Multiple-Criteria Decision Support for a Sustainable Supply Chain: Applications to the Fashion Industry


Department of Industrial Systems Engineering and Management, National University of Singapore, Singapore 117576 Singapore
*
Author to whom correspondence should be addressed.
Informatics 2017, 4(4), 36; https://doi.org/10.3390/informatics4040036
Submission received: 30 June 2017
/
Revised: 27 September 2017
/
Accepted: 9 October 2017
/
Published: 12 October 2017
(This article belongs to the Special Issue Decision Support for Sustainable Supply Chain Design and Management)
Abstract
:With increasing globalization and international cooperation, the importance of sustainability management across supply chains has received much attention by companies across various industries. Companies therefore strive to implement effective and integrated sustainable supply chain management initiatives to improve their operational and economic performance while also minimizing unnecessary damage to the environment and maintaining their social reputation and images. The paper presents an easy-to-use decision-support approach based on multiple-criteria decision-making (MCDM) methodologies that aim to help companies develop effective models for timely decision-making involving sustainable supply chain management strategies. The proposed approach can be used by practitioners to ultimately build a comprehensive Analytic Network Process model that will adequately capture and reveal all the interrelationships and interdependency among the elements in the problem, which is often a very difficult task. To facilitate and simplify this complex process, we propose that hierarchical thinking be used first to structure the essences of the problem capturing only the major issues, and an Analytic Hierarchy Process (AHP) model be built. Users can learn from the modeling process and gain much insight into the problem. The AHP can then be extended to an Analytic Network Process (ANP) model so as to capture the relationships and interdependencies among the elements. Our approach can reduce the sustainable expertise, effort and information that are often needed to build an ANP model from scratch. We apply our approach to the evaluation of sustainable supply chain management strategies for the fashion industry. Three main dimensions of sustainability—environmental, economic and social—are considered. Based on the literature, we identified four alternative supply chain management strategies. It was found that the Reverse Logistics alternative appears to be the recommended solution by the AHP model. However, the Socially Leagile Supply Chain is recommended by the ANP model, thereby demonstrating the necessity and importance of considering interdependencies in the model.
1. Introduction
Supply chain activities have greatly intensified in recent years due to rapid growth in level of consumerism and globalization. This rapid growth in supply chain activities has caused a significant burden on the environment. For example, air and water pollution is generated during the transportation and production stage of the intensified supply chain [1]. Companies are therefore increasingly paying much more attention to the promotion and adaptation of sustainable supply chain practices that will reduce the ecological damages and adverse social impact in order to achieve long-term economic viability [2]. However, in order for a company to thrive, it must have the ability to effectively evaluate its own sustainability performance. At the same time, it must also increase the visibility of its supply chain management so that it can improve on its deficient areas [3]. Unfortunately, all the functions mentioned here require a significant amount of expertise, time and resources on the part of the company. Hence, companies can greatly benefit from the development of effective decision-support methodologies and tools that effectively integrate all these functions and therefore enhance the quality of the decisions made.
This paper presents a decision-support approach based on multiple-criteria decision-making (MCDM) methodologies for a company to evaluate and select the best sustainable supply chain management strategy. MCDM methods are adopted due to their ability to explicitly model multiple and possibly conflicting factors. They are also able to reveal the complexity of the problem with decisive attributes, make appropriate trade-offs among conflicting factors, and recommend well-balanced solutions to different stakeholders. Our proposed approach takes into consideration three well-known dimensions of sustainability, which are economic, environment, and social. These three critical dimensions are effectively captured using the Analytic Hierarchy Process (AHP) [4] and if necessary, extended to the Analytic Network Process (ANP) [5]. Users of this decision-support tool will be advised to use either the AHP or ANP to evaluate their supply chain performance depending not only on the complexity of the problem, but also their preference, information availability and expertise in modeling and analysis. The formulation and model structuring process is often a complex task without any appropriate modeling tools. Our proposed decision-support approach adopts an incremental modeling approach towards building the multiple-criteria decision models starting with hierarchical thinking. Hierarchical thinking allows users to first structure the relevant factors much more simply and then build a simple AHP model. We believe that this approach provides a highly intuitive representation of the problem while avoiding the overwhelming complex interdependency within the problem. At the same time, the users can learn much from the simplified modeling and solution process, before extending the AHP model to an ANP model by relaxing the various independence relationships among the elements of the problem. However, building an ANP model is not a simple process and decision-makers not formally trained as professional analysts often face difficulties in the modeling and assessment process. This paper also provides a detailed procedure for converting an AHP model into an ANP model as part of the decision-support process.
The proposed decision-support approach in this paper has been applied to a sustainable supply chain, and in particular, to the fashion industry. Fashion is ubiquitous in the modern society, and within the context of sustainability, the fashion industry’s contribution to environmental damage is significant to some extent [6]. As the second most polluting industry, being eco-friendly and cutting down environmental costs have become a main concern for many fashion organizations [7]. Fashion companies are increasingly putting effort into establishing an integrated approach to minimize environmental waste, increase the profitability and at the same time, build up social reputation. However, previous research has mostly over-simplified the issue of sustainability by focusing only on economic competitiveness and environmental damage, while neglecting other significant factors such as for example, social sustainability. This paper attempts to close this gap through providing a more comprehensive view of sustainability by emphasizing all three major dimensions of sustainability, namely environmental, economic and social. Through literature review, each of these three major dimensions is further decomposed into relevant sub-factors.
Our case study considered four representative alternative supply chain management strategies, namely just-in-time, global sourcing, reverse logistics, and a socially leagile supply chain. The results of our case study using AHP showed that global logistics is the most preferred followed closely by a socially leagile supply chain. Furthermore, the omission of the social dimension in the model resulted in significant change in global weights of the company as well as the gap between the two top alternatives, thereby showing that it is important for companies to pay attention to the social factors in supply chain management. Our results also show that when the model is extended to an ANP model that represents the problem more realistically by additional consideration of interdependencies, the most preferred alternative is the socially leagile supply chain instead of reverse logistics, and there is also a significant gap in the global weights between the two top alternatives. Again, this demonstrated the inadequacy of using only AHP, and necessity of extending to ANP. Our decision-support method can therefore facilitate this entire modeling and analysis process in an effective manner, and extend the usability and applicability of the ANP method in solving complex and large-scale problems with a high degree of dependency.
This paper is organized as follows: Section 2 provides a review of related research on the sustainable supply chain and MCDM. Section 3 presents a study on some selected supply chain practices and identifies possible alternative supply chain management strategies in the fashion industry. Section 4 presents the proposed MCDM-based decision-support methodology and its application to the fashion industry. Finally, Section 5 concludes the paper with a discussion, identifying the limitations and proposing possible future work.
2. Literature Review
2.1. Related Work on Sustainable Supply Chain
Supply Chain Management is defined as the integrated business processes and competitive strategy with which products, services and information flows from suppliers to end users, thereby adding values for customers and other stakeholders. The concept of the sustainable supply chain first came into the literature in the 1980s [8], and the framework comprising three major dimensions, namely environmental, economic and social, was brought up. To achieve sustainability in supply chain management, “environmental and social criteria need to be fulfilled by the members to remain within the supply chain, while it is expected that competitiveness would be maintained through meeting customer needs and related economic criteria” [9].
Even though companies are spending increasing attention in achieving sustainable supply chains, they find it difficult to effectively balance organizational responsibilities to society and the natural environment as little guidance has been provided to assist them to achieve sustainable needs [2]. Among the three dimensions, social sustainability has been relatively neglected compared to the other two as social responsibility is usually perceived to have no direct financial benefit to the company [10].
In [9], Seuring and Muller studied 191 papers related to the issue of sustainable supply chains published from 1994 to 2007. It was noted that almost all of the papers covered the economic dimension but few dealt with the social dimension. Table 1 shows the breakdown of the number of papers that discussed the different dimensions in [9]. Seuring and Muller also mentioned that the majority of the papers reviewed concluded win-win or win-win-win situations. Especially for business and environmental aspects, most of the papers deduced a positive correlation between these two dimensions. While there were fewer considerations of the social dimension in the older literature, recent work considers it in one way or another; see for examples [11,12,13,14,15].
In [16], Sarkis mentioned that organizations could gain business values through green supply chain management (GSCM) through reduction of waste, increasing resilience, new revenue streams and improving image and reputation. However, in [17], Newton and Harte criticized the “easy-win” conclusion with too many assumptions and simplifications of reality. The GSCM is not necessarily more cost-effective than traditional supply chain management (SCM), as the objectives and cost pressures of SCM and are very different. SCM concentrates more on business sustainability and ensures that the company stays competitive and profitable by minimizing the possible cost [18]. GSCM, on the other hand, emphasizes both ecological and economic success with relatively high cost pressure, compromised flexibility and speed [19]. Thus, the trade-offs should be examined carefully to fully understand the impact of implementing GSCM.
2.2. Related Work on MCDM and Their Applications
The development of rational decision-making is always at the center of discussions among scholars and researchers. Since the beginning of human history, there have been emerging prescriptive and normative theories about how people make or ought to make decisions. Among them, multiple-criteria decision-making (MCDM) is one of the most popular branches of the decision-making modeling concept [20]. MCDM can be classified mainly into two categories: multiple-attribute decision-making (MADM) and multiple-objective decision-making (MODM), according to the different purposes and data types [21]. MODM aims at optimizing several conflicting objective functions simultaneously with a set of decision variables. Hence they used techniques that involve mathematical programming. MADM deals with specific numbers of distinct alternatives, requires inter- and intra-attribute comparisons and makes explicit and implicit tradeoffs. The foundation of MADM consists of preference modeling, utility value system and fuzzy logic to capture real-life complexity [22]. According to [21], MADM can be categorized into three classes: methods based on Multiple-Attribute Utility Theories (MAUT), outranking methods and fuzzy integral. Among the most popular MADM methods are the Analytic Hierarchy Process (AHP) [4] and its extension, the Analytic Network Hierarchy (ANP) [5]. The commonly applied outranking methods include Elimination and Choice Expressing Reality (ELECTRE) [23], Order of Preference by Similarity to Ideal Solution (TOPSIS) [24] and PROMETHEE [25].
As MODM strictly follows linear or nonlinear mathematical programming solution strategies, there are significant limitations on its flexibility in modeling and analysis of complex problems. MADM is more appropriate for real-life situation modeling, especially for problems involving complex interactions, which cannot be quantified easily. Every individual MADM methodology has different emphasis and advantages, thus they have applications to certain specific industries and type of problems. In [26], Toloie and Homayonfar present a literature review of 386 papers to show the diversity of MCDM’s applications. The papers are categorized into twelve areas: Transportation and Logistics, Business and Financial Management, Managerial and Strategic, Project Management and Evaluation, Manufacturing and Assembly, Environment Management, Water Management, Energy Management, Agricultural and Forestry Management, Social service, Military Service and other topics. However, when modeling practical situations with interactive attributes, the modeling process based on MAUT alone becomes extremely complex with complicated and large numbers of utility functions. Therefore, Fuzzy Integral, AHP, ANP and outranking methods are usually adapted to compare the preferential relations between different alternatives. Among all MADM methods, AHP is one of the most commonly applied strategies with additive utility independence as its foundation [21].
2.3. Dealing with Criteria Dependencies in MCDM
The goal of MCDM is to facilitate the decision-making process for complex problems, which involve multiple and conflicting criteria. In [27], Gölcük and Baykasoğlu argue that complexity takes the form of criteria interaction, which can be classified into two categories: criteria dependency and criteria interactivity. Different MCDM strategies and techniques therefore target specific types of complexity.
AHP, ANP and Hierarchical TOPSIS are most frequently used modeling techniques for structural dependency problems. According to [26], among the 786 papers reviewed, AHP is the most commonly used method (18%, 142 papers), and it is utilized in almost all applicable areas. AHP was proposed by Saaty to model subjective decision-making processes based on multiple attributes in a hierarchical system. Besides, its general form ANP is also frequently adopted. ANP was proposed in 1996 to relax the restriction of hierarchical structure, and to indicate that the criteria are not independent of each other [5]. Although ANP and AHP are closely linked to each other, there are very few papers providing detailed comparison to illustrate the impacts of interdependence and feedback effects. Besides, the process of extension and transformation of an AHP model to an ANP model in relaxing the independence assumptions is also not well discussed. Although ANP has wide applications, it is still limited by its inability to deal with incomplete data or human subjective analysis during the pairwise comparison stage. However, there is existing literature discussing the above problem and proposing approaches such as Fuzzy ANP [28] and integration of ANP with DEMATEL [27] to reduce modeling difficulty and influence of subjective rating during the pairwise comparison stage.
Modeling and analysis of sustainable supply chain management contains complex interactions that correspond to structural dependency. Therefore, suitable modeling methods include Hierarchical TOPSIS, AHP and ANP. This is supported by [26] where, among the 78 papers that particularly focus on supply chain management, these three methods are the most frequently used. Hence in this paper, we shall adopt AHP and ANP as the main problem representation and modeling methods in our decision-support approach.
3. Supply Chain Management Strategies in Fashion Industry
3.1. Case Study on Some Fashion Companies
In this section, we review the supply chain management strategy and practices adopted by some representative companies in the fashion industry. These include fashion companies from the low-end such as the mass production apparel companies UNIQLO, to medium-level brand Zara, to the high-end luxury brands such as Louis Vuitton and Chanel. The selected companies are all relatively successful ones among their peers of similar size. Hence, the supply chain strategies of these companies can be used as possible alternatives by other fashion companies when deciding on their own supply chain practices.
Companies generally adopt different sets of supply chain practices depending on the nature of company such as the size of the company and the capital needed to implement the supply chain [29]. Figure 1 shows a typical fashion supply chain. In the supply chain, the fashion company deals with numerous suppliers upstream and a number of retailers downstream. Upstream, the fashion company has to decide how much of its manufacturing processes should be performed in house and how much of them performed externally. Hence for sourcing strategy, the company can choose between in-house or outsourcing. Downstream, the company has to decide on its channel strategy which may be either centralized or decentralized. Under the centralized channel strategy, the company tightly controls most of the key factors like prices, product mix, and inventory. Under decentralized channel strategy, the company manages its distribution function more flexibly to enable it to respond more effectively to local market conditions.
Table 2 gives a summary of the supply chain sourcing and channel strategies adopted by four specific companies in the fashion industry. Although there are a total four possible combinations in terms of sourcing strategy and channel strategy, companies typically only adopt either the concentrated supply chain strategy using in-house sourcing and centralized channel, or the dispersed supply chain strategy using outsourcing and decentralized channel strategy. Companies that practice concentrated supply chain strategy include Chanel and Louis Vuitton, while companies that practice dispersed supply chain strategy include Zara and UNIQLO.
3.2. Supply Chain Management Strategies
In general, there are four alternative supply chain management strategies for a company to choose from in establishing their supply chain. These are:
- Just-In-Time (JIT)
- Global sourcing
- Reverse logistics
- Socially leagile supply chain
We discuss each these strategies below.
3.2.1. Just-In-Time
Just-In-Time (JIT) is a popular supply chain practice that has gains increasingly more attention to the operation function in supply chain management. Just-In-Time (JIT) aim to reduce the flow times taken to process in the production system and response times taken from supplies to customers. It is an inventory management strategy that aims to increase operational efficiency and decrease wasted inventory by receiving goods only when they are needed [30]. Demand forecasting therefore plays a crucial role in ensuring the timely and correct amount of production is produced thus saving the inventory holding costs. Other immense benefits which JIT brings is the higher-level standard achieved in the quality as the quality problems can be identified in good time and hence, decision-makers can make informed decisions in good time to resolve the problems [31]. After examining multiple papers that discuss issues related to JIT practice, it is quite apparent that the adoption of JIT practice contributes to better performance in the inventory management, quality and throughput results, and hence brings about gains not only in business management but also in the financial performance of a company [32].
3.2.2. Global Sourcing
With increasing emphasis placed on global development, many companies start to implement global sourcing. Research has shown that companies always outsource their non-core activities such as, for example, minor components [9]. In addition, with increasing emphasis being put placed on corporate-social responsibility, which is one of the main pillars of a sustainable supply chain, a large part of global trade is conducted through systems of governance, linking firms tighter together in various sourcing and contracting arrangements [33]. A complex and sophisticated supply chain system should therefore adopt global sourcing so as to provide better supply chain sustainability performance and to remain globally competitive [34]. Global sourcing can also create companies’ asset returns, increase flexibility, reduce costs and improve service quality [35]. In addition, [36] studied 680 firms in Europe and North America, and provided empirical evidence on global sourcing’s ability to fulfill both social and environmental sustainability goals beside lower cost and improved competitiveness.
3.2.3. Reverse Logistics
American Reverse Logistics Executive Council defined reverse logistics as “the process of planning, implementing and controlling the efficient, cost-effective flow of raw materials, in-process inventory, finished goods and related information from the point of consumption to the point of origin for the purpose of recapturing value or proper disposal” [37]. A literature review studied the reverse logistics and closed-loop supply chain of 382 papers published between 2007 and 2013. The results provide statistical evidence that reverse logistics indeed have correlation with sustainable supply chain performance [38]. Furthermore, reverse logistics increase environmental sustainability through three “REs”, namely to facilitate recycling process, to reuse as many materials as possible, and to reduce the amount of materials [39]. Furthermore, the implementation of Reverse Logistics provides both economic and environmental advantages that are in line with two of the dimensions focused on in this paper [40].
3.2.4. Socially Leagile Supply Chain
Leagility is the combination of the lean and agile paradigm within a total supply chain strategy by positioning the decoupling point so as to best suit the need for responding to a volatile demand downstream yet providing level scheduling upstream from the decoupling point [41]. The leanness in supply chain management enables cost reduction by minimizing the waste cost while agility maximizes the company’s profits by providing exactly what the customer requires and reduce the costs [42]. The combination of the two approaches enable the cost effectiveness of the supply chain and makes the supply chain more dynamic and integrated.
4. Decision-Support Methodology
4.1. Overview of the Decision-Support Process
An overview of the proposed decision-support process for companies to evaluate sustainable supply chain performance and to decide on their supply chain management strategy is described below.
Step
- Identify the alternative supply chain strategies
- Identify the criteria and sub-criteria that affect the sustainability of the company’s supply chain and organize them into a hierarchy structure representing the relationships among them
- Construct an AHP model from the hierarchy in Step 2
- Synthesize the AHP Model
- If there are significant interdependencies among factors and there is sufficient information and expertise to model the interdependencies then
- Construct an ANP model from the AHP model
- Synthesize the ANP Model
- Perform Sensitivity Analyses to gain managerial insight
- Go back and repeat any of the above steps if necessary in the light of new information or insight
In summary, we first identify the alternative supply chain management strategies. In Section 3, four possible alternatives have been identified. Next, we identify the key factors and criteria that affect the sustainability of the company’s supply chain. The factors are then organized into a hierarchical structure representing their relationships. This hierarchical structure provides a simple representation of the issues without the decision-maker being weighted down by the need to think about the complex interdependencies among the factors. The information up to this stage is sufficient to construct an AHP model with the alternatives. A series of pairwise comparisons as prescribed in the standard AHP method is conducted at all levels of the hierarchy, and the resulting AHP model is solved to obtain the global weights of the alternatives. At this stage, the decision-maker would have a fairly good idea and insight on the performance rankings of the alternatives.
Now, if there are significant inter-dependencies among factors and there is also sufficient information and expertise to model the interdependencies, an ANP model should be used instead of an AHP model to better capture and relate the interdependences among the criteria and sub-criteria. However, constructing an ANP model from primitive information and data is usually a highly involved process requiring much expertise, training, and experience on the part of the analyst, decision-maker, and domain experts working together. To overcome this difficult barrier, we provide a detailed step-by-step procedure for converting an AHP model to an ANP model that can be solved.
Finally, to complete the decision-support process, sensitivity analyses should be carried out in order for the decision-maker to gain critical insight into the problem before any implementation is carried out. It should be noted that any of the above steps may be revisited at any time and the process repeated until a clear and justifiable decision is reached.
Details of the decision-support process with application to the fashion industry are given in the following sub-sections.
4.2. Identifying Relevant Factors and Building Hierarchical Structure
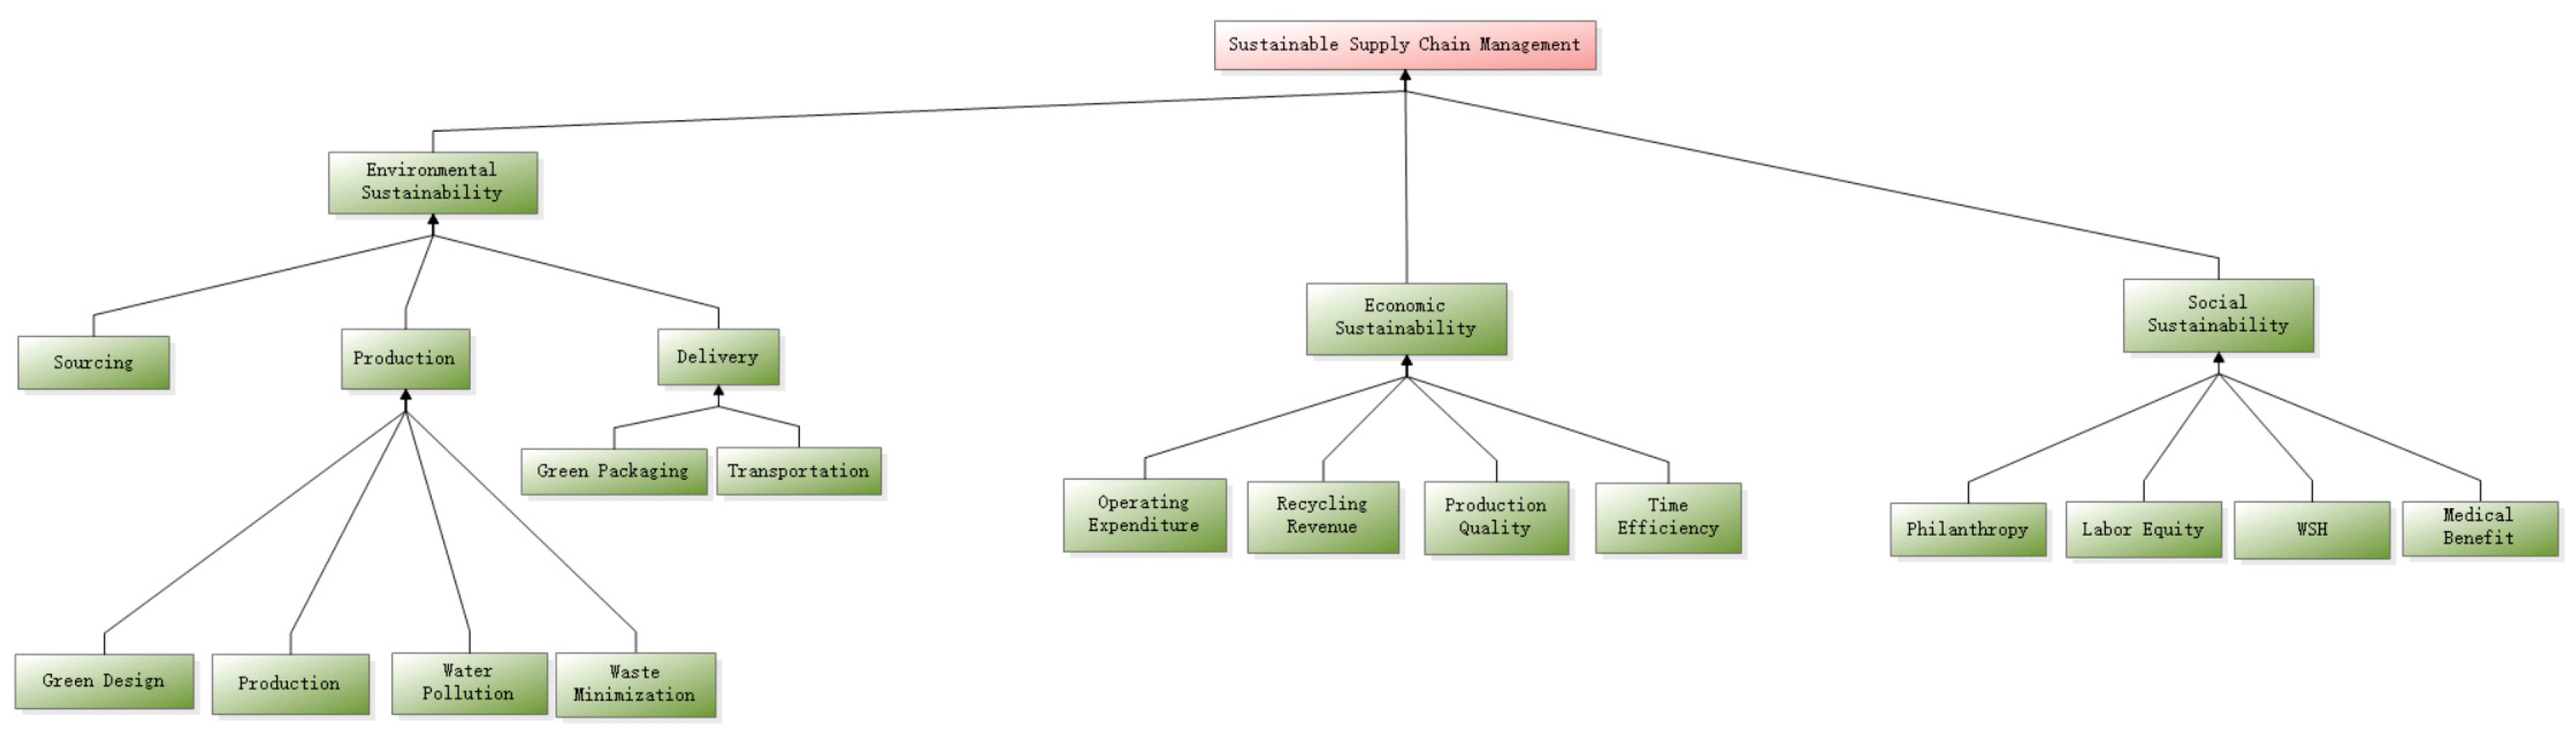
The sustainability of a supply chain depends on many factors. As shown in Figure 2, social sustainability, environmental sustainability and economic sustainability are identified as the main criteria. These three criteria are well known as the three pillars of sustainability [43] and also of an effective and successful fashion industry supply chain [44]. The three main criteria may be further divided into many sub-criteria depending on the objectives of the assessment as well as the methods of the evaluation. See for examples [11,12,13,14,15]. Figure 3 shows the sub-criteria that have been adapted for our case study base on the literature and in the context of fashion industry.
4.3. Analytic Hierarchy Process Modeling
The Analytic Hierarchy Process (AHP) [4] is a very well-known multiple-criteria decision-making method that can assist the decision-makers’ rank and evaluate alternatives through a series pairwise comparisons producing local priority weights that are then combined to produce global weights for the alternatives under evaluation. AHP follows the human innate thinking process of decomposing and structuring a complex problem as a hierarchy based on the experience, judgements and memories, to capture the relationship as well as the relative importance of the elements. The hierarchy structure of the model provides the decision-makers with a clear and straightforward global view of the problem breakdown. At the same time, the use of pairwise comparisons allows the decision-makers to focus on assessing the relative importance or priority at a local level. Overall, AHP allows decisions to be made in many complex situations.
Continuing with our approach, we extend the hierarchical structure in Figure 3 to an AHP model by adding the alternatives to the hierarchy as shown in Figure 4.
4.3.1. Prioritization of the Main Criteria
As the three main criteria for sustainability do not contribute equally to the overall goal, it is necessary to prioritize them. AHP process provides a systematic way to obtain their priority weight via pairwise comparison described below.
Table 3 shows the pairwise comparison matrix based on the standard Saaty’s 9-point scale and the priority weights for the three main criteria with respect to the goal of achieving a sustainable supply chain. Environmental sustainability is given the highest priority among the three main criteria as the performance of the environmental perspective will either directly or indirectly affect the social system and the economic system. In addition, environmental sustainability has been identified as the world’s “biggest actual problem” while economic sustainability is the “biggest apparent problem” [45]. Table 3 indicates that Environmental Sustainability is considered to be far more important than Social Sustainability, and is moderately important as compared to Economic Sustainability.
4.3.2. The Environmental Sustainability Sub-Hierarchy
According to the literature review, Plan, Source, Make, Deliver and Return has been identified as the Environmental process based on the SCOR Model [46]. Three main sub-criteria were selected under environmental sustainability. These are sourcing, production and delivering as they are relatively more related to environmental perspective as compared to the other two main criteria. Among the three sub-criteria, production has been assessed have the highest priority compared with sourcing and delivering [47]. Furthermore, production is assessed to be moderately more important than sourcing with respect to environmental sustainability. Table 4a shows the pairwise comparison matrix and priority weights for the three sub-criteria under Environmental sustainability. Table 4b shows the pairwise comparison matrix and priority weights for the four sub-sub-criteria under sub-criteria Production. Table 4c shows the pairwise comparison matrix and priority weights for the two sub-sub-criteria under sub-criteria Delivery.
4.3.3. The Business Sustainability Sub-Hierarchy
Under Business or Economic Sustainability sub-hierarchy, there are four sub-criteria, namely, Operating Expenditure, Recycling Revenue, Production Quality and Time Efficiency. Table 5 shows the pairwise comparison matrix and priority weights for the four sub-criteria under Business sustainability.
4.3.4. The Social Sustainability Sub-Hierarchy
Four criteria have been identified as the key performance indicator under Social Sustainability with Labor Equity holding the highest importance compared to the other three. Table 6 shows the pairwise comparison matrix and priority weights for the three sub-criteria under Social sustainability. It should be noted that according to the literature review, Labor Equity, Healthcare, Injury and Philanthropy have been identified as the four most significant factors affecting social sustainability. In one study, Hutchins and Sutherland [48] allocated the highest weight to Healthcare, followed by Labor Equity. However, the paper was based on U.S. context which is different from Singapore’s. Therefore, the term healthcare, which has been changed to Workplace Safety & Health (WSH), has been ranked as the second most important sub-criteria under Social Sustainability after Labor Equity.
4.3.5. Evaluation of Alternatives
To complete the AHP model, the four alternatives are pairwise compared with respect to all the leaf sub-criteria in the hierarchy. The pairwise comparison matrixes as well as the computed local priority weights are shown in Appendix A. Finally, using the additive weighted sum approach in AHP, the global weights of the four alternatives are computed. Table 7 shows the global weights for the four alternatives from the AHP model. The result by AHP shows that Reverse Logistics has the highest global weight among the four alternatives. This is followed by aocially leagile supply chain, which has the second-highest global weight.
4.3.6. The Value of Considering Social Perspective
Our literature review has shown that there had not been much attention paid to the social perspective in the study of the sustainable supply chain in fashion industry, and existing performance measurement of supply chain had mainly focused on the traditional dimensions, which are environmental and economic performance [49]. Moreover, the concept of Corporate Social Responsibility (CSR) has been neglected and only comes to the fore recently, but this is only in the context of conceptual and survey studies instead of the practical implementation [50]. CSR has always been stereotyped as being associated only with an environmental perspective [51].
As the indispensable component of a sustainable supply chain, Corporate Social Responsibility ensures business responsibility including initiative in social activities to “build meaningful relationships between the corporate and the rest of society” [52]. In the world-wide movement towards sustainability reporting by publicly listed companies, social factors have been officially included as one of the key criteria; see for example the Singapore Exchange (SGX) Sustainability Reporting Guide [53]. According to the literature review, the World Bank has resolved that Corporate Social Responsibility is one of the obligations companies need to fulfil in their operations and activities. CSR takes into consideration of a comprehensive range of impact on the society with a balanced performance that can both satisfy the environmental requirements and economic target [54].
Table 8 shows a comparison of the results obtained for the alternative’s global weights with and without consideration of the social criteria in the AHP model. It should be noted that although the omission of the social sustainability criterion does not change the ranking of the top alternatives, they do result in significant change in the value of the goal weights as well as the gap between the two top alternatives. Therefore, companies should put more emphasis on and effort into social sustainability in order to achieve a more sustainable supply chain.
4.4. Analytic Network Process Modeling
4.4.1. Overview of Analytic Network Process
Many real-world complex problems cannot be realistically modeled and solved using the simplistic AHP method due to the existence of interactions and dependence across different levels [22]. This happens when the goal, criteria, and sub-criteria cannot be represented strictly as a simple hierarchy. In these cases, it may be necessary to use the Analytic Network Process (ANP) instead of AHP.
The ANP method is a generalization of the AHP method, where the independence assumptions of AHP are no longer imposed. In ANP, the hierarchical structure of the elements in the system is relaxed to a network structure where loops and feedbacks among the elements are allowed. However, in using the ANP, the direct construction of a network model capturing all the interactions and feedbacks is often an extremely tedious task without good decision-support tools. In this section, we briefly describe the ANP method and, to facilitate the usability and practicality of the method, propose a straightforward process to extend and convert an AHP model to an ANP model.
In ANP, all the elements such as goal, criteria, sub-criteria, alternatives, etc., are treated equally as nodes in a network structure. The elements are then partitioned into a number of disjoint clusters. The clusters are then connected with directed arcs known relationship arcs. Depending on the connectivity of the network, pairwise comparisons and eigenvalue computations are carried out as in the AHP method, among the elements of a cluster with respect to elements in a cluster, and also among clusters with respect to other clusters. ANP is therefore able to take into consideration the impacts of the alternatives on the importance of criteria and vise versa. ANP also allows the grouping of similarly-related elements into clusters which cannot be done in AHP.
An ANP network defined as a 3-tuple <E, C, A> where E is a set of elements (representing goal, criteria, sub criteria, alternatives, etc.) which is partitioned into a set C of n clusters {C1, C2, …, Cn}, and A ⊆ C × C is a set of directed arcs such that aij ∈ A if there is a relationship arc from cluster Ci to cluster Cj. The network can be cyclic as well as contains self-loops.
Denote by ekj be the jth element in cluster Ck, where k = 1 to n and j = 1 to mk.
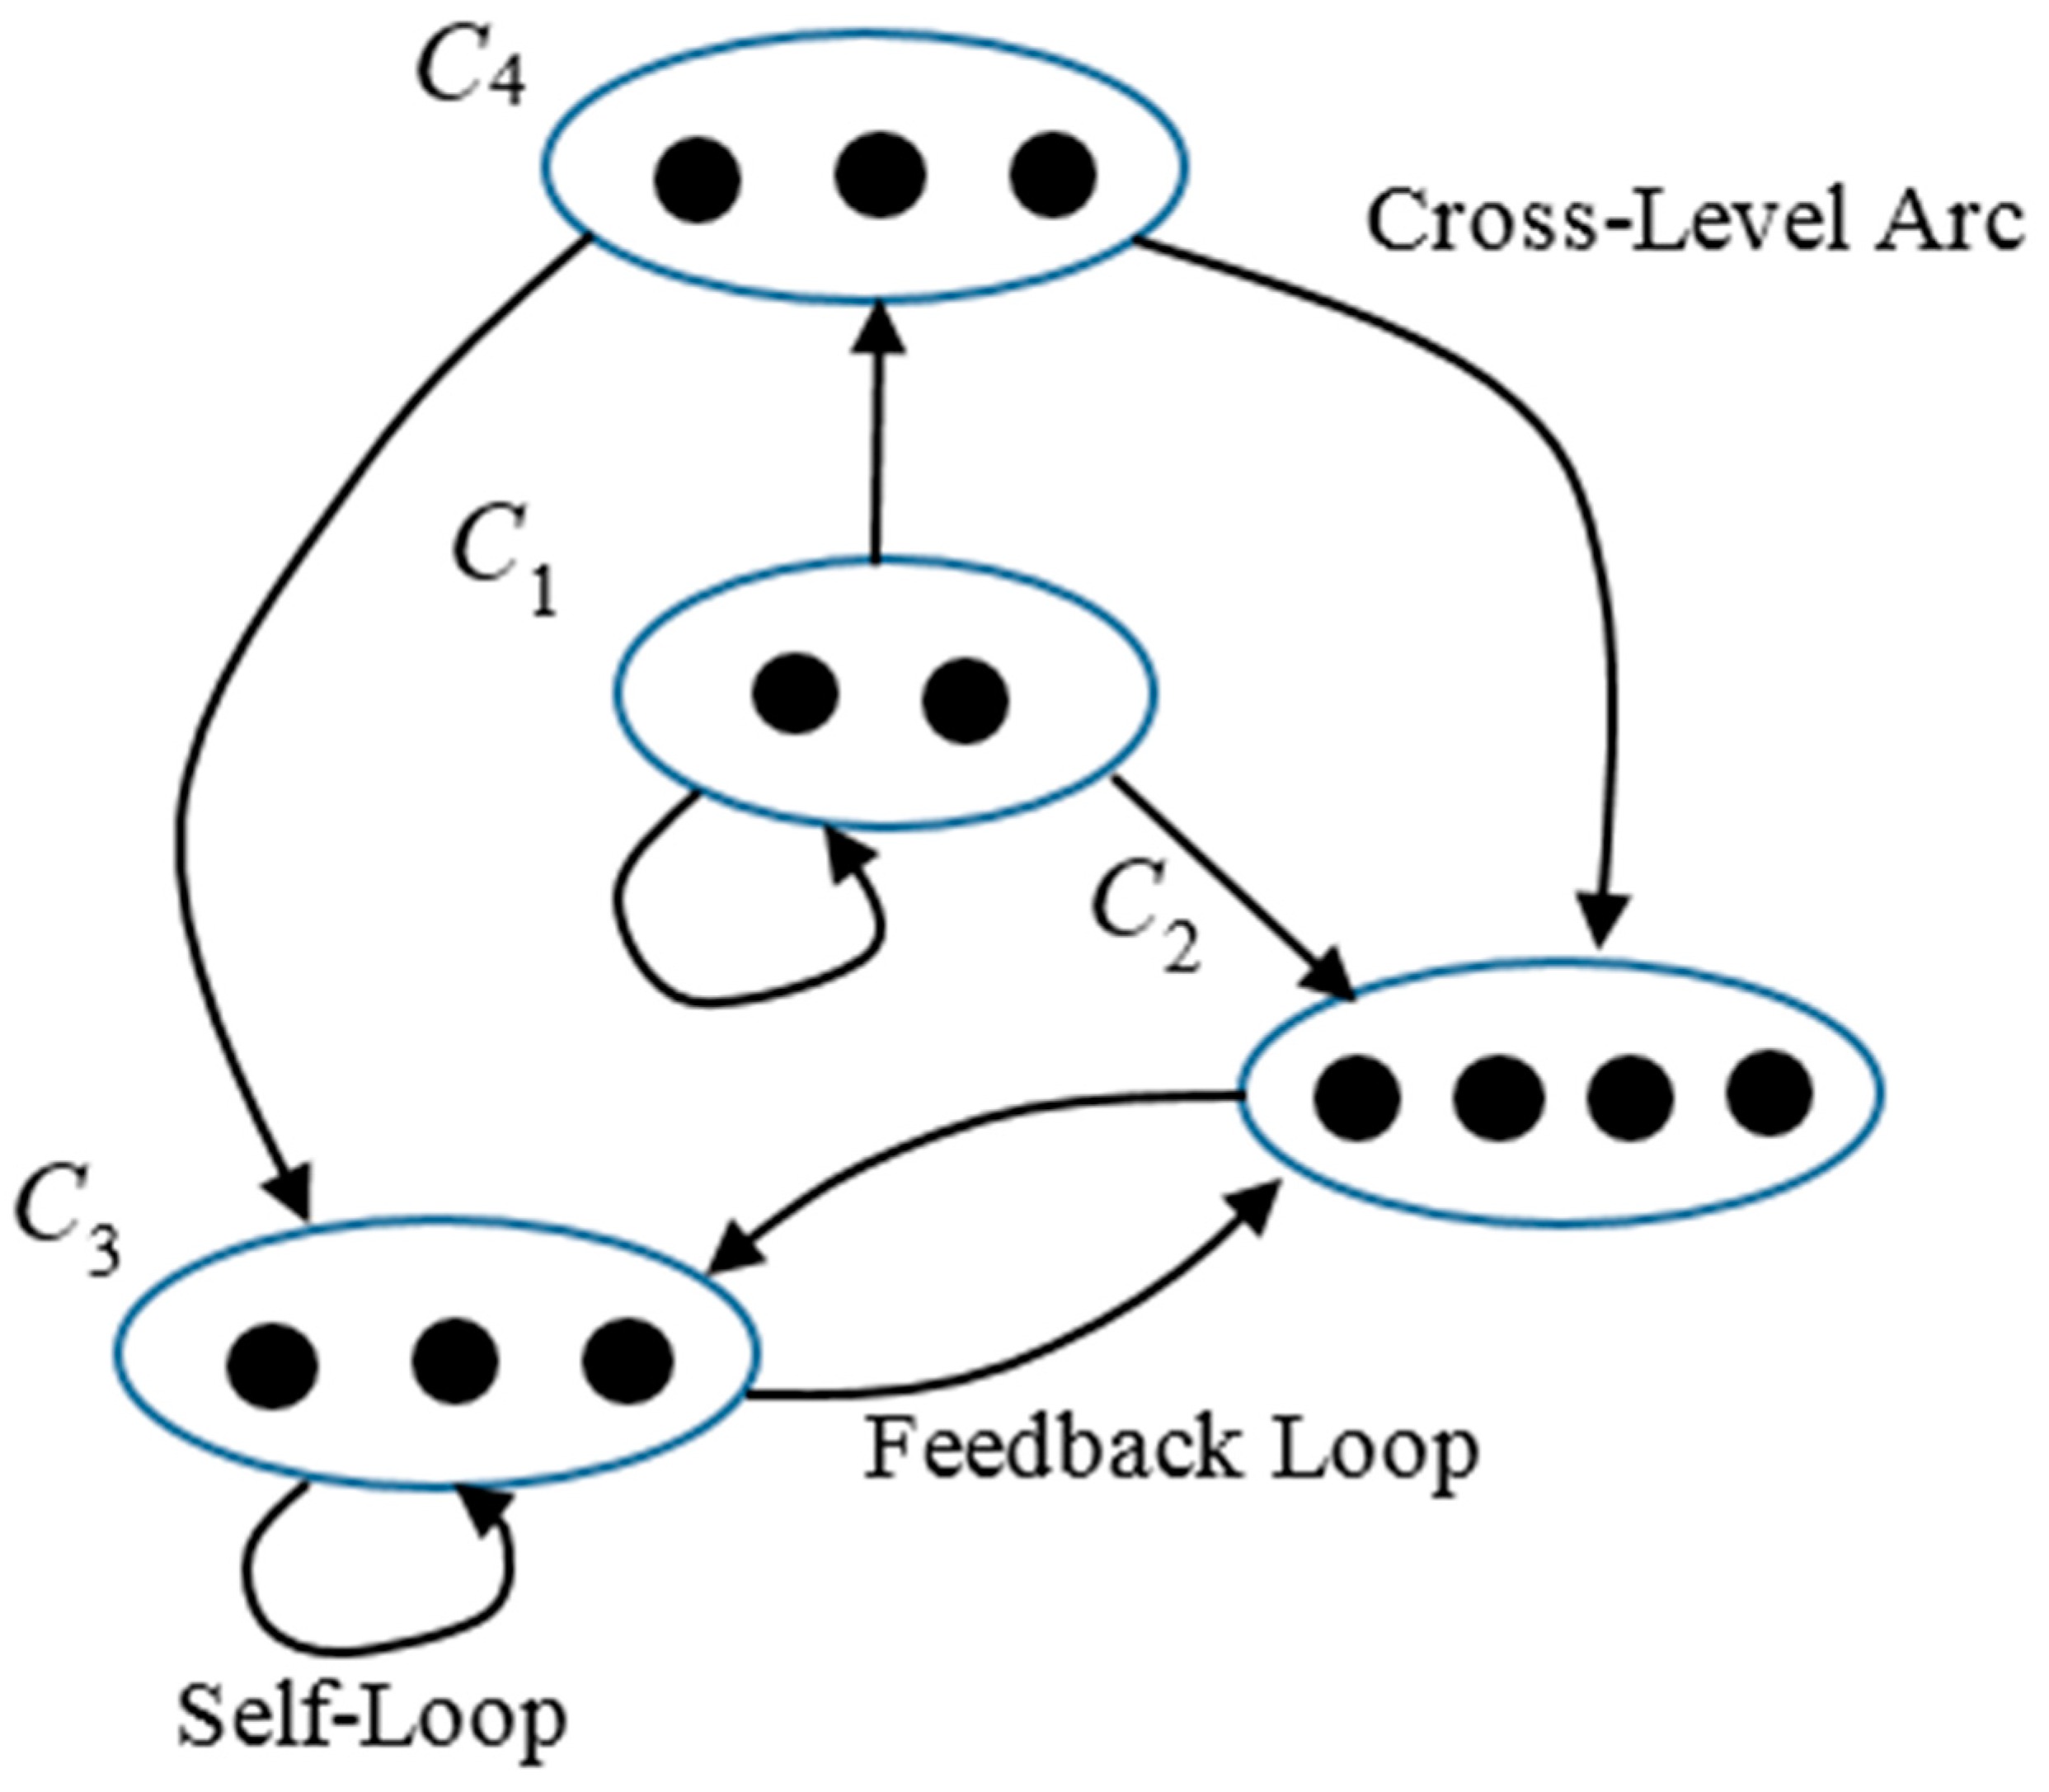
Let π(e, C) = eigenvector obtained by pairwise comparison of the elements of cluster C with respect to element e. Figure 5 shows the general structure of an ANP network.
There are three types of relationship arcs in an ANP network structure:
- A directed arc between two clusters indicates cross-level relationship between the elements of the clusters. This is called outer dependence.
- A self-loop connects a cluster to itself indicating dependency of the elements within its own cluster. This is called inner dependence.
- A directed loop between two clusters indicates interdependency of the elements within the two clusters. This is called feedback.
There are three types of clusters in an ANP network structure.
- A cluster with no relationship arcs entering it is known as a source cluster.
- A cluster with no relationship arcs leaving it is known as a sink cluster.
- A cluster with both entering and leaving relationship arcs is known a transient cluster.
4.4.2. The ANP Super Matrix
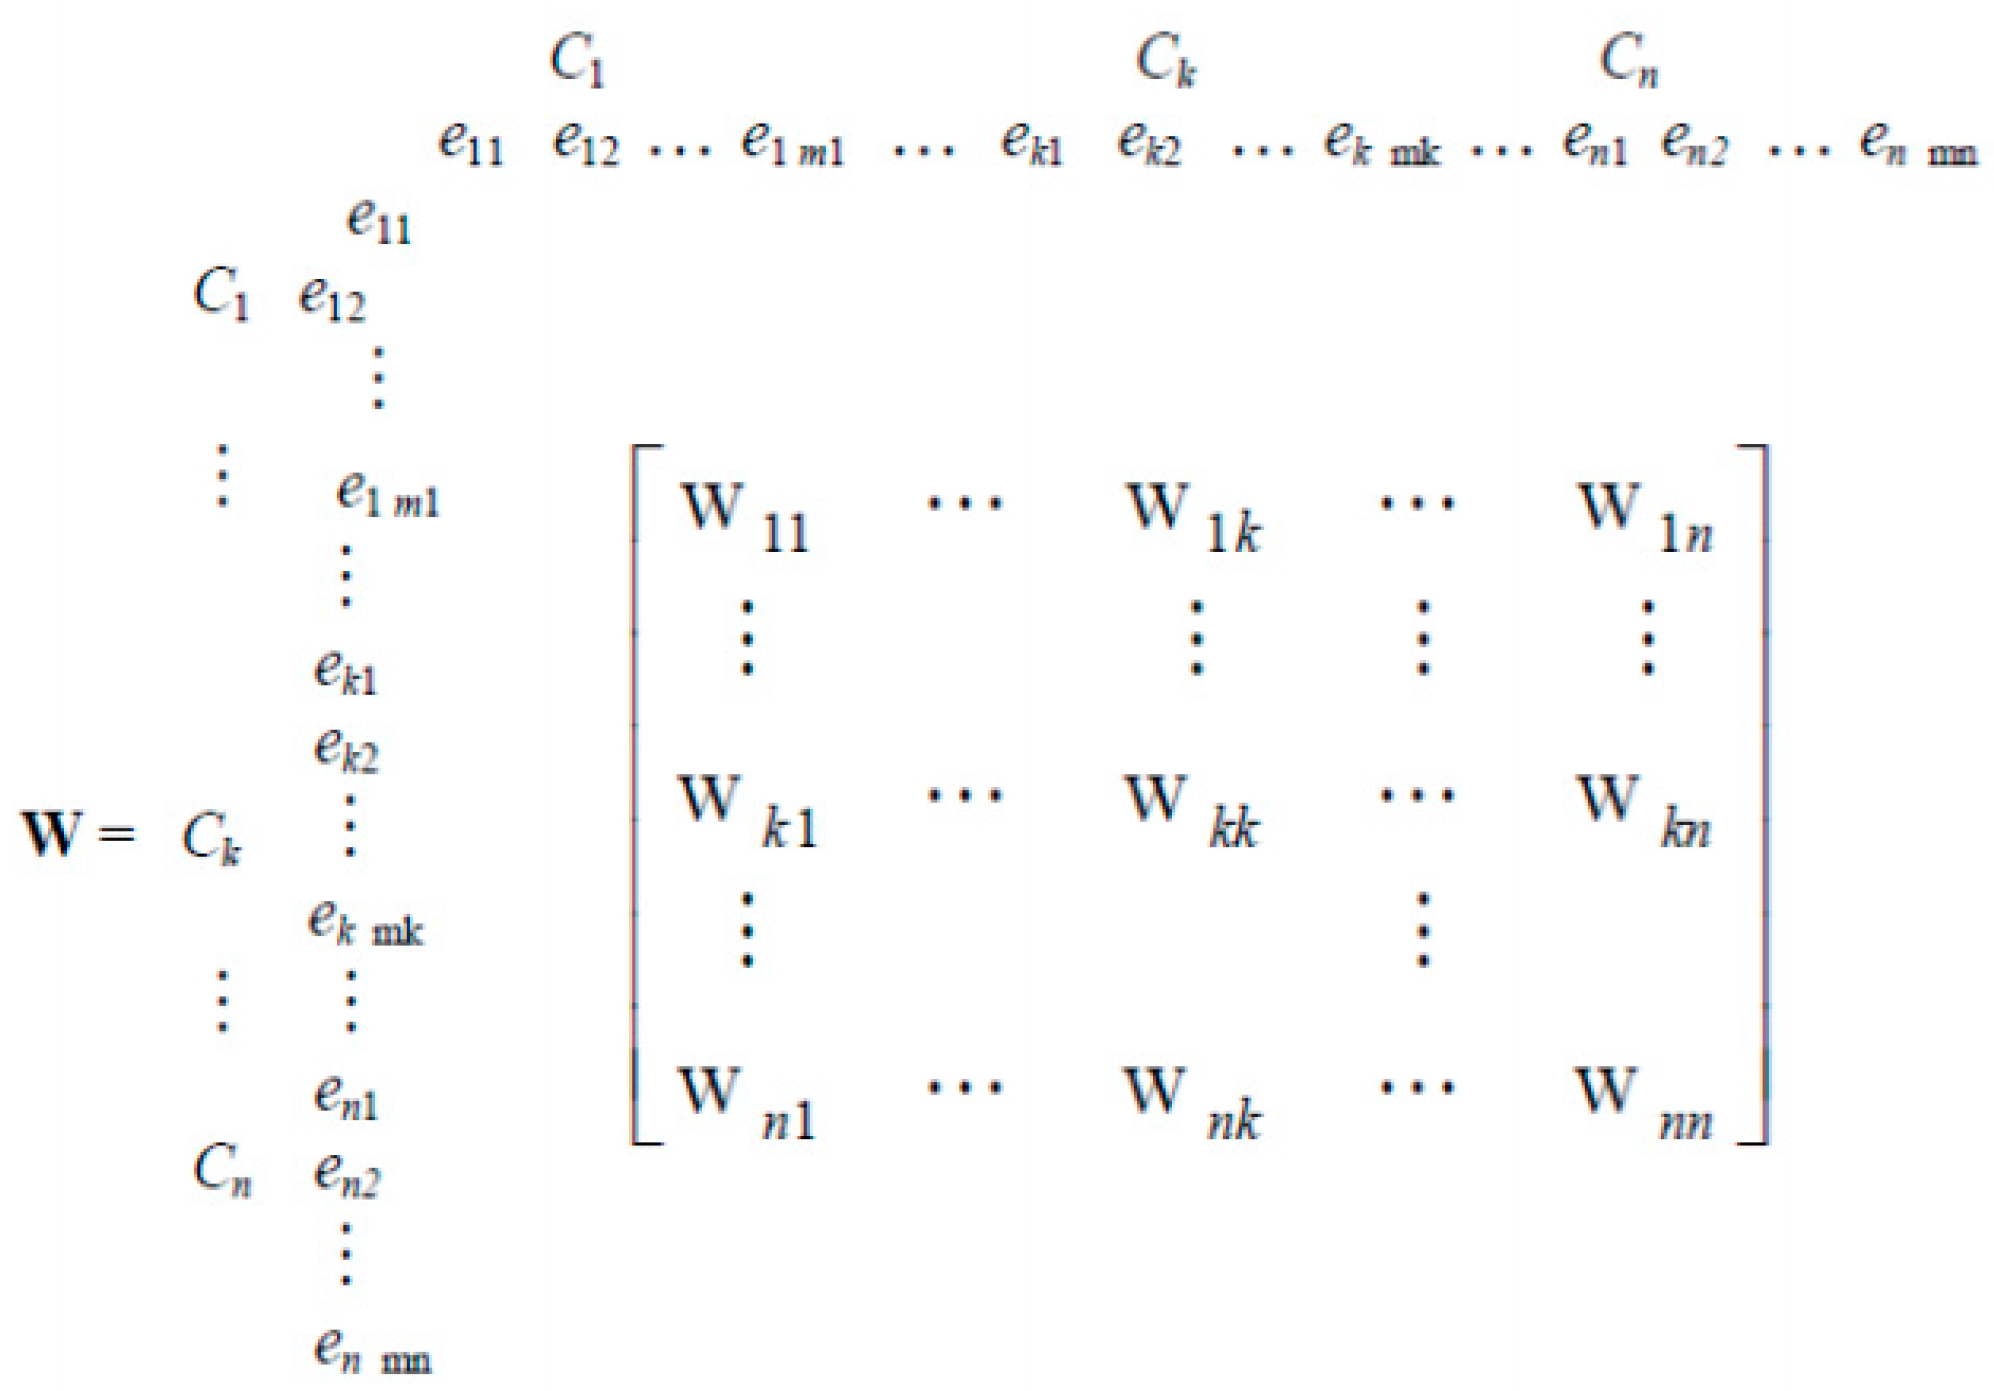
To perform synthesis, ANP utilizes a super matrix to represent the relations, strengths, priorities among the elements and clusters in the network model. Each row and column of the matrix corresponds to an element in the ANP model. These include the goal, the criteria and their sub criteria, as well as the alternatives. Each cell in the super matrix represents the weight of an element from the columns-header with respect to an element from the row-header [7].
An ANP model is specified by a super matrix comprising a set of sub-matrix Wij (I = 1, …, n; j = 1 ,.., n) representing the interaction between cluster i and cluster j as shown in Figure 6.
The unweighted AHP super matrix can be assessed by determining the cluster-to-cluster sub matrix Wij (j = 1 to n and I = 1 to n) as follows:
- If aij ∉ A, i.e., there is no relationship arc from cluster i to cluster j, then Wji is a mj by mi zero-matrix.
- If aij ∈ A and i ≠ j, i.e., there is a relationship arc from cluster i to cluster j, then the kth column (k = 1 to mi) of Wji is the eigenvector obtained by pairwise comparisons of the elements of cluster Cj with respect to element eik of Cj, i.e., π(eik, Cj).
- If aii ∈ A, i.e., there is a self-loop at cluster i, then Wii is a zero-diagonal matrix such that the kth column (k = 1 to mi) of Wij is the eigenvector obtained by pairwise comparisons of the elements of Ci\{eik} with respect to element eik, i.e., π(eik, Ci\{eik}).
- Finally, if Ci is a sink cluster and does not have a self-loop, i.e., aii ∉ A, then replace Wii with an identity matrix of size mi.
At this stage, the columns of the super matrix may not be normalized, i.e., is not a column stochastic matrix. It is necessary to convert it to a column normalized matrix by multiplying each Wij with a cluster weight uij.
The cluster weight uij (I = 1 to n, j = 1 to n) is ith component of eigenvector obtained by pairwise comparisons of the set of clusters in Rj with respect to Cj, where Rj = {Ck ∈ C| ajk ∈ A} is the set of clusters that has a direct relationship from cluster Cj.
The weighted super matrix is than obtained by replacing each Wjj with uij Wjj in the super matrix.
The ANP model is then solved by computing the limit matrix of the weighted super matrix. The Limit Matrix is obtained by raising the weighted super matrix to a sufficiently high power. The resulting global weights of the alternatives are given the column under “Goal”.
4.4.3. From Hierarchical Thinking to Network Modeling
It is natural for human being decision-makers to think and structure their thoughts in a hierarchical structure when dealing with complexity [55]. Hierarchical thinking follows people’s thinking habit and therefore allows for the easy construction of an AHP model in a top-down structure by listing the goal at the top, alternatives at the bottom, and all the criteria and sub-criteria in between. It would then be very natural to extend the AHP model to an ANP model by making incremental changes to the hierarchical structure. A systematic procedure to convert an AHP model to an ANP model is as follows:
Step
- Transfer the weights for the AHP model to the appropriate columns of the super matrix.
- Insert additional weights that arise due to the interdependencies in the appropriate columns of the super matrix.
- If the super matrix is not yet a stochastic matrix, normalise the columns of the super matrix by applying cluster-to-cluster weights.
- Compute the limit matrix of the super matrix by raising the super matrix to a sufficiently high power.
Some of the sub-matrices for the super matrix can be obtained from the priority weights determined by the original AHP model. However, additional assessments using pairwise comparisons are necessary to assess the other sub-matrices depending on the interdependencies among the nodes.
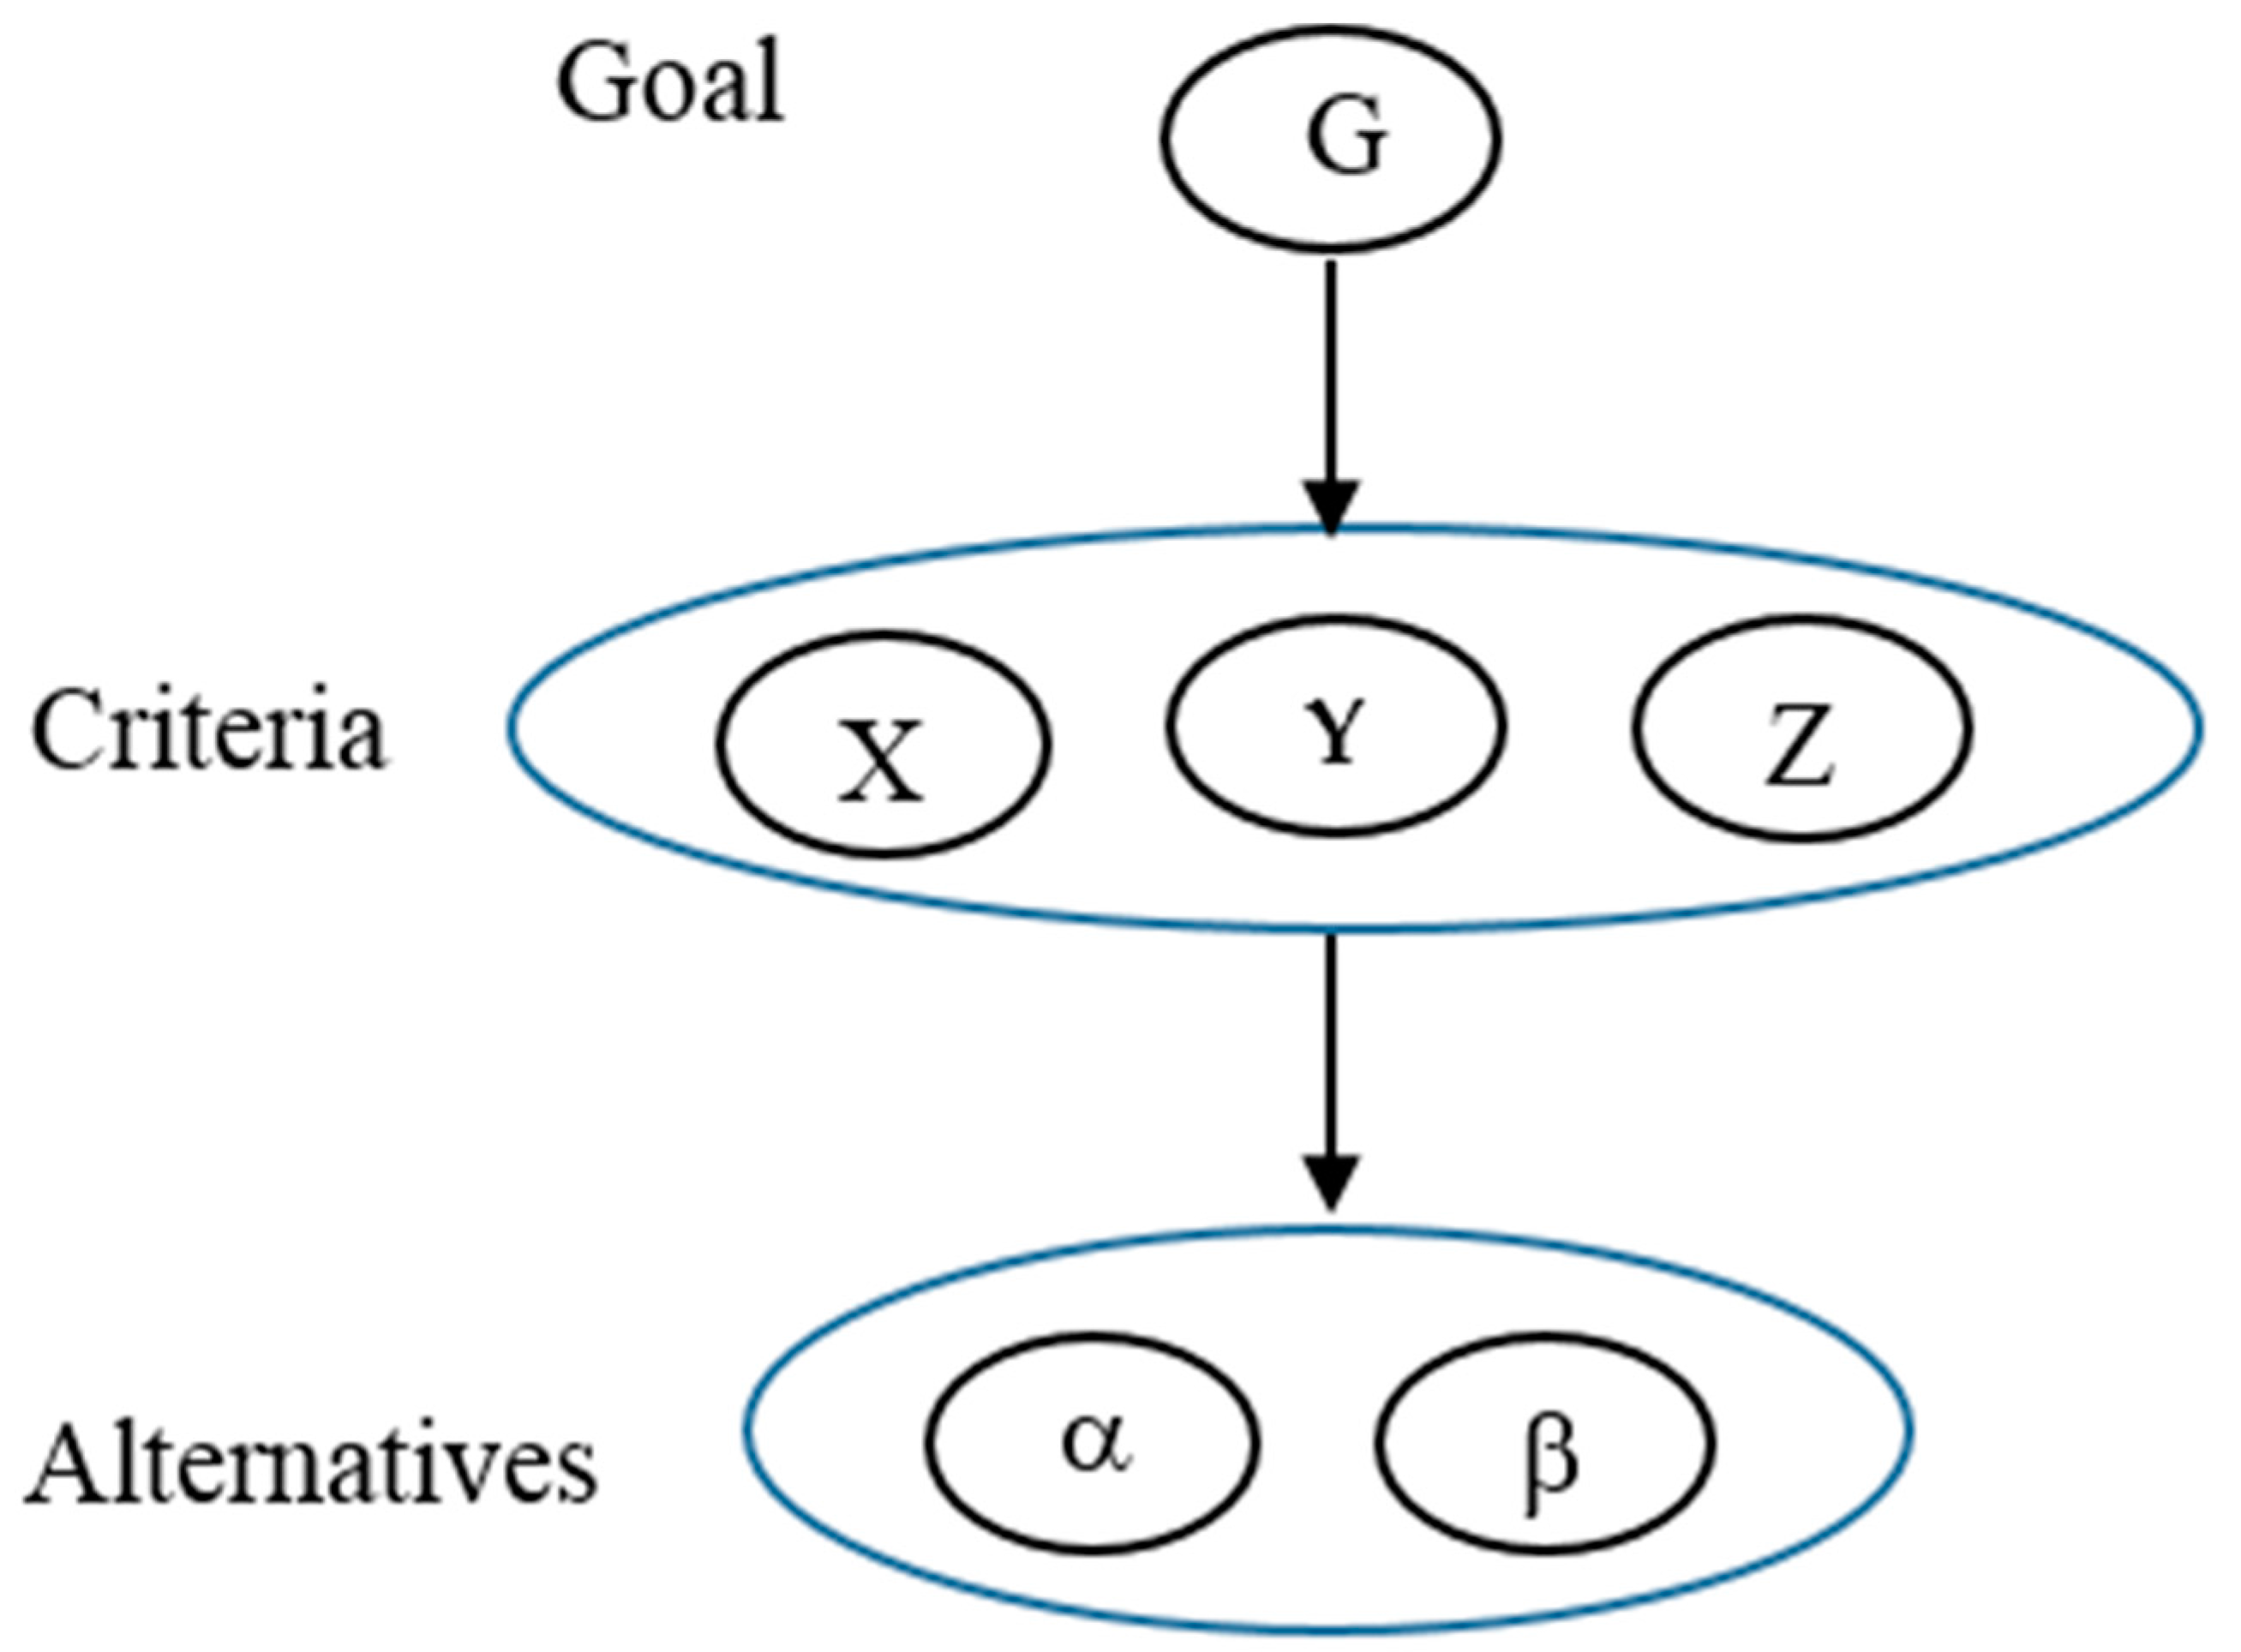
To illustrate the construction of a super matrix, that us first consider the equivalent ANP model of a simple 3-level AHP model comprising a Goal with three criteria (X, Y, Z) and two alternatives (α, β). The ANP network representing this problem is shown in Figure 7.
Let
- wic = the normalised weight of criterion i w.r.t. Goal, for i = X, Y, Z.
- wijA = the normalized weight of Alternative j w.r.t. criterion i, for i = X, Y, Z and j = α, β.
Then the global weight of the alternatives w.r.t. Goal is for j = α, β.
The ANP super matrix corresponding to the 3-level AHP model is shown in Figure 8. If the limit matrix of this super matrix is computed, we should obtain the same results as that obtained using the conventional AHP method.
In general, the ANP network structure corresponding to an AHP model has a top down linear structure as shown in Figure 7. When there are interdependences between the criteria and alternatives, the ANP network structure is no longer a top-down linear hierarchy structure, but a general network of clusters as shown earlier on in Figure 5.
4.4.4. The ANP Model for the Supply Chain Sustainability
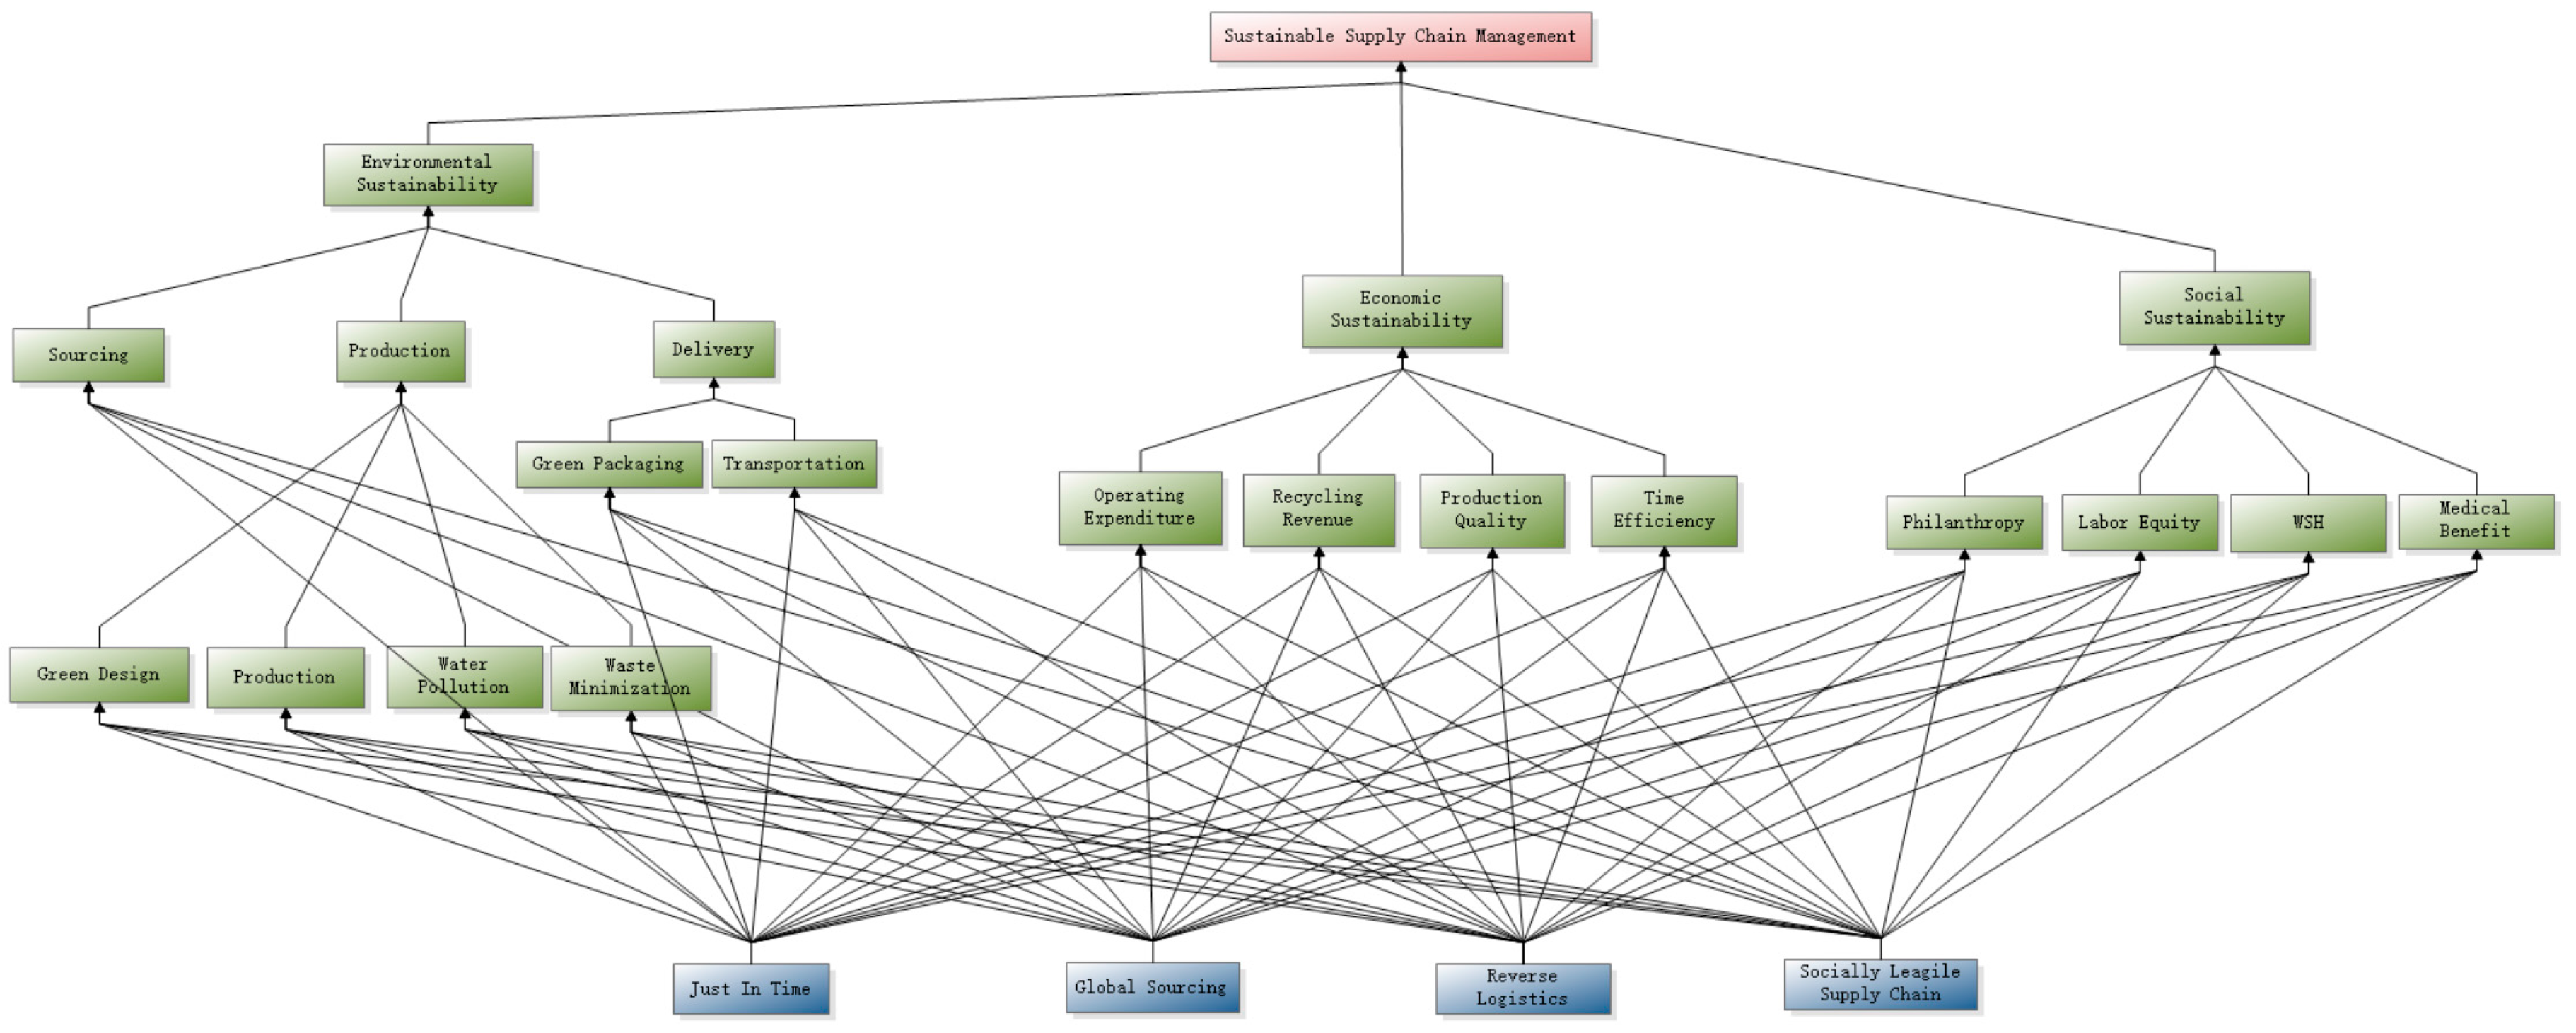
The AHP model for sustainable supply chain constructed earlier on may be simplified into an equivalent 3-level AHP by flattening the criteria hierarchy to contain only the leaf-criteria. These comprise the 15 sub-criteria on which the alternatives are directly connected to in the hierarchy. Figure 9 shows the ANP network model.
The global weights of leaf criteria may be computed in the usual linear criteria weighted sum form, and used in the criteria to criteria cluster to goal column of the super-matrix. Next, columns of the alternatives cluster to criteria cluster sub-matrix may be filled in using the local weights of the four alternatives with respect to each leaf-criteria in the AHP model. Up to this point, the partially completed super matrix shown in Table 9 corresponds to the equivalent original AHP model. If the super matrix of Table 9 is solved, we would obtain the same solution as with the AHP model. Indeed this is illustrated as shown in Table 10 which is the limit matrix of the super matrix in Table 9.
In order to complete the super matrix at this stage, it is necessary to assess the criteria cluster to alternative cluster sub-matrix. Table 11, Table 12, Table 13, and Table 14 show the pairwise compression of the 15 criteria with respect to each of the four alternatives, respectively. The normalized weights from these four pairwise comparisons are added to the columns under the corresponding alternative in the super matrix as shown in Table 15. The limit matrix for the super matrix of Table 15 is shown in Table 16.
The results that are shown as the last four cells in the first column indicate a change in the rankings of the alternatives compared to the AHP result. The best alternative for a sustainable supply chain management is now the socially leagile supply chain instead of reverse logistics. This change ranking of the alternatives imply that the earlier AHP model had been an over-simplification of the problem and that the interdependencies of the elements had not been properly and adequately captured by the model. The addition of the network influence of alternatives on criteria in the model has made the model more comprehensive and realistic, reflecting the relationships among the elements [36]. In summary, the use of ANP is therefore a necessity in order to make the right decision.
4.5. Sensitivity Analyses
Sensitivity analysis, also known as what-if analysis in decision analysis, studies how a change in one or more key factors or parameters in the decision model may impact on the decision made. This is an important step in the decision-support process as very often the decision-maker is interested in knowing to what extent his or her decision is valid given possible changes to some key parameters or assumptions.
In MCDM, a key factor that drives the final decision is the priority that has been placed on some key criteria or factors. This is expressed via the weight that was assigned to the specific criterion in the model. One-way sensitivity analysis addresses this problem by varying the weight of a criterion, one at a time, from 0 to 1, while keeping the weights of the other criteria in the same relative proportion as in the original base model.
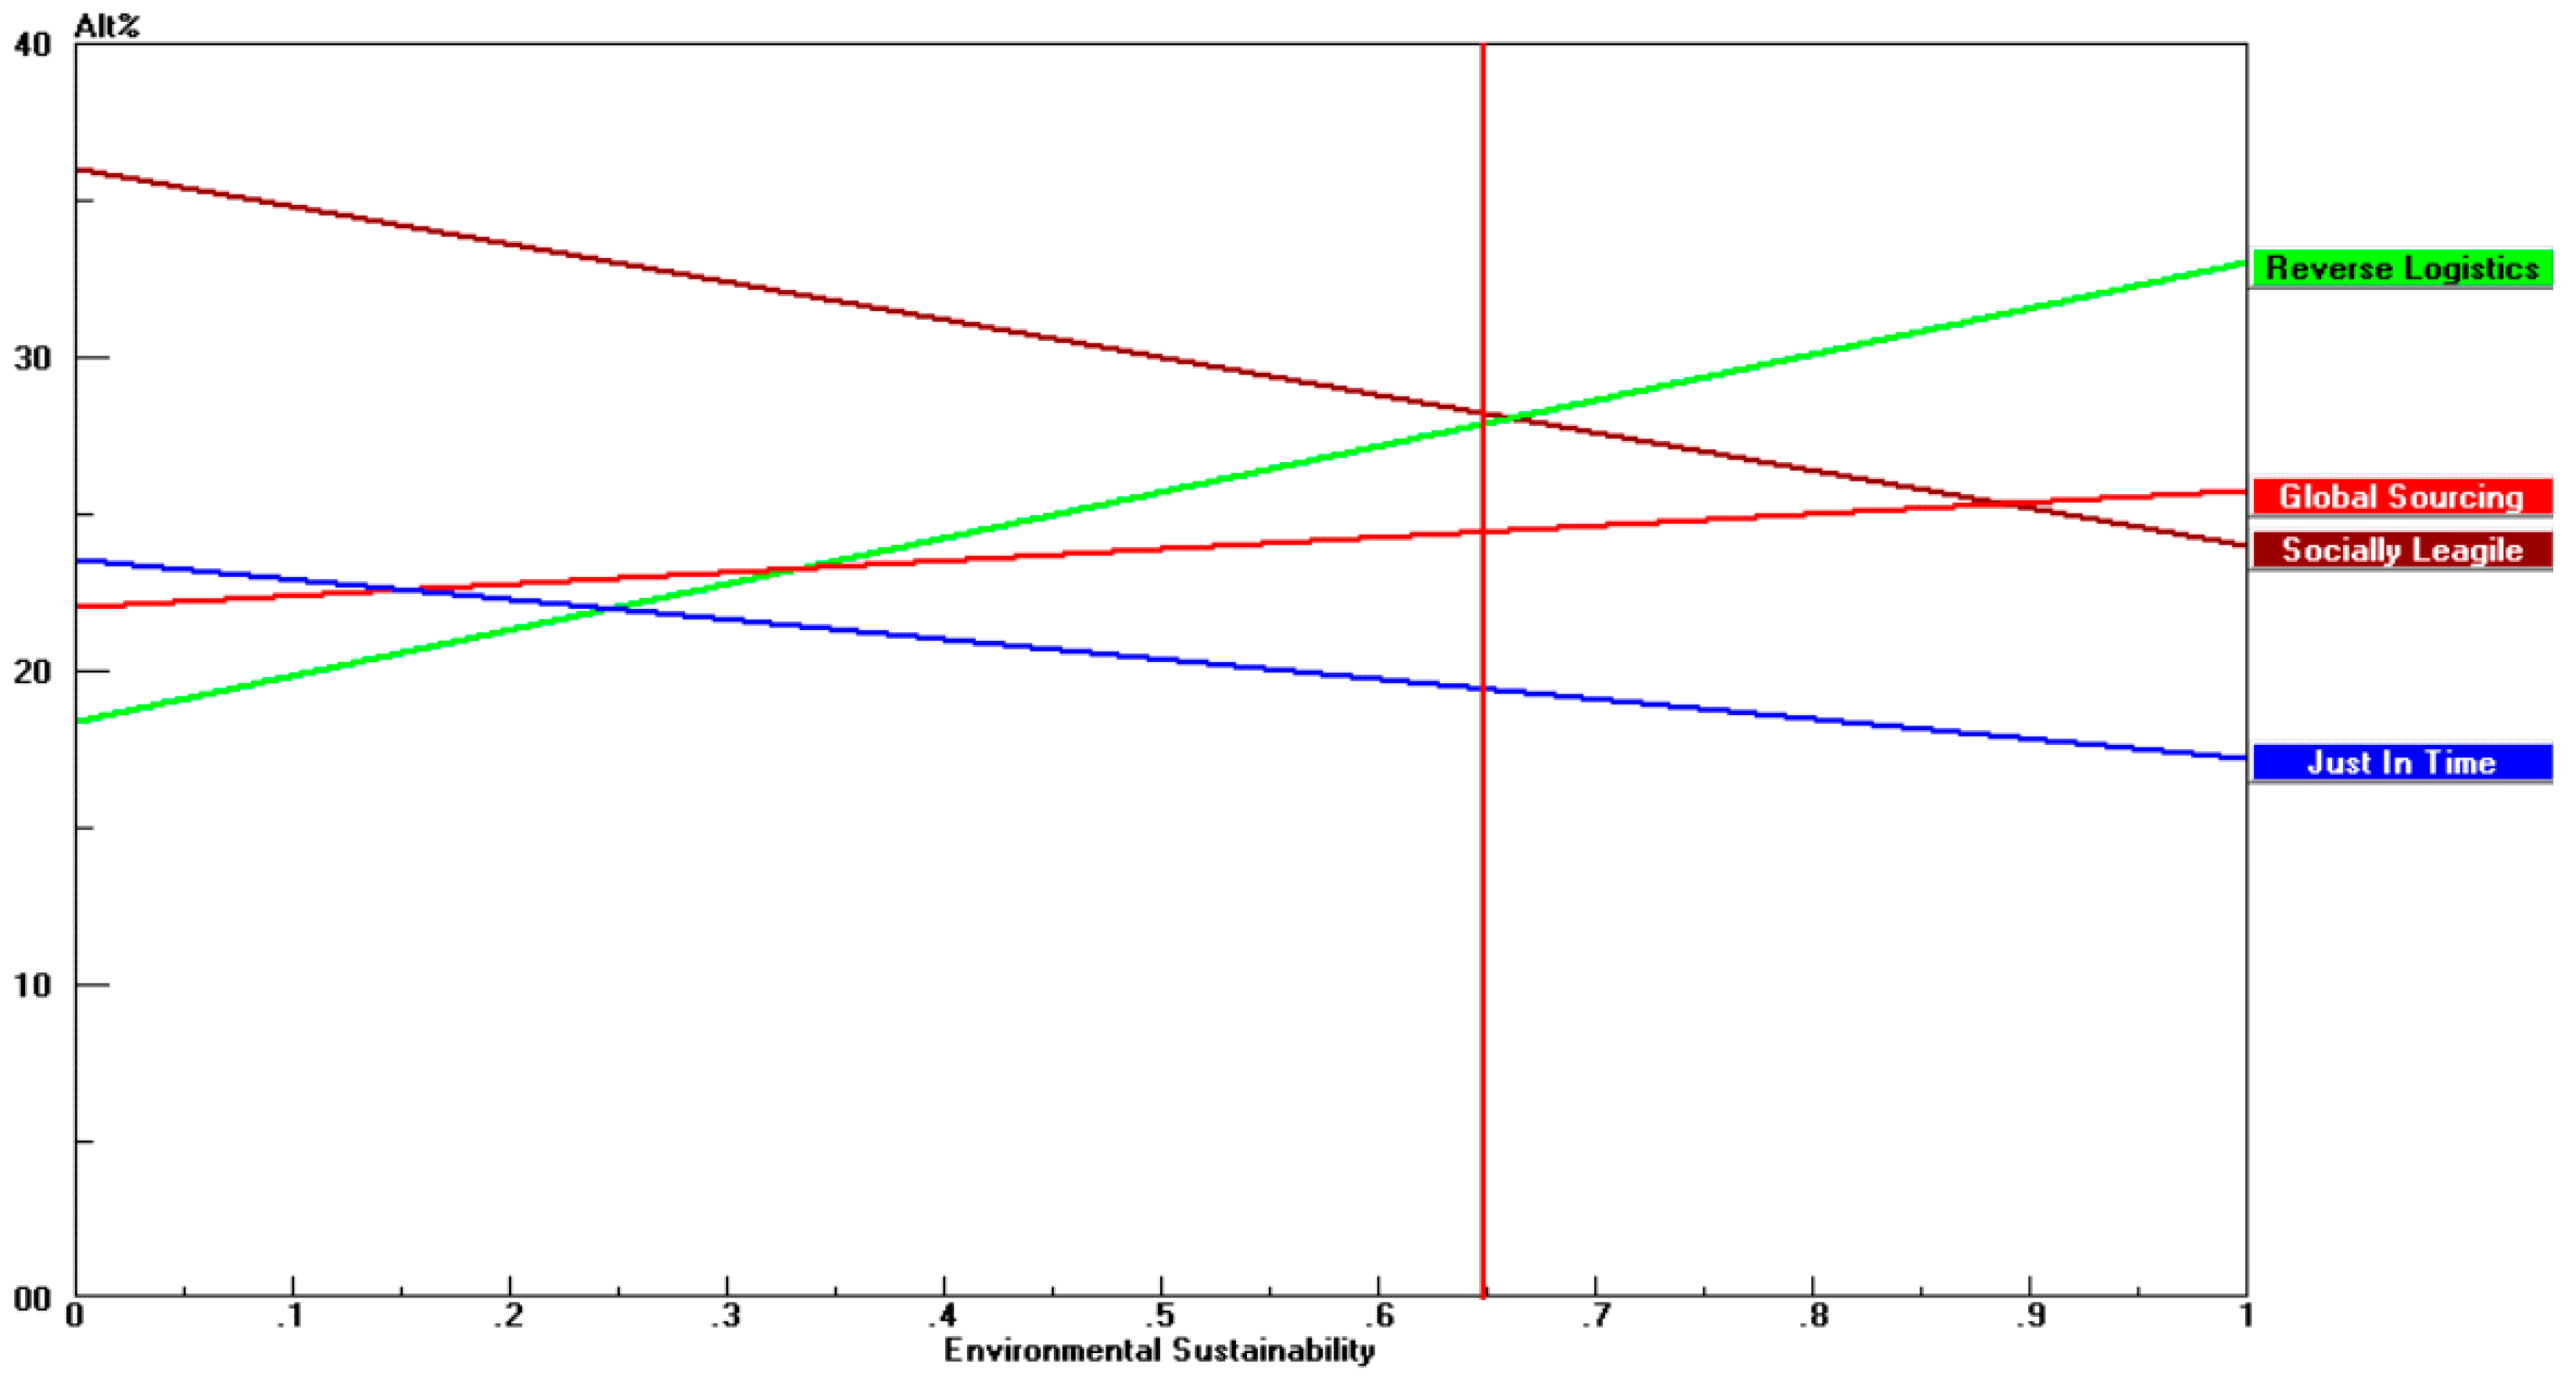
Figure 10 shows the one-way sensitivity analysis graph (also known as a rainbow diagram) for the global weights of the four alternatives due to variation of Environmental sustainability criterion weight from 0 to 1. From Figure 10, we observed that when the Environmental sustainability criterion weight is between 0 and 0.65, the best alternative is socially leagile supply chain, and between 0.65 and 1, the best alternative is Revere Logistics. This means that is not possible for the other two alternatives, Just-in-Time and Global Sourcing, to be chosen under all possible values of the Environmental sustainability criterion weight. These two alternatives are said to be dominated.
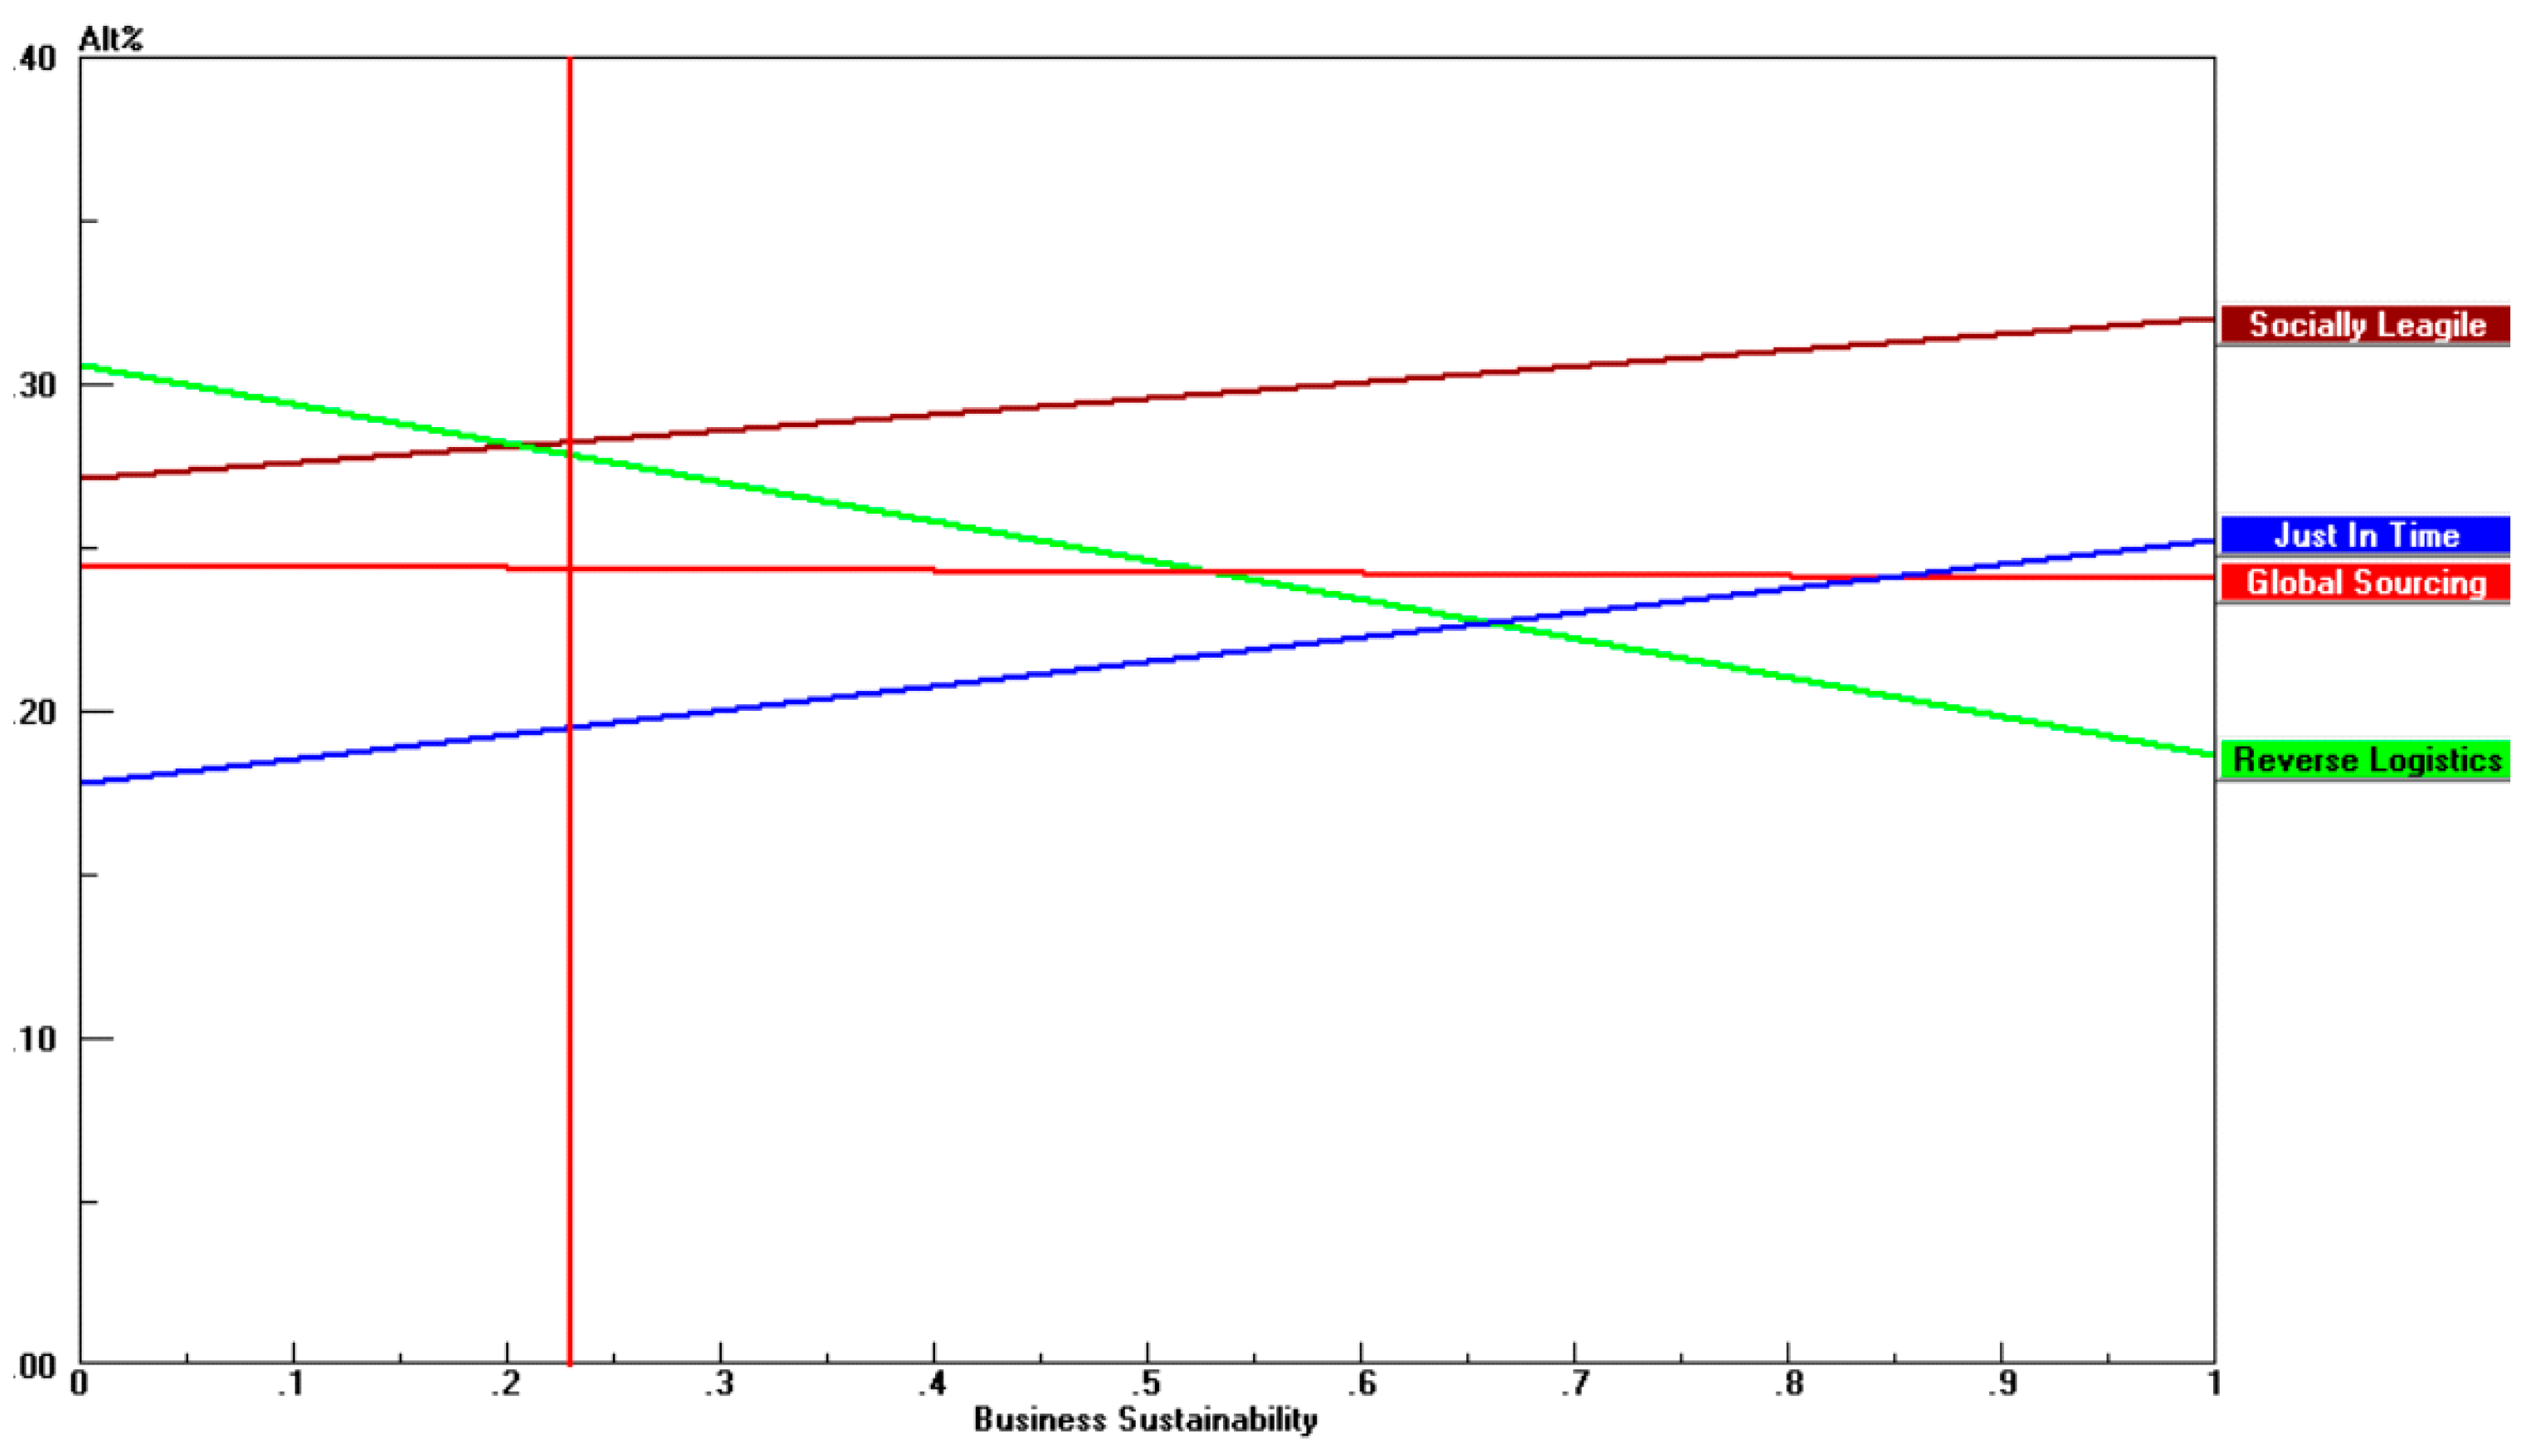
Figure 11 shows the one-way sensitivity analysis graph for the global weights of the four alternatives due to variation of Business sustainability criterion weight. From Figure 11, we observed that when the business sustainability criterion weight is between 0 and 0.2, the best alternative is Reverse logistic, and between 0.2 and 1, the best alternative is Socially Leagile. Just-in-Time and Global Sourcing are dominated alternatives.
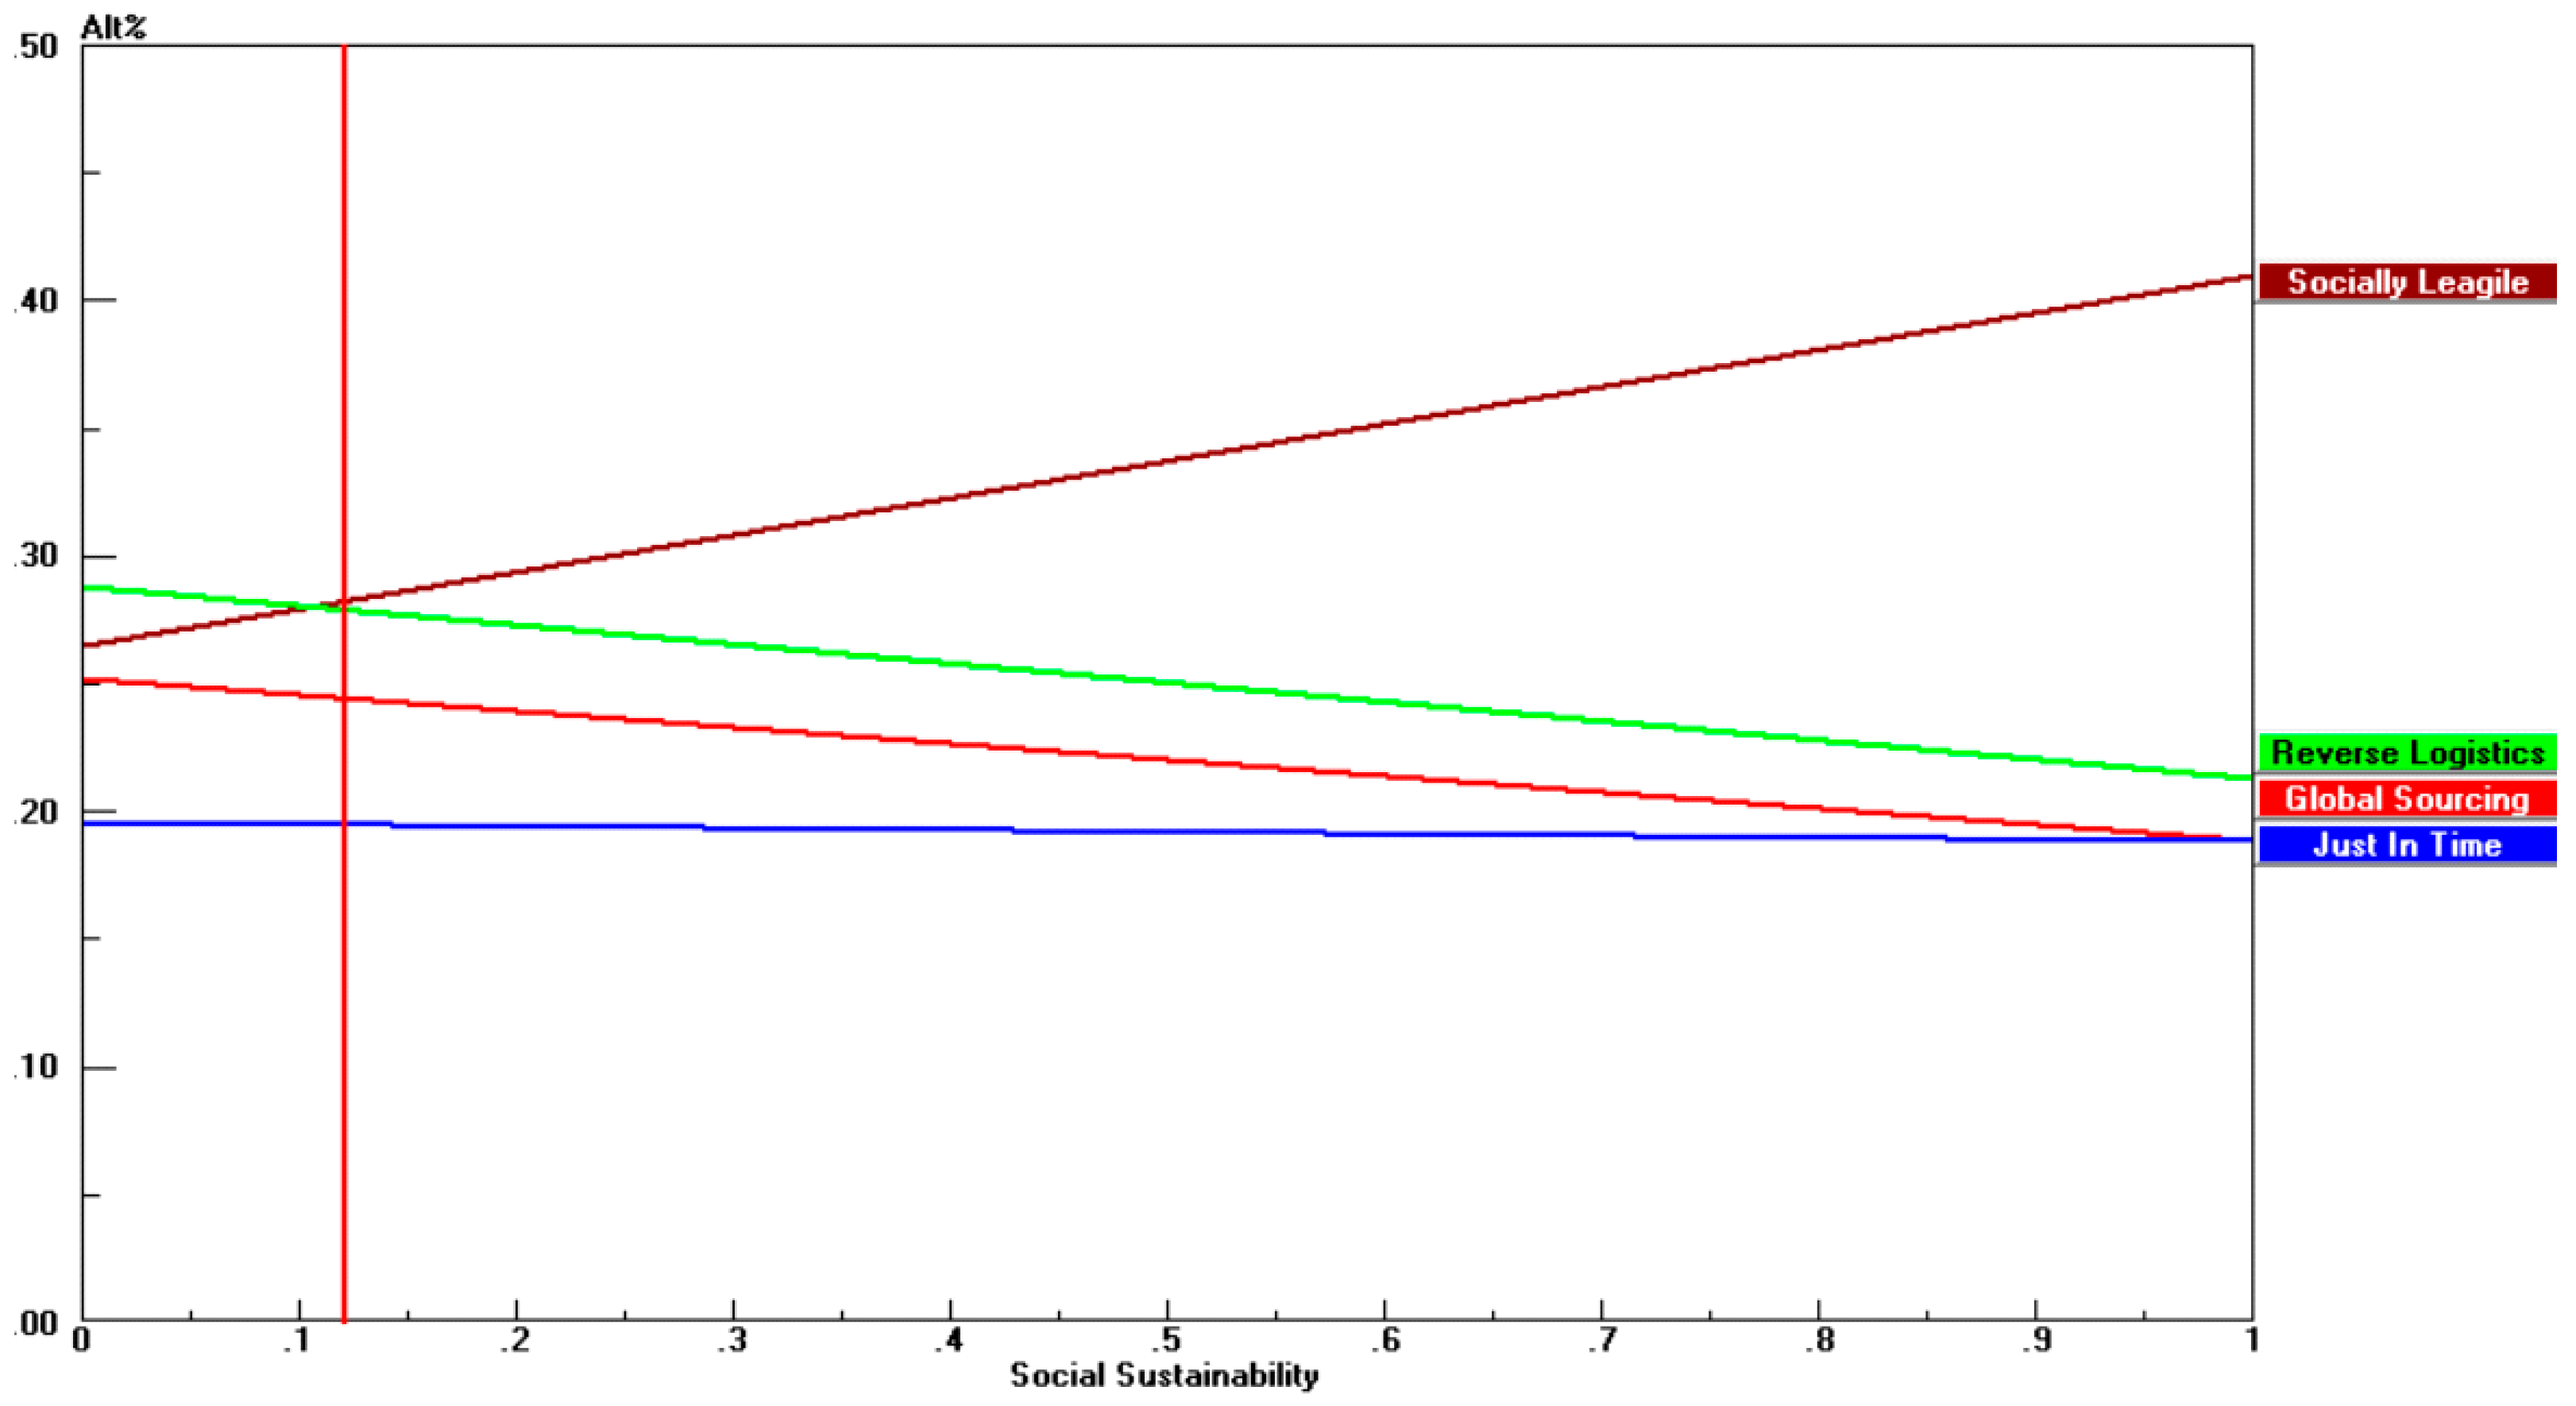
Figure 12 shows the one-way sensitivity analysis graph for the global weights of the four alternatives due to variation of Social sustainability criterion weight. From Figure 11, we observed that when the Social sustainability criterion weight is between 0 and 0.1, the best alternative is Reverse logistic, and between 0.1 and 1, the best alternative is Socially Leagile. Just-in-Time and Global Sourcing are dominated alternatives.
5. Conclusions
5.1. Discussion
In this paper, we present a decision-support approach based on multiple-criteria decision-making (MCDM) methodologies for a company to evaluate and select the best sustainable supply chain management strategy. The decision-maker has the flexibility of either using the AHP or the ANP methods depending on the nature of the problem as well as information and expertise availability. However, as demonstrated by the case study, the development of an ANP model is often a necessity and not a luxury in order to adequately capture and reveal the complex relationships and interdependencies among the elements in decision-making concerning the sustainability of supply chains. However, very often, constructing an ANP model for large complex problems from scratch is often a very difficult task without the help of an experienced analyst. Our proposed approach can effectively facilitate this through an incremental modeling and analysis approach by first starting off with hierarchal thinking and structuring of the elements and the development of an AHP model that does not yet consider the inter-dependencies. We believe that the users can learn much from this “simplified” model and can gain enough insight about the problem before extending it to an ANP model. We have also provided an intuitive process for converting the AHP model to an ANP model.
In the case study, we have focused on the three dimensions—environmental, economic and social—in the evaluation of sustainable supply chains. Until recently, the consideration of the social dimension has often been neglected or included implicitly in the environmental dimension. Our model is therefore holistic and is comprehensive enough to assist the companies’ evaluation of their supply chain management practices, setting of benchmarks, monitoring, and improving the performance of their supply chain. Hence, companies can systematically make informed and timely decisions to develop appropriate and strategic management approaches to achieve sustainable supply chains.
Finally, it should be noted that, although our case study focused on the sustainable supply chain, the proposed decision-support approach and all the associated methodologies are general enough to be applied to other domains as well.
5.2. Limitations and Future Work
The models built in the case study are based on the authors’ own assessments and judgements based on the available literature. In reality, different companies may hold different standards and priorities in judging the performance of their supply chain. Experts and practitioners’ knowledge and experience may be required to provide more accurate weightings and more professional assessments in evaluating the criteria and alternatives. We therefore acknowledge that we may have left out some sub-criteria under each of the three main criteria that some practitioners may consider important. In our case study of fashion companies, we only considered companies whom we think are representative of the industry. This limitation can be overcome by consideration of more companies and the consideration of more alternative supply chain management strategies.
In order to make the process of converting an AHP model to an ANP model as simple as possible for practitioners to adopt and use, we only use one criteria cluster comprising all the leaf-criteria, and only feedback loops to and from the alternatives clusters. This model ignored the inner dependencies and interaction among the criteria. This limitation can be removed by extending the model to include multiple-criteria clusters and the inner and outer dependencies of the criteria may be captured more accurately. However, much more information and modeling expertise would be required to achieve this. Hence, future work should include the development of automatic and intelligent decision-support tools to overcome these difficulties.
Acknowledgments
The authors would like to thanks the Department of Industrial Systems Engineering and Management at the National University of Singapore for the general support provided.
Author Contributions
Both authors conceived and built the models, analysed the results, and wrote the paper jointly.
Conflicts of Interest
The authors declare no conflict of interest.
Appendix A

Table A1.
Pairwise Comparison of Alternatives w.r.t. sub-criterion Sourcing.
| Just-in-Time | Global Sourcing | Reverse Logistics | Socially Leagile SC | Weight | |
|---|---|---|---|---|---|
| Just-in-Time | 1 | 1 | 3 | 3 | 0.375 |
| Global Sourcing | 1 | 1 | 3 | 3 | 0.375 |
| Reverse Logistics | 1/3 | 1/3 | 1 | 1 | 0.125 |
| Socially Leagile SC | 1/3 | 1/3 | 1 | 1 | 0.125 |
Table A2.
Pairwise Comparison of Alternatives w.r.t. sub-criterion Green Design.
| Just-in-Time | Global Sourcing | Reverse Logistics | Socially Leagile SC | Weight | |
|---|---|---|---|---|---|
| Just-in-Time | 1 | 1 | 1/3 | 1/4 | 0.1090 |
| Global Sourcing | 1 | 1 | 1/3 | 1/4 | 0.1090 |
| Reverse Logistics | 3 | 3 | 1 | 1/2 | 0.2968 |
| Socially Leagile SC | 4 | 4 | 2 | 1 | 0.4852 |
Table A3.
Pairwise Comparison of Alternatives w.r.t. sub-criterion Resource Consumption.
| Just-in-Time | Global Sourcing | Reverse Logistics | Socially Leagile SC | Weight | |
|---|---|---|---|---|---|
| Just-in-Time | 1 | 1 | 1/3 | 1/2 | 0.1377 |
| Global Sourcing | 1 | 1 | 1/3 | 1/3 | 0.1258 |
| Reverse Logistics | 3 | 3 | 1 | 2 | 0.4483 |
| Socially Leagile SC | 2 | 2 | 1/2 | 1 | 0.2879 |
Table A4.
Pairwise Comparison of Alternatives w.r.t. sub-criterion Water Pollution.
| Just-in-Time | Global Sourcing | Reverse Logistics | Socially Leagile SC | Weight | |
|---|---|---|---|---|---|
| Just-in-Time | 1 | 1 | 1/2 | 1/3 | 0.1437 |
| Global Sourcing | 1 | 1 | 1/2 | 1/2 | 0.1613 |
| Reverse Logistics | 2 | 2 | 1 | 1/2 | 0.2700 |
| Socially Leagile SC | 3 | 2 | 2 | 1 | 0.4249 |
Table A5.
Pairwise Comparison of Alternatives w.r.t. sub-criterion Waste Minimization.
| Just-in-Time | Global Sourcing | Reverse Logistics | Socially Leagile SC | Weight | |
|---|---|---|---|---|---|
| Just-in-Time | 1 | 1/3 | 1/5 | 1/3 | 0.0797 |
| Global Sourcing | 3 | 1 | 1/3 | 1 | 0.2071 |
| Reverse Logistics | 5 | 3 | 1 | 2 | 0.4859 |
| Socially Leagile SC | 3 | 1 | 1/2 | 1 | 0.2272 |
Table A6.
Pairwise Comparison of Alternatives w.r.t. sub-criterion Green Packaging.
| Just-in-Time | Global Sourcing | Reverse Logistics | Socially Leagile SC | Weight | |
|---|---|---|---|---|---|
| Just-in-Time | 1 | 1/2 | 1/5 | 3 | 0.0851 |
| Global Sourcing | 2 | 1 | 1/3 | 1/2 | 0.1519 |
| Reverse Logistics | 5 | 3 | 1 | 3 | 0.5232 |
| Socially Leagile SC | 3 | 2 | 1/3 | 1 | 0.2398 |
Table A7.
Pairwise Comparison of Alternative w.r.t. sub-criterion Transportation.
| Just-in-Time | Global Sourcing | Reverse Logistics | Socially Leagile SC | Weight | |
|---|---|---|---|---|---|
| Just-in-Time | 1 | 1/5 | 1 | 1/3 | 0.1024 |
| Global Sourcing | 5 | 1 | 3 | 3 | 0.5272 |
| Reverse Logistics | 1 | 1/3 | 1 | 1/2 | 0.1295 |
| Socially Leagile SC | 3 | 1/3 | 2 | 1 | 0.2409 |
Table A8.
Pairwise Comparison of Alternative w.r.t. sub-criterion Operating Expenditure.
| Just-in-Time | Global Sourcing | Reverse Logistics | Socially Leagile SC | Weight | |
|---|---|---|---|---|---|
| Just-in-Time | 1 | 1/2 | 1 | 1/2 | 0.1681 |
| Global Sourcing | 2 | 1 | 1 | 1/2 | 0.2390 |
| Reverse Logistics | 1 | 1 | 1 | 1/2 | 0.1976 |
| Socially Leagile SC | 2 | 2 | 2 | 1 | 0.3952 |
Table A9.
Pairwise Comparison of Alternative w.r.t. sub-criterion Recycling Revenue.
| Just-in-Time | Global Sourcing | Reverse Logistics | Socially Leagile SC | Weight | |
|---|---|---|---|---|---|
| Just-in-Time | 1 | 1 | 1/5 | 1/3 | 0.1065 |
| Global Sourcing | 1 | 1 | 1/3 | 1/3 | 0.1201 |
| Reverse Logistics | 5 | 3 | 1 | 1 | 0.4131 |
| Socially Leagile SC | 3 | 3 | 1 | 1 | 0.3603 |
Table A10.
Pairwise Comparison of Alternative w.r.t. sub-criterion Production Quality.
| Just-in-Time | Global Sourcing | Reverse Logistics | Socially Leagile SC | Weight | |
|---|---|---|---|---|---|
| Just-in-Time | 1 | 1 | 2 | 2 | 0.3383 |
| Global Sourcing | 1 | 1 | 2 | 1 | 0.2878 |
| Reverse Logistics | 1/2 | 1/2 | 1 | 1 | 0.1692 |
| Socially Leagile SC | 1/2 | 1 | 1 | 1 | 0.2046 |
Table A11.
Pairwise Comparison of Alternative w.r.t. sub-criterion Time Efficiency.
| Just-in-Time | Global Sourcing | Reverse Logistics | Socially Leagile SC | Weight | |
|---|---|---|---|---|---|
| Just-in-Time | 1 | 2 | 5 | 2 | 0.4488 |
| Global Sourcing | 1/2 | 1 | 3 | 1 | 0.2346 |
| Reverse Logistics | 1/5 | 1/3 | 1 | 1/3 | 0.0819 |
| Socially Leagile SC | 1/2 | 1 | 3 | 1 | 0.2346 |
Table A12.
Pairwise Comparison of Alternative w.r.t. sub-criterion Philanthropy.
| Just-in-Time | Global Sourcing | Reverse Logistics | Socially Leagile SC | Weight | |
|---|---|---|---|---|---|
| Just-in-Time | 1 | 1 | 1/2 | 1/4 | 0.1210 |
| Global Sourcing | 1 | 1 | 1/2 | 1/4 | 0.1210 |
| Reverse Logistics | 2 | 2 | 1 | 1/3 | 0.2196 |
| Socially Leagile SC | 4 | 4 | 3 | 1 | 0.5385 |
Table A13.
Pairwise Comparison of Alternative w.r.t. sub-criterion Labor Equity.
| Just-in-Time | Global Sourcing | Reverse Logistics | Socially Leagile SC | Weight | |
|---|---|---|---|---|---|
| Just-in-Time | 1 | 1 | 1 | 1/2 | 0.2000 |
| Global Sourcing | 1 | 1 | 1 | 1/2 | 0.2000 |
| Reverse Logistics | 1 | 1 | 1 | 1/2 | 0.2000 |
| Socially Leagile SC | 2 | 2 | 2 | 1 | 0.4000 |
Table A14.
Pairwise Comparison of Alternative w.r.t. sub-criterion Workplace safety & Health.
| Just-in-Time | Global Sourcing | Reverse Logistics | Socially Leagile SC | Weight | |
|---|---|---|---|---|---|
| Just-in-Time | 1 | 1 | 1 | 1/2 | 0.2036 |
| Global Sourcing | 1 | 1 | 1/2 | 0.2036 | |
| Reverse Logistics | 1 | 1 | 0.2463 | ||
| Socially Leagile SC | 1 | 0.3466 |
Table A15.
Pairwise Comparison of Alternative w.r.t. sub-criterion Medical Benefit.
| Just-in-Time | Global Sourcing | Reverse Logistics | Socially Leagile SC | Weight | |
|---|---|---|---|---|---|
| Just-in-Time | 1 | 1 | 1 | 1/3 | 0.1667 |
| Global Sourcing | 1 | 1 | 1/3 | 0.1667 | |
| Reverse Logistics | 1 | 1/3 | 0.1667 | ||
| Socially Leagile SC | 1 | 0.5000 |
References
- Golinska, P.; Romano, A.C. Environmental Issues in Supply Chain Management—Main Challenges. Available online: http://www.europeanfinancialreview.com/?p=1568 (accessed on 30 June 2017).
- Carter, C.R.; Dale, S.R. A framework of sustainable supply chain management: Moving toward new theory. Int. J. Phys. Distrib. Logist. Manag. 2008, 38, 360–387. [Google Scholar] [CrossRef]
- Fernie, J.; Sparks, L. (Eds.) Logistics and Retail Management: Insights into Current Practice and Trends from Leading Experts; The Institute of Logistics and Transport: London, UK, 2004. [Google Scholar]
- Saaty, T.L. The Analytic Hierarchy Process; McGraw Hill: New York, NY, USA, 1980. [Google Scholar]
- Saaty, T.L.; Vargas, L.G. Decision Making with the Analytic Network Process; Springer: New York, NY, USA, 2006. [Google Scholar]
- Gardetti, M.A.; Torres, A.L. Textiles, Fashion and Sustainability; The Sustainable Textile Centre, Greeleaf Publishing Argentina: Oxford, UK, 2012. [Google Scholar]
- Ditty, S. Europe in the World: The Garment, Textiles & Fashion Industry. Available online: http://fashionrevolution.org/europe-in-the-world-the-garment-textiles-fashion-industry/ (accessed on 30 June 2017).
- Cooper, M.C.; Lambert, D.M.; Pagh, J.D. Supply Chain Management: More Than a New Name for Logistics. Int. J. Logist. Manag. 1997, 8, 1–14. [Google Scholar] [CrossRef]
- Seuring, S.; Müller, M. From a literature review to a conceptual framework for sustainable supply chain management. J. Clean. Prod. 2008, 16, 1699–1710. [Google Scholar] [CrossRef]
- Wally, N.; Whitehead, B. It is not easy being green. Harv. Bus. Rev. 1994, 72, 46–52. [Google Scholar]
- Boukherroub, T.; Ruiz, A.; Guinet, A.; Fondrevelle, J. An integrated approach for sustainable supply chain planning. Comput. Oper. Res. 2015, 54, 180–194. [Google Scholar] [CrossRef]
- Chardine-Baumann, E.; Botta-Genoulaz, V. A framework for sustainable performance assessment of supply chain management practices. Comput. Ind. Eng. 2014, 76, 138–147. [Google Scholar] [CrossRef]
- Haghighi, M.; Torabi, S.A.; Ghasemi, R. An integrated approach for performance evaluation in sustainable supply chain (with a case study). J. Clean. Prod. 2016, 137, 579–597. [Google Scholar] [CrossRef]
- Wu, K.-J.; Liao, C.-J.; Tseng, M.; Chiu, K.K. Multi-attrbute approach to sustainable supply chain management under uncertainty. Ind. Manag. Data Syst. 2016, 116, 777–800. [Google Scholar]
- Lin, Y.-H.; Tseng, M.-L. Assessing the competitive priorities within sustainable supply chain management under uncertainty. J. Clean. Prod. 2016, 112, 2133–2144. [Google Scholar]
- Sarkis, J. A strategic decision framework for green supply chain management. J. Clean. Prod. 2003, 11, 397–409. [Google Scholar] [CrossRef]
- Newton, T.; Harte, G. Green business: Technicist kitsch? J. Manag. Stud. 1997, 34, 75–98. [Google Scholar] [CrossRef]
- Ho, J.C.; Shalishali, M.K.; Tseng, L.; Ang, D.S. Opportunities in Green Supply Chain Management. Coast. Bus. J. 2009, 8, 18–31. [Google Scholar]
- Luthra, S.; Kumar, V.; Kumar, S.; Haleem, A. Barriers to implement green supply chain management in automobile industry using interpretive structural modeling technique: An Indian perspective. J. Ind. Eng. Manag. 2011, 4, 231–257. [Google Scholar] [CrossRef]
- Triantaphyllou, E. Multi-criteria Decision Making Methods: A Comparative Study; Springer Science & Business Media: Dordrecht, Germany, 2000. [Google Scholar]
- Tzeng, G.H.; Huang, J.J. Multiple Attribute Decision Making: Methods and Applications; CRC Press: Boca Raton, FI, USA, 2011. [Google Scholar]
- Figueira, J.; Greco, S.; Ehrgott, M. Multiple Criteria Decision Analysis: State of the Art Surveys; Springer Science & Business Media: New York, NY, USA, 2005; Volume 78. [Google Scholar]
- Roy, B. Classement et choix en présence de points de vue multiples (la méthode ELECTRE). La Revue d'Informatique et de Recherche Opérationelle (RIRO) 1968, 8, 57–75. [Google Scholar] [CrossRef]
- Hwang, C.L.; Yoon, K. Multiple Attribute Decision Making: Methods and Applications; Springer-Verlag: New York, NY, USA, 1981. [Google Scholar]
- Brans, J.P. L’ingénierie de la Décision: Élaboration D’instruments D’aide à La décision. La Méthode PROMETHEE; Presses de l’Université Laval: Quebec, QC, Canada, 1982. [Google Scholar]
- Toloie-Eshlaghy, A.; Homayonfar, M. MCDM methodologies and applications: A literature review from 1999 to 2009. Res. J. Int. Stud. 2011, 21, 86–137. [Google Scholar]
- Gölcük, İ.; Baykasoğlu, A. An analysis of DEMATEL approaches for criteria interaction handling within ANP. Exp. Syst. Appl. 2016, 46, 346–366. [Google Scholar] [CrossRef]
- Mikhailov, L.; Singh, M.G. Fuzzy analytic network process and its application to the development of decision support systems. IEEE Trans. Syst. Man Cybern. Part C 2003, 33, 33–41. [Google Scholar] [CrossRef]
- Afande, F.O.; Ratemo, B.M.; Nyaribo, F.N. Adoption of Supply Chain Management Practices: Review of Determining Factors. Innov. Syst. Des. Eng. 2015, 6, 72–77. [Google Scholar]
- Investopedia. Just In Time—JIT. Available online: http://www.investopedia.com/terms/j/jit.asp (accessed on 30 June 2017).
- Sheffi, Y. Supply Chain Management under the Threat of International Terrorism. Logist. Manag. 2001, 12, 1–11. [Google Scholar] [CrossRef]
- Kannan, V.R.; Tan, K.C. Just in time, total quality management, and supply chain management: Understanding their linkages and impact on business performance. Omega 2005, 33, 153–162. [Google Scholar]
- Andersen, M.; Skjoett-Larsen, T. Corporate social responsibility in global supply chains. Supply Chain Manag. Int. J. 2009, 14, 75–86. [Google Scholar] [CrossRef]
- Sadraoui, T.; Mchirgui, N. Supply Chain Management Optimization within Information System Development. Int. J. Econ. Financ. Manag. 2014, 2, 59–71. [Google Scholar]
- Lynch, C.F. Logistics Outsourcing—A Management Guide. J. Bus. Logist. 2001, 22, 221–222. [Google Scholar]
- Von Haartman, R.; Bengtsson, L. Global sourcing for innovation and sustainable development. In Proceedings of the Presented at the EurOMA 2013, European Operations Management Association, Dublin, Ireland, 9–12 June 2013. [Google Scholar]
- Rogers, D.S.; Tibben-Lembke, R.S. Going Backwards: Reverse Logistics Trends and Practices; Reverse Logistics Executive Council: New York, NY, USA, 1998. [Google Scholar]
- Govindan, K.; Soleimani, H.; Kannan, D. Reverse logistics and closed-loop supply chain: A comprehensive review. Eur. J. Oper. Res. 2015, 240, 603–626. [Google Scholar] [CrossRef] [Green Version]
- Carter, C.R.; Ellram, L.M. Reverse Logistics: A Review of the Literature and Framework for Future Investigation. J. Bus. Logist. 1998, 19, 85–102. [Google Scholar]
- Rubio, S.; Miranda, F.J.; Chamorro, A.; Valero, V. Implementing a reverse logistics system: A case study. Int. J. Procure. Manag. 2009, 2, 346–357. [Google Scholar] [CrossRef]
- Naylor, J.B.; Naim, M.M.; Berry, D. Leagility: Integrating the lean and agile paradigms in the total supply chain. Int. J. Prod. Econ. 1999, 62, 107–118. [Google Scholar] [CrossRef]
- Mason-Jones, R.; Naylor, B.; Towill, D.R. Engineering the leagile supply chain. Int. J. Agil. Manag. Syst. 2000, 2, 54–61. [Google Scholar] [CrossRef]
- United Nations General Assembly. Resolution Adopted by the General Assembly: 2005 World Summit Outcome; Resolution A/60/1; UN General Assembly: New York, NY, USA, 2005. [Google Scholar]
- De Brito, M.P.; Carbone, V.; Blanquart, C.M. Towards a sustainable fashion retail supply chain in Europe: Organisation and performance. Int. J. Prod. Econom. 2008, 114, 534–553. [Google Scholar] [CrossRef]
- Thwing.org. The Three Pillars of Sustainability. 2014. Available online: http://www.thwink.org/sustain/glossary/ThreePillarsOfSustainability.htm (accessed on 30 June 2017).
- APICS. SCOR Framework. 2005. Available online: http://www.apics.org/apics-for-business/products-and-services/apics-scc-frameworks/scor (accessed on 30 June 2017 ).
- The World Bank. Guidance Notes on Tools for Pollution Management: Sustainability in the Supply Chain. The World Bank. Available online: http://siteresources.worldbank.org/INTRANETENVIRONMENT/Resources/244351-1279901011064/Sustainability-in-SupplyChain_111031.pdf (accessed on 30 June 2017).
- Hutchins, M.J.; Sutherland, J.W. An exploration of measures of social sustainability and their application. J. Clean. Prod. 2008, 16, 1688–1698. [Google Scholar] [CrossRef]
- Caniato, F.; Cardi, M.; Crippa, L.; Moeretto, A. Environmental sustainability in fashion supply chains: An exploratory case based research. Int. J. Prod. Econom. 2012, 135, 659–670. [Google Scholar] [CrossRef]
- Cruz, J.M. The impact of corporate social responsibility in supply chain management: Multicriteria decision-making approach. Decis. Support Syst. 2009, 48, 224–236. [Google Scholar] [CrossRef]
- Gwilt, A.; Rissanen, T. (Eds.) Shaping Sustainable Fashion: Changing the Way We Make and Use Clothes; Earthscan: London, UK, 2011. [Google Scholar]
- CIPS. Socially Responsible Procurement: Corporate Social Responsibility in a Supply Chain Context. CIPS Knowledge, 2013. Available online: https://www.cips.org/en-gb/knowledge/procurement-topics-and-skills/sustainability/corporate-social-responsibility-csr/socially-responsible-procurement---corporate-social-responsibility-in-a-supply-chain-context/ (accessed on 30 June 2017).
- SGX. Rulebooks: Sustainability Reporting Guide, 20 June 2006.
- Doane, D. The myth of CSR. Stanf. Soc. Innov. Rev. 2005, 3, 23–29. [Google Scholar]
- Simon, H.A. The architecture of complexity. Proc. Am. Philos. Soc. 1962, 106, 457–476. [Google Scholar]
Figure 1.
Fashion Supply Chain.
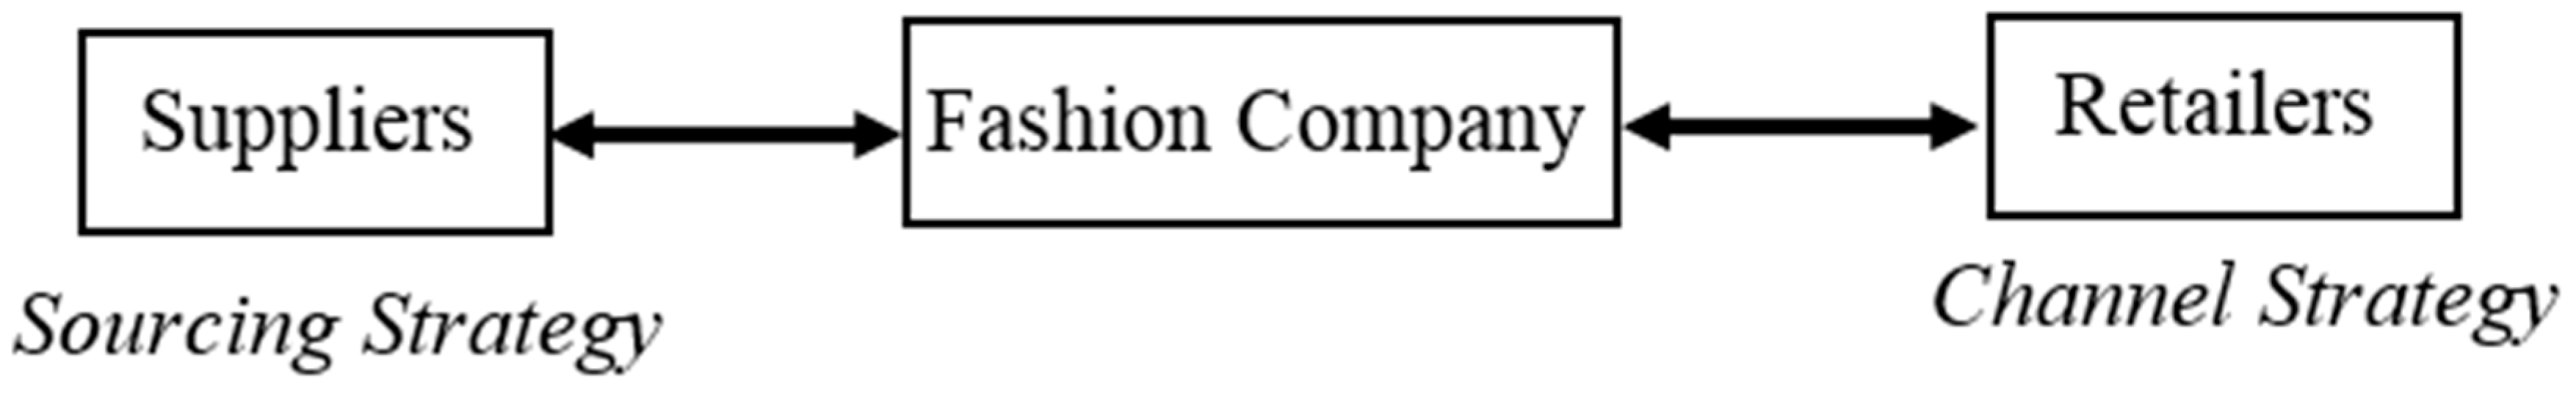
Figure 2.
Three pillars of sustainability.
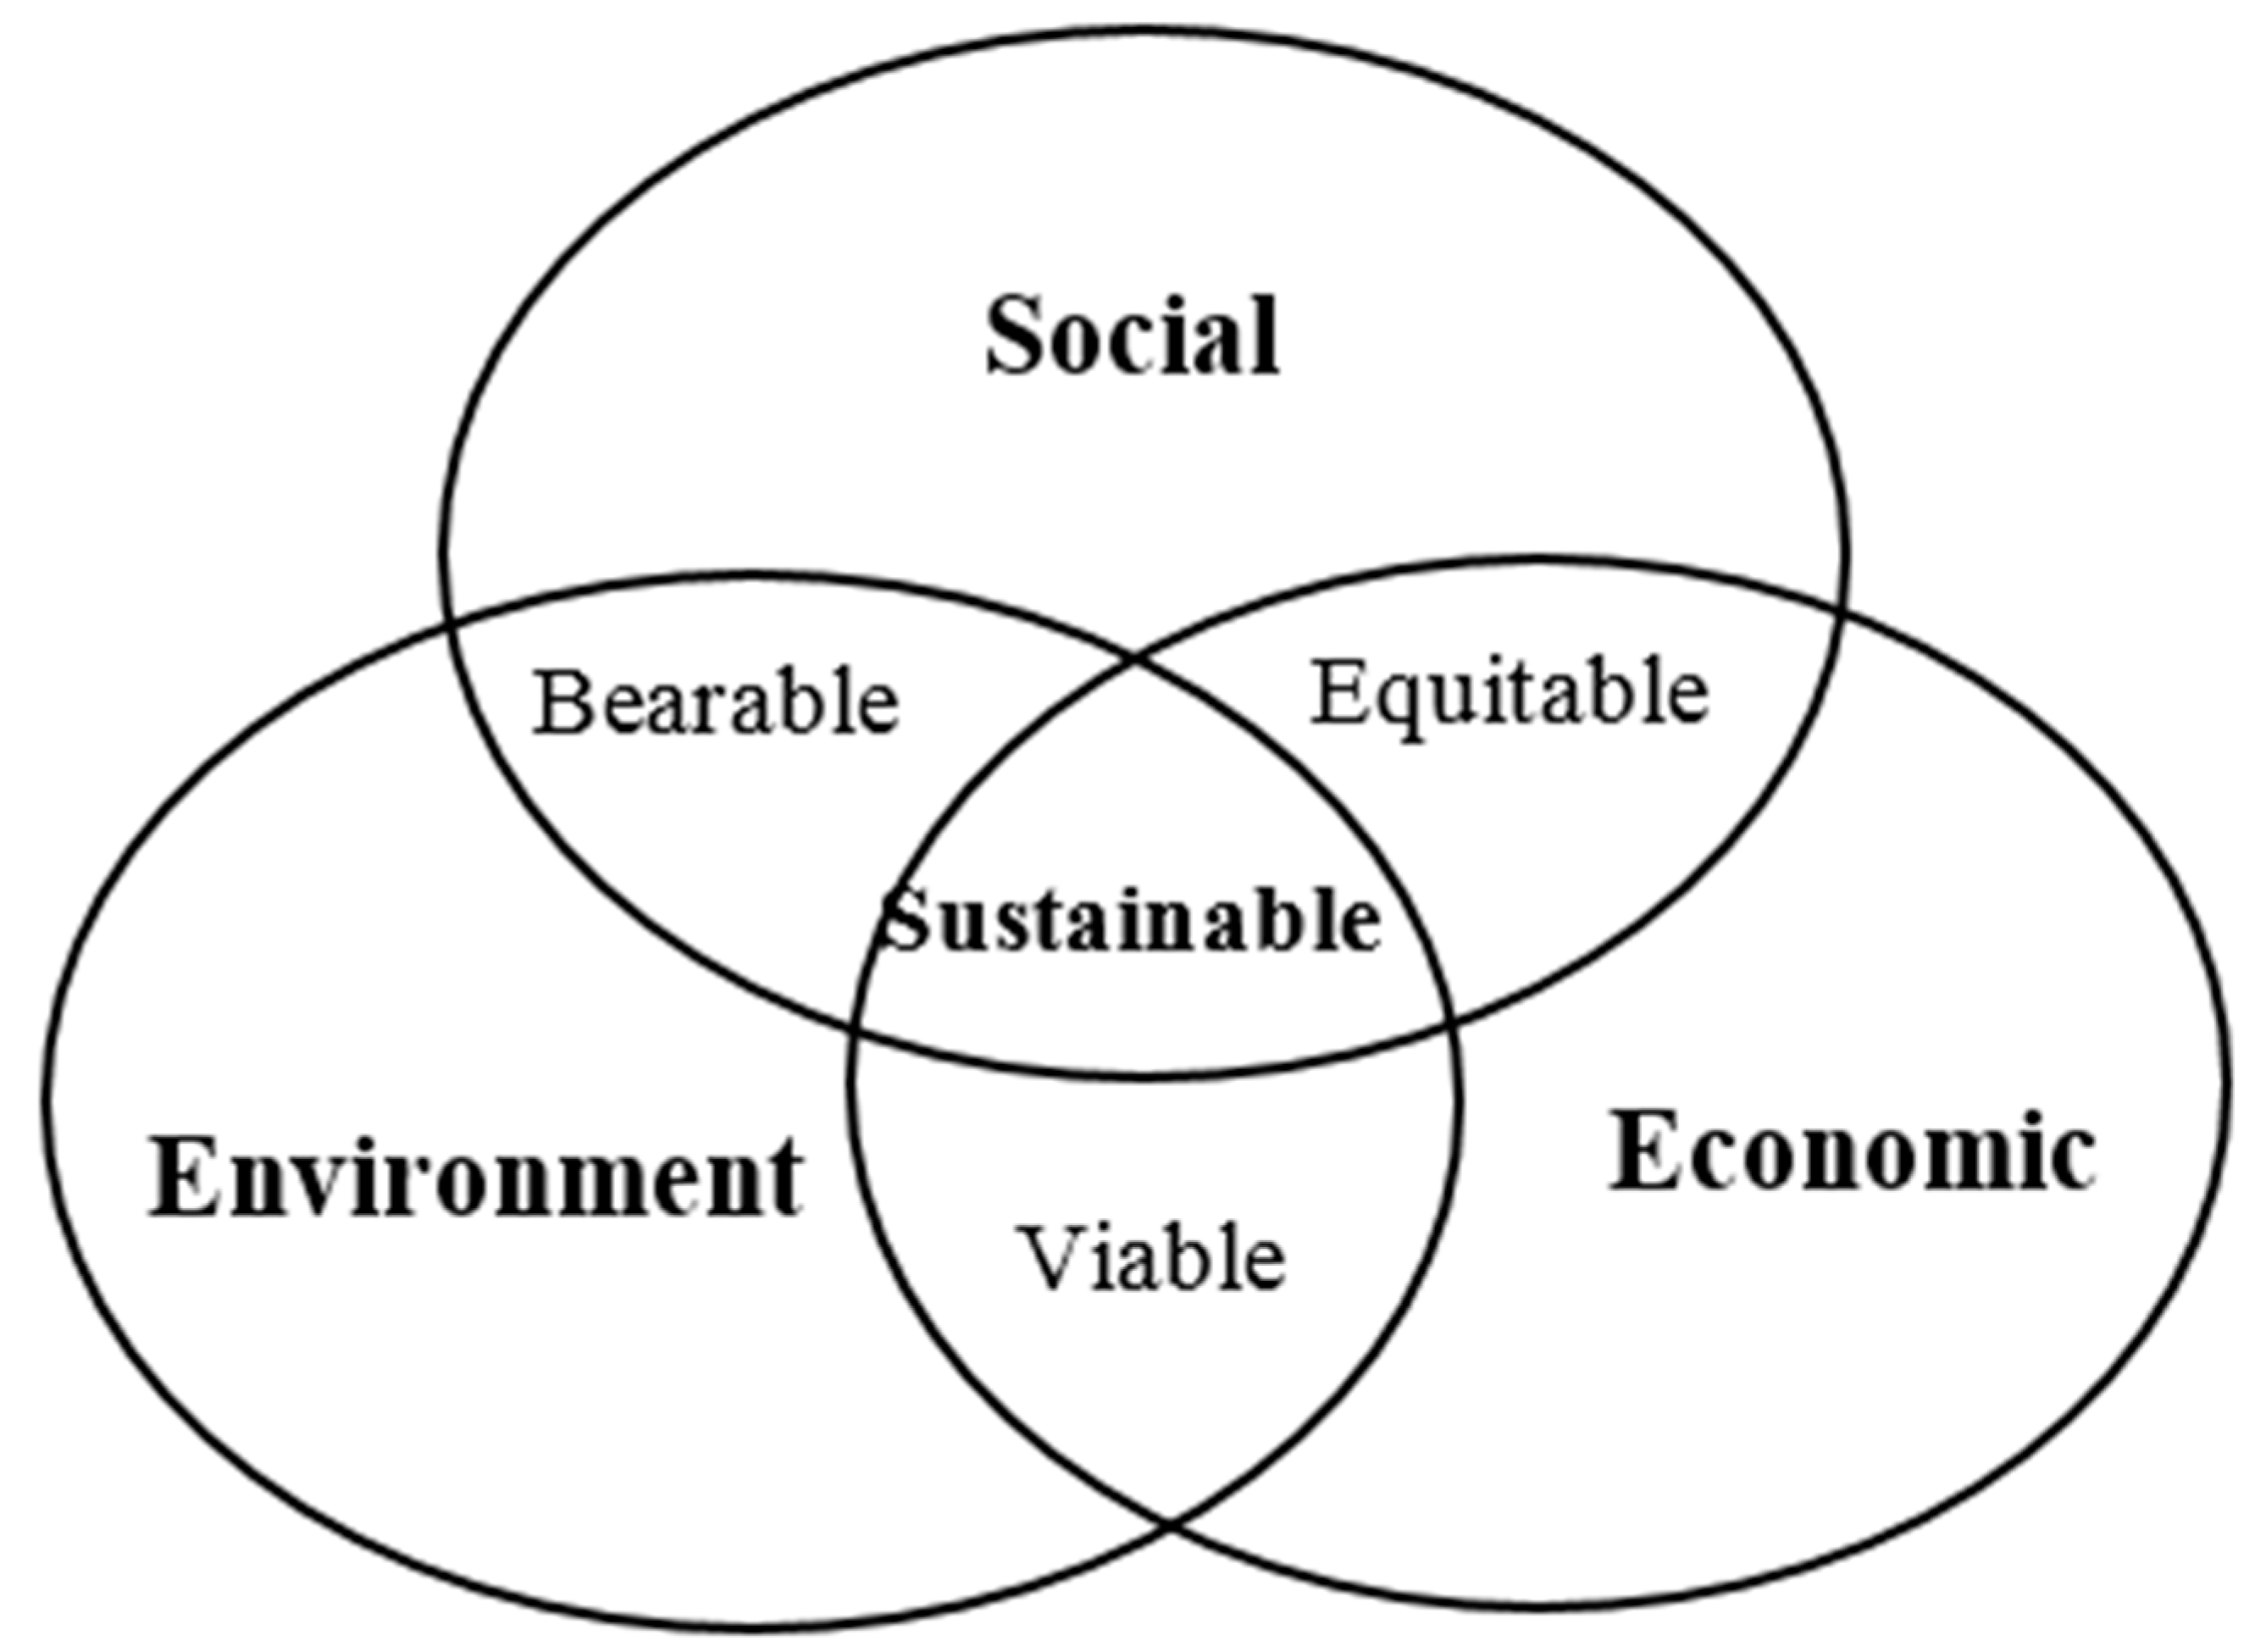
Figure 3.
The Hierarchy Structure for factors affecting supply chain sustainability.

Figure 4.
AHP Model.

Figure 5.
A general ANP network structure.

Figure 6.
The super matrix representing an ANP model.

Figure 7.
ANP network structure for a standard 3-level AHP model.

Figure 8.
Super matrix for the 3-level standard AHP model.
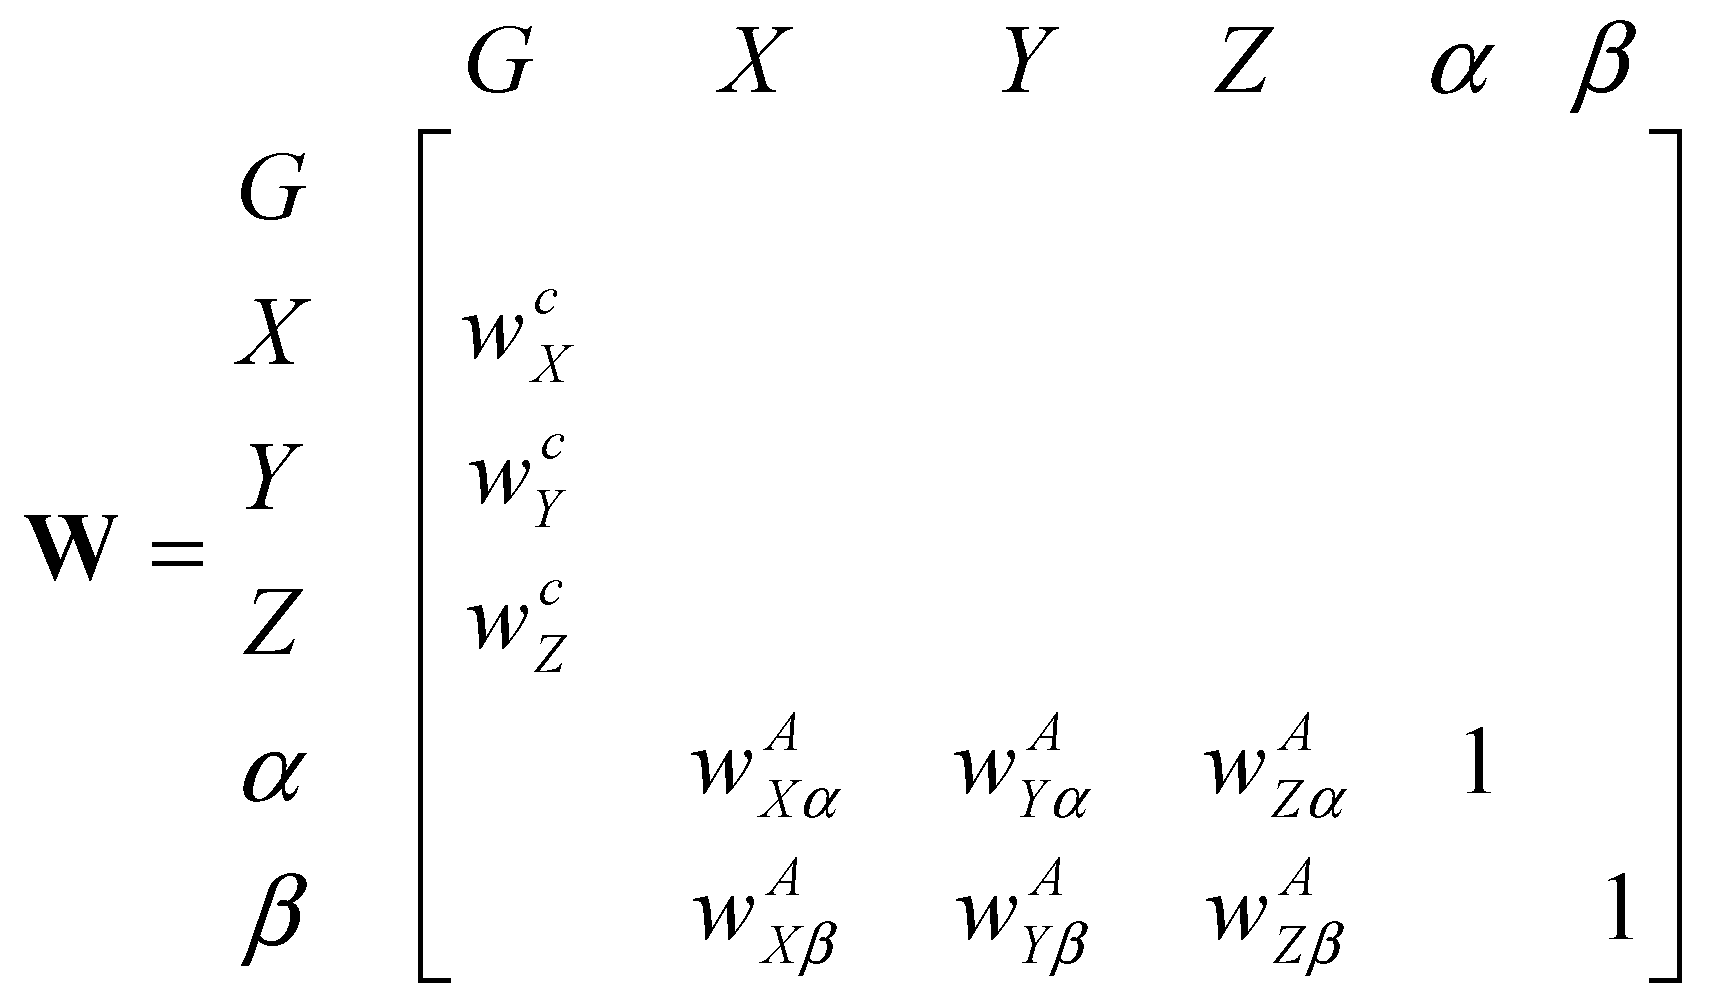
Figure 9.
ANP network structure for the Supply Chain Sustainability problem.
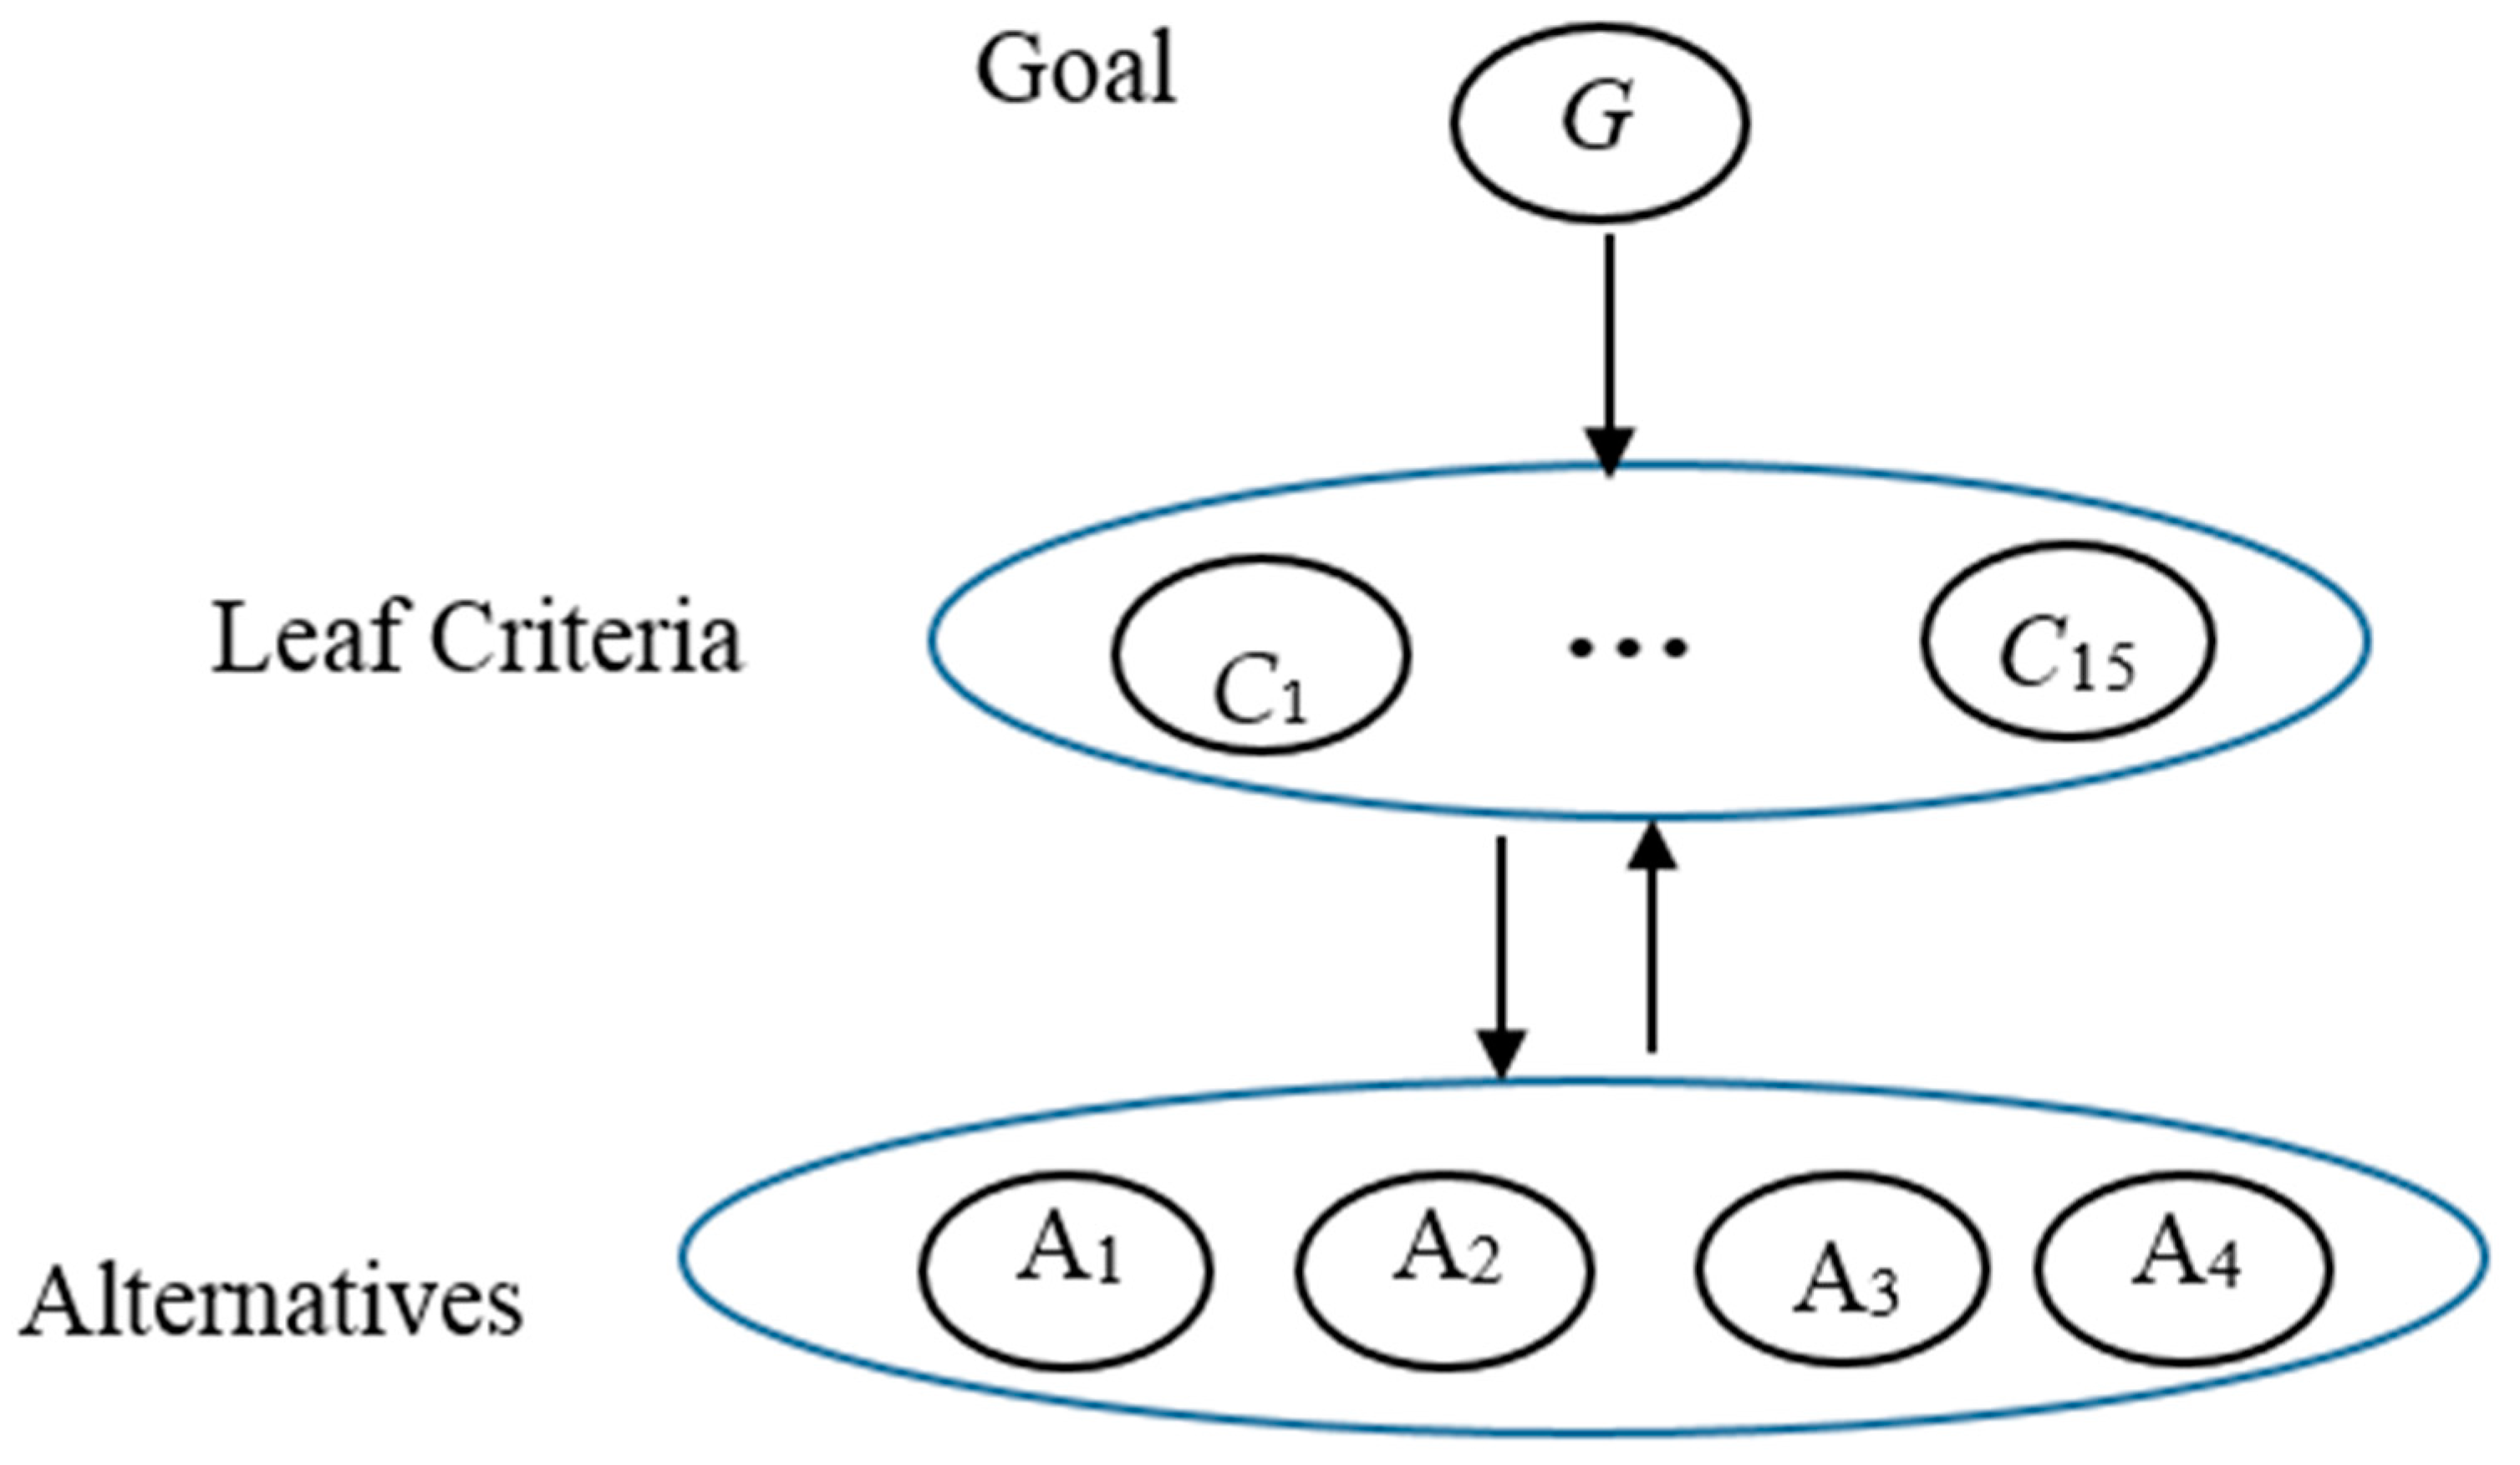
Figure 10.
Sensitivity analysis of alternatives w.r.t. Environmental sustainability weight.

Figure 11.
Sensitivity analysis of alternatives w.r.t. Business sustainability weight.

Figure 12.
Sensitivity analysis of alternatives w.r.t. Social sustainability weight.

Table 1.
Number of papers discussed on various dimensions [9].
Table 1.
Number of papers discussed on various dimensions [9].
| Dimension | Number of Papers |
|---|---|
| Environmental | 140 |
| Social | 20 |
| Sustainable (Environmental + Social) | 31 |
Table 2.
Summary of Supply Chain Management Practices.
| Brand | Target Market | Sourcing & Channel Sourcing Strategy in SC Practice |
|---|---|---|
| UNIQLO Fast retailing: Fast retailing’s line of business resembles that of a “Holding” Company, by controlling and managing the overall group activities as its main owner. | General and industry-wide industry Mass Production | Specialty-store of Private-label Apparel (SPA) Control of its supply chain extends from design to manufacturing, all the way to retail-achieved “low costs” on its final product and a high degree of flexibility to meet fashion trends Reducing Inventory → JIT provide UNIQLO with the necessary tools and framework to reduce inventory; use state-of-the-art technology; analyze weekly sales patterns Convert the out-of-fashion product into other popular product → bottlenecks in the distribution section of its supply chain are drastically reduced. Providing Agility: JIT provides supply chain with an agility that sets it apart from most of its competitors → Leading-edge forecasting systems to predict |
| Zara Distribution Group: Inditex → New York Times called it “mind-spinningly supersonic” Supply Chain: | General and industry-wide industry Mass Production | Diversification with vertical integrations Couture design + manufacturing + distributes + retails clothes within 2 weeks of the original design first appearing on catwalks → fast fashion Just In Time (controlled and integrated) → keeps a significant amount of its production in house and makes sure its own house reserve 85% of their capacity for in-season adjustments. In-house production: flexible in amount, frequency and variety of new products to be launched. Inventory optimization models Centralized logistics → make decision in a very coordinated manner Local Sourcing → produced in Spain, Turkey and North Africa. Solid distribution network: To Europe: 24 h; To American and Asian outlets: <40 h; Get a production out from concept to store: 15 days. Average is 6 months. |
| Louis Vuitton | High-end Luxury market | Highly integrated supply chain → LV does over 60% of its manufacturing in house and owns all of the retail stores worldwide Complete access to the real-time information about key factors such as sales, inventory amount, and inventory location Its ability to protect its proprietary knowhow to build superb products Its ability to control the price completely |
| Chanel | High-end Luxury market | Most of the products are made in house Integrated supply chain Pay attention to its responsiveness to the market demand change → get market feedback from fashion shows → also present its own vision and direction to the market |
Table 3.
Pairwise Comparison of the three main criteria w.r.t. Goal.
| Environmental Sustainability | Business Sustainability | Social Sustainability | Priority Weight | |
|---|---|---|---|---|
| Environmental Sustainability | 1 | 3 | 5 | 0.6483 |
| Business Sustainability | 1/3 | 1 | 2 | 0.2297 |
| Social Sustainability | 1/5 | 1/2 | 1 | 0.1220 |
Table 4.
Pairwise Comparison of Sub Criteria w.r.t. Environmental Sustainability; Pairwise Comparison of Sub-Sub Criteria w.r.t. sub-criteria Production; Pairwise Comparison of Sub-Sub Criteria w.r.t. sub-criteria Delivery.
Table 4.
Pairwise Comparison of Sub Criteria w.r.t. Environmental Sustainability; Pairwise Comparison of Sub-Sub Criteria w.r.t. sub-criteria Production; Pairwise Comparison of Sub-Sub Criteria w.r.t. sub-criteria Delivery.
| a | |||||
| Sourcing | Production | Delivery | Priority Weight | ||
| Sourcing | 1 | 1/3 | 1 | 0.2098 | |
| Production | 3 | 1 | 2 | 0.5500 | |
| Delivery | 1 | 1/2 | 1 | 0.2402 | |
| b | |||||
| Green Design | Resources Consumption | Water Pollution | Waste Minimization | Priority Weight | |
| Green Design | 1 | 1/2 | 1/2 | 1/5 | 0.0936 |
| Resources Consumption | 2 | 1 | 3 | 1/2 | 0.2605 |
| Water Pollution | 2 | 1/3 | 1 | 1/5 | 0.1196 |
| Waste Minimization | 5 | 2 | 5 | 1 | 0.5263 |
| c | |||||
| Green Packaging | Transportation | Priority Weight | |||
| Green Packaging | 1 | 1 | 0.5 | ||
| Transportation | 1 | 1 | 0.5 | ||
Table 5.
Pairwise Comparison of Sub Criteria w.r.t. Business Sustainability.
| Operating Expenditure | Recycling Revenue | Production Quality | Time Efficiency | Priority Weight | |
|---|---|---|---|---|---|
| Operating Expenditure | 1 | 5 | 3 | 3 | 0.5205 |
| Recycling Revenue | 1/5 | 1 | 1/3 | 1/3 | 0.0776 |
| Production Quality | 1/3 | 3 | 1 | 1 | 0.2010 |
| Time Efficiency | 1/3 | 3 | 1 | 1 | 0.2010 |
Table 6.
Pairwise Comparison of Sub Criteria w.r.t. Social Sustainability.
| Philanthropy | Labor Equity | WSH | Medical Benefit | Priority Weight | |
|---|---|---|---|---|---|
| Philanthropy | 1 | 1/3 | 1/2 | 1 | 0.1411 |
| Labor Equity | 3 | 1 | 2 | 3 | 0.4550 |
| WSH | 2 | 1/2 | 1 | 2 | 0.2627 |
| Medical Benefit | 1 | 1/3 | 1/2 | 1 | 0.1411 |
Table 7.
Global weight for alternatives obtained from AHP model.
| Alternative | Global Weight |
|---|---|
| Just In Time | 0.1845 |
| Global Sourcing | 0.2420 |
| Reverse Logistics | 0.2900 |
| Socially Leagile Supply Chain | 0.2835 |
Table 8.
Comparing Global weights of alternatives without and without Social Perspective.
| Alternative | Global Weight without Social Perspective | Global Weight with Social Perspective |
|---|---|---|
| Just In Time | 0.1833 | 0.1845 |
| Global Sourcing | 0.2500 | 0.2420 |
| Reverse Logistics | 0.3029 | 0.2900 |
| Socially Leagile Supply Chain | 0.2638 | 0.2835 |
Table 9.
Super matrix for the equivalent AHP Model.
| Goal | Criteria | Alternatives | |||||||||||||||||||
|---|---|---|---|---|---|---|---|---|---|---|---|---|---|---|---|---|---|---|---|---|---|
| Sustainable Supply Chain | Sourcing | Green Design | Resource Consum | Water Pollution | Waste Min | Green Packaging | Transp | Ops Exp | Recycling Revenue | Production Quality | Time Efficiency | Philan | Labor Equity | Wkplace Safety & Health | Medical Benefit | Just in Time | Global Sourcing | Reverse Logistics | Socially Leagile SC | ||
| Goal | Substainable SC | 0 | 0 | 0 | 0 | 0 | 0 | 0 | 0 | 0 | 0 | 0 | 0 | 0 | 0 | 0 | 0 | ||||
| Criteria | Sourcing | 0.136 | 0 | 0 | 0 | 0 | 0 | 0 | 0 | 0 | 0 | 0 | 0 | 0 | 0 | 0 | 0 | 0 | 0 | 0 | 0 |
| Green Design | 0.034 | 0 | 0 | 0 | 0 | 0 | 0 | 0 | 0 | 0 | 0 | 0 | 0 | 0 | 0 | 0 | 0 | 0 | 0 | 0 | |
| Resource Consumption | 0.094 | 0 | 0 | 0 | 0 | 0 | 0 | 0 | 0 | 0 | 0 | 0 | 0 | 0 | 0 | 0 | 0 | 0 | 0 | 0 | |
| Water Pollution | 0.044 | 0 | 0 | 0 | 0 | 0 | 0 | 0 | 0 | 0 | 0 | 0 | 0 | 0 | 0 | 0 | 0 | 0 | 0 | 0 | |
| Waste Minimization | 0.185 | 0 | 0 | 0 | 0 | 0 | 0 | 0 | 0 | 0 | 0 | 0 | 0 | 0 | 0 | 0 | 0 | 0 | 0 | 0 | |
| Green Packaging | 0.078 | 0 | 0 | 0 | 0 | 0 | 0 | 0 | 0 | 0 | 0 | 0 | 0 | 0 | 0 | 0 | 0 | 0 | 0 | 0 | |
| Transportation | 0.078 | 0 | 0 | 0 | 0 | 0 | 0 | 0 | 0 | 0 | 0 | 0 | 0 | 0 | 0 | 0 | 0 | 0 | 0 | 0 | |
| Operating Expenditure | 0.120 | 0 | 0 | 0 | 0 | 0 | 0 | 0 | 0 | 0 | 0 | 0 | 0 | 0 | 0 | 0 | 0 | 0 | 0 | 0 | |
| Recycling Revenue | 0.018 | 0 | 0 | 0 | 0 | 0 | 0 | 0 | 0 | 0 | 0 | 0 | 0 | 0 | 0 | 0 | 0 | 0 | 0 | 0 | |
| Production Quality | 0.046 | 0 | 0 | 0 | 0 | 0 | 0 | 0 | 0 | 0 | 0 | 0 | 0 | 0 | 0 | 0 | 0 | 0 | 0 | 0 | |
| Time Efficiency | 0.046 | 0 | 0 | 0 | 0 | 0 | 0 | 0 | 0 | 0 | 0 | 0 | 0 | 0 | 0 | 0 | 0 | 0 | 0 | 0 | |
| Philanthropy | 0.017 | 0 | 0 | 0 | 0 | 0 | 0 | 0 | 0 | 0 | 0 | 0 | 0 | 0 | 0 | 0 | 0 | 0 | 0 | 0 | |
| Labor Equity | 0.056 | 0 | 0 | 0 | 0 | 0 | 0 | 0 | 0 | 0 | 0 | 0 | 0 | 0 | 0 | 0 | 0 | 0 | 0 | 0 | |
| Workplace S & H | 0.032 | 0 | 0 | 0 | 0 | 0 | 0 | 0 | 0 | 0 | 0 | 0 | 0 | 0 | 0 | 0 | 0 | 0 | 0 | 0 | |
| Medical Benefit | 0.017 | 0 | 0 | 0 | 0 | 0 | 0 | 0 | 0 | 0 | 0 | 0 | 0 | 0 | 0 | 0 | 0 | 0 | 0 | 0 | |
| Alternatives | Just in Time | 0 | 0.375 | 0.109 | 0.138 | 0.144 | 0.080 | 0.085 | 0.102 | 0.168 | 0.106 | 0.338 | 0.449 | 0.121 | 0.200 | 0.204 | 0.167 | 1 | 0 | 0 | 0 |
| Global Sourcing | 0 | 0.375 | 0.109 | 0.126 | 0.161 | 0.207 | 0.152 | 0.527 | 0.239 | 0.120 | 0.288 | 0.235 | 0.121 | 0.200 | 0.204 | 0.167 | 0 | 1 | 0 | 0 | |
| Reverse Logistics | 0 | 0.125 | 0.297 | 0.449 | 0.270 | 0.486 | 0.523 | 0.129 | 0.198 | 0.413 | 0.169 | 0.082 | 0.220 | 0.200 | 0.246 | 0.167 | 0 | 0 | 1 | 0 | |
| Socially Leagile SC | 0 | 0.125 | 0.485 | 0.288 | 0.425 | 0.227 | 0.240 | 0.241 | 0.395 | 0.360 | 0.205 | 0.235 | 0.538 | 0.400 | 0.347 | 0.500 | 0 | 0 | 0 | 1 | |
Table 10.
Limit matrix for the equivalent AHP Model.
| Goal | Criteria | Alternatives | |||||||||||||||||||
|---|---|---|---|---|---|---|---|---|---|---|---|---|---|---|---|---|---|---|---|---|---|
| Sustainable Supply Chain | Sourcing | Green Design | Resource Consum | Water Pollution | Waste Min | Green Packaging | Transp | Ops Exp | Recycling Revenue | Production Quality | Time Efficiency | Philan | Labor Equity | Wkplace Safety & Health | Medical Benefit | Just in Time | Global Sourcing | Reverse Logistics | Socially Leagile SC | ||
| Goal | Substainable SC | 0 | 0 | 0 | 0 | 0 | 0 | 0 | 0 | 0 | 0 | 0 | 0 | 0 | 0 | 0 | 0 | 0 | 0 | 0 | 0 |
| Criteria | Sourcing | 0 | 0 | 0 | 0 | 0 | 0 | 0 | 0 | 0 | 0 | 0 | 0 | 0 | 0 | 0 | 0 | 0 | 0 | 0 | 0 |
| Green Design | 0 | 0 | 0 | 0 | 0 | 0 | 0 | 0 | 0 | 0 | 0 | 0 | 0 | 0 | 0 | 0 | 0 | 0 | 0 | 0 | |
| Resource Consumption | 0 | 0 | 0 | 0 | 0 | 0 | 0 | 0 | 0 | 0 | 0 | 0 | 0 | 0 | 0 | 0 | 0 | 0 | 0 | 0 | |
| Water Pollution | 0 | 0 | 0 | 0 | 0 | 0 | 0 | 0 | 0 | 0 | 0 | 0 | 0 | 0 | 0 | 0 | 0 | 0 | 0 | 0 | |
| Waste Minimization | 0 | 0 | 0 | 0 | 0 | 0 | 0 | 0 | 0 | 0 | 0 | 0 | 0 | 0 | 0 | 0 | 0 | 0 | 0 | 0 | |
| Green Packaging | 0 | 0 | 0 | 0 | 0 | 0 | 0 | 0 | 0 | 0 | 0 | 0 | 0 | 0 | 0 | 0 | 0 | 0 | 0 | 0 | |
| Transportation | 0 | 0 | 0 | 0 | 0 | 0 | 0 | 0 | 0 | 0 | 0 | 0 | 0 | 0 | 0 | 0 | 0 | 0 | 0 | 0 | |
| Operating Expenditure | 0 | 0 | 0 | 0 | 0 | 0 | 0 | 0 | 0 | 0 | 0 | 0 | 0 | 0 | 0 | 0 | 0 | 0 | 0 | 0 | |
| Recycling Revenue | 0 | 0 | 0 | 0 | 0 | 0 | 0 | 0 | 0 | 0 | 0 | 0 | 0 | 0 | 0 | 0 | 0 | 0 | 0 | 0 | |
| Production Quality | 0 | 0 | 0 | 0 | 0 | 0 | 0 | 0 | 0 | 0 | 0 | 0 | 0 | 0 | 0 | 0 | 0 | 0 | 0 | 0 | |
| Time Efficiency | 0 | 0 | 0 | 0 | 0 | 0 | 0 | 0 | 0 | 0 | 0 | 0 | 0 | 0 | 0 | 0 | 0 | 0 | 0 | 0 | |
| Philanthropy | 0 | 0 | 0 | 0 | 0 | 0 | 0 | 0 | 0 | 0 | 0 | 0 | 0 | 0 | 0 | 0 | 0 | 0 | 0 | 0 | |
| Labor Equity | 0 | 0 | 0 | 0 | 0 | 0 | 0 | 0 | 0 | 0 | 0 | 0 | 0 | 0 | 0 | 0 | 0 | 0 | 0 | 0 | |
| Workplace S & H | 0 | 0 | 0 | 0 | 0 | 0 | 0 | 0 | 0 | 0 | 0 | 0 | 0 | 0 | 0 | 0 | 0 | 0 | 0 | 0 | |
| Medical Benefit | 0 | 0 | 0 | 0 | 0 | 0 | 0 | 0 | 0 | 0 | 0 | 0 | 0 | 0 | 0 | 0 | 0 | 0 | 0 | 0 | |
| Alternatives | Just in Time | 0.184 | 0.375 | 0.109 | 0.138 | 0.144 | 0.080 | 0.085 | 0.102 | 0.168 | 0.106 | 0.338 | 0.449 | 0.121 | 0.200 | 0.204 | 0.167 | 1 | 0 | 0 | 0 |
| Global Sourcing | 0.242 | 0.375 | 0.109 | 0.126 | 0.161 | 0.207 | 0.152 | 0.527 | 0.239 | 0.120 | 0.288 | 0.235 | 0.121 | 0.200 | 0.204 | 0.167 | 0 | 1 | 0 | 0 | |
| Reverse Logistics | 0.290 | 0.125 | 0.297 | 0.449 | 0.270 | 0.486 | 0.523 | 0.129 | 0.198 | 0.413 | 0.169 | 0.082 | 0.220 | 0.200 | 0.246 | 0.167 | 0 | 0 | 1 | 0 | |
| Socially Leagile SC | 0.284 | 0.125 | 0.485 | 0.288 | 0.425 | 0.227 | 0.240 | 0.241 | 0.395 | 0.360 | 0.205 | 0.235 | 0.538 | 0.400 | 0.347 | 0.500 | 0 | 0 | 0 | 1 | |
Table 11.
Pairwise comparisons of the criteria w.r.t. Just in Time.
| w.r.t. Just In Time | Sourcing | Green Design | Resource Consumption | Water Pollution | Waste Minimization | Green Packaging | Transportation | Operating Expenditure | Recycling Revenue | Production Quality | Time Efficiency | Philanthropy | Labor Equity | WSH | Medical Benefit | Weight |
|---|---|---|---|---|---|---|---|---|---|---|---|---|---|---|---|---|
| Sourcing | 1 | 5 | 1 | 7 | 1 | 7 | 7 | 3 | 2 | 2 | 2 | 7 | 7 | 7 | 7 | 0.159 |
| Green Design | 1/5 | 1 | 1/5 | 2 | 1/5 | 2 | 2 | 2 | 1 | 1/3 | 1/3 | 3 | 3 | 3 | 3 | 0.048 |
| Resource Consumption | 1 | 5 | 1 | 7 | 1 | 7 | 7 | 7 | 5 | 2 | 2 | 7 | 7 | 7 | 7 | 0.181 |
| Water Pollution | 1/7 | 1/2 | 1/7 | 1 | 1/7 | 1 | 1 | 1 | 1/2 | 1/4 | 1/4 | 1 | 1 | 1 | 1 | 0.024 |
| Waste Minimization | 1 | 5 | 1 | 7 | 1 | 7 | 7 | 7 | 5 | 2 | 2 | 7 | 7 | 7 | 7 | 0.181 |
| Green Packaging | 1/7 | 1/2 | 1/7 | 1 | 1/7 | 1 | 1 | 1 | 1/2 | 1/4 | 1/4 | 1 | 1 | 1 | 1 | 0.024 |
| Transportation | 1/7 | 1/2 | 1/7 | 1 | 1/7 | 1 | 1 | 1 | 1/2 | 1/4 | 1/4 | 1 | 1 | 1 | 1 | 0.024 |
| Operating Expenditure | 1/3 | 1/2 | 1/7 | 1 | 1/7 | 1 | 1 | 1 | 1/2 | 1/2 | 1/2 | 2 | 2 | 2 | 2 | 0.034 |
| Recycling Revenue | 1/2 | 1 | 1/5 | 2 | 1/5 | 2 | 2 | 2 | 1 | 1 | 1 | 4 | 4 | 4 | 5 | 0.066 |
| Production Quality | 1/2 | 3 | 1/2 | 4 | 1/2 | 4 | 4 | 2 | 1 | 1 | 1 | 4 | 4 | 4 | 5 | 0.088 |
| Time Efficiency | 1/2 | 3 | 1/2 | 4 | 1/2 | 4 | 4 | 2 | 1 | 1 | 1 | 4 | 4 | 4 | 5 | 0.088 |
| Philanthropy | 1/7 | 1/3 | 1/7 | 1 | 1/7 | 1 | 1 | 1/2 | 1/4 | 1/4 | 1/4 | 1 | 1 | 1 | 1 | 0.021 |
| Labor Equity | 1/7 | 1/3 | 1/7 | 1 | 1/7 | 1 | 1 | 1/2 | 1/4 | 1/4 | 1/4 | 1 | 1 | 1 | 1 | 0.021 |
| WSH | 1/7 | 1/3 | 1/7 | 1 | 1/7 | 1 | 1 | 1/2 | 1/4 | 1/4 | 1/4 | 1 | 1 | 1 | 1 | 0.021 |
| Medical Benefit | 1/7 | 1/3 | 1/7 | 1 | 1/7 | 1 | 1 | 1/2 | 1/5 | 1/5 | 1/5 | 1 | 1 | 1 | 1 | 0.020 |
Table 12.
Pairwise comparisons of the criteria w.r.t. Global sourcing.
| w.r.t. Global Sourcing | Sourcing | Green Design | Resource Consumption | Water Pollution | Waste Minimization | Green Packaging | Transportation | Operating Expenditure | Recycling Revenue | Production Quality | Time Efficiency | Philanthropy | Labor Equity | WSH | Medical Benefit | Weight |
|---|---|---|---|---|---|---|---|---|---|---|---|---|---|---|---|---|
| Sourcing | 1 | 5 | 5 | 5 | 5 | 5 | 3 | 5 | 5 | 5 | 5 | 7 | 7 | 7 | 7 | 0.259 |
| Green Design | 1/5 | 1 | 1 | 1 | 1 | 1 | 1/3 | 1 | 1 | 1 | 1 | 2 | 2 | 2 | 2 | 0.054 |
| Resource Consumption | 1/5 | 1 | 1 | 1 | 1 | 1 | 1/3 | 1 | 1 | 1 | 1 | 2 | 2 | 2 | 2 | 0.054 |
| Water Pollution | 1/5 | 1 | 1 | 1 | 1 | 1 | 1/3 | 1 | 1 | 1 | 1 | 2 | 2 | 2 | 2 | 0.054 |
| Waste Minimization | 1/5 | 1 | 1 | 1 | 1 | 1 | 1/3 | 1 | 1 | 1 | 1 | 2 | 2 | 2 | 2 | 0.054 |
| Green Packaging | 1/5 | 1 | 1 | 1 | 1 | 1 | 1/3 | 1 | 1 | 1 | 1 | 2 | 2 | 2 | 2 | 0.054 |
| Transportation | 1/3 | 3 | 3 | 3 | 3 | 3 | 1 | 3 | 3 | 3 | 3 | 5 | 5 | 5 | 5 | 0.149 |
| Operating Expenditure | 1/5 | 1 | 1 | 1 | 1 | 1 | 1/3 | 1 | 1 | 1 | 1 | 2 | 2 | 2 | 2 | 0.054 |
| Recycling Revenue | 1/5 | 1 | 1 | 1 | 1 | 1 | 1/3 | 1 | 1 | 1 | 1 | 2 | 2 | 2 | 2 | 0.054 |
| Production Quality | 1/5 | 1 | 1 | 1 | 1 | 1 | 1/3 | 1 | 1 | 1 | 1 | 2 | 2 | 2 | 2 | 0.054 |
| Time Efficiency | 1/5 | 1 | 1 | 1 | 1 | 1 | 1/3 | 1 | 1 | 1 | 1 | 2 | 2 | 2 | 2 | 0.054 |
| Philanthropy | 1/7 | 1/2 | 1/2 | 1/2 | 1/2 | 1/2 | 1/5 | 1/2 | 1/2 | 1/2 | 1/2 | 1 | 1 | 1 | 1 | 0.028 |
| Labor Equity | 1/7 | 1/2 | 1/2 | 1/2 | 1/2 | 1/2 | 1/5 | 1/2 | 1/2 | 1/2 | 1/2 | 1 | 1 | 1 | 1 | 0.028 |
| WSH | 1/7 | 1/2 | 1/2 | 1/2 | 1/2 | 1/2 | 1/5 | 1/2 | 1/2 | 1/2 | 1/2 | 1 | 1 | 1 | 1 | 0.028 |
| Medical Benefit | 1/7 | 1/2 | 1/2 | 1/2 | 1/2 | 1/2 | 1/5 | 1/2 | 1/2 | 1/2 | 1/2 | 1 | 1 | 1 | 1 | 0.028 |
Table 13.
Pairwise comparisons of the criteria w.r.t. Reverse Logistics.
| w.r.t. Socially Leagile Supply Chain | Sourcing | Green Design | Resource Consumption | Water Pollution | Waste Minimization | Green Packaging | Transportation | Operating Expenditure | Recycling Revenue | Production Quality | Time Efficiency | Philanthropy | Labor Equity | WSH | Medical Benefit | Weight |
|---|---|---|---|---|---|---|---|---|---|---|---|---|---|---|---|---|
| Sourcing | 1 | 1 | 1/3 | 1/3 | 1/3 | 1 | 1 | 1/3 | 1/3 | 1/5 | 1/5 | 1/3 | 1/3 | 1/3 | 1/3 | 0.023 |
| Green Design | 1 | 1 | 1/3 | 1/3 | 1/3 | 1 | 1 | 1/3 | 1/3 | 1/5 | 1/5 | 1/3 | 1/3 | 1/3 | 1/3 | 0.023 |
| Resource Consumption | 3 | 3 | 1 | 1 | 1 | 3 | 3 | 1 | 1 | 1/3 | 1/3 | 1 | 1 | 1 | 1 | 0.064 |
| Water Pollution | 3 | 3 | 1 | 1 | 1 | 3 | 3 | 1 | 1 | 1/3 | 1/3 | 1 | 1 | 1 | 1 | 0.064 |
| Waste Minimization | 3 | 3 | 1 | 1 | 1 | 3 | 3 | 1 | 1 | 1/3 | 1/3 | 1 | 1 | 1 | 1 | 0.064 |
| Green Packaging | 1 | 1 | 1/3 | 1/3 | 1/3 | 1 | 1 | 1/3 | 1/3 | 1/5 | 1/5 | 1/3 | 1/3 | 1/3 | 1/3 | 0.023 |
| Transportation | 1 | 1 | 1/3 | 1/3 | 1/3 | 1 | 1 | 1/3 | 1/3 | 1/5 | 1/5 | 1/3 | 1/3 | 1/3 | 1/3 | 0.023 |
| Operating Expenditure | 3 | 3 | 1 | 1 | 1 | 3 | 3 | 1 | 1 | 1/3 | 1/3 | 1 | 1 | 1 | 1 | 0.064 |
| Recycling Revenue | 3 | 3 | 1 | 1 | 1 | 3 | 3 | 1 | 1 | 1/3 | 1/3 | 1 | 1 | 1 | 1 | 0.064 |
| Production Quality | 5 | 5 | 3 | 3 | 3 | 5 | 5 | 3 | 3 | 1 | 1 | 3 | 3 | 3 | 3 | 0.167 |
| Time Efficiency | 5 | 5 | 3 | 3 | 3 | 5 | 5 | 3 | 3 | 1 | 1 | 3 | 3 | 3 | 3 | 0.167 |
| Philanthropy | 3 | 3 | 1 | 1 | 1 | 3 | 3 | 1 | 1 | 1/3 | 1/3 | 1 | 1 | 1 | 1 | 0.064 |
| Labor Equity | 3 | 3 | 1 | 1 | 1 | 3 | 3 | 1 | 1 | 1/3 | 1/3 | 1 | 1 | 1 | 1 | 0.064 |
| WSH | 3 | 3 | 1 | 1 | 1 | 3 | 3 | 1 | 1 | 1/3 | 1/3 | 1 | 1 | 1 | 1 | 0.064 |
| Medical Benefit | 3 | 3 | 1 | 1 | 1 | 3 | 3 | 1 | 1 | 1/3 | 1/3 | 1 | 1 | 1 | 1 | 0.064 |
Table 14.
Pairwise comparisons of the criteria w.r.t. Socially Leagile supply chain.
| w.r.t. Socially Leagile Supply Chain | Sourcing | Green Design | Resource Consumption | Water Pollution | Waste Minimization | Green Packaging | Transportation | Operating Expenditure | Recycling Revenue | Production Quality | Time Efficiency | Philanthropy | Labor Equity | WSH | Medical Benefit | Weight |
|---|---|---|---|---|---|---|---|---|---|---|---|---|---|---|---|---|
| Sourcing | 1 | 1 | 1/3 | 1/3 | 1/3 | 1 | 1 | 1/3 | 1/3 | 1/5 | 1/5 | 1/3 | 1/3 | 1/3 | 1/3 | 0.023 |
| Green Design | 1 | 1 | 1/3 | 1/3 | 1/3 | 1 | 1 | 1/3 | 1/3 | 1/5 | 1/5 | 1/3 | 1/3 | 1/3 | 1/3 | 0.023 |
| Resource Consumption | 3 | 3 | 1 | 1 | 1 | 3 | 3 | 1 | 1 | 1/3 | 1/3 | 1 | 1 | 1 | 1 | 0.064 |
| Water Pollution | 3 | 3 | 1 | 1 | 1 | 3 | 3 | 1 | 1 | 1/3 | 1/3 | 1 | 1 | 1 | 1 | 0.064 |
| Waste Minimization | 3 | 3 | 1 | 1 | 1 | 3 | 3 | 1 | 1 | 1/3 | 1/3 | 1 | 1 | 1 | 1 | 0.064 |
| Green Packaging | 1 | 1 | 1/3 | 1/3 | 1/3 | 1 | 1 | 1/3 | 1/3 | 1/5 | 1/5 | 1/3 | 1/3 | 1/3 | 1/3 | 0.023 |
| Transportation | 1 | 1 | 1/3 | 1/3 | 1/3 | 1 | 1 | 1/3 | 1/3 | 1/5 | 1/5 | 1/3 | 1/3 | 1/3 | 1/3 | 0.023 |
| Operating Expenditure | 3 | 3 | 1 | 1 | 1 | 3 | 3 | 1 | 1 | 1/3 | 1/3 | 1 | 1 | 1 | 1 | 0.064 |
| Recycling Revenue | 3 | 3 | 1 | 1 | 1 | 3 | 3 | 1 | 1 | 1/3 | 1/3 | 1 | 1 | 1 | 1 | 0.064 |
| Production Quality | 5 | 5 | 3 | 3 | 3 | 5 | 5 | 3 | 3 | 1 | 1 | 3 | 3 | 3 | 3 | 0.167 |
| Time Efficiency | 5 | 5 | 3 | 3 | 3 | 5 | 5 | 3 | 3 | 1 | 1 | 3 | 3 | 3 | 3 | 0.167 |
| Philanthropy | 3 | 3 | 1 | 1 | 1 | 3 | 3 | 1 | 1 | 1/3 | 1/3 | 1 | 1 | 1 | 1 | 0.064 |
| Labor Equity | 3 | 3 | 1 | 1 | 1 | 3 | 3 | 1 | 1 | 1/3 | 1/3 | 1 | 1 | 1 | 1 | 0.064 |
| WSH | 3 | 3 | 1 | 1 | 1 | 3 | 3 | 1 | 1 | 1/3 | 1/3 | 1 | 1 | 1 | 1 | 0.064 |
| Medical Benefit | 3 | 3 | 1 | 1 | 1 | 3 | 3 | 1 | 1 | 1/3 | 1/3 | 1 | 1 | 1 | 1 | 0.064 |
Table 15.
Super matrix for the ANP model.
| Goal | Criteria | Alternatives | |||||||||||||||||||
|---|---|---|---|---|---|---|---|---|---|---|---|---|---|---|---|---|---|---|---|---|---|
| Sustainable Supply Chain | Sourcing | Green Design | Resources Comsum | Water Pollution | Waste Min | Green Packaging | Transp | Ops Exp | Recycling Revenue | Production Quality | Time Efficiency | Philan | Labor Equity | Wkplace Safety & Health | Medical Benefit | Just in Time | Global Sourcing | Reverse Logistics | Socially Leagile SC | ||
| Goal | Substainable SC | 0 | 0 | 0 | 0 | 0 | 0 | 0 | 0 | 0 | 0 | 0 | 0 | 0 | 0 | 0 | 0 | 0 | 0 | 0 | 0 |
| Criteria | Sourcing | 0.136 | 0 | 0 | 0 | 0 | 0 | 0 | 0 | 0 | 0 | 0 | 0 | 0 | 0 | 0 | 0 | 0.159 | 0.259 | 0.021 | 0.023 |
| Green Design | 0.034 | 0 | 0 | 0 | 0 | 0 | 0 | 0 | 0 | 0 | 0 | 0 | 0 | 0 | 0 | 0 | 0.048 | 0.054 | 0.021 | 0.023 | |
| Resources Comsumption | 0.094 | 0 | 0 | 0 | 0 | 0 | 0 | 0 | 0 | 0 | 0 | 0 | 0 | 0 | 0 | 0 | 0.181 | 0.054 | 0.209 | 0.064 | |
| Water Pollution | 0.044 | 0 | 0 | 0 | 0 | 0 | 0 | 0 | 0 | 0 | 0 | 0 | 0 | 0 | 0 | 0 | 0.024 | 0.054 | 0.055 | 0.064 | |
| Waste Minimization | 0.185 | 0 | 0 | 0 | 0 | 0 | 0 | 0 | 0 | 0 | 0 | 0 | 0 | 0 | 0 | 0 | 0.181 | 0.054 | 0.202 | 0.064 | |
| Green Packaging | 0.078 | 0 | 0 | 0 | 0 | 0 | 0 | 0 | 0 | 0 | 0 | 0 | 0 | 0 | 0 | 0 | 0.024 | 0.054 | 0.021 | 0.023 | |
| Transportation | 0.078 | 0 | 0 | 0 | 0 | 0 | 0 | 0 | 0 | 0 | 0 | 0 | 0 | 0 | 0 | 0 | 0.024 | 0.149 | 0.053 | 0.023 | |
| Operating Expenditure | 0.120 | 0 | 0 | 0 | 0 | 0 | 0 | 0 | 0 | 0 | 0 | 0 | 0 | 0 | 0 | 0 | 0.034 | 0.054 | 0.114 | 0.064 | |
| Recycling Revenue | 0.018 | 0 | 0 | 0 | 0 | 0 | 0 | 0 | 0 | 0 | 0 | 0 | 0 | 0 | 0 | 0 | 0.066 | 0.054 | 0.114 | 0.064 | |
| Production Quality | 0.046 | 0 | 0 | 0 | 0 | 0 | 0 | 0 | 0 | 0 | 0 | 0 | 0 | 0 | 0 | 0 | 0.088 | 0.054 | 0.053 | 0.167 | |
| Time Efficiency | 0.046 | 0 | 0 | 0 | 0 | 0 | 0 | 0 | 0 | 0 | 0 | 0 | 0 | 0 | 0 | 0 | 0.088 | 0.054 | 0.053 | 0.167 | |
| Philanthropy | 0.017 | 0 | 0 | 0 | 0 | 0 | 0 | 0 | 0 | 0 | 0 | 0 | 0 | 0 | 0 | 0 | 0.021 | 0.028 | 0.021 | 0.064 | |
| Labor Equity | 0.056 | 0 | 0 | 0 | 0 | 0 | 0 | 0 | 0 | 0 | 0 | 0 | 0 | 0 | 0 | 0 | 0.021 | 0.028 | 0.021 | 0.064 | |
| Workplace S & H | 0.032 | 0 | 0 | 0 | 0 | 0 | 0 | 0 | 0 | 0 | 0 | 0 | 0 | 0 | 0 | 0 | 0.021 | 0.028 | 0.021 | 0.064 | |
| Medical Benefit | 0.017 | 0 | 0 | 0 | 0 | 0 | 0 | 0 | 0 | 0 | 0 | 0 | 0 | 0 | 0 | 0 | 0.020 | 0.028 | 0.021 | 0.064 | |
| Alternatives | Just in Time | 0 | 0.375 | 0.109 | 0.138 | 0.144 | 0.080 | 0.085 | 0.102 | 0.168 | 0.106 | 0.338 | 0.449 | 0.121 | 0.200 | 0.204 | 0.167 | 0 | 0 | 0 | 0 |
| Global Sourcing | 0 | 0.375 | 0.109 | 0.126 | 0.161 | 0.207 | 0.152 | 0.527 | 0.239 | 0.120 | 0.288 | 0.235 | 0.121 | 0.200 | 0.204 | 0.167 | 0 | 0 | 0 | 0 | |
| Reverse Logistics | 0 | 0.125 | 0.297 | 0.449 | 0.270 | 0.486 | 0.523 | 0.129 | 0.198 | 0.413 | 0.169 | 0.082 | 0.220 | 0.200 | 0.246 | 0.167 | 0 | 0 | 0 | 0 | |
| Socially Leagile SC | 0 | 0.125 | 0.485 | 0.288 | 0.425 | 0.227 | 0.240 | 0.241 | 0.395 | 0.360 | 0.205 | 0.235 | 0.538 | 0.400 | 0.347 | 0.500 | 0 | 0 | 0 | 0 | |
Table 16.
The Limit Matrix of the ANP model.
| Goal | Criteria | Alternatives | |||||||||||||||||||
|---|---|---|---|---|---|---|---|---|---|---|---|---|---|---|---|---|---|---|---|---|---|
| Sustainable Supply Chain | Sourcing | Green Design | Resources Comsum | Water Pollution | Waste Min | Green Packaging | Transp | Ops Exp | Recycling Revenue | Production Quality | Time Efficiency | Philan | Labor Equity | Wkplace Safety & Health | Medical Benefit | Just in Time | Global Sourcing | Reverse Logistics | Socially Leagile SC | ||
| Goal | Substainable SC | 0 | 0 | 0 | 0 | 0 | 0 | 0 | 0 | 0 | 0 | 0 | 0 | 0 | 0 | 0 | 0 | 0 | 0 | 0 | 0 |
| Criteria | Sourcing | 0 | 0.105 | 0.105 | 0.105 | 0.105 | 0.105 | 0.105 | 0.105 | 0.105 | 0.104 | 0.105 | 0.105 | 0.105 | 0.105 | 0.105 | 0.105 | 0 | 0 | 0 | 0 |
| Green Design | 0 | 0.035 | 0.035 | 0.035 | 0.035 | 0.035 | 0.035 | 0.035 | 0.035 | 0.035 | 0.035 | 0.035 | 0.035 | 0.035 | 0.035 | 0.035 | 0 | 0 | 0 | 0 | |
| Resources Comsumption | 0 | 0.126 | 0.126 | 0.126 | 0.126 | 0.126 | 0.126 | 0.126 | 0.126 | 0.126 | 0.126 | 0.126 | 0.126 | 0.126 | 0.126 | 0.126 | 0 | 0 | 0 | 0 | |
| Water Pollution | 0 | 0.052 | 0.052 | 0.052 | 0.052 | 0.052 | 0.052 | 0.052 | 0.052 | 0.051 | 0.052 | 0.052 | 0.052 | 0.052 | 0.052 | 0.052 | 0 | 0 | 0 | 0 | |
| Waste Minimization | 0 | 0.124 | 0.124 | 0.124 | 0.124 | 0.124 | 0.124 | 0.124 | 0.124 | 0.124 | 0.124 | 0.124 | 0.124 | 0.124 | 0.125 | 0.125 | 0 | 0 | 0 | 0 | |
| Green Packaging | 0 | 0.030 | 0.030 | 0.030 | 0.030 | 0.030 | 0.030 | 0.030 | 0.030 | 0.030 | 0.030 | 0.030 | 0.030 | 0.030 | 0.030 | 0.030 | 0 | 0 | 0 | 0 | |
| Transportation | 0 | 0.061 | 0.061 | 0.061 | 0.061 | 0.061 | 0.061 | 0.061 | 0.061 | 0.060 | 0.061 | 0.061 | 0.061 | 0.061 | 0.061 | 0.061 | 0 | 0 | 0 | 0 | |
| Operating Expenditure | 0 | 0.070 | 0.070 | 0.070 | 0.070 | 0.070 | 0.070 | 0.070 | 0.070 | 0.070 | 0.070 | 0.070 | 0.070 | 0.070 | 0.070 | 0.070 | 0 | 0 | 0 | 0 | |
| Recycling Revenue | 0 | 0.077 | 0.076 | 0.076 | 0.076 | 0.076 | 0.076 | 0.077 | 0.076 | 0.076 | 0.076 | 0.077 | 0.076 | 0.076 | 0.077 | 0.077 | 0 | 0 | 0 | 0 | |
| Production Quality | 0 | 0.095 | 0.095 | 0.095 | 0.095 | 0.095 | 0.095 | 0.095 | 0.095 | 0.095 | 0.095 | 0.095 | 0.095 | 0.095 | 0.095 | 0.095 | 0 | 0 | 0 | 0 | |
| Time Efficiency | 0 | 0.095 | 0.095 | 0.095 | 0.095 | 0.095 | 0.095 | 0.095 | 0.095 | 0.095 | 0.095 | 0.095 | 0.095 | 0.095 | 0.095 | 0.095 | 0 | 0 | 0 | 0 | |
| Philanthropy | 0 | 0.036 | 0.036 | 0.036 | 0.036 | 0.036 | 0.036 | 0.036 | 0.036 | 0.036 | 0.036 | 0.036 | 0.036 | 0.036 | 0.036 | 0.036 | 0 | 0 | 0 | 0 | |
| Labor Equity | 0 | 0.036 | 0.036 | 0.036 | 0.036 | 0.036 | 0.036 | 0.036 | 0.036 | 0.036 | 0.036 | 0.036 | 0.036 | 0.036 | 0.036 | 0.036 | 0 | 0 | 0 | 0 | |
| Workplace S & H | 0 | 0.036 | 0.036 | 0.036 | 0.036 | 0.036 | 0.036 | 0.036 | 0.036 | 0.036 | 0.036 | 0.036 | 0.036 | 0.036 | 0.036 | 0.036 | 0 | 0 | 0 | 0 | |
| Medical Benefit | 0 | 0.035 | 0.035 | 0.035 | 0.035 | 0.035 | 0.035 | 0.035 | 0.035 | 0.035 | 0.035 | 0.035 | 0.035 | 0.035 | 0.035 | 0.035 | 0 | 0 | 0 | 0 | |
| Alternatives | Just in Time | 0.203 | 0 | 0 | 0 | 0 | 0 | 0 | 0 | 0 | 0 | 0 | 0 | 0 | 0 | 0 | 0 | 0.205 | 0.206 | 0.205 | 0.206 |
| Global Sourcing | 0.227 | 0 | 0 | 0 | 0 | 0 | 0 | 0 | 0 | 0 | 0 | 0 | 0 | 0 | 0 | 0 | 0.229 | 0.230 | 0.229 | 0.230 | |
| Reverse Logistics | 0.274 | 0 | 0 | 0 | 0 | 0 | 0 | 0 | 0 | 0 | 0 | 0 | 0 | 0 | 0 | 0 | 0.276 | 0.278 | 0.276 | 0.277 | |
| Socially Leagile SC | 0.295 | 0 | 0 | 0 | 0 | 0 | 0 | 0 | 0 | 0 | 0 | 0 | 0 | 0 | 0 | 0 | 0.298 | 0.300 | 0.298 | 0.299 | |
© 2017 by the authors. Licensee MDPI, Basel, Switzerland. This article is an open access article distributed under the terms and conditions of the Creative Commons Attribution (CC BY) license (http://creativecommons.org/licenses/by/4.0/).
Share and Cite
MDPI and ACS Style
Poh, K.L.; Liang, Y. Multiple-Criteria Decision Support for a Sustainable Supply Chain: Applications to the Fashion Industry. Informatics 2017, 4, 36. https://doi.org/10.3390/informatics4040036
AMA Style
Poh KL, Liang Y. Multiple-Criteria Decision Support for a Sustainable Supply Chain: Applications to the Fashion Industry. Informatics. 2017; 4(4):36. https://doi.org/10.3390/informatics4040036
Chicago/Turabian StylePoh, Kim Leng, and Yiying Liang. 2017. "Multiple-Criteria Decision Support for a Sustainable Supply Chain: Applications to the Fashion Industry" Informatics 4, no. 4: 36. https://doi.org/10.3390/informatics4040036
Note that from the first issue of 2016, this journal uses article numbers instead of page numbers. See further details here.