Article

A Data Quality Strategy to Enable FAIR, Programmatic Access across Large, Diverse Data Collections for High Performance Data Analysis

National Computational Infrastructure, the Australian National University, Acton 2601, Australia
*
Author to whom correspondence should be addressed.
Informatics 2017, 4(4), 45; https://doi.org/10.3390/informatics4040045
Submission received: 31 August 2017 / Revised: 1 December 2017 / Accepted: 8 December 2017 / Published: 13 December 2017
(This article belongs to the Special Issue Quality Management in Big Data)

Abstract

:
To ensure seamless, programmatic access to data for High Performance Computing (HPC) and analysis across multiple research domains, it is vital to have a methodology for standardization of both data and services. At the Australian National Computational Infrastructure (NCI) we have developed a Data Quality Strategy (DQS) that currently provides processes for: (1) Consistency of data structures needed for a High Performance Data (HPD) platform; (2) Quality Control (QC) through compliance with recognized community standards; (3) Benchmarking cases of operational performance tests; and (4) Quality Assurance (QA) of data through demonstrated functionality and performance across common platforms, tools and services. By implementing the NCI DQS, we have seen progressive improvement in the quality and usefulness of the datasets across the different subject domains, and demonstrated the ease by which modern programmatic methods can be used to access the data, either in situ or via web services, and for uses ranging from traditional analysis methods through to emerging machine learning techniques. To help increase data re-usability by broader communities, particularly in high performance environments, the DQS is also used to identify the need for any extensions to the relevant international standards for interoperability and/or programmatic access.

1. Introduction

The National Computational Infrastructure (NCI) manages one of Australia’s largest and more diverse repositories (10+ PBytes) of research data collections spanning datasets from climate, coasts, oceans and geophysics through to astronomy, bioinformatics and the social sciences [1]. Within these domains, data can be of different types such as gridded, ungridded (i.e., line surveys, point clouds), and raster image types, as well as having diverse coordinate reference projections and resolutions. NCI has been following the Force 11 FAIR data principles to make data Findable, Accessible, Interoperable, and Reusable [2]. These principles provide guidelines for a research data repository to enable data-intensive science, and enable researchers to answer questions such as how can I trust the scientific quality of the data? Is the data usable by my software platform and my tools?
To ensure broader reuse of the data, enable transdisciplinary integration across multiple domains, as well as enabling programmatic access, a dataset must be usable and of value to a broad range of users from different communities [3]. Therefore, a set of standards and ‘best practices’ for ensuring the quality of scientific data products is a critical component in the life cycle of data management. We undertake both QC through compliance with recognized community standards (e.g., checking the header of the files to make sure it is compliant with community convention standard) and QA of data through demonstrated functionality and performance across common platforms, tools and services (e.g., checking the data to be functioning with designated software and libraries).
The Earth Science Information Partners (ESIP) Information Quality Cluster (IQC) has been established for collecting such standards and best practices and then assisting data producers to implement, and users to take advantage of them [4]. They consider four different aspects of information quality in close relation to different stages of data products in their life cycle and divided into four stages [4]: (1) define, develop, and validate; (2) produce, access and deliver; (3) maintain, preserve, and disseminate; and (4) enable use, provide support, and service.
Science teams or data producers are responsible for managing data quality during the first two stages, while data publishers are responsible for the latter two stages. As NCI is both a digital repository, which manages the storage and distribution of reference data for a range of users, as well as the provider of high-end compute and data analysis platforms, the data quality processes are focused on the latter two stages. A check on the scientific correctness is considered to be part of the first two stages and is not included in the definition of ‘data quality’ that is described in this paper.

2. NCI’s Data Quality Strategy (DQS)
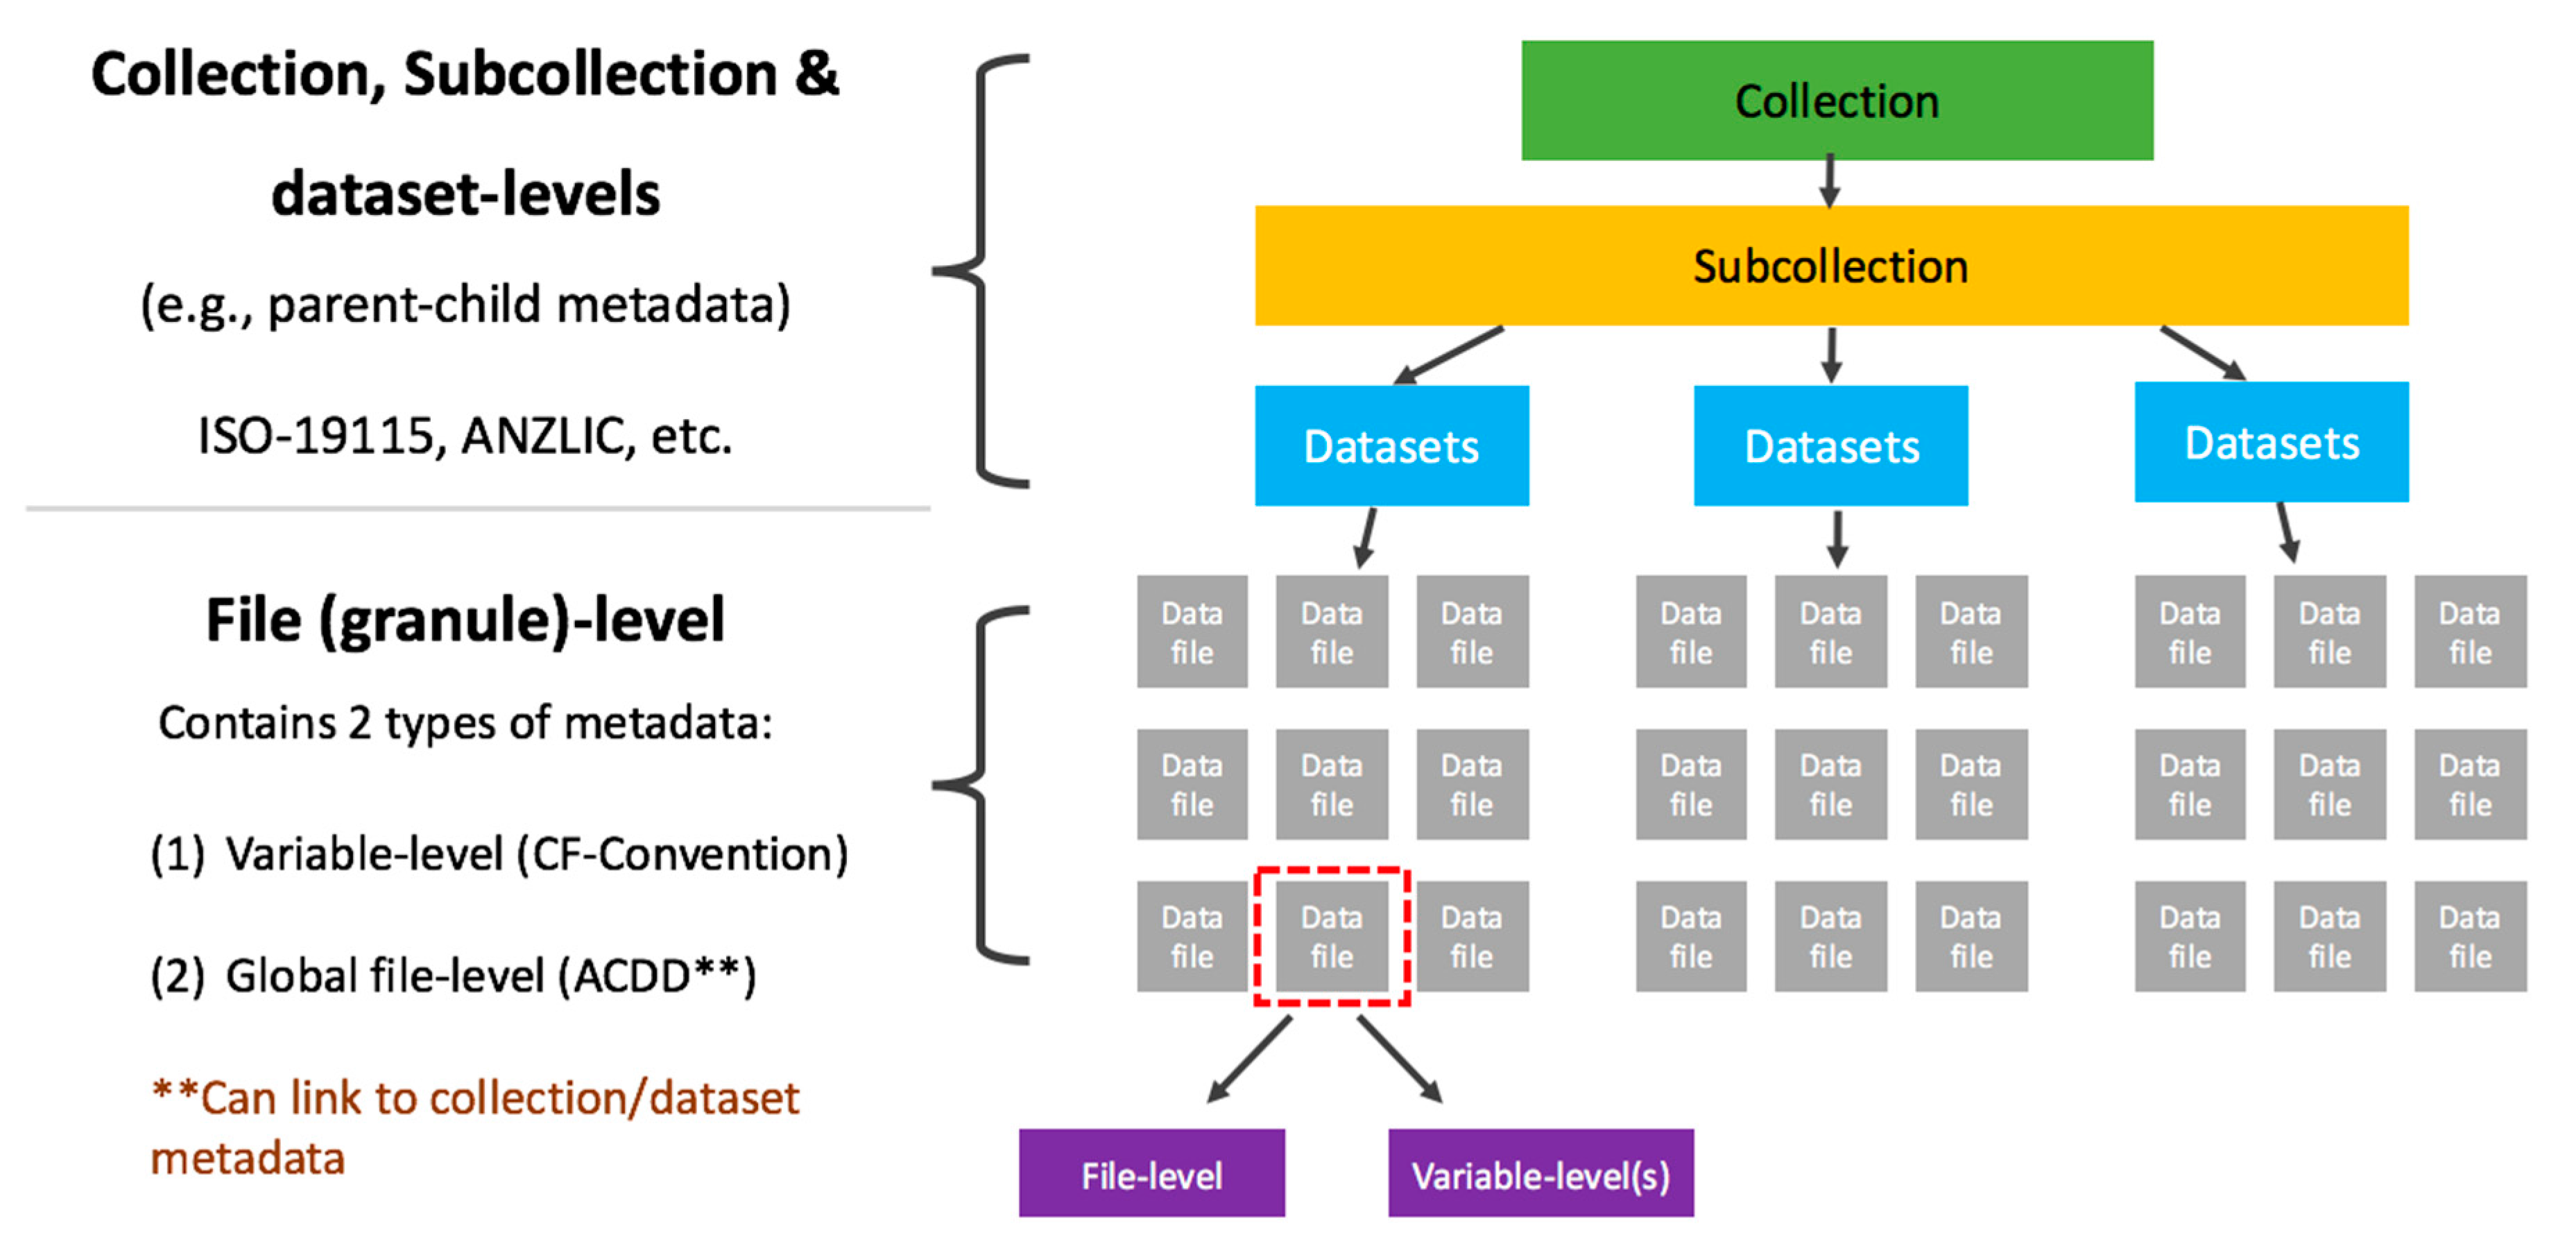
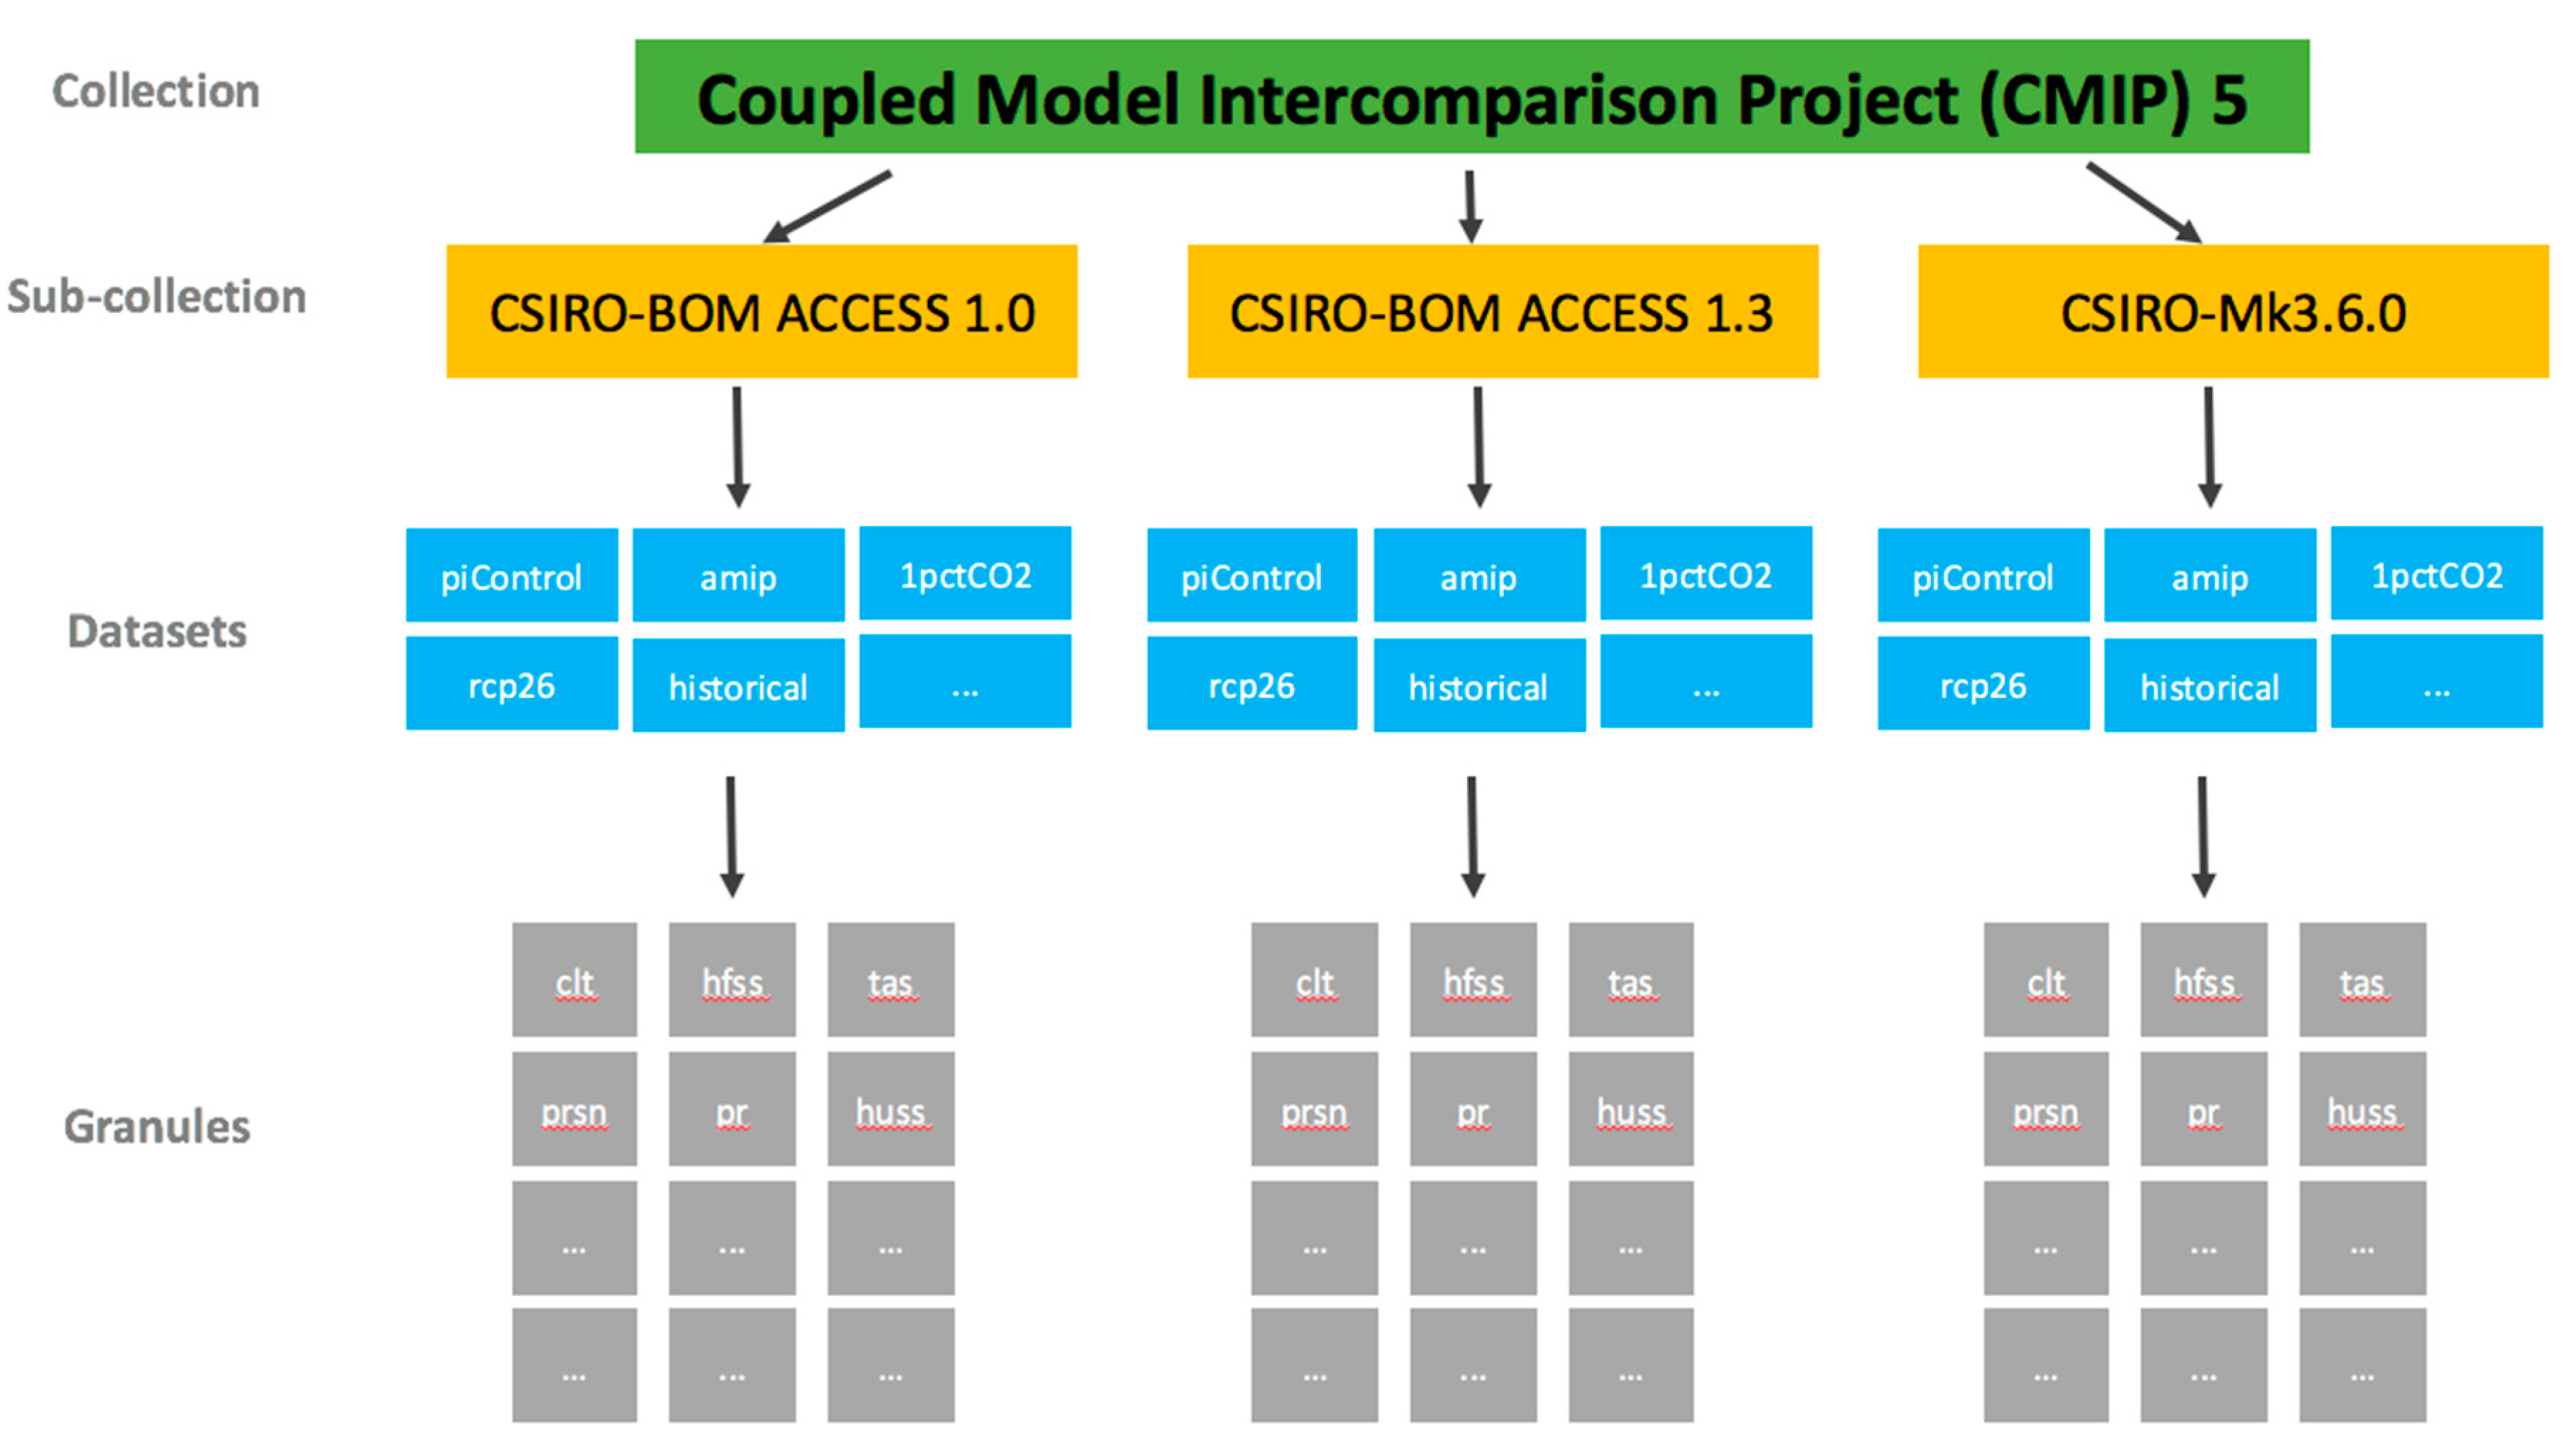
NCI developed a DQS to establish a level of assurance, and hence confidence, for our user community and key stakeholders as an integral part of service provision [5]. It is also a step on the pathway to meet the technical requirements of a trusted digital repository, such as the CoreTrustSeal certification [6]. As meeting these requirements involves the systematic application of agreed policies and procedures, our DQS provides a suite of guidelines, recommendations, and processes for: (1) consistency of data structures suitable for the underlying High Performance Data (HPD) platform; (2) QC through compliance with recognized community standards; (3) benchmarking performance using operational test cases; and (4) QA through demonstrated functionality and benchmarking across common platforms, tools and services.
NCI’s DQS was developed iteratively through firstly a review of other approaches for management of data QC and data QA (e.g., [4,7]) to establish the DQS methodology and secondly applying this to selected use cases at NCI which captured existing and emerging requirements, particularly the use cases that relate to HPC.
Our approach is consistent with the American Geophysical Union (AGU) Data Management Maturity (DMM)SM model [7,8], which was developed in partnership the Capability Maturity Model Integration (CMMI)® Institute and adapted for their DMMSM [9] model for applications in the Earth and space sciences. The AGU DMMSM model aims to provide guidance on how to improve data quality and consistency and facilitate reuse in the data life cycle. It enables both producers of data and repositories that store data to ensure that datasets are ‘fit-for-purpose’, repeatable, and trustworthy. The Data Quality Process Areas in the AGU DMMSM model define a collaborative approach for receiving, assessing, cleansing, and curating data to ensure ‘fitness’ for intended use in the scientific community.
After several iterations, the NCI DQS was established as part of the formal data publishing process and is applied throughout the cycle from submission of data to the NCI repository through to its final publication. The approach is also being adopted by the data producers who now engage with the process from the preparation stage, prior to ingestion onto the NCI data platform. Early consultation and feedback has greatly improved both the quality of the data as well as the timeliness for publication. To improve the efficiency further, one of our major data suppliers is including our DQS requirements in their data generation processes to ensure data quality is considered earlier in data production.
The technical requirements and implementation of our DQS will be described as four major, but related data components: Structure, QC, Benchmarking and QA.

2.1. Data Structure

NCI’s research data collections are particularly focused on enabling programmatic access, required by: (1) NCI core services such as the NCI supercomputer and NCI cloud-based capabilities; (2) community virtual laboratories and virtual research environments; (3) those that require remote access through established scientific standards-based protocols that use data services; and (4) increasingly by international data federations. To enable these different types of programmatic access, datasets must be registered in the central NCI catalogue [10], which records their location for access both on the filesystems and via data services.
This requires the data to be well-organized and compliant with uniform, professionally managed standards and consistent community conventions wherever possible. For example, the climate community Coupled Model Intercomparison Project (CMIP) experiments use the Data Reference Syntax (DRS) [11], whilst the National Aeronautics and Space Administration (NASA) recommends a specific name convention for Landsat satellite image products [12]. The NCI data collection catalogue manages the details of each dataset through a uniform application of ISO 19115:2003 [13]—an international schema used for describing geographic information and services. Essentially, each catalogue entry points to the location of the data within the NCI data infrastructure. The catalogue entries also point to the services endpoints such as a standard data download point, data subsetting interface, as well as Open Geospatial Consortium (OGC) Web Mapping Service (WMS) and Web Coverage Services (WCS). NCI can publish data through several different servers and so the specific endpoint for each of these service capabilities is listed.
NCI has developed a catalogue and directory policy, which provides guidelines for the organization of datasets within the concepts of data collections and data sub-collections and includes a comprehensive definition for each hierarchical layer. The definitions are:
  • A data collection is the highest in the hierarchy of data groupings at NCI. It is comprised of either an exclusive grouping of data subcollections; or, it is a tiered structure with an exclusive grouping of lower tiered data collections, where the lowest tier data collection will only contain data subcollections.
  • A data subcollection is an exclusive grouping of datasets (i.e., belonging to only one subcollection) where the constituent datasets are tightly managed. It must have responsibilities within one organization with responsibility for the underlying management of its constituent datasets. A data subcollection constitutes a strong connection between the component datasets, and is organized coherently around a single scientific element (e.g., model, instrument). A subcollection must have compatible licenses such that constituent datasets do not need different access arrangements.
  • A dataset is a compilation of data that constitutes a programmable data unit that has been collected and organized using a self-contained process. For this purpose it must have a named data owner, a single license, one set of semantics, ontologies, vocabularies, and has a single data format and internal data convention. A dataset must include its version.
  • A dataset granule is used for some scientific domains that require a finer level of granularity (e.g., in satellite Earth Observation datasets). A granule refers to the smallest aggregation of data that can be independently described, inventoried, and retrieved as defined by NASA [14]. Dataset granules have their own metadata and support values associated with the additional attributes defined by parent datasets.
In addition we use the term ‘Data Category’ to identify common contents/themes across all levels of the hierarchy.
  • A data category allows a broad spectrum of options to encode relationships between data. A data category can be anything that weakly relates datasets, with the primary way of discovering the groupings within the data by key terms (e.g., keywords, attributes, vocabularies, ontologies). Datasets are not exclusive to a single category.

Organization of Data within the Data Structure

NCI has organized data collections according to this hierarchical structure on both filesystem and within our catalogue system. Figure 1 shows how these datasets are organized. Figure 2 provides an example of how the CMIP 5 data collection demonstrates the hierarchical directory structure.

2.2. Data QC

Data QC measures are intended to ensure that all datasets hosted at NCI adhere, wherever possible, to existing community standards for metadata and data. For Network Common Data Form (netCDF) (and Hierarchical Data Format v5 (HDF5)-based) file formats, these include: the Climate and Forecast (CF) Convention [15] and the Attribute Convention for Data Discovery [16] (see Table 1).

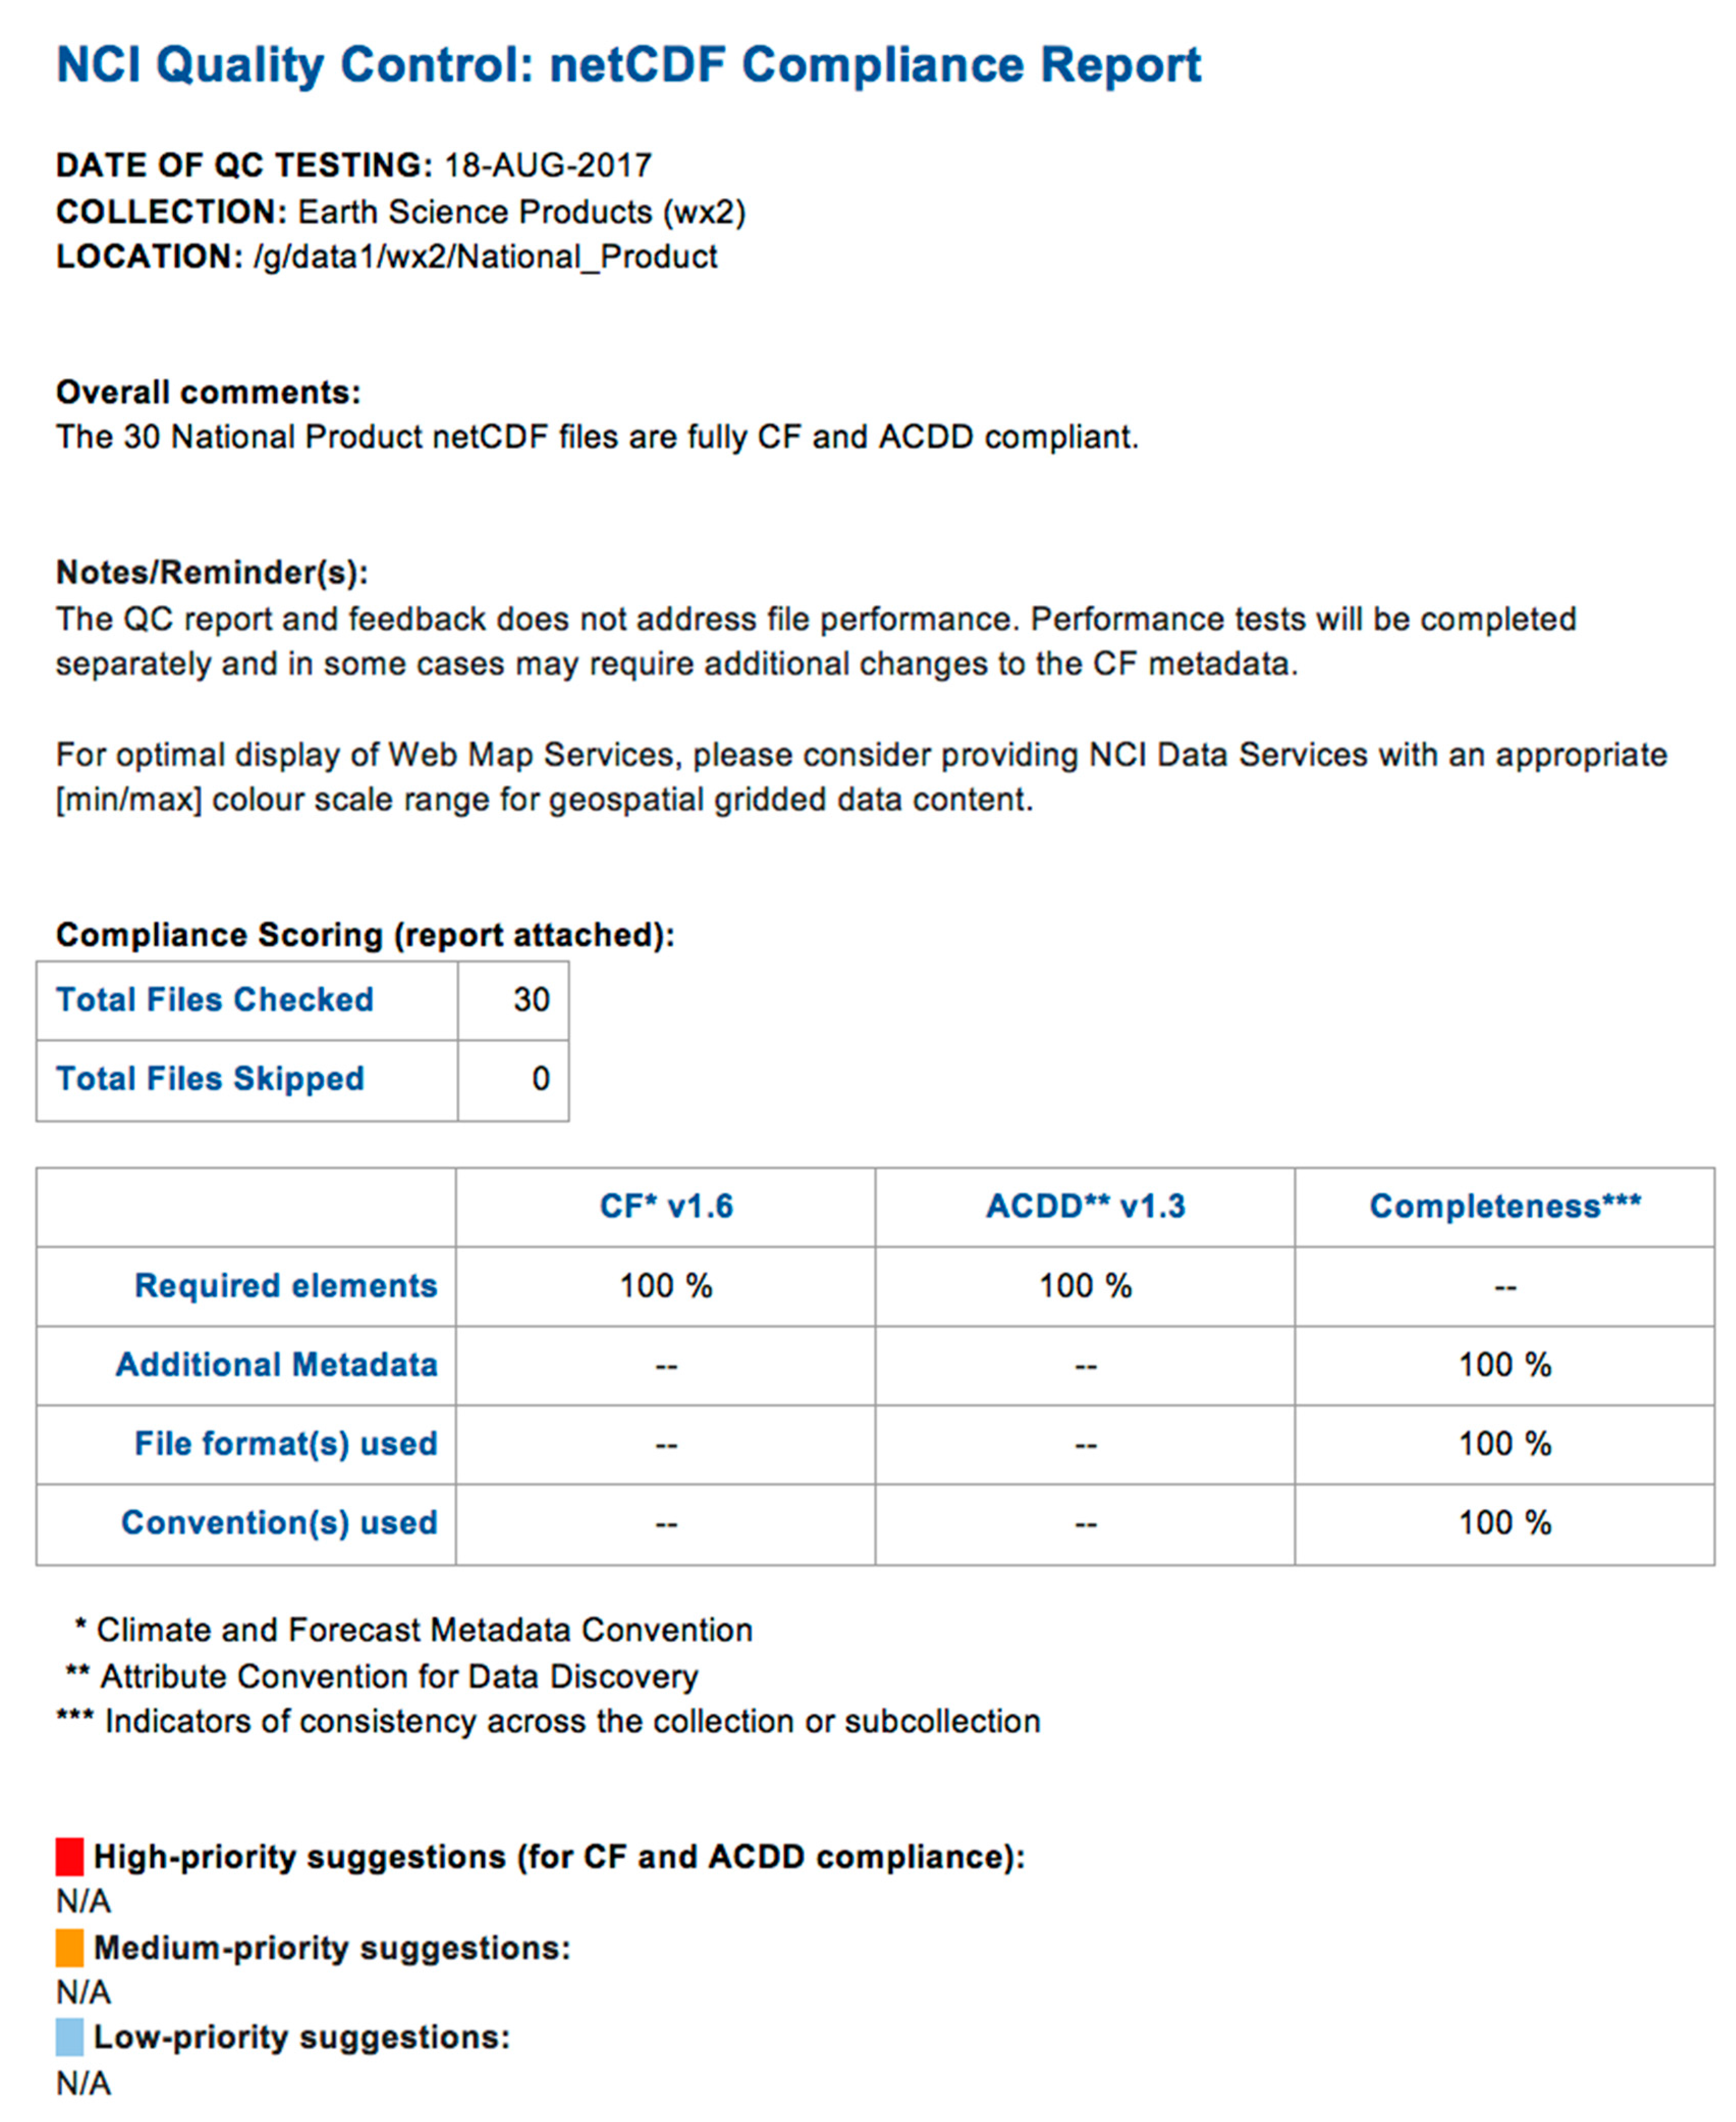
2.2.1. Climate and Forecast (CF) Convention

NCI requires that all geospatial datasets meet the minimum mandatory CF Convention metadata criteria at the time of publication and, where scientifically applicable, we require they meet the relevant recommended CF criteria. These requirements are detailed in the latest CF Convention document provided on their website [15].
The CF Convention is the primary community standard for netCDF data, which was originally developed by the Climate community and is now being adapted for other domains, e.g., Marine and Geosciences. It defines metadata requirements for information on each variable contained within the file as well as spatial and temporal properties of the data, so that contents are fully “self-described”. For example, no additional companion files or external sources are required to describe any information about how to read or utilize the data contents within the file. The metadata requirements also provide important guidelines on how to structure spatial data. This includes recommendations on the order of dimensions, the handling of gridded and non-gridded (time series, point and trajectory) data, coordinate reference system descriptions, standardized units, and cell measures (i.e., information relating to the size, shape or location of grid cells). CF requires that all metadata information be equally readable and understandable by humans and software, which has the benefit of allowing software tools to easily display and dynamically perform associated operations.

2.2.2. Attribute Convention for Data Discovery (ACDD)

The ACDD is another common standard for netCDF data that complements the CF Convention requirements [16]. The ACDD primarily governs metadata information written at the file-level (i.e., netCDF global attributes) while the CF Convention pertains mainly to variable-level metadata and structure information. Therefore, combined these two standards help to fully describe both the higher-level metadata relevant to the entire file (e.g., dataset title, custodian, data created, etc.) and the lower-level information about each individual variable or dimension (e.g., name, units, bounds, fill values, etc.). ACDD also provides the ability to link to even higher-levels such as the dataset parent and grandparent ISO-19115 metadata entries.
NCI has applied this convention, along with CF, as summarized in Table 1 as part of our Data QC. As the ACDD has no “required” fields in its current specification, NCI has applied a modified version that requires all published datasets meet the minimum of four required ACDD catalogue metadata fields at the time of publication. These are: “title”, “summary”, “source”, and “date_created” and have been ranked as “required” to aid with NCI’s data services and data discovery. A complete list of ACDD metadata attributes and NCI requirements are available in Appendix A.

2.3. Benchmarking Methodology

Any reference datasets made available on NCI must be well organized and accessible in a form suitable for the known class of users. Datasets also need to be more broadly available to other users from different domains, with the expectation that the collection will continue to have long-term and enduring value not just to the research community, but to others (e.g., government, general public, industry). To ensure that these expectations are clearly understood across the range of use-cases and environments, NCI has adopted a Benchmarking Methodology as part of their DQS process. Benchmarks register their functionality and performance, which helps to define expectations around data accessibility, and provide an effective, defined measure of usability.
To substantiate this, NCI works with both the data producers and the users to establish benchmarks for specific areas, which are then included as part of the registry of data QA measures. These tests are then verified by both NCI and by wider community representatives to ensure that the benchmark is appropriate for the requested access. The benchmark methodology also provides a way to systematically consider how current users will be affected when considering any future developments or evolution in technology, standards or reorganization of data. The benchmark cases then substantiate the original intention, and they can be reviewed against any subsequent changes. For example, benchmark cases that were previously specified to use data in a particular format may have been updated to use an alternative, more acceptable format that is better for use in High Performance environments or improves accessibility across multiple domains. The original benchmark cases can then be re-evaluated against both the functionality and performance required to assess how to make such a transformation. Further, if there are any upgrades or changes to the production services, the benchmark cases are used to perform prerelease tests on the data servers before implementing the changes into production.
The benchmarks consist of explicit current examples using tools, libraries, services, packages, software and processes that are executed at NCI. These benchmarks explore the required access and identify supporting standards that are critical to the utility of the service, whether access be through the filesystem or by API protocols provided by NCI data services. Where benchmarks are shown to be beyond the capability of the current data service, the benchmark case will be recorded for future application.
Furthermore, the results of the testing of each benchmark are reviewed with the data producer in light of any issues raised. This may require action by the user to revise the access pattern and/or by the data producer to modify the data to ensure that the reliability of NCI’s production service is not compromised. Alternatively, NCI may be able to provide a temporary separate service to accommodate some aspects of the usage pattern. For example, the data might be released via a modified server that can address shortcomings of a specific benchmark case, but would not be applicable generally. This may be a short-term measure until a better server solution is found, or it may address current local issues on either the data or client application side.

2.4. Data QA

To ensure that the data is usable across a range of use-cases and environments, the QA approach uses benchmarks for testing data located on the local filesystem, as well as remotely via the data service endpoints. The QA process is designed to verify that software and libraries used are functioning properly with the most commonly used tools in the community.
The following are a list of data services that are available under NCI’s Unidata Thematic Real-time Environmental Distributed Data Services (THREDDS):
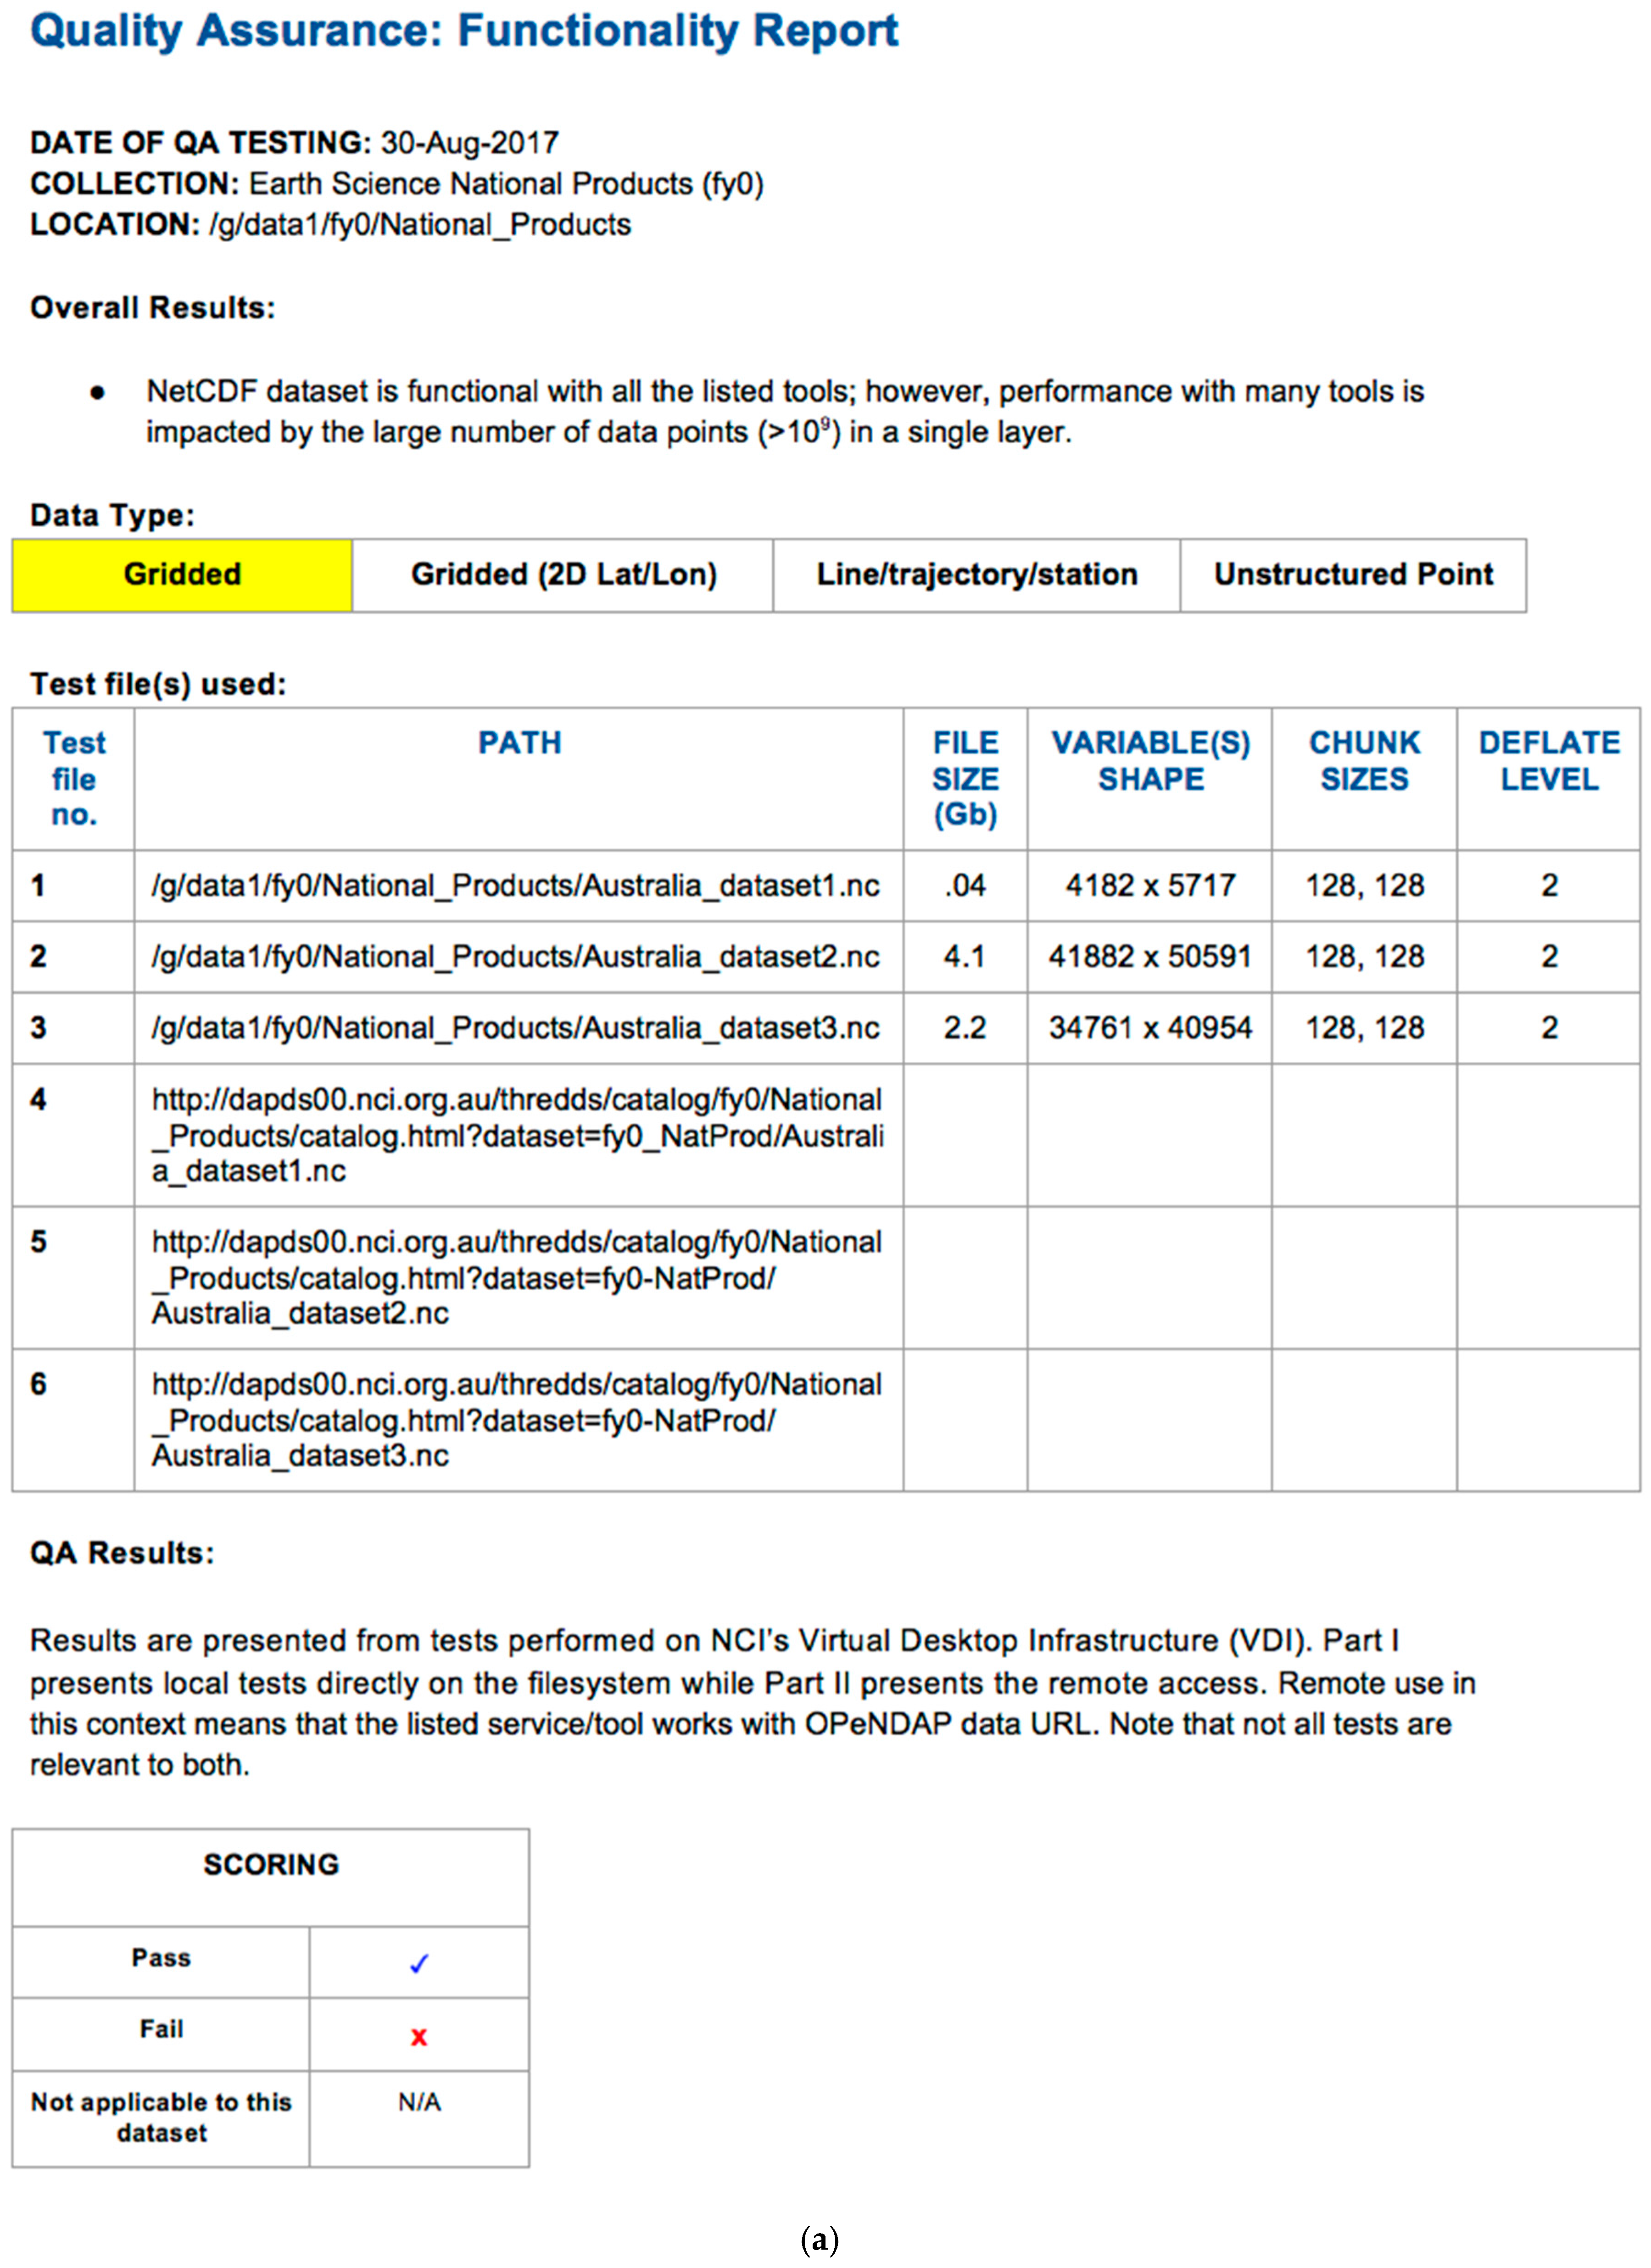
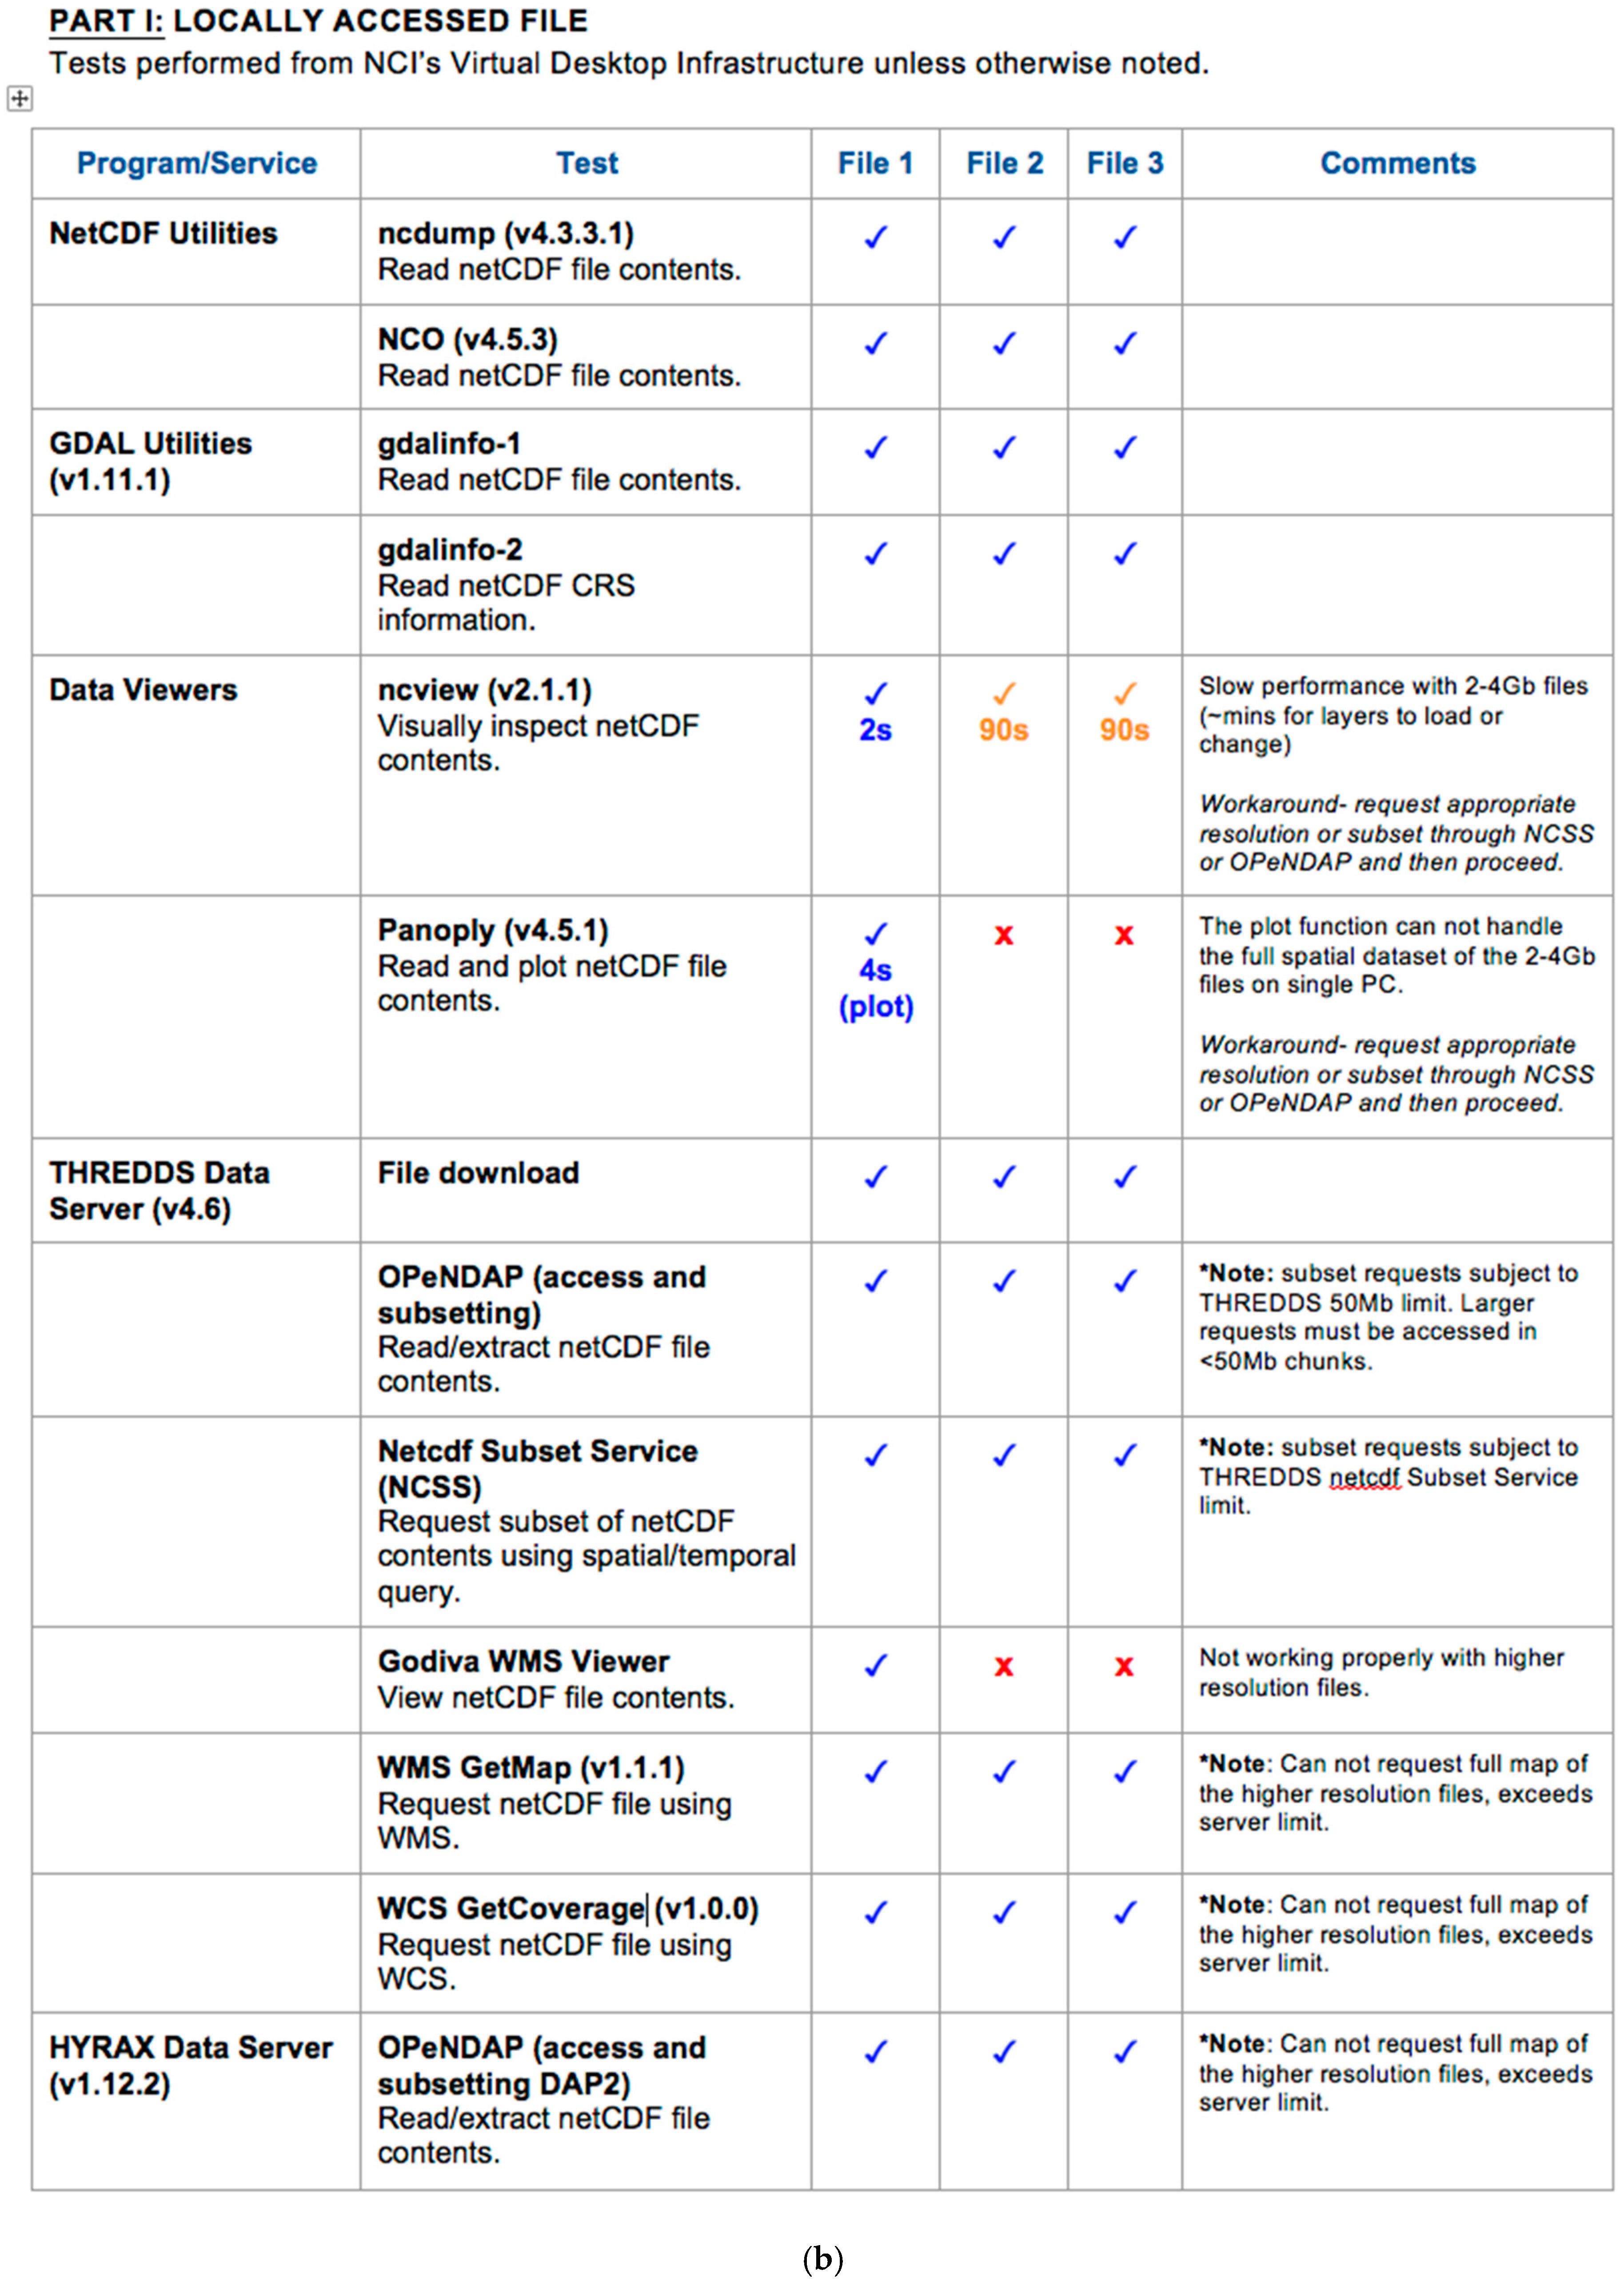
  • Open-source Project for a Network Data Access Protocol (OPeNDAP): a protocol enabling data access and subsetting through the web;
  • NetCDF Subset Service (NCSS): Web service for subsetting files that can be read by the netCDF java library;
  • WMS: OGC web service for requesting raster images of data;
  • WCS: OGC web service for requesting data in some output format;
  • Godiva2 Data Viewer: Tool for simple visualization of data; and
  • HTTP File Download: direct downloading data.
The data is tested through each of the required services as part of the QA process with the basic usability functionality tests applied to each service as shown in Table 2. Should an issue be discovered during these functionality tests, the issue is investigated further. This may lead to additional modifications of the data so as to pass the functionality or performance requirements, and in doing so requires further communication with the data producer to ensure that such changes are acceptable, and can be corrected in any future data production process. More detailed functionality can also be recorded for scientific use around the data. Such tests tend to be specific for the data use-case, but follow the same methodology as that described here.

3. Examples of Tests and Reports Undertaken on NCI Datasets Prior to Publication

3.1. Metadata QC Checker Reports

To assess the CF and ACDD compliance, NCI runs a QC checker prior to data publication and works with the data producer to rectify problems. The NCI checker is based on the U.S. Integrated Ocean Observing System (IOOS) Compliance Checker [17] but has been modified to include additional checks relevant to NCI’s data services as well as the modified ACDD convention. Appendix B shows an example QC checker report (Figure A1) with metadata that is 100% compliant with NCI’s requirements. In practice, the process usually needs to be run several times as the datasets are checked, feedback is given, and then re-run against the timestamp for each version to keep a record of metadata update provenance. The reports are shared with the data producers with comments and additional feedback provided in the “high/medium/low-priority suggestions” section at the end of the report depending on the potential impact of non-compliance.
Due to the large number of data files that can be involved, NCI’s QC checker has been modified to enable parallelization so that multiple processes can be run simultaneously, and thus increases performance of the checking process. For instance, it takes less than a minute to check hundreds of files; and about 10 min for tens of thousands. For the largest datasets, the QC checker can typically run on more than 1 million files at a time.
The QC checker also helps to find corrupted or temporary files, which can be easily overlooked or not detected by the data producers, especially during a batch production process.

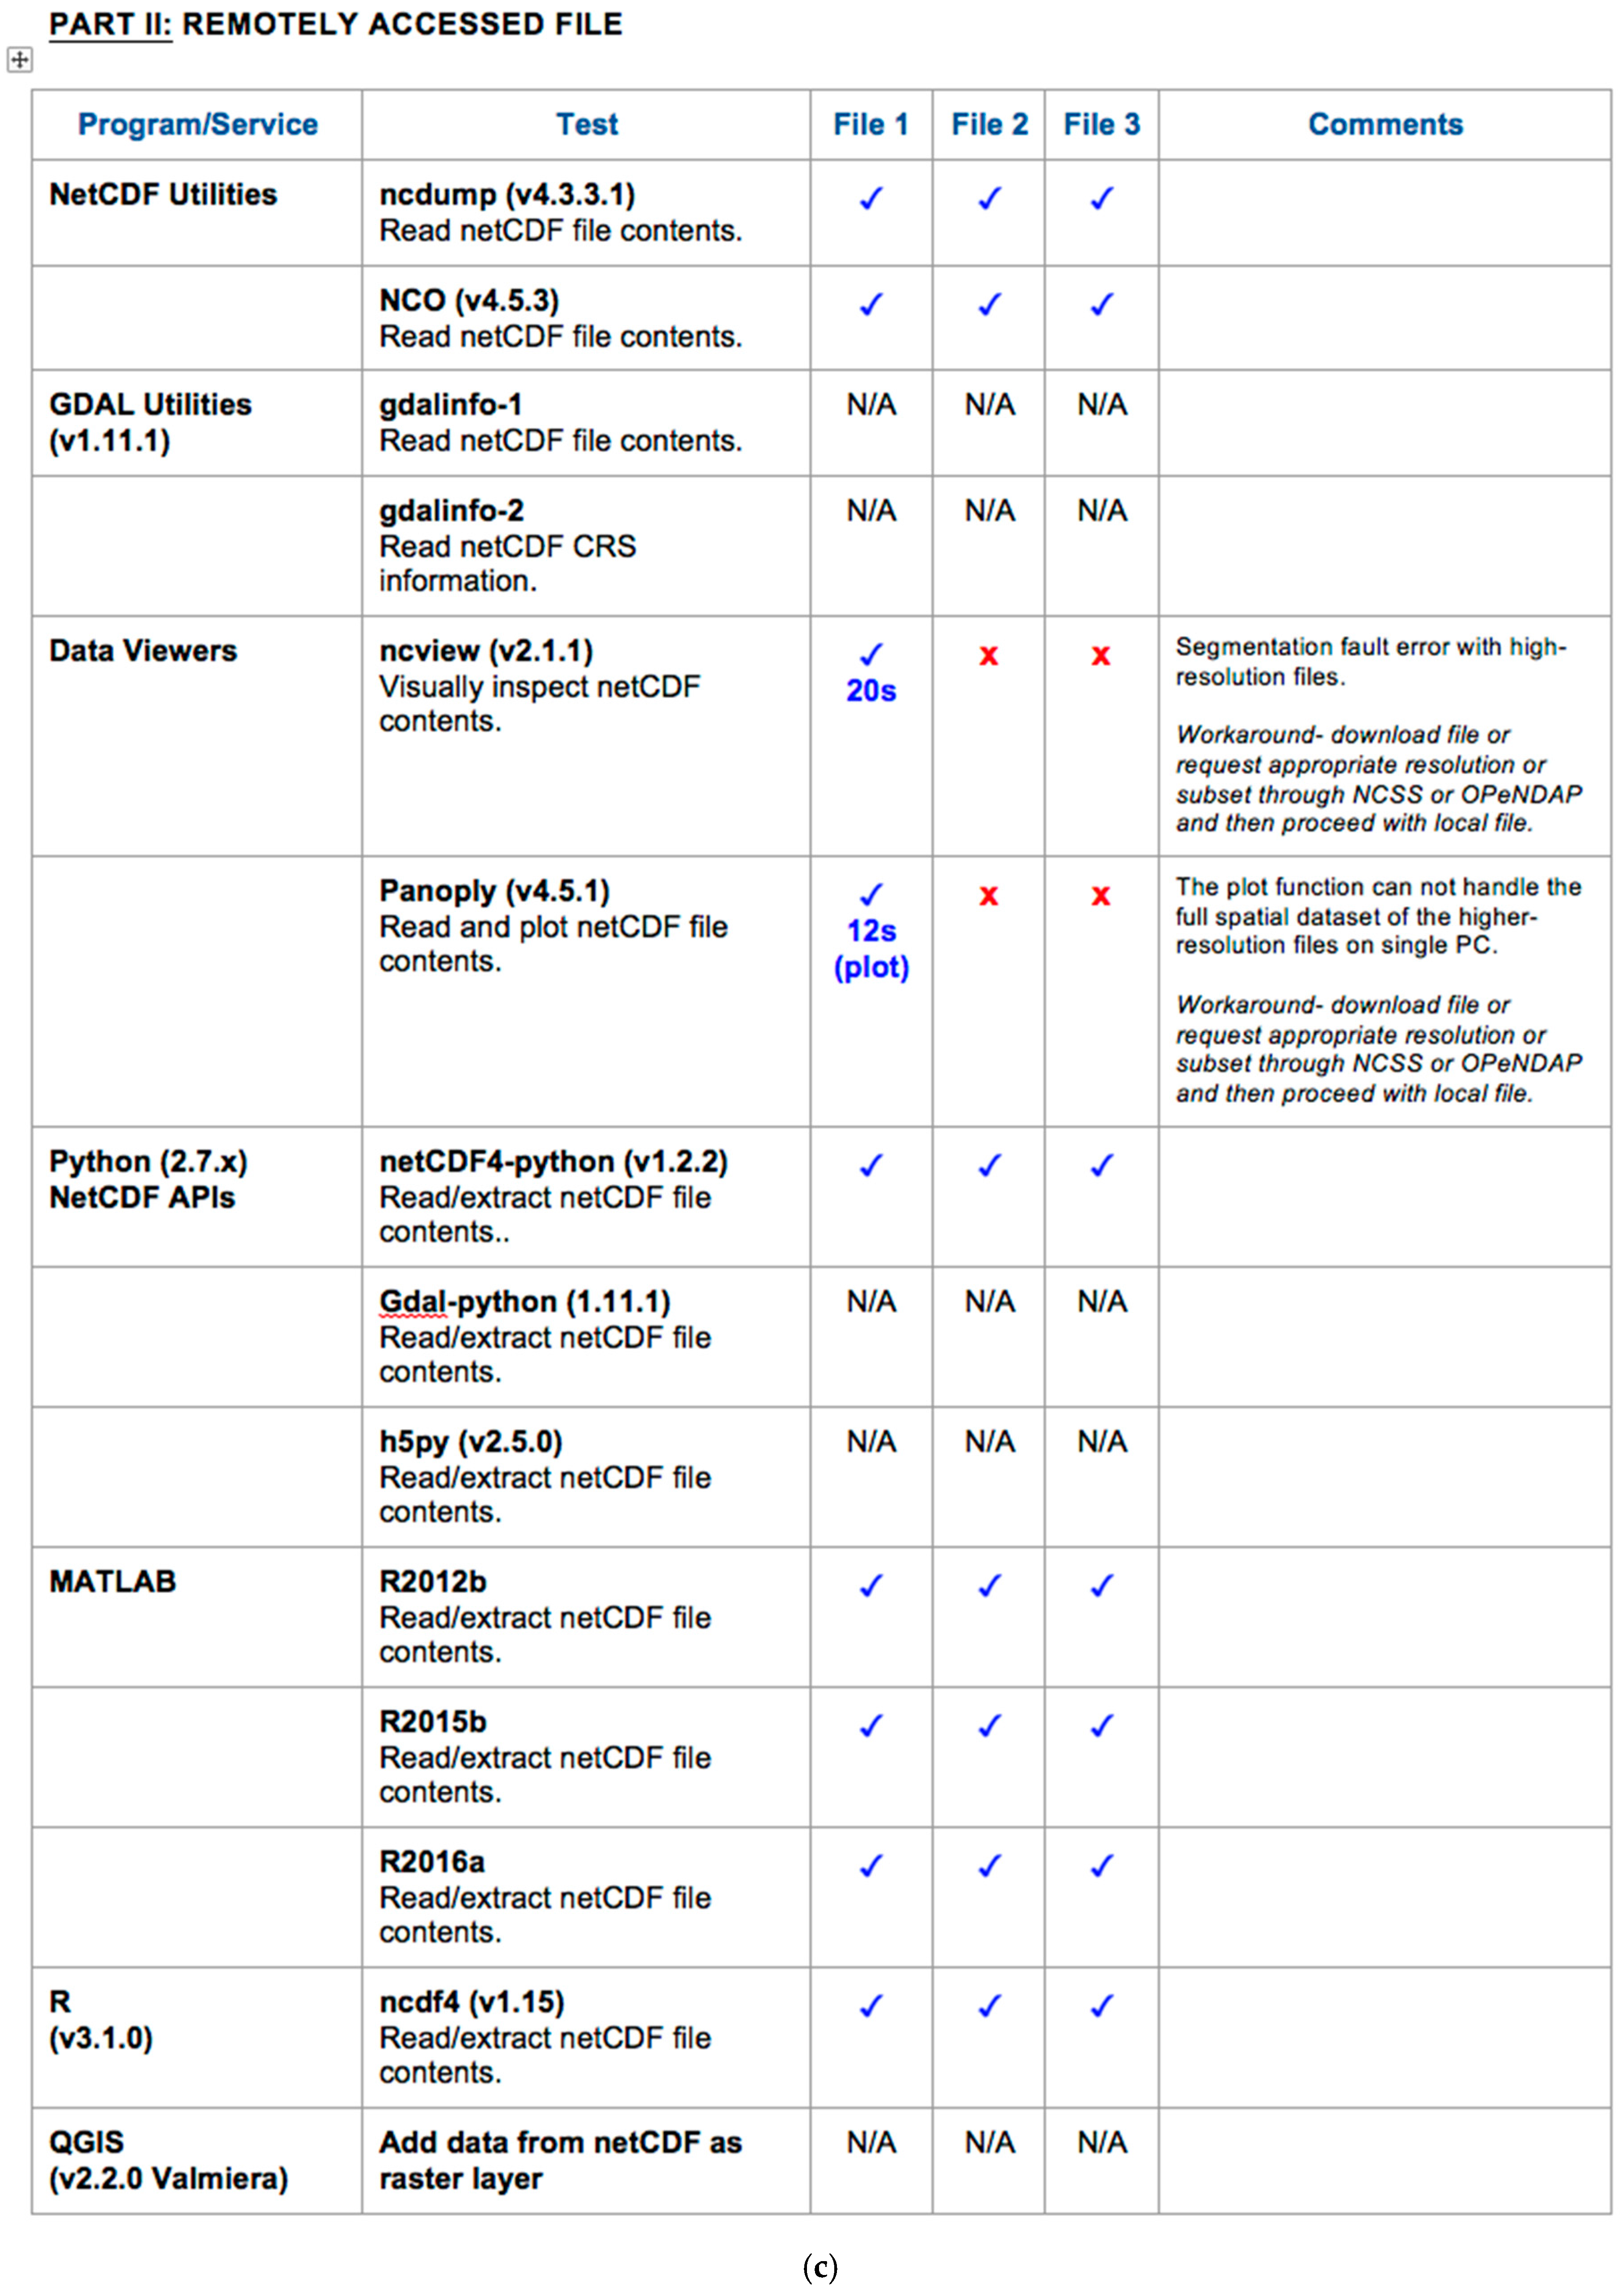
3.2. Functionality Test QA Reports

Appendix B provides an example report (Figure A2) of the QA results from checking three data files when accessed directly on the filesystem and their service endpoints for access via THREDDS. The functionality test shows that the variable structure within the data of two files (2 GB and 4 GB) are too large to load the files into several commonly used data viewers, such as ncview (v2.1.1) and Panoply (v4.5.1); and have similar issues on opening files through the service endpoints. In this case, our advice for mitigation is to reduce the requested size of the image by using a lower resolution or to work in-situ with this particular data file, as recorded in the comments of Figure A2b,c.

3.3. Benchmarking Use Cases

In the benchmark tests several popular tools and APIs are run to evaluate their elapsed time on accessing data either residing on the local filesystem or being accessed via data services. The test files in the example NCI functionality QA test report (Figure A2) are used in the benchmark tests and their data structures are listed in Table 3. We access the 2D variable in each file, which is recorded at (lat, lon), chunked at (128,128) and deflated at level 2.
The elapsed time of the benchmark tests are listed in Table 4. The netCDF utilities such as ncdump or h5dump could dump the contents of netCDF files into an ASCII representation. They are frequently used in the functionality test of the QA report to fetch the metadata of the netCDF files. In the performance benchmarking tests, we measure the elapsed time to dump the whole variable as human readable ASCII text. This performance relies on the internal data organization, such as contiguous or chunking, deflation shuffling etc., and involves numerous type conventional operations. Such conventions may also incur a heavy overhead during the dump process and it could take a very long time to complete the access of a large size file.
In Table 4 we show an extreme case where a file provided complies with standard QC checks and is well formatted. However, when we evaluate the file using the standard suite of tools we see that the elapsed time of using both ncdump and h5dump can take hours to dump a variable for a file size of 2 GB or 4 GB. To evaluate performance of programmatic methods on netCDF files, we use netCDF4-python, Geospatial Data Abstraction Library (GDAL)-python and h5py to access the target files from the Lustre filesystems. In this case our tests show that all APIs could use much less time fetching the whole variable than netCDF dump tools due to the removal of overheads on data convention and transporting. Our tests also show that h5py presents the best performance. Since netCDF-4 is essentially a profile of the HDF5 format, both netCDF4-python and GDAL-python eventually invoke the HDF5 library to access the data. NetCDF4-python can also access data from the THREDDS server (which is tested for performance on our high speed internal network), but it takes nearly 6 times longer to access the data via the data service when compared with accessing the same volume of data on our Lustre filesystem. All three tools take a similar time to access data from our THREDDS server. By default, netCDF4-python and THREDDS have a request size limit of 500 MB so it is necessary to divide the fetching process into several individual requests if the target dataset is larger than 500 MB. NCSS, on the other hand, has a much larger file limit per request so less requests are needed in NCSS than either netCDF4-python or THREDDS.

3.4. Results Sharing

All QC/QA reports and benchmarks are shared with the data producers. In the future we plan to make these reports available to the wider community as the information provides consumers with evidence on how the data is functioning and how it has performed with different software and libraries. It also provides guidance on how to best use the data and enables the consumer to determine if they are using data, or a tool to access the data, that has not been tested before. This information is also used in data training to demonstrate the application of data standards in both data organization and data preparation, and how to use the data with a range of software.

4. Discussion

The NCI DQS has been applied to Climate and Weather, Earth Observation, Geoscience and Astronomy data with the QC and QA tests adapted to meet the relevant community standards and protocols for each domain. The examples provided in this paper have shown how the knowledge and experience on data standards for netCDF files and conventions, such as CF and ACDD initially developed within the Climate Community, are applicable to other scientific domains. For example, the geophysics domain, there is a growing need to enable access to much larger data volumes, over larger spatial areas and/or enable aggregation of data from multiple individual geophysical surveys. To do this, in consultation with the geophysics and HDF communities, the principles of the CF convention from the climate community and the ACDD from the Earth science community were translated into a proposed new geophysics convention that improves programmatic access and interoperability across different geophysical data types, such as seismic, gravity, magnetotelluric, radiometrics [18]. We also applied our benchmarking strategy to the geophysics domain, initially using the domain-popular ObsPy library [19] and SPECFEM3D code [20], to demonstrate how different organizations of the data (in terms of chunking size and compression) impact on the performance by comparing new data formats, such as PH5 [21] and ASDF [22] to traditional formats such as the Society of Exploration Geophysicists-Y Data Exchange Format (SEG-Y), the Standard for the Exchange of Earthquake Data Format (SEED), Seismic Analysis Code (SAC), etc.

5. Conclusions

We have developed a DQS as a key component of our vision to provide a trustworthy, transdisciplinary, high performance data platform which enables researchers to share, use, reuse and repurpose the data collections in high-end computational and data-intensive environments. The implementation of DQS provides assurance to users that the data is properly quality checked and they are compliant within the community standard. The functionality check in the QA process lists suitable software and libraries so that users can check whether the data is usable within their platform. Applying the DQS provides a standard way to: (1) assess completeness and consistency of data across multiple datasets and collections; (2) evaluate the suitability of the data for transdisciplinary use; (3) enable standardized programmatic access; and (4) avoid the negative impacts of poor data and dissatisfied user experience.
The NCI DQS identifies issues with the data and metadata at the time of data ingestion onto the NCI data platform, thus allowing corrections to be undertaken prior to publication. Applying the DQS means that scientists spend less time re-formatting and wrangling the data to make it suitable for use by their applications and workflows—especially if their applications can read standardized interfaces. Future work will focus on broader adoption of data from additional domains and data types, as well improving use of controlled vocabularies for individual data attributes as a means of more efficiently indexing the data.

Acknowledgments

The authors wish to acknowledge funding from the Australian Government Department of Education, through the National Collaborative Research Infrastructure Strategy (NCRIS) and the Education Investment Fund (EIF) Super Science Initiatives through the NCI and Research Data Services (RDS) projects. We also wish to acknowledge the organizational partners and data managers involved in data management at NCI, particularly Geoscience Australia, the Bureau of Meteorology, CSIRO, and the Australian National University.

Author Contributions

B.E. and K.D. conceived and designed the NCI DQS. K.D. developed the codes of QC/QA checker. K.D. and J.W. run the QC and QA test and generate reports. R.Y. ran the benchmark tests. J.W., K.D., R.Y. and L.W. wrote the initial paper. B.E., C.R. and L.W. reviewed and improved key sections of the paper, particularly for the broader activities of QA and its application.

Conflicts of Interest

The authors declare no conflict of interest. The founding sponsors had no role in the design of the study; in the collection, analyses, or interpretation of data; in the writing of the manuscript, and in the decision to publish the results.

Appendix A

NCI NetCDF Metadata Guide based on the Attribute Convention for Dataset Discovery (ACDD v1.3).
Table A1. The following table contains a subgroup of attributes from the ACDD metadata specification [16] where the priority-level for the attributes are categorized as “Required”, “Recommended”, or “Suggested” and which shows attributes where the priority-level has been modified to better align with NCI’s data hosting services (e.g., NCI classifies “source” as “Required” while it is only “Recommended” by the ACDD guidelines).
REQUIRED
Global AttributeDescription
titleA short phrase or sentence describing the dataset. In many discovery systems, the title will be displayed in the results list from a search, and therefore should be human readable and reasonable to display in a list of such names. This attribute is also recommended by the NetCDF Users Guide and the CF conventions.
summaryA paragraph describing the dataset, analogous to an abstract for a paper.
sourceThe method of production of the original data. If it was model-generated, source should name the model and its version. If it is observational, source should characterize it. This attribute is defined in the CF Conventions. Examples: ‘temperature from CTD #1234’; ‘world model v.0.1’.
date_createdThe date on which this version of the data was created. (Modification of values implies a new version, hence this would be assigned the date of the most recent values modification.) Metadata changes are not considered when assigning the date_created. The ISO 8601:2004 extended date format is recommended, as described in the Attribute Content Guidance section.
RECOMMENDED
Global AttributeDescription
ConventionsA comma-separated list of the conventions that are followed by the dataset. For files that follow this version of ACDD, include the string ‘ACDD-1.3’. (This attribute is described in the netCDF Users Guide.)
metadata_linkA URL that gives the location of more complete metadata. A persistent URL is recommended for this attribute.
historyProvides an audit trail for modifications to the original data. This attribute is also in the netCDF Users Guide: ‘This is a character array with a line for each invocation of a program that has modified the dataset. Well-behaved generic netCDF applications should append a line containing: date, time of day, user name, program name and command arguments.’ To include a more complete description you can append a reference to an ISO Lineage entity; see NOAA EDM ISO Lineage guidance.
licenseProvide the URL to a standard or specific license, enter “Freely Distributed” or “None”, or describe any restrictions to data access and distribution in free text.
doiTo be used if a DOI exists.
product_versionVersion identifier of the data file or product as assigned by the data creator. For example, a new algorithm or methodology could result in a new product_version.
processing_levelA textual description of the processing (or QC) level of the data.
institutionThe name of the institution principally responsible for originating this data. This attribute is recommended by the CF convention.
projectThe name of the project(s) principally responsible for originating this data. Multiple projects can be separated by commas, as described under Attribute Content Guidelines. Examples: ‘PATMOS-X’, ‘Extended Continental Shelf Project’.
instrumentName of the contributing instrument(s) or sensor(s) used to create this data set or product. Indicate controlled vocabulary used in instrument_vocabulary.
platformName of the platform(s) that supported the sensor data used to create this data set or product. Platforms can be of any type, including satellite, ship, station, aircraft or other. Indicate controlled vocabulary used in platform_vocabulary.
SUGGESTED
Global AttributeDescription
idAn identifier for the data set, provided by and unique within its naming authority. The combination of the “naming authority” and the “id” should be globally unique, but the id can be globally unique by itself also. IDs can be URLs, URNs, DOIs, meaningful text strings, a local key, or any other unique string of characters. The id should not include white space characters.
date_modifiedThe date on which the data was last modified. Note that this applies just to the data, not the metadata. The ISO 8601:2004 extended date format is recommended, as described in the Attributes Content Guidance section.
date_createdThe date on which this version of the data was created. (Modification of values implies a new version, hence this would be assigned the date of the most recent values modification.) Metadata changes are not considered when assigning the date_created. The ISO 8601:2004 extended date format is recommended, as described in the Attribute Content Guidance section.
date_issuedThe date on which this data (including all modifications) was formally issued (i.e., made available to a wider audience). Note that these apply just to the data, not the metadata. The ISO 8601:2004 extended date format is recommended, as described in the Attributes Content Guidance section.
referencesPublished or web-based references that describe the data or methods used to produce it. Recommend URIs (such as a URL or DOI) for papers or other references. This attribute is defined in the CF conventions.
keywordsA comma-separated list of key words and/or phrases. Keywords may be common words or phrases, terms from a controlled vocabulary (GCMD is often used), or URIs for terms from a controlled vocabulary (see also “keywords_vocabulary” attribute).
standard_name_vocabularyThe name and version of the controlled vocabulary from which variable standard names are taken. (Values for any standard_name attribute must come from the CF Standard Names vocabulary for the data file or product to comply with CF.) Example: ‘CF Standard Name Table v27’.
geospatial_lat_minDescribes a simple lower latitude limit; may be part of a 2- or 3-dimensional bounding region. Geospatial_lat_min specifies the southernmost latitude covered by the dataset.
geospatial_lat_maxDescribes a simple upper latitude limit; may be part of a 2- or 3-dimensional bounding region. Geospatial_lat_max specifies the northernmost latitude covered by the dataset.
ospatial_lon_minDescribes a simple longitude limit; may be part of a 2- or 3-dimensional bounding region. geospatial_lon_min specifies the westernmost longitude covered by the dataset. See also geospatial_lon_max.
geospatial_lon_maxDescribes a simple longitude limit; may be part of a 2- or 3-dimensional bounding region. geospatial_lon_max specifies the easternmost longitude covered by the dataset. Cases where geospatial_lon_min is greater than geospatial_lon_max indicate the bounding box extends from geospatial_lon_max, through the longitude range discontinuity meridian (either the antimeridian for −180:180 values, or Prime Meridian for 0:360 values), to geospatial_lon_min; for example, geospatial_lon_min = 170 and geospatial_lon_max = −175 incorporates 15 degrees of longitude (ranges 170 to 180 and −180 to −175).
geospatial_vertical_minDescribes the numerically smaller vertical limit; may be part of a 2- or 3-dimensional bounding region. See geospatial_vertical_positive and geospatial_vertical_units.
geospatial_vertical_maxDescribes the numerically larger vertical limit; may be part of a 2- or 3-dimensional bounding region. See geospatial_vertical_positive and geospatial_vertical_units.
geospatial_vertical_positiveOne of ‘up’ or ‘down’. If up, vertical values are interpreted as ‘altitude’, with negative values corresponding to below the reference datum (e.g., under water). If down, vertical values are interpreted as ‘depth’, positive values correspond to below the reference datum. Note that if geospatial_vertical_positive is down (‘depth’ orientation), the geospatial_vertical_min attribute specifies the data’s vertical location furthest from the earth’s center, and the geospatial_vertical_max attribute specifies the location closest to the earth’s center.
geospatial_boundsDescribes the data’s 2D or 3D geospatial extent in OGC’s Well-Known Text (WKT) Geometry format (reference the OGC Simple Feature Access (SFA) specification). The meaning and order of values for each point’s coordinates depends on the coordinate reference system (CRS). The ACDD default is 2D geometry in the EPSG:4326 coordinate reference system. The default may be overridden with geospatial_bounds_crs and geospatial_bounds_vertical_crs (see those attributes). EPSG:4326 coordinate values are latitude (decimal degrees_north) and longitude (decimal degrees_east), in that order. Longitude values in the default case are limited to the [−180, 180) range. Example: ‘POLYGON ((40.26 -111.29, 41.26 -111.29, 41.26 -110.29, 40.26 -110.29, 40.26 -111.29))’.
time_coverage_startDescribes the time of the first data point in the data set. Use the ISO 8601:2004 date format, preferably the extended format as recommended in the Attribute Content Guidance section.
time_coverage_endDescribes the time of the last data point in the data set. Use ISO 8601:2004 date format, preferably the extended format as recommended in the Attribute Content Guidance section.
time_coverage_durationDescribes the duration of the data set. Use ISO 8601:2004 duration format, preferably the extended format as recommended in the Attribute Content Guidance section.
time_coverage_resolutionDescribes the targeted time period between each value in the data set. Use ISO 8601:2004 duration format, preferably the extended format as recommended in the Attribute Content Guidance section.

Appendix B

Examples of NCI’s Quality Control (QC) and Quality Assurance (QA) reporting.
Figure A1. An example of NCI’s QC compliance report, which is shared with data producers and used to ensure that the dataset metadata meets the minimum requirements for a netCDF collection. In this particular example collection, 30 files were successfully scanned (zero skipped) and all elements of the QC process passed. In cases were elements are not fully compliant, the high/medium/low priority suggestions section at the end of the report is used to explain the nature of the errors found and list possible means for modification.
Informatics 04 00045 g0a1
Figure A2. An example of NCI functionality QA test report. (a) The first section of the report provides a short summary of results and whether the data is considered functional with all the tested tools, and lists the details of the files that were used for the assessment, including the properties of the files, such as size, variable shape, chunk size, and compression (deflate) level. (b) The second section provides the results for the functionality tests performed on the data, directly on the filesystem. (c) The third section provides the results of the functionality tests using the data served through NCI’s THREDDS services.
Informatics 04 00045 g0a2aInformatics 04 00045 g0a2bInformatics 04 00045 g0a2c

References

  1. Wang, J.; Evans, B.; Bastrakova, I.; Ryder, G.; Martin, J.; Duursma, D.; Gohar, K.; Mackey, T.; Paget, M.; Siddeswara, G.; et al. Large-Scale Data Collection Metadata Management at the National Computation Infrastructure. In Proceedings of the American Geophysical Union Fall Meeting, San Francisco, CA, USA, 13–17 December 2014. [Google Scholar]
  2. The FAIR Data Principles. Available online: https://www.force11.org/group/fairgroup/fairprinciples (accessed on 23 August 2017).
  3. Evans, B.; Wyborn, L.; Druken, K.; Richards, C.; Trenham, C.; Wang, J. Extending the Common Framework for Earth Observation Data to other Disciplinary Data and Programmatic Access. In Proceedings of the American Geophysical Union Fall Meeting, San Francisco, CA, USA, 15–19 December 2016. [Google Scholar]
  4. Ramapriyan, H.; Peng, G.; Moroni, D.; Shie, C.L. Ensuring and Improving Information Quality for Earth Science Data and Products. D-Lib Magazine. Volume 23, No. 7/8. Available online: https://doi.org/10.1045/july2017-ramapriyan (accessed on 18 October 2017).
  5. Atkin, B.; Brooks, A. Chapter 8: Service Specifications, Service Level Agreements and Performance. In Total Facilities Management, 2nd ed.; Blackwell Publishing Ltd.: Oxford, UK, 2005; ISBN 978-1-4051-2790-5. [Google Scholar]
  6. The CoreTrustSeal. Available online: https://www.coretrustseal.org/why-certification/requirements/ (accessed on 24 October 2017).
  7. Stall, S. AGU’s Data Management Maturity Model. Abstracts SciDataCon 2016. Available online: http://www.scidatacon.org/2016/sessions/100/paper/278/ (accessed on 23 October 2017).
  8. Stall, S.; Hanson, B.; Wyborn, L. The American Geophysical Union Data Management Maturity Program. Abstracts for eResearch Australasia 2016. Available online: https://eresearchau.files.wordpress.com/2016/03/eresau2016_paper_72.pdf (accessed on 23 October 2017).
  9. Data Management Maturity Model; CMMI® Institute: Pittsburgh, PA, USA, 2014.
  10. NCI’s Data Catalogue Websites. Available online: https://datacatalogue.nci.org.au/ and https://geonetwork.nci.org.au (accessed on 23 August 2017).
  11. CMIP5 Data Reference Syntax. Available online: http://cmip-pcmdi.llnl.gov/cmip5/docs/cmip5_data_reference_syntax.pdf (accessed on 23 August 2017).
  12. NASA Landsat File Name Convention. Available online: https://landsat.usgs.gov/what-are-naming-conventions-landsat-scene-identifiers (accessed on 23 August 2017).
  13. ISO 2015 ISO19115-1:2014. Geographic Information—Metadata—Part 1: Fundamentals. Standards document. International Organization for Standardization, Geneva. Available online: http://www.iso.org/iso/home/store/catalogue_tc/catalogue_detail.htm?csnumber=53798 (accessed on 25 May 2016).
  14. NASA Glossary. Available online: https://earthdata.nasa.gov/user-resources/glossary#ed-glossary-g (accessed on 23 August 2017).
  15. NetCDF Climate and Forecast Metadata Conventions. Available online: http://cfconventions.org (accessed on 23 August 2017).
  16. Attribute Convention for Data Discovery 1.3. Available online: http://wiki.esipfed.org/index.php/Attribute_Convention_for_Data_Discovery_(ACDD) (accessed on 23 August 2017).
  17. IOOS Compliance Checker. Available online: https://github.com/ioos/compliance-checker (accessed on 22 November 2017).
  18. Wang, J.; Yang, R.; Evans, B.J.E. Improving Seismic Data Accessibility and Performance Using HDF Containers. Abstracts AGU 2017 Fall Meeting. Available online: https://agu.confex.com/agu/fm17/meetingapp.cgi/Paper/222706 (accessed on 24 October 2017).
  19. ObsPy. Available online: https://github.com/obspy/obspy/wiki (accessed on 6 November 2017).
  20. SPECFEM3D. Available online: https://geodynamics.org/cig/software/specfem3d/ (accessed on 6 November 2017).
  21. PH5: What Is It? IRIS PASSCAL. Available online: https://www.passcal.nmt.edu/content/ph5-what-it (accessed on 18 October 2017).
  22. Krischer, L.; Smith, J.; Lei, W.; Lefebvre, M.; Ruan, Y.; Andrade, E.S.; Podhorszki, N.; Bozdag, E.; Tromp, J. An Adaptable Seismic Data Format. Geophys. J. Int. 2016, 207, 1003–1011. [Google Scholar] [CrossRef]
Figure 1. Illustration of the different levels of metadata and community standards used for each.
Informatics 04 00045 g001
Figure 2. Example schematic of the National Computational Infrastructure (NCI)’s data organizational structure using the Coupled Model Intercomparison Project (CMIP)) 5 collection. The CMIP 5 collection housed at NCI includes three sub-collections from The Commonwealth Scientific and Industrial Research Organisation (CSIRO) and Australian Bureau of Meteorology (BOM): (1) the ACCESS-1.0 model, (2) ACCESS-1.3 model, and (3) Mk 3.6.0 model. Each sub-collection then contains a number of datasets, such as “piControl” (pre-industrial control experiment), which then contains numerous granules (e.g., precipitation, “pr”). A complete description on the range of CMIP5 contents can be found at: https://pcmdi.llnl.gov/mips/cmip5/experiment_design.html.
Informatics 04 00045 g002
Table 1. The NCI Quality Control (QC) mandatory requirements. A full list of the Attribute Convention for Data Discovery (ACDD) metadata requirements used by NCI is provided in Appendix A.
Convention/StandardNCI RequirementsFurther Information
CFMandatory CF criteria, e.g., no “errors” result from any of the recommended compliance checkers http://cfconventions.org
ACDD *Required attributes are included within each file:
1. title
2. summary
3. source
4. date_created
http://wiki.esipfed.org/index.php/Attribute_Convention_for_Data_Discovery_1-3
* Modified version, please see Appendix A for more details.
Table 2. Description of basic accessibility and functionality tests that are applied for commonly used tools as part of NCI’s QA tests.
TestMeasures of Success
netCDF C-LibraryUsing the ‘ncdump-h <file>’ function from command line, the file is readable and displays the file header information about the file dimensions, variables, and metadata.
GDALUsing the ‘gdalinfo <file>’ function from command line, the file is readable and displays the file header information about the file dimensions, variables, and metadata.
Using the ‘gdalinfo NETCDF:<file>:<subdataset>’ function from command line, the subdatasets are readable and corresponding metadata for each subdataset is displayed.
The Open and GetMetadata functions return non-empty values that correspond to the netCDF file contents.
The GetProjection function (of the appropriate file or subdataset) returns a non-empty result corresponding to the data coordinate reference system information.
NCO (NetCDF Operators)Using the ‘ncks -m <file>’ function from command line, the file is readable and displays file metadata.
CDO (Climate Data Operators)Using the ‘cdo sinfon <file>’ function from command line, the file is readable and displays information on the included variables, grids, and coordinates.
FerretUsing SET DATA “<file>” followed by SHOW DATA displays information on file contents.
Using SET DATA “<file>” followed by SHADE <variable> (or another plotting command) produces a plot of the requested data.
Thredds Data ServerDataset index catalog page loads without timeout and within reasonable time expectations (<10 s)
Thredds Data Service EndpointsHTTP Download: File download commences when selected the HTTPServer option from the THREDDS catalog page for the file.
OPeNDAP: When selecting OPeNDAP from the THREDDS catalog page for the file, the OPeNDAP Dataset Access Form page loads without error. From the OPeNDAP Dataset Access Form page, a data subset is returned in ASCII format after selecting data and clicking the Get ASCII option at the top of the page.
Godiva2: When selecting the Godiva2 viewer option from the THREDDS catalog page for the file, the viewer displays the file contents.
WMS: When selecting the WMS option from the THREDDS catalog page for the file, the web browser displays the GetCapabilities information in xml format. After constructing a GetMap request, the web browser displays the corresponding map.
WCS: When selecting the WCS option from the THREDDS catalog page for the file, the web browser displays the GetCapabilities information in xml format. After constructing a GetCoverage request, file download of coverage commences.
PanoplyFrom the File → Open menu, the file can be opened. File contents and metadata displayed.
Using Create Plot for a selected variable, data is displayed correctly in new plot window.
QGISUsing the Add WMS/WMTS menu option, QGIS can request GetCapabilities and/or GetMap operations and layer is visible.
The ncWMS GetCapabilities URL accepts and adds the NCI THREDDS Server, the request displays the available layers to select from, and a selected layer displays according to user expectations.
NASA Web WorldWindThe ncWMS GetCapabilities URL accepts and adds the NCI THREDDS Server, the request displays the available layers to select from, and a selected layer displays according to user expectations.
PYTHON cdms2The file can be opened by the Open function.
File metadata is displayed using attributes function.
File data contents are displayed when using variables function.
PYTHON netCDF4The file can be opened by the Dataset function.
File metadata is displayed using ncattrs object.
File data contents are displayed using variables (and/or groups) objects.
PYTHON h5pyThe netcdf file can be opened by the File function.
The metadata and variables are displayed by the keys and attrs objects.
ParaViewFrom the File → Open menu, the file can be opened and displayed as a layer in the Pipeline Browser. Enabling layer visibility results in data displaying in Layout window.
Table 3. Data structure of the sample files used in the benchmark tests.
AttributesFile 1File 2File 3
lon (double)Size57175950140954
Chunksize128128128
lat (double)Size41824188234761
Chunksize128128128
Variable(float)Namegrav_ir_anomalymag_tmi_rtp_anomalyrad_air_dose_rate
Size(4182,5717)(41882,59501)(34761,40954)
Chunksize(128,128)(128,128)(128,128)
Deflate Level 222
Format netCDF-4 classic modelnetCDF-4 classic modelnetCDF-4 classic model
Table 4. Benchmark results (in sec.).
Program/ServiceTestFile 1File 2File 3
NetCDF Utilitiesncdump8.6305584.4143246.879
h5dump40.5473546.9992373.483
Python (2.7.x) netCDF APIsnetCDF4-python (1.2.7)0.44548.60329.160
GDAL-python (1.11.1)0.42142.65425.538
h5py (v2.6.0)0.35640.10523.826
THREDDS Data Server (TDS)netCDF4-python (1.2.7)3.087282.797185.358
OPeNDAP (TDS v4.6.6)3.038277.21194.85
netCDF Subset Service (TDS v4.6.6)2.833248.194158.236

