Analysis of Multi-Loop Control Structures of Dividing-Wall Distillation Columns Using a Fundamental Model


Abstract
:1. Introduction

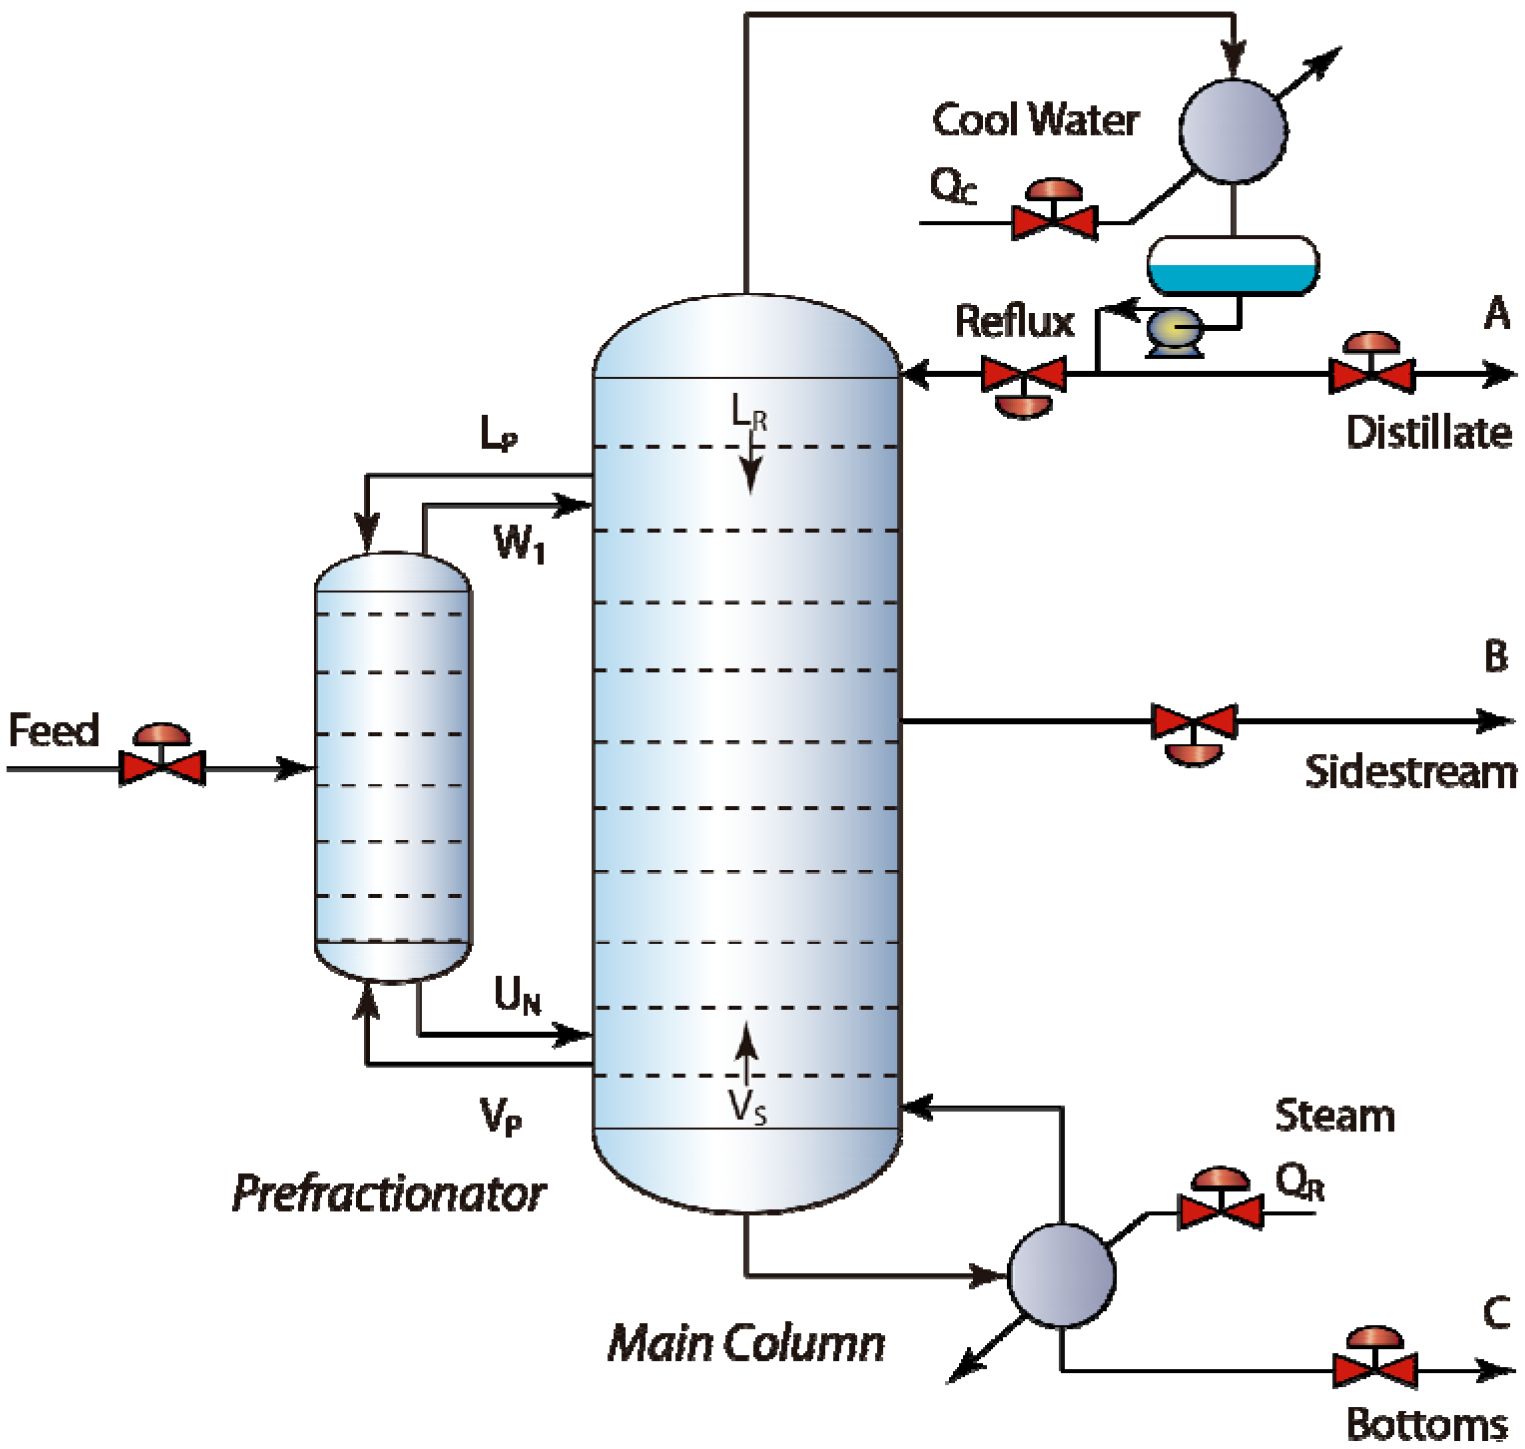
2. Design and Modeling of DWCs
2.1. Design of DWCs
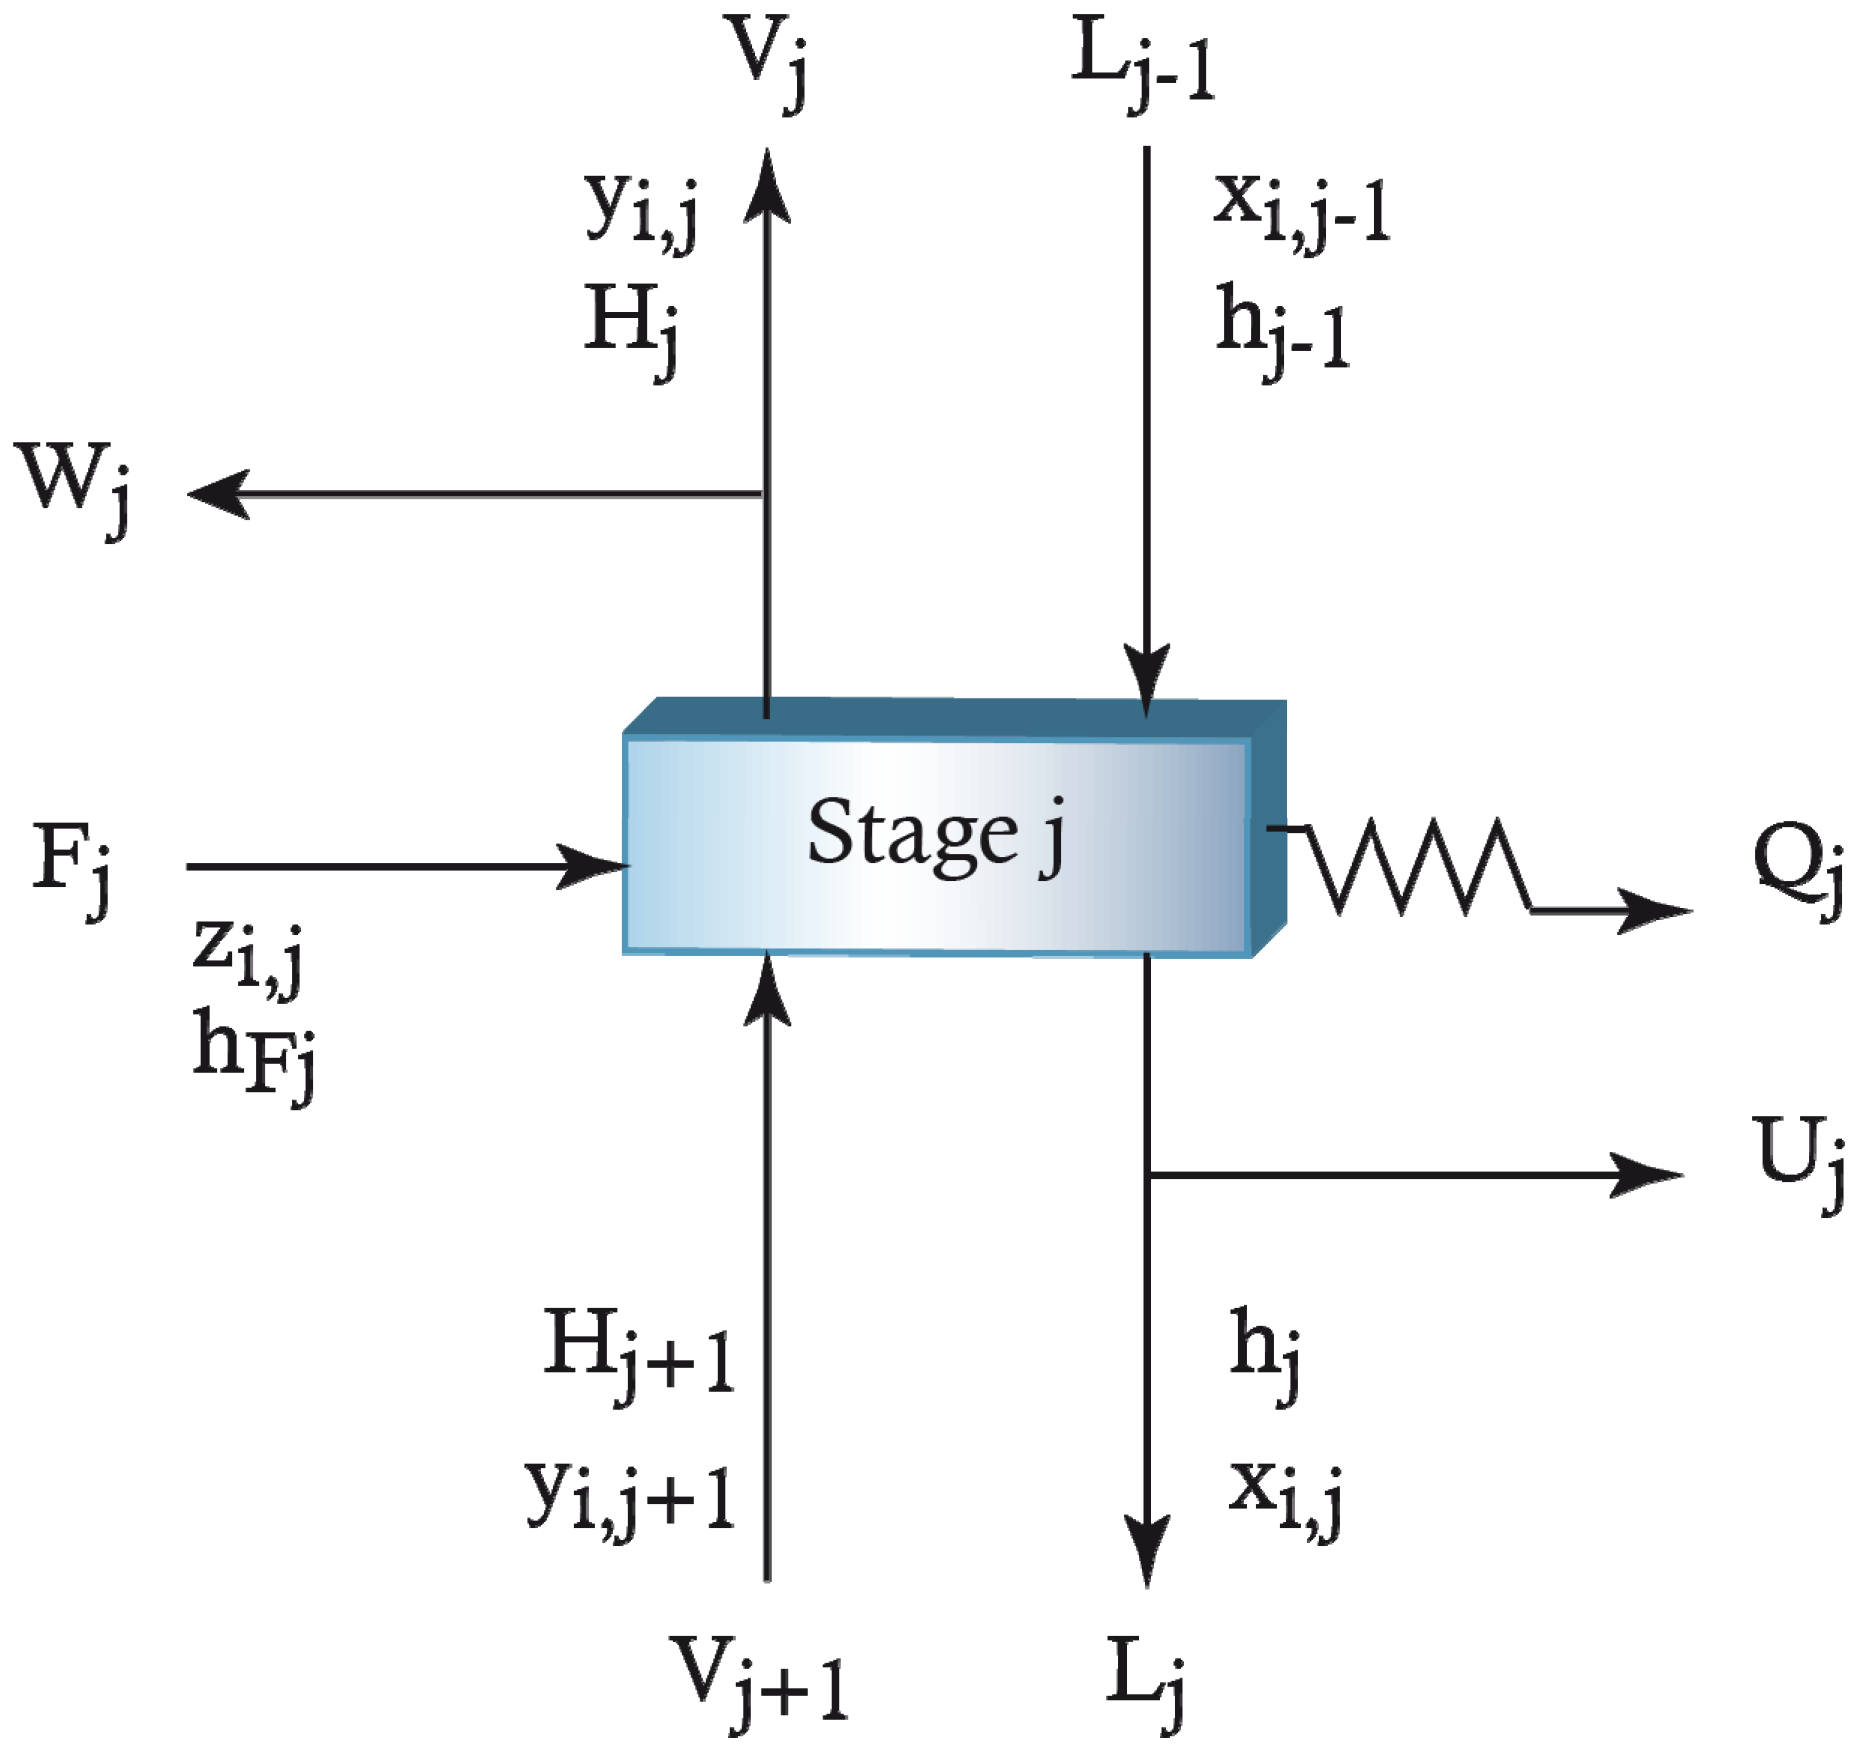
2.2. Model Equations
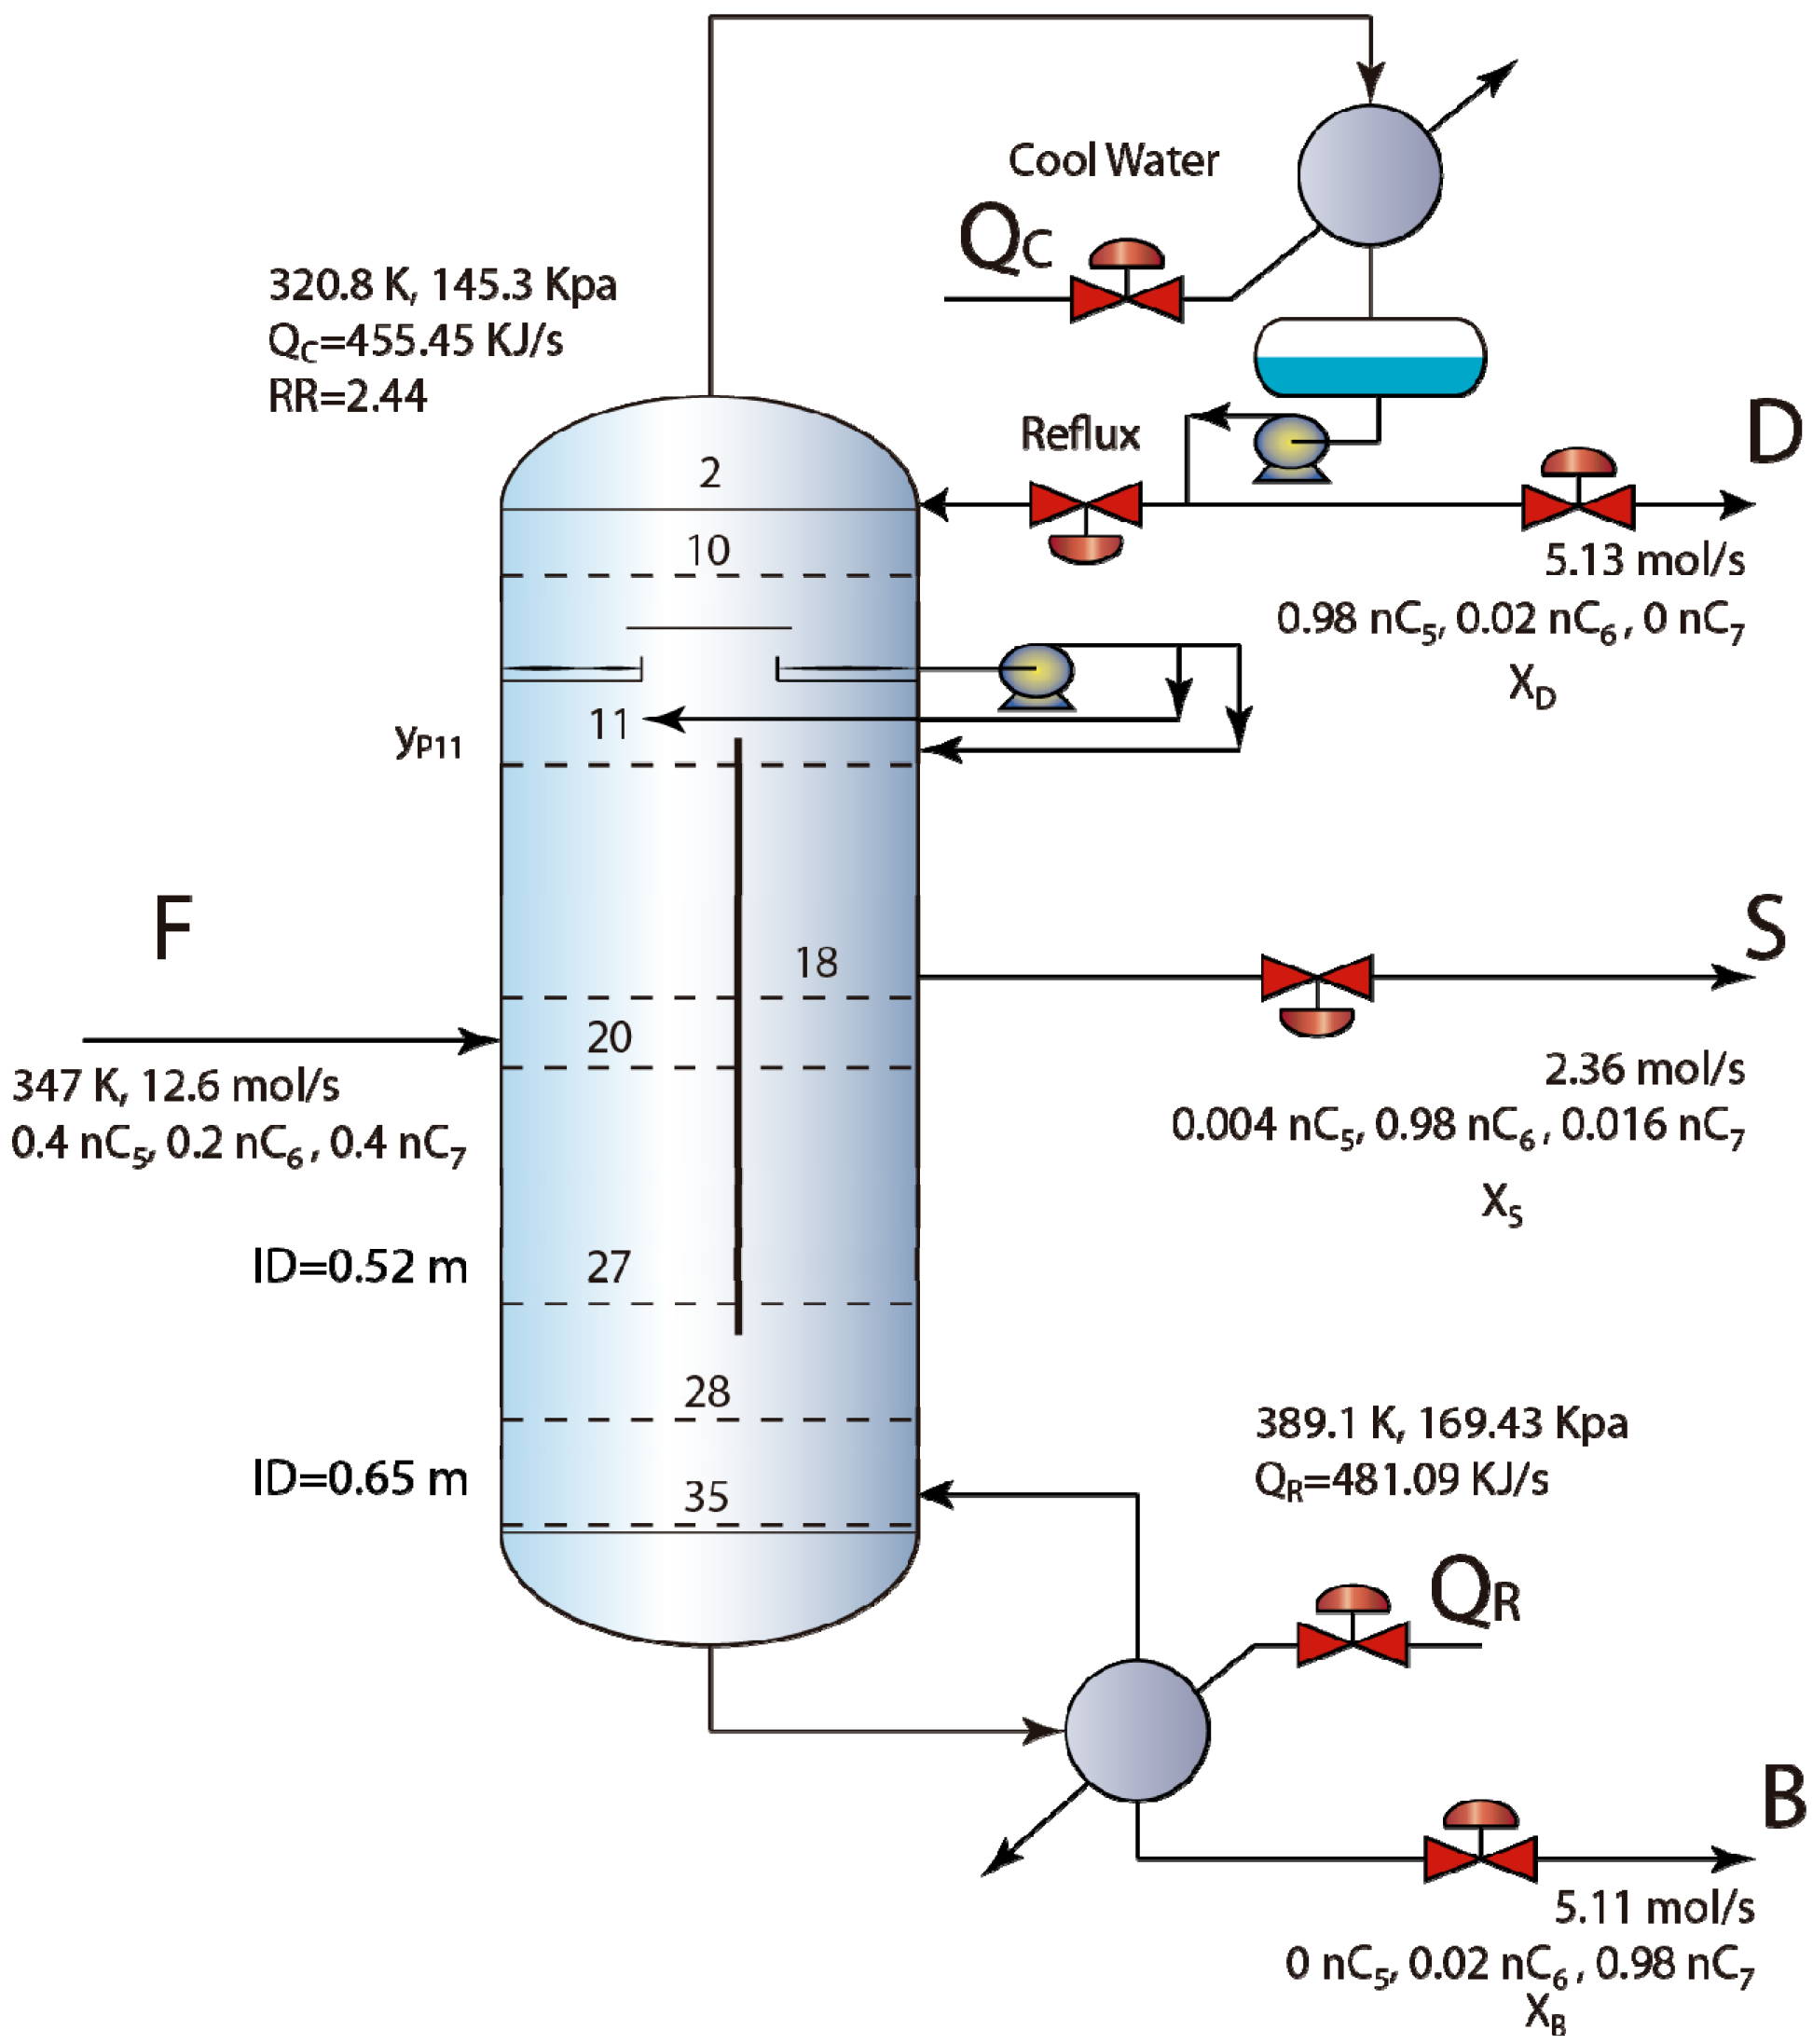
3. Investigated Column and Controller Design

| Mixture | Components (A,B,C) | ESI |
|---|---|---|
| M1 | n-pentane, n-hexane, n-heptane | 1.04 |
| M2 | n-butane, i-pentane, n-pentane | 1.86 |
| M3 | i-pentane, n-pentane, n-hexane | 0.47 |
| M4 | benzene, toluene, ethylbenzene | 0.98 |


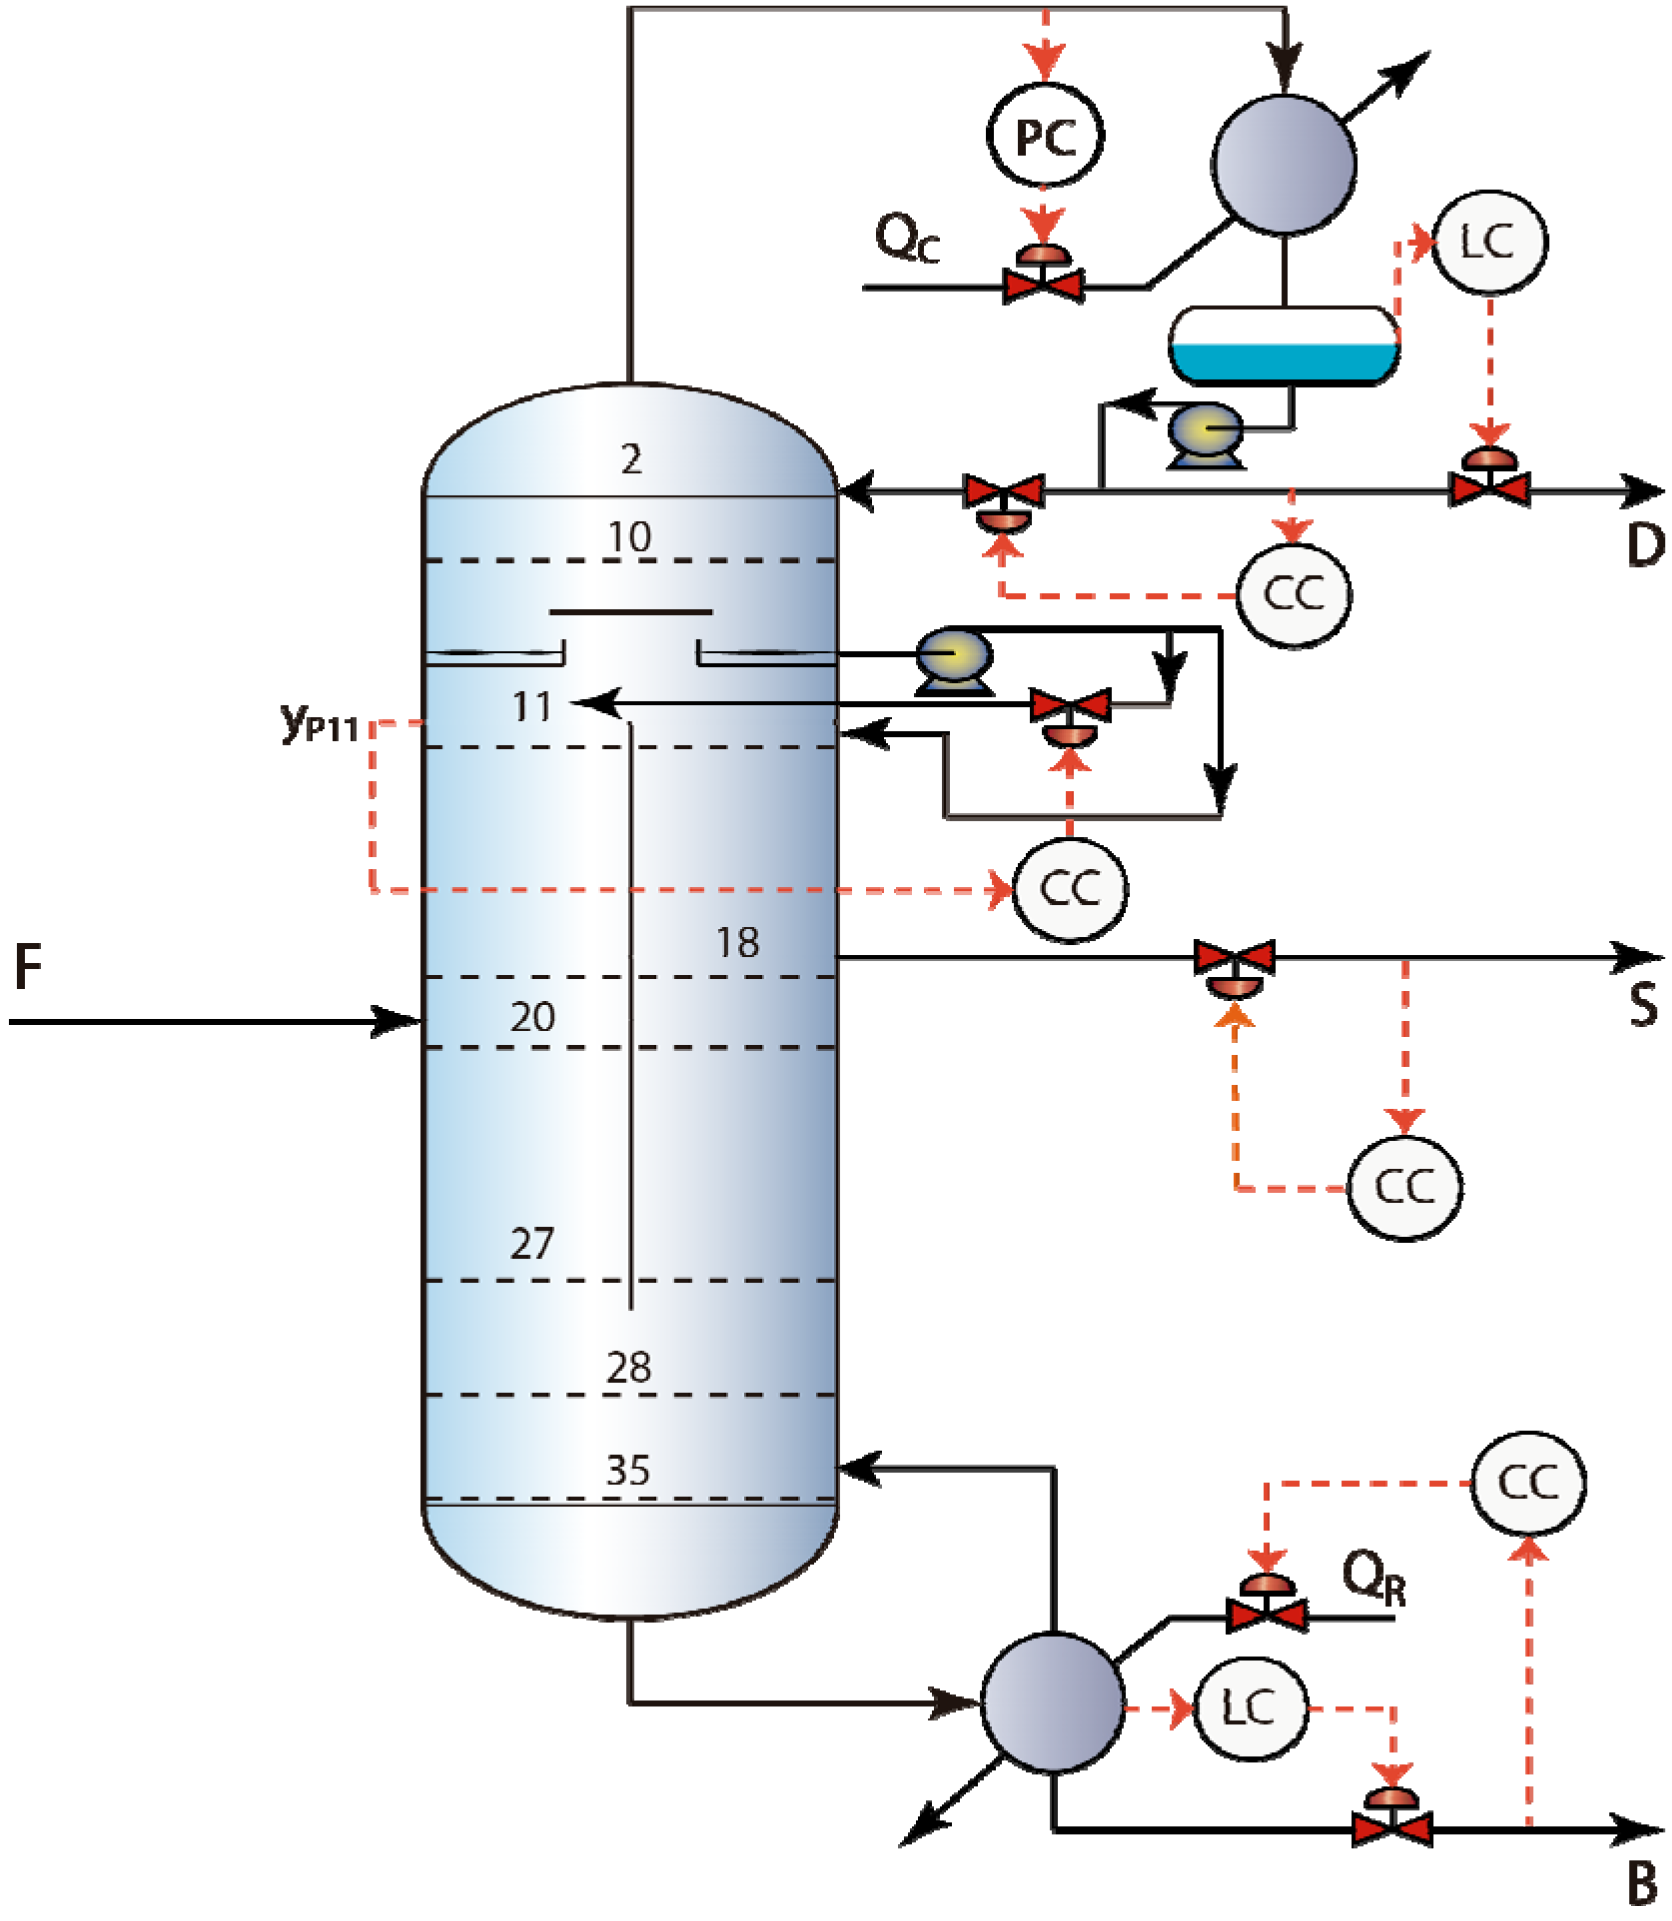
3.1. RGA Analysis and PI Controller Tuning
| L1 | S | QR | βL | |
|---|---|---|---|---|
| xA |  |  |  |  |
| xB |  |  |  |  |
| xc |  |  |  |  |
| yp11 |  |  |  |  |
| L1 | S | QR | βL | |
|---|---|---|---|---|
| xA | 1.1938 | −0.0015 | −0.1880 | −0.0043 |
| xB | 0.2409 | 0.8407 | −0.0688 | −0.0127 |
| xc | −0.3074 | 0.1629 | 1.3019 | −0.1574 |
| yp11 | −0.1273 | −0.0021 | −0.0449 | 1.1743 |

| Control structure-Controlled variable | Manipulated variable | τc (min) | Kc (%/%) | τI(min) |
|---|---|---|---|---|
| DB-LSV | ||||
| xD(nC5) | L1 | 13.65 | 2.778 | 46.77 |
| xS(nC6) | S | 14.68 | 8.613 | 73.43 |
| xB(nC7) | QR | 7.72 | 3.553 | 41.38 |
| yp11(nC7) | βL | 16.57 | 0.3851 | 83.38 |
| DV-LSB | ||||
| xD(nC5) | L1 | 15.87 | 2.938 | 39.68 |
| xS(nC6) | S | 10.01 | 65.98 | 33.35 |
| xB(nC7) | B | 6.77 | 13.83 | 45.14 |
| yp11(nC7) | βL | 16.56 | 0.3825 | 82.83 |
| LB-DSV | ||||
| xD(nC5) | D | 29.50 | 3.855 | 59.01 |
| xS(nC6) | S | 39.76 | 54.88 | 79.52 |
| xB(nC7) | QR | 7.88 | 4.983 | 52.57 |
| yp11(nC7) | βL | 16.59 | 0.3885 | 83.02 |
| LV-DSB | ||||
| xD(nC5) | D | 28.38 | 4.44 | 56.77 |
| xS(nC6) | S | 13.86 | 176.3 | 27.72 |
| xB(nC7) | B | 18.18 | 14.9 | 90.94 |
| yp11(nC7) | βL | 16.59 | 0.3873 | 82.24 |
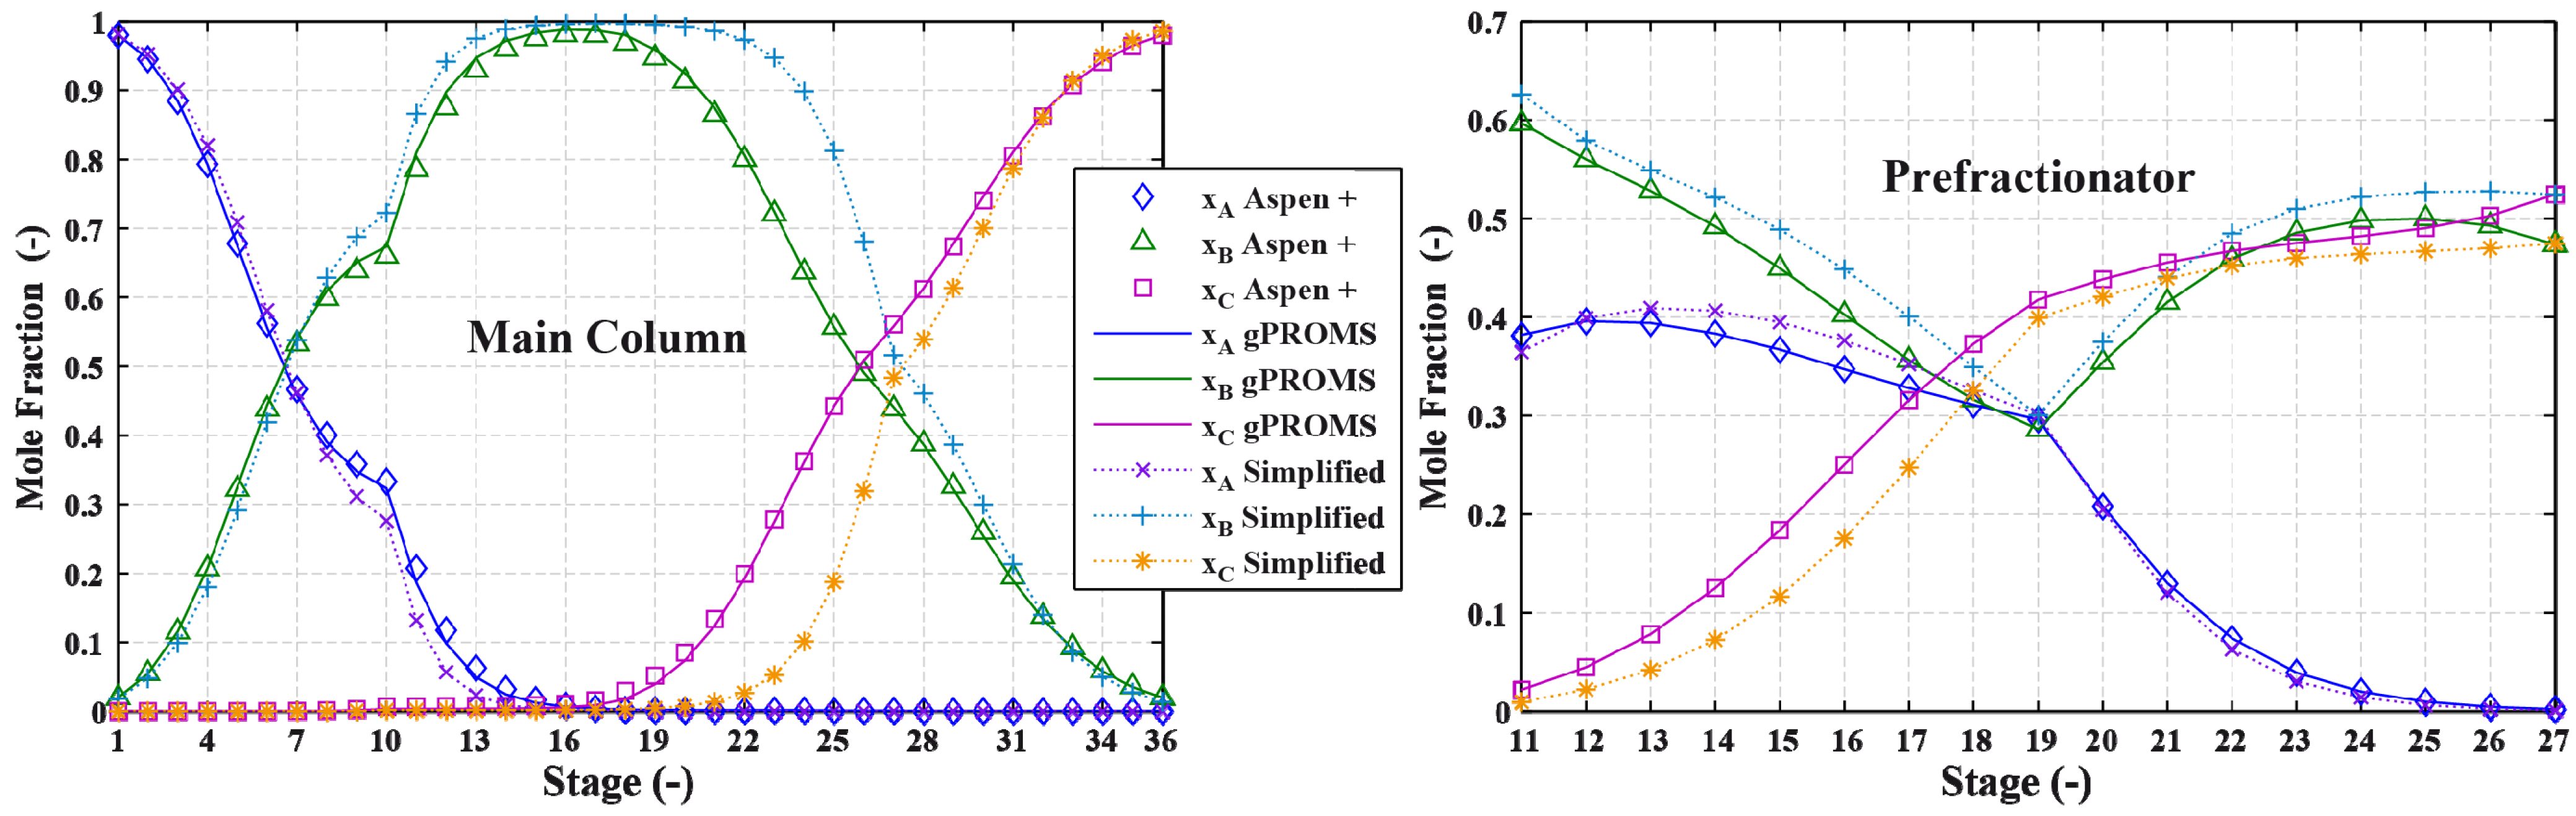
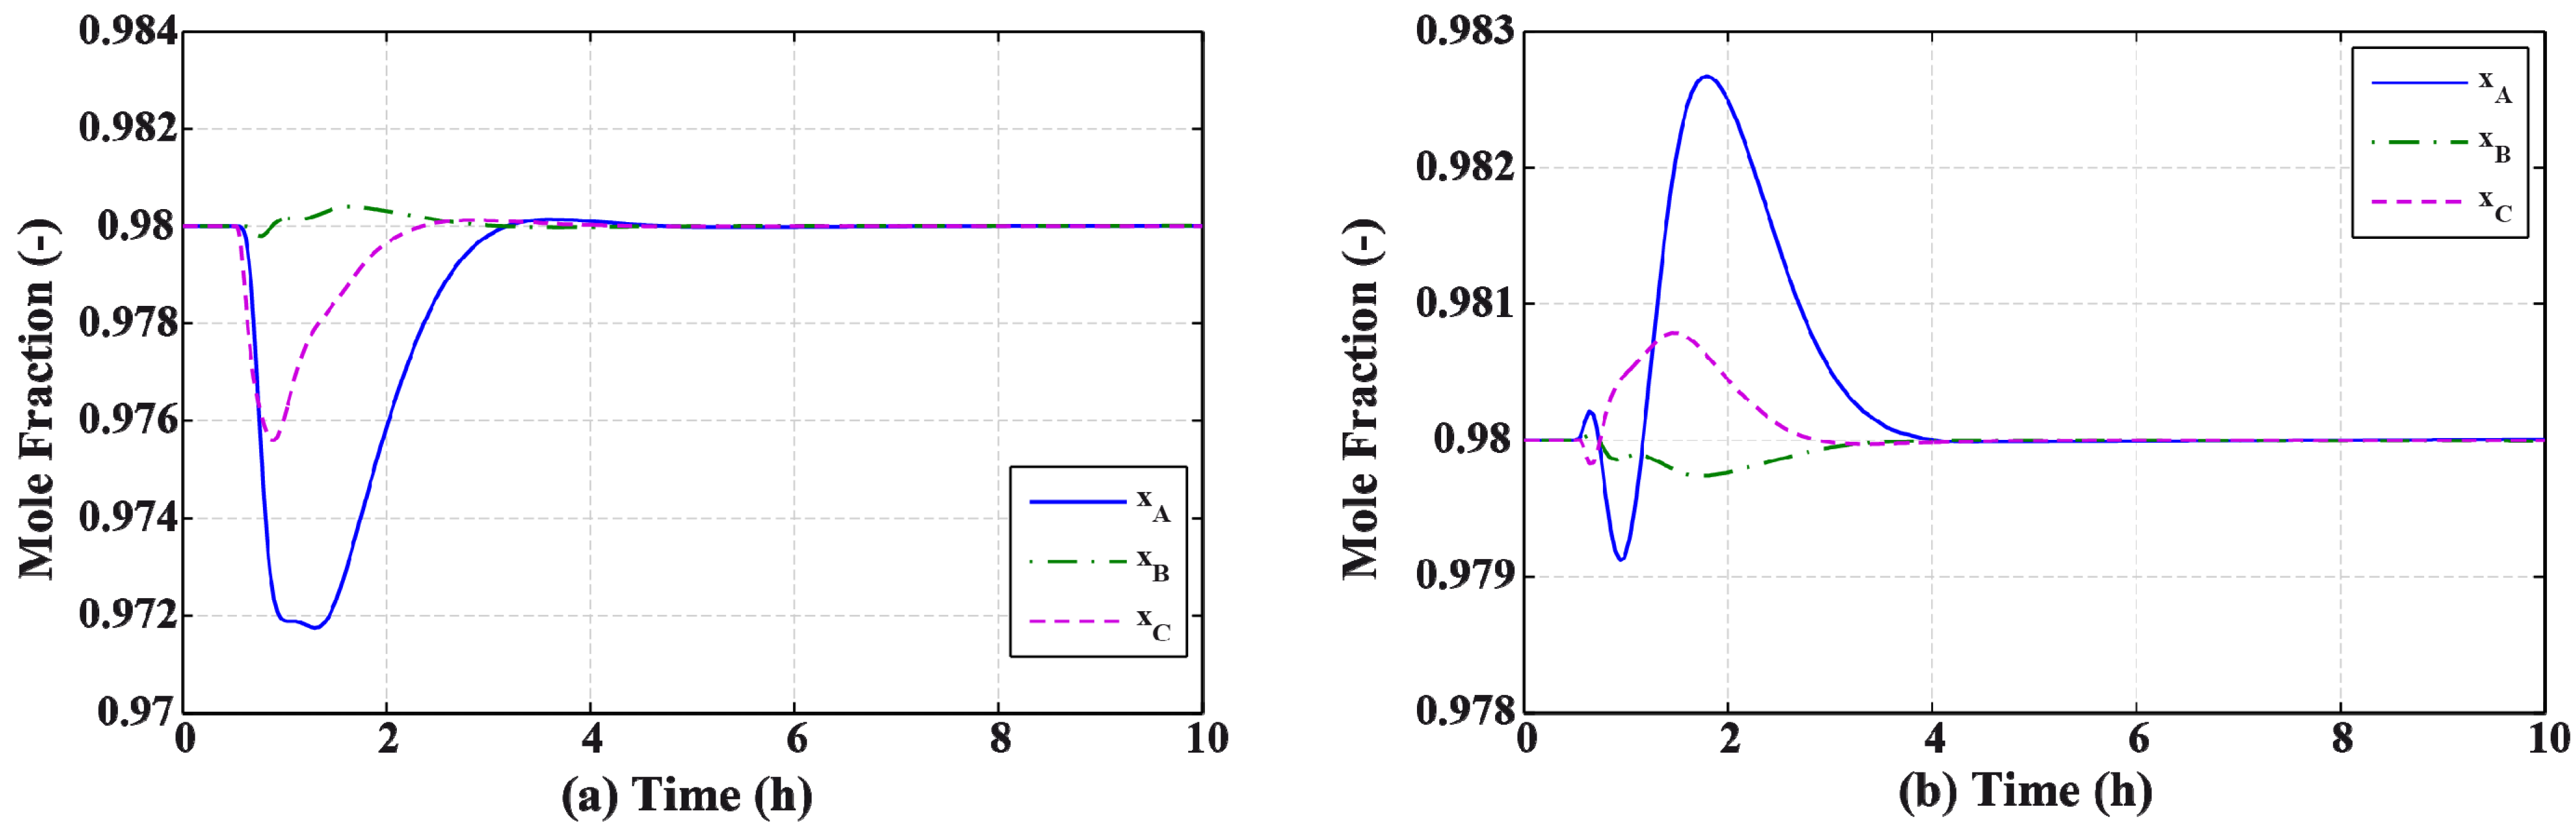
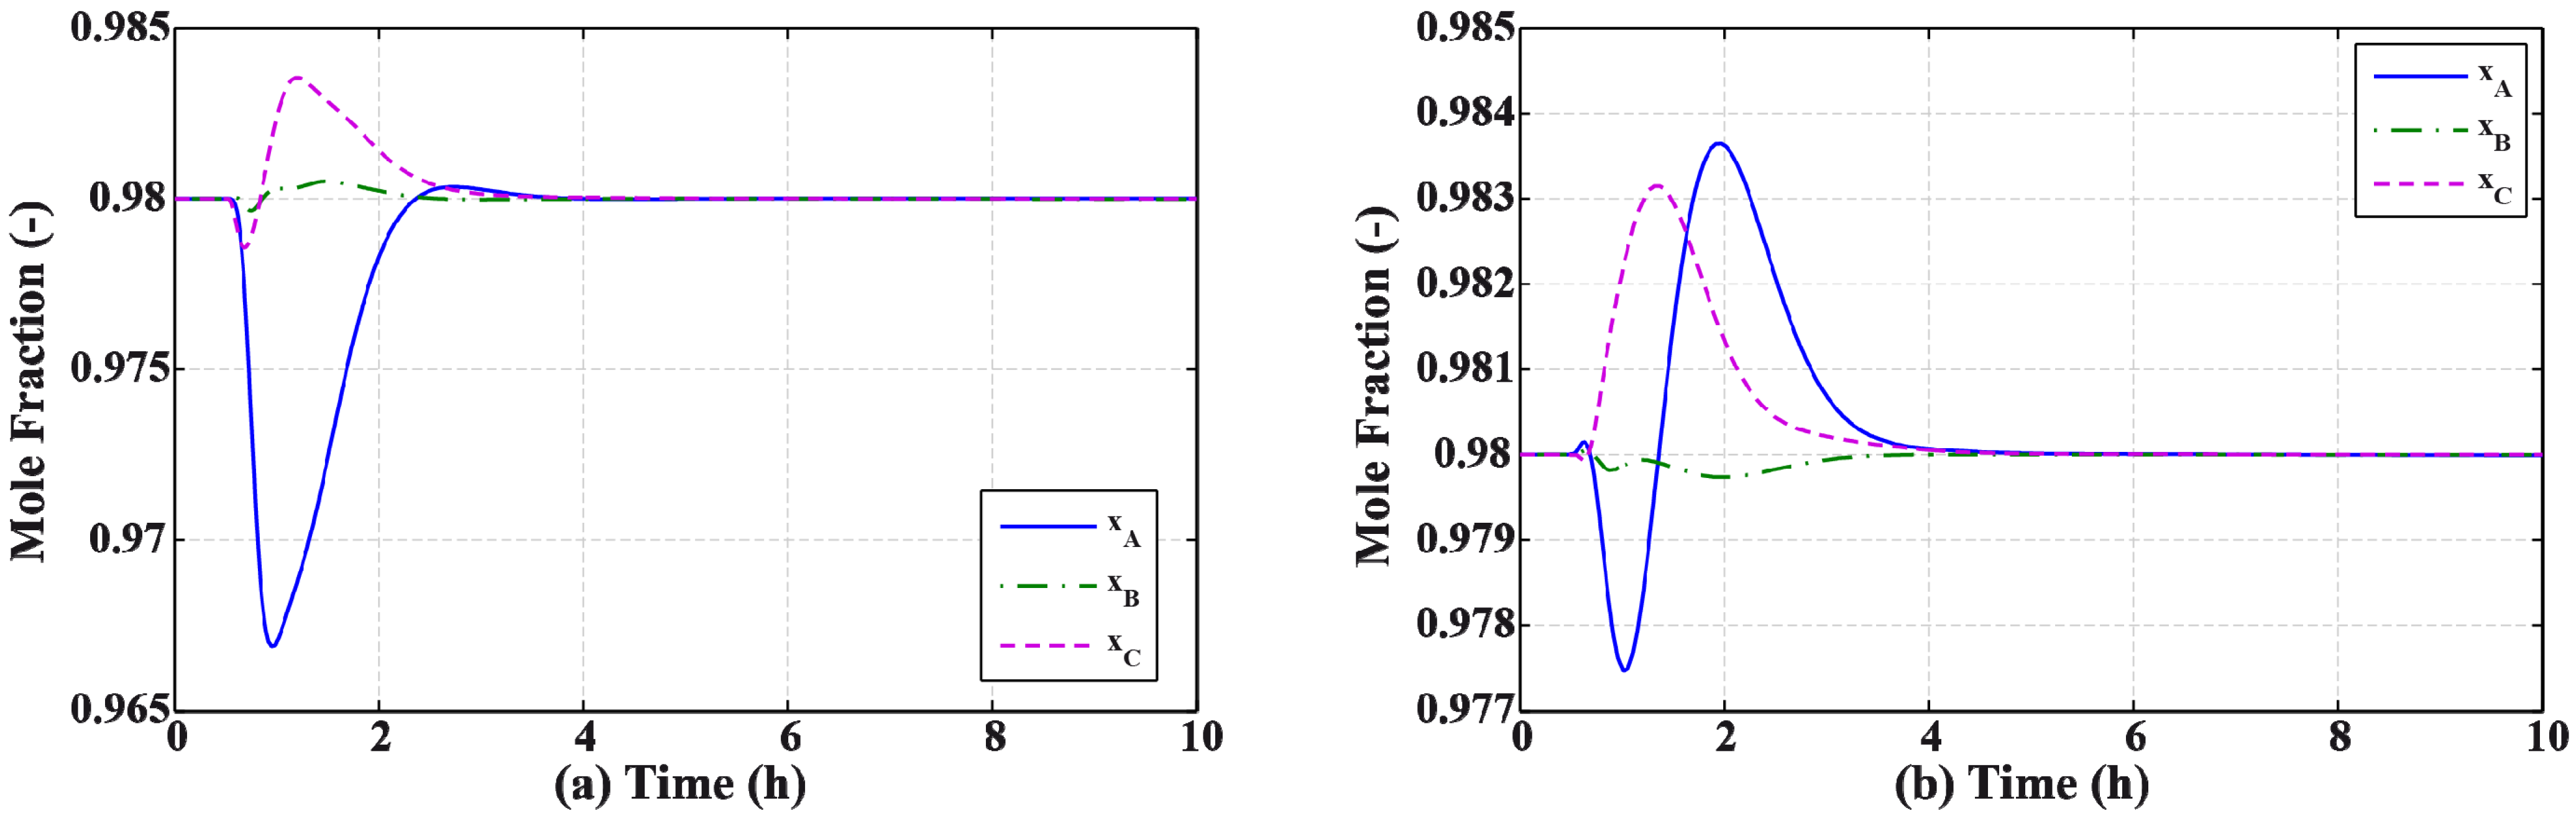
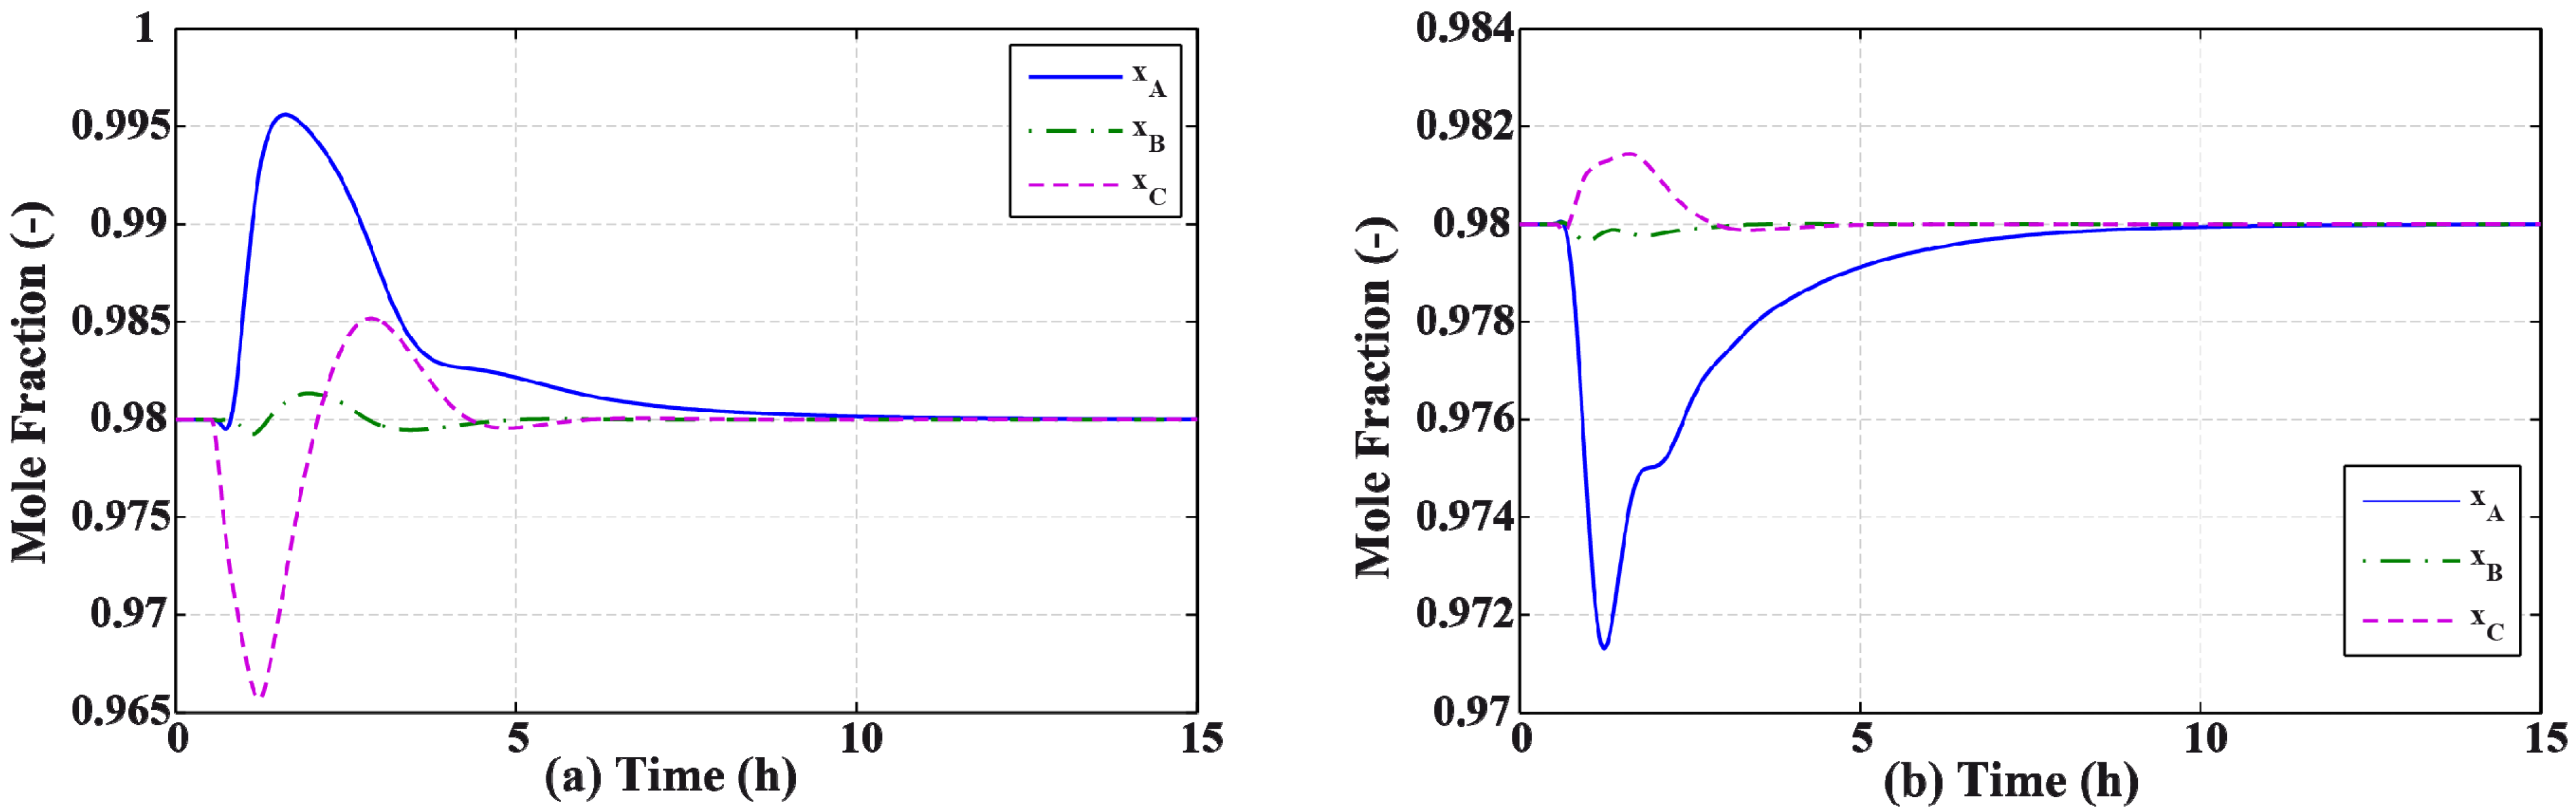
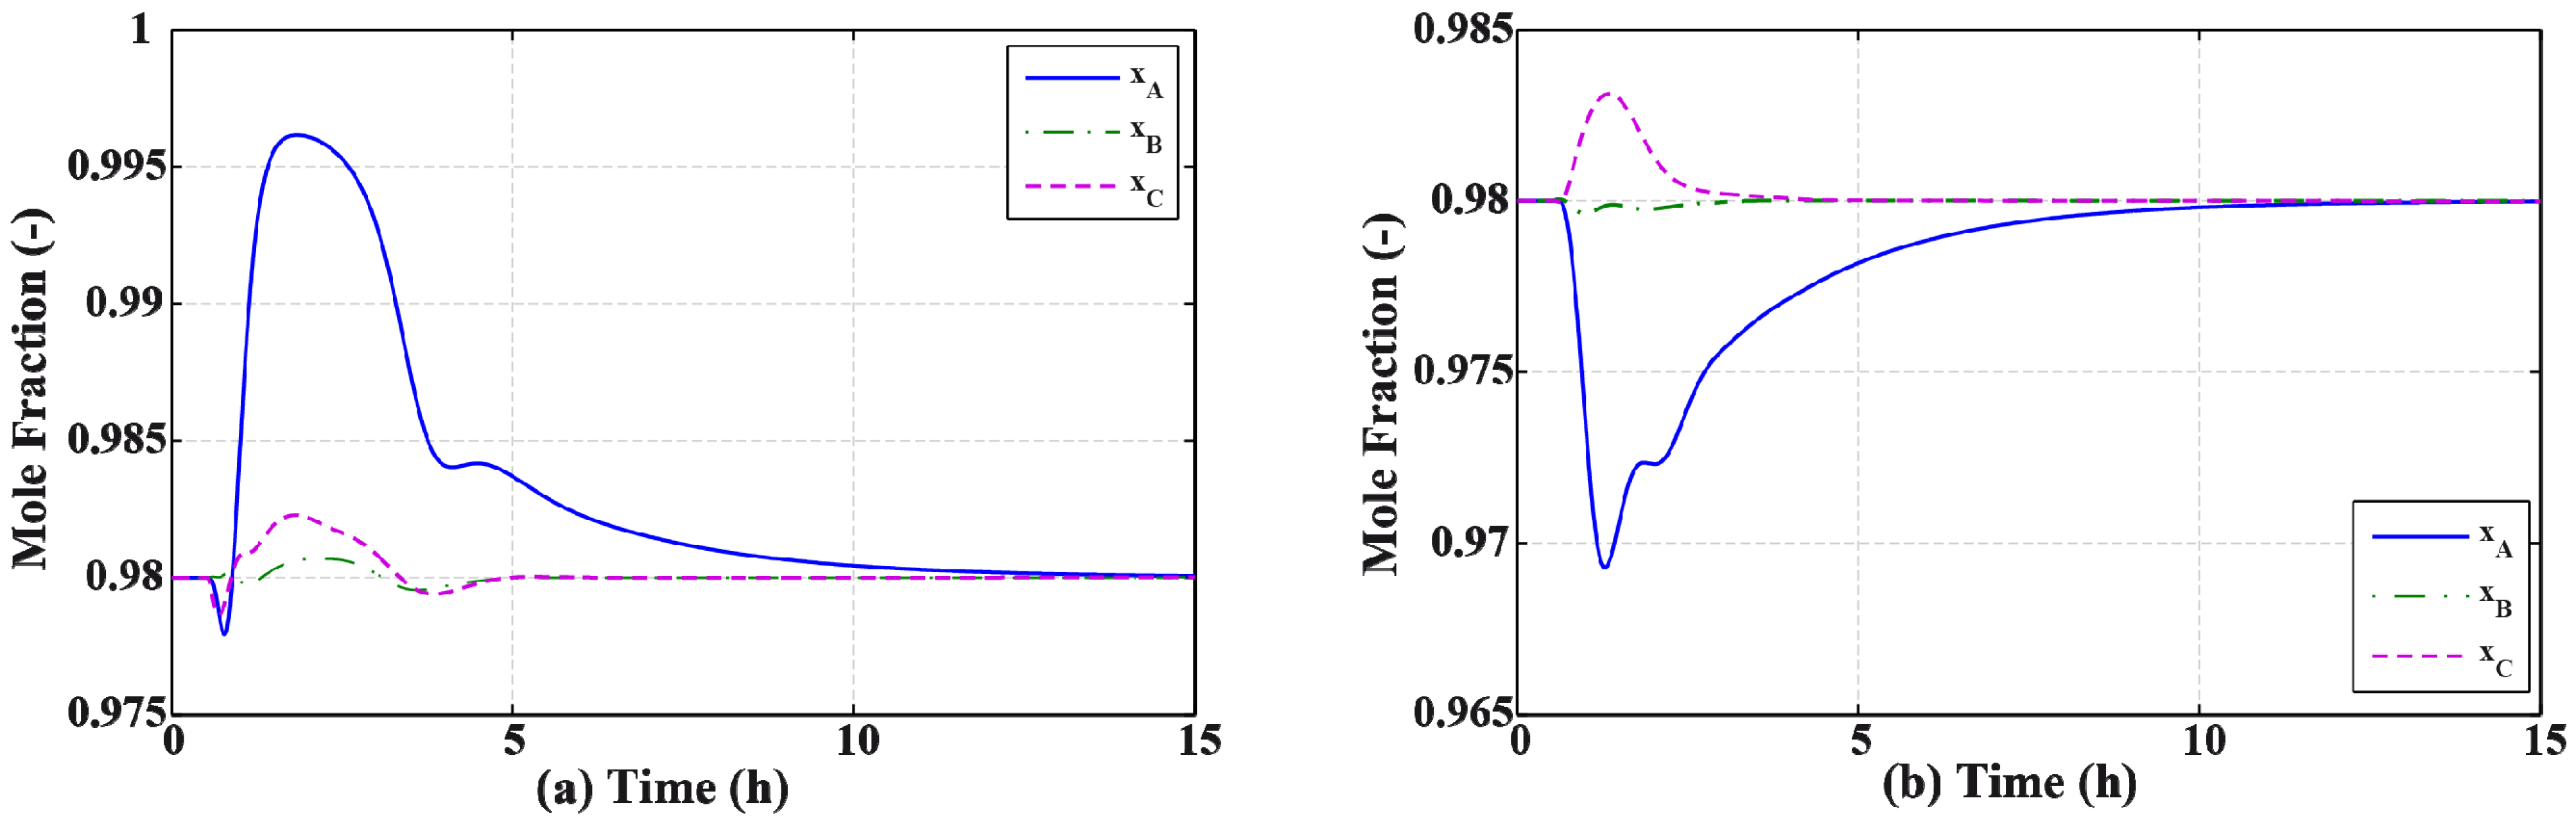
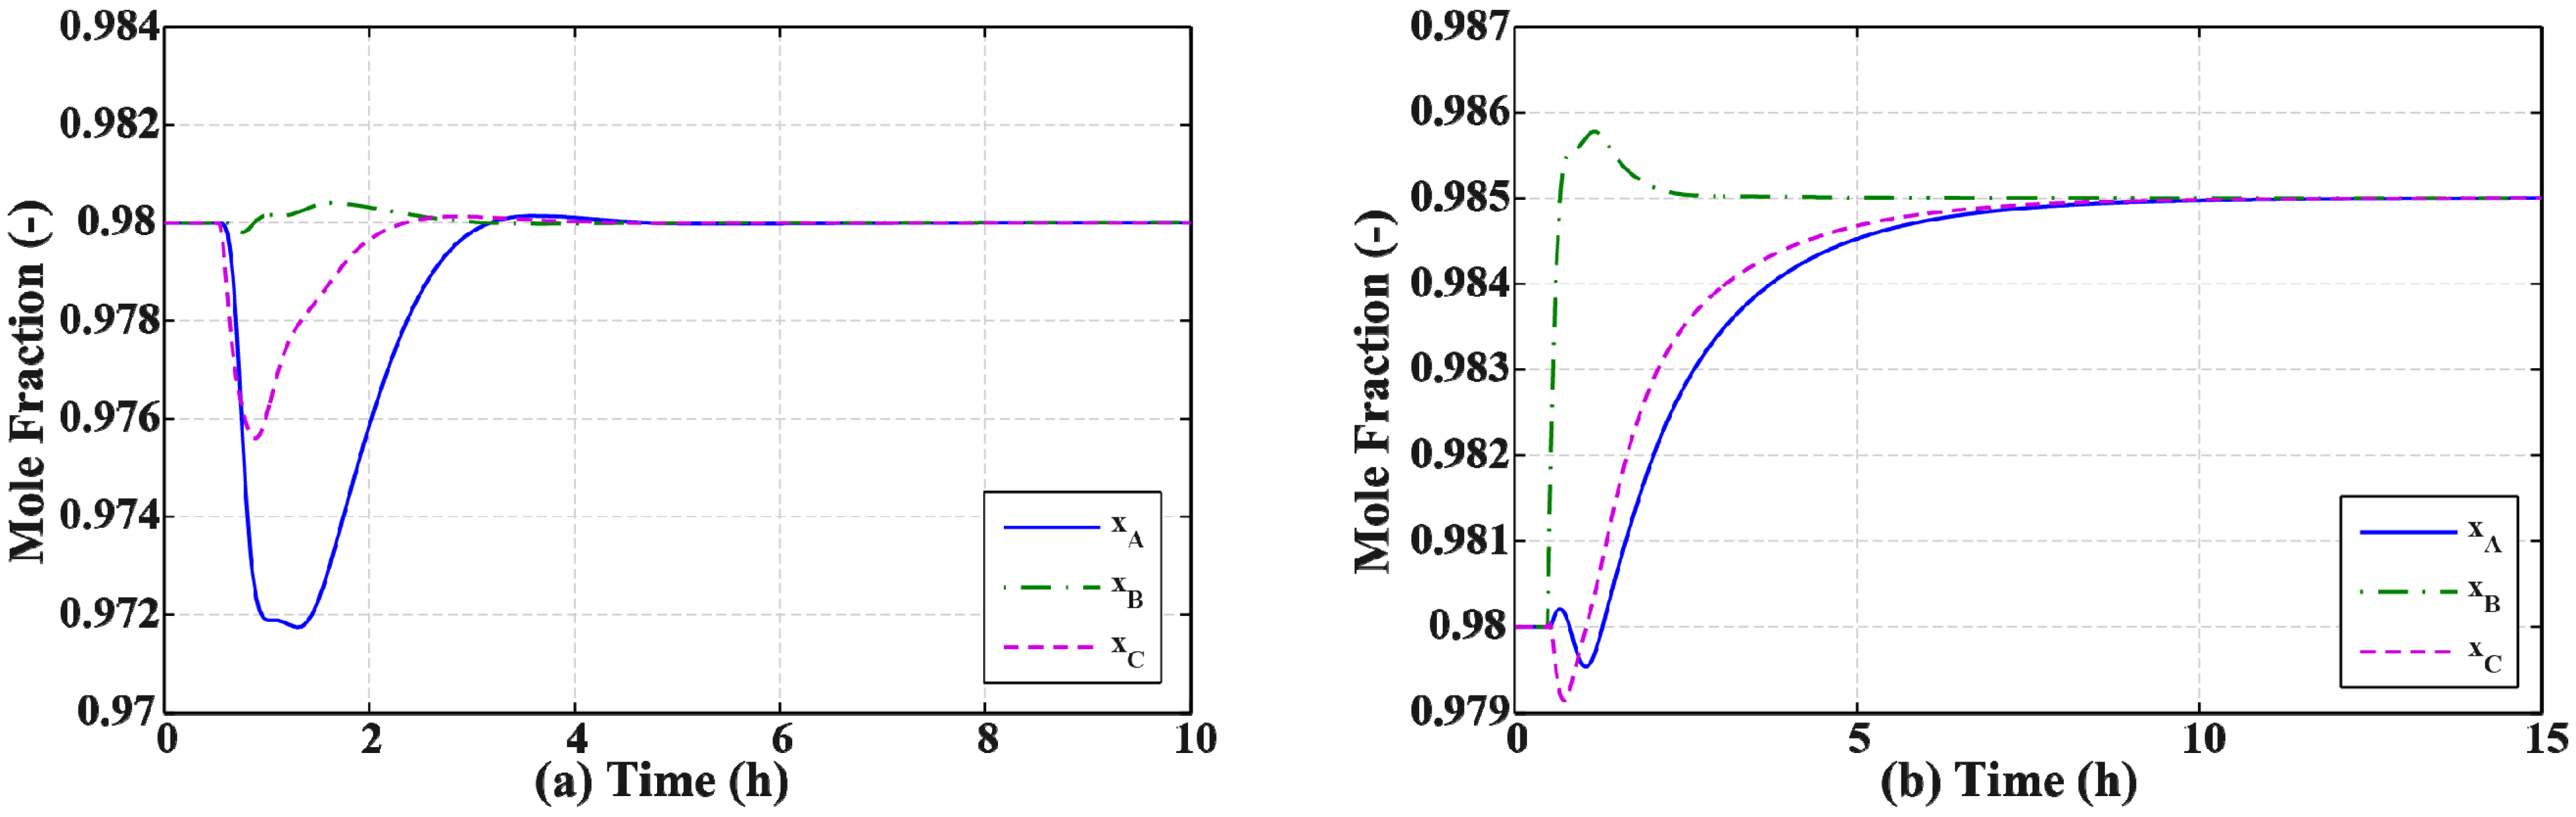
3.2. Results and Discussion


4. Effect of Mixture Properties on Control Structure Selection
| Mixture | RR | Nmain | Nprefrac | NL | NV | NS | QR/[KW] | βL | βV |
|---|---|---|---|---|---|---|---|---|---|
| M1F1 | 2.44 | 36 | 17 | 11 | 28 | 18 | 481.09 | 0.3849 | 0.6571 |
| M1F2 | 10.19 | 37 | 37 | 11 | 28 | 17 | 576.23 | 0.3611 | 0.6947 |
| M2F1 | 16.62 | 93 | 21 | 11 | 60 | 21 | 1839.67 | 0.1497 | 0.1893 |
| M2F2 | 43.72 | 99 | 21 | 11 | 66 | 21 | 1732.19 | 0.1251 | 0.1619 |
| M3F1 | 8.48 | 80 | 62 | 33 | 73 | 63 | 1147.89 | 0.1680 | 0.3035 |
| M3F2 | 29.18 | 80 | 59 | 33 | 72 | 62 | 1243.35 | 0.1457 | 0.2733 |
| M4F1 | 2.05 | 37 | 18 | 10 | 27 | 17 | 526.23 | 0.4960 | 0.7548 |
| M4F2 | 9.16 | 42 | 16 | 9 | 31 | 17 | 634.77 | 0.2268 | 0.5570 |
| Mixture | Components (A,B,C) | ESI | BEST CONTROL STRUCTURE | |
|---|---|---|---|---|
| F1 | F2 | |||
| M1 | n-pentane, n-hexane, n-heptane | 1.04 | DB-LSV | LB-DSV |
| M2 | n-butane, i-pentane, n-pentane | 1.86 | LB-DSV | LB-DSV |
| M3 | i-pentane, n-pentane, n-hexane | 0.47 | DB-LSV | DV-LSB |
| M4 | benzene, toluene, ethylbenzene | 0.98 | DB-LSV | DV-LSB |
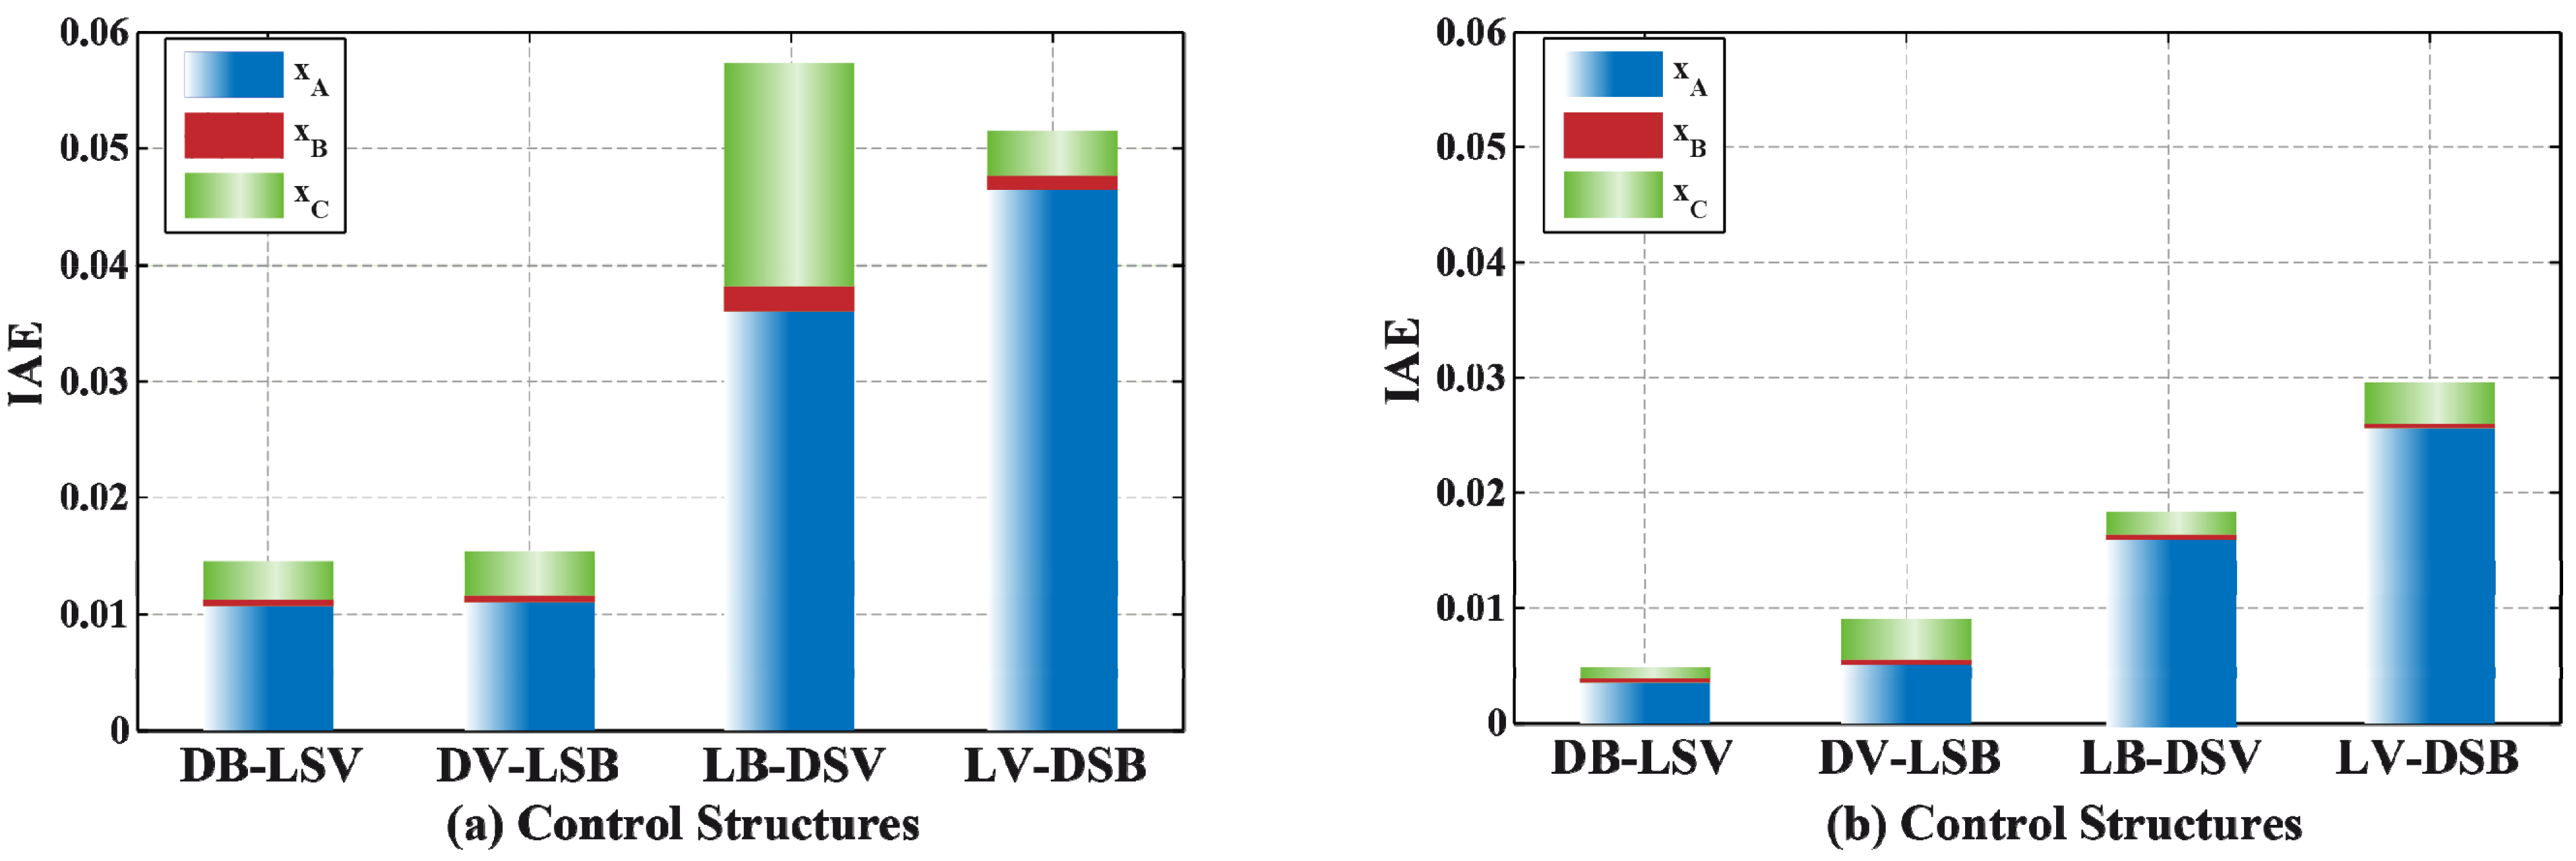
| Mixture/Feed Composition | Controlled variable | Flow Rate Disturbance | Composition Disturbance | ||||||
|---|---|---|---|---|---|---|---|---|---|
| Structure | DB-LSV | DV-LSB | LB-DSV | LV-DSB | DB-LSV | DV-LSB | LB-DSV | LV-DSB | |
| M1F1 | xA | 0.01077 | 0.01107 | 0.03661 | 0.04963 | 0.00355 | 0.00507 | 0.01595 | 0.02560 |
| xB | 0.00050 | 0.00053 | 0.00218 | 0.00144 | 0.00039 | 0.00039 | 0.00041 | 0.00043 | |
| xC | 0.00328 | 0.00376 | 0.01931 | 0.00433 | 0.00094 | 0.00358 | 0.00199 | 0.00357 | |
| Overall | 0.01455 | 0.01536 | 0.05811 | 0.05541 | 0.00488 | 0.00903 | 0.01835 | 0.02960 | |
| M1F2 | xA | 0.02701 | 0.01982 | 0.00449 | 0.06340 | 0.00331 | 0.00259 | 0.00202 | 0.02894 |
| xB | 0.00231 | 0.00207 | 0.00231 | 0.00247 | 0.00027 | 0.00029 | 0.00029 | 0.00050 | |
| xC | 0.00658 | 0.00239 | 0.00692 | 0.00337 | 0.00050 | 0.00263 | 0.00056 | 0.00274 | |
| Overall | 0.03590 | 0.02428 | 0.01372 | 0.06924 | 0.00409 | 0.00551 | 0.00287 | 0.03219 | |
| M2F1 | xA | 0.14802 | 0.14760 | 0.00293 | 0.00264 | 0.20397 | * | 0.00172 | 0.00162 |
| xB | 0.10982 | 0.10965 | 0.00187 | 0.00181 | 9.84515 | * | 0.00083 | 0.00083 | |
| xC | 0.00269 | 0.00088 | 0.00080 | 0.00251 | 0.00374 | * | 0.00019 | 0.00091 | |
| Overall | 0.26053 | 0.25813 | 0.00559 | 0.00697 | 10.05287 | * | 0.00274 | 0.00335 | |
| M2F2 | xA | 0.28814 | * | 0.01153 | * | 0.32005 | * | 0.00568 | * |
| xB | 0.00764 | * | 0.00268 | * | 0.01081 | * | 0.00094 | * | |
| xC | 0.02220 | * | 0.00569 | * | 0.02285 | * | 0.00153 | * | |
| Overall | 0.31799 | * | 0.01989 | * | 0.35371 | * | 0.00815 | * | |
| M3F1 | xA | 0.00852 | 0.00454 | 0.02430 | 0.02424 | 0.00037 | * | 0.02763 | 0.02796 |
| xB | 0.02075 | 0.01146 | 0.06875 | 0.06074 | 0.00037 | * | 0.01832 | 0.01832 | |
| xC | 0.01375 | 0.02858 | 0.01960 | 0.01686 | 0.00139 | * | 0.00625 | 0.00348 | |
| Overall | 0.04303 | 0.04458 | 0.11264 | 0.10185 | 0.00213 | * | 0.05219 | 0.04976 | |
| M3F2 | xA | 0.02714 | 0.00742 | * | * | 0.00857 | 0.00283 | * | * |
| xB | 0.01551 | 0.00813 | * | * | 0.00310 | 0.00141 | * | * | |
| xC | 0.06955 | 0.00859 | * | * | 0.02707 | 0.00280 | * | * | |
| Overall | 0.11220 | 0.02414 | * | * | 0.03873 | 0.00705 | * | * | |
| M4F1 | xA | 0.04206 | 0.04084 | 0.06167 | 0.05524 | 0.01631 | 0.01211 | 0.02310 | 0.02050 |
| xB | 0.01527 | 0.04995 | 0.07069 | 0.07444 | 0.00200 | 0.00146 | 0.00099 | 0.00132 | |
| xC | 0.02281 | 0.02386 | 0.02678 | 0.02353 | 0.00268 | 0.00225 | 0.00204 | 0.00225 | |
| Overall | 0.08014 | 0.11465 | 0.15914 | 0.15321 | 0.02099 | 0.01582 | 0.02613 | 0.02407 | |
| M4F2 | xA | 0.05396 | 0.02353 | 0.01004 | 0.00978 | 0.01836 | 0.00759 | 0.01831 | 0.01031 |
| xB | 0.00362 | 0.00444 | 0.00183 | 0.00303 | 0.00062 | 0.00117 | 0.00043 | 0.00054 | |
| xC | 0.02957 | 0.00875 | 0.01705 | 0.00621 | 0.00453 | 0.00423 | 0.00261 | 0.00258 | |
| Overall | 0.08715 | 0.03672 | 0.02893 | 0.01901 | 0.02351 | 0.01300 | 0.02135 | 0.01343 | |
5. Conclusions
Nomenclature
| Aholes | total area of all active holes |
| Atray | tray active area |
| B | bottoms flow rate |
| D | distillate flow rate |
| F | feed flow rate |
| g | Gravity |
| H | enthalpy of vapor |
| h | enthalpy of liquid |
| hweir | liquid height on weir |
| L | liquid flow rate |
| L1 | reflux flow rate |
| Lp | liquid flow rate fed to the prefractionator |
| LR | total liquid leaving the bottom tray in the rectifying section |
| K | vapor-liquid equilibrium constant |
| Kc | proportional gain |
| S | side product |
| Lweir | weir length |
| Nc | number of components in the mixture |
| Nmain | number of stages in the Main Column |
| Nprefrac | number of stages in the Prefractionator |
| NL | liquid interconnecting stage |
| NV | vapor interconnecting stage |
| NS | side stream stage |
| M | moles of liquid retained |
| MD | moles of liquid retained in the reflux drum |
| MNT | moles of liquid retained in the base of the column |
| Q | heat transferred |
| QC | condenser heat duty |
| QR | reboiler heat duty |
| RR | reflux ratio |
| U | liquid sidestream |
| V | vapor flow rate fed to the prefractionator |
| Vp | vapor flow rate |
| VS | total vapor leaving the top tray in the stripping section |
| W | vapor sidestream |
| x | liquid mole fraction |
| xA | mole fraction of A in the top product |
| xB | mole fraction of B in the sidestream product |
| xC | mole fraction of C in the bottoms product |
| y | vapor mole fraction |
| yp11 | mole fraction of the heavy component on stage 11 at the top of the prefractionator |
| z | mole fraction of the feed |
Greek Symbols
| α | dry-hole pressure drop coefficient |
| βL | liquid split |
| βV | vapor split |
| β | aeration factor |
| ρ | molar density |
| φL | liquid fugacity coefficient |
| φV | vapor fugacity coefficient |
| γ | liquid molar volume |
| τc | filter parameter |
| τp | time constant |
| τI | integral time |
| θ | dead time |
Subscripts and Superscripts
| L | liquid phase |
| V | vapor phase |
| i | component |
| NT | total number of stages |
| j | stage number |
Acknowledgments
Conflicts of Interest
Appendix


References
- Petlyuk, F.B.; Platonov, V.M.; Slavinskii, D.M. Thermodynamically optimal method for separating multicomponent mixtures. Int. Chem. Eng. 1965, 5, 555–561. [Google Scholar]
- Agrawal, R. A method to draw fully thermally coupled distillation column configurations for multicomponent distillation. Chem. Eng. Res. Des. 2000, 78, 454–464. [Google Scholar] [CrossRef]
- Dejanović, I.; Matijašević, L.; Olujić, Ž. Dividing wall column—A breakthrough towards sustainable distilling. Chem. Eng. Process.: Process Intensif. 2010, 49, 559–580. [Google Scholar] [CrossRef]
- Ben-Guang, R. Synthesis of dividing-wall columns (DWC) for multicomponent distillations—A systematic approach. Chem. Eng. Res. Des. 2011, 89, 1281–1294. [Google Scholar] [CrossRef]
- Kaibel, G. Distillation columns with vertical partitions. Chem. Eng. Technol. 1987, 10, 92–98. [Google Scholar] [CrossRef]
- Kaibel, B.; Jansen, H.; Zich, E.; Olujic, Z. Unfixed dividing wall technology for packed and tray distillation columns. IChemE Trans. Sympos. Ser. No. 152 2006, 15, 252. [Google Scholar]
- Kolbe, B.; Wenzel, S. Novel distillation concepts using one-shell columns. Chem. Eng. Process.: Process Intensif. 2004, 43, 339–346. [Google Scholar] [CrossRef]
- Christiansen, A.C.; Skogestad, S.; Lien, K. Complex distillation arrangements: Extending the petlyuk ideas. Comput. Chem. Eng. 1997, 21, S237–S242. [Google Scholar] [CrossRef]
- Kiss, A.A.; Bildea, C.S. A control perspective on process intensification in dividing-wall columns. Chem. Eng. Process.: Process Intensif. 2011, 50, 281–292. [Google Scholar] [CrossRef]
- Errico, M.; Tola, G.; Rong, B.-G.; Demurtas, D.; Turunen, I. Energy saving and capital cost evaluation in distillation column sequences with a divided wall column. Chem. Eng. Res. Des. 2009, 87, 1649–1657. [Google Scholar] [CrossRef]
- Hernández, S.; Jiménez, A. Controllability analysis of thermally coupled distillation systems. Ind. Eng. Chem. Res. 1999, 38, 3957–3963. [Google Scholar] [CrossRef]
- Jiménez, A.; Hernández, S.; Montoy, F.A.; Zavala-García, M. Analysis of control properties of Conventional and nonconventional distillation sequences. Ind. Eng. Chem. Res. 2001, 40, 3757–3761. [Google Scholar] [CrossRef]
- Serra, M.; Perrier, M.; Espuna, A.; Puigjaner, L. Study of the divided wall column controllability: Influence of design and operation. Comput. Chem. Eng. 2000, 24, 901–907. [Google Scholar] [CrossRef]
- Serra, M.; Perrier, M.; Espuña, A.; Puigjaner, L. Analysis of different control possibilities for the divided wall column: Feedback diagonal and dynamic matrix control. Comput. Chem. Eng. 2001, 25, 859–866. [Google Scholar] [CrossRef]
- Serra, M.; Espuña, A.; Puigjaner, L. Controllability of different multicomponent distillation arrangements. Ind. Eng. Chem. Res. 2003, 42, 1773–1782. [Google Scholar] [CrossRef]
- Segovia-Hernández, J.G.; Hernández, S.; Rico-Ramı́rez, V.; Jiménez, A. A comparison of the feedback control behavior between thermally coupled and conventional distillation schemes. Comput. Chem. Eng. 2004, 28, 811–819. [Google Scholar] [CrossRef]
- Segovia-Hernández, J.G.; Hernández-Vargas, E.A.; Márquez-Muñoz, J.A. Control properties of thermally coupled distillation sequences for different operating conditions. Comput. Chem. Eng. 2007, 31, 867–874. [Google Scholar] [CrossRef]
- Ling, H.; Luyben, W.L. New control structure for divided-wall columns. Ind. Eng. Chem. Res. 2009, 48, 6034–6049. [Google Scholar] [CrossRef]
- Wolff, E.A.; Skogestad, S. Operation of integrated three-product (Petlyuk) distillation columns. Ind. Eng. Chem. Res. 1995, 34, 2094–2103. [Google Scholar] [CrossRef]
- Mutalib, M.I. A.; Smith, R. Operation and control of dividing wall distillation columns: Part 1: Degrees of freedom and dynamic simulation. Chem. Eng. Res. Des. 1998, 76, 308–318. [Google Scholar] [CrossRef]
- Kim, K.; Lee, M.; Park, S. Two-point temperature control structure selection for dividing-wall distillation columns. Ind. Eng. Chem. Res. 2012, 51, 15683–15695. [Google Scholar] [CrossRef]
- Segovia-Hernández, J.G.; Hernández, S.; Femat, R.; Jiménez, A. Control of thermally coupled distillation arrangements with dynamic estimation of load disturbances. Ind. Eng. Chem. Res. 2006, 46, 546–558. [Google Scholar] [CrossRef]
- Tututi-Avila, S.; Jiménez-Gutiérrez, A. Control of dividing-wall columns via fuzzy logic. Ind. Eng. Chem. Res. 2013, 52, 7492–7503. [Google Scholar] [CrossRef]
- Dwivedi, D.; Halvorsen, I.J.; Skogestad, S. Control structure selection for three-product Petlyuk (dividing-wall) column. Chem. Eng. Process.: Process Intensif. 2013, 64, 57–67. [Google Scholar] [CrossRef]
- Zumoffen, D.; Gonzalo, M.; Basualdo, M. Improvements on multivariable control strategies tested on the Petlyuk distillation column. Chem. Eng. Sci. 2013, 93, 292–306. [Google Scholar] [CrossRef]
- Triantafyllou, C.; Smith, R. The design and optimisation of fully thermally coupled distillation columns: Process design. Chem. Eng. Res. Des. 1992, 70, 118–132. [Google Scholar]
- Hernández, S.; Jiménez, A. Design of energy-efficient Petlyuk systems. Comput. Chem. Eng. 1999, 23, 1005–1010. [Google Scholar] [CrossRef]
- Dünnebier, G.; Pantelides, C.C. Optimal design of thermally coupled distillation columns. Ind. Eng. Chem. Res. 1998, 38, 162–176. [Google Scholar]
- Grossmann, I.E.; Aguirre, P.A.; Barttfeld, M. Optimal synthesis of complex distillation columns using rigorous models. Comput. Chem. Eng. 2005, 29, 1203–1215. [Google Scholar] [CrossRef]
- Hernández, S.; Jiménez, A. Design of optimal thermally-coupled distillation systems using a dynamic model. Chem. Eng. Res. Design 1996, 74, 357–362. [Google Scholar]
- Halvorsen, I.J.; Skogestad, S. Optimal operation of Petlyuk distillation: Steady-state behavior. J. Process Control 1999, 9, 407–424. [Google Scholar] [CrossRef]
- Halvorsen, I.J.; Skogestad, S. Optimizing control of Petlyuk distillation: Understanding the steady-state behavior. Comput. Chem. Eng. 1997, 21, S249–S254. [Google Scholar] [CrossRef]
- Rewagad, R.R.; Kiss, A.A. Dynamic optimization of a dividing-wall column using model predictive control. Chem. Eng. Sci. 2012, 68, 132–142. [Google Scholar] [CrossRef]
- Serra, M.; Espuña, A.; Puigjaner, L. Control and optimization of the divided wall column. Chem. Eng. Process.: Process Intensif. 1999, 38, 549–562. [Google Scholar] [CrossRef]
- van Diggelen, R.C.; Kiss, A.A.; Heemink, A.W. Comparison of control strategies for dividing-wall columns. Ind. Eng. Chem. Res. 2009, 49, 288–307. [Google Scholar] [CrossRef]
- Tedder, D.W.; Rudd, D.F. Parametric studies in industrial distillation: Part I. Design comparisons. AIChE J. 1978, 24, 303–315. [Google Scholar] [CrossRef]
- Segovia-Hernández, J.G.; Hernández, S.; Jiménez, A. Control behaviour of thermally coupled distillation sequences. Chem. Eng. Res. Des. 2002, 80, 783–789. [Google Scholar] [CrossRef]
- Liptak, B.G. Instrument Engineers’ Handbook: Vol. 2 Process Control and Optimization, 4th ed.; CRC/Taylor & Francis: Boca Raton, FL, USA, 2006; p. 2387. [Google Scholar]
- Kiss, A.A.; Rewagad, R.R. Energy efficient control of a BTX dividing-wall column. Comput. Chem. Eng. 2011, 35, 2896–2904. [Google Scholar] [CrossRef]
- Luyben, W.L.; Tyréus, B.D.; Luyben, M.L. Plantwide Process Control; McGraw-Hill: New York, NY, USA, 1999; p. 395. [Google Scholar]
- Gross, F.; Baumann, E.; Geser, A.; Rippin, D.W.T.; Lang, L. Modelling, simulation and controllability analysis of an industrial heat-integrated distillation process. Comput. Chem. Eng. 1998, 22, 223–237. [Google Scholar] [CrossRef]
- Skogestad, S.; Postlethwaite, I. Multivariable Feedback Control: Analysis and Design; Wiley: Chichester, UK; New York, NY, USA, 1996; p. 559. [Google Scholar]
- Morari, M.; Zafiriou, E. Robust Process Control; Prentice Hall: Englewood Cliffs, NJ, USA, 1989; p. 488. [Google Scholar]
- Rivera, D.E.; Morari, M.; Skogestad, S. Internal model control: PID controller design. Ind. Eng. Chem. Process Des. Dev. 1986, 25, 252–265. [Google Scholar] [CrossRef]
- Seborg, D.E. Process Dynamics and Control, 3rd ed.; John Wiley & Sons: Hoboken, NJ, USA, 2011; p. 514. [Google Scholar]
- Skogestad, S. Simple analytic rules for model reduction and PID controller tuning. J. Process Control 2003, 13, 291–309. [Google Scholar] [CrossRef]
- Luyben, W.L. Distillation Design and Control using Aspen Simulation; Wiley-Interscience: Hoboken, NJ, USA, 2006. [Google Scholar]
- Coulson, J.M.; Richardson, J.F. Coulson & Richardson’s Chemical Engineering. Volume 1,Fluid Flow,Heat Transfer and Mass Transfer; Butterworth-Heinemann: Amsterdam, The Netherlands; Boston, MA, USA, 2009; p. 895. [Google Scholar]
- Georgiadis, M.C.; Schenk, M.; Pistikopoulos, E.N.; Gani, R. The interactions of design control and operability in reactive distillation systems. Comput. Chem. Eng. 2002, 26, 735–746. [Google Scholar] [CrossRef]
- McCabe, W.L.; Smith, J.C.; Harriott, P. Unit Operations of Chemical Engineering, 5th ed.; McGraw-Hill: New York, NY, USA, 1992; p. 1130. [Google Scholar]
- Luyben, W.L. Process Modeling, Simulation, and Control for Chemical Engineers, 2nd ed.; McGraw-Hill: New York, NY, USA, 1990; p. 725. [Google Scholar]
- Choe, Y.S.; Luyben, W.L. Rigorous dynamic models of distillation columns. Ind. Eng. Chem. Res. 1987, 26, 2158–2161. [Google Scholar] [CrossRef]
- Fuentes, C.; Luyben, W.L. Comparison of energy models for distillation columns. Ind. Eng. Chem. Fundam. 1982, 21, 323–325. [Google Scholar] [CrossRef]
© 2014 by the authors; licensee MDPI, Basel, Switzerland. This article is an open access article distributed under the terms and conditions of the Creative Commons Attribution license (http://creativecommons.org/licenses/by/3.0/).
Share and Cite
Tututi-Avila, S.; Jiménez-Gutiérrez, A.; Hahn, J. Analysis of Multi-Loop Control Structures of Dividing-Wall Distillation Columns Using a Fundamental Model. Processes 2014, 2, 180-199. https://doi.org/10.3390/pr2010180
Tututi-Avila S, Jiménez-Gutiérrez A, Hahn J. Analysis of Multi-Loop Control Structures of Dividing-Wall Distillation Columns Using a Fundamental Model. Processes. 2014; 2(1):180-199. https://doi.org/10.3390/pr2010180
Chicago/Turabian StyleTututi-Avila, Salvador, Arturo Jiménez-Gutiérrez, and Juergen Hahn. 2014. "Analysis of Multi-Loop Control Structures of Dividing-Wall Distillation Columns Using a Fundamental Model" Processes 2, no. 1: 180-199. https://doi.org/10.3390/pr2010180