1. Introduction
Currently, the majority of pharmaceutical and specialty chemical manufacturing is performed in large volume batch reactors. These reactors are limited by a number of challenges: Poor mixing, large temperature gradients, potentially inaccurate serial additions, safety and pressure hazards, and resource-intensive validation procedures requiring man-hours, time, and manual sampling for quality assurance and control. Many of these challenges are mitigated using continuous flow reactors (CFRs). CFRs are small volume flow cells optimized for continuous, consistent production of a target compound. The volumes and channels of CFRs can range from milliliter to microliter scale [
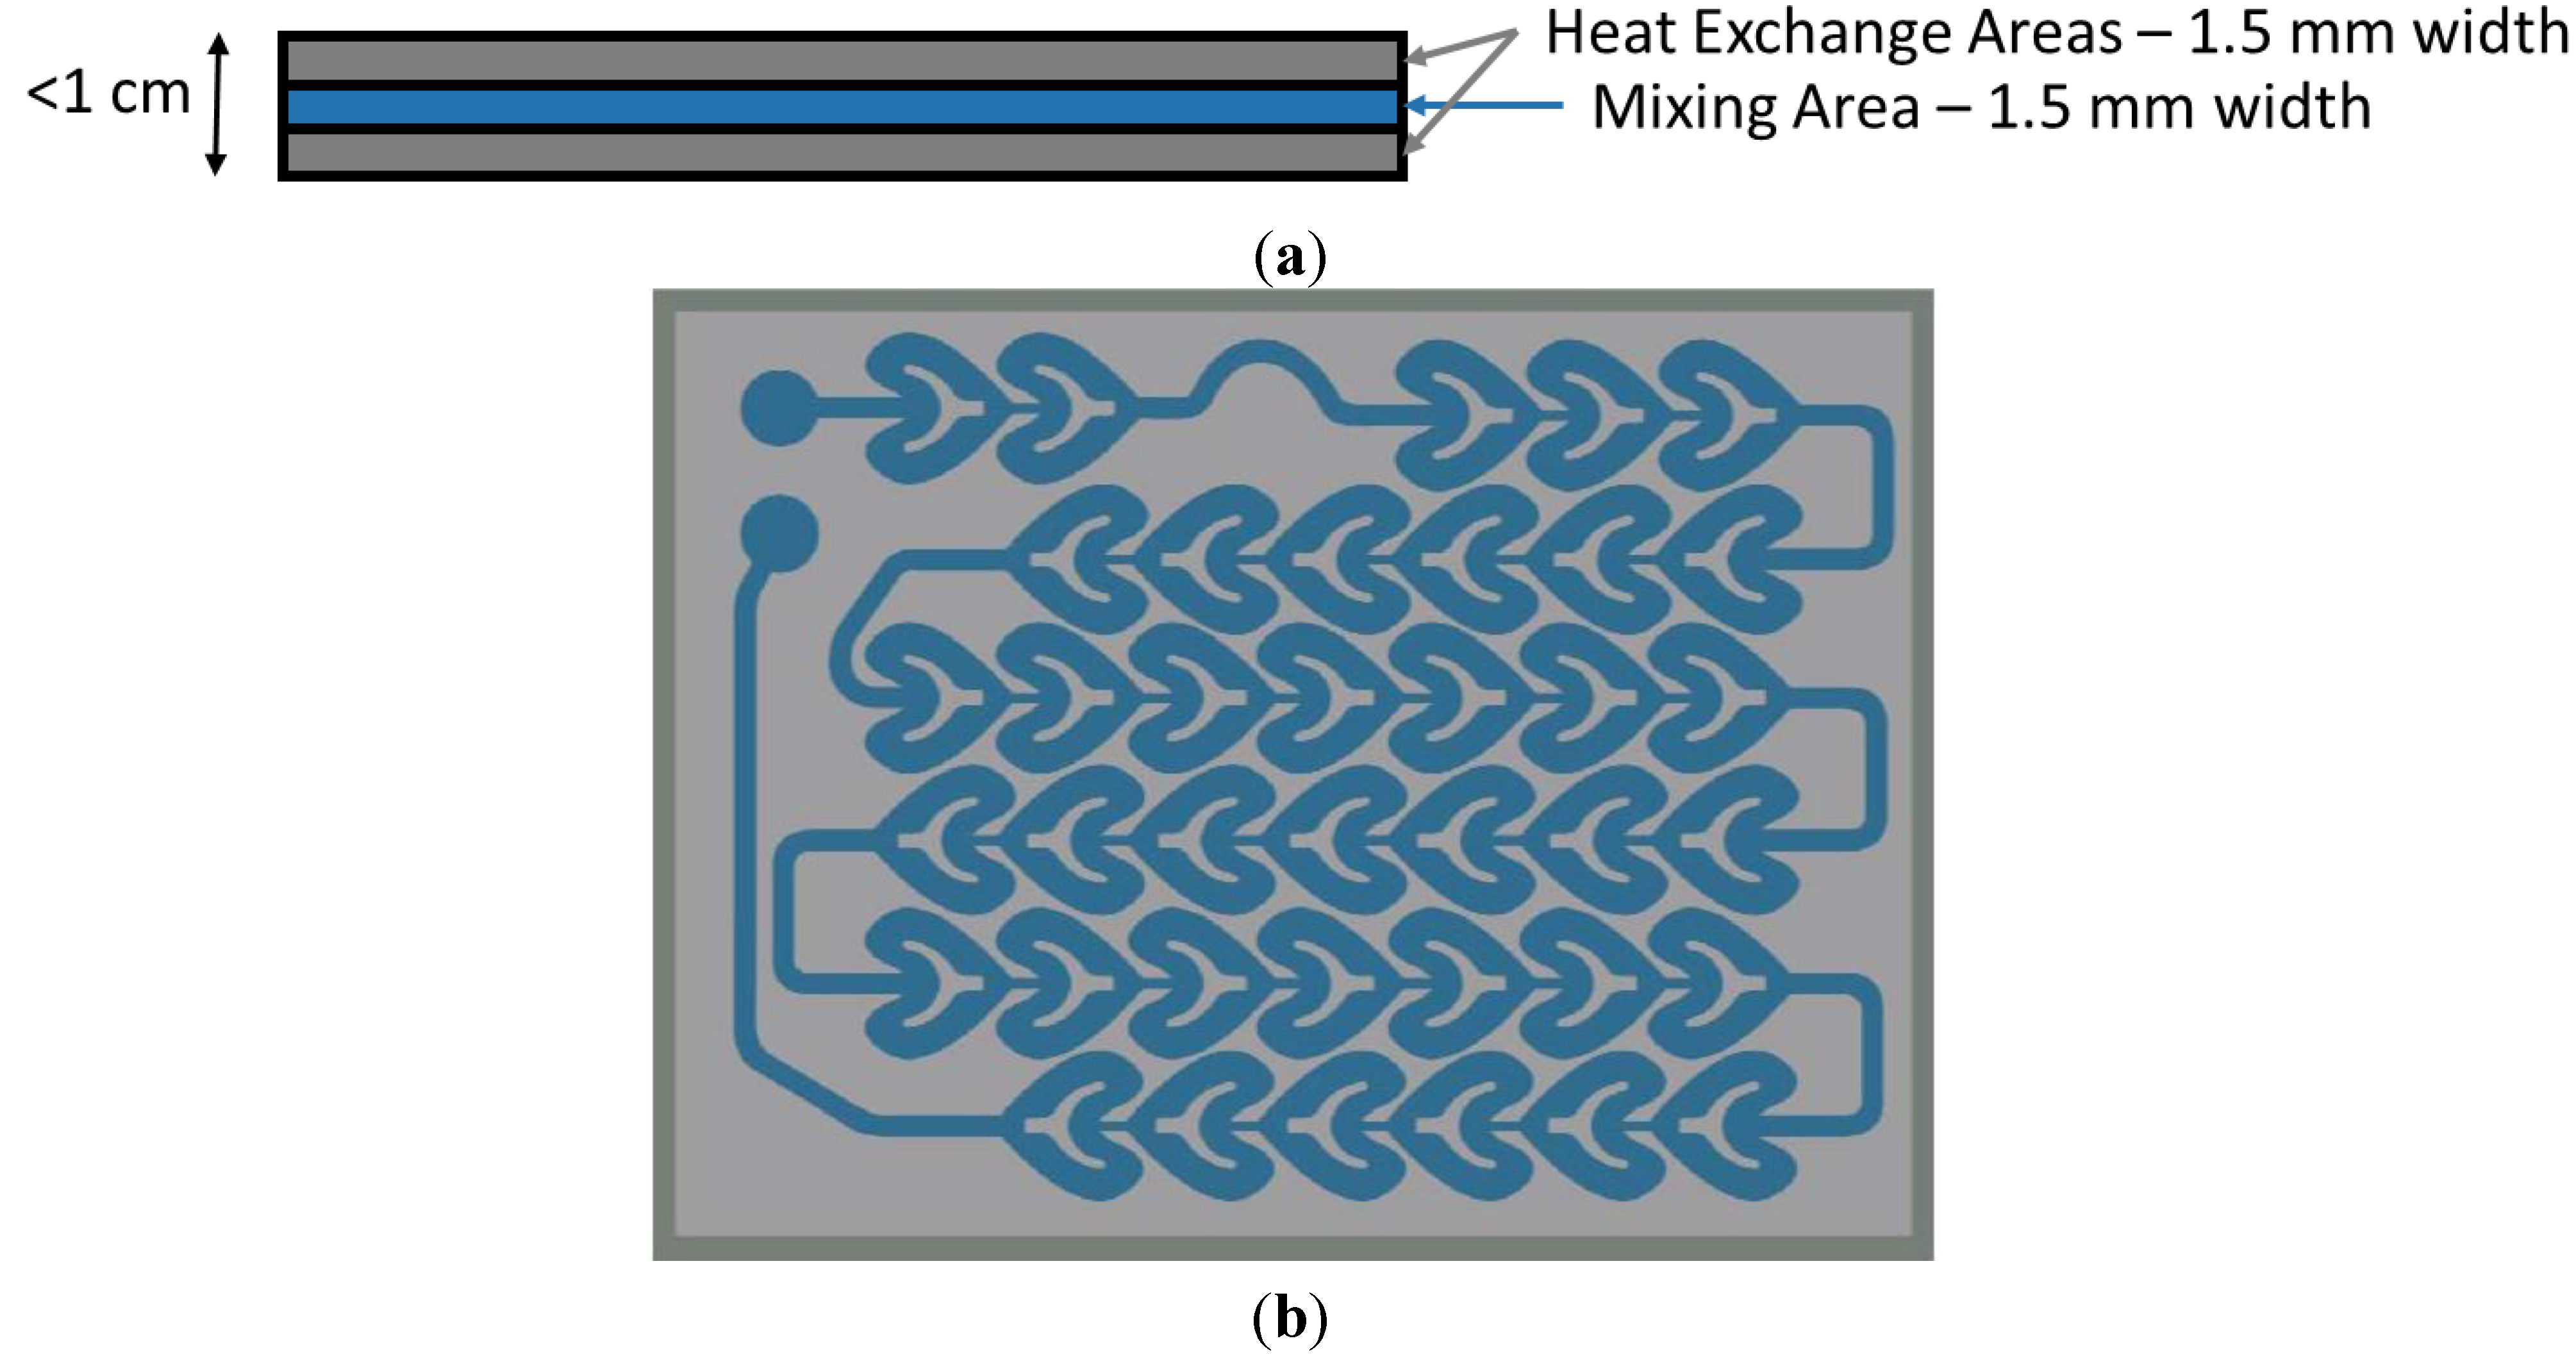
1]. Milliliter-scale CFRs typically employ reaction plates designed for turbulent mixing (
Figure 1a). Reaction plates are typically manufactured with millimeter-wide channels and a high surface-to-volume interface for a multi-fold reduction in the average distance to temperature control channels (
Figure 1b). The design results in a reduction of temperature gradients and improved homogeneity in CFRs [
2,
3,
4]. It has also been shown that parallel addition of reagents removes variation introduced by operators, and a closed system is less affected by environmental variation [
5]. Roberto
et al. have previously demonstrated a 75% reduction in reaction time in continuous flow when compared to a batch reactor [
6].
Figure 1.
(a) Side view of continuous flow reactor mixing chip showing heat exchange and mixing areas. Each area has a width of 1.5 mm, and are separated by 1 mm of glass; (b) Top view of continuous flow reactor mixing chip. Heart-shaped mixers are employed to ensure turbulent mixing throughout.
Figure 1.
(a) Side view of continuous flow reactor mixing chip showing heat exchange and mixing areas. Each area has a width of 1.5 mm, and are separated by 1 mm of glass; (b) Top view of continuous flow reactor mixing chip. Heart-shaped mixers are employed to ensure turbulent mixing throughout.
All of these advantages assume that a reactor system is in steady state. A steady state continuous flow system is one that is physically stable with regards to the variables of pressure, flow rate, mixing, and temperature. This results in controlled chemical production with reproducible results. Such a system offers significant advantages over batch reactors that fluctuate between different production runs. Currently, CFRs are determined to be at steady state by either a univariate method detecting physical stability in the reactor or a multivariate method determining the stability of chemical output [
1,
5,
7,
8,
9]. Chemical measurements frequently require aliquots for offline validation to determine steady state. Uncertainty in reactor steady state requires multiple measurements, further extending analysis time. This can be especially problematic when attempting to determine optimal reactor conditions that require the exploration of a large design space. Physical measurements, while rapid, cannot effectively detect problems associated with product quality. Reactor systems are not currently constructed with interfaces to accommodate process analytical technology (PAT). Instead, current physical stability detection methods largely rely on feedback from the temperature or flow controllers without dedicated analytics.
A continuous flow system was designed that expands traditional physical monitoring while implementing real-time chemical monitoring to accurately and rapidly determine steady state. Monitoring of any process requires a reproducible sampling interface for reliable results. New Sampling/Sensor Initiative (NeSSI) sampling systems have previously been shown to be effective tools for enabling process monitoring in fluid and gas systems [
6,
10], and as interfaces for continuous flow reactor analytics [
6]. NeSSI is a modular platform allowing for simple expansion or rearrangement of a sampling platform. This enables rapid prototyping and development of continuous flow reactor systems. The coupling of NeSSI with appropriate sensors creates a dependable interface for the sampling of a flow channel [
10,
11].
Chromatographic methods are the most frequently used validation methods to determine chemical steady state and conversion in CFRs [
5,
7,
8,
9,
12,
13]. These methods yield reproducible results but can have analysis times in excess of fifteen minutes after sample collection. Confirmation of chemical steady state in a CFR over multiple aliquots requires an hour or more using chromatographic methods. A design of experiments (DoE) with 25 points would require more than a day to determine optimal conditions. Raman spectroscopy has previously been applied and proven effective for in-line process monitoring of flow systems [
9,
14,
15,
16]. Recent work by Roberto
et al. has shown that Raman spectroscopy is a viable method for monitoring chemical yield in a CFR [
6]. Deconvolution of Raman spectral data is challenging in complex chemical systems. Chemometric tools such as principal component analysis (PCA) are often used to process and analyze this spectral data quickly and effectively [
17,
18]. Used in tandem, Raman spectroscopy and PCA allow for robust process monitoring and effective process control [
18,
19,
20,
21].
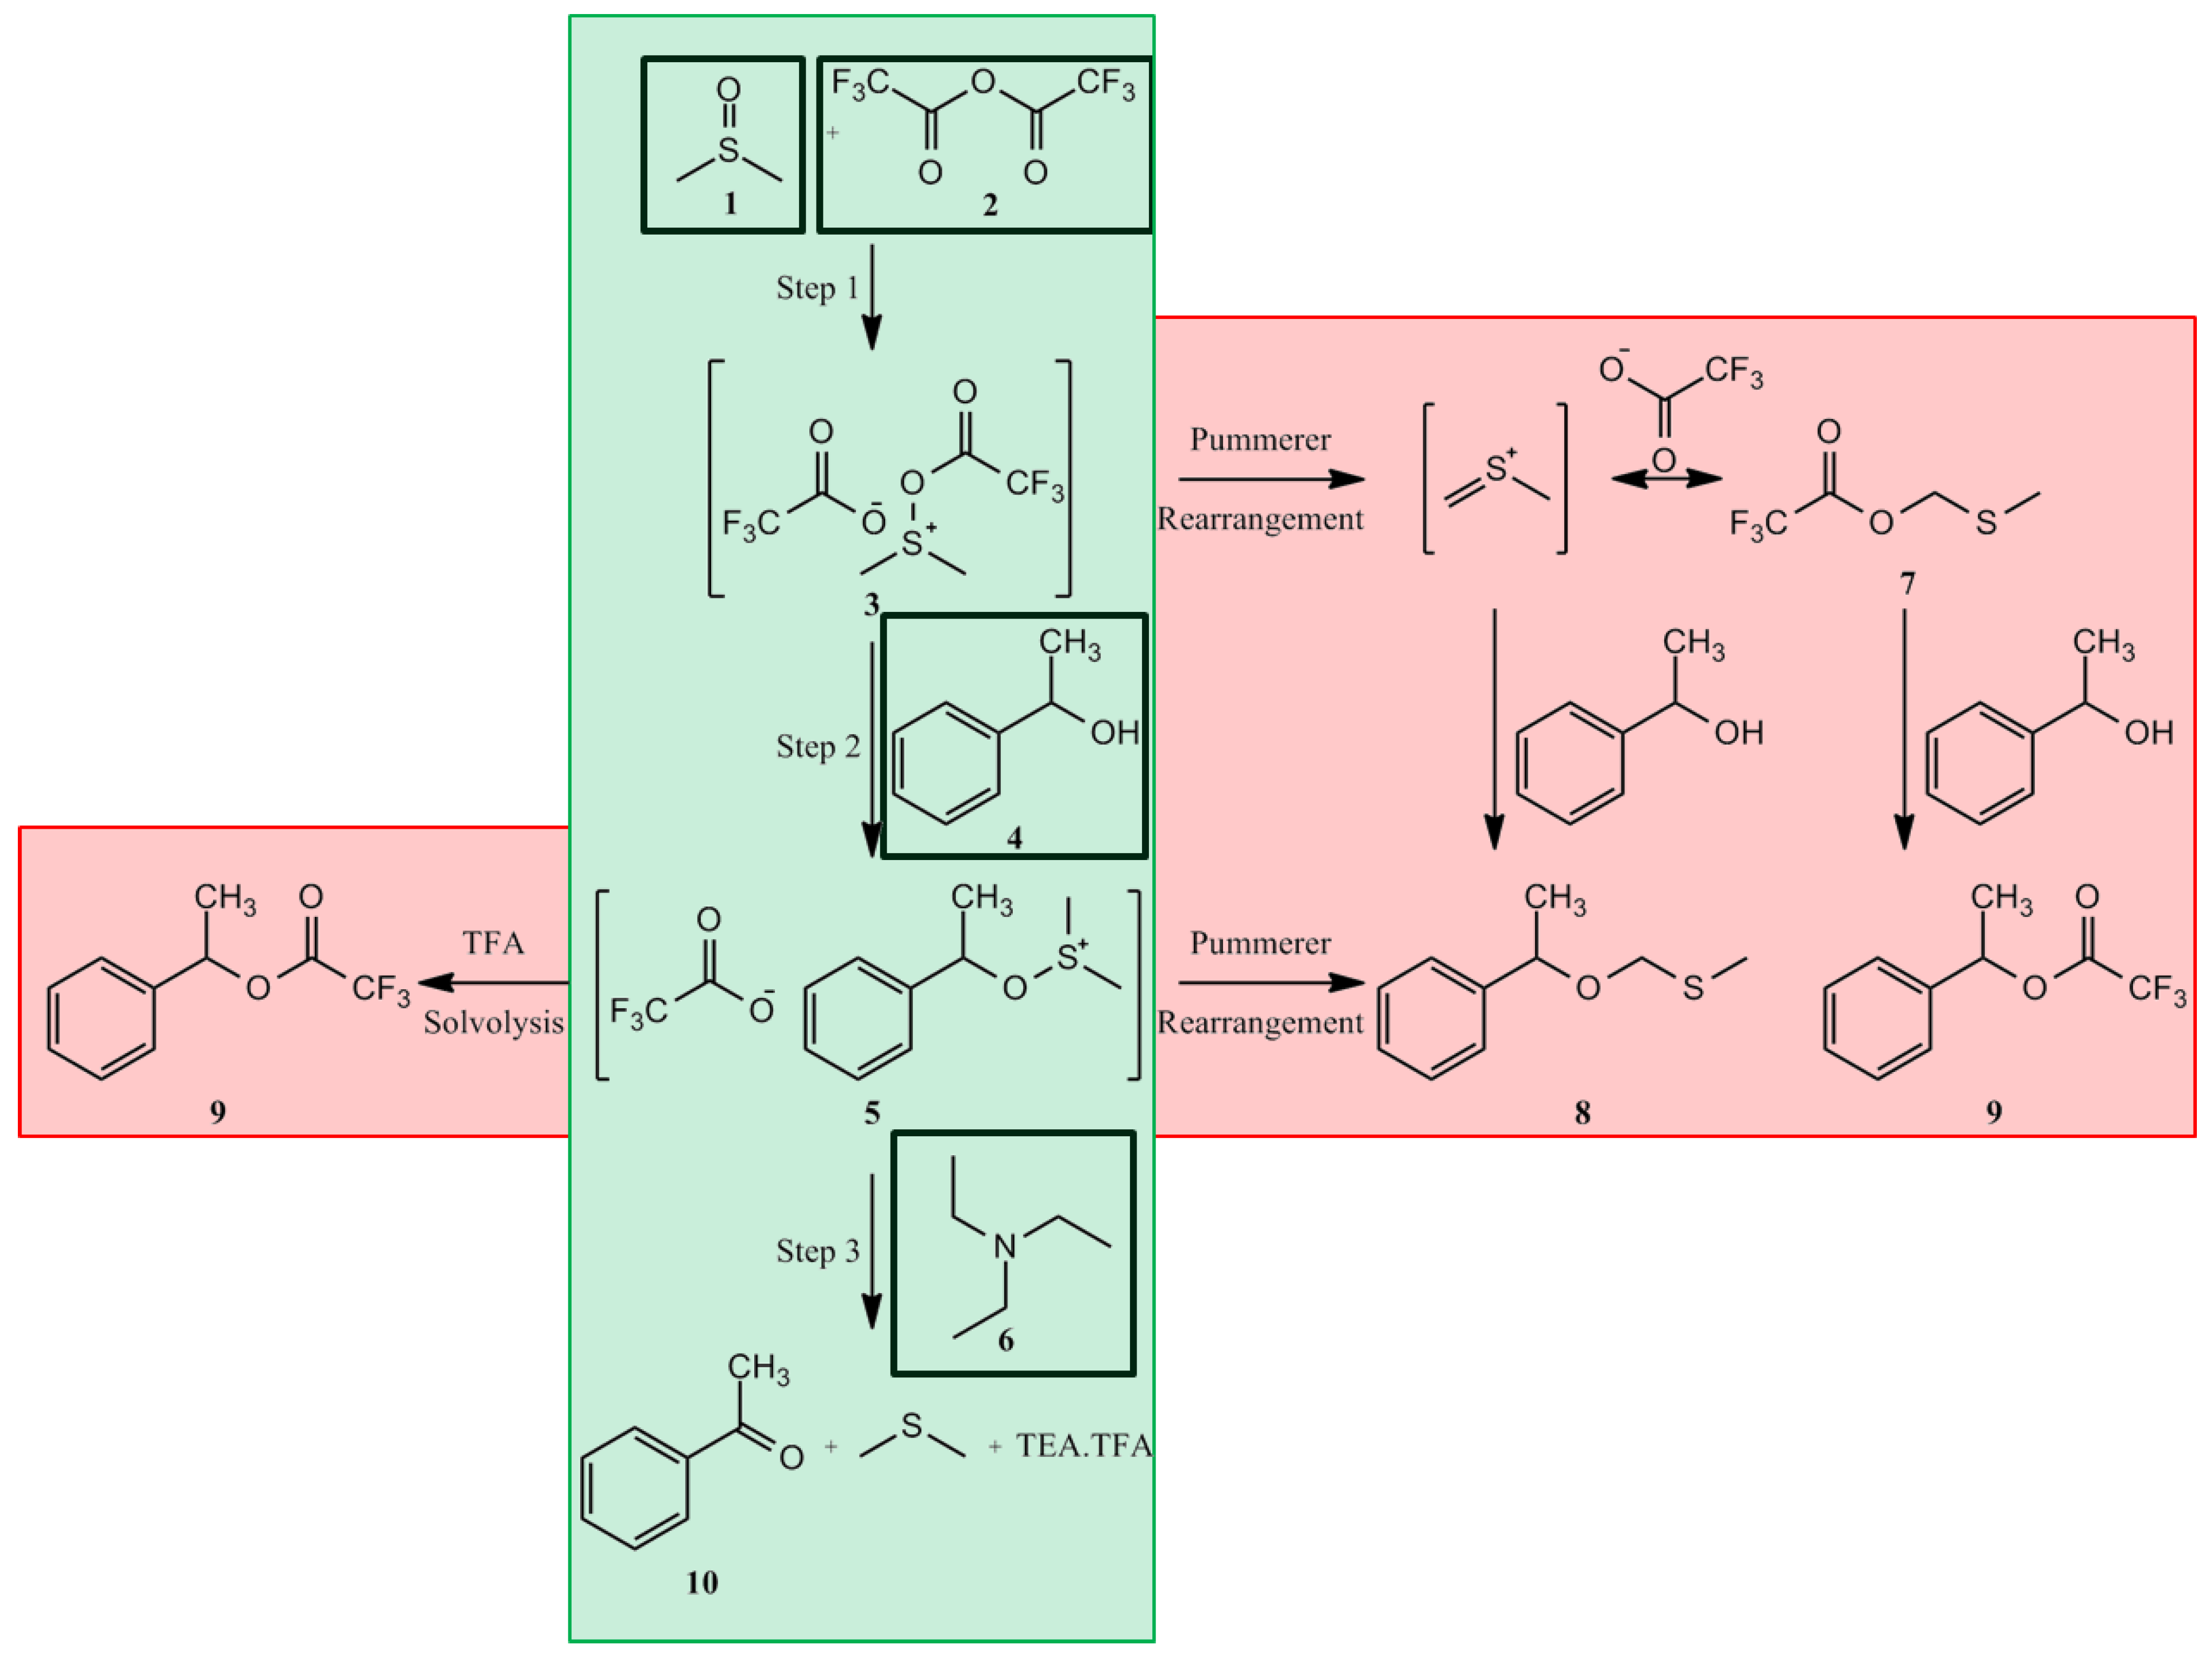
The focus of this investigation was to demonstrate that the combination of NeSSI with PAT and multivariate chemical monitoring offers significant advantages for optimizing chemical design space when compared with systems that employ physical or chemical techniques alone. Additionally, methods developed show potential for quality control and upset detection in production-scale facilities. Critical to the success of this project was the construction and design of a smart reactor system for monitoring and control of a defined chemistry with PAT. To demonstrate the smart reactor system, the Moffatt-Swern oxidation of 1-phenylethanol (
Figure 2) was investigated. The formation of the highly unstable intermediates
3 and
5 is highly exothermic, requiring accurate temperature control [
12,
13]. The overall results demonstrate that the application of PAT to accurately detect physical and chemical stability in CFRs improved the time required to determine steady state by more than an order of magnitude. This reduced the time required to process the DoE and determine optimal reactor conditions. The final goal of this project was to develop a procedure for optimizing CFRs independent of the chemistry performed.
Figure 2.
The Swern oxidation. The center column (green background) shows the desired chemical path, with added reagents shown in black boxes. The outer columns (red background) show the potential chemical pathways for side-product formation (8 and 9).
Figure 2.
The Swern oxidation. The center column (green background) shows the desired chemical path, with added reagents shown in black boxes. The outer columns (red background) show the potential chemical pathways for side-product formation (8 and 9).
2. Experimental Section
The continuous flow reactor (CFR) was comprised of 4 main components: The Intraflow NeSSI sampling system, the analytics and controllers, the chemical mixers, and the control software. The Intraflow sampling system, provided by Parker Hannifin (Cleveland, OH, USA), consisted of four identical reagent lines and a product line. Four reagents: 1.0 M trifluoroacetate anhydride (Sigma-Aldrich, St. Louis, MO, USA), 1.1 M DMSO (Sigma-Aldrich, St. Louis, MO, USA), 1.0 M
S-1-phenylethanol (Sigma-Aldrich, St. Louis, MO, USA), and 2.4 M triethylamine (Sigma-Aldrich, St. Louis, MO, USA) all in dichloromethane (Sigma-Aldrich, St. Louis, MO, USA) are pumped into the system by HPLC Pumps (two FLOM FS10A HPLC pumps, FLOM USA, San Diego, CA, USA, and two SSI Series I HPLC pumps, SSI, State College, PA, USA). These pumps actively controlled the residence time and stoichiometry of the reactor system. Pressure relief valves were installed on each line to ensure that the reactor did not overpressurize. Temperature was controlled by a Huber Tango heat-exchanger (Huber USA, Northport, NY, USA) and was pumped across three sequential Corning LF Reactor plates (Corning Glass, Avon, France), each with a reactor volume of 1 mL, that included 38 heart-shaped mixers per plate (
Figure 1b) to ensure turbulent mixing throughout.
The analytics on each of the four reagent line were as follows: A pressure transducer (HEISE, Stratford, CT, USA), a flow meter (FCI Incorporated, San Marcos, CA, USA), and a 0.5” O.D. Raman ball-probe (Marqmetrix, Seattle, WA, USA) were interfaced to NeSSI via a fiber optic cable. The heat exchange lines were equipped with a thermocouple (Omega Engineering, Stamford, CT, USA) before and after the reactor plates to determine the temperature loss across the reactor. The product line NeSSI system contained a thermocouple and a 0.5” O.D. Raman ball-probe. A four-channel 785 nm Raman system, supplied by Kaiser Optical Systems (Ann Arbor, MI, USA) was used to collect Raman spectra from the four ball-probes mounted on the reactor sequentially. The sensors and controllers, with the exception of the Raman instrument, were all monitored and controlled via an in-house designed LabVIEW 7.5 (National Instruments Corporation, Austin, TX, USA) GUI environment. All of the analytics were interfaced to the reaction flow via NeSSI sampling system. The sensors and digital controllers were queried once per second; the GUI reported temperature, pressure, and flow information in real-time.
Raman investigation of the reaction chemistry was performed prior to exploring the full temperature and flow rate design space. Spectra were collected by performing chemistry at a constant flow rate of 4 mL/min from −20 °C to 20 °C at 10 °C intervals. Five Raman spectra were recorded; each consisting of five one-second exposures, for a total of 25 calibration spectra. All calibration samples were validated on an Agilent 1100 Series HPLC (Agilent Technologies, Santa Clara, CA, USA) using a reverse-phase column (Agilent C18 Column, Santa Clara, CA, USA). The liquid chromatography was performed using two mobile phases: 0.1% acetic acid in water and acetonitrile. A constant flow of 5% acetonitrile for 2 min, then a gradient of 5% acetonitrile to 95% acetonitrile over 5.5 min, followed by 2 min constant flow resulted in clearly defined peaks for S-1-phenylethanol (4), acetophenone (10), and side-products 8 and 9. Acetophenone peak area was used to determine reaction progress.
Raman spectra were imported into MATLAB 7.5 (Mathworks, Natick, MA, USA) for analysis and modeling. All spectra were preprocessed using a 1st order baseline removal to remove variations between spectra. PCA was performed with PLS Toolbox 5.0 (Eigenvector Research, Inc., Wenatchee, WA, USA) using mean-centered, background corrected spectra to monitor reactor steady state via changes in the multivariate scores. After establishing a system for accurately detecting chemical steady state, the full 25 point design space of flow rate (2–10 mL/min at 2 mL/min increments) and temperature (−20 °C to 20 °C at 10 °C intervals) was explored via the control software.
3. Results and Discussion
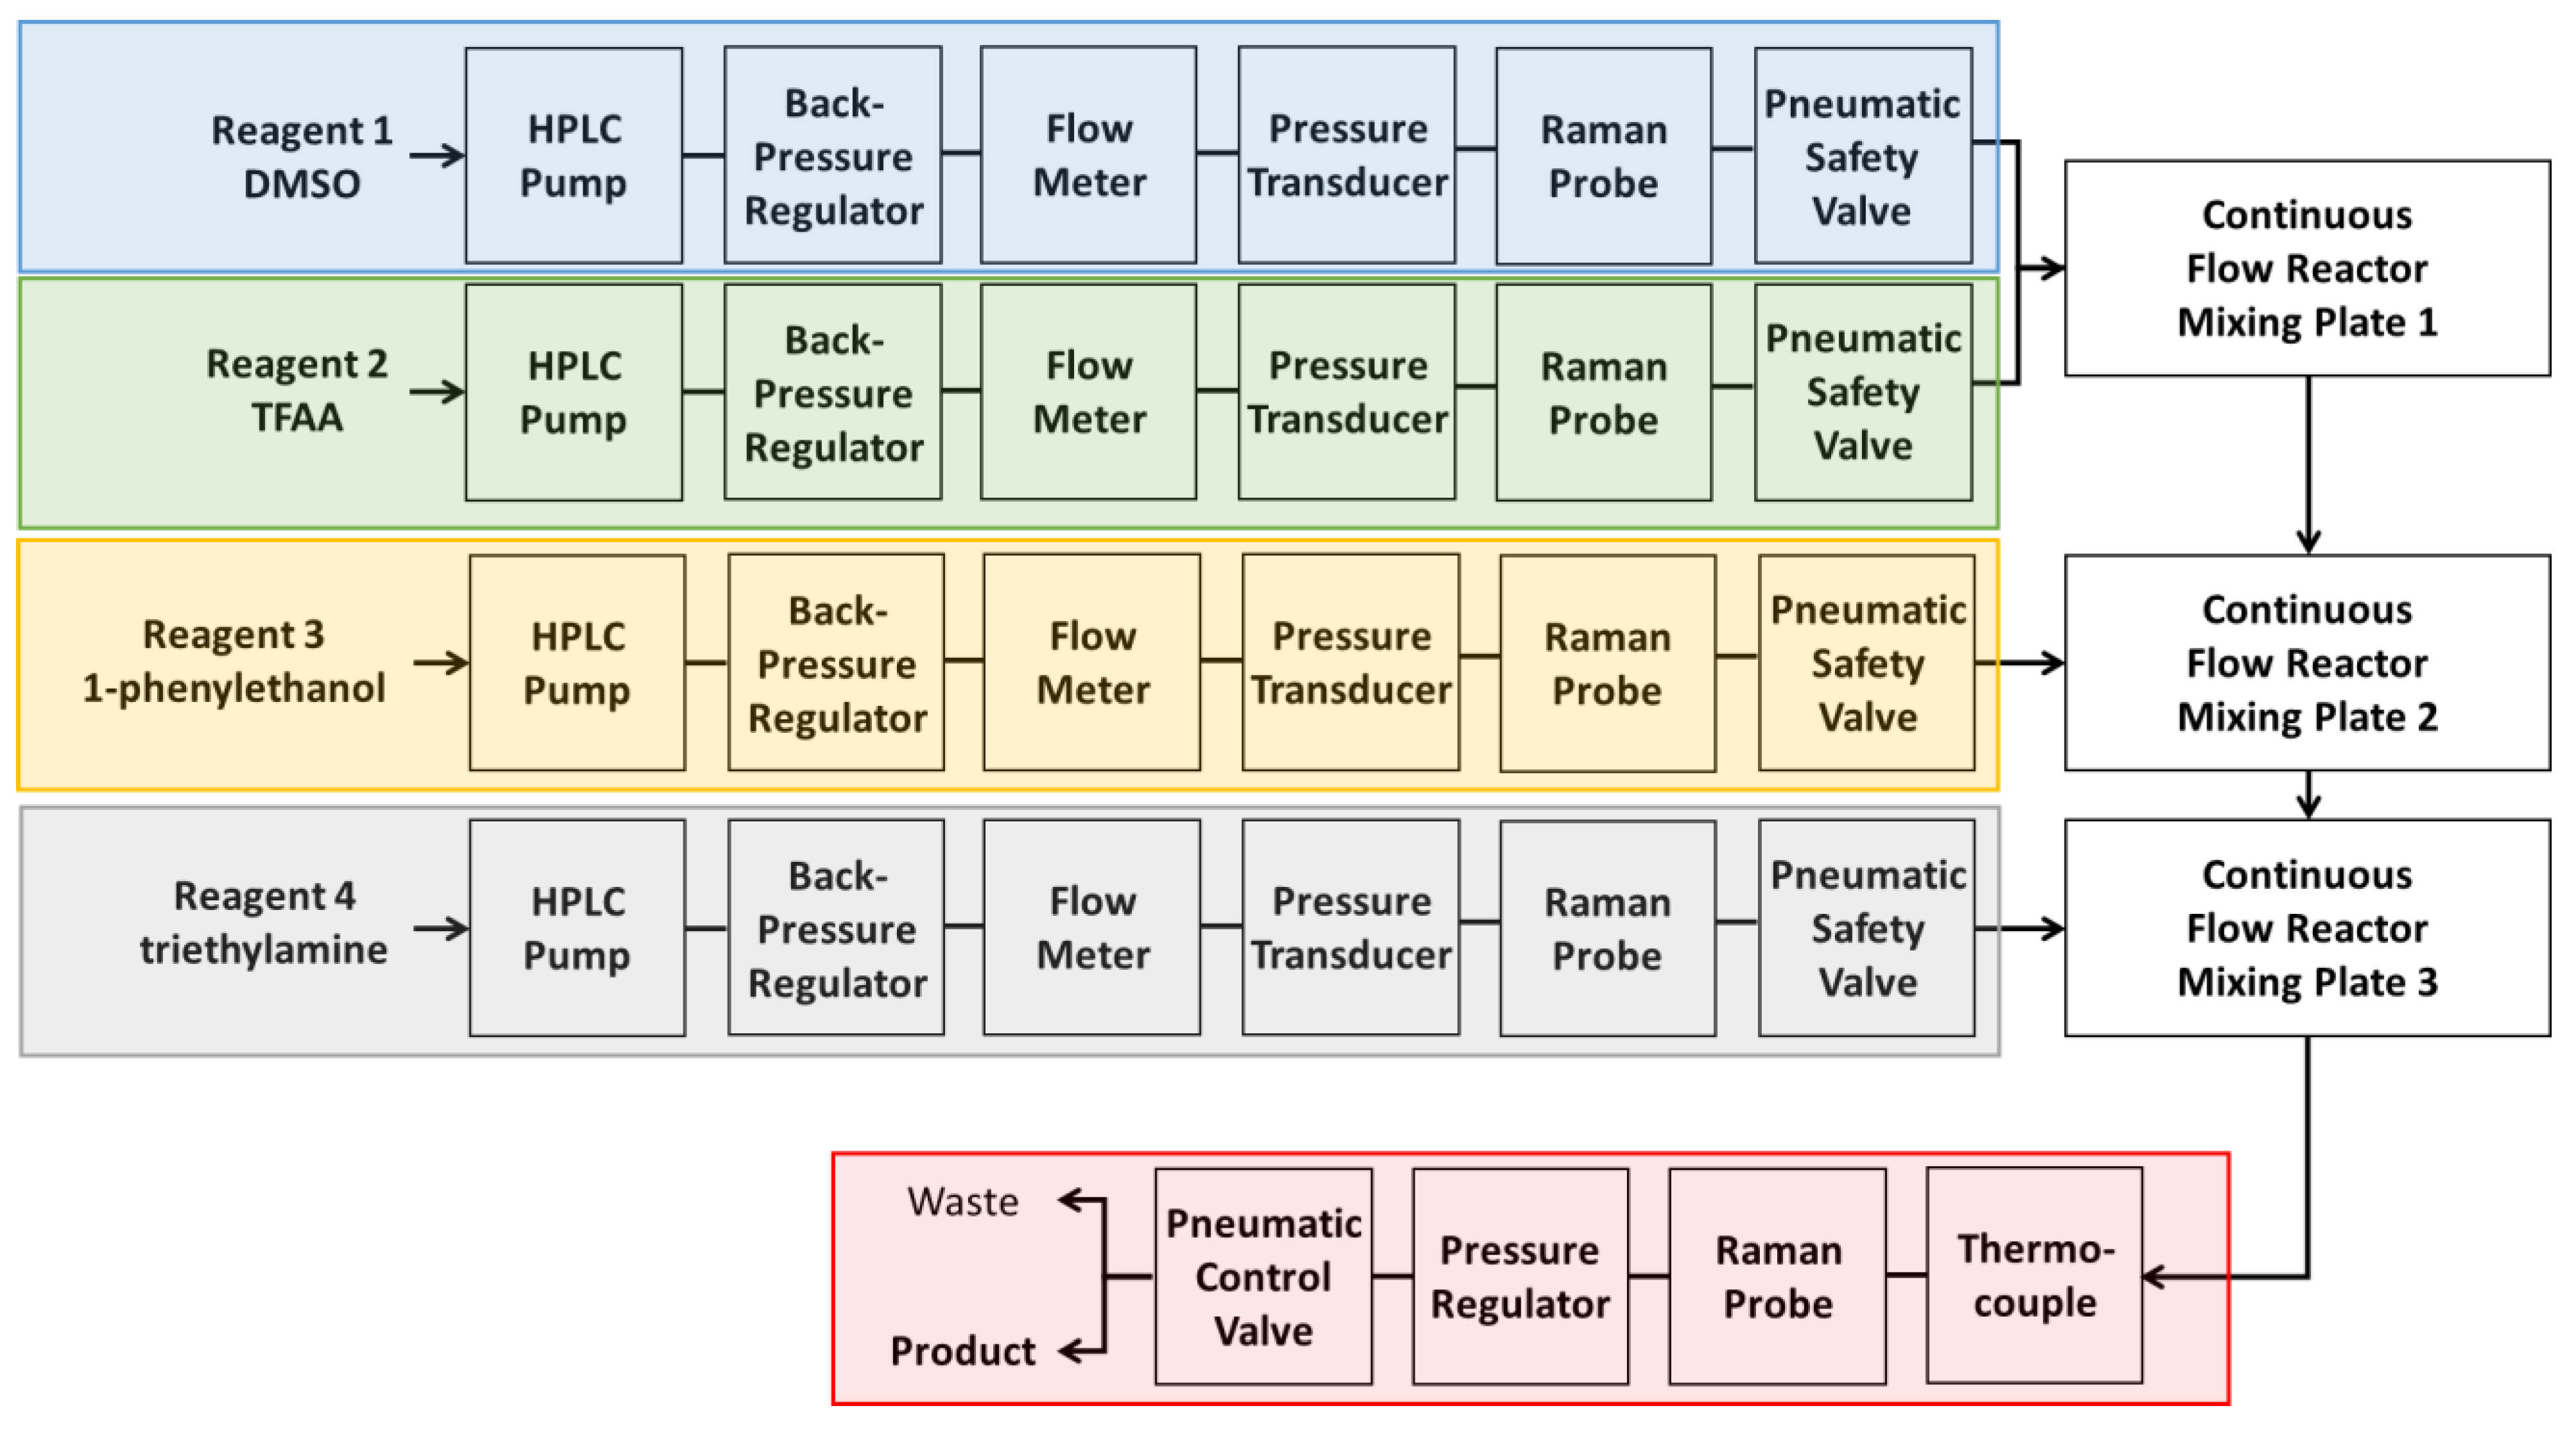
A system was developed using a CFR, NeSSI sampling system, and PAT to monitor chemical and physical variation in real-time (
Figure 3). The PAT served two purposes: To determine reaction steady state, and to detect process upsets in the reactor. The variables temperature, pressure, and flow were recorded at one second intervals at specific locations in the reactor (
Figure 3). When the lowest deviation of each physical measurement had been obtained the reactor was considered physically stable.
Figure 3.
Schematic of continuous flow reactor system. Each of the four reagent lines have the same analytics present: Flow meter, pressure sensor, Raman probe, and valves for operator safety. The first two reagent lines combine in the first reactor, with each subsequent line adding a reagent to the next reactor. The product line contains a Raman probe, a pressure regulator, and a pneumatic valve that is able to send the chemical output to either product collection or waste.
Upon reaching physical stability the reactor requires a lead time in order for the physical changes to be reflected in the chemical output downstream. Lead time is dependent upon the flow rate and the total volume of the reactor system by the equation:
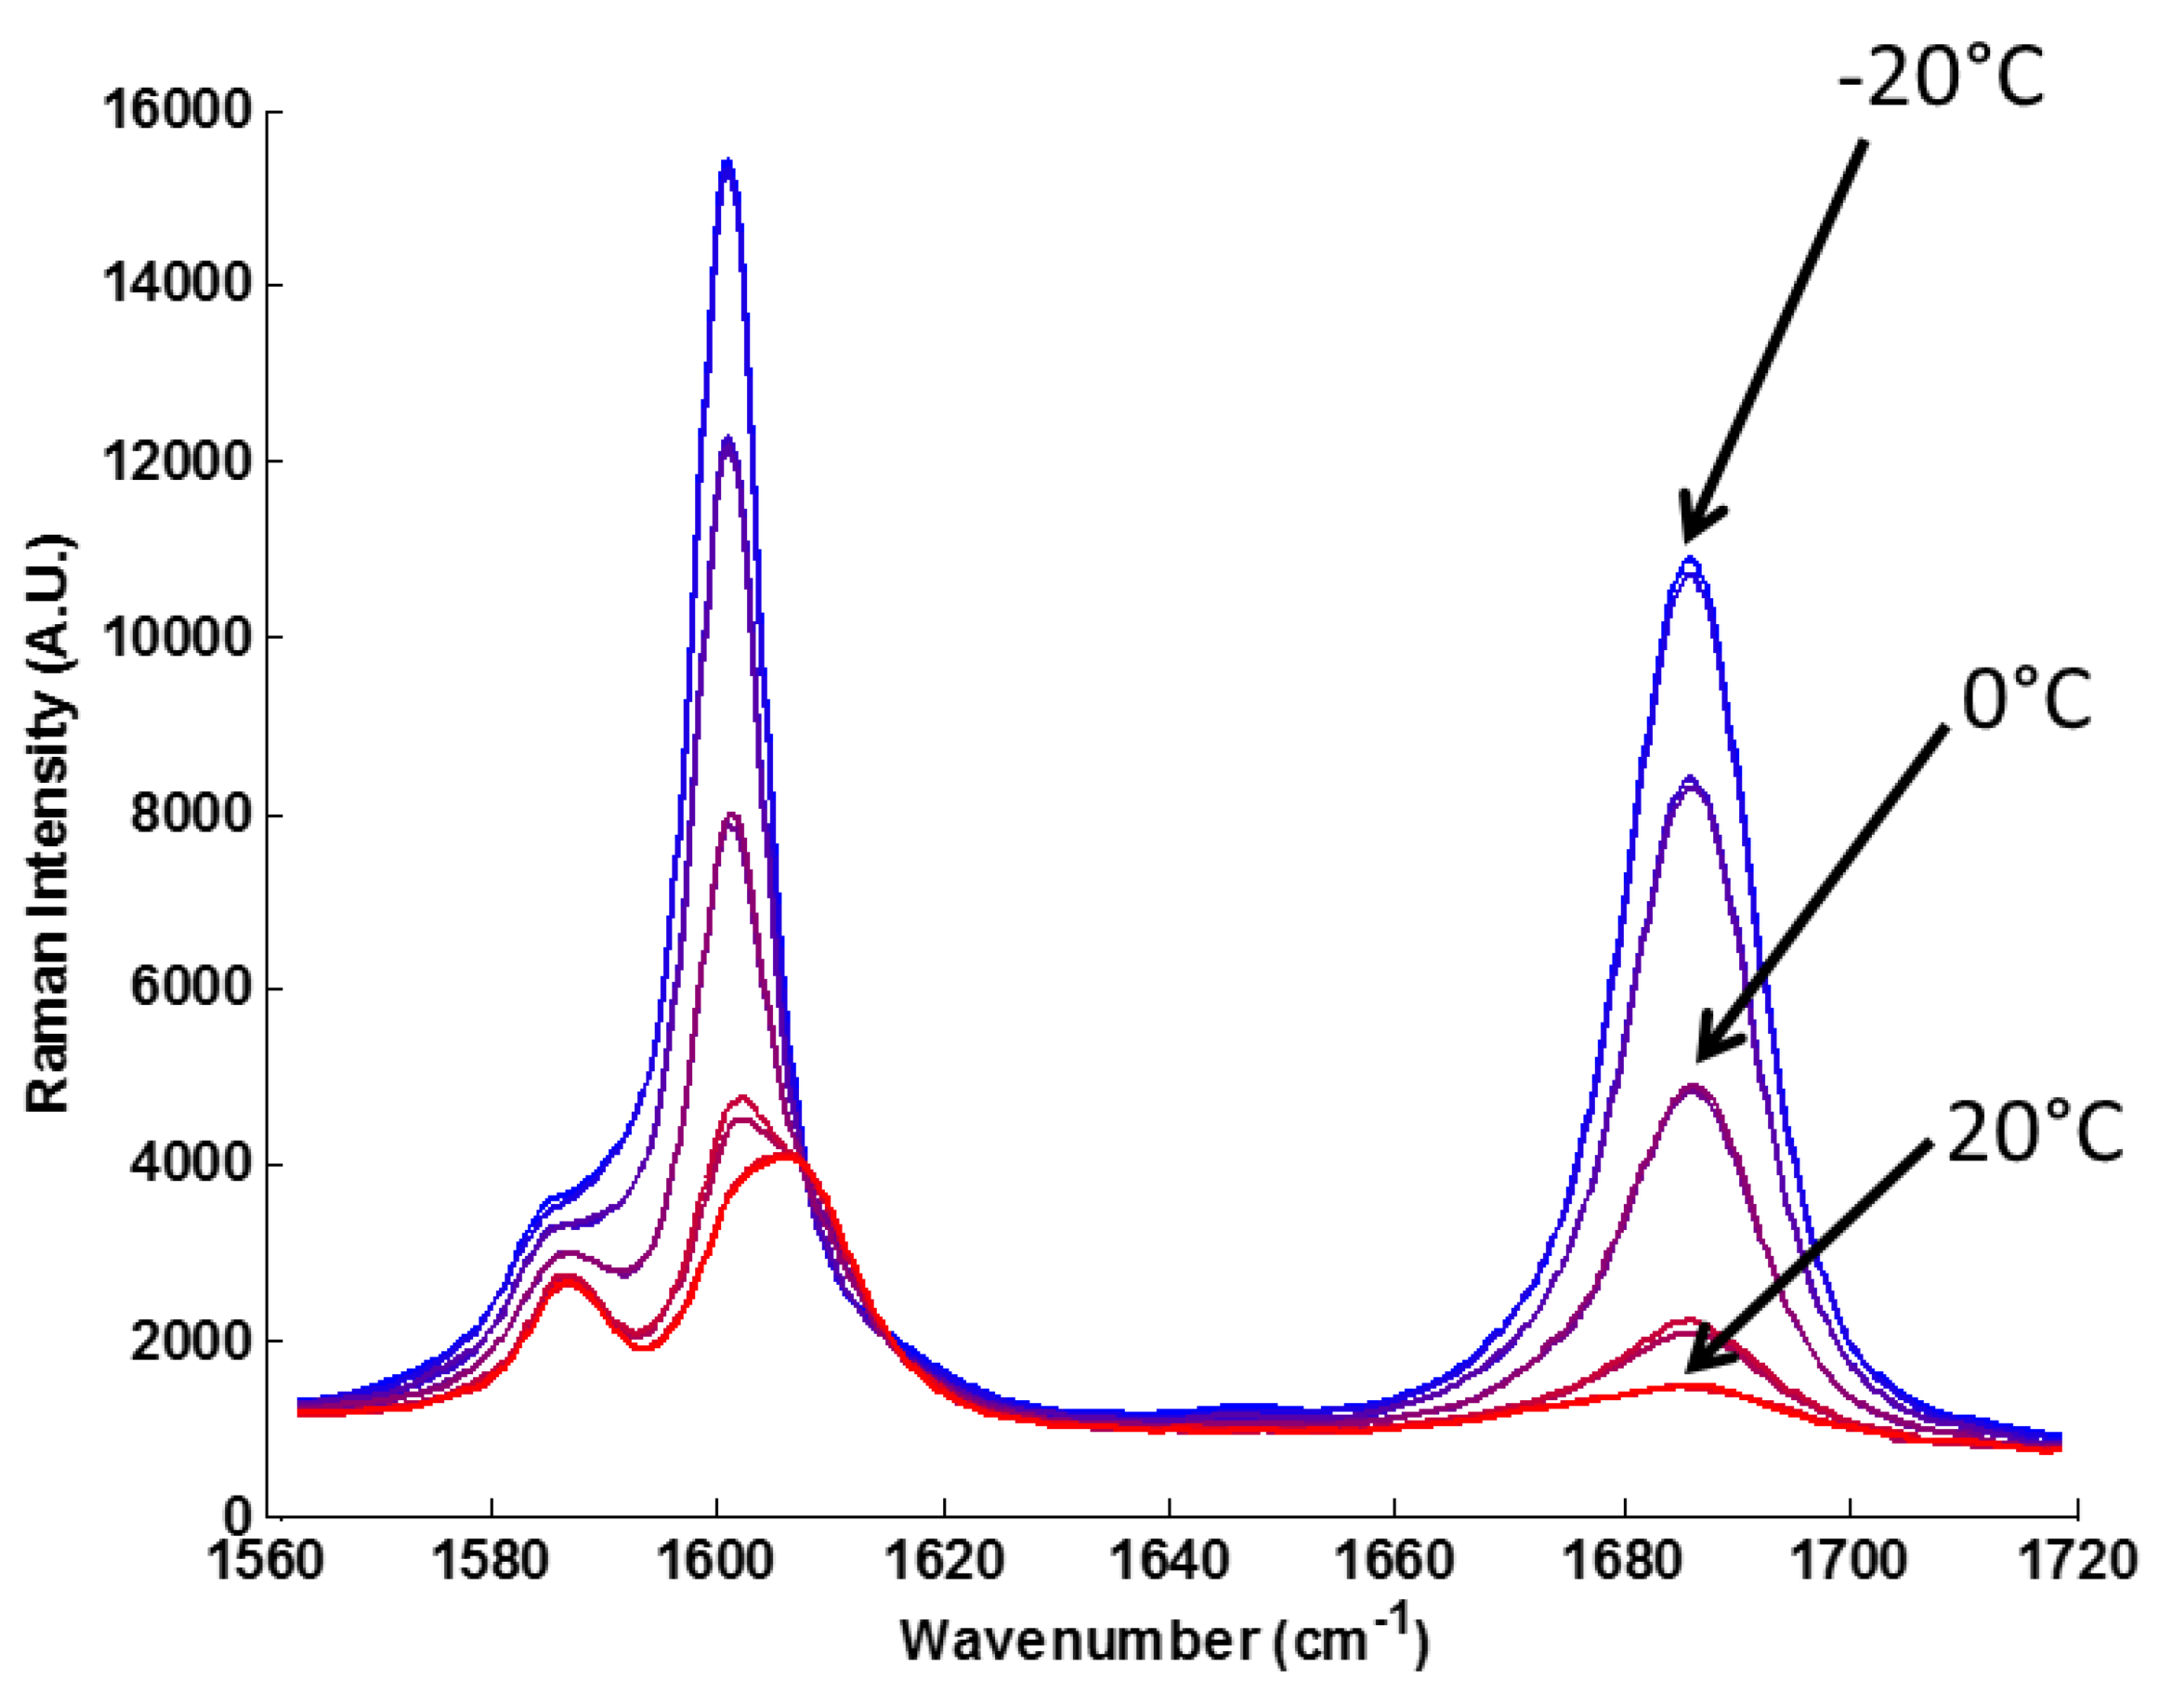
A Raman ball probe on the product line (
Figure 3) performed spectral acquisitions every 15 s. Raman spectroscopy is particularly suitable for monitoring the Swern oxidation due to the strength of the C=O band at 1691 cm
−1 (
Figure 4). Upon exiting the final reactor plate, all chemicals rapidly reached room temperature in the NeSSI sampling system prior to Raman analysis. This was confirmed by a thermocouple upstream of the Raman ball-probe on the product line. Chemical stability was determined via monitoring of the first PCA score from the Raman spectra in real-time. Four sequential scores within an acceptable statistical confidence established chemical steady state (approximately 1 min of sample time). Upon attaining chemical steady state, a single HPLC sample was extracted and analyzed to quantitatively determine the yield of product.
Figure 4.
Wavelength subset of Raman spectra at five different temperatures. While the entire spectrum was used for PCA modeling, this region in particular shows the temperature dependence of the production of acetophenone, with peaks at 1691 cm−1 and 1602 cm−1.
Figure 4.
Wavelength subset of Raman spectra at five different temperatures. While the entire spectrum was used for PCA modeling, this region in particular shows the temperature dependence of the production of acetophenone, with peaks at 1691 cm−1 and 1602 cm−1.
An example of how physical stability and chemical steady state relate to each other is shown in
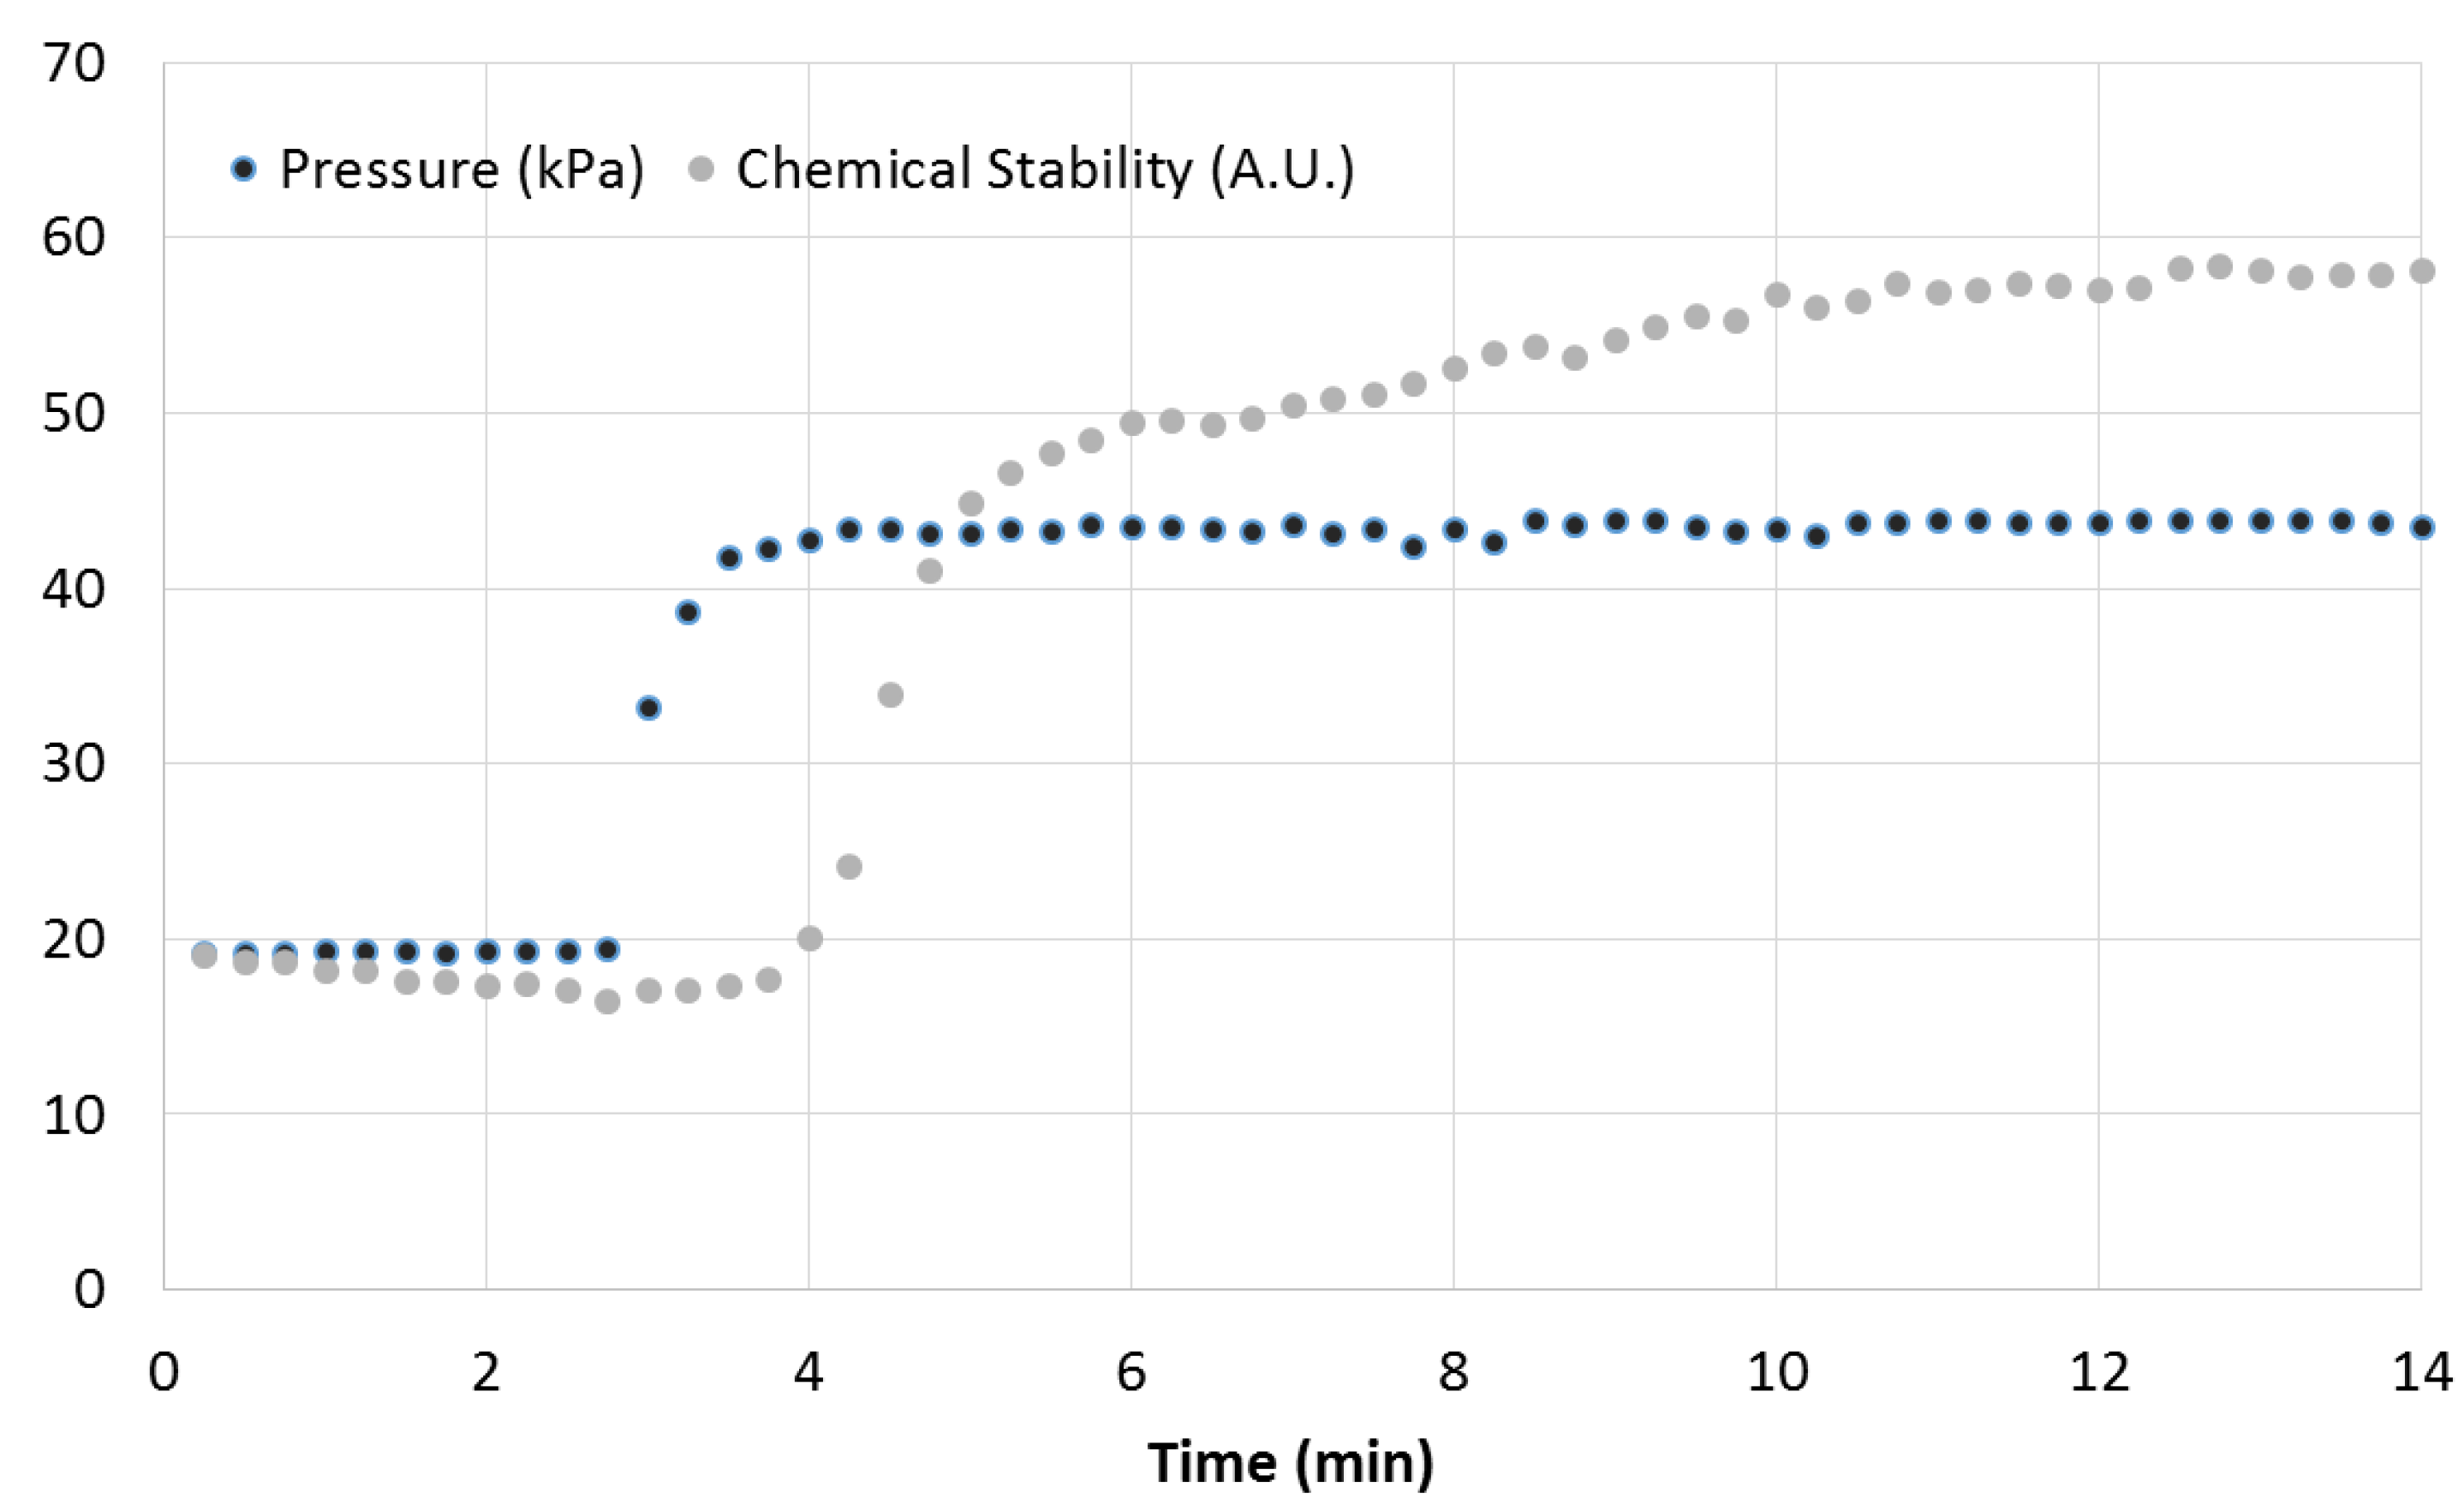
Figure 5. The dark dotted line shows the measured pressure in one of the four reagent lines. At 3 min, the flow rates of the four reagents were doubled from 2 to 4 mL/min. Physical stability is established in less than one minute. The first change in the PCA scores is observed at 4 min, shown in the lighter dotted line. Chemical steady state is reached by 13 min, 10 min after the change in physical conditions. Determining chemical steady state using HPLC would have significantly increased the time to complete reactor optimization. Four consecutive HPLC measurements require an analysis cycle of one hour. This is 60 times longer than Raman monitoring to determine steady state. The real-time Raman information enabled a more effective use of HPLC for validation. Using this technique to rapidly and accurately determine steady state, a 25-point design space was explored in under four hours.
The chemical yield results obtained by using offline HPLC are shown in
Table 1. In batch, at temperatures above −30 °C, no significant product yield was detected (<2%) [
13]. Within the CFR at temperatures above −30 °C the Moffat Swern oxidation had yields ranging from 81% at −20 °C to 37% at 0 °C. As expected due to the exothermic nature of the reaction, yield decreases with increasing temperature. The unstable nature of intermediates
3 and
5 also resulted in lower chemical yield at slower flow rates (
Table 1). This effect has been previously reported by Yoshida
et al. [
12] and Kemperman
et al. [
13].
Figure 5.
Pressure response in a reagent line (dark dotted line) and chemical yield information (light dotted line) that demonstrate physical and chemical steady states and changes in the system. At 3 min, the flow rates of the four reagent lines were doubled. The pressure sensor indicates physical steady state occurring in the reactor at 4 min, and the chemical yield response demonstrates chemical steady state occurring in the reactor at 13 min.
Table 1.
Chemical yield in % product of acetophenone, determined by off-line HPLC.
Table 1.
Chemical yield in % product of acetophenone, determined by off-line HPLC.
| Flow Rate (mL/min) | Temperature |
|---|
| −20 °C | −10 °C | 0 °C | 10 °C | 20 °C |
|---|
| 2 | 34 | 17 | 15 | 4.5 | 1 |
| 4 | 73 | 58 | 31.5 | 7.5 | 2.28 |
| 6 | 80 | 68.5 | 32.5 | 8.5 | 3 |
| 8 | 81 | 73 | 37 | 14 | 5 |
| 10 | 81 | 74 | 37 | 14.5 | 5 |
The information from physical and chemical sensors allowed for rapid exploration of a design of experiments in the CFR in less than four hours. Using HPLC to validate chemical steady state would have required at least 30 h of experiment time. These results demonstrate that the real-time monitoring of physical and chemical steady state in a CFR offers significant advantages for optimizing a reactor system when compared with systems that employ either physical or chemical techniques. This was accomplished through the construction of a reactor designed for PAT implementation using NeSSI sampling systems and Raman spectroscopy. The fast optimization technique is chemistry and hardware agnostic, making this approach a viable means of optimizing any CFR for any suitable chemical reaction.


