Article

Mathematical Modeling and Analysis of Crosstalk between MAPK Pathway and Smad-Dependent TGF-β Signal Transduction

1
Key Laboratory of Advanced Control and Optimization for Chemical Processes of Ministry of Education, East China University of Science and Technology, Shanghai 200237, China
2
Center for Biotechnology and Interdisciplinary Studies, Rensselaer Polytechnic Institute, 110 8th Street, Troy, NY 12180, USA
3
Department of Biomedical Engineering and Department of Chemical & Biological Engineering, Rensselaer Polytechnic Institute, 110 8th Street, Troy, NY 12180, USA
*
Author to whom correspondence should be addressed.
Processes 2014, 2(3), 570-595; https://doi.org/10.3390/pr2030570
Submission received: 6 June 2014 / Revised: 15 July 2014 / Accepted: 21 July 2014 / Published: 4 August 2014
(This article belongs to the Special Issue Modeling and Analysis of Signal Transduction Networks)

Abstract

:
Broad evidence exists for cross talk between the Mitogen-activated protein kinases (MAPK) pathway and Smad-dependent TGF-β signal transduction. A variety of studies, oftentimes involving different cell types, have identified several potential mechanisms for the crosstalk. However, there is no clear consensus on the actual mechanism(s) responsible for the crosstalk. This work develops a model of the pathway, including several hypothesized crosstalk mechanisms, and discusses which of the potential mechanisms can appropriately describe observed behaviors. Simulation results show a good agreement of the findings with results reported in the literature.

1. Introduction

The Transforming Growth Factor β (TGF-β) family of proteins is involved in regulating a variety of cellular processes such as cell proliferation, apoptosis, differentiation, immune functions and tumor invasion/metastasis [1,2,3,4,5]. TGF-β signals through a receptor complex of serine/threonine kinase type I (TbRI) and type II (TbRII) receptors. Upon ligand-binding, this receptor complex activation leads to phosphorylation of cytoplasmic mediated Smad2 and/or Smad3 (R-Smad). This phosphorylation at the C-terminal SSXS motif of Smad2/3 allows them to form a heteromeric complex with the common mediator Smad (C-Smad), Smad4. These complexes translocate into the nucleus and act as transcription factors to regulate target gene expression [1]. The nuclear Smad complexes are then dephosphorylated by Smad phosphatases [6]. It should be noted that while TGF-β activates Smad signaling, Smad plays an important role in the epithelial to mesenchymal transition, which is important for tumor metastasis [7].
While the Smad pathway is considered one of the main pathways for TGF-β signaling, it nevertheless has to be considered in a broader context as other pathways directly influence Smad signaling activity [8,9]. The fact that some of this crosstalk is also activated by TGF-β makes the problem of investigating Smad signaling even more challenging [10].
Mitogen activated protein kinase (MAPK), including Erk1/2, JNK1/2/3, and p38/MAPKs, is a family of kinases. Multiple extracellular stimuli, such as cytokines, Epidermal Growth Factor (EGF), hepatocyte growth factor (HGF), as well as TGF-β, can initiate a cascade of serial phosphorylation activation from MAP kinase kinase kinases (MAPKKKs) to MAP kinase kinases (MAPKKs) and finally to MAPKs [8]. Broad evidence exists for crosstalk of Smad signaling with the MAPK pathway, which has a significant effect on TGF-β induced signal transduction. The crosstalk is highly cell-type dependent and either inhibits or enhances the TGF-β/Smad pathway [8].
Erk activation by TGF-β has been observed in mesenchymal cells. Linker region phosphorylation of Smad2 and 3 by activated Erk resulted in increased half-life of C-terminal phosphorylated Smad2 and 3 and increased duration of Smad target gene transcription [1]. MAPKs play an important role in TGF-β mediated extracellular matrix production in mesangial cells [9]. Hayashida et al. [11] showed that blocking Erk inhibited TGF-β stimulation of Smad2 C-terminal phosphorylation and Smad2 association with Smad4 in human mesangial cells. The interaction is through Erk-induced phosphorylation of Smad2 in the linker region. Funaba et al. [12] reported that constitutively active MEK induced by EGF increased the half-life of Smad2 and enhanced the Smad2-dependent transcription activity in mink lung epithelial cells and COS7 cells. It has been shown that TGF-β induced receptor activation stimulated a parallel p42/p44 MAPK pathway that targeted Smad2 for an increased nuclear translocation and enhanced gene activation [13]. A high level of phosphorylated Smad2 in the linker region (PSmadL) was detected in a fraction of TGF-β treated vascular smooth-muscle cells [13]. In addition, the inhibitors of Erk and p38 attenuated the effect of TGF-β on increasing PSmadL.
Conversely, extensive observations have been reported that Erk negatively regulates the TGF-β induced gene transcription in some hyperactive Ras signaling cells [14,15,16,17]. Kretzschmar et al. [14,15] suggested that oncogenic Ras signaling can directly interfere with Smad-dependent responses by attenuating the agonist-induced nuclear accumulation of Smad1, Smad2, and Smad3 in mammary and lung epithelial cells. This effect is mediated by the phosphorylation of Smad1, Smad2, and Smad3 in the linker region by Ras-activated Erk1 and Erk2 protein kinases. A possible explanation for the contradictory observations is that responses, which depend on a certain level of nuclear Smad activity, may require the counterbalancing effect of Ras signaling to achieve a suitable level of nuclear Smad activity [18]. In a majority of human cancers carrying oncogenic Ras mutations, the activity rather than the levels of Ras expression is elevated. Thus, the levels of Ras activity are affected by the levels of MAPK activity, ultimately shaping the TGF-β response via crosstalk between Smad and the Ras-MAPK pathway [19].
Although crosstalk between the MAPK pathway and TGF-β/Smad signal transduction has been widely described, most of the studies only investigated this relationship for one specific cell type. As it is possible, and even quite likely, that different mechanisms are dominant in different cell types, this paper seeks to model and analyze the different proposed mechanisms. A model of the pathways, including different potential crosstalk mechanisms, is developed and thoroughly analyzed with respect to the effect that these mechanisms have on the observed response. Specific emphasis has been put on uncertainty in the model, as modeling potential mechanisms implies that the model structure is not well known. The goal of the presented work is to contribute to the understanding of crosstalk between the MAPK pathway and TGF-β/Smad signaling.

2. Materials and Methods

2.1. Model of the TGF-β/Smad Pathway

The part of the model representing the TGF-β/Smad pathway used in this work was developed by Zi et al. [6]. This model takes into account the receptor trafficking and endocytosis, Smads nucleocytoplasmic shuttling, Smad complex formation and dissociation, and the ligand induced negative feedback. There are 16 states and 20 parameters in the model. The nominal values of the model parameters were derived from experimental analysis in epithelial cells. The equations and the nominal parameter values for this model can be obtained from the literature [6]. Simulation results which agree well with experimental data include: The level of nuclear Smad complex, i.e., the transcription factor, peaked at approximately 45 min after TGF-β addition and then declined to saturate above the basal level after about 5–6 h; the type I receptor kinase inhibitor SB431542 added at 30 min will cause rapid decrease of the nuclear Smad complex level to the basal level; also, TGF-β caused a change in the overall Smad2 distribution from predominantly in the cytoplasm to predominantly in the nucleus, which suggests TGF-β induces a change in the intercellular location of the majority of Smad2.
Similar to the simulation by Zi et al. two different types of stimulations are implemented in this work. The first stimulation is exposure to a constant level of 2 ng/mL of TGF-β. The second stimulation adds 2 ng/mL of TGF-β for 60 min after which the signal is terminated, which can experimentally be achieved via the addition of the type I receptor kinase inhibitor SB431542.

2.2. Model of the MAPK Pathway

The stimulus-response behavior of the MAPK pathway exhibits ultra-sensitivity and a Sigmoid-like shape [20,21,22]. When the ligand concentration is above a specific value, the variation of the output signal is negligible. Because most of experiments on the crosstalk between the two pathways focused on the low-stimulus response, this work will focus on low stimulus levels where the stimulus-response curves are less steep than those at high stimulation.
Multiple extracellular stimuli (cytokines, EGF, HGF), as well as TGF-β itself, can initiate a cascade of serial phosphorylation activation from MKKKs to MKKs and finally MAPKs. MAPKs such as Erk, JNK or p38 are the kinases of the cascade. The kinases of the first level, MKKKs, are activated by several mechanisms involving Ras (in the case of Erk) activation or other MAP kinase kinase kinase kinases (MKKKKs) activation [22]. Schoeberl et al. established a detailed model of the EGF-stimulated MAPK pathway, which consists of 94 states and 95 parameters using mass action kinetics [23]. However, this model is quite complex and includes a significant amount of detail, which is not necessary for this study, and can possibly even be detrimental due to uncertainties in the interactions of the pathways. In contrast to this, Kholodenko’s model [22], consisting of 8 states and 22 parameters, is used in this work for the three-level cascade from Ras/MKKKKs to MAPKs. The input stimulus of this MAPK cascade is the concentration of activated receptors (Ras/MKKKKs). However, the receptor activation mechanism in response to extracellular stimuli is not well understood for the pathway investigated in this work. In order to address this point, the input stimulus of the MAPK cascade, namely the concentration of activated receptors, can be written as
V1 = V0 exp (−γ (tt0))
where, 1/γ is the characteristic time of activated receptors (Ras/MKKKKs). The smaller the value of γ, the longer the receptor will be in the activated state. In the limiting case of γ→0, the pathway is permanently activated [20]. Here, t0 is introduced to represent the delayed response to extracellular stimuli and V0 is the concentration of activated receptors at t = 0.
Evidence has indicated that the time, level and duration of MAPKs activation are not correlated with a specific cellular function, but it appears to be regulated in a cell-type and stimulus-specific manner [24]. For example, EGF results in a transient activation of MAPK pathway in PC12 pheochromocytoma cells, whereas the nerve growth factor (NGF) is associated with a sustained activation of the MAPK pathway in PC12 cells. Although the exact mechanisms of Erk, JNK, or p38 MAPK activation by TGF-β are poorly understood, it has been observed that TGF-β-induced MAPKs activation also varies with cell type. In some cell lines, delayed activation suggests an indirect response requiring protein translation, whereas in others, activation is rapid and comparable to signaling by EGF [25]. Rapid and transient p38 MAPK activation by TGF-β has been described in certain cell types, including human neutrophils, HEK293, and C2C12 cells, whereas the prolonged and sustained p38 MAPK activation was observed in pancreatic carcinoma cells, hepatocytes and osteoblasts [26]. Hough et al. reported that Erk phosphorylation in mesenchymal cells became significant between 60 and 90 min and increased for at least 3 h after TGF-β addition [1]. In mesenchymal AKR-2B cells, Erk phosphorylation became detectable between 20 and 40 min of TGF-β treatment and remained elevated for at least 120 min [23]. Blanchette et al. [27] observed that TGF-β stimulation of HepG2 cells resulted in a relatively delayed (detectable at the 30 min time point), but sustained, p42/p44 MAPK phosphorylation with a maximum at the 2 h time point.
It is clear that the parameters γ, t0 and V0 are dependent on the cell types and extracellular stimuli used. V0 is dependent on the concentration of the extracellular stimulus. The protein dynamics in the MAPK pathway has a similar nature over the entire range of values for V0. As such, V0 is set to be proportional to the initial concentration of extracellular stimuli. In this case the combination of Equation (1) and the three-level cascade model presented by Kholodenho [22] shows good agreement with the model described by Schoeberl et al. [23]. The stimulus-response behaviors of the two models for proteins of interest to this work have been found to be similar in simulations (data not shown).
Therefore, the combination of Equation (1) and the three-level cascade model presented by Kholodenko [22] is used to describe the MAPK pathway in this work. The nominal values of other parameters of this model can be found in the literature [22].

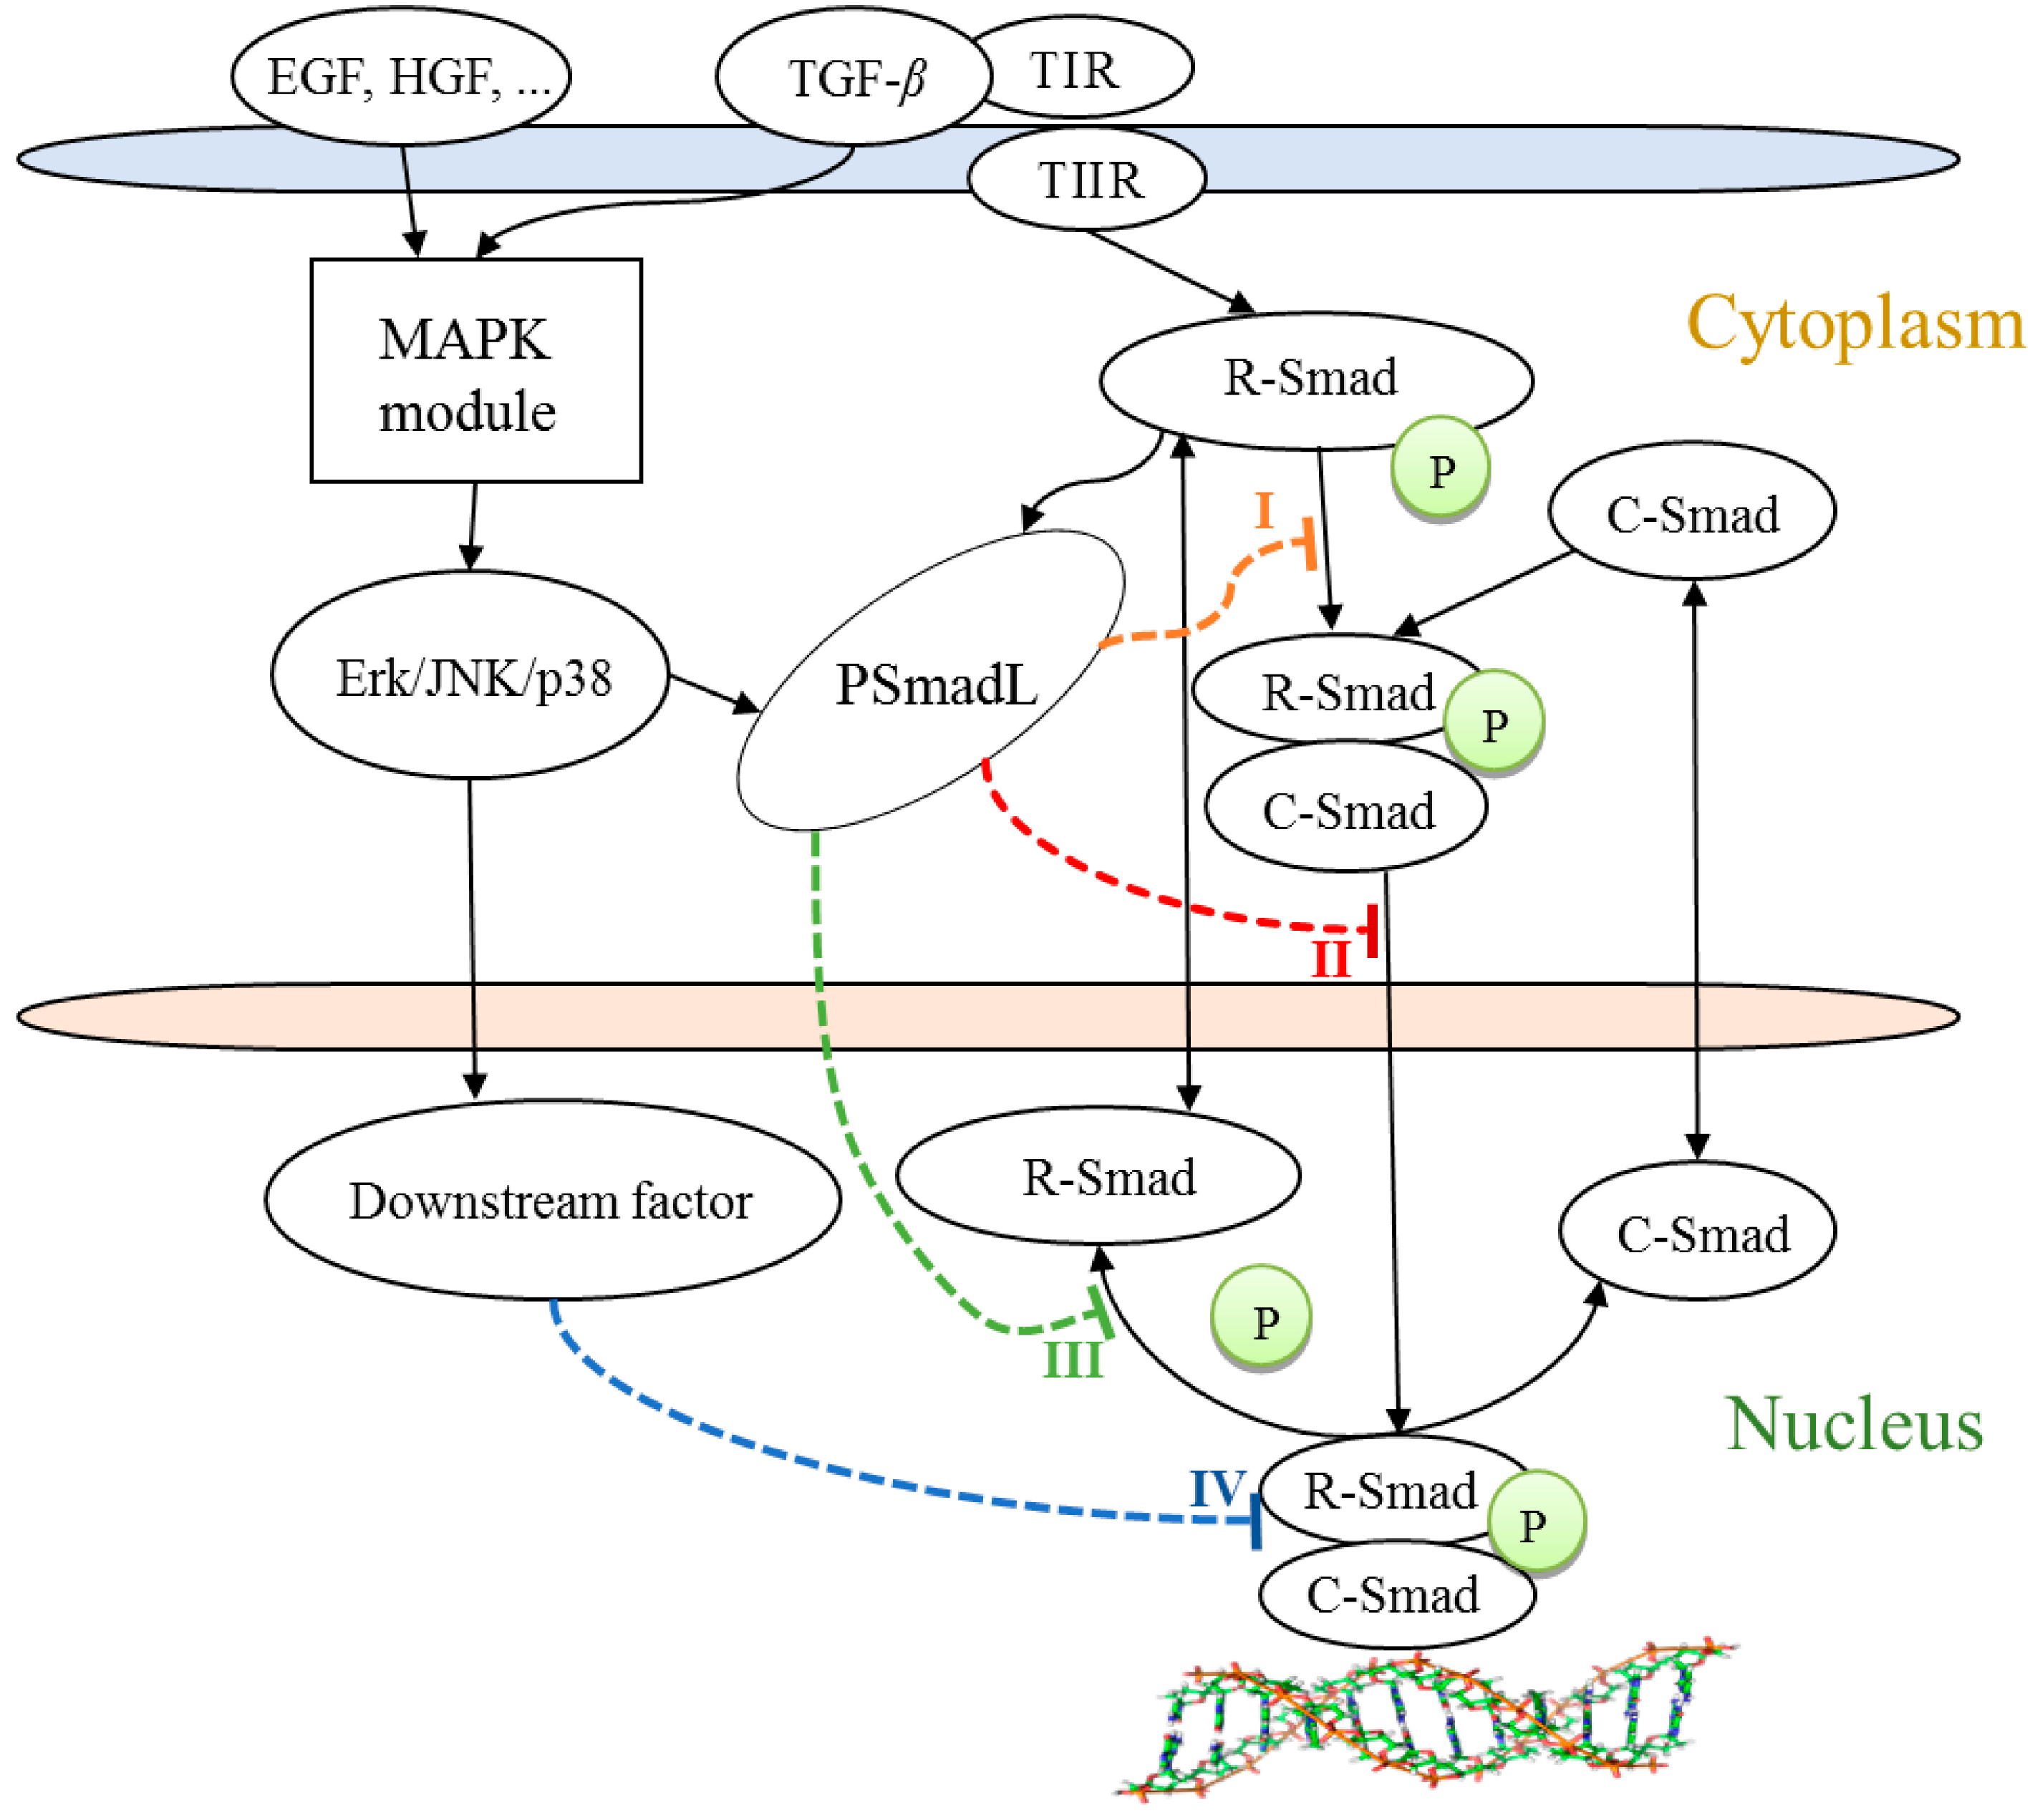
2.3. Interaction Mechanisms Reported in the Literature

As mentioned above, there is significant evidence of interactions between the MAPK and the TGF-β/Smad pathway. A summary of interaction mechanisms reported in the literature is provided below.
A number of studies mention that the linker region phosphorylation of Smad proteins plays an important role on how MAPKs, i.e., Erk, p38, or JNK, affect the TGF-β/Smad pathway [1,2,9,10,11,12,13,14,15]. Reported mechanisms include activated MAPKs phosphorylating R-Smad proteins, regulating nuclear translocation or DNA binding of Smads [9], all of which either enhance or inhibit the TGF-β induced gene expression. Although the exact mechanisms whereby MAPKs regulate Smads nuclear translocation and DNA binding are still unknown, it is clear that multiple interactions between MAPK and Smad pathways might occur depending on the cell types and possibly the extent of MAPK activation. The reported mechanisms from the literature fall into the following categories:
  • Activated Erk, p38 or JNK, phosphorylates R-Smad in linker region. This process attenuates the R-Smad concentration and inhibits R-Smad association with C-Smad in the cytoplasm [2,25].
  • Activated Erk, p38 or JNK regulates the translocation of the Smad complex from the cytoplasm to the nucleus [10].
  • Activated Erk, p38 or JNK phosphorylates R-Smad in the linker region. This phosphorylated Smad (PSmadL) translocates into the nucleus and then inhibits the dephosphorylation, which is linked to the dissociation of the nuclear Smad complex [12].
  • The nuclear transcription factors of the MAPK pathway, c-Fos and c-Jun, bind to the nuclear Smad complex to regulate its transcription activity [9].
The first three interaction mechanisms explain the regulation of Smads nuclear translocation via proteins involved in the MAPK pathway, and the last one describes the regulation of DNA binding of Smads. Interaction IV, the Smad complex association with other transcription factors, was thought to be a possible crosstalk point by many researchers [2,8,9,10,11]. While c-Jun interacts with the Smad transcriptional co-repressor TG-interacting factor (TGIF) to suppress Smad transcriptional activity [28], inhibition of TGIF by Ras is not sufficient to significantly affect the response to TGF-β stimulation [29]. This implies that interactions other than interaction IV must also contribute to the inhibition. Because Smads translocate into the nucleus in response to TGF-β, the interactions between Smads and MAPKs may be regulated largely by the alteration of Smad intercellular localization [30]. Due to this, the focus of this work is on the regulation of Smads nuclear translocation by MAPKs, which is given by the first three interaction mechanisms listed above.
A simplified model of the crosstalk including the four potential interactions is depicted in Figure 1, followed by a survey table (Table 1) of literature studies of the possible interaction mechanisms. The column “assumed mechanisms” in Table 1 refers to the first three interactions affecting Smads nuclear translocation. Some of literature [4,5,6,9,23,27] mentioned evident changes in Smads nuclear translocation due to MAPKs activation, but no detailed kinetic mechanism is provided. This is represented by “*” in Table 1.
Figure 1. Crosstalk between the MAPK pathway and TGF-β stimulated Smad pathway. I, II, III, IV represent four potential mechanisms for crosstalk.
Processes 02 00570 g001
Table 1. Overview of potential interaction mechanisms reported in the literature.
LiteraturesIIIIIIIVDetailsAssumed Mechanism
Hough et al. [1] Experimental paper, PSmad2/3 level and gene expression were enhanced in mesenchymal cellsPSmadL stabilizes R-Smad phosphorylation
Derynck et al. [2] Review paper, Transcription activity was inhibited in hyperactive Ras cells and was enhanced in normal cellsMAPK pathway changes R-Smad phosphorylation, association with Smad4 and nuclear translocation
Javelaud et al. [8]***Review paper, Smad signaling was enhanced or inhibitedPSmadL inhibits or enhances nuclear translocation
Inoki et al. [9]***Experimental paper, gene expression was enhanced in mesangial cellsMAPKs regulate the nuclear translocation
Guo et al. [10]***Review paper: Smad signaling was enhanced or inhibitedMAPKs phosphorylate R-Smad to control their intracellular redistribution
Hayashida et al. [11] Experimental paper, PSmad2/3 level was enhanced in human mesangial cellsMAPKs increase the R-Smad phosphorylation and its association with Smad4
Funaba et al. [12] Experimental paper, transcription activity was enhanced in mink lung epithelial cells and COS7 cellsMAPKs increase the half-life of Smad2 and the amount of Smad complex
Burch et al. [13] * Experimental paper, transcription activity was enhanced in vascular smooth-muscle cellsPSmadL accumulates in nucleus and upregulates transcription
Kretzschmar et al. [14] Experimental paper, nuclear PSmad2/3 level and transcription activity was inhibited in oncogenic Ras mammary and lung epithelial cellsPSmadL attenuates R-Smad nuclear accumulation
Chapnick et al. [19] Review paper, Smad signaling was inhibited in cancer cellsPSmadL attenuates R-Smad phosphorylation
Zhang [25] Review paper, Smad signaling was inhibited or enhancedPSmadL attenuates R-Smad to inhibit its association with Smad4
Blanchette et al. [27]***Experimental paper, nuclear Smad2 level and gene expression were enhanced in mammalian fur cellMAPKs increase nuclear translocation
Massagué [31]**Review paper, Smad signaling was inhibited by Erk in I, IV and enhanced by p38 and JNK in IVMAPKs attenuates Smad accumulation in nucleus
√: Detailed kinetic mechanism is provided; * Evident changes in Smads nuclear translocation due to MAPKs activation is mentioned, but no detailed kinetic mechanism is provided.

2.4. Global Sensitivity Analysis

Parameter sensitivity analysis provides a powerful tool to analyze mathematical models of biological signaling networks. The analysis can improve the understanding of the signaling networks by identifying the contribution of individual factors to the signaling response. Furthermore it can be used to recognize the identifiability of key parameters through their sensitivity vectors, which is essential for estimation of these parameters [32,33].
Local sensitivity analysis addresses model behavior near a particular point in the parameter space—a nominal point, whereas global sensitivity analysis does so over a wide range of parameter values. The Morris method is an example of a global sensitivity analysis method [34] which is more suitable for analysis signal transduction pathway models than a local method. The method consists of a repetition of local evaluations whereby the output derivative di (t) is calculated for each parameter pi by adding a small change ∆i to the parameter:
Processes 02 00570 i001
where, di (t) is called the elementary effect of the i-th parameter at time t, p1, p2, …, pk are the model parameters analyzed, and y is a model output.
The Morris method computes the average of the elementary effects over a number of points in parameter space and will therefore reflect an average of the sensitivity over a region of the parameter space. The mean of the elementary effects is defined as the sensitivity measure
Processes 02 00570 i002
where, Si is the sensitivity measure of output y with respect to the i-th parameter. dij (t) is the elementary effect of the i-th parameter at the j-th sampling point, h is the number of sampling points. The sensitivity is a function of time and sensitivities at different time points are usually concatenated into a sensitivity vector. The sensitivity can be normalized to ensure that the use of different units does not affect the sensitivity analysis results.

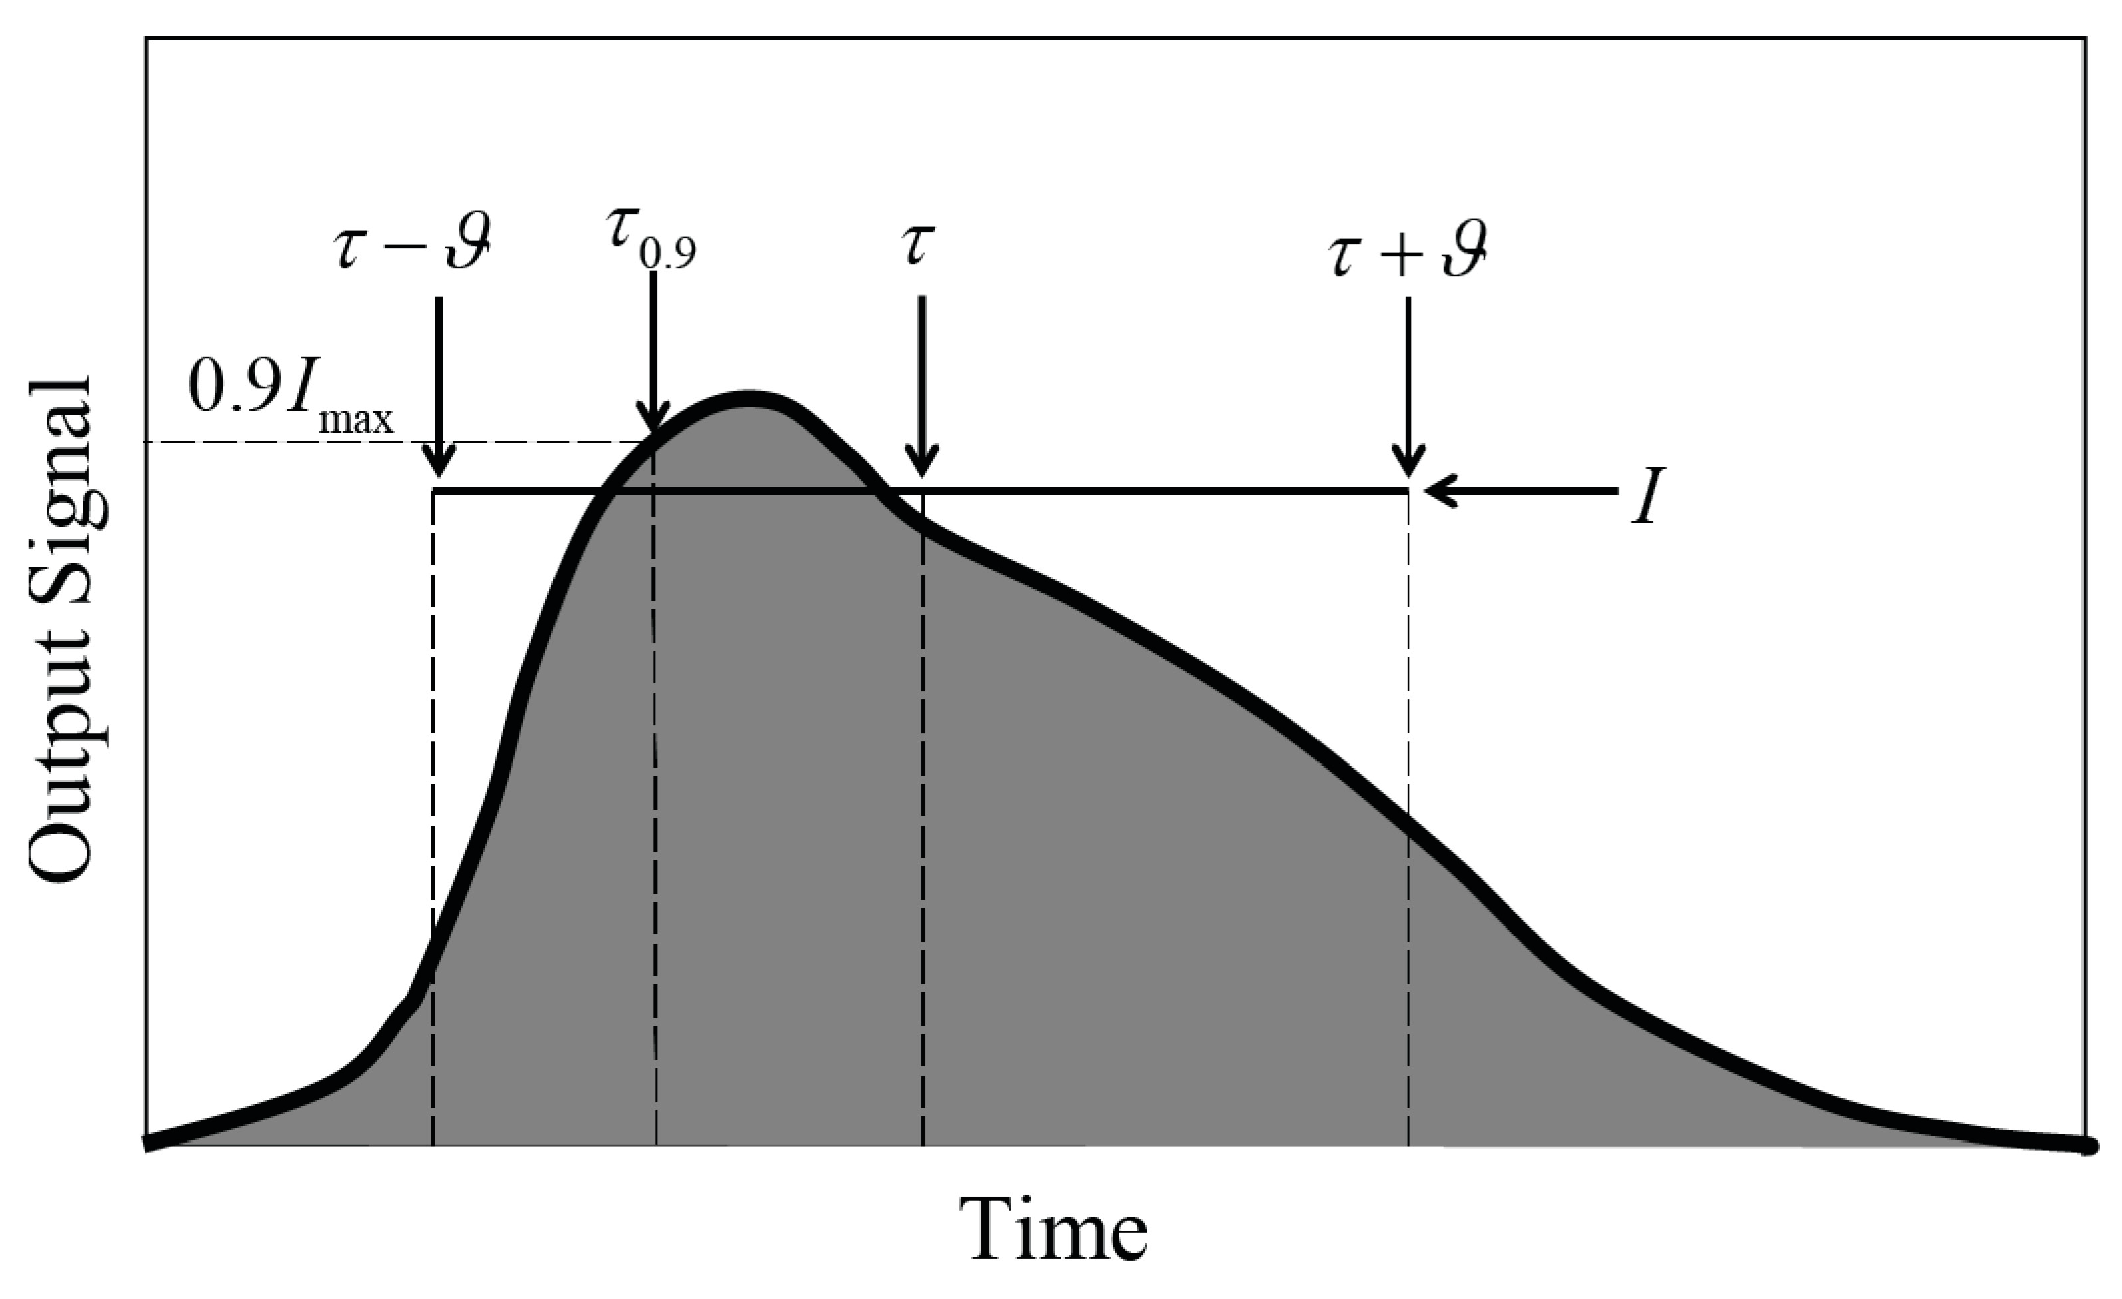
2.5. Measures for Evaluating Output Signals

Three key characteristics are used to evaluate output signals, i.e., the transcription factor concentrations, of the pathways. These three characteristic parameters are the signal time τ, signal duration ϑ and signal amplitude I, and are calculated numerically from the output signal y (t) [20].
Processes 02 00570 i003
Processes 02 00570 i004
Processes 02 00570 i005
τ and ϑ represent the average time to activate the output element and the average time during which this output component is activated, respectively [20]. I is defined as the ratio of total amount of the output signal and duration ϑ of the signal, providing a measurement of the average concentration of the output element [20]. These parameters are difficult to interpret if the output signals do not return to zero, as τ and ϑ will grow over time in this case. In order to deal with this situation, another measure, τ0.9, is defined which evaluates how fast a system responds. τ0.9 is defined as the time at which 90% of maximal output signal is reached [21]. Figure 2 shows the geometric interpretation of the three measures used [20].
Figure 2. Geometric representation of signal time, signal duration and signal amplitude.
Processes 02 00570 g002

3. Model Development

As mentioned above, the individual models of the TGF-β/Smad pathway and the MAPK pathway have been described in detail in the literature [6,22]. In addition, several potential interactions have been proposed which can be responsible for crosstalk between these two pathways. However, the crosstalk has not been modeled in published studies. Furthermore, most of the studies only investigated one specific type of crosstalk, usually the one dominant in a particular cell type, and the underlying interaction kinetics was not determined. This paper seeks to address these points by developing a model of the pathways, including different potential crosstalk mechanisms, and thoroughly analyzing the effect that these different mechanisms have on the observed response.

3.1. Potential Crosstalk Mechanisms

Three potential interaction mechanisms have been reported in the literature for the regulation of Smads nuclear translocation via proteins involved in the MAPK pathway. As shown in Table 1, the first interaction (point I in Figure 1) is supported by most of studies, whereas there are fewer references mentioning the second potential interaction (point II in Figure 1). Some references discussing the second interaction implied that MAPKs regulation of the import of cytoplasmic Smad complex to the nucleus functions by attenuating R-Smad, which results in the same kinetics as the first interaction. Similarly, there are fewer studies investigating the interaction at point III. A few experimental studies [1,2] have concluded that activated MAPKs increased stability of C-terminal phosphorylated R-Smad and the amount of the nuclear Smad complex. However, the underlying interaction kinetics have not been disclosed.
Data suggest that the linker region phosphorylation of Smad2 (PSmadL) by the MEK1-Erk pathway does not directly affect Smad2 affinity for Smad4 [12]. It is assumed that PSmadL attenuates R-Smad to inhibit its association with C-Smad which causes the negative regulation of TGF-β/Smad signaling by the MAPK pathway [19]. However, this argument cannot explain the opposite effect of the MAPK pathway on TGF-β/Smad signaling reported in several sources in the literature [1,9,11,12,13,27]. As previously mentioned, some studies suggest that the levels of Ras activity could dictate the outcome of the cross talk [18,19]. Responses to TGF-β may require the counterbalancing effect of Ras signaling to achieve a suitable level of nuclear Smad activity. Based on this, a possible kinetics for the positive regulation of TGF-β/Smad signaling by MAPK pathway is proposed in this paper: nuclear PSmadL inhibits the dephosphorylation (or dissociation) of the nuclear Smad complex via attenuating the nuclear phosphatase, which enhances the Smad-mediated transcription activity.
It is suggested that the increase of the nuclear Smad complex, which upregulates the gene expression, is closely associated with nuclear PSmadL. Experiments by Hough et al. [1] and Funaba et al. [12] showed that most of PSmadL was found in the nucleus of cell fibroblasts. These data do not preclude the possibility of cytoplasmic phosphorylation of Smad2 in the linker region, followed by a rapid nuclear translocation [13,35]. Burch et al. [13] also discussed that nuclear PSmadL upregulates the gene activity in vascular smooth-muscle cells. On the other hand, it is well known that phosphatase inhibition is the most effective way that one signaling pathway can influence another [20]. Hough et al. [1] suggested that the negative control of the concentration of the nuclear Smad complex is due to the dephosphorylation of the nuclear Smad complex, which implies that the nuclear phosphatase has a strong negative control on the nuclear Smad complex level. Thus, phosphorylation of Smad in the linker region directly or indirectly attenuates the nuclear phosphatase and offsets its negative control on the nuclear Smad complex level. The attenuated phosphatase decreases the dephosphorylation rate of the nuclear Smad complex and thereby affects the its concentration of the nuclear Smad complex [12].
The above discussion supports the hypothesis that nuclear PSmadL, initiated by activated MAPKs, inhibits the dephosphorylation of the nuclear Smad complex, which enhances the Smad-mediated transcription activity. Therefore, the third interaction (point III) may explain the positive regulation while the first one (point I) accounts for the negative regulation. Points I and III are assumed as the possible crosstalk points of the MAPK and TGF-β/Smad pathways.

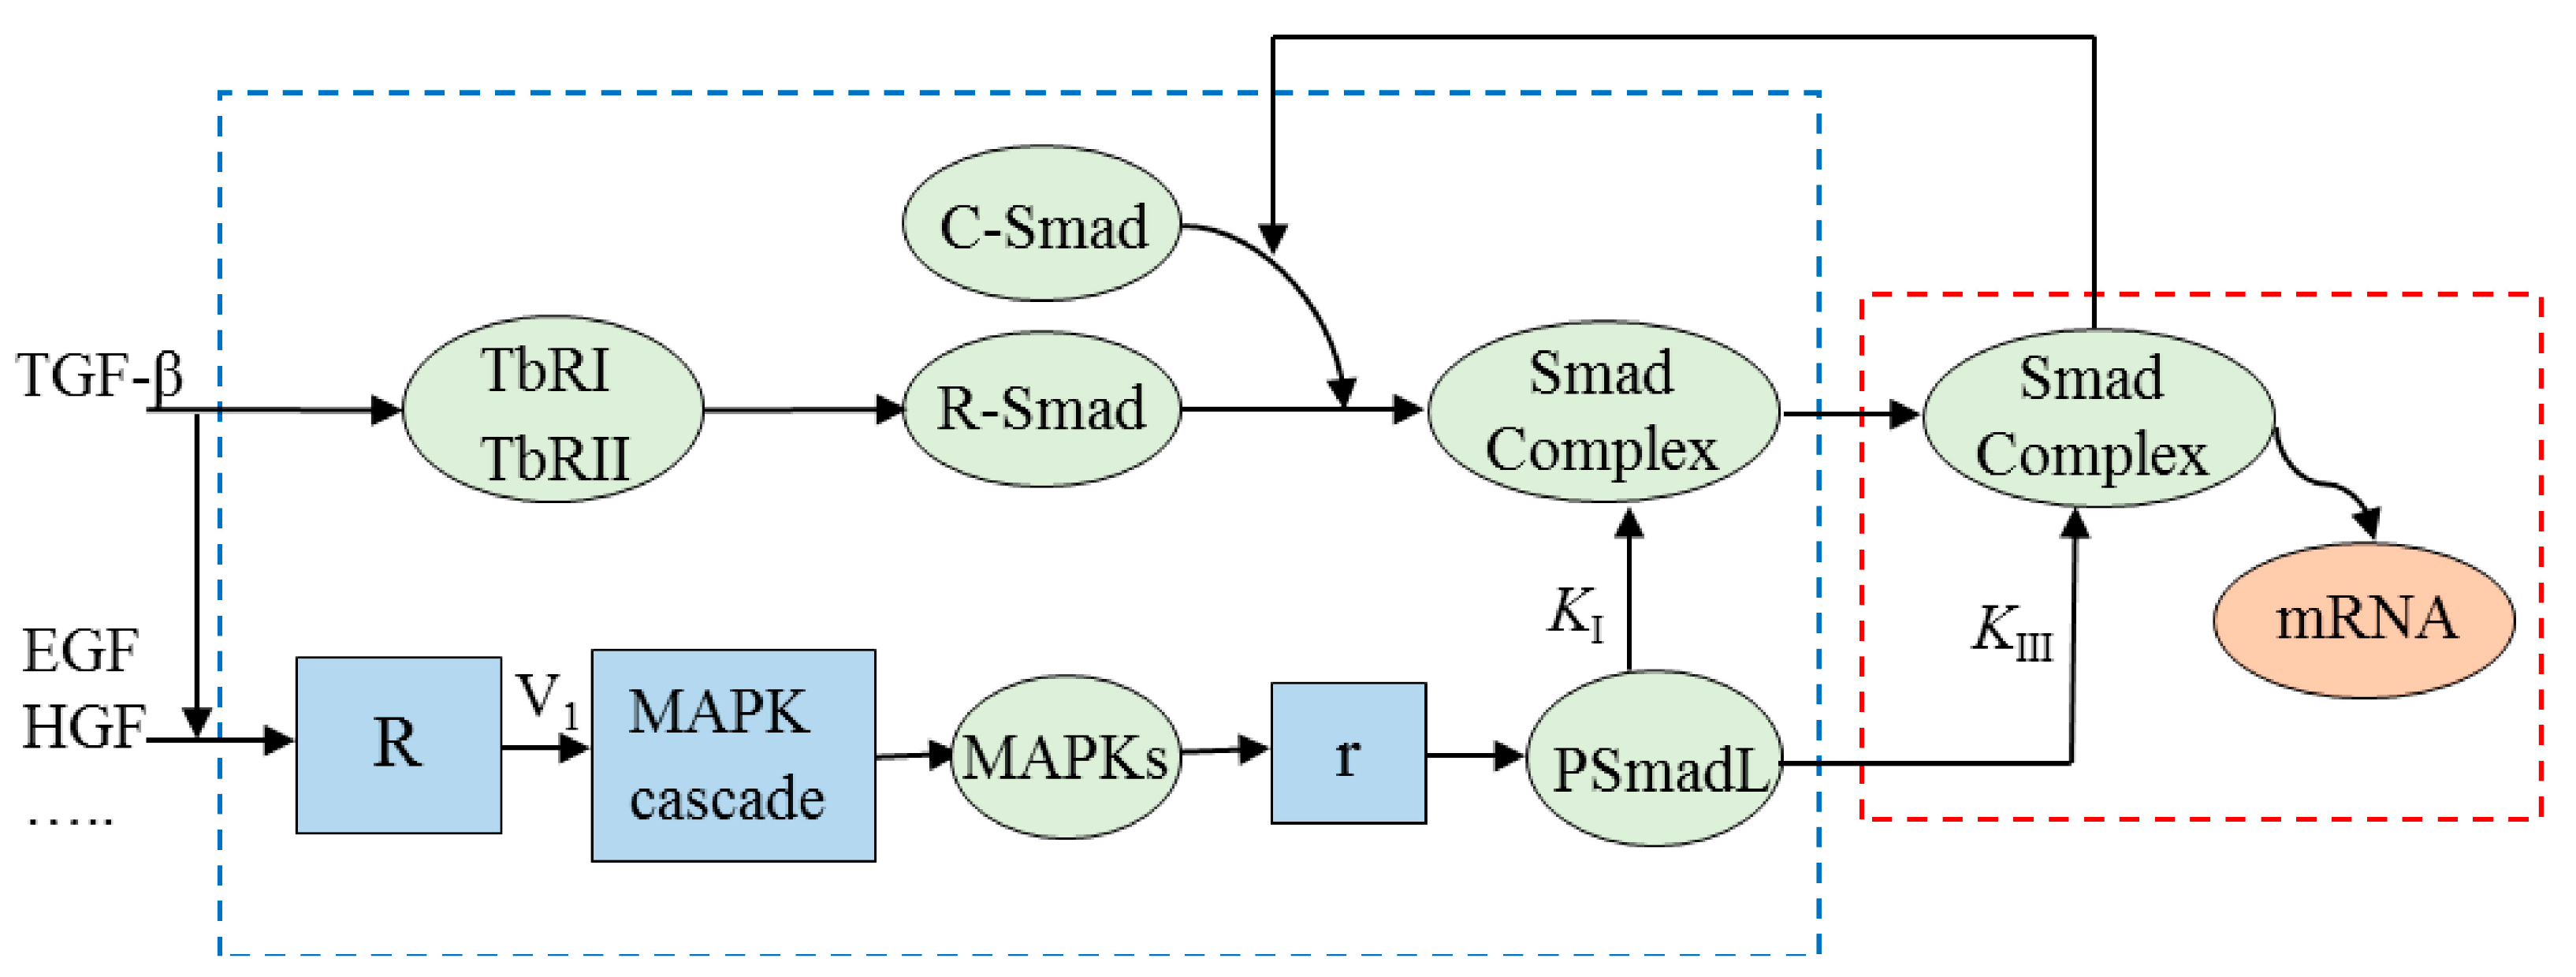
3.2. Modeling Potential Crosstalk Mechanisms

It is generally acknowledged that PSmadL is a key component for integrating MAPK signals with the TGF-β/Smad pathway [1,2,9,10,11,12,13,14,15]. However, the exact kinetics of the Smad linker region phosphorylation by MAPKs is poorly understood. The time course of TGF-β-mediated Smad2 linker region phosphorylation, as well as Erk phosphorylation, have been reported in Western blots in mesenchymal cells [1]. These data indicated that the time course of Smad2 linker region phosphorylation has a similar nature as the one for Erk phosphorylation. A linear relationship is often used to link PSmadL and MAPKs [21] from Figure 1. A similar assumption was made for the relationship of activated receptor and proteins involved in the interaction when modeling the crosstalk between the MAPK pathway and other pathways [20].
The potential crosstalk discussed in Section 3.1 is modeled through incorporating PSmadL into the original model of TGF-β/Smad pathway. At point I, shown in Figure 1, PSmadL can attenuate R-Smad and consequently inhibit the R-Smad association with C-Smad in the cytoplasm, which consequently decreases the concentration of the nuclear Smad complex. This interaction function can be incorporated by rewriting the reaction rate describing the formation of the Smad complex:
Processes 02 00570 i006
where, [PSmadL] represents the concentration of interaction component PSmadL and is directly proportional to the concentration of MAPKs. KI describes the interaction strength, i.e., the smaller the value of KI, the stronger the interaction will be. m is an adjustable parameter to control inhibition strength, and is set to m = 1 in this work. ksmads-complex is the original reaction rate constant, equal to 6.85 × 10⁵ nM2·min1 [6].
At point III shown in Figure 1, PSmadL may translocate into the nucleus and inhibit the dissociation of the nuclear Smad complex, which increases the concentration of the nuclear Smad complex. This behavior can be modeled by revising the reaction rate of the dephosphorylation of the nuclear Smad complex:
Processes 02 00570 i007
where KIII is defined in the same way as KI, and m = 1. Processes 02 00570 i008 is the original dephosphorylation rate, equal to 0.1174 min−1 [6].

3.3. Integrating the Individual Components of the Model

As described as Section 3.2, the interactions at point I and III account for two opposite effect of MAPKs on the TGF-β/Smad pathway. This section integrated these two competing effects into the original models which results in a model representing the MAPK and TGF-β/Smad pathways as well as their interactions. A schematic of the model is shown in Figure 3. “R”, “MAPK cascade” and “r” in the blue-shaded frames represent the modules of Ras/MKKKKs receptor activation by extracellular stimuli, three-level serial phosphorylation of MAPK cascade and the linker region phosphorylation of R-Smad by activated MAPKs, respectively. The two interactions of the MAPK and the TGF-β/Smad signaling pathways, i.e., inhibition and enhancement, are also shown. It can be hypothesized that the two opposite effects define specific cellular responses to TGF-β. A detailed description of the equations of this model can be found in Appendix I.
Figure 3. Representation of crosstalk between MAPK and Smad signaling pathways.
Processes 02 00570 g003

3.4. Simulation Results

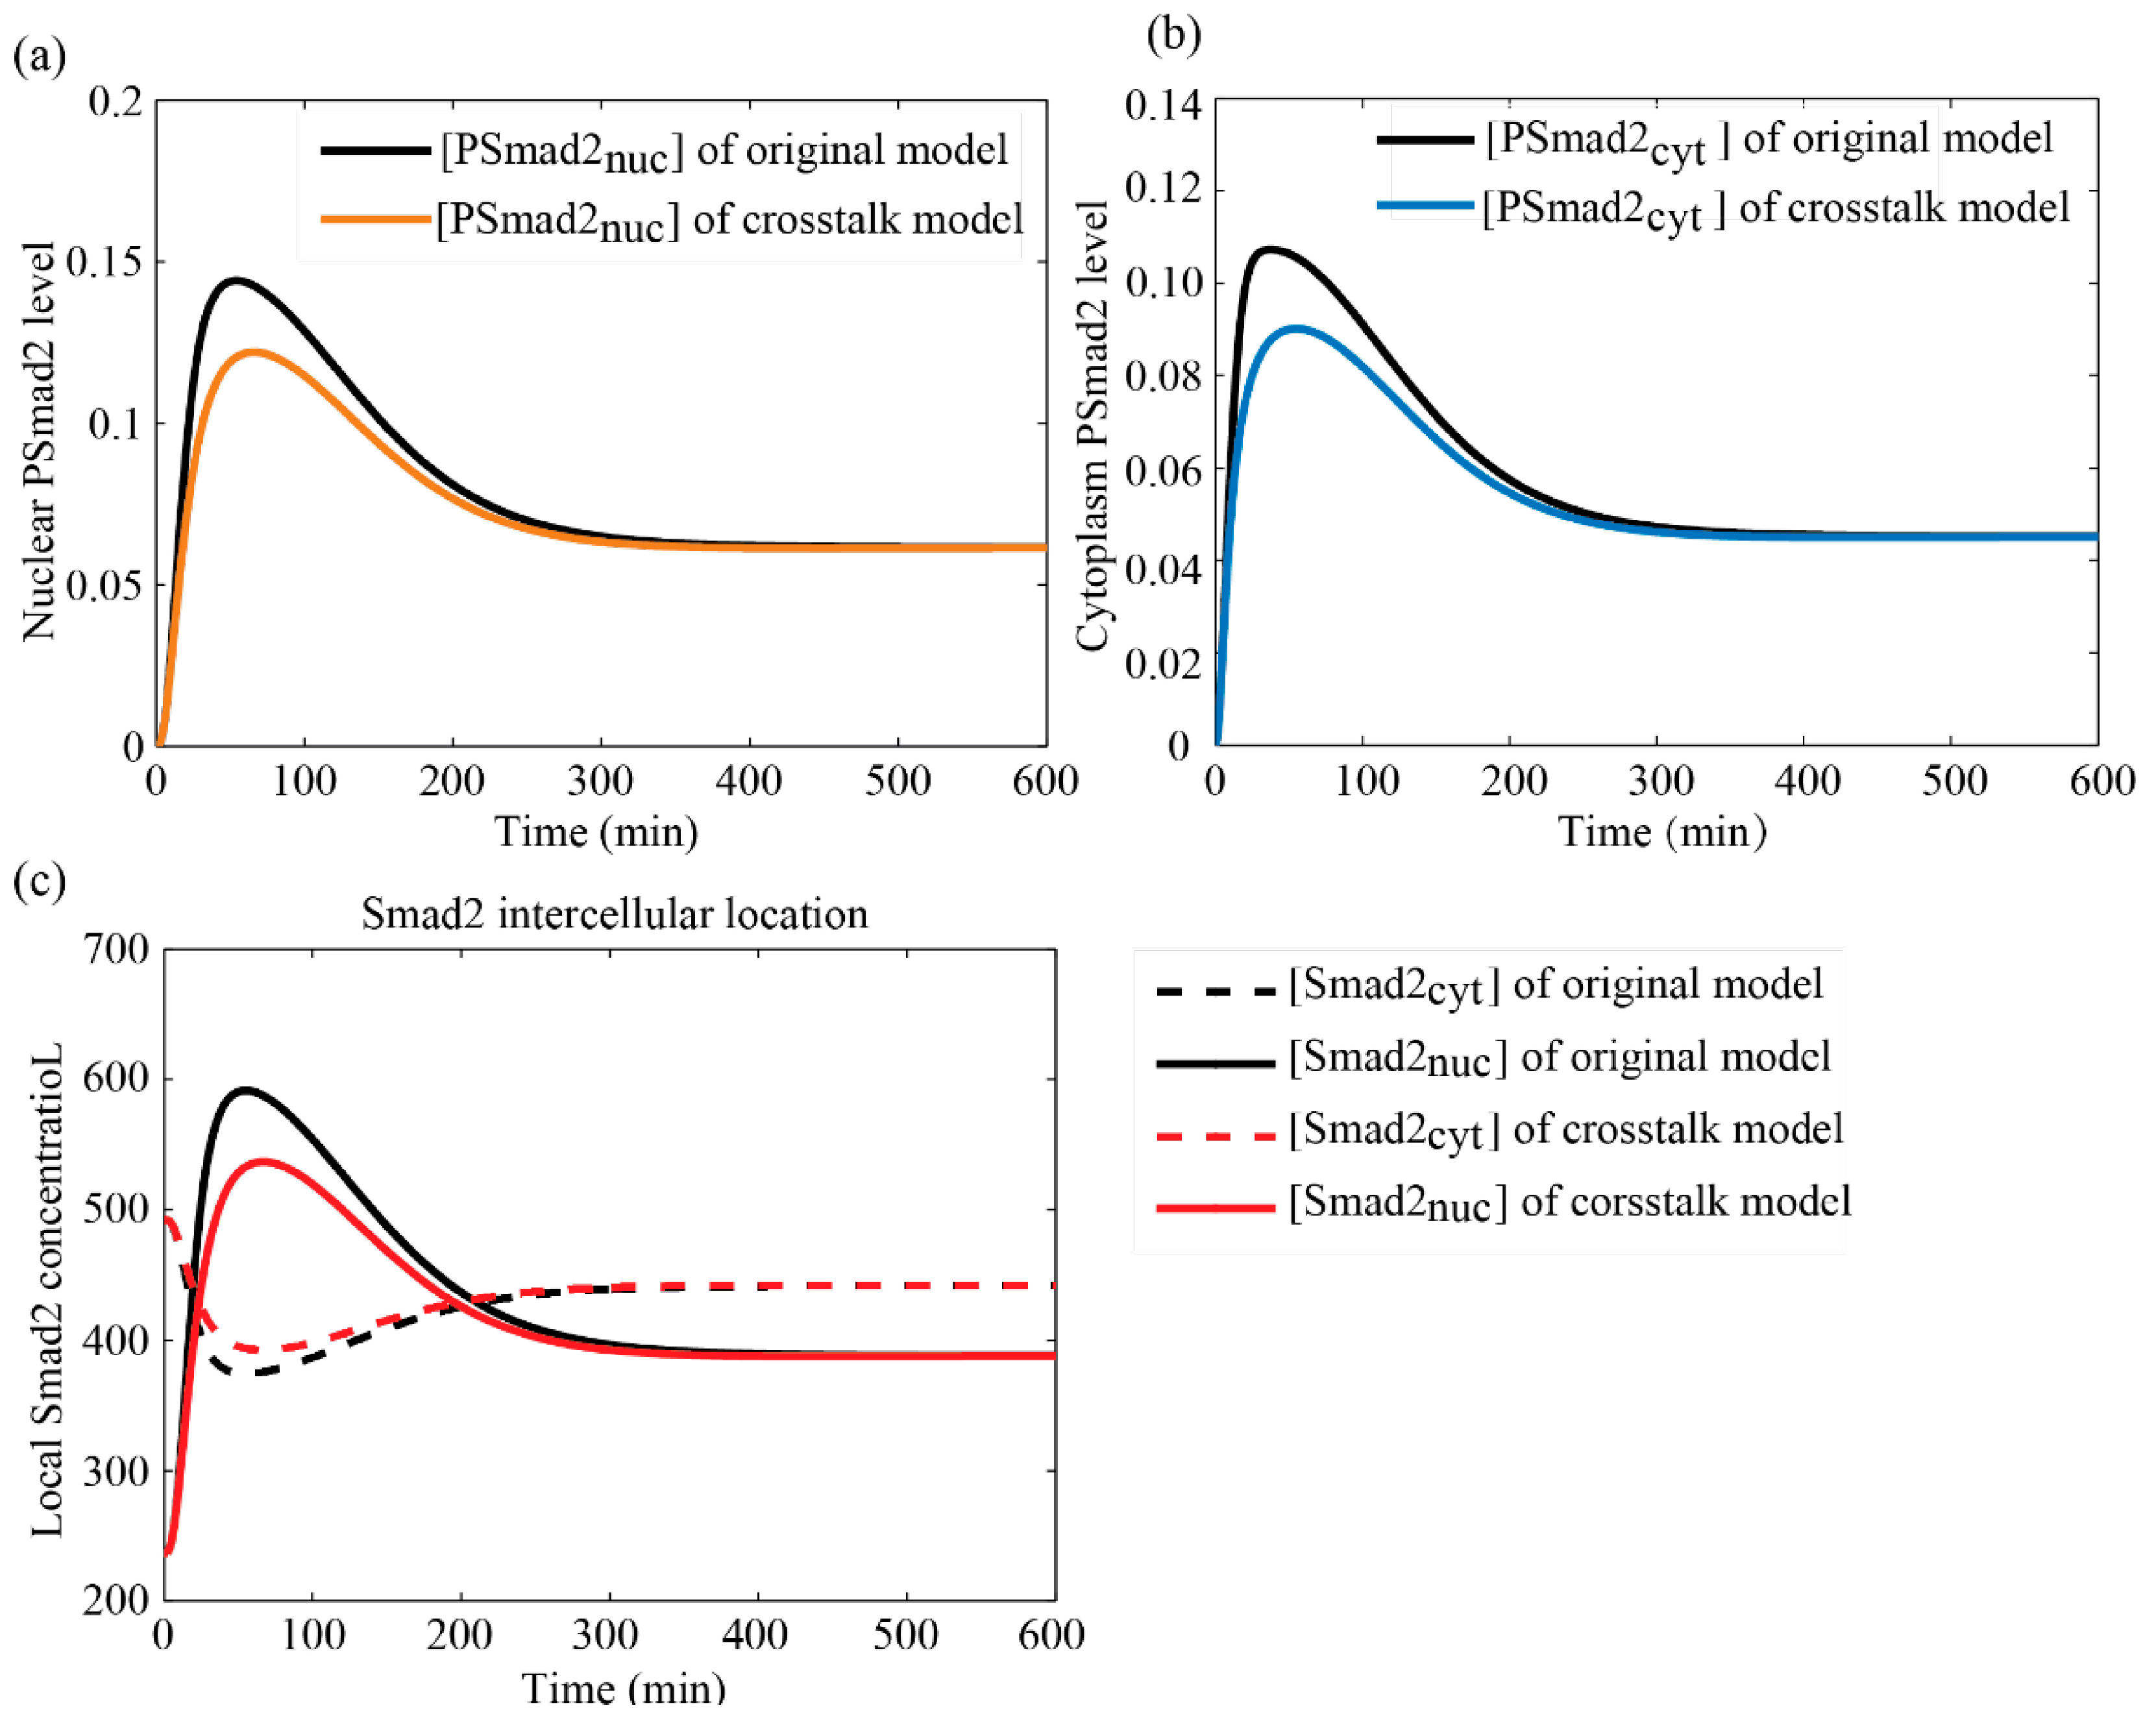
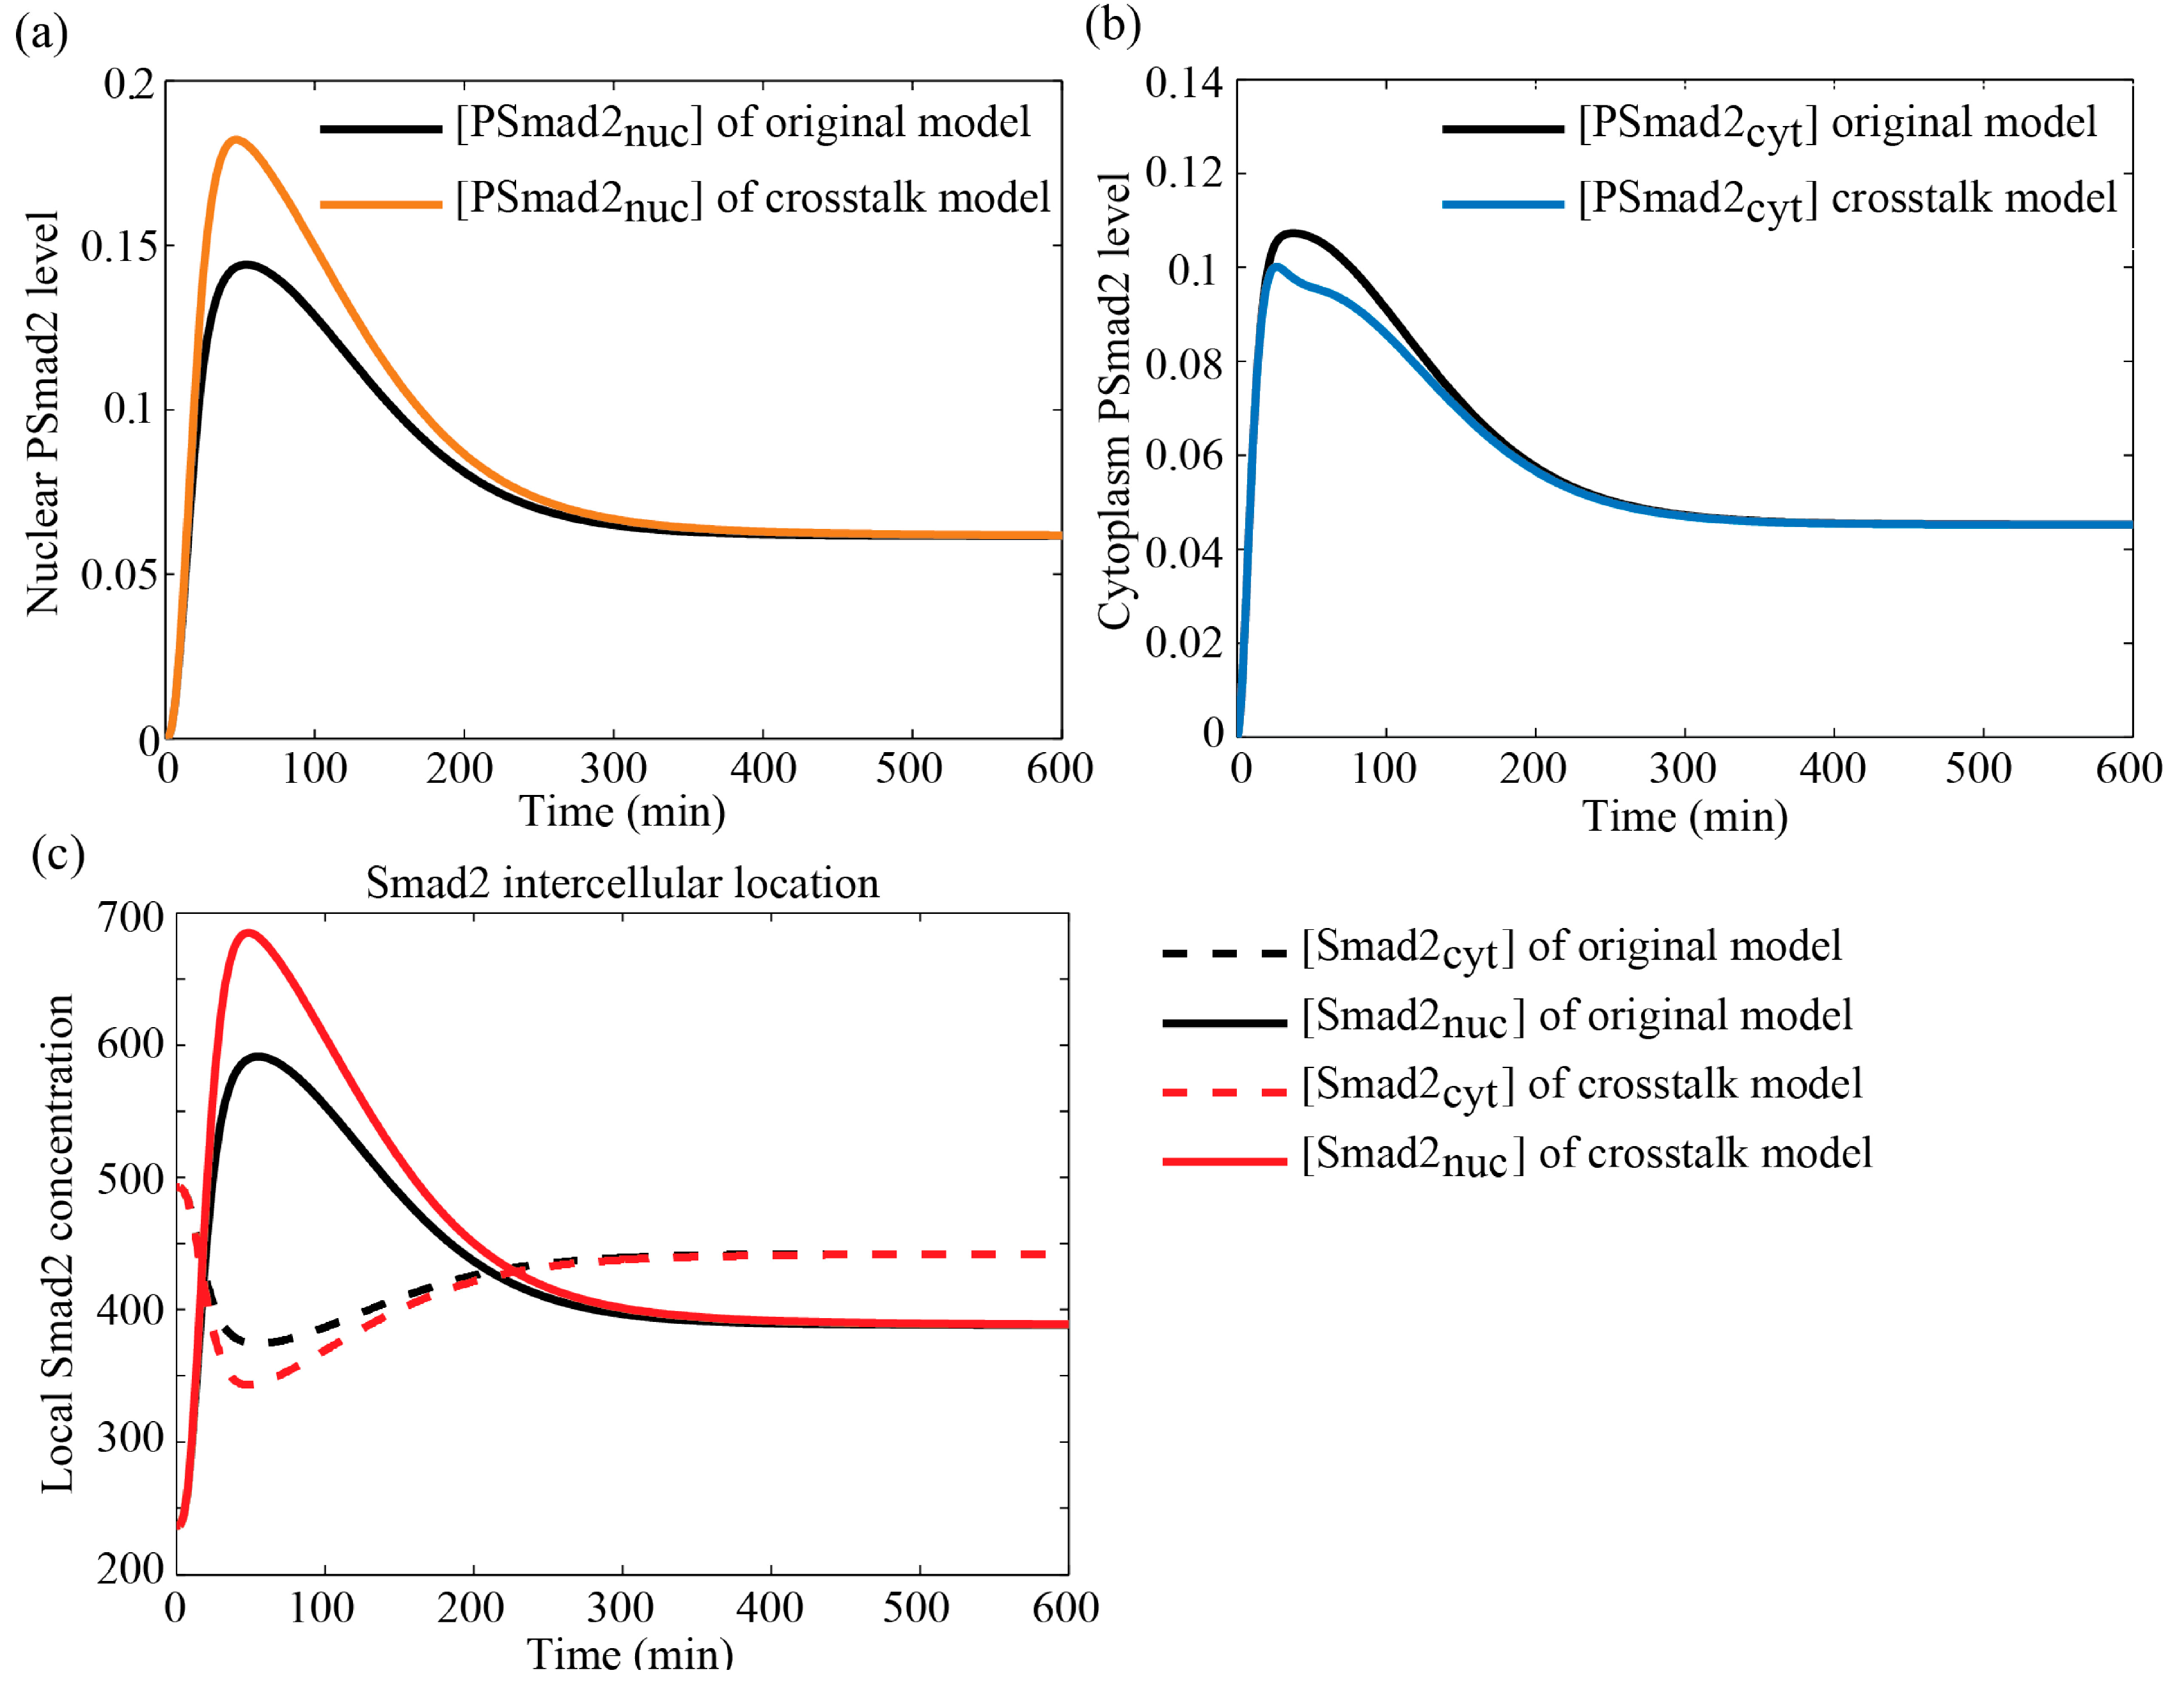
3.4.1. Comparisons between Crosstalk Model and Original Model

The developed model is used in simulations in this section and the results are compared with the simulated data presented by Zi et al. [6]. A continuous TGF-β stimulation (2 ng/mL) is used for the simulations. MAPKs activation may be induced by any of the extracellular factors such as TGF-β, EGF, HGF and others as the model does not explicitly account for these extracellular factors. V0 is set to 0.18 which suggests a low level of MAPKs activation. t0 is set to zero which indicates MAPKs activation without time delay and γ is set to 0.001 which represents a transient MAPKs activation. The nuclear and cytoplasmic PSmad2 levels, calculated from the crosstalk model, are compared with the simulated data from the original TGF-β/Smad model [6]. Figure 4 shows the simulated data for the crosstalk model and original model presented by Zi et al. for the case where only inhibition occurs (KI = 1, KIII→∞). Similarly Figure 5 shows the simulated data for the two models for the case where only enhancement is taking place (KI→∞, KIII = 1). As described in [6], the shape of the profiles of nuclear and cytoplasmic PSmad2 level are very similar. For the case where only inhibition is considered, PSmanL is assumed to attenuate the Smad2 level and further inhibit the formation of the Smad complex in the cytoplasm. It will cause a decrease of the PSmad2 level in the cytoplasm as well as in the nucleus, which is consistent with the simulated data shown in Figure 4a,b. Conversely, for the case where only upregulation is considered, PSmadL is assumed to inhibit the dissociation of the nuclear Smad complex. Thus, the nuclear PSmad2 level will increase, which agrees well with the data shown in Figure 5a. This effect will cause a distinct decrease of Smad2 level in the cytoplasm as well as the nucleus (data not shown) and consequently leads to a slight decrease of the cytoplasmic PSmad2 level which can be seen in Figure 5b. Simulated data from the two models are consistent with the theoretical analysis expected from the interactions. Furthermore, simulated data of the Smad2 intercellular locations for the crosstalk model also show that TGF-β stimulation induced a change in the overall Smad2 distribution from predominantly in the cytoplasm to being mainly in the nucleus as shown in Figure 4c and Figure 5c, which is in agreement with the literature [6]. Simulation results using a pulse stimulation of TGF-β (2 ng/mL) for the first 30 min are also consistent with theoretical analysis and literature reports (data not shown).
Figure 4. Comparison of simulated data obtained from the crosstalk model and from the original model presented by Zi et al. [3] when only the inhibition is present for (a) nuclear PSmad2 level; (b) cytoplasmic PSmad2 level; and (c) Smad2 intercellular location. Note that the PSmad2 level is a relative value. Its unit is nmole when the extracellular medium volume is set to 1 Liter [6].
Processes 02 00570 g004
Figure 5. Comparison of simulated data obtained from the crosstalk model and from the original model presented by Zi et al. [3] for the case where only enhancement is present: (a) nuclear PSmad2 level; (b) cytoplasmic PSmad2 level; and (c) Smad2 intercellular location. Note that the PSmad2 level uses the same unit as described in the caption of Figure 4.
Processes 02 00570 g005

3.4.2. Comparison with Literature Data

As shown in Table 1, many studies suggest that the crosstalk between the MAPK and the TGF-β/Smad pathways either increase or decrease the nuclear PSmad2 protein level. However, the exact amounts of the increase or decrease are usually not mentioned as the data are often qualitative or semi-quantitative rather than quantitative in nature. Two sets of experimental data are used for comparison purposes here, specifically data presented by Hough et al. [1] and Blanchette et al. [27]. The decay rate of C-terminal PSmad2 in mesenchymal cells were determined experimentally by Hough et al. [1]. The time to decrease the signal intensity by 50% differed between treatment groups: 116 min for TGF-β + U0126 vs. 135 min for TGF-β alone. The intercellular location of Smad2 was observed experimentally in the human liver cell line (HepG2) [27]. With TGF-β alone 49.6% ± 3.1% of Smad2 exhibited a predominantly nuclear Smad2-specific staining compared with 10.1% ± 1.4% for unstimulated cells and 19.0% ± 0.9% for TGF-β + PD98059 (PD98059 is a MEK1-specific inhibitor). While these two sets of data cannot be used to estimate model parameters, some qualitative comparison with the simulation data can be performed.
In the experiments by Hough et al. [1], the cell lysates were pulsed for 10 min with TGF-β (2 ng/mL) with or without U0126 (inhibitor of Erk phosphorylation). Relative signal intensity of the C-terminal PSmad2 with TGF-β alone and TFG-β + U0126 was shown in Figure 5d of [1] by setting the 60 min. value at 100%. The time to decrease the signal intensity by 50% was given (116 min for TGF-β + U0126 vs. 135 min for TGF-β alone). Here, the decay rate of C-terminal PSmad2 is calculated based on the crosstalk model and assumed parameter values. Due to the time delay of Erk activation described by this experiment, t0 is set to 30 min. The concentration of PSmadL is set to zero to mimic addition of U0126 from the experiment, and at the 10 min. time point the concentration of TGF-β is changed to zero in the simulation. For the case of [PSmadL] = 0, the crosstalk does not occur and the scenario reduced to the one for TGF-β induced Smad signaling without crosstalk, whereas, in the case of stimulation with TGF-β alone, the crosstalk is induced by TGF-β itself. Figure 6a shows the concentration profiles of C-terminal PSmad2 with crosstalk and without crosstalk. The curves indicate that the TGF-β-induced Erk activation (in case of TGF-β alone) does stabilize the PSmad2 level. The decay profiles of the signal intensity are shown in Figure 6b, whose general trend is consistent with those shown in Figure 5d of [1]. The decay time increased by 16% when no U0126 was added for the simulation while the increase in time was also 16% for the experimental data reported by Hough et al. [1].
Figure 6. Comparison of simulation results with and without crosstalk from the crosstalk model for (a) nuclear PSmad2 level; and (b) relative signal intensity of nuclear PSmad2.
Processes 02 00570 g006
Next, the intercellular location of Smad2 is calculated based on the presented crosstalk model and compared with the experimental results presented by Blanchette et al. [27]. The experimental data [27] indicated that phosphorylation of p42/p44 MAPK by TGF-β was prolonged at least 30 min and sustained for at least 2 h. Thus, t0 is set to 30 min and γ = 0.0005. Zi’s experimental data showed initially 14% of Smad2 was in the nucleus in the unstimulated mesenchymal cells. When cells are stimulated by TGF-β (10 ng/mL) and PSmadL concentration is set to zero, which mimics the addition of PD98059 in an experiment, the ratio of nuclear Smad2 to total amount of Smad2 becomes 35% at the 1 h time point. When cells are treated by TGF-β (10 ng/mL) alone, the amount of nuclear PSmad2 increased 2.5-fold in simulations as compared to the case where stimulation with TGF-β occurred and [PSmadL] was set to zero. This value is consistent with the experimental values observed by Blanchette et al. [27] for experiments where cells were stimulated with TGF-β and, separately, with TGF-β and PD98059.

4. Results and Discussion

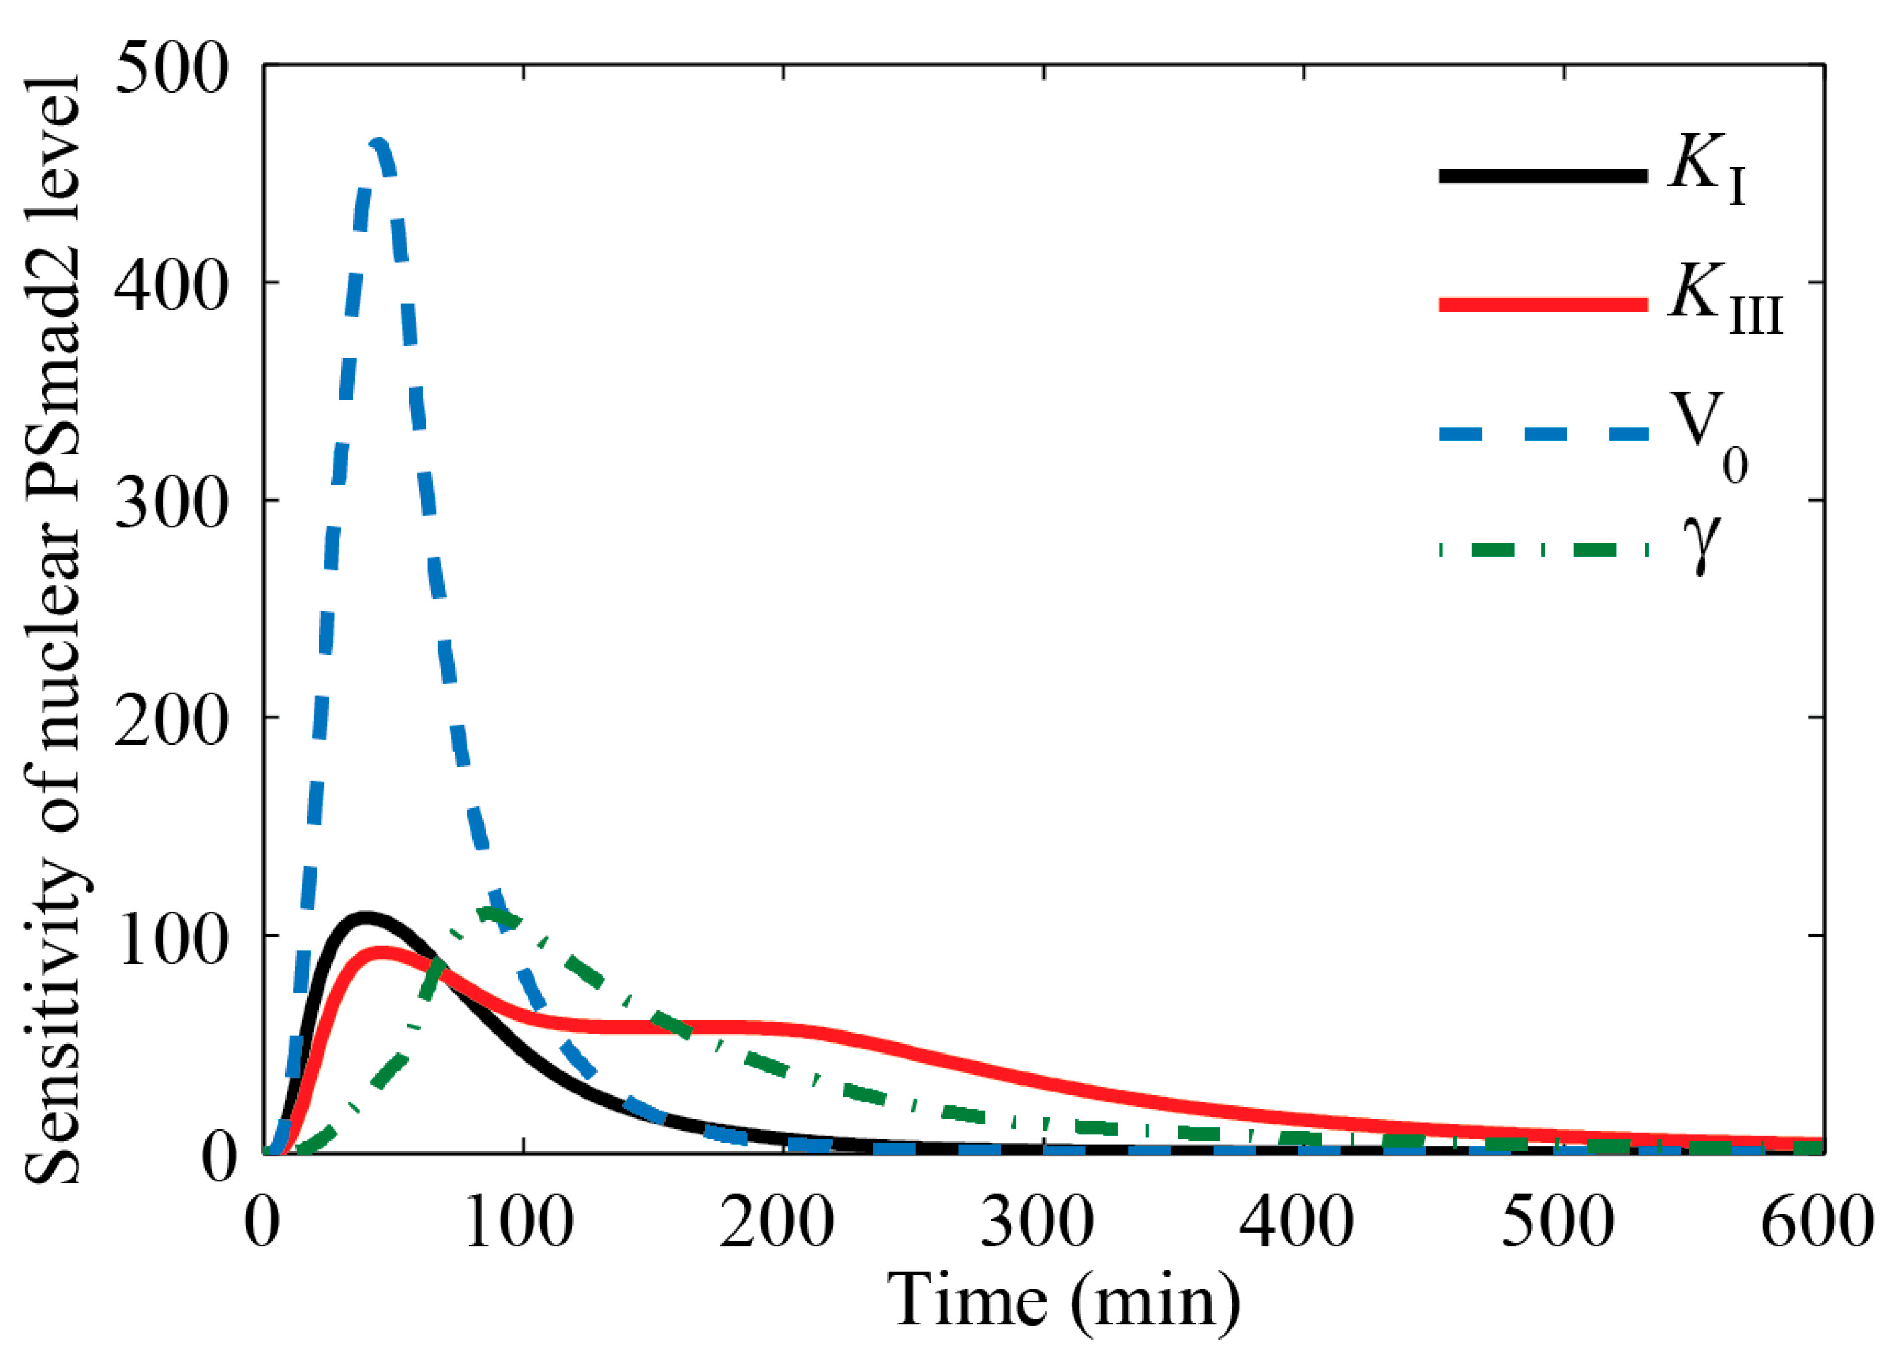
4.1. Sensitivity Analysis of Key Parameters

The presented model integrates the three-level cascade model of the MAPK pathway with the original model of TGF-β/Smad pathway and also includes two crosstalk mechanisms. The final output, the transcription factor, will mediate the TGF-β-induced gene expression.
The parameter set of this proposed model consists of three parts: the parameters of the TGF-β/Smad pathway model, the parameters of the three-level cascade model describing the MAPK pathway and the parameters involved in the crosstalk. The nominal parameter values found in the literature for the TGF-β/Smad pathway and the MAPK cascade models have been used in this work. The normalized sensitivity values of parameters over a period of time are calculated from the crosstalk model by the Morris method. For the parameters of the TGF-β/Smad pathway model, the uncertainty ranges are set to 50%–150% of the nominal values. The uncertainty of the parameters KI, KIII, V0 and γ involved in the crosstalk is assumed to be much larger as no values can be found in the literature. Their nominal values are assumed to be 5, 5, 0.18, 0.004, and their uncertainty ranges are defined as [0.1, 10], [0.1, 10], [0.14, 0.22], [0.001, 0.01], respectively. The value ranges of V0 and γ were chosen to represent a transient, low level activation of the MAPK pathway. The reason for choosing the specific parameters mentioned here for the sensitivity analysis is that the interaction parameters, KI and KIII, are the key parameters to determine whether the crosstalk inhibits or enhances the Smad transcription activity. Additionally, parameters describing receptor activation of the MAPK pathway by extracellular factors, e.g., the parameters V0, γ and t0, may affect the crosstalk. The delay time t0 usually can be observed directly through experiments. However, there are four unknown key parameters whose effects on the output need to be investigated: KI, KIII, V0 and γ.
Here, the time-dependent sensitivity dynamics of the transcription factor concentration with respect to the parameters KI, KIII, V0 and γ are calculated and analyzed using the Morris method. A constant exposure of 2 ng/mL of TGF-β is chosen for the analysis as well as parameters values corresponding to a transient and low level activation of MAPKs.
The normalized sensitivity profiles with respect to the four parameters are depicted in Figure 7. V0 has the biggest amplitude of the sensitivity but its sensitivity declines fast, whereas γ has a more significant long-term effect than V0. When KIII is perturbed, it has a considerable impact on the amplitude and the duration of the output signal. The effect of KI is mainly observed over the initial time interval. According to the hypothesized interaction mechanisms, MAPKs, once activated, may quickly attenuate R-Smad to inhibit the formation of the Smad complex in cytoplasm at the initial stage of interaction; this interaction strength is controlled by KI. On the other hand, most of PSmadL remains in the nucleus and inhibits the dissociation of the Smad complex over a longer time; this interaction strength is controlled by KIII. The simulation results are in good agreement with the theoretical analysis.
Figure 7. Sensitivity profiles of the transcription factor concentration, i.e., the nuclear PSmad2 level, with respect to KI, KIII, V0, and γ.
Processes 02 00570 g007

4.2. Balance between Two Competing Effects Defines the Specific Cell Responses

Based on the previous discussion, the level of the nuclear transcription factor is not only Smad-dependent, but also influenced by activated MAPKs. The effects of activated MAPKs on the Smad pathway show two opposite responses: inhibition or enhancement of the nuclear transcription factor concentration. Furthermore, it is hypothesized that the two opposite effects define specific cellular responses to TGF-β, that is to say, the balance between the two opposing effects defines specific cellular responses to TGF-β regulated by activity of the MAPK pathway.
In the literature, inhibition was observed mostly in hyperactive Ras signaling, oncogenic Ras signaling or mutant tumor cells [14,15,16,17], whereas enhancement was observed mostly in normal cells or in case of relatively low level of extracellular stimuli [1,9,11,12,13,27]. Massagué et al. hypothesized that responses to TGF-β may require balancing effects of Ras signaling to achieve a suitable level of nuclear Smad activity [18]. The previously proposed hypothesis that the balance between two opposite effects defines specific cellular responses not only agrees well with this viewpoint, but also highlights the underlying kinetics: rapid activation of Erk, in the case of Erk, induced by EGF or oncogenic Ras signaling, coupled with a high level of Ras activation, may quickly attenuate R-Smad to inhibit the formation of the Smad complex in the cytoplasm before R-Smad activation and nuclear translocation, which predominantly inhibits the Smad transcription activity. Conversely, the delayed activation of Erk induced by TGF-β or other extracellular factors in some cells, coupled with a relatively low level of Ras activation, will be negligible for the R-Smad activation and nuclear translocation. Most of PSmadL will transfer into the nucleus and inhibit the dissociation of the nuclear Smad complex, which predominantly enhances the Smad transcription activity. This hypothesized kinetics is in good agreement with the literature reports. Additionally, the simulated data from the crosstalk model, as shown in Figure 4, Figure 5, Figure 6 and Figure 7, seems to align with this hypothesis.

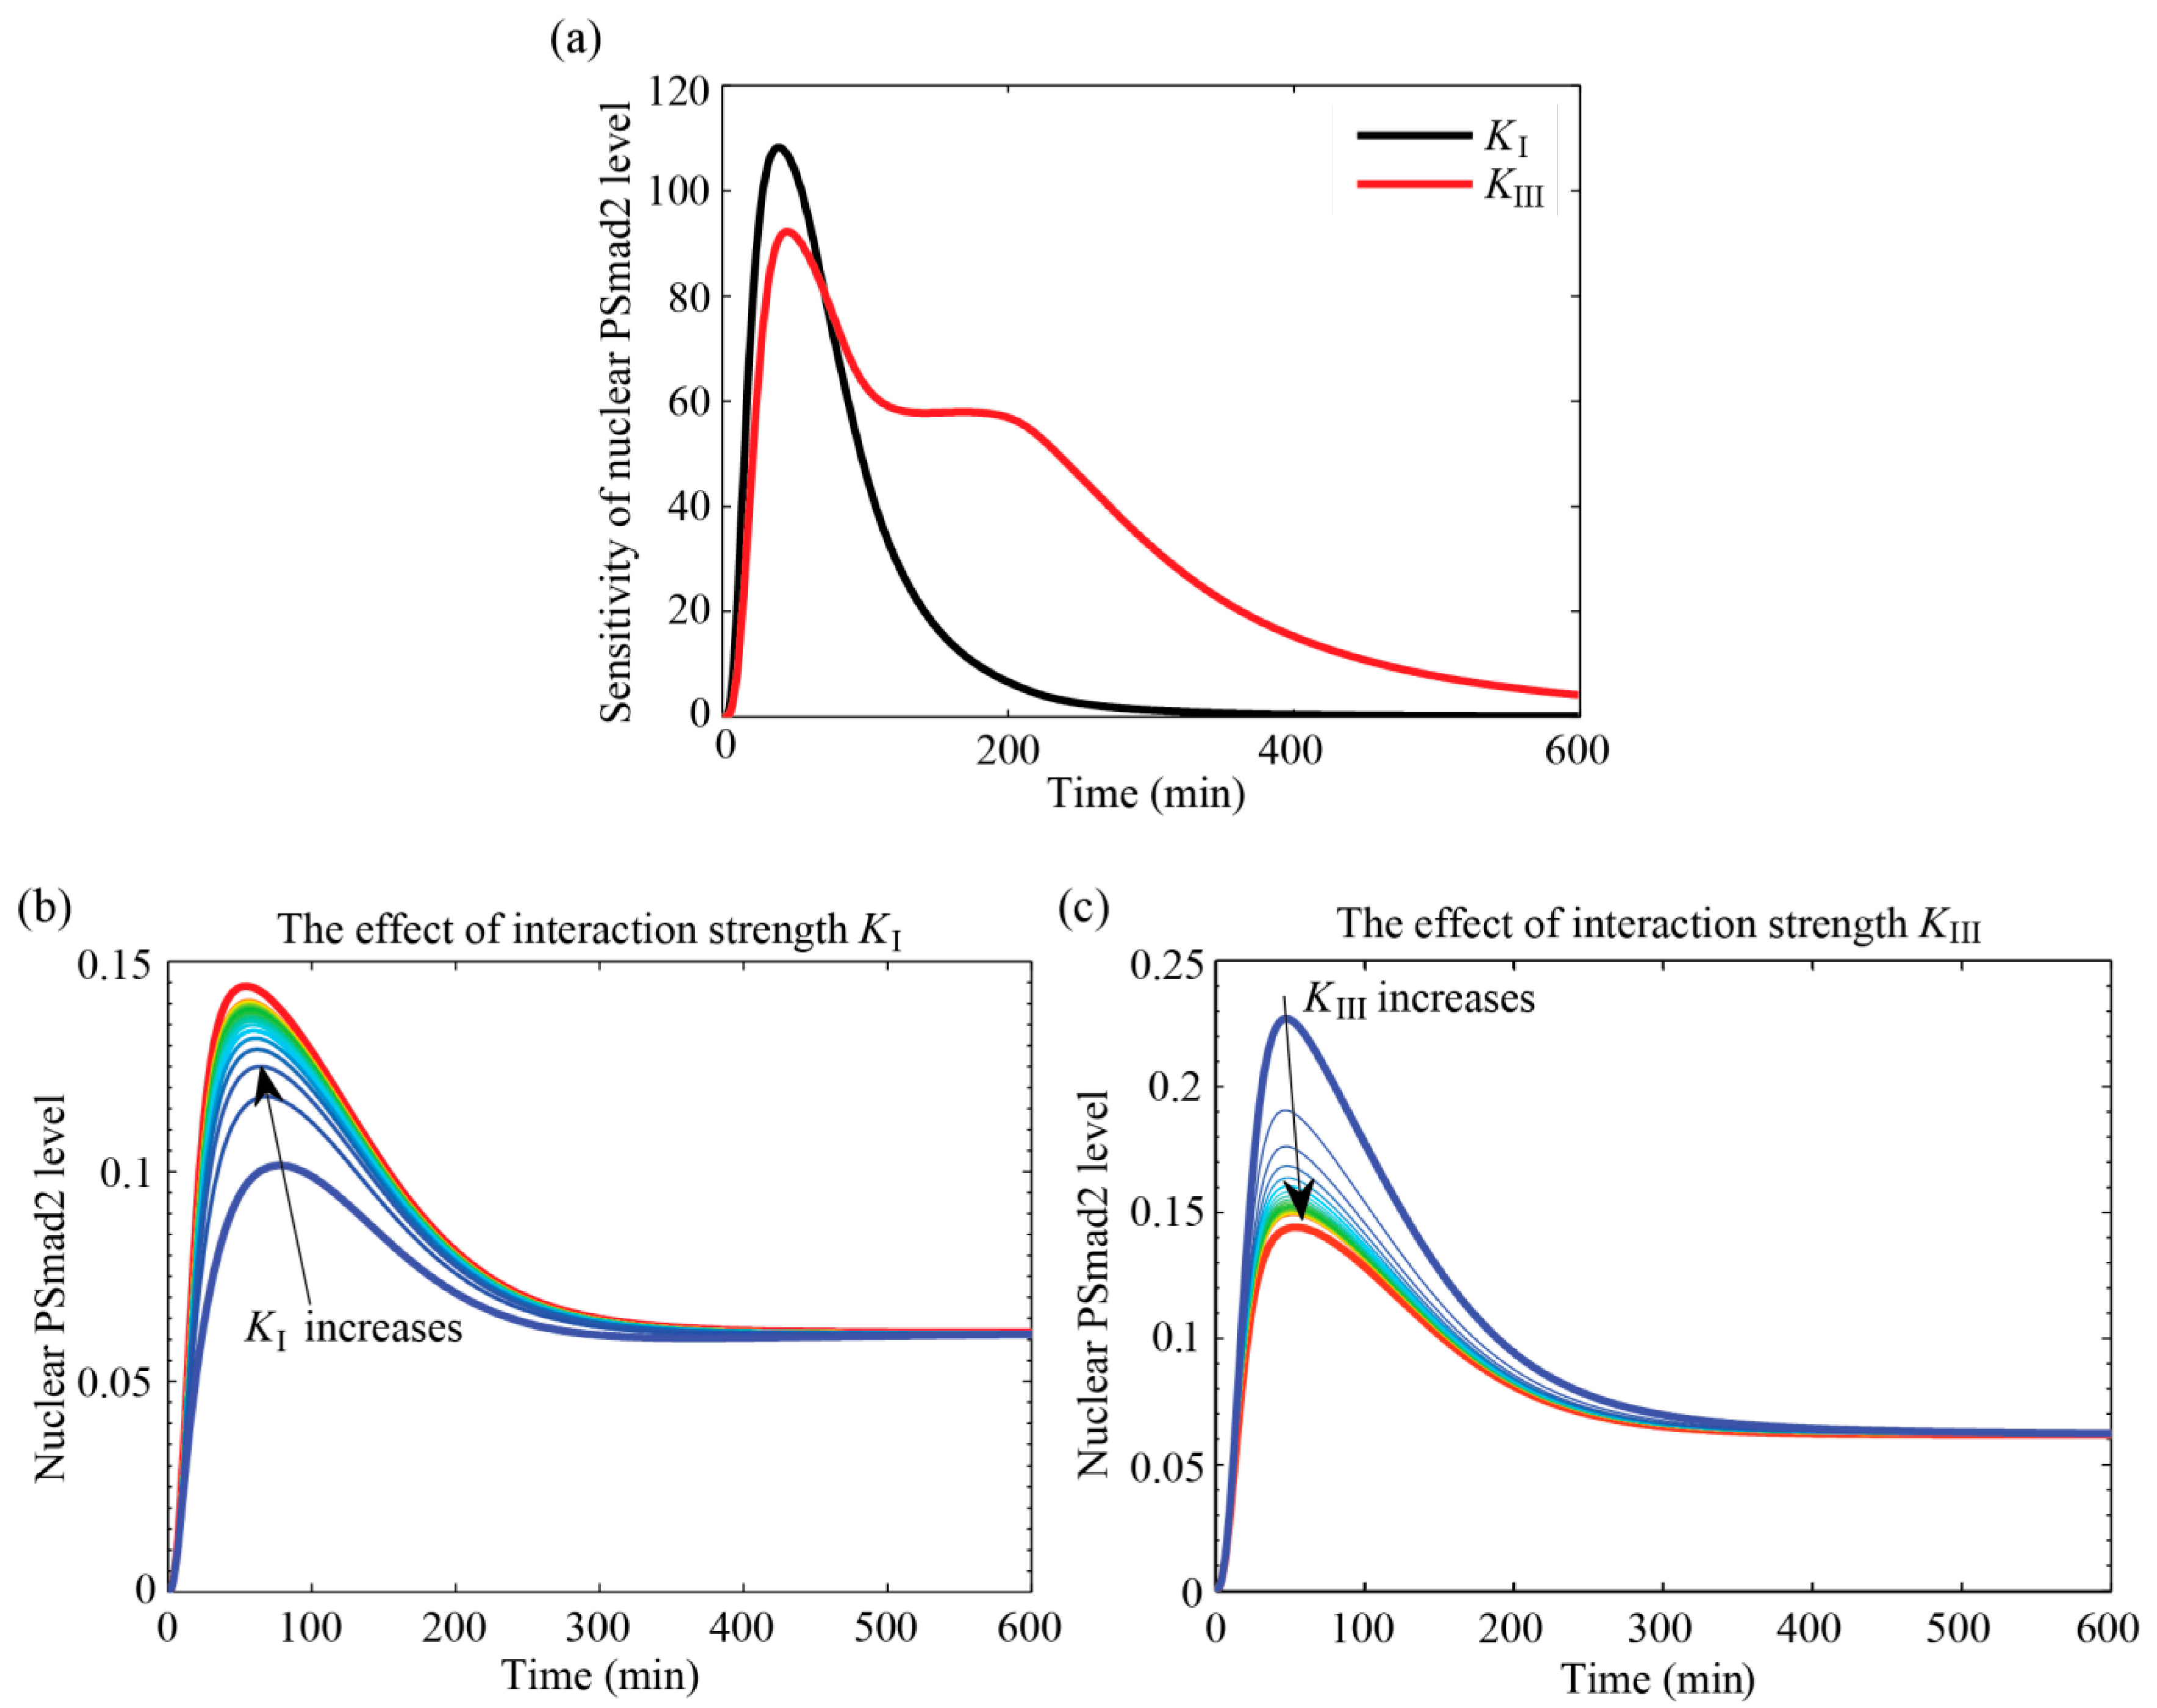
4.3. Effects of Interaction Parameters on Cell Responses

The values of the interaction parameters KI and KIII are responsible for either inhibition or enhancement of MAPKs on TGF-β/Smad signaling. This section discusses whether specific interaction outcome, either inhibition or enhancement, can be distinguished using experimental data.

4.3.1. Interaction Parameters Are Identifiable and have Distinct Effects on the Outputs

As far as a group of parameters to estimate are concerned, it is very possible that they are pairwise indistinguishable. If the effects of two parameters on the output are highly correlated then their sensitivity profiles have similar shapes. If this is the case then the parameters cannot be simultaneously estimated. The sensitivity profiles of the nuclear PSmad2 level with respect to KI and KIII are shown in Figure 8a. In addition, the relative levels of the transcription factor at different values of each parameter (while the other parameters are held constant) are shown in Figure 8b,c. It is clear from Figure 8a that the sensitivity profile for KI is distinctly different from the sensitivity profile for KIII. It can be concluded that KI and KIII are estimable and each one has a distinct effect on the output.
Figure 8. Sensitivity analysis of nuclear PSmad2 level. (a) Sensitivity profiles with respect to KI and KIII; (b) the effect of KI on nuclear PSmad2 level; (c) The effect of KIII on nuclear PSmad2 level.
Processes 02 00570 g008

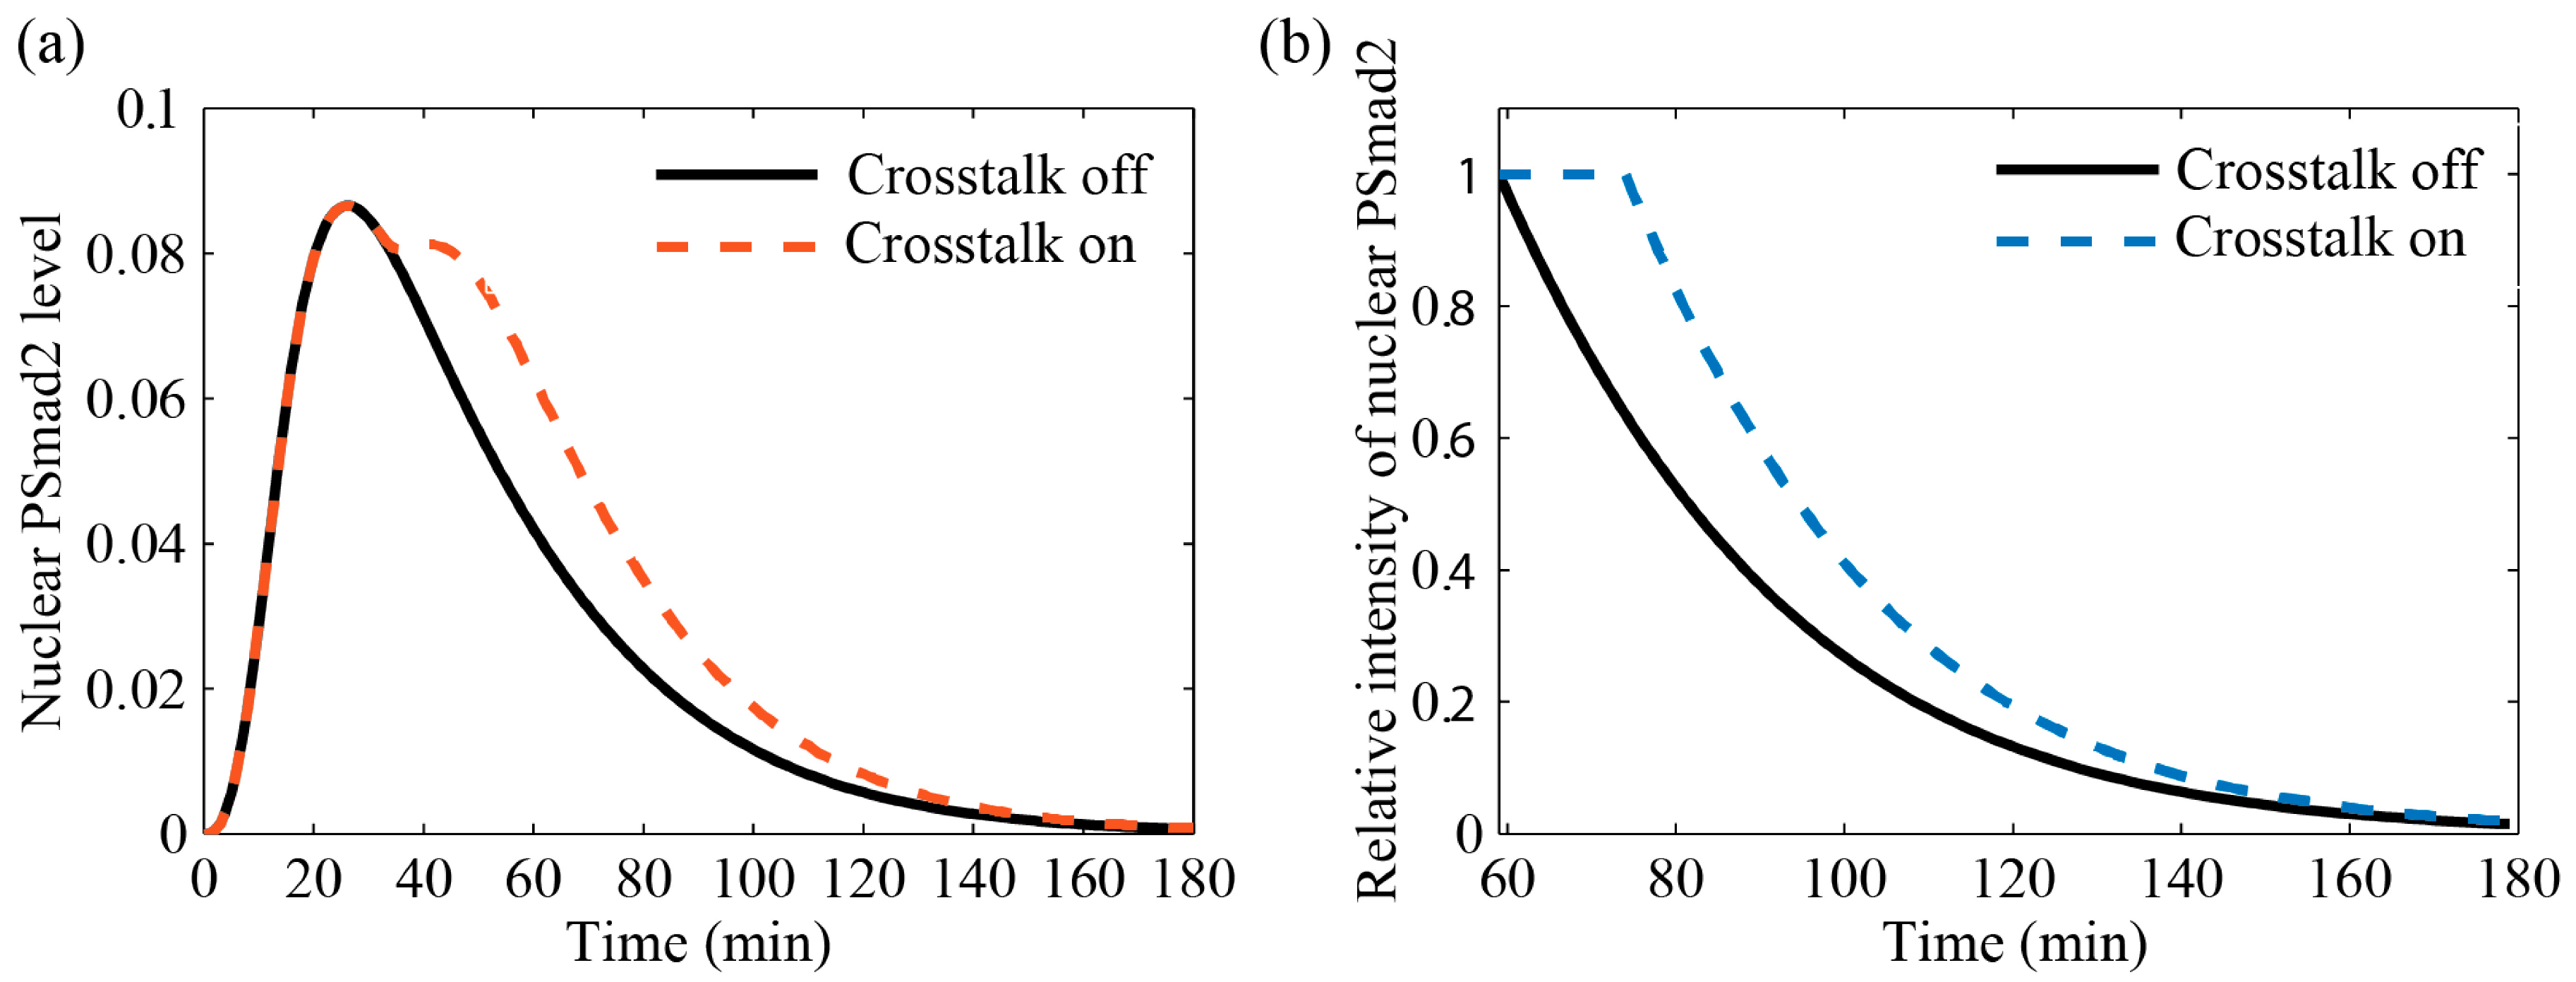
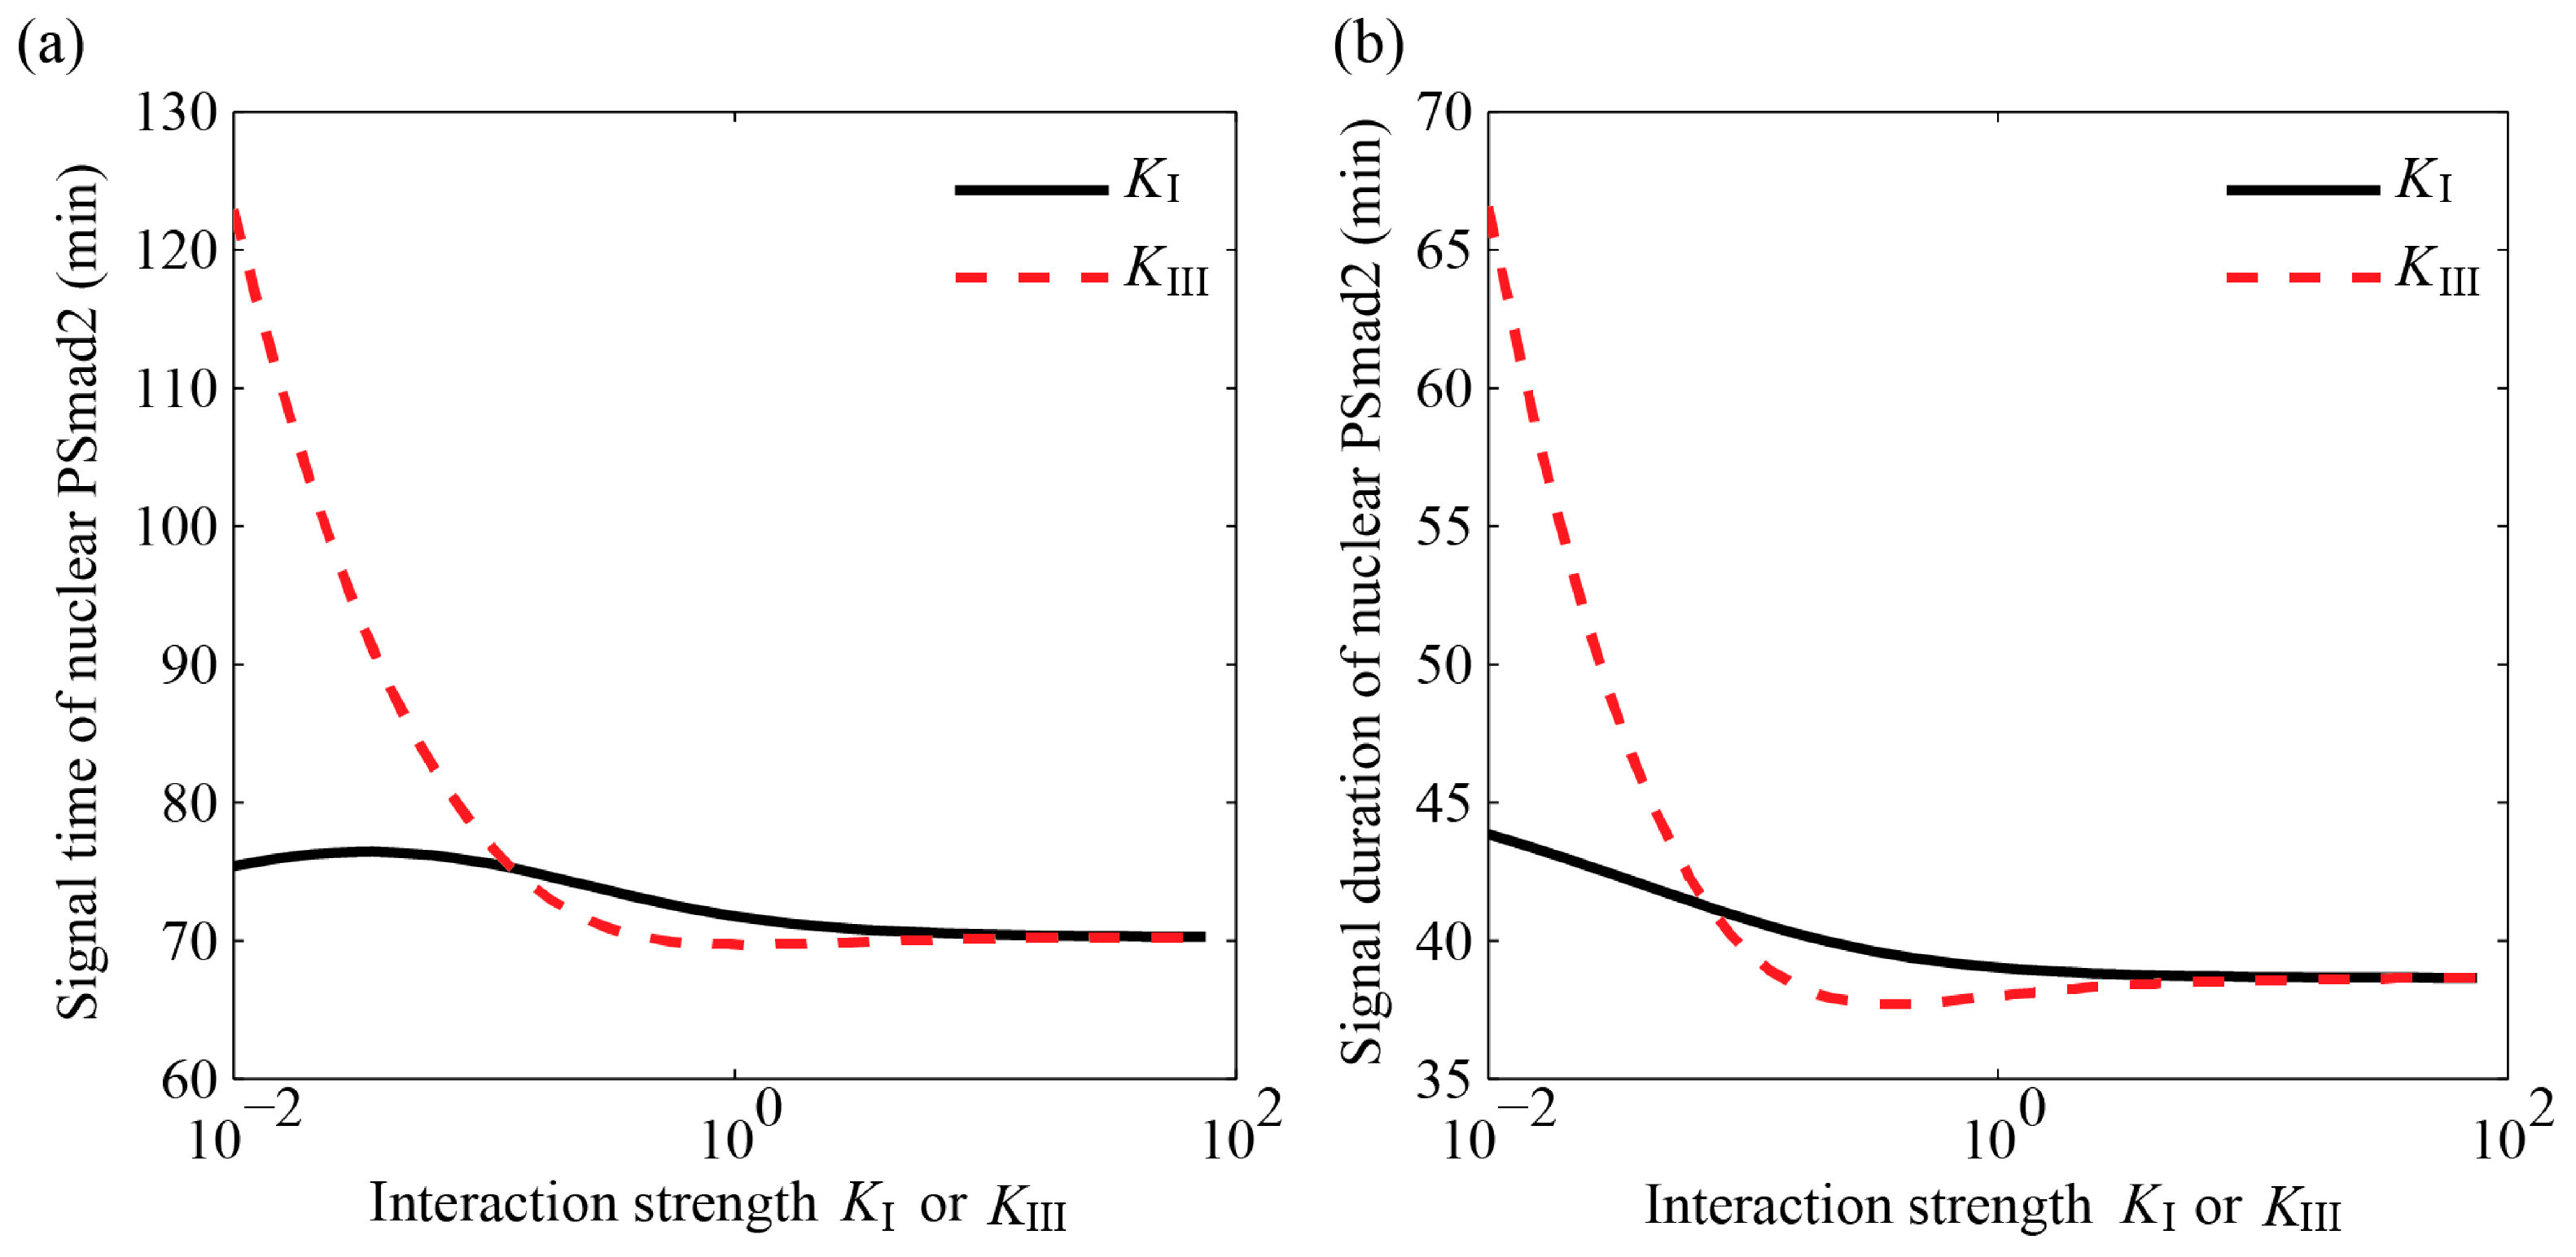
4.3.2. MAPK Pathway Extends the TGF-β/Smad Signal Transduction Duration, Which Is More Strongly Affected by Values of KIII than KI

To provide further insight into the effects of the MAPK pathway on Smad signaling, signal time, duration and amplitude at different values for each interaction parameter KI or KIII are calculated to quantify the effect of the crosstalk on the output signal. As previously described, signal time, duration, and amplitude will grow over time to infinity if the output signals do not return to zero. Therefore, a pulse stimulation of TGF-β (2 ng/mL) for the first 60 min is used for the following analysis. Furthermore, a transient and low-level activation of MAPKs is assumed (V0 = 0.18, γ = 0.001) without time delay. Then the input signal, i.e., the TGF-β concentration, is set to zero after 60 min.
Figure 9 shows the signal time profiles (Figure 9a), signal duration profiles (Figure 9b) for different values of the parameters KI and KIII. The signal time and duration decrease as KI or KIII increase and converge to basal values equal to the signal time and duration of the original TGF-β/Smad pathway model. The signal time for KIII is significantly larger than that for KI as shown in Figure 9a. According to the proposed hypothesis, the inhibition effect controlled by KI arises from PSmadL activation in the cytoplasm, whereas the enhancement effect controlled by KIII only becomes significant after PSmadL transfers from the cytoplasm to the nucleus. This implies that it takes longer for the enhancement interaction involving KIII to have a noticeable effect than for the inhibition interaction involving KI. The results shown in Figure 9a are in good agreement with this hypothesis. On the other hand, the smaller the values of KI and KIII, the larger the signal time and signal duration. That is to say, the stronger the crosstalk is, the longer it takes for the transcription factor to be activated but the activation also lasts longer. It can be concluded that the crosstalk between the pathways extends the duration of the TGF-β/Smad signal transduction, which is consistent with the literature reports [1,12]. Additionally, KIII has a more profound effect on the signal time and signal duration than KI as can be seen in Figure 9a,b. A significant body of the literature has reported that positive regulation of TGF-β/Smad signaling by the MAPK pathway enhances the duration of the increased levels of nuclear phosphorylated Smad2 [1,12], whereas there are few reports mentioning down regulation. It is possibly that this is due to the fact that the signal duration of PSmad2 level is predominantly controlled by KI and changes little under negative regulation.
Figure 9. Signal time (a) and duration; (b) for different values of KI and KIII.
Processes 02 00570 g009

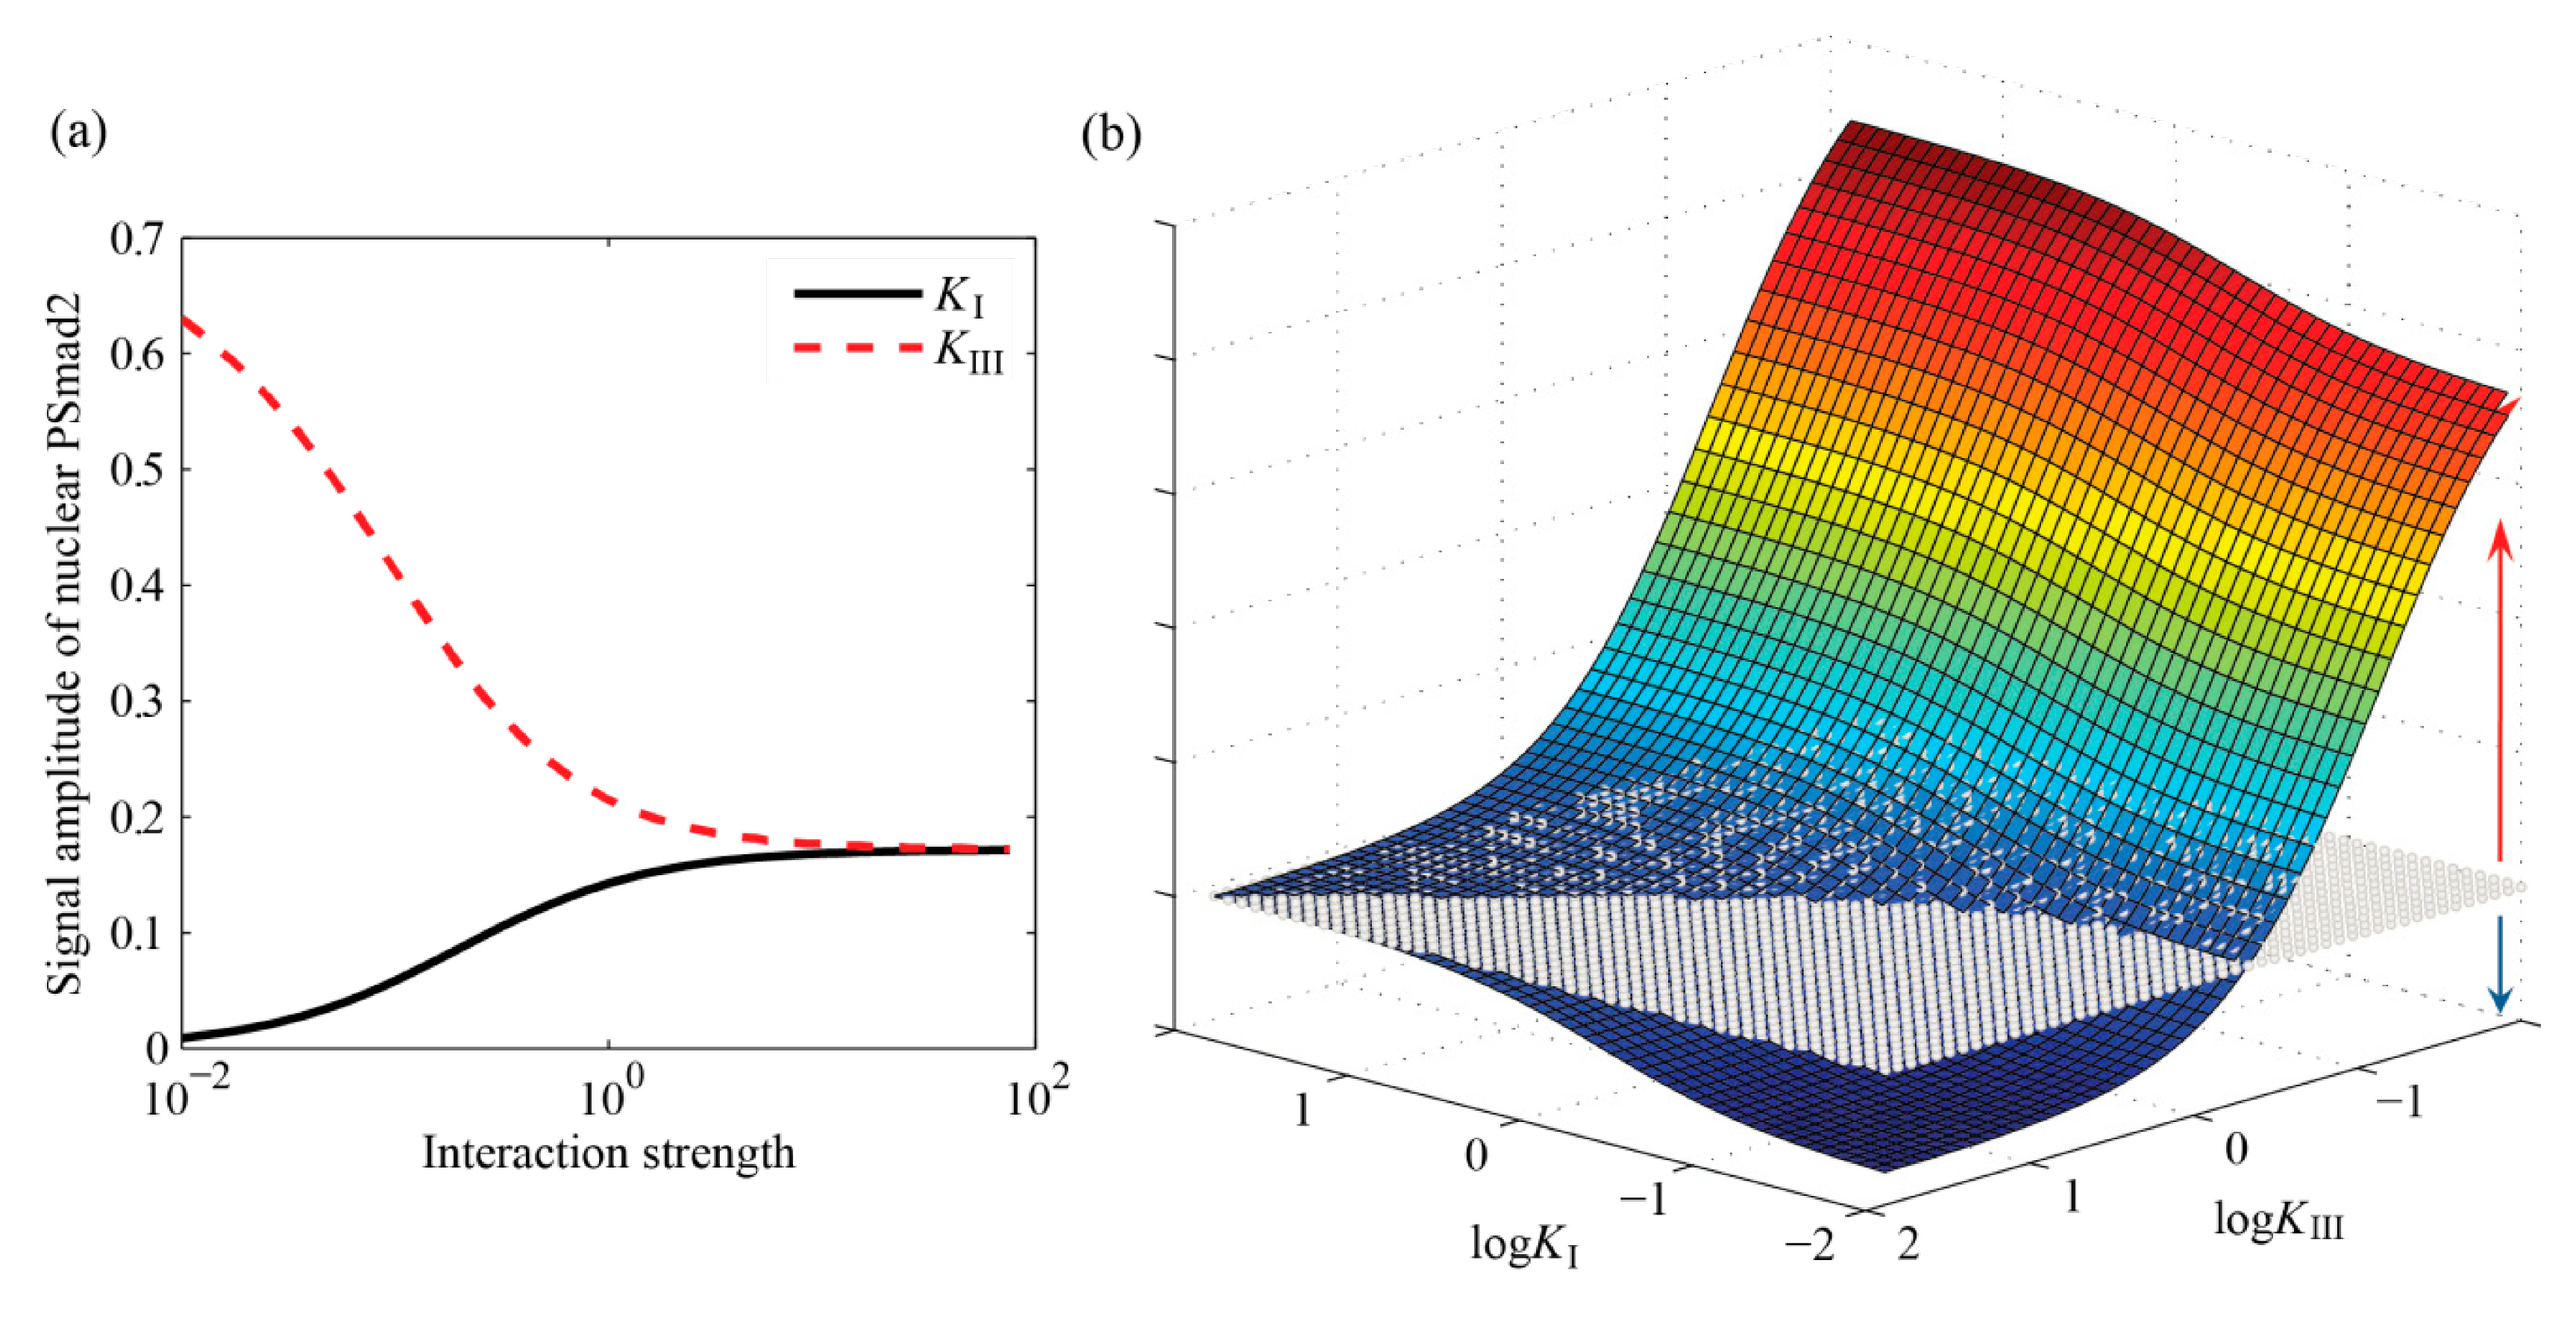
4.3.3. Specific Outcomes Can Be Described through Appropriate Choices for KI and KIII

The specific outcome, if signaling is enhanced or inhibited, depends upon the values of KI and KIII. As such, it is important to investigate what combinations of values of these parameters have an enhancing/inhibiting effect. The signal amplitude, representing the average concentrations of the nuclear Smad complex, can be used as a measure to determine the magnitude of the effect. This signal amplitude is computed for a number of values for combinations of KI and KIII. Small values of KI, i.e., stronger interactions, result in low average concentrations of the transcription factor, which illustrates the inhibition of TGF-β/Smad signaling. Conversely, small values of KIII, i.e., strong interactions, result in large average concentrations of transcription factor, illustrating enhancement of TGF-β/Smad signaling. The variation amount of the signal amplitude I around its basal value is defined to quantify the effect when both inhibition, via KI, and enhancement, via KIII, take place:
VarI = I (basal) − II (KI)
VarIII = IIII (KIII) − I (basal)
VarI and VarIII are the variation amounts of the signal amplitudes II (KI) and IIII (KIII) around their basal value I (basal). If KI and KIII tend to infinity, the output signal tends to the basal value which represents the original pathway without crosstalk. I (basal) is equal to the output signal amplitude of the original TGF-β/Smad pathway.
The interaction outcome is characterized by the values of VarI and VarIII: (1) If VarI = VarIII, then the two interaction will cancel each other; (2) If VarI > VarIII, then inhibition is stronger than enhancement; (3) If VarI < VarIII, then enhancement dominates inhibition. A plot of the surface of the difference between VarI and VarIII as a function of KI and KIII is shown in Figure 10b. The grey plane is added to divide the surface into two areas: overall inhibition and enhancement. The part above the plane indicates that enhancement is stronger than inhibition while the area below the plane represents the opposite effect.
Figure 10. Signal amplitude analysis for different values of KI and KIII: (a) signal amplitude profiles; (b) surface plot of the difference between VarI and VarIII as a function of KI and KIII.
Processes 02 00570 g010

5. Conclusions

Crosstalk plays a key role for TGF-β signal transduction. Broad evidence exists for the crosstalk of Smad signaling with MAPK pathways. A variety of studies have identified different potential mechanisms for the crosstalk, however, there is no clear consensus on the actual mechanism(s) responsible for the crosstalk.
A model of the pathways, including different potential crosstalk mechanisms, is developed through integrating a model of MAPK pathway [22] with the TGF-β/Smad pathway model [6]. The effects that different interaction mechanisms have on the observed response are thoroughly analyzed and discussed. It is hypothesized that two potential interaction mechanisms account for the crosstalk between MAPK and GF-β/Smad signaling pathways: (1) PSmadL attenuates R-Smad to inhibit its association with C-Smad in the cytoplasm; (2) Nuclear PSmadL inhibits the dephosphorylation and thereby the dissociation of the nuclear Smad complex. The two mechanisms explain the inhibition and enhancement effects of MAPKs on Smad signaling. It is hypothesized that the balance between these two competing effects defines specific cellular responses to TGF-β, depending on the cell types and the extent of MAPKs activation. This hypothesis agrees with results from the literature reports [1,9,11,12,13,14,15,16,17,18,27].
The sensitivity of the transcription factor with respect to interaction parameters is calculated for the presented model. It can be concluded that interaction strengths KI and KIII are estimable and each one has a distinct effect on the output. Signal time, duration and amplitude at different combinations of values of the interaction parameters KI or KIII are calculated to quantify the effect of the crosstalk on the output signal. The results show that the MAPK pathway extends the TGF-β/Smad signal transduction duration, which is more strongly affected by the values of KIII than KI. This conclusion agrees with the experimental reports from the literature [1,12]. Once the interaction strengths KI and KIII have been estimated, the specific interaction outcome, inhibition or enhancement, can be extracted from an analysis of the signal amplitudes.

Acknowledgments

The contribution is partially supported by Natural Science Foundation of China (grant No. 61304071) through a fellowship for Ji Liu.

Author Contributions

Ji Liu performed the literature review, developed the model, and contributed to the analysis; Wei Dai focused on parameter sensitivity analysis and the analysis and discussion; Juergen Hahn oversaw all aspects of the research.

Appendix

The detailed equations of the developed model are listed here. The first eight equations explain the three-level MAPK cascade with the input V0 exp (−γ (tt0)). The remaining sixteen equations account for TGF-β/Smad signaling mediated by MAPKs (i.e., MPAKpp).
Processes 02 00570 i009
Processes 02 00570 i010
Processes 02 00570 i011
Processes 02 00570 i012
Processes 02 00570 i013
Processes 02 00570 i014
Processes 02 00570 i015
Processes 02 00570 i016
Processes 02 00570 i017
Processes 02 00570 i018
Processes 02 00570 i019
Processes 02 00570 i020
Processes 02 00570 i021
Processes 02 00570 i022
Processes 02 00570 i023
Processes 02 00570 i024
Processes 02 00570 i025
Processes 02 00570 i026
Processes 02 00570 i027
Processes 02 00570 i028
Processes 02 00570 i029
Processes 02 00570 i030
Processes 02 00570 i031
Processes 02 00570 i032
Processes 02 00570 i033
This model consists of 24 states and 44 parameters. The nominal values of the Michaelis constants K1K10 are given in nM.
K1 = 10, K2 = 8, K3 = K4 = K5 = K6 = K7 = K8 = K9 = K10 = 15
The catalytic rate constants k3, k4, k7, k8 are given in min−1
k3 = k4 = k7 = k8 = 1.5
The maximal enzyme rates V2, V5, V6, V9, V10 are expressed in nM·min1
V2 =15, V5 = V6 = 45, V9 = V10 = 30
The nominal values and biological interpretations of the other parameters are shown in Table A1. The initial conditions and biological interpretations of the state variables are listed in Table A2.
Table A1. Parameter values in the model.
ParameterBiological MeaningValue
vT1Rtype I receptor production rate constant0.0103 nM·min1
vT2Rtype II receptor production rate constant0.02869 nM·min1
kiEEinternalization rate constant of receptor from cell surface to early endosome0.33 min1
krEErecycling rate constant of receptor from early endosome to cell surface0.033 min1
kicaveinternalization rate constant of receptor from cell surface to caveolar lipid-raft0.33 min1
krcaverecycling rate constant of receptor from caveolar lipid-raft to cell surface0.03742 min1
kcdconstitutive degradation rate constant for ligand-receptor complex in early endosome0.005 min1
kLCRligand-receptor complex formation rate constant from TGF-β and receptors2197 N·m2·min1
klidligand induced degradation rate constant for ligand-receptor complex in caveolar lipid-raft0.02609 min1
Processes 02 00570 i034constitutive degradation rate constant for type I receptor in early endosome0.005 min1
Processes 02 00570 i035constitutive degradation rate constant for type II receptor in early endosome0.025 min1
Processes 02 00570 i036nuclear import rate constant for Smad20.16 min1
Processes 02 00570 i037nuclear export rate constant for Smad21 min1
Processes 02 00570 i038nuclear import rate constant for Smad40.08 min1
Processes 02 00570 i039nuclear export rate constant for Smad40.5 min1
kSmads_complexformation rate constant for the phosphorylated Smad complex6.85 × 105 n·M2·min1
Processes 02 00570 i040nuclear import rate constant for the phosphorylated Smad complex0.16 min1
Processes 02 00570 i041dissociation rate constant for the nuclear phosphorylated Smad complex0.1174 min1
VC/Vnratio of cytoplasmic to nuclear volume3
V0/Vextraratio of cytoplasmic volume to the average extracellular medium volume per cell0.001
V0the concentration of activated receptor MKKKK at t = t00.18 nM·s1
γthe characteristic time of activated receptor MKKKK0.004
t0the delayed time of receptor response to extracellular stimuli0
KIinteraction strength5
KIIIinteraction strength5
Table A2. Initial conditions of state variables in the model.
VariableBiological MeaningInitial Value (nM)
MKKKMAPK kinase kinase100
MKKKPSingly phosphorylated MKKK0
MKKMAPK kinase300
MKKPSingly phosphorylated MKK0
MKKPPdoubly phosphorylated MKK0
MAPKMAP kinase300
MAPKPSingly phosphorylated MAPK0
MAPKPPdoubly phosphorylated MAPK0
T1Rsurftype I receptor at cell surface0.237
T1Rcavetype I receptor in caveolar lipid-raft2.092
T1REEtype I receptor in early endosome1.148
T2Rsurftype II receptor at cell surface0.202
T2Rcavetype II receptor in caveolar lipid-raft1.778
T2REEtype II receptor in early endosome1.148
LRCsurfligand-receptor complex at cell surface0
LRCcaveligand-receptor complex in caveolar lipid-raft0
LRCEEligand-receptor complex in early endosome0
Smad2cSmad2 in the cytoplasm492.61
Smad2nSmad2 in the nucleus236.45
Smad4cSmad4 in the cytoplasm1149.4
Smad4nSmad4 in the nucleus551.72
Smads_complexcSmad complex in the cytoplasm0
Smads_complexnSmad complex in the nucleus0
TGF-βTGF-β in the extracellular medium0.080

Conflicts of Interest

The authors declare no conflict of interest.

References

  1. Hough, C.; Radu, M.; Doré, J.J. Tgf-β induced Erk phosphorylation of smad linker region regulates smad signaling. PLoS One 2012, 7, e42513. [Google Scholar] [CrossRef] [Green Version]
  2. Derynck, R.; Zhang, Y.E. Smad-dependent and Smad-independent pathways in TGF-β family signalling. Nature 2003, 425, 577–584. [Google Scholar] [CrossRef]
  3. Kyprianou, N.; Isaacs, J.T. Expression of transforming growth factor-β in the rat ventral prostate during castration-induced programmed cell death. Mol. Endocrinol. 1989, 3, 1515–1522. [Google Scholar] [CrossRef]
  4. Guo, Y.; Kyprianou, N. Restoration of transforming growth factor β signaling pathway in human prostate cancer cells suppresses tumorigenicity via induction of caspase-1-mediated apoptosis. Cancer Res. 1999, 59, 1366–1371. [Google Scholar]
  5. Zhu, B.; Fukada, K.; Zhu, H.; Kyprianou, N. Prohibitin and cofilin are intracellular effectors of transforming growth factor β signaling in human prostate cancer cells. Cancer Res. 2006, 66, 8640–8647. [Google Scholar]
  6. Zi, Z.; Klipp, E. Constraint-based modeling and kinetic analysis of the Smad dependent TGF-β signaling pathway. PLoS One 2007, 2, e936. [Google Scholar] [CrossRef]
  7. Tian, X.-J.; Zhang, H.; Xing, J. Coupled reversible and irreversible bistable switches underlying TGFβ-induced epithelial to mesenchymal transition. Biophys. J. 2013, 105, 1079–1089. [Google Scholar] [CrossRef]
  8. Javelaud, D.; Mauviel, A. Crosstalk mechanisms between the mitogen-activated protein kinase pathways and Smad signaling downstream of TGF-β: Implications for carcinogenesis. Oncogene 2005, 24, 5742–5750. [Google Scholar] [CrossRef]
  9. Inoki, K.; Haneda, M.; Ishida, T.; Mori, H.; Maeda, S.; Koya, D.; Sugimoto, T.; Kikkawa, R. Role of mitogen-activated protein kinases as downstream effectors of transforming growth factor-β; in mesangial cells. Kidney Int. 2000, 58, S76–S80. [Google Scholar] [CrossRef]
  10. Guo, X.; Wang, X.-F. Signaling cross-talk between TGF-β/BMP and other pathways. Cell Res. 2008, 19, 71–88. [Google Scholar]
  11. Hayashida, T.; Decaestecker, M.; Schnaper, H.W. Cross-talk between ERK MAP kinase and Smad signaling pathways enhances TGF-β-dependent responses in human mesangial cells. FASEB J. 2003, 17, 1576–1578. [Google Scholar]
  12. Funaba, M.; Zimmerman, C.M.; Mathews, L.S. Modulation of Smad2-mediated signaling by extracellular signal-regulated kinase. J. Biol. Chem. 2002, 277, 41361–41368. [Google Scholar]
  13. Burch, M.L.; Yang, S.N.; Ballinger, M.L.; Getachew, R.; Osman, N.; Little, P.J. TGF-β stimulates biglycan synthesis via p38 and ERK phosphorylation of the linker region of Smad2. Cell. Mol. Life Sci. 2010, 67, 2077–2090. [Google Scholar] [CrossRef]
  14. Kretzschmar, M.; Doody, J.; Timokhina, I.; Massague, J. A mechanism of repression of TGF-β/Smad signaling by oncogenic Ras. Genes Dev. 1999, 13, 804–816. [Google Scholar] [CrossRef]
  15. Kretzschmar, M.; Doody, J.; Massagu, J. Opposing BMP and EGF signalling pathways converge on the TGF-β family mediator Smad1. Nature 1997, 389, 618–622. [Google Scholar] [CrossRef]
  16. Oft, M.; Peli, J.; Rudaz, C.; Schwarz, H.; Beug, H.; Reichman, E. TGF-β1 and Ha-Ras collaborate in modulating the phenotypic plasticity and invasiveness of epithelial tumor cells. Genes Dev. 1996, 10, 2462–2477. [Google Scholar] [CrossRef]
  17. Calonge, M.A.J.; Massagué, J. Smad4/DPC4 silencing and hyperactive Ras jointly disrupt transforming growth factor-β antiproliferative responses in colon cancer cells. J. Biol. Chem. 1999, 274, 33637–33643. [Google Scholar] [CrossRef]
  18. Massagué, J.; Chen, Y.-G. Controlling TGF-β signaling. Genes Dev. 2000, 14, 627–644. [Google Scholar]
  19. Chapnick, D.A.; Warner, L.; Bernet, J.; Rao, T.; Liu, X. Partners in crime: The TGF-β and MAPK pathways in cancer progression. Cell Biosci. 2011. [Google Scholar] [CrossRef]
  20. Heinrich, R.; Neel, B.G.; Rapoport, T.A. Mathematical models of protein kinase signal transduction. Mol. Cell 2002, 9, 957–970. [Google Scholar] [CrossRef]
  21. Saez-Rodriguez, J.; Kremling, A.; Conzelmann, H.; Bettenbrock, K. Modular analysis of signal transduction networks. Control Syst. IEEE 2004, 24, 35–52. [Google Scholar]
  22. Kholodenko, B.N. Negative feedback and ultrasensitivity can bring about oscillations in the mitogen-activated protein kinase cascades. Eur. J. Biochem. 2000, 267, 1583–1588. [Google Scholar] [CrossRef]
  23. Schoeberl, B.; Eichler-Jonsson, C.; Gilles, E.D.; Müller, G. Computational modeling of the dynamics of the MAP kinase cascade activated by surface and internalized EGF receptors. Nat. Biotechnol. 2002, 20, 370–375. [Google Scholar] [CrossRef]
  24. Hartsough, M.T.; Mulder, K.M. Transforming growth factor β activation of p44mapk in proliferating cultures of epithelial cells. J. Biol. Chem. 1995, 270, 7117–7124. [Google Scholar] [CrossRef]
  25. Zhang, Y.E. Non-Smad pathways in TGF-β signaling. Cell Res. 2008, 19, 128–139. [Google Scholar] [CrossRef]
  26. Gui, T.; Sun, Y.; Shimokado, A.; Muragaki, Y. The roles of mitogen-activated protein kinase pathways in TGF-β-induced epithelial-mesenchymal transition. J. Signal Transduct. 2012, 2012. [Google Scholar] [CrossRef]
  27. Blanchette, F.; Rivard, N.; Rudd, P.; Grondin, F.; Attisano, L.; Dubois, C.M. Cross-talk between the p42/p44 MAP kinase and Smad pathways in transforming growth factor β1-induced furin gene transactivation. J. Biol. Chem. 2001, 276, 33986–33994. [Google Scholar]
  28. Pessah, M.; Prunier, C.; Marais, J.; Ferrand, N.; Mazars, A.; Lallemand, F.; Gauthier, J.M.; Atfi, A. c-jun interacts with the corepressor TG-interacting factor (TGIF) to suppress Smad2 transcriptional activity. Proc. Natl. Acad. Sci. USA 2001, 98, 6198–6203. [Google Scholar] [CrossRef]
  29. Suzuki, K.; Wilkes, M.C.; Garamszegi, N.; Edens, M.; Leof, E.B. Transforming growth factor β signaling via Ras in mesenchymal cells requires p21-activated kinase 2 for extracellular signal-regulated kinase-dependent transcriptional responses. Cancer Res. 2007, 67, 3673–3682. [Google Scholar]
  30. Liberati, N.T.; Datto, M.B.; Frederick, J.P.; Shen, X.; Wong, C.; Rougier-Chapman, E.M.; Wang, X.F. Smads bind directly to the Jun family of AP-1 transcription factors. Proc. Natl. Acad. Sci. USA 1999, 96, 4844–4849. [Google Scholar]
  31. Massagué, J. How cells read TGF-β signals. Nat. Rev. Mol. Cell Biol. 2000, 1, 169–178. [Google Scholar] [CrossRef]
  32. Chu, Y.; Hahn, J. Parameter set selection via clustering of parameters into pairwise indistinguishable groups of parameters. Ind. Eng. Chem. Res. 2008, 48, 6000–6009. [Google Scholar] [CrossRef]
  33. Dai, W.; Bansal, L.; Hahn, J.; Word, D. Parameter set selection for dynamic systems under uncertainty via dynamic optimization and hierarchical clustering. AIChE J. 2014, 60, 181–192. [Google Scholar] [CrossRef]
  34. Morris, M.D. Factorial sampling plans for preliminary computational experiments. Technometrics 1991, 33, 161–174. [Google Scholar] [CrossRef]
  35. Martin, M.M.; Buckenberger, J.A.; Jiang, J.; Malana, G.E.; Knoell, D.L.; Feldman, D.S.; Elton, T.S. TGF-β1 stimulates human AT1 receptor expression in lung fibroblasts by cross talk between the Smad, p38 MAPK, JNK, and PI3K signaling pathways. Am. J. Physiol. Lung Cell. Mol. Physiol. 2007, 293, L790–L799. [Google Scholar] [CrossRef]

