A Novel Through-Thickness Perfusion Bioreactor for the Generation of Scaffold-Free Tissue Engineered Cartilage

Abstract
:
1. Introduction
2. Experimental Section
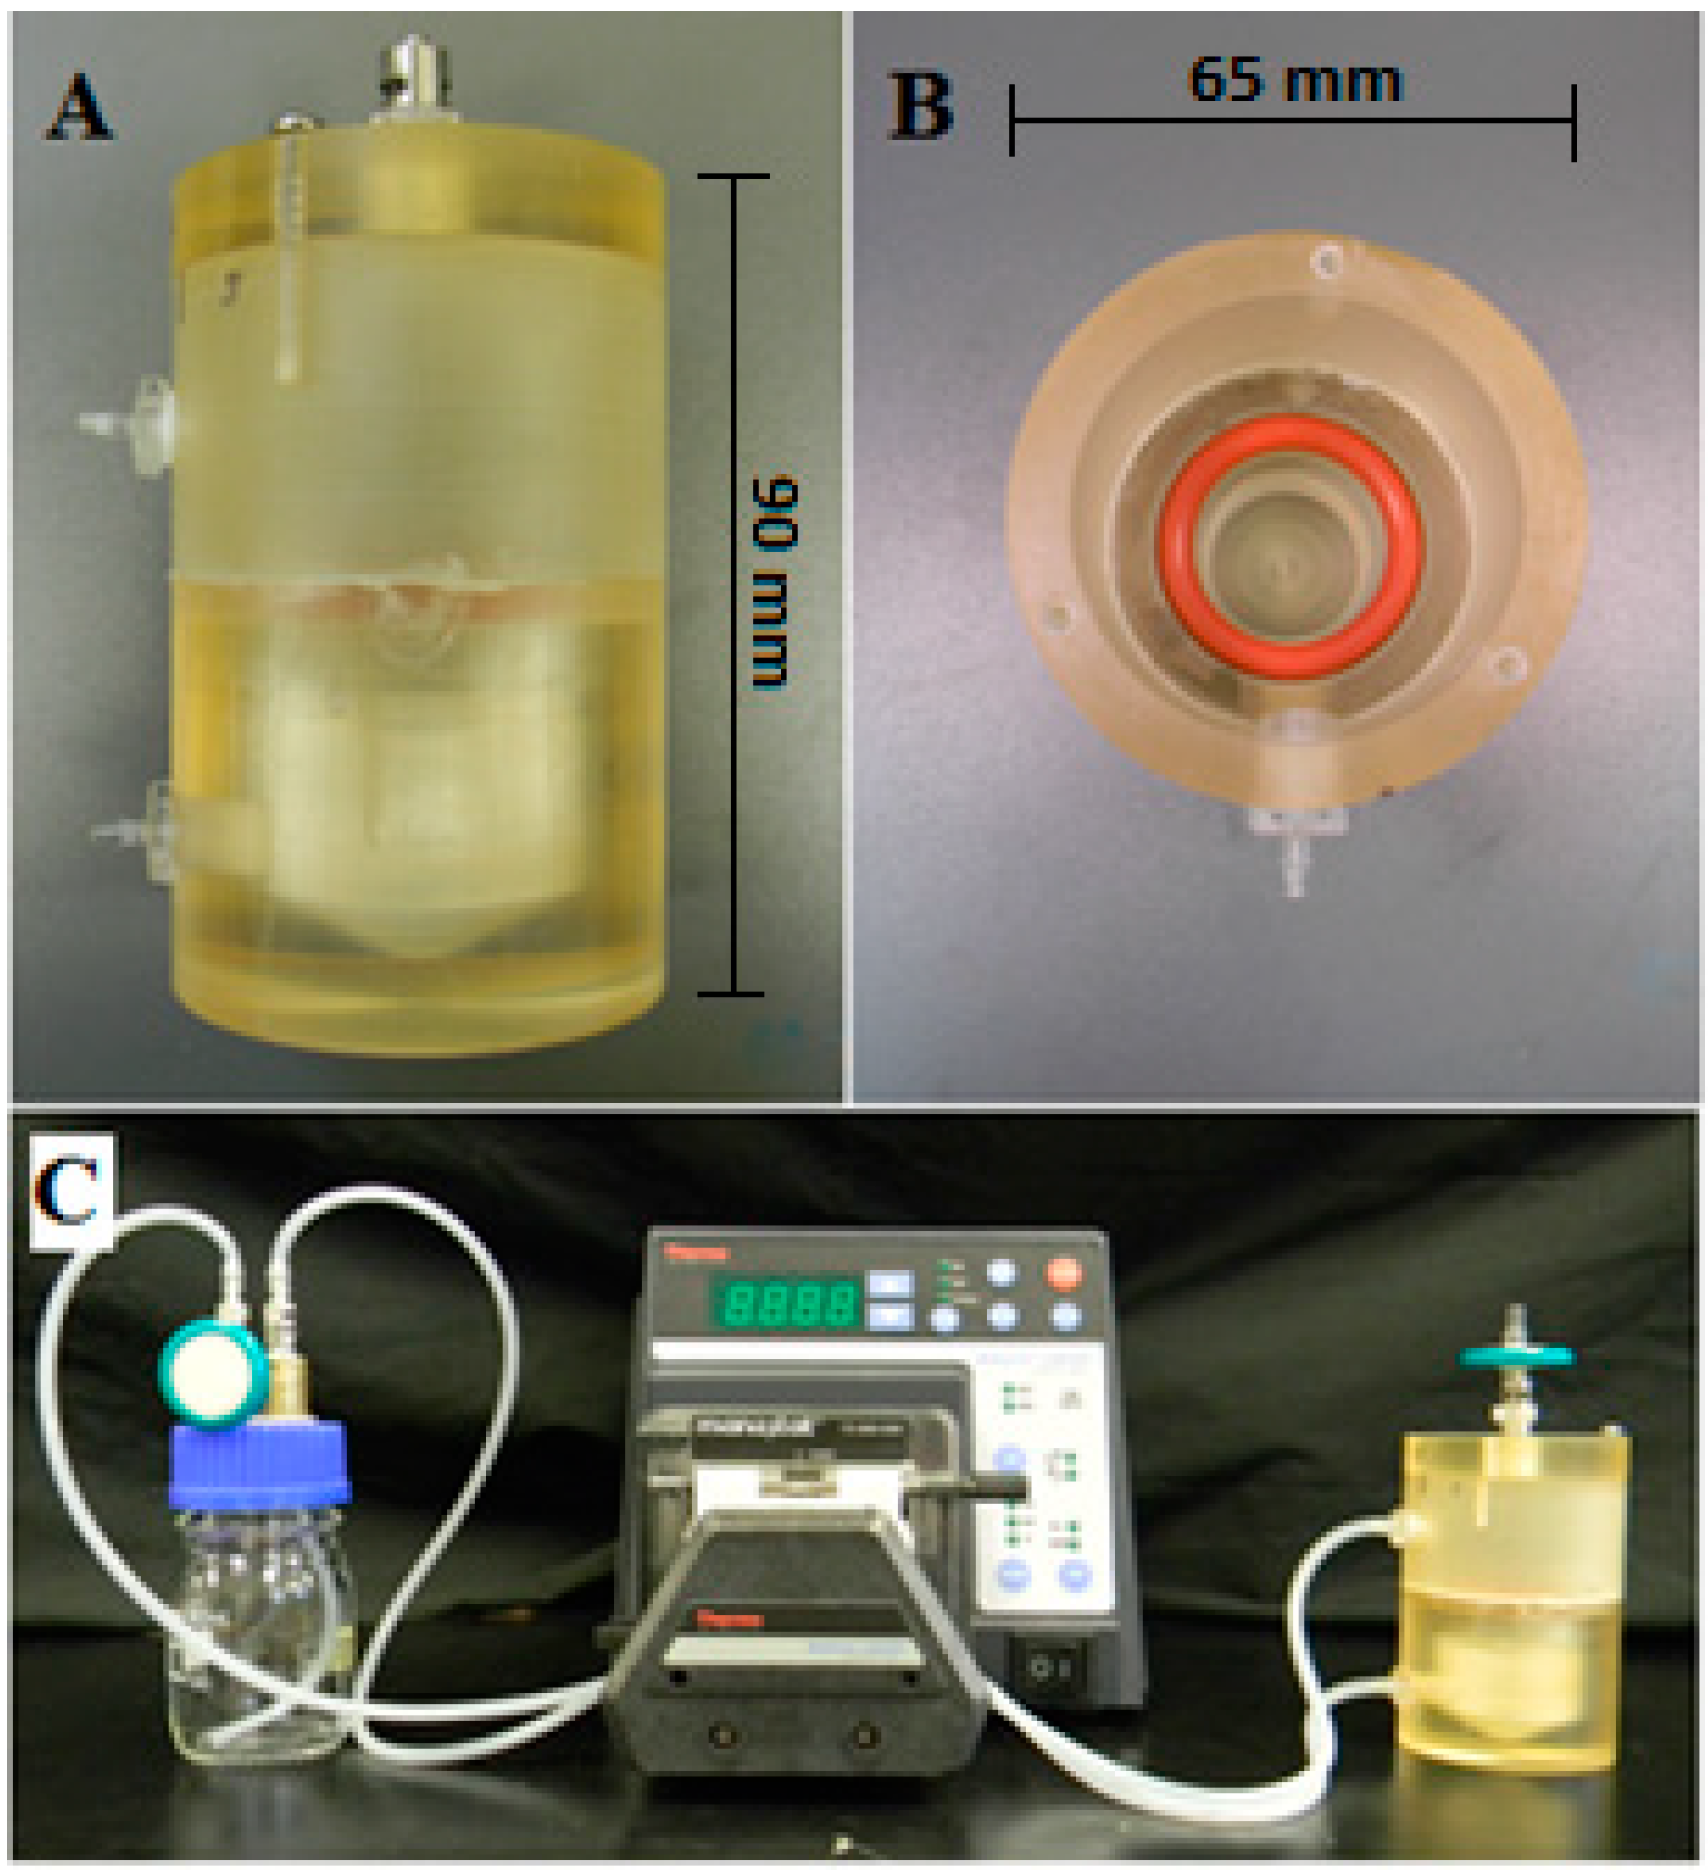
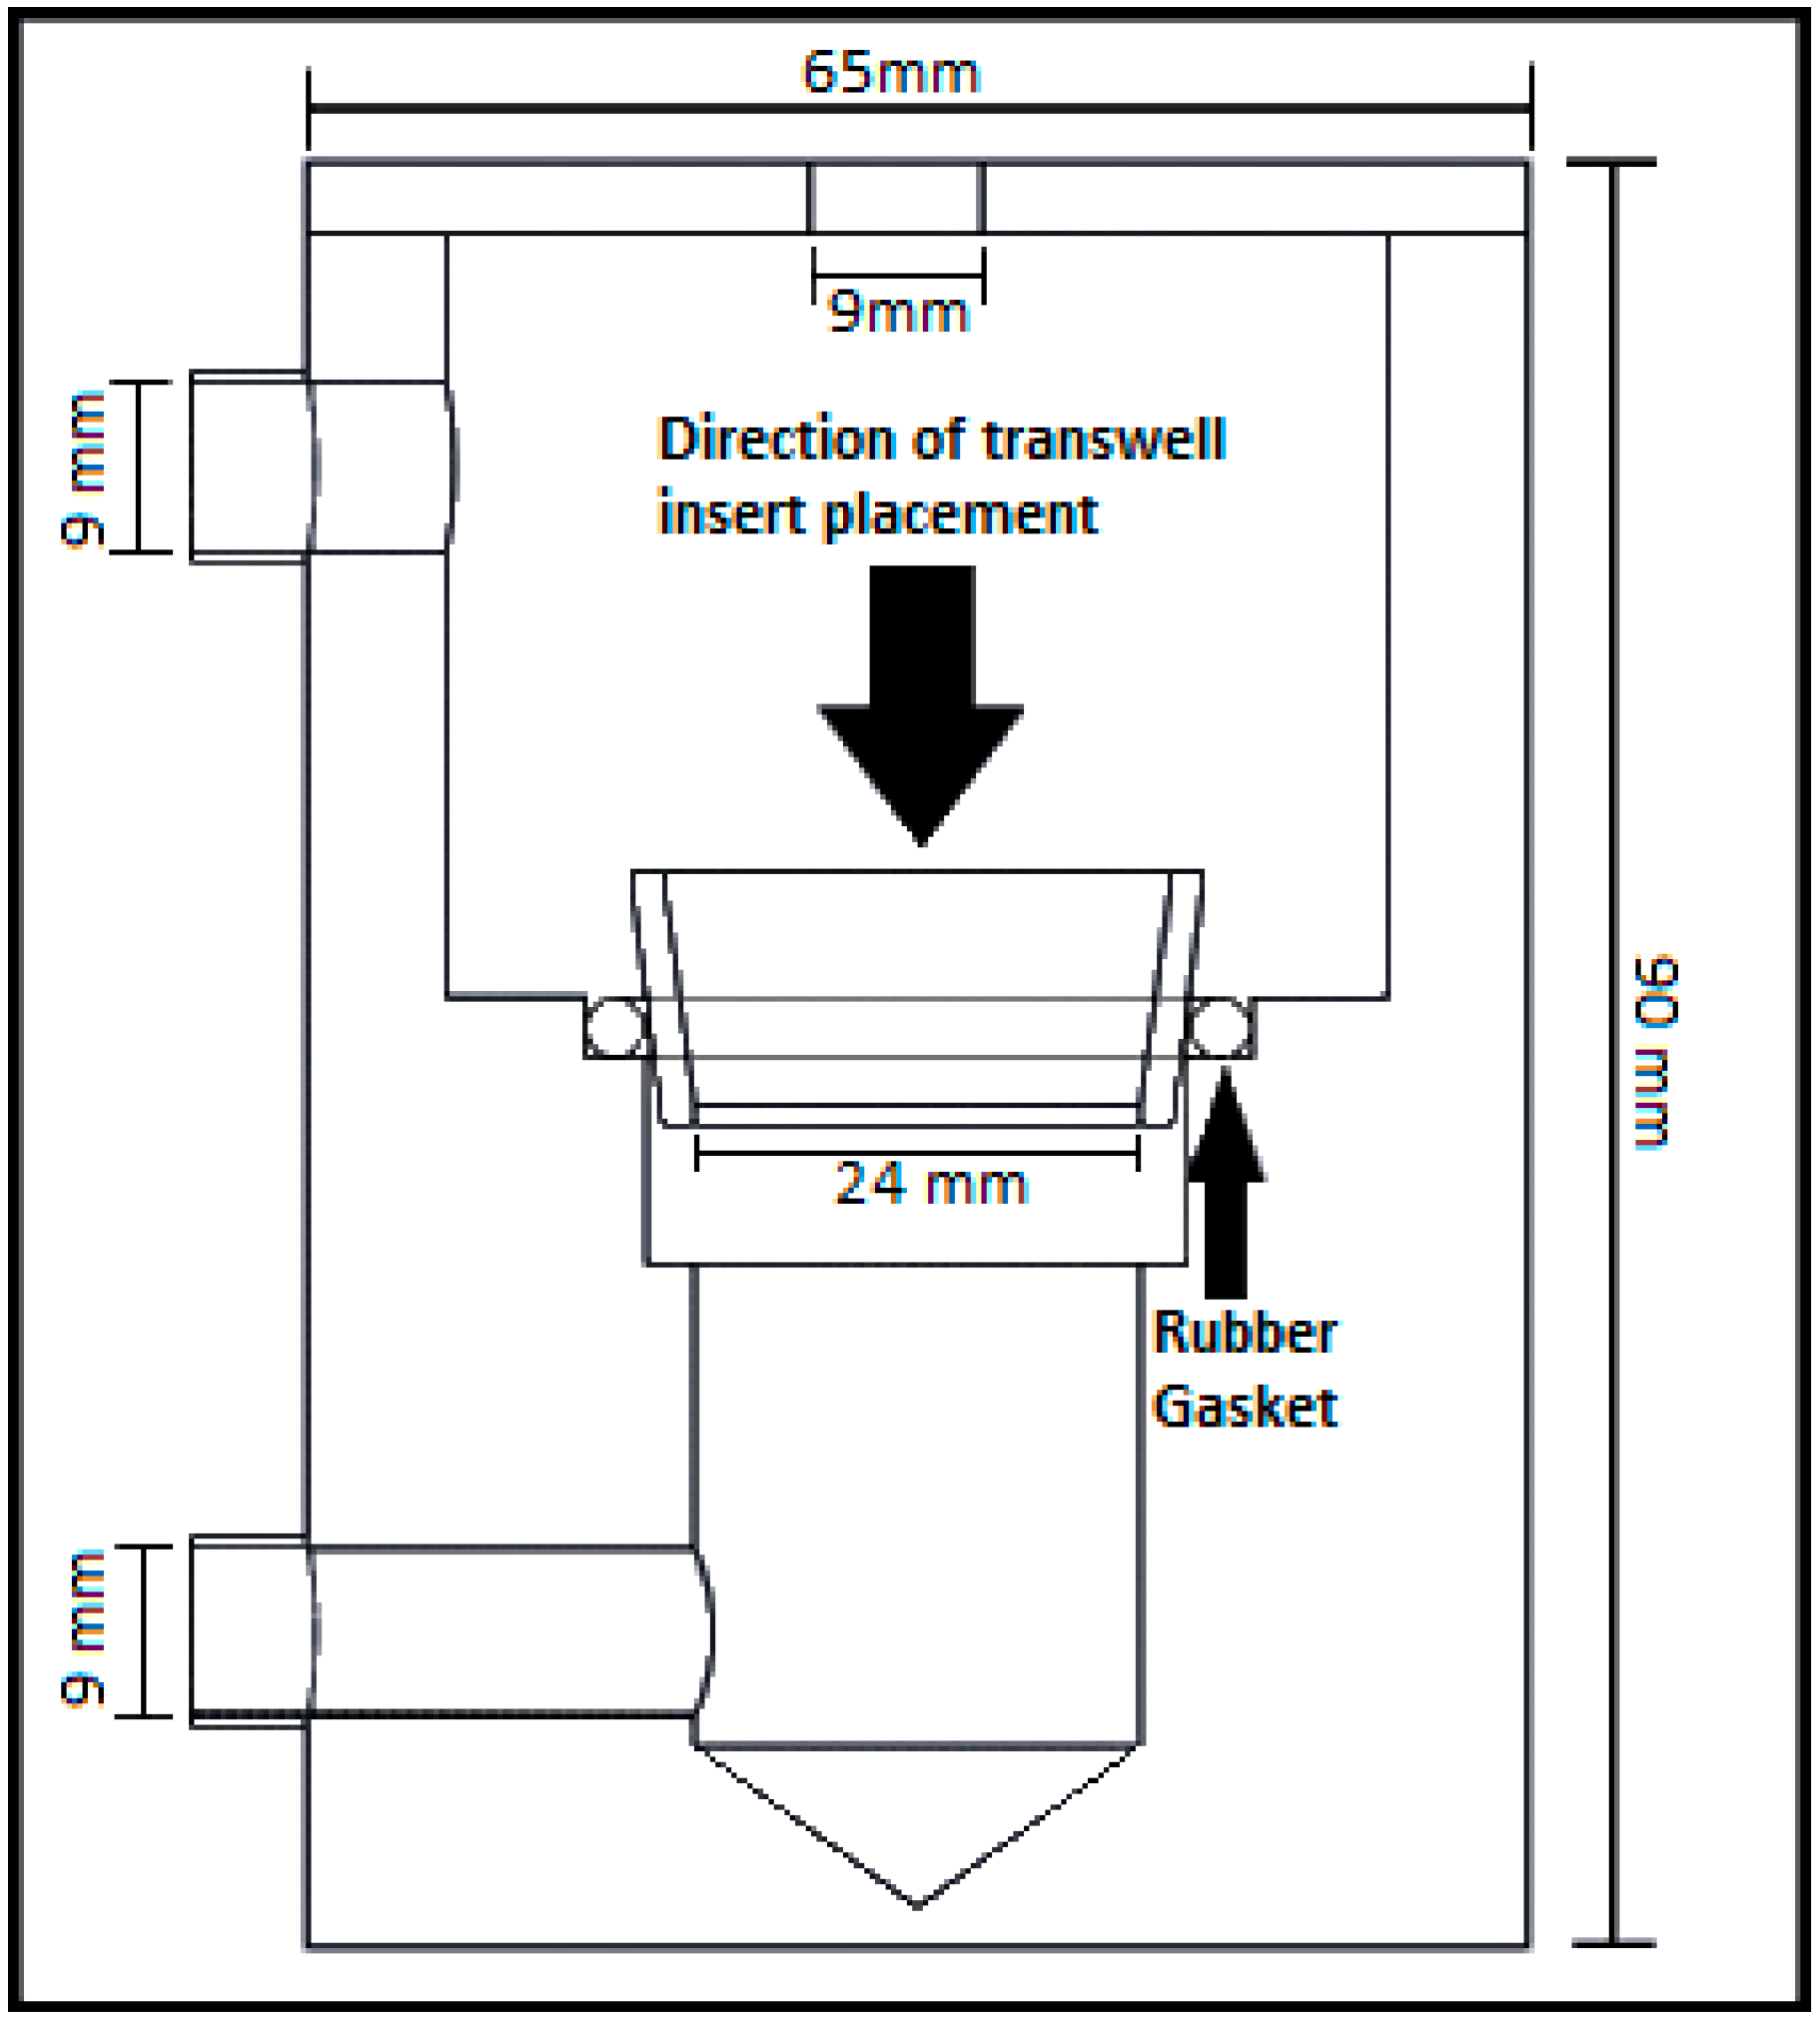
2.1. Perfusion Bioreactor Design


2.2. Cell Isolation and Cell Culture
2.3. Biomechanics and Biochemistry

2.4. Histology
2.5. Modelling

3. Results and Discussion
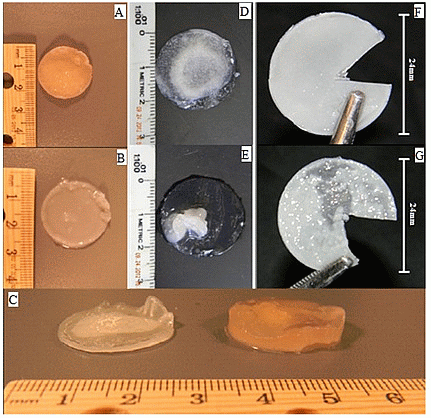
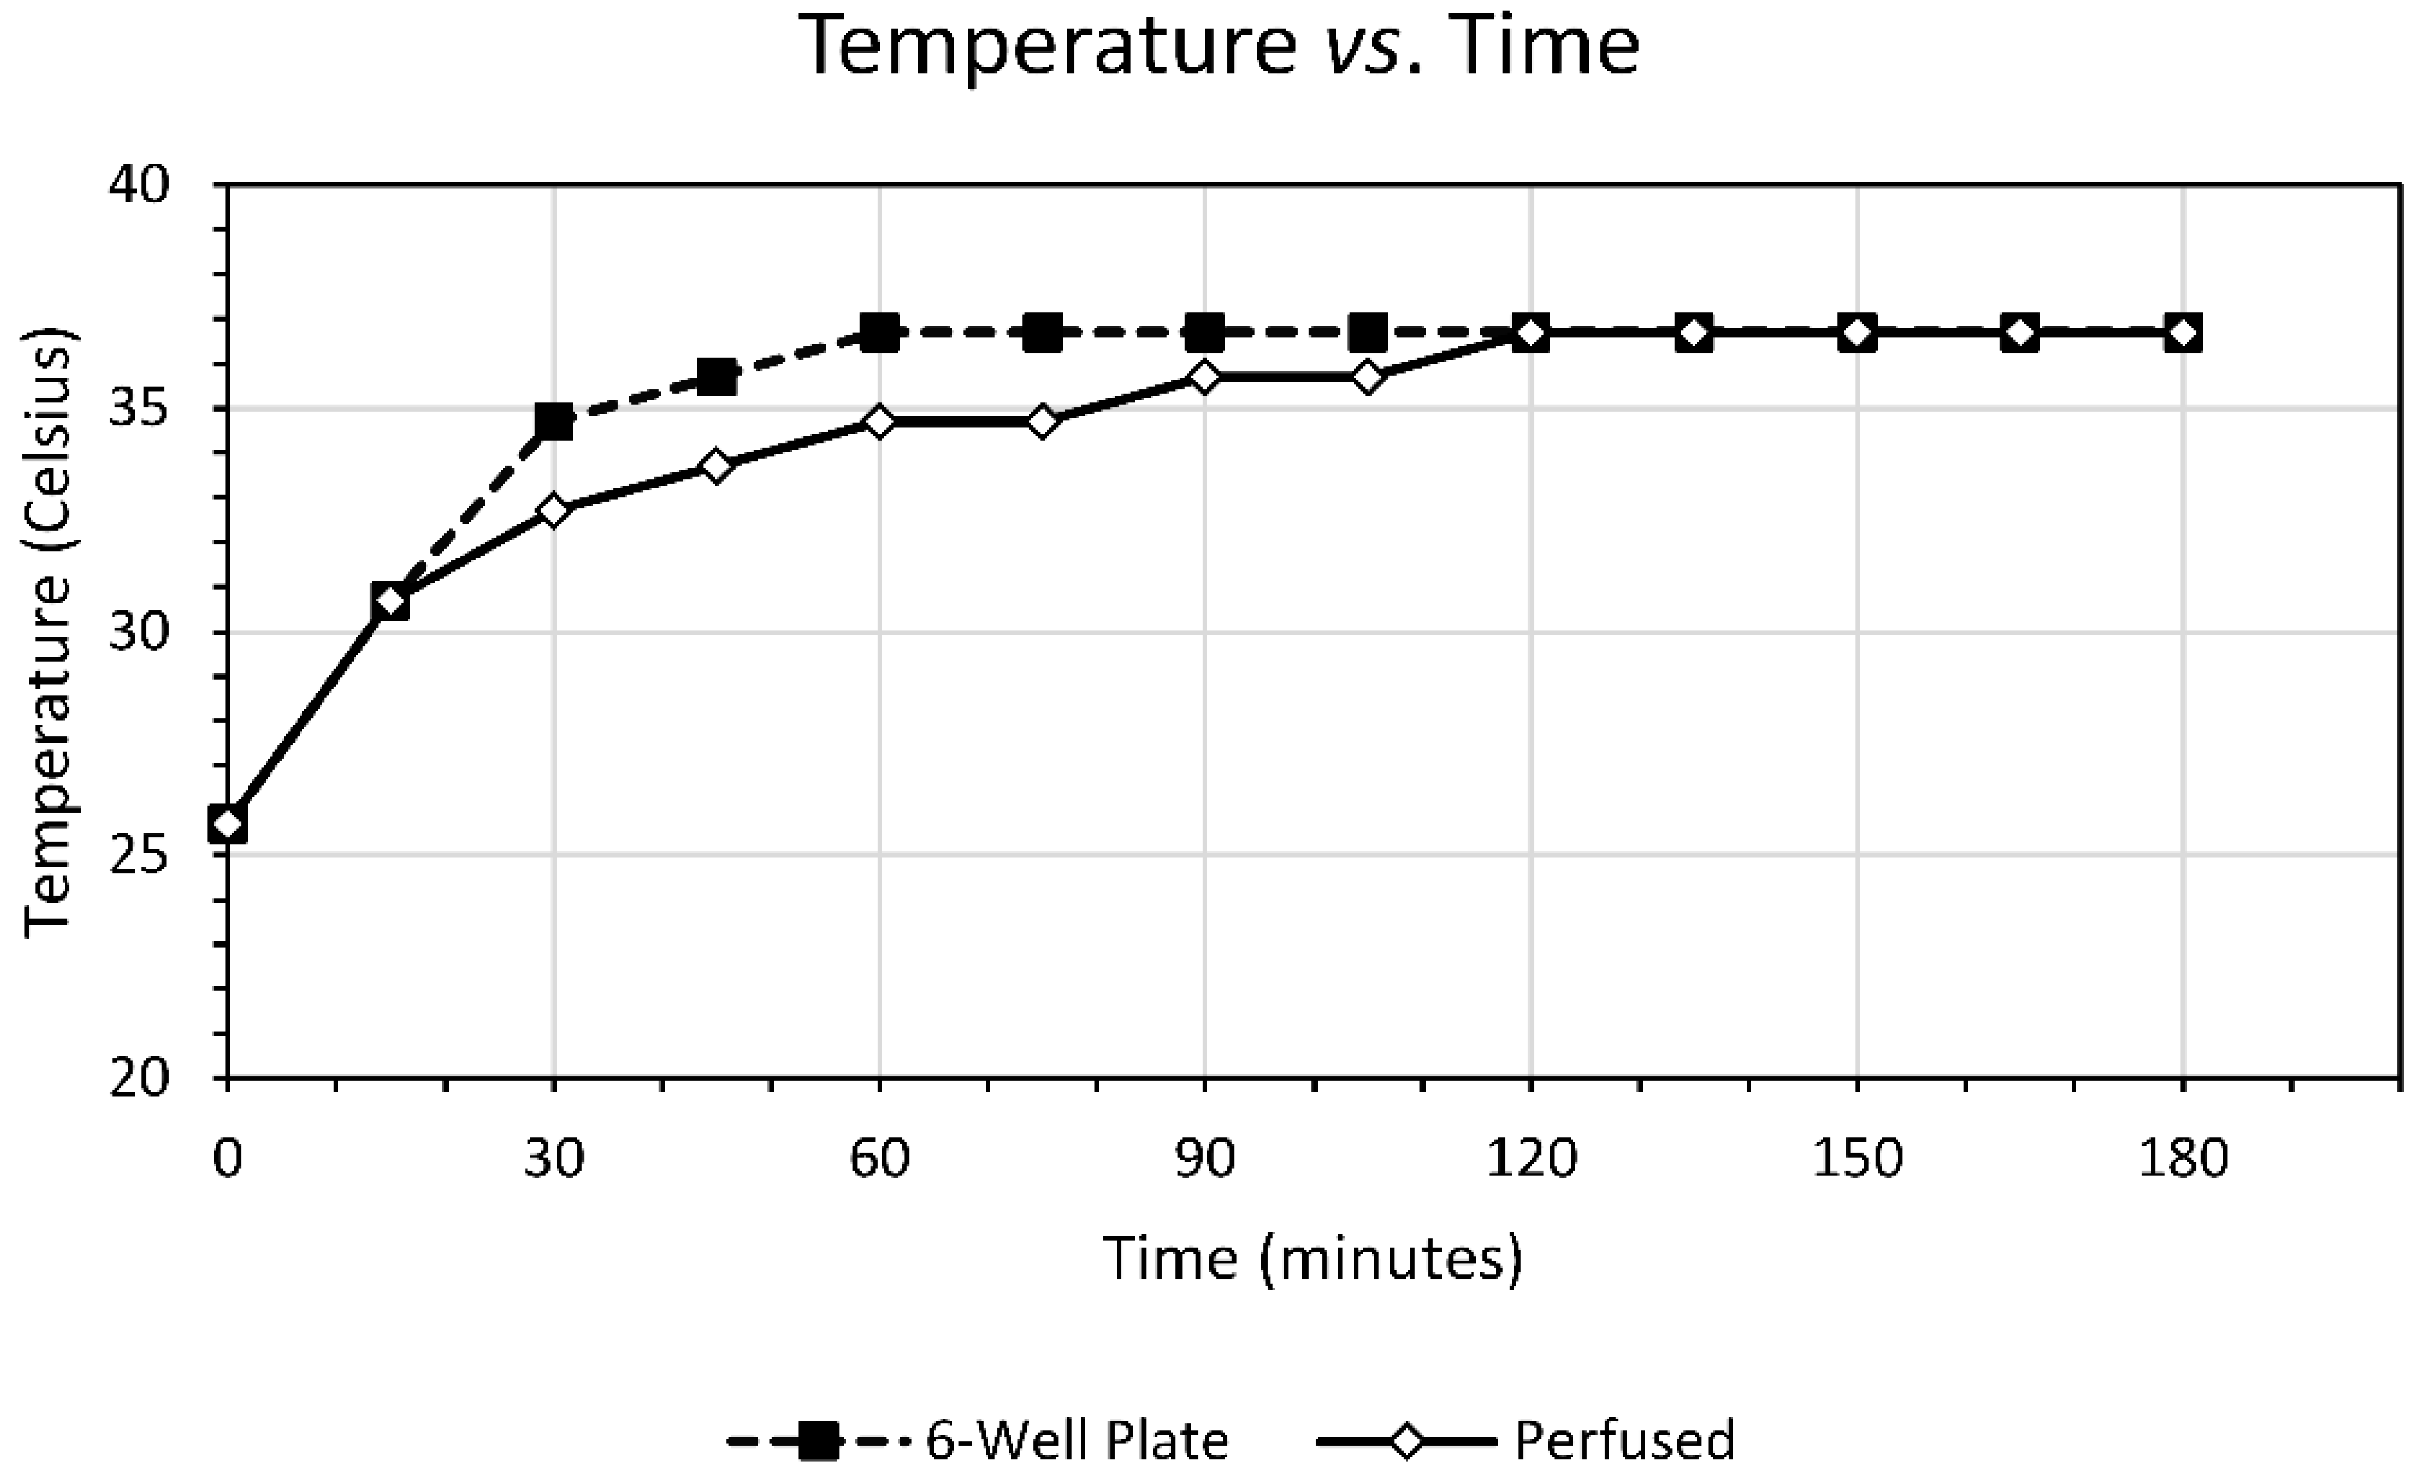
3.1. Bioreactor Design


3.2. Cell Culture

| Experiment | Media Flow | Construct Thickness (mm) | Young’s Modulus (kPa) | Hydroxyproline/DNA (μg/μg) | GAG/DNA (μg/μg) |
|---|---|---|---|---|---|
| Method 1 | Static | 0.79 (±0.056) | 46.6 (±2.4) | 0.0347 (±0.0033) | 0.1199 (±0.0272) |
| Perfused | 3.05 (±0.36) * | 2.4 (±1.0) * | 0.0332 (±0.0010) | 0.1441 (±0.0836) | |
| Method 2 | Static | n/a | 21.0 (±5.7) ** | 0.0353 (±0.0022) | 0.0398 (±0.0078) |
| Perfused | 0.944 (±.287) | 15.8 (±12.1) | 0.0328 (±0.0045) | 0.04452 (±0.00454) | |
| Method 3 | Static | 0.43 (±.302) | 37.6 (±12.7) | 0.301 (±0.040) | 100.10 (±24.6) |
| Perfused | 0.524 (±.0622) | 86.6 (±23.9) * | 0.354 (±0.080) | 75.17 (±5.0) |


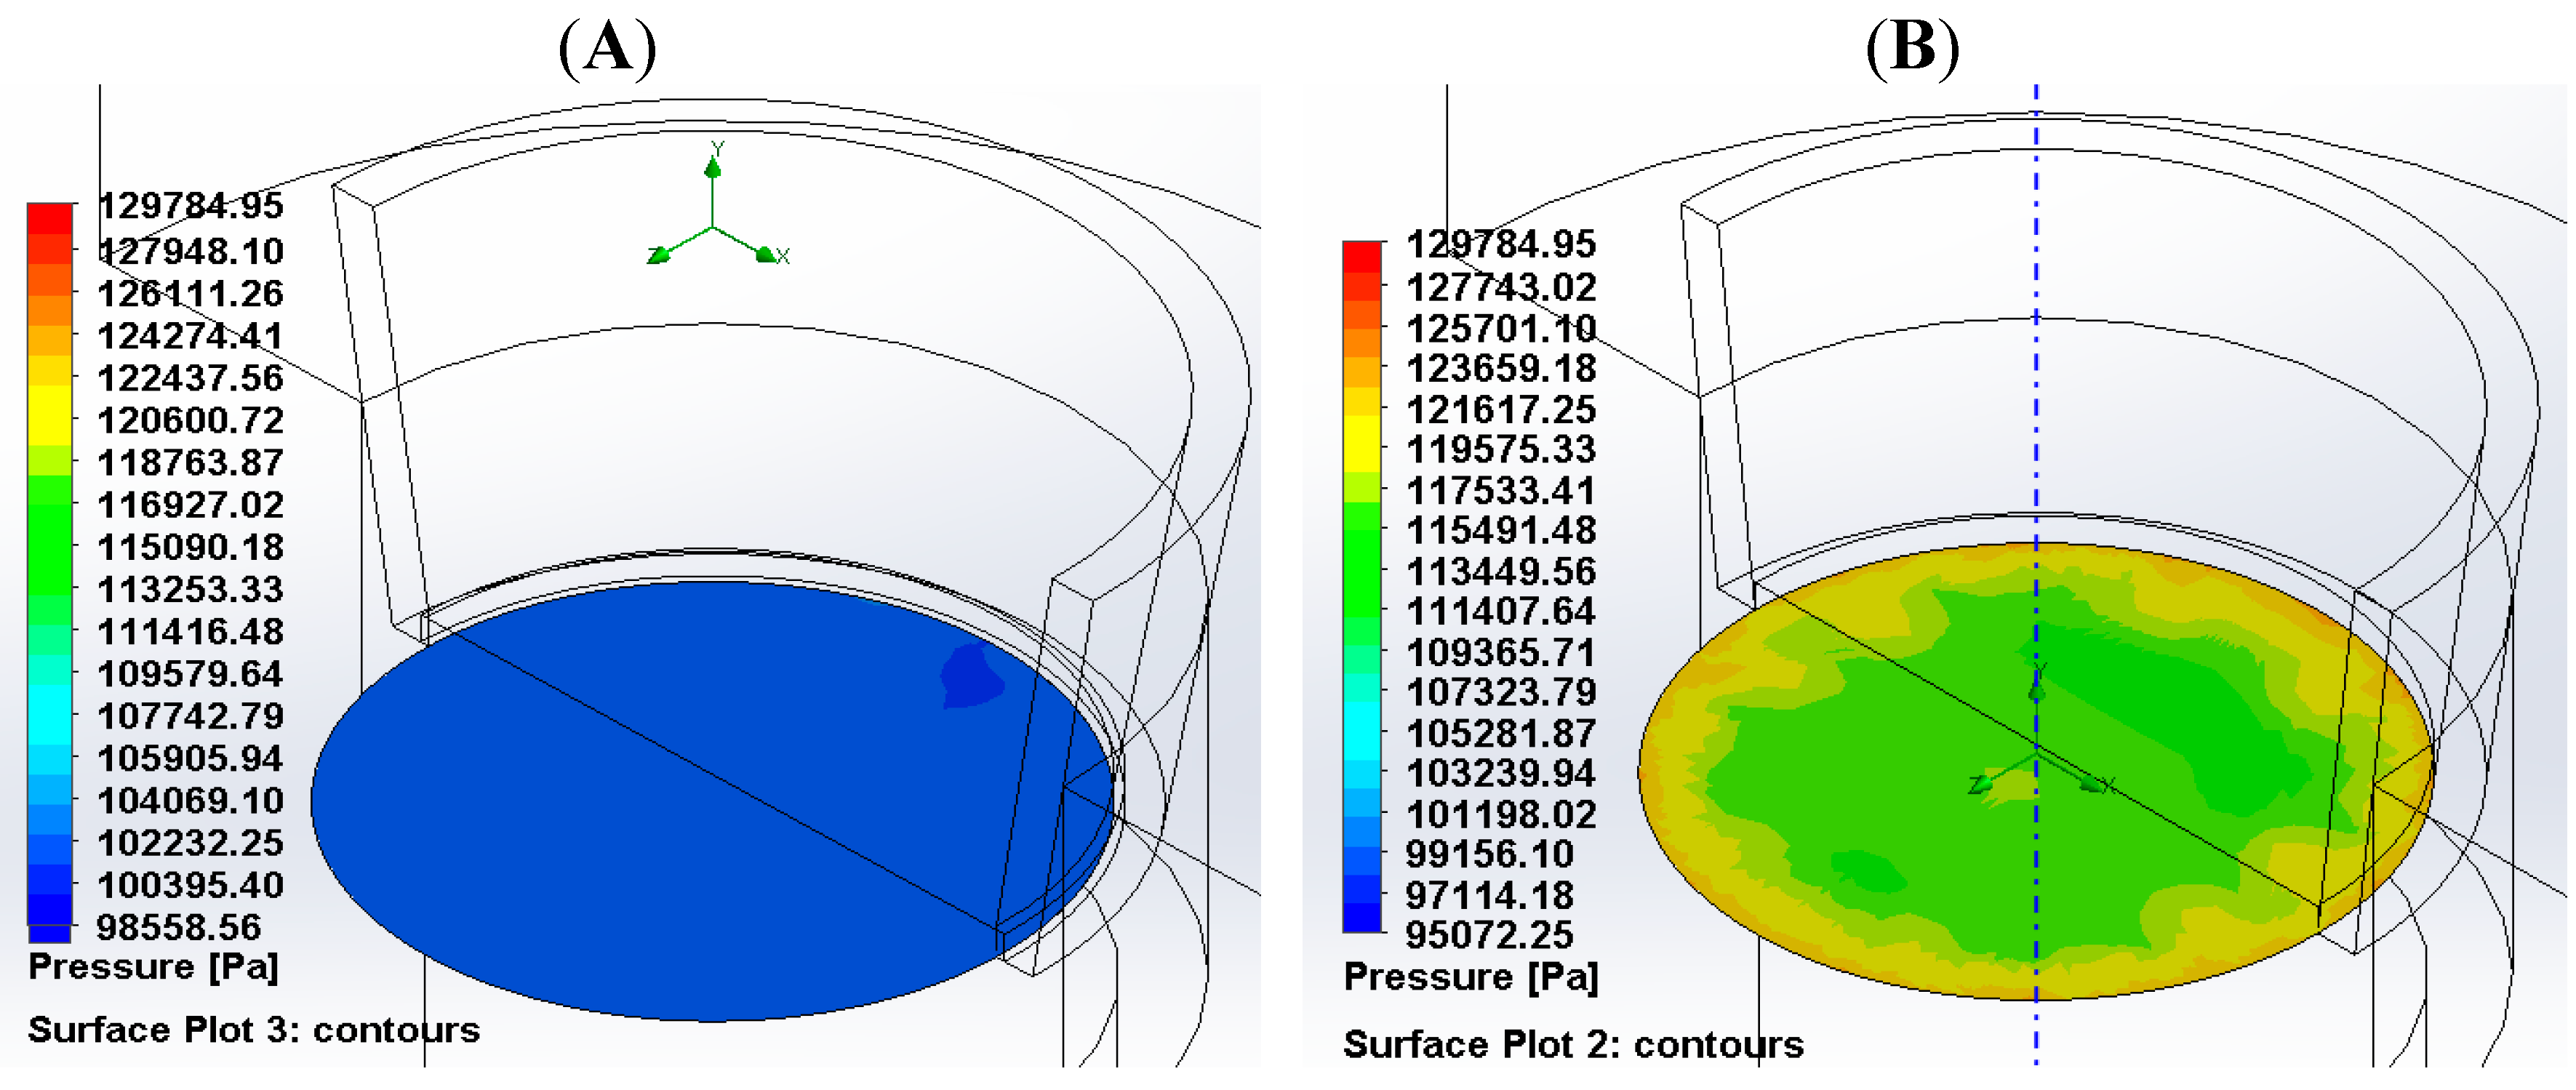
3.3. Modelling


3.4. Discussion
4. Conclusions
Author Contributions
Conflicts of Interest
References
- Nukavarapu, S.; Dorcemus, D. Osteochondral tissue engineering: Current strategies and challenges. Biotechnol. Adv. 2013, 31, 706–721. [Google Scholar] [CrossRef]
- Kahn, I.M.; Singhrao, S.K.; Duance, V.S.; Archer, C.W. Cartilage integration: Evaluation of the reasons for failure of integration during cartilage repair. A Review. Eur. Cells Mater. 2008, 16, 26–39. [Google Scholar]
- Perera, J.R.; Gikas, P.D.; Bentley, G. The present state of treaments for articular cartilage defects in the knee. Ann. R. Coll. Surg. Engl. 2012, 94, 381–387. [Google Scholar] [CrossRef]
- Bhosale, A.M.; Richardson, J.B. Articular cartilage: Structure, injuries and review of management. Br. Med. Bull. 2008, 87, 77–95. [Google Scholar] [CrossRef]
- Darling, E.; Athanasiou, K. Articular cartilage bioreactor and bioprocesses. Tissue Eng. 2003, 9, 9–26. [Google Scholar] [CrossRef]
- Chen, H.-C.; Hu, Y.-C. Bioreactors for tissue engineering. Biotechnol. Lett. 2006, 28, 1415–1423. [Google Scholar] [CrossRef]
- Athanasiou, K.A.; Darling, E.M.; Hu, J.C. Articular Cartilage Tissue Engineering: Synthesis Lectures on Tissue Engineering; Morgan & Claypool: Fort Collins, CO, USA, 2010; Volume 3. [Google Scholar]
- Elder, S.H.; Cooley, A.J., Jr.; Borazjani, A.; Sowell, B.L.; To, H.; Tran, S.C. Production of hyaline-like cartilage by bone marrow mesenchymal stem cells in a self-assembly model. Tissue Eng. Part A 2009, 15, 3025–3035. [Google Scholar]
- Naumann, A.; Dennis, J.E.; Aigner, J.; Coticchia, J.; Arnold, J.; Berghaus, A.; Kastenbauer, E.R.; Caplan, A.I. Tissue engineering of autologous cartilage grafts in three-dimensional in vitro macroaggregate culture system. Tissue Eng. 2004, 10, 1695–1706. [Google Scholar] [CrossRef]
- Hu, J.C.; Athanasiou, K.A. A self-assembling process in articular cartilage tissue engineering. Tissue Eng. 2006, 12, 969–979. [Google Scholar] [CrossRef]
- Murdoch, A.D.; Grady, L.M.; Ablett, M.P.; Katopodi, T.; Meadows, R.S.; Hardingham, T.E. Chondrogenic differentiation of human bone marrow stem cells in transwell cultures: Generation of scaffold-free cartilage. Stem Cells 2007, 25, 2786–2796. [Google Scholar] [CrossRef]
- Campbell, A.B.; Knopp, M.V.; Kolovich, G.P.; Wei, W.; Jia, G.; Siston, R.A.; FLanigan, D.C. Preoperative MRI underestimates articular cartilage defect size compared with an arthroscopic knee surgery. Am. J. Sports Med. 2013, 41, 590–595. [Google Scholar] [CrossRef]
- Salzmann, G.M.; Sah, B.; Südkamp, N.P.; Niemeyer, P. Clinical outcome following the first-line, single lesion microfracture at the knee joint. Arch. Orthop. Trauma Surg. 2013, 133, 303–310. [Google Scholar] [CrossRef]
- Santoro, R.; Olivares, A.L.; Brans, G.; Wirz, D.; Longinotti, C.; Lacroix, D.; Martin, I.; Wendt, D. Bioreactor based engineering of large-scale human cartilage grafts for joint resurfacing. Biomaterials 2010, 31, 8946–8952. [Google Scholar] [CrossRef] [Green Version]
- Furukawa, K.S.; Sato, M.; Nagai, T.; Ting, S.; Mochida, J.; Ushida, T. Scaffold-free Cartilage Tissue by Mechanical Stress Loading for Tissue Engineering; Eberli, D., Ed.; InTech: Winchester, UK, 2010. Available online: http://www.intechopen.com/books/tissue-engineering/scaffold-free-cartilage-tissue-by-mechanical-stress-loading-for-tissue-engineering (accessed on 13 March 2013).
- Mohanraj, B.; Farran, A.J.; Mauck, R.L.; Dodge, G.R. Time-dependent functional maturation of scaffold-free cartilage tissue analogs. J. Biomech. 2014, 47, 2137–2142. [Google Scholar] [CrossRef]
- Vunjak-Novakovic, G.; Obradovic, B.; Treppo, S.; Grodzinsky, A.J.; Langer, R.; Freed, L.E. Bioreactor cultivation conditions modulate the composition and mechanical properties of tissue-engineered cartilage. J. Orthop. Res. 1999, 17, 130–138. [Google Scholar] [CrossRef]
- Mizuno, S.; Allemann, F.; Glowacki, J. Effect of medium perfusion on matrix production by bovine chondrocytes in three-dimensional collagen sponges. J. Biomed. Mater. Res. 2001, 56, 368–375. [Google Scholar] [CrossRef]
- Raimondi, M.T.; Easton, S.M.; Laganà, M.; Aprile, V.; Nava, M.M.; Cerullo, G.; Osellame, R. Three-dimensional structural niches engineered via two-photon laser polymerization promote stem cell homing. Acta Biomater. 2013, 9, 4579–4584. [Google Scholar] [CrossRef]
- Laganà, M.; Raimondi, M.T. A miniaturized, optically accessible bioreactor for systematic 3D tissue engineering research. Biomed. Microdevices 2012, 14, 225–234. [Google Scholar]
- Schulz, R.M.; Bader, A. Cartilage tissue engineering and bioreactor systems for the cultivation and stimulation of chondrocytes. Eur. Biophys. J. 2007, 36, 539–568. [Google Scholar] [CrossRef]
- Julkunen, P.; Korhonen, R.K.; Herzog, W.; Jurvelin, J.S. Uncertainties in indentation testing of articular cartilage: A fibril-reinforced poroviscoelastic study. Med. Eng. Phys. 2008, 30, 506–515. [Google Scholar] [CrossRef]
- Haynes, W.C.; Keer, L.M.; Herrmann, G.; Mockros, L.F. A mathematical analysis for indentation tests of articular cartialge. J. Biomech. 1972, 5, 541–551. [Google Scholar] [CrossRef]
- Reddy, G.K.; Enwemeka, C.S. A simplified method for the analysis of hydroxyproline in biological tissues. Clin. Biochem. 1996, 29, 225–229. [Google Scholar]
- Hoemann, C. Molecular and biochemical assays of cartilage components. In Methods in Molecular Medicine: Cartilage and Osteoarthritis; Ceuninck, F., Sabatini, M., Pastoureau, P., Eds.; Humana Press: Totowa, NJ, USA, 2004; Volume 2, pp. 127–156. [Google Scholar]
- Loboa, E.G.; Wren, T.A.; Beaupré, G.S.; Carter, D.R. Mechanobiology of soft skeletal tissue differentiation—A computational approach of a fiber-reinforced poroelastic model based on homogeneous and isotropic simplifications. Biomech. Model. Mechanobiol. 2003, 2, 83–96. [Google Scholar] [CrossRef]
- Ryu, J.; Saito, S.; Yamamoto, K. Changes in articular cartilage in experimentally induced patellar subluxation. Ann. Rheum. Dis. 1997, 56, 677–681. [Google Scholar] [CrossRef]
- Raimondi, M.T. Engineered tissue as a model to study cell and tissue function from a biophysical perspective. Curr. Drug Discov. Technol. 2006, 3, 245–268. [Google Scholar] [CrossRef]
- Sacco, R.; Causin, P.; Zunino, P.; Raimondi, M.T. A multiphysics/multiscale 2D numerical simulation of scaffold-based cartilage regeneration under interstitial perfusion in a bioreactor. Biomech. Model. Mechanobiol. 2010, 10, 577–589. [Google Scholar]
- Grad, S.; Eglin, D.; Alini, M.; Stoddart, M. Physical stimulation of chondrogenic cells in vitro: A review. Clin. Orthop. Relat. Res. 2011, 469, 2764–2772. [Google Scholar] [CrossRef]
- Mabvuure, N.; Hindocha, S.; Khan, W. The role of bioreactors in cartilage tissue engineering. Curr. Stem Cell Res. Ther. 2013, 7, 287–292. [Google Scholar] [CrossRef]
- Sun, S.; Ren, Q.; Wang, D.; Zhang, L.; Wu, S.; Sun, X. Repairing cartilage defects using chondrocyte and osteoblast composites developed using a bioreactor. Chin. Med. J. 2011, 124, 758–763. [Google Scholar]
- Gharravi, A.M.; Orazizadeh, M.; Ansari-Asl, K.; Banoni, S.; Izadi, S.; Hashemitabar, M. Design and fabrication of anatomical bioreactor systems containing alginate scaffolds for cartialge tissue engineering. Avicenna J. Med. Biotechnol. 2012, 4, 65–74. [Google Scholar]
- Pazzano, D.; Mercier, K.; Moran, J.; Fong, S.; DiBiasio, D.; Rulfs, J.; Kohles, S.; Bonassar, L. Comparison of chondrogenesis in static and perfused bioreactor culture. Biotechnol. Prog. 2000, 16, 893–896. [Google Scholar] [CrossRef]
© 2014 by the authors; licensee MDPI, Basel, Switzerland. This article is an open access article distributed under the terms and conditions of the Creative Commons Attribution license (http://creativecommons.org/licenses/by/3.0/).
Share and Cite
Gilbert, E.; Mosher, M.; Gottipati, A.; Elder, S. A Novel Through-Thickness Perfusion Bioreactor for the Generation of Scaffold-Free Tissue Engineered Cartilage. Processes 2014, 2, 658-674. https://doi.org/10.3390/pr2030658
Gilbert E, Mosher M, Gottipati A, Elder S. A Novel Through-Thickness Perfusion Bioreactor for the Generation of Scaffold-Free Tissue Engineered Cartilage. Processes. 2014; 2(3):658-674. https://doi.org/10.3390/pr2030658
Chicago/Turabian StyleGilbert, Eric, Mark Mosher, Anuhya Gottipati, and Steven Elder. 2014. "A Novel Through-Thickness Perfusion Bioreactor for the Generation of Scaffold-Free Tissue Engineered Cartilage" Processes 2, no. 3: 658-674. https://doi.org/10.3390/pr2030658