Article

Comparison of Membrane Chromatography and Monolith Chromatography for Lactoferrin and Bovine Serum Albumin Separation

Laboratoire d’Automatique et de Génie des Procédés (LAGEP), Université Claude Bernard Lyon I, 43 bd du 11 Novembre 1918, Bâtiment CPE, Villeurbanne Cedex 69622, France
*
Author to whom correspondence should be addressed.
Processes 2016, 4(3), 31; https://doi.org/10.3390/pr4030031
Submission received: 13 July 2016 / Revised: 16 August 2016 / Accepted: 29 August 2016 / Published: 6 September 2016
(This article belongs to the Special Issue Membrane Separation Processes)

Abstract

:
These last few decades, membranes and monoliths have been increasingly used as stationary phases for chromatography. Their fast mass transfer is mainly based on convection, which leads to reduced diffusion, which is usually observed in resins. Nevertheless, poor flow distribution, which causes inefficient binding, remains a major challenge for the development of both membrane and monolith devices. Moreover, the comparison of membranes and monoliths for biomolecule separation has been very poorly investigated. In this paper, the separation of two proteins, bovine serum albumin (BSA) and lactoferrin (LF), with similar sizes, but different isoelectric points, was investigated at a pH of 6.0 with a BSA-LF concentration ratio of 2/1 (2.00 mg·mL−1 BSA and 1.00 mg·mL−1 LF solution) using strong cation exchange membranes and monoliths packed in the same housing, as well as commercialized devices. The feeding flow rate was operated at 12.0 bed volume (BV)/min for all devices. Afterward, bound LF was eluted using a phosphate-buffered saline solution with 2.00 M NaCl. Using membranes in a CIM housing from BIA Separations (Slovenia) with porous frits before and after the membrane bed, higher binding capacities, sharper breakthrough curves, as well as sharper and more symmetric elution peaks were obtained. The monolith and commercialized membrane devices showed lower LF binding capacity and broadened and non-symmetric elution peaks.

Graphical Abstract

1. Introduction

Downstream processes in the biopharmaceutical and biotechnological industries usually rely on multiple chromatographic steps, with micro-sized resins in a packed-bed column as the stationary phase. The resins have diameters between 100 and 500 μm and generally provide an efficient chromatographic technique with high binding capacity [1,2]. However, the method is rather slow and represents a major cost in biomolecules production, as the transport of solute molecules to the binding sites inside resin pores is limited by intra-particle diffusion. The pressure drop over the column is high even at low flow rates and increases during processing due to bed consolidation and column blinding [3]. Decreases in binding capacity and throughput are also observed when using large biomolecules and highly concentrated feed-stocks [4,5]. Furthermore, scaling-up a resin-based column remains a challenge, as significant medium compression and increasing pressure drops are observed with increasing bed height [6]. Consequently, several other innovative stationary phases, including monoliths and membranes, have been developed in the last few decades as possible alternatives to classical chromatographic supports.
Membrane chromatography is based on the integration of membrane filtration and liquid chromatography into a single-step operation [3,7,8]. The main advantage of the method is attributed to short diffusion times, as the interactions between molecules and active sites in the membrane occur in convective through-pores rather than in stagnant fluid inside the resin pores. Therefore, membrane chromatography has the potential to operate at high flow rates and low pressure drops, to purify large biomolecules with small diffusivities and to reduce the degradation and denaturation of biomolecules, as well as buffer usages [3,8,9]. Another interesting feature of these membrane devices for biopharmaceutical industries is their single-use ability, as the elimination of cleaning and regeneration steps reduces the contamination risk and manufacturing costs. Several membrane materials have been tested as chromatographic supports: inorganic-organic (e.g., an alkoxysilane coated on glass fiber and alumina membranes [10]) and organic materials (i.e., cellulose and its derivatives, nylon, polyethersulfone, polypropylene, polyvinylidene, etc. [5,10]). Most membrane chromatography devices, especially those for ion-exchange, are made from regenerated cellulose [10]. Several devices, including axial, radial and tangential flow devices, have also been tested. Axial flow devices containing stacked membrane disks are commonly used at the laboratory scale and are commercialized with different membrane volumes. Radial flow membrane chromatography, reported first in the late 1980s [11], is preferred for large-scale applications due to having the easiest scale-up. Nowadays, several radial flow membrane chromatography devices are commercialized with large bed volumes up to 1–5 L. Tangential flow devices are another possible alternative for industrial applications and could reduce membrane fouling [12]. Recently, Madadkar et al. [13] presented a novel configuration using stacked membrane sheets with lateral feed, to obtain a more uniform flow distribution and, therefore, higher resolution of the elution peaks.
Monoliths are single pieces of porous materials characterized by a highly interconnected network of channels with diameters in the range of 10–4000 nm [14,15]. The major benefit of monolithic supports for chromatography is similar to the one of membranes. The mobile phase is forced to flow through the large pores; as a consequence, mass transport is mainly based on convection, and high flow rates can be obtained without negative effects on separation performance. Due to the large pore size and short bed of monolith supports, the separation time, as well as the pressure drop compared to traditional resin columns can be decreased [15,16,17,18]. In addition, monolithic columns offer high resolution fractionation and have been increasingly employed for analytical and chip-based separation [19]. This high resolution separation results from the absence of void volume in the monolithic column, which reduces eddy dispersion and void flow [14,18,20,21]. Monoliths have been produced using a large range of materials, including polymethacrylate, polyacrylate, polyacrylamide, polystyrene, cellulose and silica [17,22]. Most monoliths for chromatography are made from polymethacrylate [17,22]. They are available in two main geometries for the laboratory scale: disk shaped (diameter > length) and rod shaped (length > diameter) [23]. For both geometries, scaling-up remains an issue as mechanical instability and inhomogeneity in the monolith are observed with increasing diameter. Monolithic rods can be scaled up by increasing their length; however, the increasing pressure drop becomes a major problem [22]. Similar to membrane devices, monolithic tubes have been introduced for large-scale separation units with radial flow [22]. To prepare a monolith tube of desired thickness, several cylinders of appropriate dimensions are polymerized and inserted one into another [22]. A subsequent polymerization can be performed to fill the void between the cylinders when required. The same authors [24] prepared tubular monolithic columns up to 8 L, having high resolution separation and significant productivity.
Despite numerous studies on membrane and monolith chromatography, the comparison of their separation performance has been poorly studied. To our knowledge, only Gagnon et al. [19] compared the performance of membrane and monolith anion exchangers for the removal of DNA from IgG solutions. The authors showed that breakthrough curves using membrane devices were broadened and happened earlier; in addition, the binding capacities were lower than the ones obtained with the monolith device. The low performance of the membrane was explained by the non-ideal flow distribution in the membrane device: flow occurs between membrane layers and elsewhere within the housing; on the contrary, this does not happen in monoliths, which have a very limited void volume. The larger void volume is a major cause of band spreading in chromatographic separation due to dispersion in this area. However, the housings containing the membrane and monolith were different, which could lead to an erroneous comparison.
In this work, the separation of two similarly-sized proteins, BSA and lactoferrin (LF), is studied using monolith and membrane supports, which are both strong cation exchangers. Although many techniques have been developed to isolate LF, the separation of high-value minor proteins of similar molecular weights, such as BSA and LF, remains a challenge [25,26]. BSA is a 66.5-kDa protein with an isoelectric point near 4.7; LF is a 78.0-kDa protein with an isoelectric point around 8.7. In our former study [27], we obtained effective separation of BSA and LF using membrane chromatography at a pH between the isoelectric point of these two proteins. Using the cation exchange membrane, LF was completely retained until breakthrough occurred; the highest selectivity was obtained at a strong ionic strength of 100 mM and buffer pH 6.0. At these conditions, BSA passed completely through the membrane and into the effluent. Afterward, bound LF was collected by increasing the ionic strength using a phosphate buffer saline solution with 2.00 M NaCl.
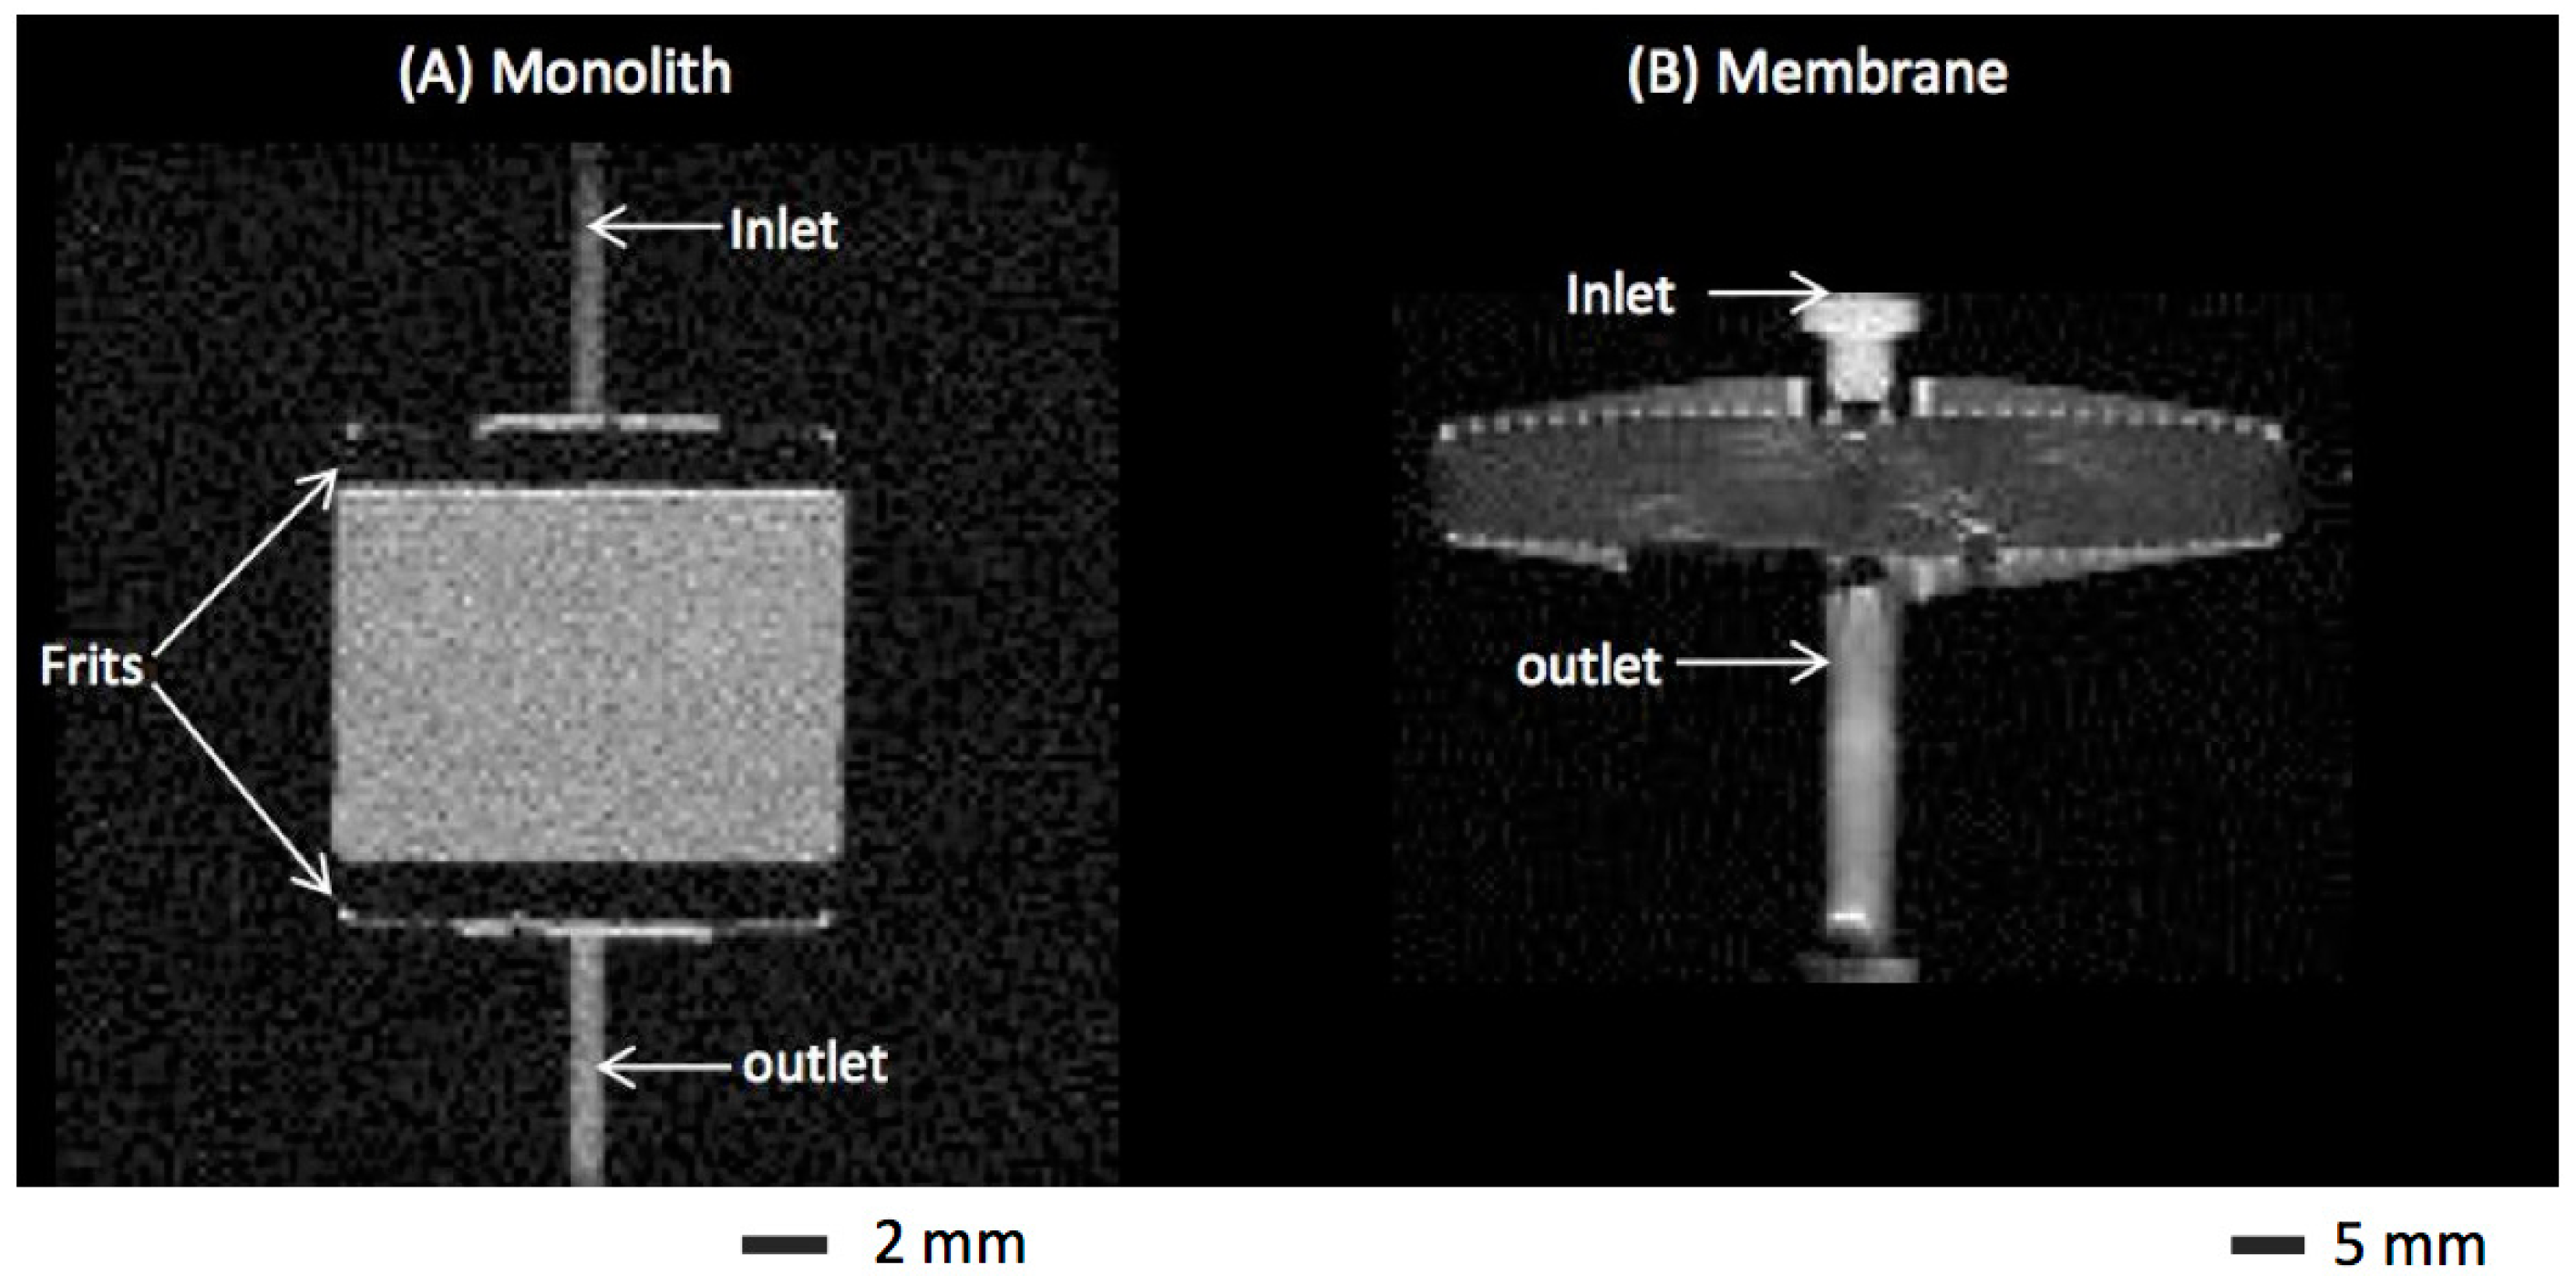
To compare monolith and membrane chromatography for LF and BSA separation, we used membranes stacks and monolith discs with identical bed heights placed into the same housing of an axial flow column (CIM housing, BIA Separations, Slovenia). The effects of membrane and monolithic media on flow distribution, binding behavior and elution peaks were measured. In addition, the effect of bed height for membrane and monolithic devices was investigated. The performances of membranes packed in the CIM housing and commercial chromatographic membrane devices were also compared.

2. Materials and Methods

2.1. Chromatographic Media and Devices

Monolithic discs and membrane flat-sheet stacks were compared at the same bed height using the same CIM housing from BIA Separations (Ljubljana, Slovenia). The characteristics of the different chromatographic media and devices with their dimension parameters (i.e., membrane diameter (Dm), bed height (H) and bed volume (BV)) used in this work are summarized in Table 1. The internal diameter of the CIM housing is 16 mm, and the bed height can be increased up to 12 mm. The CIM housing allows efficient flow distribution and optimized void volume; moreover, it makes the column packing and unpacking simple.
Strong cation exchange CIM monolithics from BIA Separations (Ljubljana, Slovenia) were selected as the monolith supports. These poly(glycidyl methacrylate-co-ethylene dimethacrylate) monoliths are highly interconnected polymeric networks of nuclei, agglomerated into globules, further agglomerated into clusters [27]. CIM monoliths (Dm = 12.00 mm, H = 3.00 mm) are surrounded by a nonporous fitting ring, which prevents chipping of the edges and/or breaking when exposed to the maximal flow rate. The pore diameter of the monolithic is 1.35 μm for the CIM disc and 2.10 μm for the CIMmultus device (data given by the manufacturer); the porosity is around 0.60 for CIM discs [27]. The interconnected pore structure of the CIM media was previously observed by scanning electron microscopy (SEM) [5]. For strong cation exchanger monoliths, sulfonyl groups are coated on the internal surfaces. In the first experiments, a CIM disc (H = 3.0 mm, BV = 0.34 mL) was inserted into the CIM housing; then, H was increased by inserting 3 CIM discs (H = 9.0 mm and BV = 1.02 mL). A CIMmultus device (BIA Separations, Ljubljana, Slovenia) with radial flow (BIA Separations) was also investigated (BV = 1.00 mL).
Strong cation exchange membranes Sartobind S (Sartorius Stedim Biotech GmbH, Goettingen, Germany) were used as the membrane chromatographic media. Sartobind S membranes are formed by a macroporous support based on reinforced cross-linked cellulose containing a hydrogel layer on the macroporous walls [28]. The membrane pore diameter is in the range of 3.0–5.0 μm; the membrane thickness is 275 m (data provided by the manufacturer); and the porosity is around 0.78 [28]. The pore structure of the Sartobind membrane was visualized using SEM by Tatarova et al., 2009 [28]. Sulfonic acid groups for cation exchange are bound covalently to the internal surface of the membrane. To fit the CIM housing, an A4 sheet of membrane was cut into discs of 16.00 mm in diameter. First, 11 membrane discs were placed into the CIM housing (H = 3 mm and BV = 0.60 mL). The membrane stack was then increased by packing 33 membrane discs into the housing (H = 9 mm and BV = 1.80 mL). The performance of a commercialized membrane device Sartobind S75, with 15 discs (BV = 2.1 mL), was also tested for comparison.
The internal geometries of the CIM housing containing 3 discs of monolith (H = 9.0 mm) and the Sartobind S75 device (Sartorius Stedim Biotech GmbH, Goettingen, Germany) are shown Figure 1. These images were obtained by magnetic resonance imaging (MRI) using a 4.7 T BioSpec (Bruker, Champs-sur-Marne, France) with a magnetic Magnex field gradient SGRAD 156/100/S and a quadrature coil (Rapid Biomedical, Germany) used for excitation and signal detection. From Figure 1, the inlet and outlet of the devices can be observed. For the monolith, the flow is distributed through frits placed above and below the monolith. For the Sartobind device, flow distributors consist of 8 radial channels and 14 circular channels [30]. In the inlet distributor, the fluid is conducted to the peripheral region of the membrane by the radial channels and distributed through all of the membrane section by the circular channels. The fluid takes an inverse path in the outlet distributor.

2.2. Protein Solutions

BSA-LF solutions were prepared at a BSA-LF concentration ratio of 2/1 by mixing the same volume of 2.00 mg·mL−1 BSA solution and 1.00 mg·mL−1 LF solution. Before use, the protein mixtures were filtered through a 0.22 µm polyethersulfone hydrophilic Millex-GP filter unit (Millipore, Molsheim, France) to remove any fine particles. The BSA lyophilized powder with purity ≥96% was obtained from Sigma Aldrich (Saint Quentin Fallavier, France). Purified bovine LF lyophilized powder (≥93% of purity) was generously offered by Erie Europe (Paris, France). The 100 mM potassium phosphate buffer solutions at pH 6.0 were prepared by adjusting the volumes of the K2HPO4 and KH2PO4 solutions (Sigma Aldrich, Saint Quentin Fallavier, France) and subsequently filtered through a hydrophobic membrane filter with a 0.45 µm pore size (Millipore, Molsheim, France). Concentrations of LF and BSA solutions were measured by spectrophotometry at 280 nm using the UV detector of the Aktaprime-plus system (GE Healthcare, Vélizy-Villacoublay, France). For BSA-LF mixture solutions, concentrations of LF and BSA were determined using the two separate breakthrough curves of BSA and LF, as previously detailed in our study using ion exchange chromatography membrane devices [31].

2.3. BSA-LF Mixture Separation

All experiments were performed using an Aktaprime-plus system with a UV-280 detector (GE Healthcare, Vélizy-Villacoublay, France). Data acquisition was monitored online using the Primeview 5.0 software (GE Healthcare, Vélizy-Villacoublay, France). The Aktaprime-plus pump controls the flow rate in the range of 0.1–50.0 mL·min−1, the maximum operating pressure being 1.10 MPa. The separation was composed of the following different steps: equilibrium, protein loading, washing and elution steps. All separation steps were operated at a constant flow rate of 12.0 BV·min−1. Bound LF was recovered using a phosphate-buffered saline solution with 2.00 M NaCl.
The BSA-LF separation cycles were performed in triplicate without regeneration between each cycle. After three complete cycles, the stationary phase was cleaned and regenerated using 1.00 M NaOH at 1.0 BV·min−1 for 1 h, followed by 10.0 BV of the elution and phosphate buffers, during 10 min for each solution. The dynamic binding capacity of LF at 10% breakthrough (DBC10%) was determined using the method previously described [30]. Values were reported per BV of stationary phase, as the average ± standard deviation of 3 independent measurements. The void volume (V0) of each chromatographic device connected to the external system (i.e., tube, pump, UV cell, etc.) was measured by loading 5% of acetone in phosphate buffer; V0 was then read at 10% of the loading concentration.

3. Results

3.1. BSA-LF Mixture Separation

BSA-LF mixture separation was performed at different flow rates (12.0, 18.0 and 24.0 BV·min−1) using monolith and membrane in the CIM housing (H = 3.00 mm) and the Sartobind S75 device (H = 4.00 mm). The average operating pressure was measured during the loading step (Supplementary Material). The operating pressures were slightly higher using the monolith in the CIM housing compared to the membranes, although they have the same bed height of 3.00 mm. This could be due to the membrane’s larger pore size, 3.00–5.00 μm, and higher porosity, 0.78 [28], compared to the values of the monolith, which are respectively given as 1.35 μm and 0.60 [27]. In addition, the Sartobind S75 device required slightly higher operating pressures than the membrane in the CIM housing, which may be due to its higher bed height (4 mm) compared to the membranes stacked in the CIM housing (3 mm).
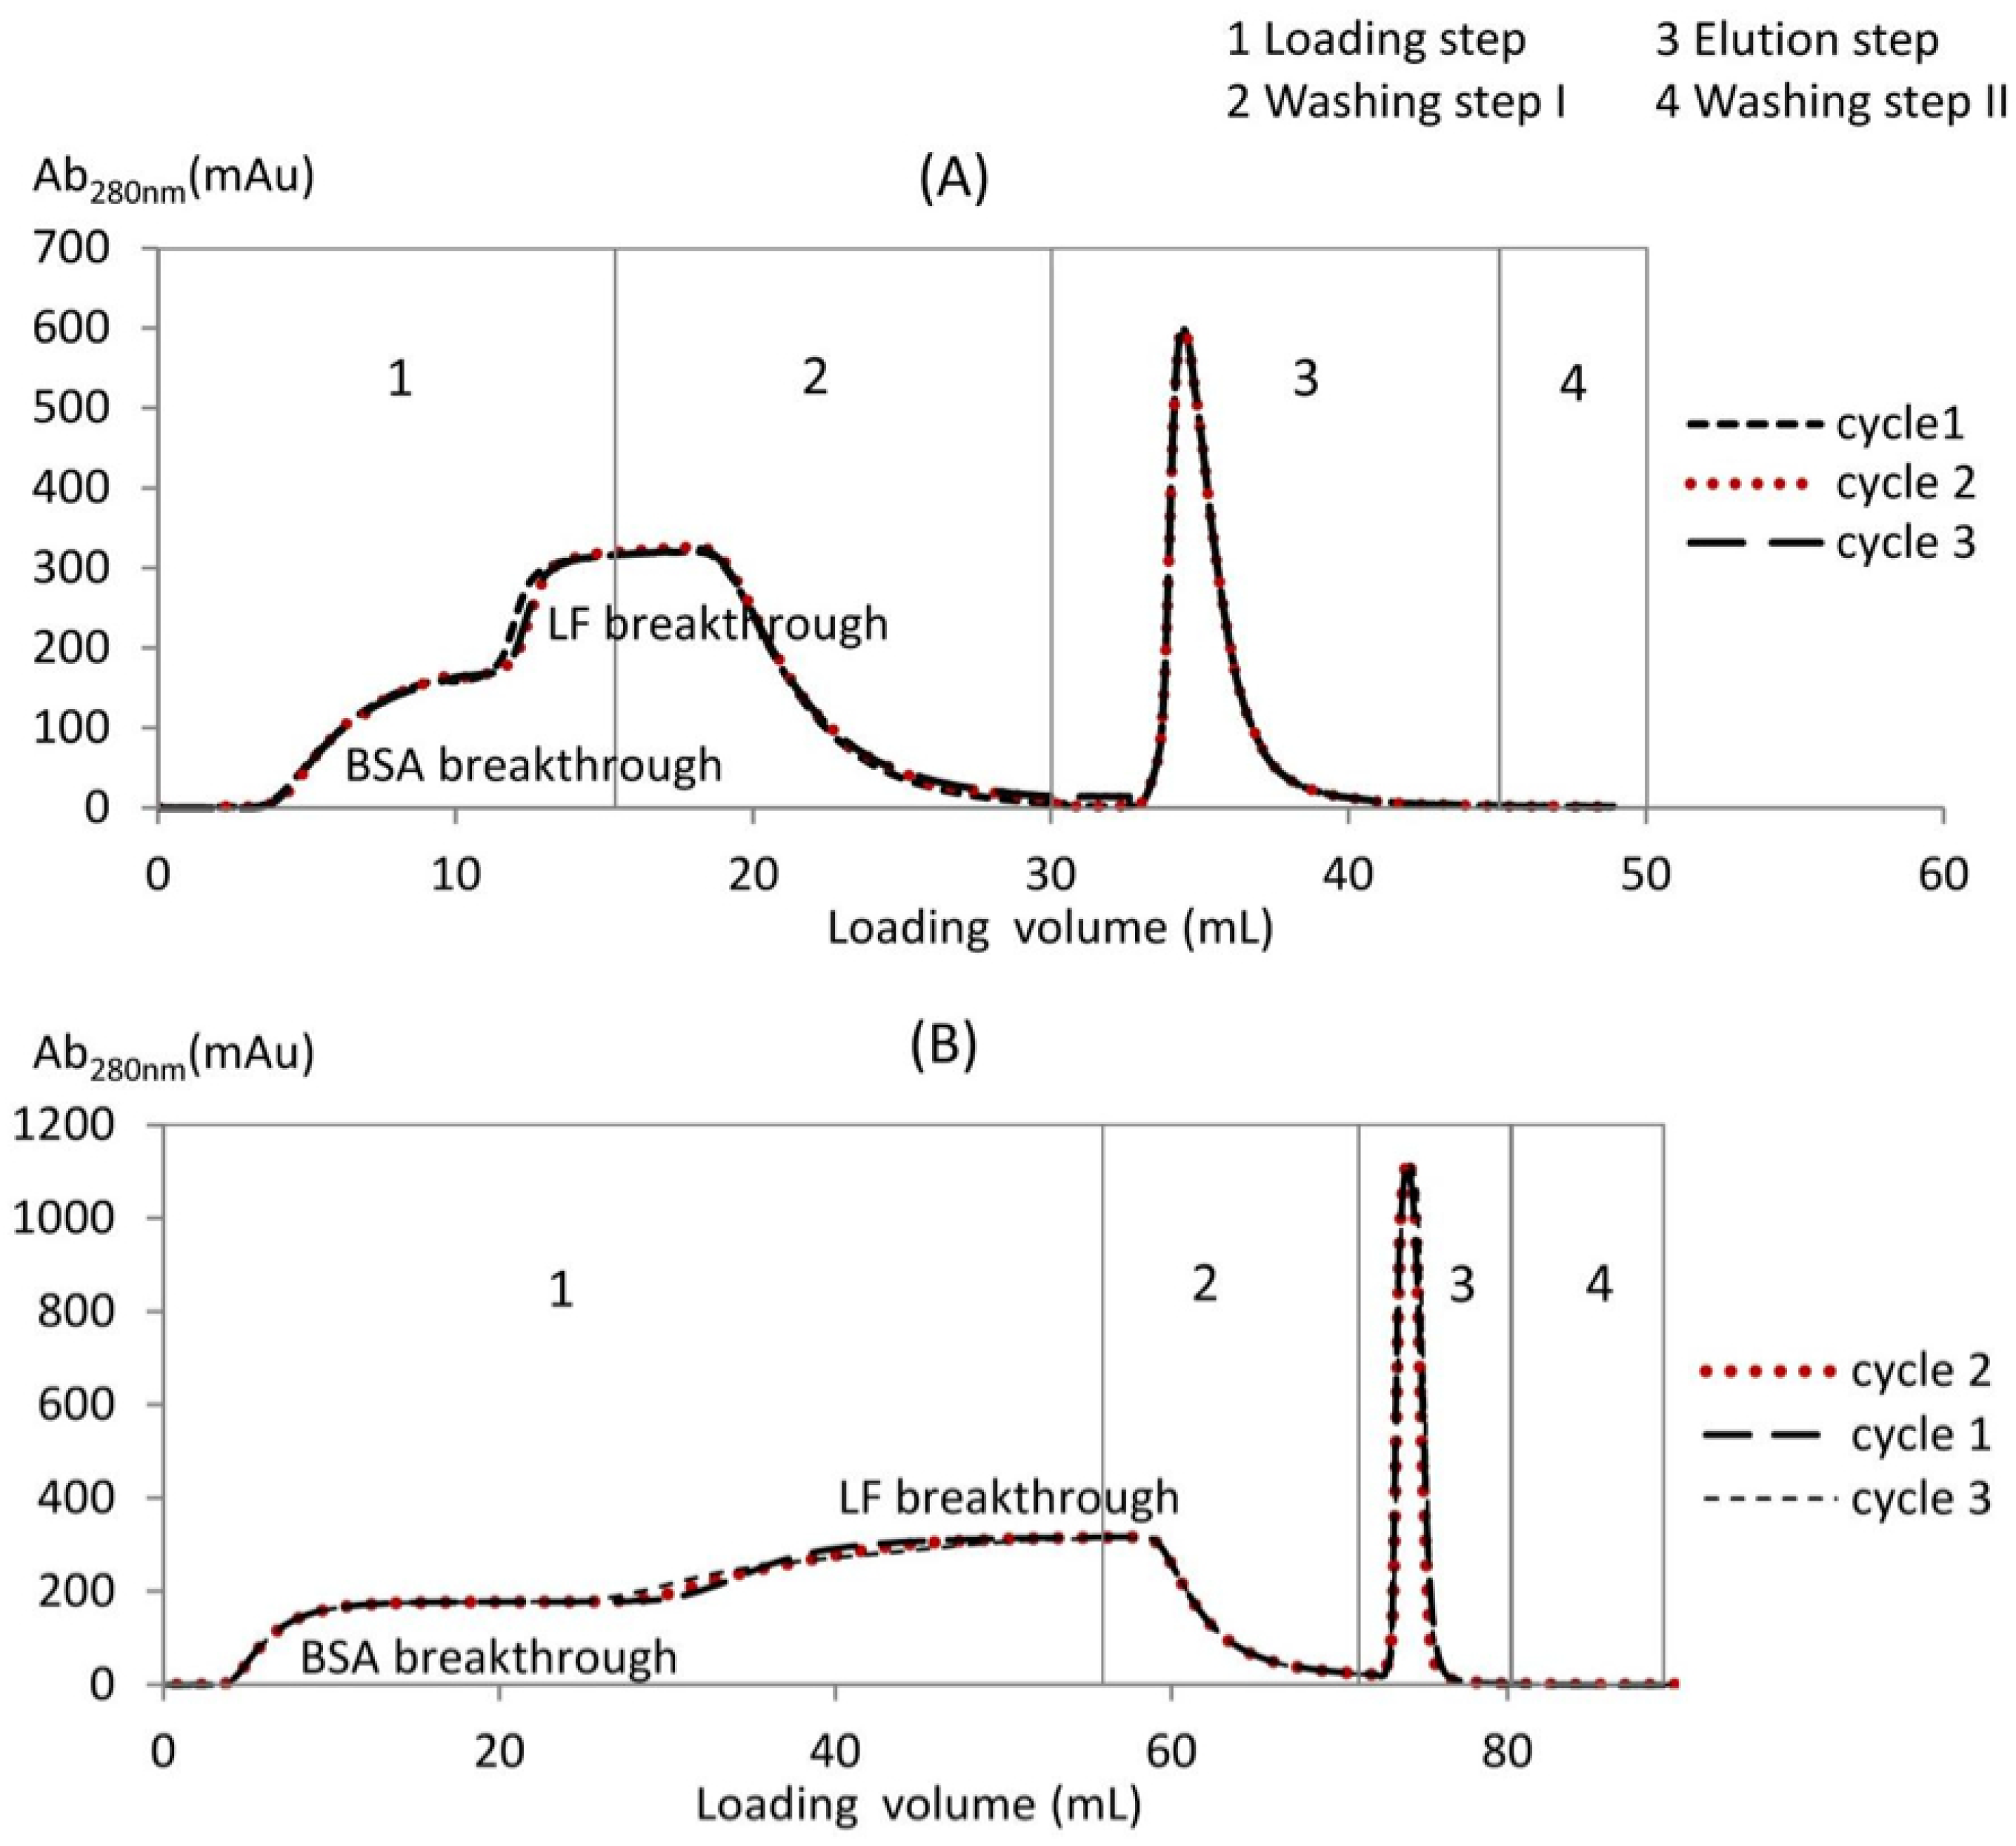
The BSA-LF separation cycles are shown in Figure 2A for the monolith and in Figure 2B for the membrane housed in the CIM column (H = 3 mm). The loading step was operated at a pH of 6.00, i.e., between the isoelectric point of BSA (4.7) and LF (8.7). At this pH, BSA possesses more negative charges than LF and thus flows in the effluent without binding, while LF is more positively charged and is thus bound to the cation exchanger membrane or monolith [31]. Two separate breakthrough curves were obtained during BSA-LF mixture separation at a pH of 6.00. At the beginning of the loading step, the breakthrough curve was BSA, whereas LF was fully retained on the membrane or monolith. We demonstrated previously that only LF was bound to the stationary phase and that BSA passed completely through the media without binding, using the RP-HPLC method [31]. In this study, the LF and BSA concentrations were measured in samples taken at various times during the loading step of the LF-BSA.
Afterward, the membrane or monolith reached saturation, and the LF breakthrough curve started. At the end of the loading step, washing was performed until the absorbance decreased to zero. Finally, the elution buffer with higher ionic strength was used to recover bound LF. The separation cycle was repeated for at least three cycles without any regeneration step for both the monolith and membrane. No major differences were observed between the three cycles, which indicates the good repeatability of the membranes and monoliths. However, regular cleaning and regeneration is strongly recommended to reduce the risk of fouling and contamination.
Furthermore, the BSA-LF separation was performed at different flow rates (12.0, 18.0 and 24.0 BV·min−1). For each flowrate, the binding capacity of LF was calculated at 10% breakthrough (DBC10%) and reported in Table 2. The highest DBC10% of LF per BV (about 42 mg·mL−1) was obtained using the membrane in the CIM housing (H = 3.00 mm), while the Sartobind S75 device gave lower LF DBC10% around 28 mg·mL−1. The lowest binding capacity was found using the monolith in the CIM housing with LF DBC10% around 24 mg·mL−1. In addition, there was no significant effect of the flow rate (between 18.0 and 24.0 BV·min−1) for all devices, as the LF DBC10% were almost identical at the different operating flow rates. This confirms the advantage of membrane and monolith chromatography, in which mass transport is mainly convective, and therefore, higher flow rates can be used without any loss in binding capacity. The increase in productivity is possible by increasing the operating flow rate with both membrane and monolith chromatography as usually reported (e.g. [2,21,23]).

3.2. BSA Non-Binding Breakthrough Curves

As mentioned earlier, BSA is not retained by the cation exchange membrane nor the monolith; therefore, it may be used as a tracer for non-binding experiments. Experimental BSA breakthrough curves are plotted as a function of loading volume (V) for the membrane and monolith with H = 3.00 mm in Figure 3. For both media, BSA breakthrough curves were similar until around 70% breakthrough. Afterward, the BSA breakthrough curve of the membrane was more dispersed, and 100% breakthrough was reached at a higher loading volume (15.12 mL), whereas a lower volume (10.52 mL) was required for the monolith. Using the Sartobind S75 device, the BSA breakthrough curve was significantly different from the one of the membrane in the CIM housing. Breakthrough happened later, due to the larger void volume inside the device, and the breakthrough curve was more dispersed.

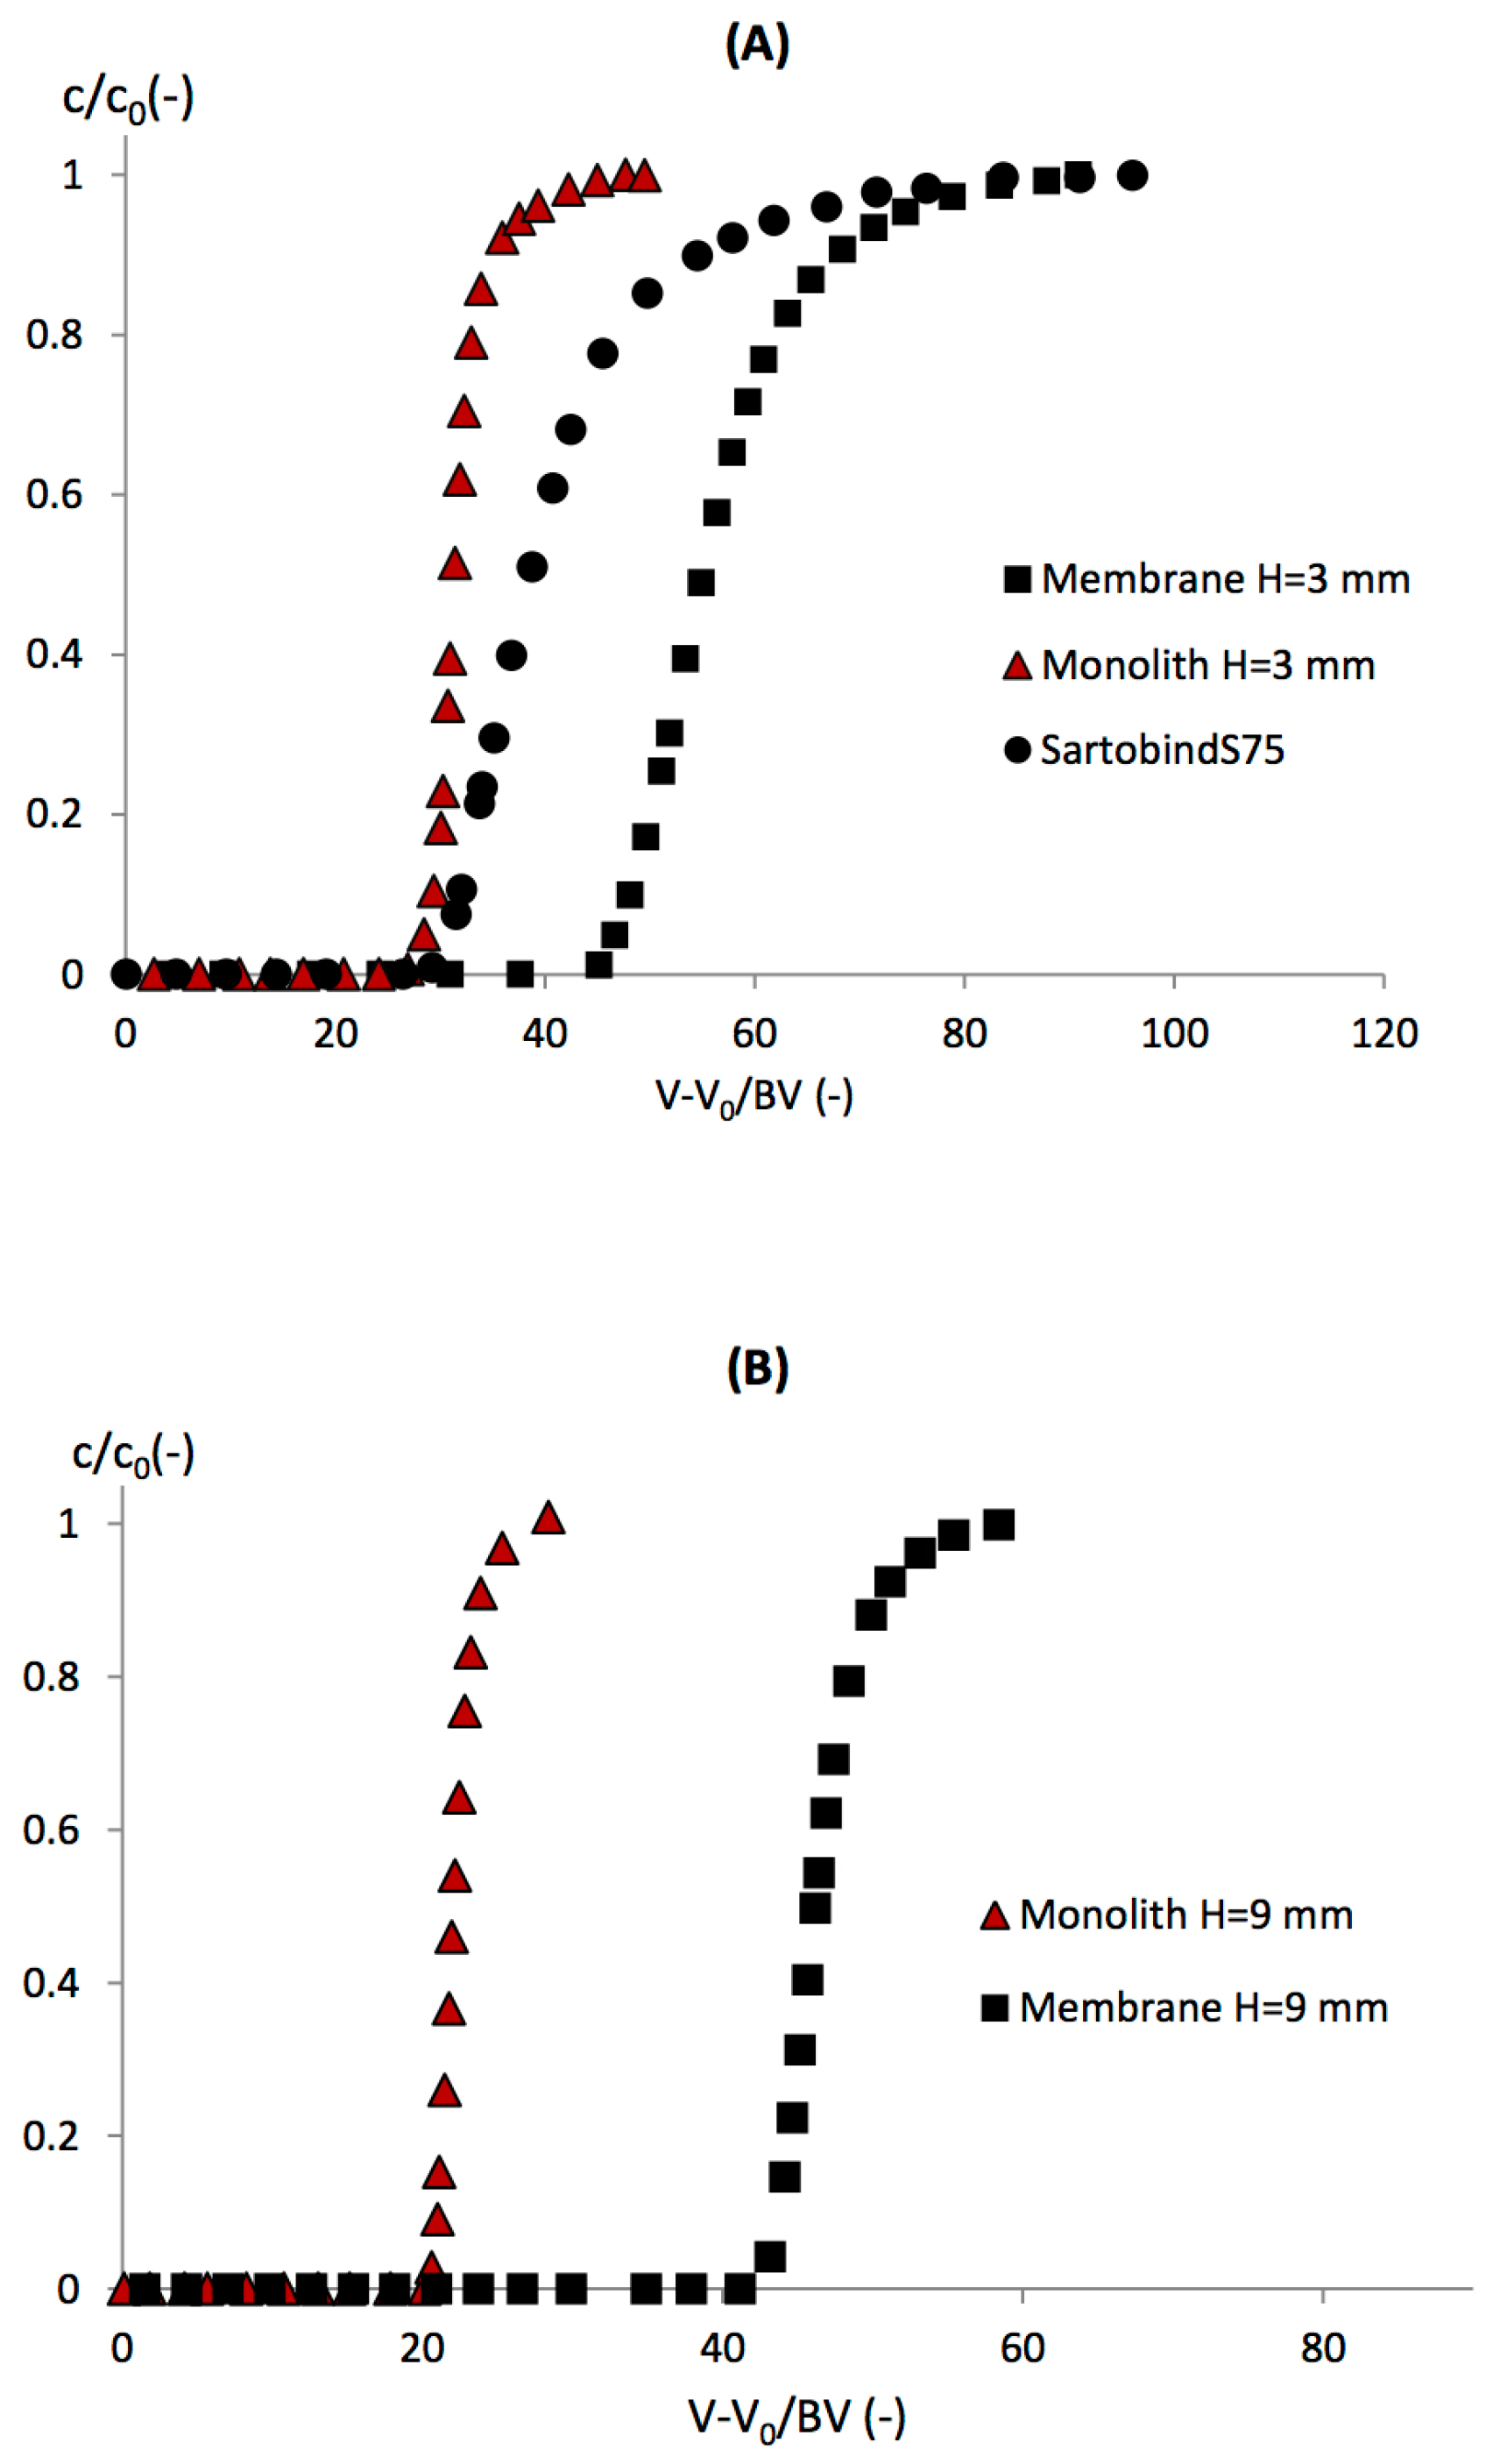
3.3. LF Binding Breakthrough Curves

As seen previously, BSA does not bind on the cation exchange membrane nor monolith because BSA possesses more negative charges than LF at pH 6; therefore, LF adsorbs preferentially. In Figure 4A, LF breakthrough curves were plotted against the loading volume corrected by void volume (V0) and divided by BV, for the membrane and monolith with H = 3.00 mm in the CIM housing and the Sartobind device. The same parameters were used during the loading steps: flow rate of 12.0 BV·min−1 and initial BSA-LF ratio of 2/1. The data for breakthrough at 10%, DBC10%, are reported in Table 2.
For the monolith, the breakthrough curve appeared early due to its lower LF binding capacity (24.74 ± 0.43 mg·mL−1). The breakthrough curve was very sharp and rapidly reached 100% breakthrough, which indicates very efficient mass transfer and homogeneous flow distribution. For the membrane housed in the CIM housing, the LF breakthrough curve happened later, and DBC10% was higher (43.80 ± 0.81 mg·mL−1). A more dispersed breakthrough curve was observed due to the tailing effect near 100% breakthrough. This suggests slower mass transfer near the saturation of the membrane.
Van Beijeren et al. [32] highlighted that the presence of a grafted polymer layer in the ion exchange Sartobind membranes, in which a high degree of multilayering takes place, reduces the accessibility of the binding sites and/or introduces a diffusive transport limitation. The amount of proteins that breakthrough at a certain point depends primarily on the amount of proteins already adsorbed, as the binding of proteins reduces the accessibility of the binding sites. This phenomena seems to occur to a lesser extent within the functionalized poly(glycidyl methacrylate-co-ethylene dimethacrylate) monolith, although such behavior has also been reported [33]. Another explanation from Orr et al. [8] was that non-uniform membrane porosity, membrane thickness and ligand grafting can lead to variable flow resistance and binding kinetics within the membrane matrix.
Using the Sartobind S75 device, the LF breakthrough occurred at a lower value of (VV0)/BV than was observed for the membrane in the CIM housing, and the dispersion and tailing effects were more significant. These results suggest again the major role played by the membrane module design on membrane binding capacity [13]. The optimized flow distribution in the CIM housing improved the performance of the membrane.

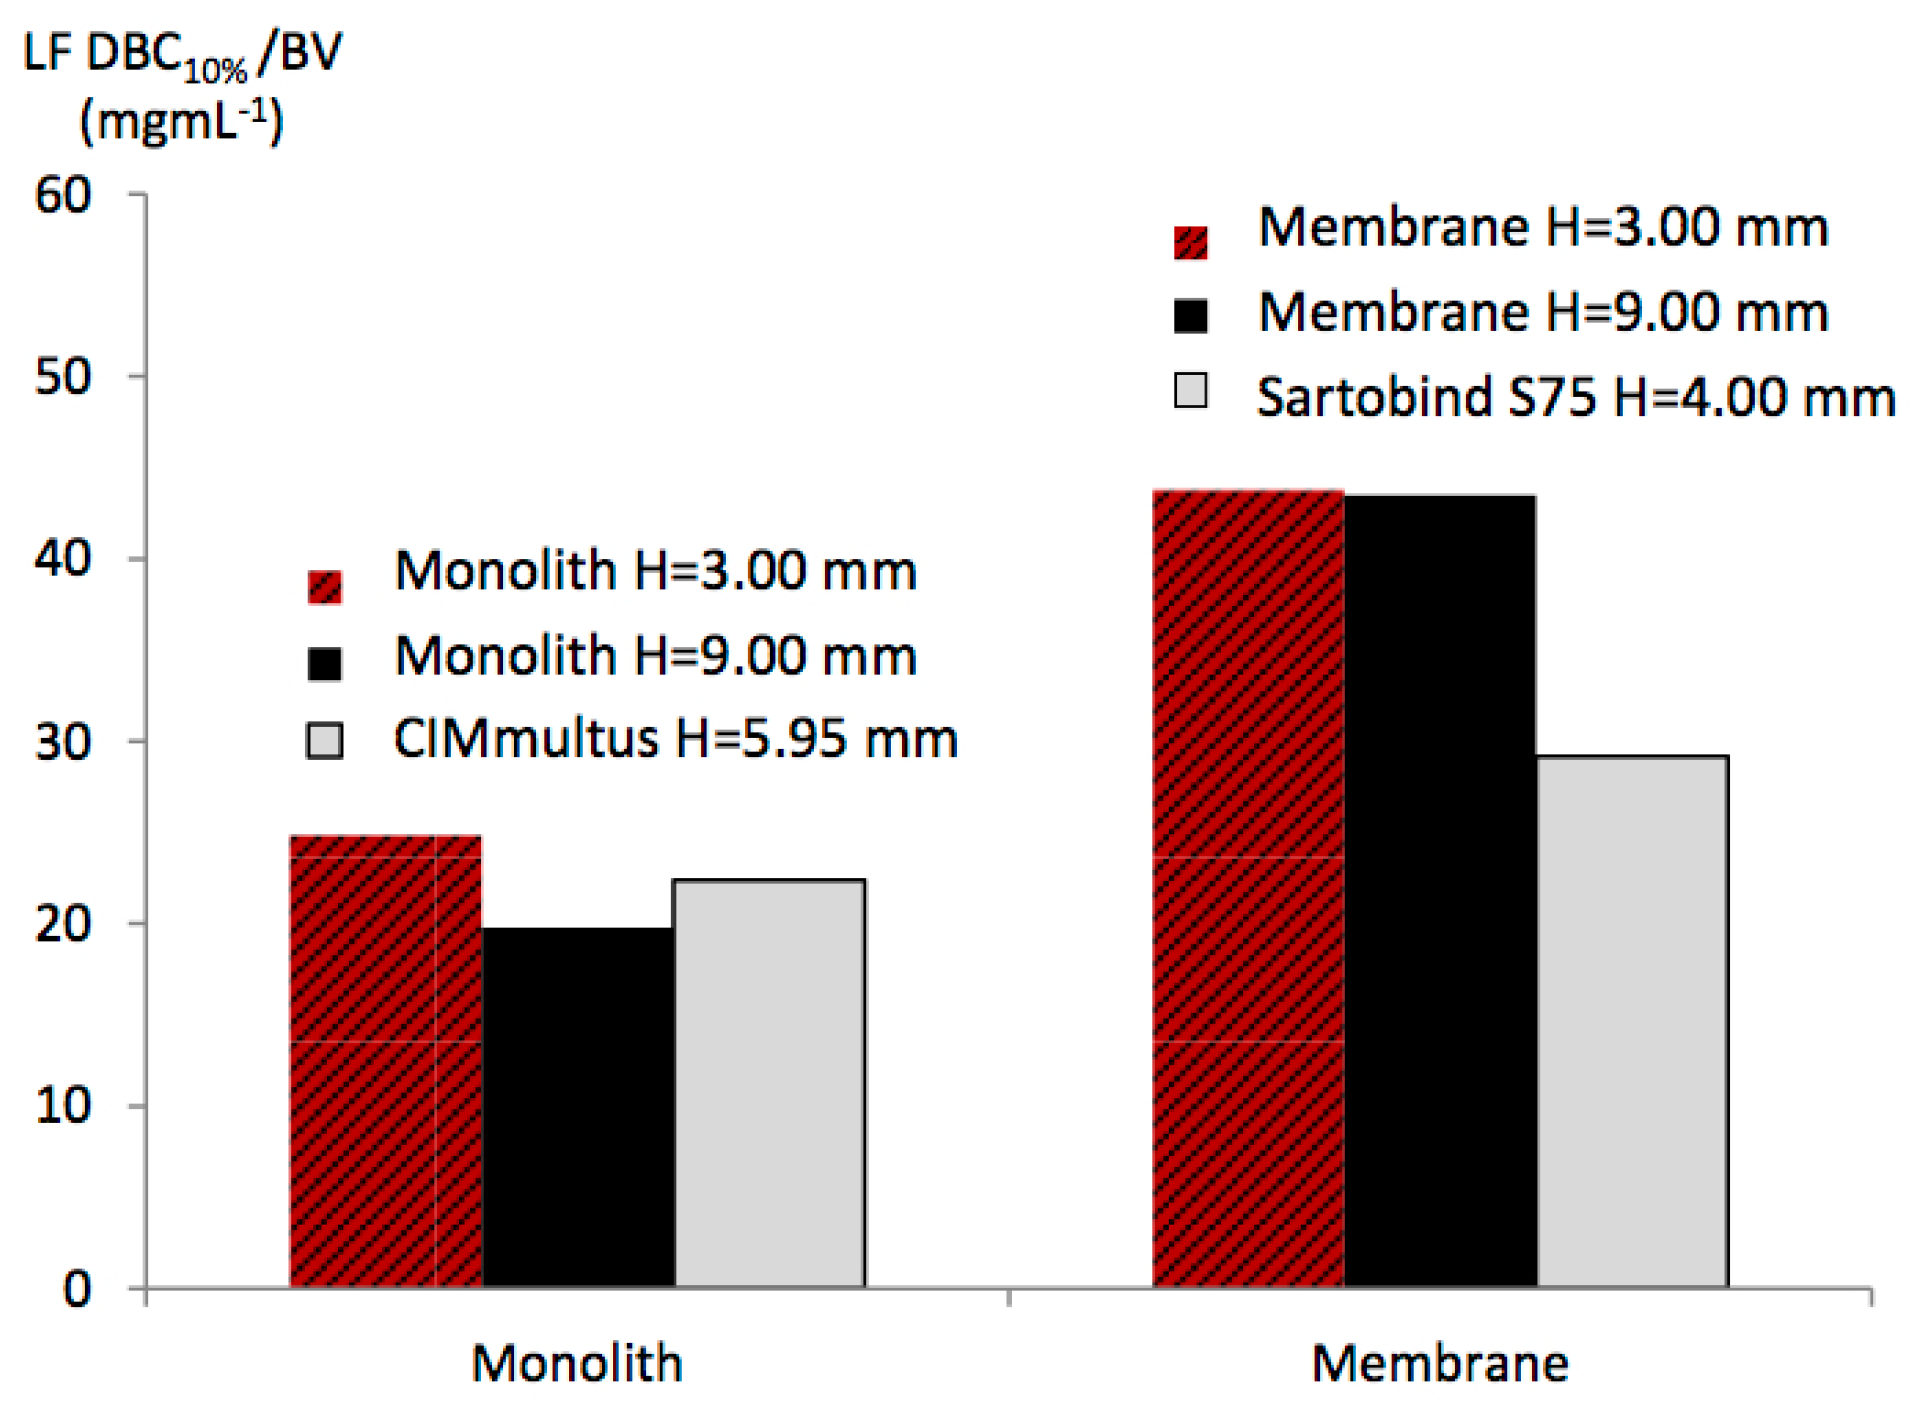
3.4. Effect of the Bed Height

The membrane and monolith in the CIM column with both H = 9 mm were first investigated at 12.00 BV·min−1 and a loading BSA-LF ratio of 2/1. However, using the monolith, this high flow rate could not be operated due to the over pressure on the Aktaprime-plus system (>1.10 MPa). Therefore, the flow rate was reduced to 0.4 BV·min−1. For both media, the LF DBC10% values were calculated from experimental breakthrough curves (Figure 4B) and compared to values from other devices in Figure 5.
By increasing the monolith bed height, a slight decrease in LF DBC10% was observed. The DBC10% per BV was 19.80 mg·mL−1 for the monolith with H = 9 mm, instead of 24 mg·mL−1 for H = 3 mm. The monolith radial flow device CIMmultus gave an intermediate LF binding capacity (around 22 mg·mL−1), which may be due in part to its intermediate bed height (5.95 mm). On the contrary, for the two membranes in the CIM housing (H = 3 mm and 9 mm), no effect of bed height was observed, with both binding capacities being around 43 mg·mL−1. In our previous study [30], by comparing Sartobind devices with increasing bed height, a decrease in binding capacity was obtained. When packed in the CIM column, this effect was not observed, which may suggest an improved flow distribution. This may be due to the absence of the O-ring between membrane sheets and, therefore, to the ability of the flow to pass at the peripheral region of the membrane discs.
The decrease in monolith binding capacity with increasing bed height may be explained by the non-uniform flow inside the CIM housing due to the diameter change between the frit and monolith section. Indeed, the highest monolith bed height (9 mm) may have larger regions with non-uniform flow, than the monolith with a bed height of 3 mm. These peripheral regions of the monolithic disc could be not easily reached by LF molecules. This effect could lead to the decrease in LF binding capacity with increasing bed height.
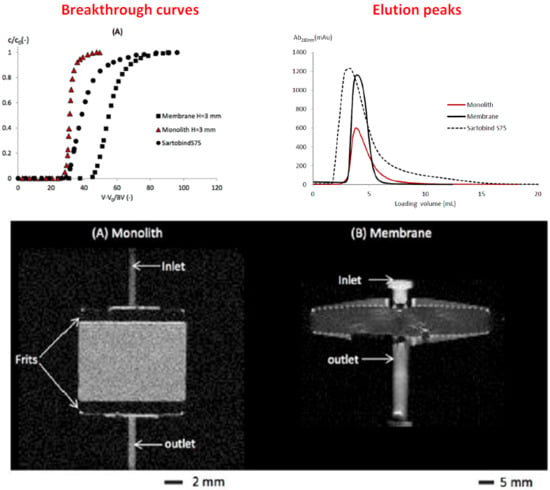
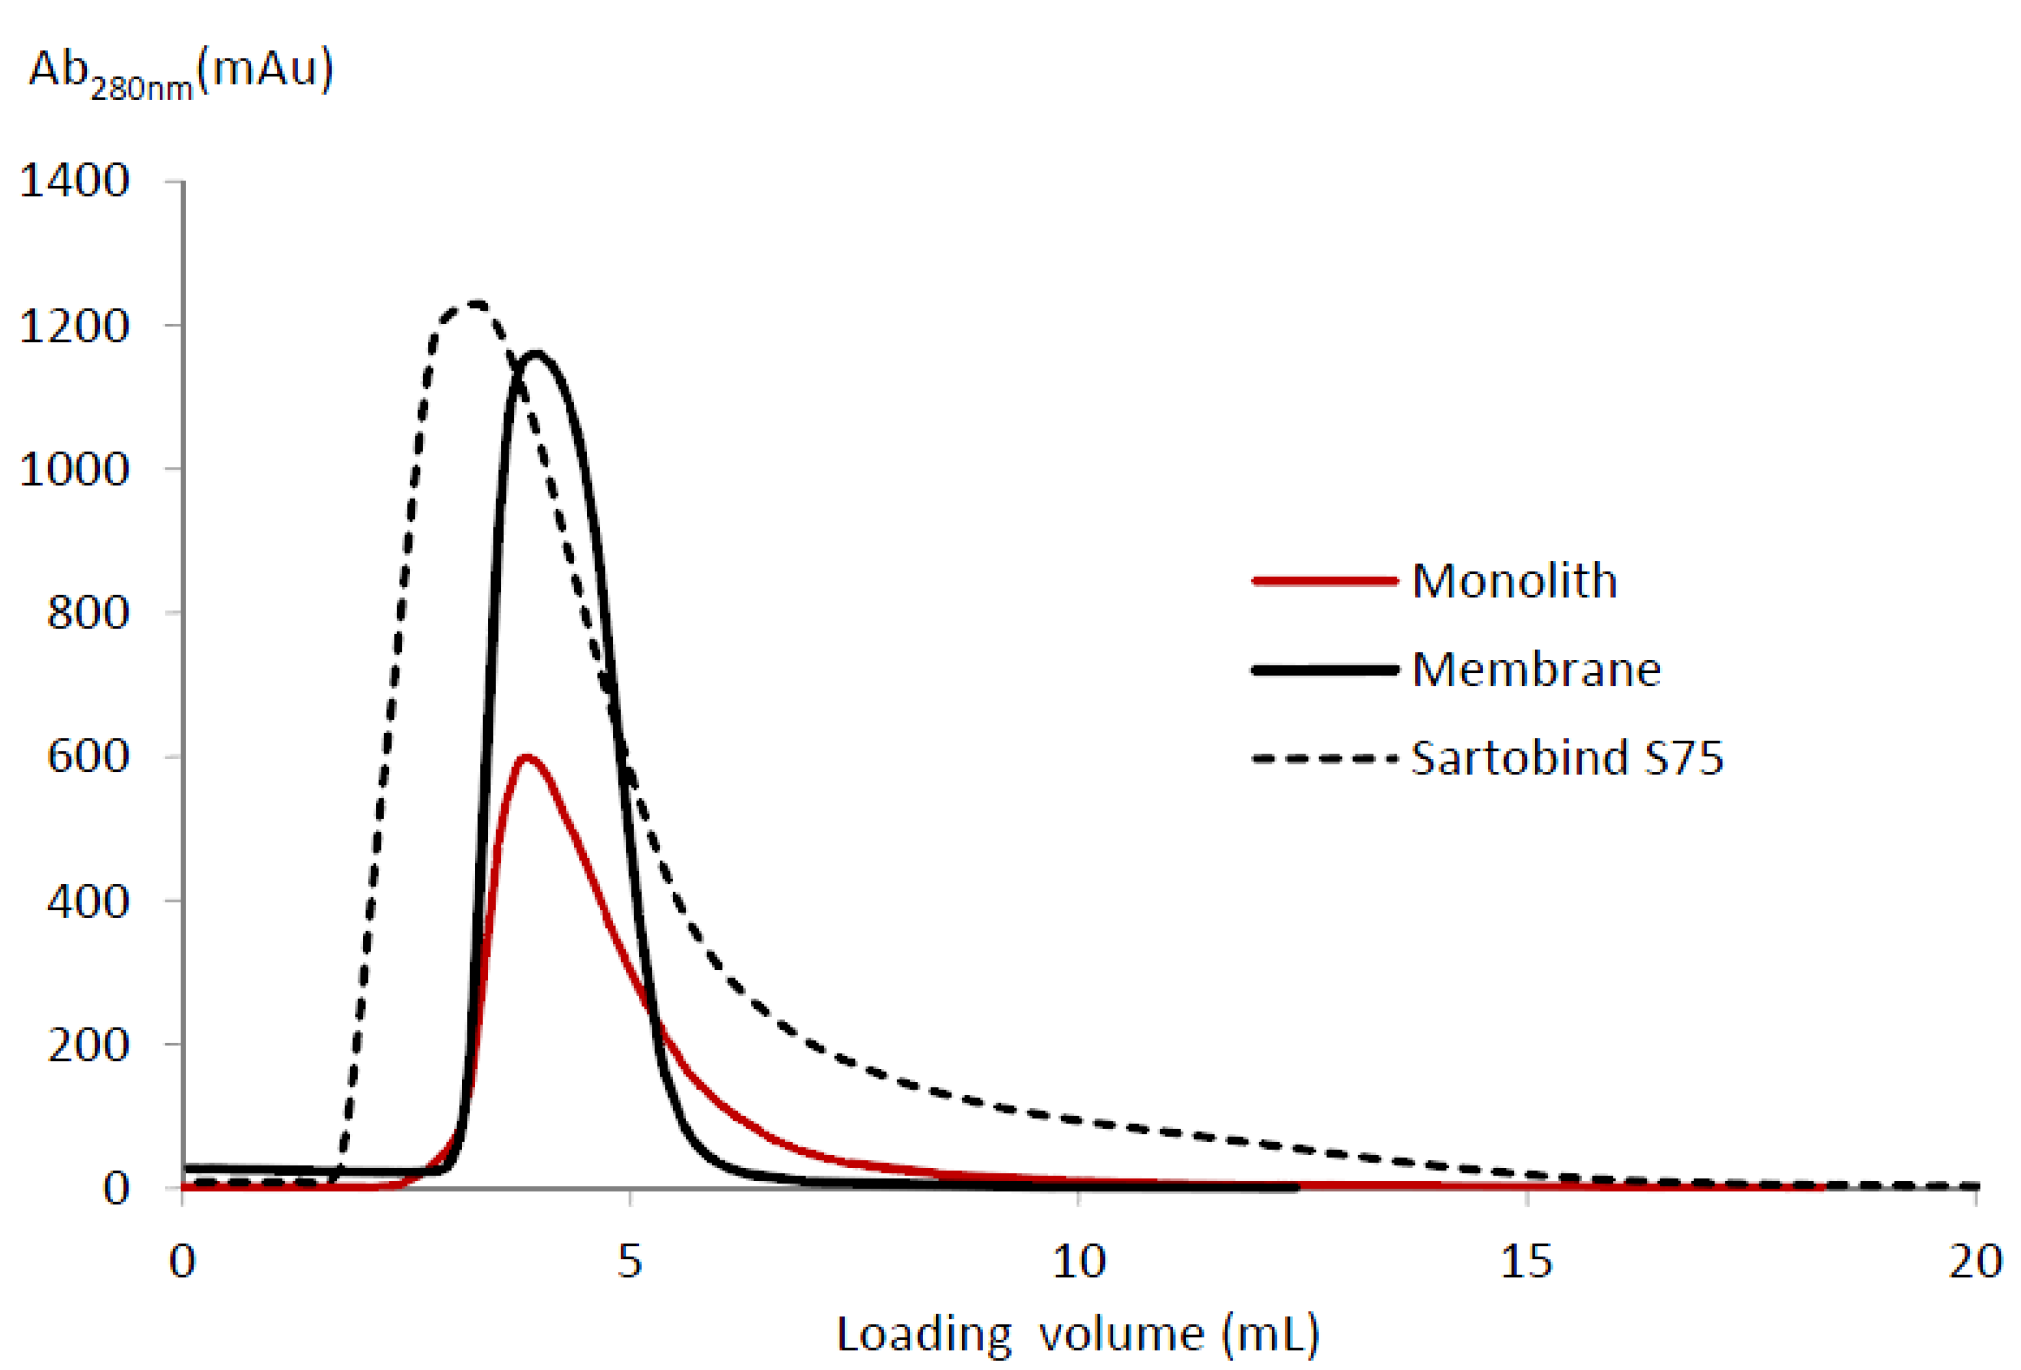
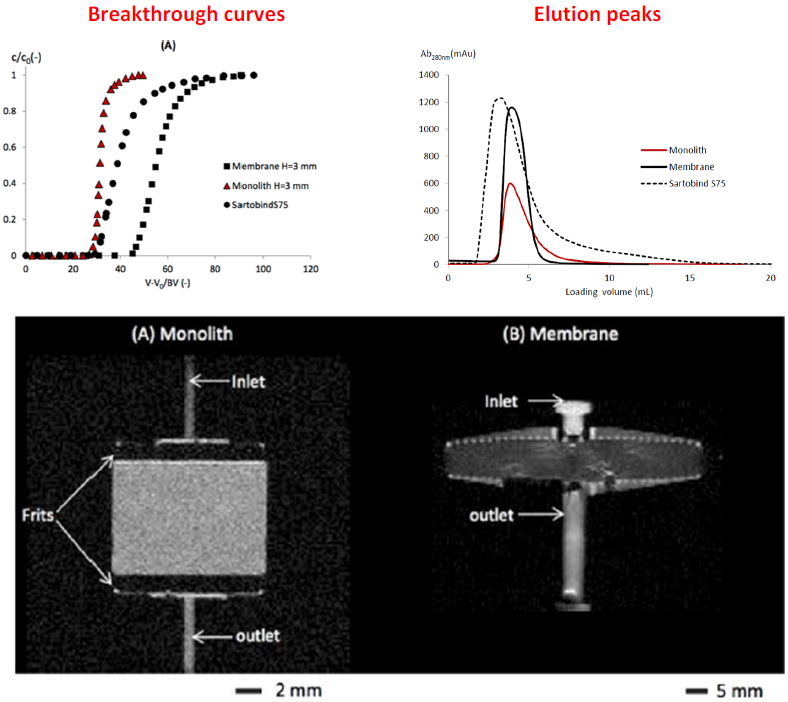
3.5. Elution Peaks

After loading a BSA/LF solution at the initial BSA-LF ratio of 2/1, the LF bound to the membrane or monolith was eluted using a phosphate buffer containing 2 M NaCl at a flow rate of 12 BV·min−1. Figure 6 shows the elution peaks for the Sartobind device, membrane and monolith with H = 3 mm in the CIM column. The eluted mass, peak width at half-height, asymmetric ratio and tailing factor obtained are given in Table 3. The asymmetry ratio was calculated at 10% of the peak height, whereas the tailing factor was measured at 5% of the peak height [13,34].
The highest LF eluted mass/BV (32.58 mg·mL−1) was obtained for the membrane in the CIM housing. In addition, the elution peak was then sharper and more symmetrical. The lower the values of the asymmetry ratio (2.10), tailing factor (1.73) and peak width at half-height (1.32) indicate that the flow distribution was significantly improved compared to the flow distribution in the Sartobind device and in the monolith. The Sartobind S75 device gave the lowest eluted mass (14.05 mg·mL−1), whereas a higher asymmetrical ratio and tailing factor were obtained, respectively 3.61 and 3.00. Using the monolith, the LF eluted mass was lower (19.33 mg·mL−1); the elution peak became more asymmetrical (asymmetric ratio of 3.37); and the tailing effect was also increased (tailing factor of 2.68). Finally, a larger peak width at half-height of 1.65 was obtained, which is also indicative of flow mal-distribution. Overall, the membranes in the CIM housing show the best flow distribution and, therefore, the best LF binding capacity during loading and LF recovery during elution.

4. Conclusions

In this paper, we compared the performance of monolith and membrane chromatography, which were based on convective mass transport, for the separation of two similarly-sized proteins, BSA and LF. The strong cation exchange membrane and monolith showed very good selectivity at pH = 6.00, as LF was bound onto the binding sites, whereas BSA passed in the effluent. For both the membrane and monolith, the separation cycles were repeated three times without cleaning and regeneration between each cycle. High productivities were obtained without any decrease in LF binding capacity.
The highest binding capacity of LF per support volume was obtained using the membrane housed in the CIM column, while the monolith and the commercialized Sartobind S75 device gave lower LF binding capacities, which may be due to less efficient mass transport and non-accessible regions within both devices. For the membrane, slow binding kinetics near saturation were observed. This tailing effect could be explained by steric interaction between already bound LF and available binding sites, which reduced their accessibility and thus binding kinetic; the non-uniform membrane pore size and ligand density are other possible causes.
The effect of bed height for the membrane and monolith in the CIM column was carried out by increasing the bed height to 9 mm instead of 3 mm. A lower LF binding capacity per support volume was measured for the monolith, while this negative effect was not observed with the membrane. Concerning LF elution, the membrane in the CIM housing gave a sharper and more symmetric elution peak compared to the one measured for the monolith and commercial membrane device.

Supplementary Materials

The following are available online at www.mdpi.com/2227-9717/4/3/31/s1, Supplementary data 1: Average operating pressures during the BSA-LF mixture loading step at flow rates of 12.0, 18.0 and 24.0 BV·min−1 using the monolith (H = 3 mm), membrane (H = 3 mm) in the CIM housing and Sartobind S75 device (H = 4 mm).

Acknowledgments

The authors would like to thank the Ministry of Science and Technology (MOST) of Thailand and Campus France with a doctoral scholarship for Chalore Teepakorn.

Author Contributions

This work was realized and the manuscript was written through contributions of all authors.

Conflicts of Interest

The authors declare no conflict of interest.

References

  1. Gebauer, K.H.; Thömmes, J.; Kula, M.-R. Plasma protein fractionation with advanced membrane adsorbents. Biotechnol. Bioeng. 1997, 54, 181–189. [Google Scholar] [CrossRef]
  2. Pabby, A.K.; Rizvi, S.S.H.; Requena, A.M.S. Handbook of Membrane Separations: Chemical, Pharmaceutical, Food, and Biotechnological Applications; CRC Press: Boca Raton, FL, USA, 2009. [Google Scholar]
  3. Ghosh, R. Protein separation using membrane chromatography: Opportunities and challenges. J. Chromatogr. A 2002, 952, 13–27. [Google Scholar] [CrossRef]
  4. Hunter, A.K.; Carta, G. Protein adsorption on novel acrylamido-based polymeric ion-exchangers: IV. Effects of protein size on adsorption capacity and rate. J. Chromatogr. A 2002, 971, 105–116. [Google Scholar] [CrossRef]
  5. Jungbauer, A.; Hahn, R. Polymethacrylate monoliths for preparative and industrial separation of biomolecular assemblies. J. Chromatogr. A 2008, 1184, 62–79. [Google Scholar] [CrossRef] [PubMed]
  6. Stickel, J.J.; Fotopoulos, A. Pressure-flow relationships for packed beds of compressible chromatography media at laboratory and production scale. Biotechnol. Prog. 2001, 17, 744–751. [Google Scholar] [CrossRef] [PubMed]
  7. Charcosset, C. Membrane Processes in Biotechnology and Pharmaceutics; Elsevier: Oxford, UK, 2012. [Google Scholar]
  8. Orr, V.; Zhong, L.; Moo-Young, M.; Chou, C.P. Recent advances in bioprocessing application of membrane chromatography. Biotechnol. Adv. 2013, 31, 450–465. [Google Scholar] [CrossRef] [PubMed]
  9. Thömmes, J.; Kula, M.-R. Membrane chromatography—An integrative concept in the downstream processing of proteins. Biotechnol. Prog. 1995, 11, 357–367. [Google Scholar] [CrossRef]
  10. Chang, C.-S.; Ni, H.-S.; Suen, S.-Y.; Tseng, W.-C.; Chiu, H.-C.; Chou, C.P. Preparation of inorganic-organic anion-exchange membranes and their application in plasmid DNA and RNA separation. J. Membr. Sci. 2008, 311, 336–348. [Google Scholar] [CrossRef]
  11. Huang, S.; Roy, S.; Hou, K.; Tsao, G. Scaling-up of affinity-chromatography by radial-flow cartridges. Biotechnol. Prog. 1988, 4, 159–165. [Google Scholar] [CrossRef]
  12. Orr, V.; Scharer, J.; Moo-Young, M.; Honeyman, C.H.; Fenner, D.; Crossley, L.; Suen, S.-Y.; Chou, C.P. Simultaneous clarification of Escherichia coli culture and purification of extracellularly produced penicillin G acylase using tangential flow filtration and anion-exchange membrane chromatography (TFF-AEMC). J. Chromatogr. B 2012, 900, 71–78. [Google Scholar] [CrossRef] [PubMed]
  13. Madadkar, P.; Wu, Q.; Ghosh, R. A laterally-fed membrane chromatography module. J. Membr. Sci. 2015, 487, 173–179. [Google Scholar] [CrossRef]
  14. Josic, D.; Buchacher, A.; Jungbauer, A. Monoliths as stationary phases for separation of proteins and polynucleotides and enzymatic conversion. J. Chromatogr. B: Biomed. Sci. Appl. 2001, 752, 191–205. [Google Scholar] [CrossRef]
  15. Strancar, A.; Podgornik, A.; Barut, M.; Necina, R. Short Monolithic Columns as Stationary Phases for Biochromatography; Freitag, P.D.R., Ed.; Modern Advances in Chromatography; Springer: Heidelberg, Germany, 2002; pp. 49–85. Availiable online: http://link.springer.com/chapter/10.1007/3-540-45345-8_2 (accessed on 2 October 2013).
  16. Svec, F.; Fréchet, J.M.J. Modified poly(glycidyl metharylate-co-ethylene dimethacrylate) continuous rod columns for preparative-scale ion-exchange chromatography of proteins. J. Chromatogr. A 1995, 702, 89–95. [Google Scholar] [CrossRef]
  17. Jungbauer, A.; Hahn, R. Monoliths for fast bioseparation and bioconversion and their applications in biotechnology. J. Sep. Sci. 2004, 27, 767–778. [Google Scholar] [CrossRef] [PubMed]
  18. Gagnon, P. Technology trends in antibody purification. J. Chromatogr. A 2012, 1221, 57–70. [Google Scholar] [CrossRef] [PubMed]
  19. Gagnon, P.; Richieri, R.; Zaidi, S. A comparison of microparticulate, membrane, and monolithic anion exchangers for polishing applications in the purification of monoclonal antibodies. In Proceedings of the IBC International Conference and Exposition, Boston, MA, USA, 1–4 October 2007.
  20. Cramer, S.M.; Holstein, M.A. Downstream bioprocessing: Recent advances and future promise. Curr. Opin. Chem. Eng. 2011, 1, 27–37. [Google Scholar] [CrossRef]
  21. Hormann, K.; Müllner, T.; Bruns, S.; Höltzel, A.; Tallarek, U. Morphology and separation efficiency of a new generation of analytical silica monoliths. J. Chromatogr. A 2012, 1222, 46–58. [Google Scholar] [CrossRef] [PubMed]
  22. Podgornik, A.; Barut, M.; Strancar, A.; Josić, D.; Koloini, T. Construction of large-volume monolithic columns. Anal. Chem. 2000, 72, 5693–5699. [Google Scholar] [CrossRef] [PubMed]
  23. Podgornik, A.; Strancar, A. Convective Interaction Media (CIM)—Short layer monolithic chromatographic stationary phases. Biotechnol. Annu. Rev. 2005, 11, 281–333. [Google Scholar] [CrossRef] [PubMed]
  24. Podgornik, A.; Jancar, J.; Merhar, M.; Kozamernik, S.; Glover, D.; Cucek, K.; Barut, M.; Strancar, A. Large-scale methacrylate monolithic columns: Design and properties. J. Biochem. Biophys. Methods 2004, 60, 179–189. [Google Scholar] [CrossRef] [PubMed]
  25. Chiu, C.K.; Etzel, M.R. Fractionation of lactoperoxidase and lactoferrin from bovine whey using a cation exchange membrane. J. Food Sci. 1997, 62, 996–1000. [Google Scholar] [CrossRef]
  26. Valiño, V.; San Román, M.F.; Ibañez, R.; Ortiz, I. Improved separation of bovine serum albumin and lactoferrin mixtures using charged ultrafiltration membranes. Sep. Purif. Technol. 2014, 125, 163–169. [Google Scholar] [CrossRef]
  27. Mihelič, I.; Podgornik, A.; Koloini, T. Temperature influence on the dynamic binding capacity of a monolithic ion-exchange column. J. Chromatogr. A 2003, 7, 159–168. [Google Scholar] [CrossRef]
  28. Tatárová, I.; Fáber, R.; Denoyel, R.; Polakovic, M. Characterization of pore structure of a strong anion-exchange membrane adsorbent under different buffer and salt concentration conditions. J. Chromatogr. A 2009, 1216, 941–947. [Google Scholar] [CrossRef] [PubMed]
  29. Ghosh, P.; Vahedipour, K.; Lin, M.; Vogel, J.H.; Haynes, C.; von Lieres, E. Computational fluid dynamic simulation of axial and radial flow membrane chromatography: Mechanisms of non-ideality and validation of the zonal rate model. J. Chromatogr. A 2013, 1305, 114–122. [Google Scholar] [CrossRef] [PubMed]
  30. Teepakorn, C.; Fiaty, K.; Charcosset, C. Effect of geometry and scale for axial and radial flow membrane chromatography—Experimental study of bovin serum albumin adsorption. J. Chromatogr. A 2015, 1403, 45–53. [Google Scholar] [CrossRef] [PubMed]
  31. Teepakorn, C.; Fiaty, K.; Charcosset, C. Optimization of lactoferrin and bovine serum albumin separation using ion-exchange membrane chromatography. Sep. Purif. Technol. 2015, 151, 292–302. [Google Scholar] [CrossRef]
  32. Van Beijeren, P.; Kreis, P.; Zeiner, T. Ion exchange membrane adsorption of bovine serum albumin—Impact of operating and buffer conditions on breakthrough curves. J. Membr. Sci. 2012, 415–416, 568–576. [Google Scholar] [CrossRef]
  33. Hahn, R.; Tscheliessnig, A.; Bauerhansl, P.; Jungbauer, A. Dispersion effects in preparative polymethacrylate monoliths operated in radial-flow columns. J. Biochem. Biophys. Methods 2007, 70, 87–94. [Google Scholar] [CrossRef] [PubMed]
  34. Moldoveanu, S.C.; David, V. Essentials in Modern HPLC Separations, 1st ed.; Elsevier: Oxford, UK, 2012; Availiable online: http://store.elsevier.com/Essentials-in-Modern-HPLC-Separations/Serban-Moldoveanu/isbn-9780123850133/ (accessed on 17 September 2015).
Figure 1. Visualization by MRI of the chromatographic devices: (A) CIM housing containing 3 discs of monolith (H = 9.0 mm), (B) Sartobind S75 device containing 15 membranes (H = 4.0 mm).
Processes 04 00031 g001
Figure 2. Three repeated cycles of BSA-LF mixture separation using for loading 100 mM phosphate buffer at pH 6.0 at a BSA-LF initial ratio of 2/1 and a flow rate of 12 bed volume BV·min−1 for (A) monolithic disc H = 3 mm and (B) membrane stack H = 3 mm in the CIM housing.
Processes 04 00031 g002
Figure 3. Comparison between experimental non-binding breakthrough curves of BSA obtained with the membrane (H = 3 mm), monolith (H = 3 mm) in the CIM housing and the Sartobind S75 device. The experimental breakthrough curves were obtained using 100 mM phosphate buffer pH 6.0 at the BSA/LF initial concentration of 2/1 and a flow rate of 12.0 BV·min−1.
Processes 04 00031 g003
Figure 4. Simulated and experimental LF binding breakthrough curves for (A) the membrane, the monolith with H = 3 mm in the CIM housing and the Sartobind S75 device, and (B) the membrane and the monolith with H = 9 mm. The experimental data were obtained using 100 mM phosphate buffer pH 6.0 at a BSA/LF initial concentrations of 2/1 and a flow rate of 12.0 BV·min−1, except for the monolith with H = 9 mm, for which the flow rate was 0.40 BV·min−1.
Processes 04 00031 g004
Figure 5. Comparison of LF DBC10% per BV for the different chromatographic monoliths and membranes. The experiments were performed using 100 mM phosphate buffer at pH 6.0 at the initial BSA/LF ratio of 2/1. The operating flow rate was 12 BV·min−1, except for the monolith H = 9 mm, which was 0.4 BV·min−1.
Processes 04 00031 g005
Figure 6. LF elution peaks using for elution 2 M NaCl in phosphate buffer for the membrane, monolith with H = 3 mm in the CIM housing and the Sartobind S75 device at a flow rate of 12.0 BV·min−1.
Processes 04 00031 g006
Table 1. Characteristics of the different devices of strong cation exchange chromatography.
Ion exchange chromatography deviceMembrane H = 3.0 mmMembrane H = 9.0 mmSartobind S75Monolith H = 3.0 mmMonolith H = 9.0 mmCIMmultus
Support matrixStabilized reinforced cellulosePoly(glycidyl methacrylate-co-ethylene dimethacrylate)
Average pore diameter (μm)3.0–5.01.35 (CIM disc)2.1 (CIMmultus)
Porosity0.78 [28]0.60 (CIM disc) [27]
Permeability (m2)10−13 [29]1.11 × 10⁻¹⁴ [27]
Functionalized groupSulfonic acidSulfonyl group
HousingCIM housingCIM housingAlready packedCIM housingCIM housingAlready packed
Bed height H (mm)3.009.004.003.009.005.95
Diameter Dm (mm)16.0016.0025.0012.00 (16.0 with the fitting ring)12.00 (16.0 with the fitting ring)Outer: 18.60 mm
Inner: 6.70 mm
Tube length: 4.20 mm
Number of discs11331513-
Bed volume BV (mL)0.61.82.10.341.021
Table 2. Dynamic binding capacity of LF at 10% breakthrough (DBC10%) of LF per BV using membrane and monolith supports at a BSA-LF loading ratio of 2/1 diluted in 100 mM phosphate buffer at pH 6.0 and the flow rates of 12.0, 18.0 and 24.0 BV·min−1.
Flow rate (BV·min−1)12.018.024.0
LF DBC10% per BV of chromatographic support (mg·mL−1)Monolith H = 3.0 mm24.74 ± 0.4324.50 ± 0.0224.29 ± 0.25
Membrane H = 3.0 mm43.80 ± 0.8142.25 ± 2.1241.84 ± 2.25
Sartobind S7529.15 ± 0.3827.44 ± 0.1428.89 ± 0.47
Table 3. LF characteristics of elution peaks using the membrane and monolith. LF loading using 2 M NaCl in phosphate buffer solution at 12.0 BV·min−1.
Elution PropertiesMonolith H = 3.00 mmMembrane H = 3.00 mmSartobind S75
LF eluted mass/BV (mg·mL−1)19.3332.5814.05
Asymmetry ratio3.372.103.61
Tailing factor2.681.733.00
Peak width at half-height (mL)1.651.322.64

