1. Introduction
As the world population is increasing rapidly and is expected to reach up to 9.1 billion people by the end of 2050 [
1], there are even greater concerns about the future global food demand and the sustainable agricultural practices that should be widely implemented. The latter issue has been actually raised by the ineffective use of land resources and the burdened environmental profile of current fertilizer production. More precisely, the carbon dioxide emissions generated from the ammonia production accounts for approximately 42% [
2] of the total industrial process emissions, whereas, due to its high energy requirements, it has been classified as one of the most energy intensive chemical processes [
3]. As ammonia is also used as a raw material for the synthesis of nitric acid, this encumbers practically the ecological profile of all nitrogen fertilizers. Based on these facts, it is clear that the existing fertilizer production techniques need to incorporate breakthrough technologies that will have a positive environmental and societal footprint.
According to the Food and Agricultural Organization of the United Nations (FAO), the greatest contribution to this aforementioned population growth will be mainly attributed to the developing countries. Africa, specifically, will be one of the major role players in this trend with an expected share of 46% [
4]. In addition, the country is also immensely dependent on fertilizer imports due to the high variability in the soil fertility conditions and the high domestic fertilizer prices [
5]. Given these facts, there is an imperative need for adopting and implementing an intensified fertilizer production practice that will ensure a sustainable fulfillment of the majority of the African countries’ domestic needs.
New routes towards the production of “green” fertilizers have been opened by the application of plasma technology and the utilization of atmospheric air. Experimental research studies have demonstrated promising results in the synthesis of nitric oxide, which, in turn, can be converted to nitric acid from air or pure N
2/O
2 mixture by means of non-thermal plasma in different reactor configurations [
6,
7,
8]. Efforts towards the decentralized commercialization of the plasma technology for synthesizing nitric acid have been recently initiated. A first approach to the conceptualization of the plasma-assisted nitrogen fixation at a small industrial scale has been made by Anastasopoulou et al., where important energy considerations—the integration of renewable energy sources, the power supply system of the plasma reactors and the energy efficiency of the downstream activities—have been presented as a part of the methodology followed in the MAPSYN (Microwave, Ultrasonic and Plasma assisted Syntheses) project [
9]. Ingels and Graves have proposed a system, employing a non-thermal air plasma reactor and powered by renewable electricity, for the synthesis of nitric acid [
10]. The given process has been suggested for agricultural applications and, more precisely, for the enhancement of the nitrogen content in organic fertilizers. Additionally, Evonik Industries (Essen, Germany) have promoted the idea of utilizing wind energy for powering a modular plasma-assisted plant for producing nitrogen dioxide (NO
2) that could readily be converted to fertilizer [
11]. VIVEX Engineering Ltd. (Gateshead, UK), a supplier of cold plasma technology, and Rishabh Metals & Chemicals Pvt. Ltd. (Mumbai, India), a company with a diversified production portfolio, have designed a portable fertilizer plant based on the plasma-assisted nitric acid synthesis, which claims to achieve a HNO
3 concentration of 25% to 60% and consume 20% less energy as the other processes [
12]. Although the latter references exhibit a strong industrial potentiality of the non-thermal plasma technique for the production of nitric acid, they lack in providing a detailed process design that can facilitate the respective environmental and economic assessment of the plasma-assisted nitric acid process against the conventional production route.
Considering the aforementioned knowledge gap, a comprehensive process design for a small-scale plasma-assisted nitric acid plant of 10 Tons Per Day (TPD) incorporating renewable energy sources has been proposed and environmentally assessed against the conventional production pathway [
13]. The outcomes of the given study have revealed a better environmental profile for the plasma-aided process under certain process design considerations, such as the recycling of the tail gas stream and 6% nitric oxide yield. More specifically, under these operating conditions, it has been shown that the plasma process can achieve a Global Warming Potential 19% lower than the conventional nitric acid synthesis. Taking into account such an improved environmental footprint, as well as the inherent flexibility of small-scale plants with respect to the required product specifications, deploying this novel technology in the context of a decentralized fertilizer production to African countries is likely to tackle the contemporary challenges of their agriculture in a sustainable manner. In addition to that, the capitalization potential of Africa’s renewable energy resources will also facilitate remarkably the effort towards the use of “green” energy.
In this research work, a feasibility assessment of renewable electricity supply for the proposed small-scale plasma-assisted nitric acid plant in the countries of Kenya and South Africa has been conducted and evaluated on both technical and economic bases. The reason behind the selection of the particular locations lies in the fact that South Africa and Kenya constitute the fifth and seventh biggest countries in population in Africa with high fertilizer consumption—approximately 58 and 30 kg per ha of arable land [
14,
15], respectively—and high potential in renewable energy utilization. Considering countries of such profiles is likely to provide important insights in the application of the studied chemical process to other countries of Africa as well. In this study, two process design scenarios are examined against three different renewable power systems for the cases of Kenya and South Africa. The selected power systems have been modeled in HOMER software (HOMER Pro, National Renewable Energy Laboratory, Boulder, CO, USA) and optimized configurations have been proposed based on cost-effectiveness criteria.
2. Methodology-Approach
In the following sections, the steps followed in the simulations carried out in HOMER software are provided along with the input data and assumptions that have been employed.
2.1. Case Study Description
Based on the proposed process design for the plasma-assisted nitric acid production of 10 TPD [
13], two scenarios have been considered with respect to the operating conditions: scenario A, which refers to the well-performing case of 6% NO yield and 7.77 kWh/kg NO power consumption, and scenario B, which refers to the updated experimental results of 1% NO yield and power consumption of 23 kWh/kg NO. In both scenarios, the operating temperature of the stoichiometric reactor resembling the plasma reactor has been set to 130 °C so as to facilitate the recycling of the expanded tail gas stream from 350 °C and 6 bar to atmospheric pressure back to the reactor.
The renewable energy feasibility study for the selected industrial process has been conducted in the HOMER software, which enables the simulation and optimization of different microgrid systems comprising renewables and/or conventional power sources based on economic criteria. The particular software has been used in many similar research studies and has provided great insights in the techno-economic performance of the proposed electricity generation systems [
16,
17,
18,
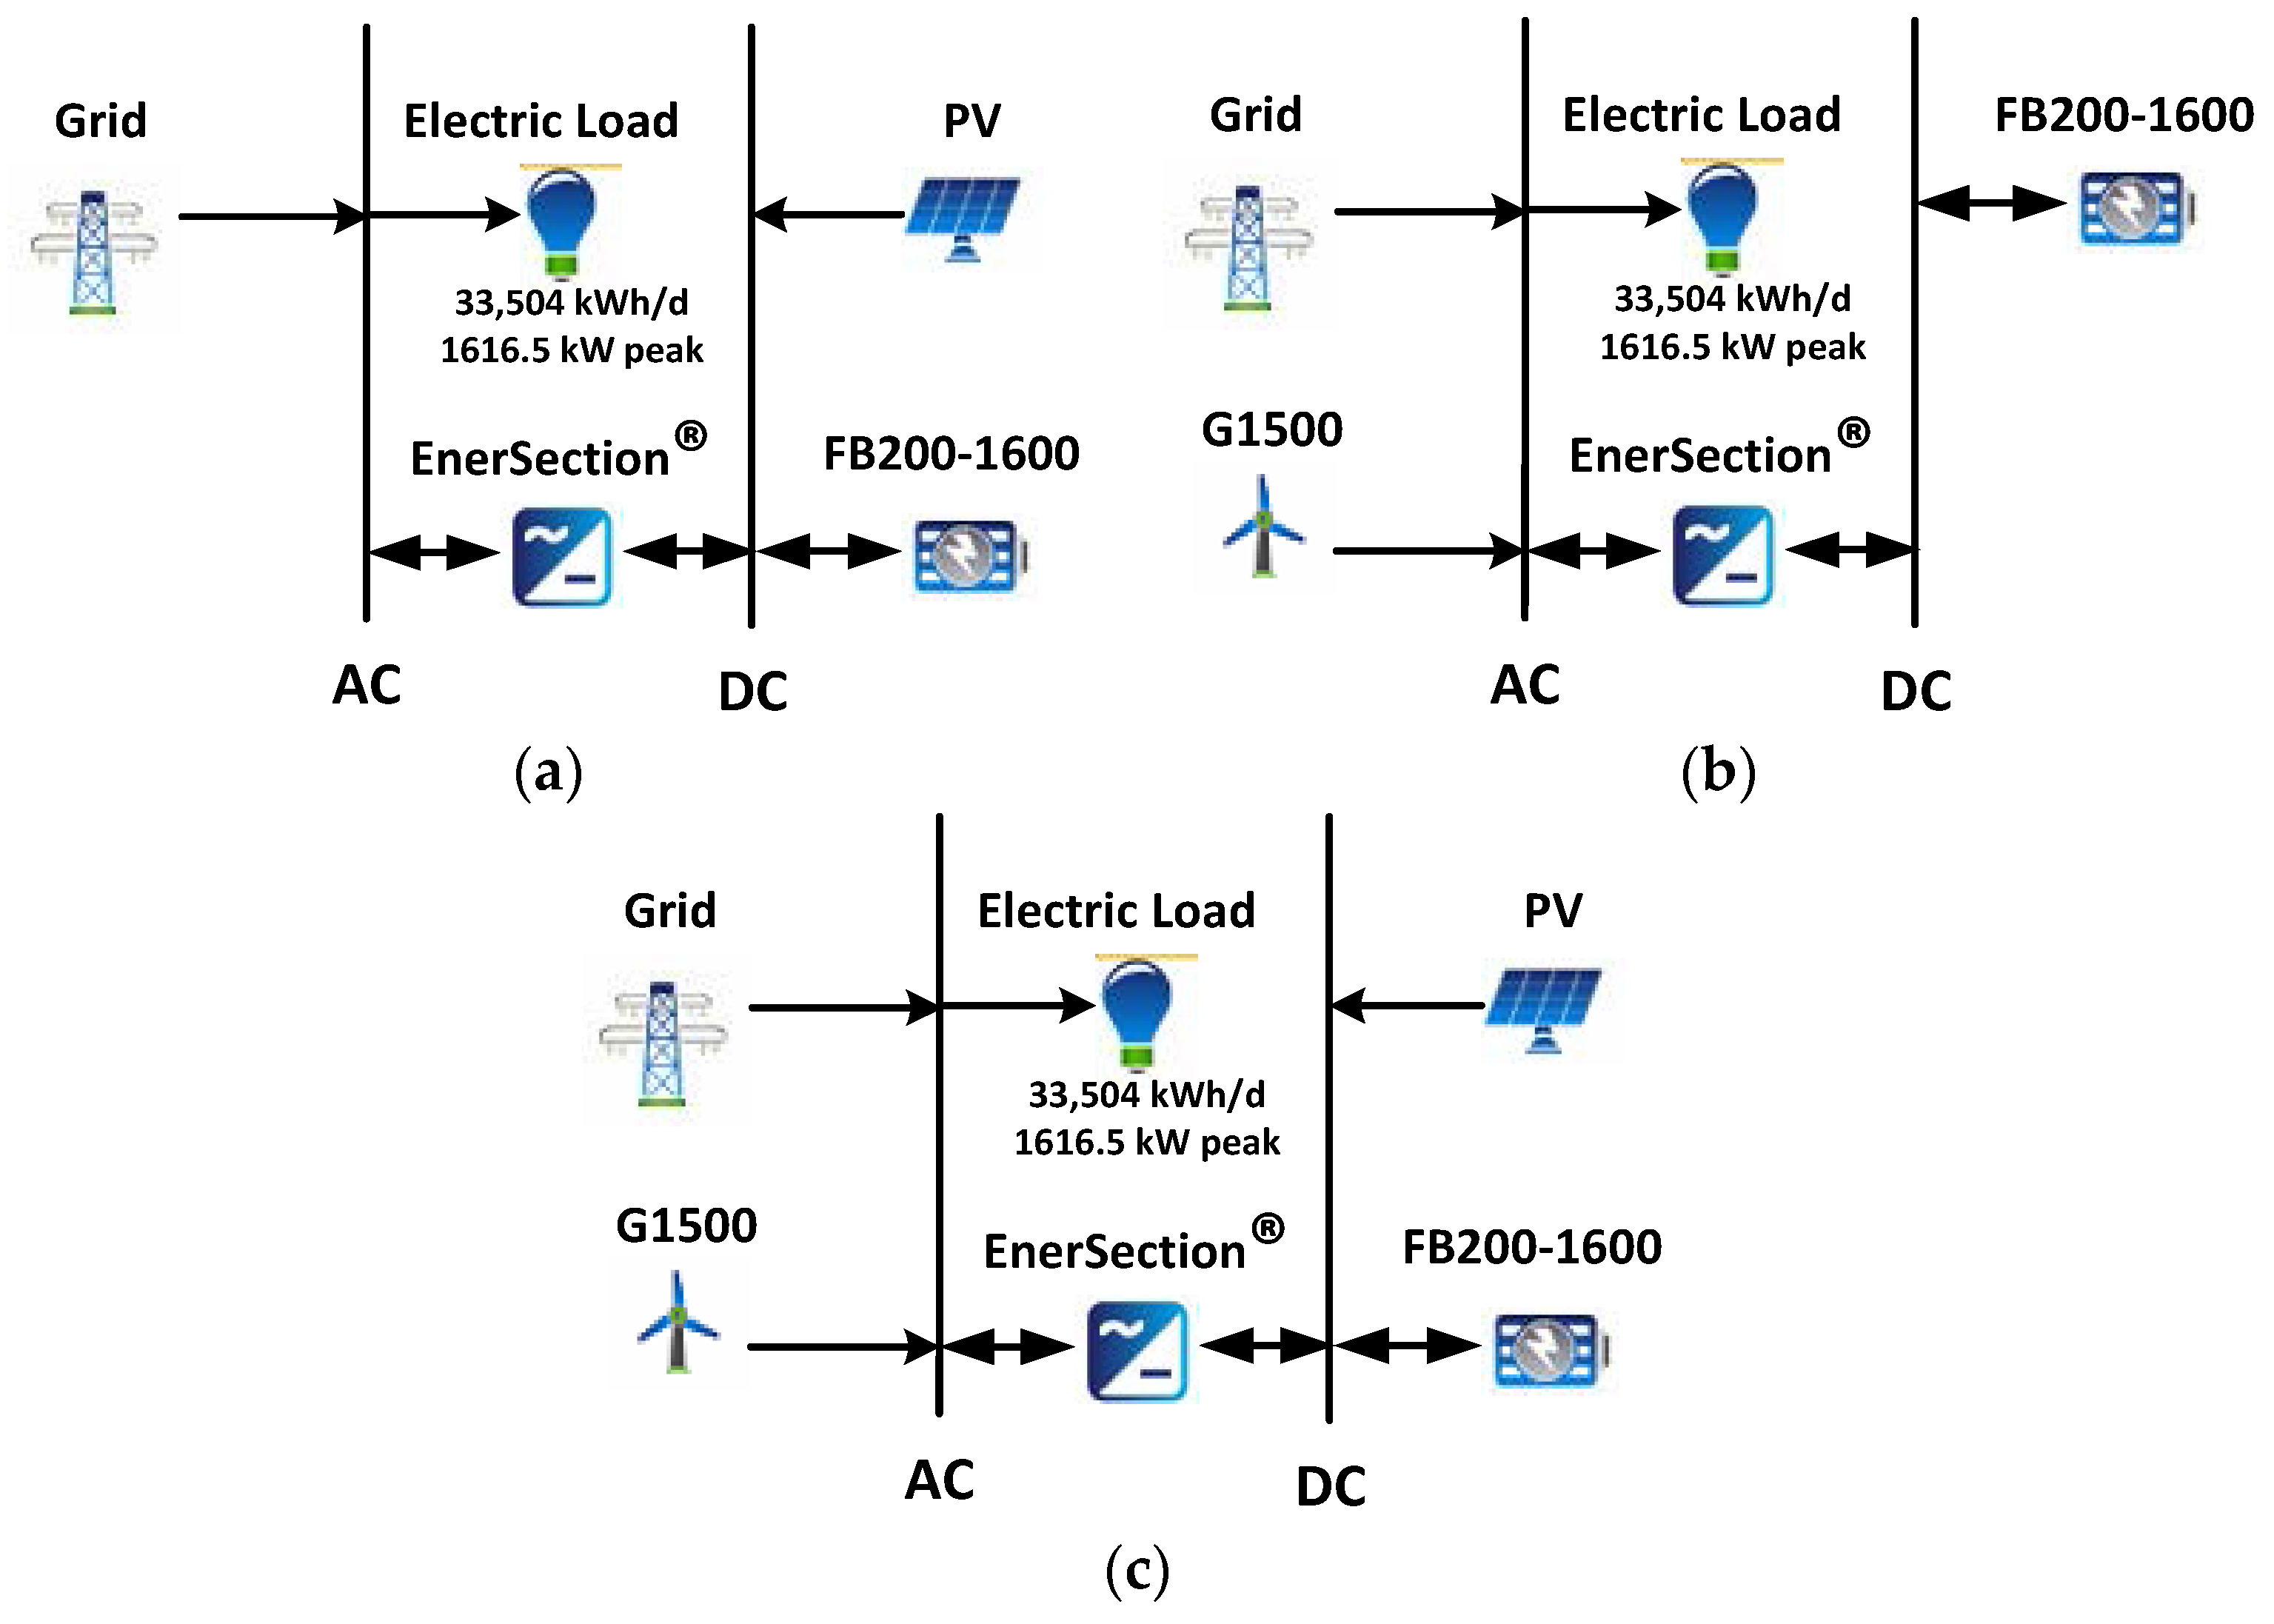
19]. In this case, three different renewable power systems, as shown in
Figure 1, have been examined and simulated for both process design scenarios: (a) standalone solar; (b) standalone wind; and (c) hybrid wind/solar power systems. The selected systems have also been considered to be connected to the grid only for selling back the excess electricity that cannot be utilized by the system under the given operating conditions. Any additional cost related to the grid extension has not been included in this study.
2.2. Load Information
The required input data for the industrial electrical load of both process design scenarios has been obtained from process simulations in ASPEN Plus software (ASPEN Plus V8.6, Aspen Technology, Bedford, MA, USA) and is presented in
Table 1 based on the equipment classification that has been made in the previous research work [
13]. In the HOMER software, an additional day-to-day random variability of 5% has been considered.
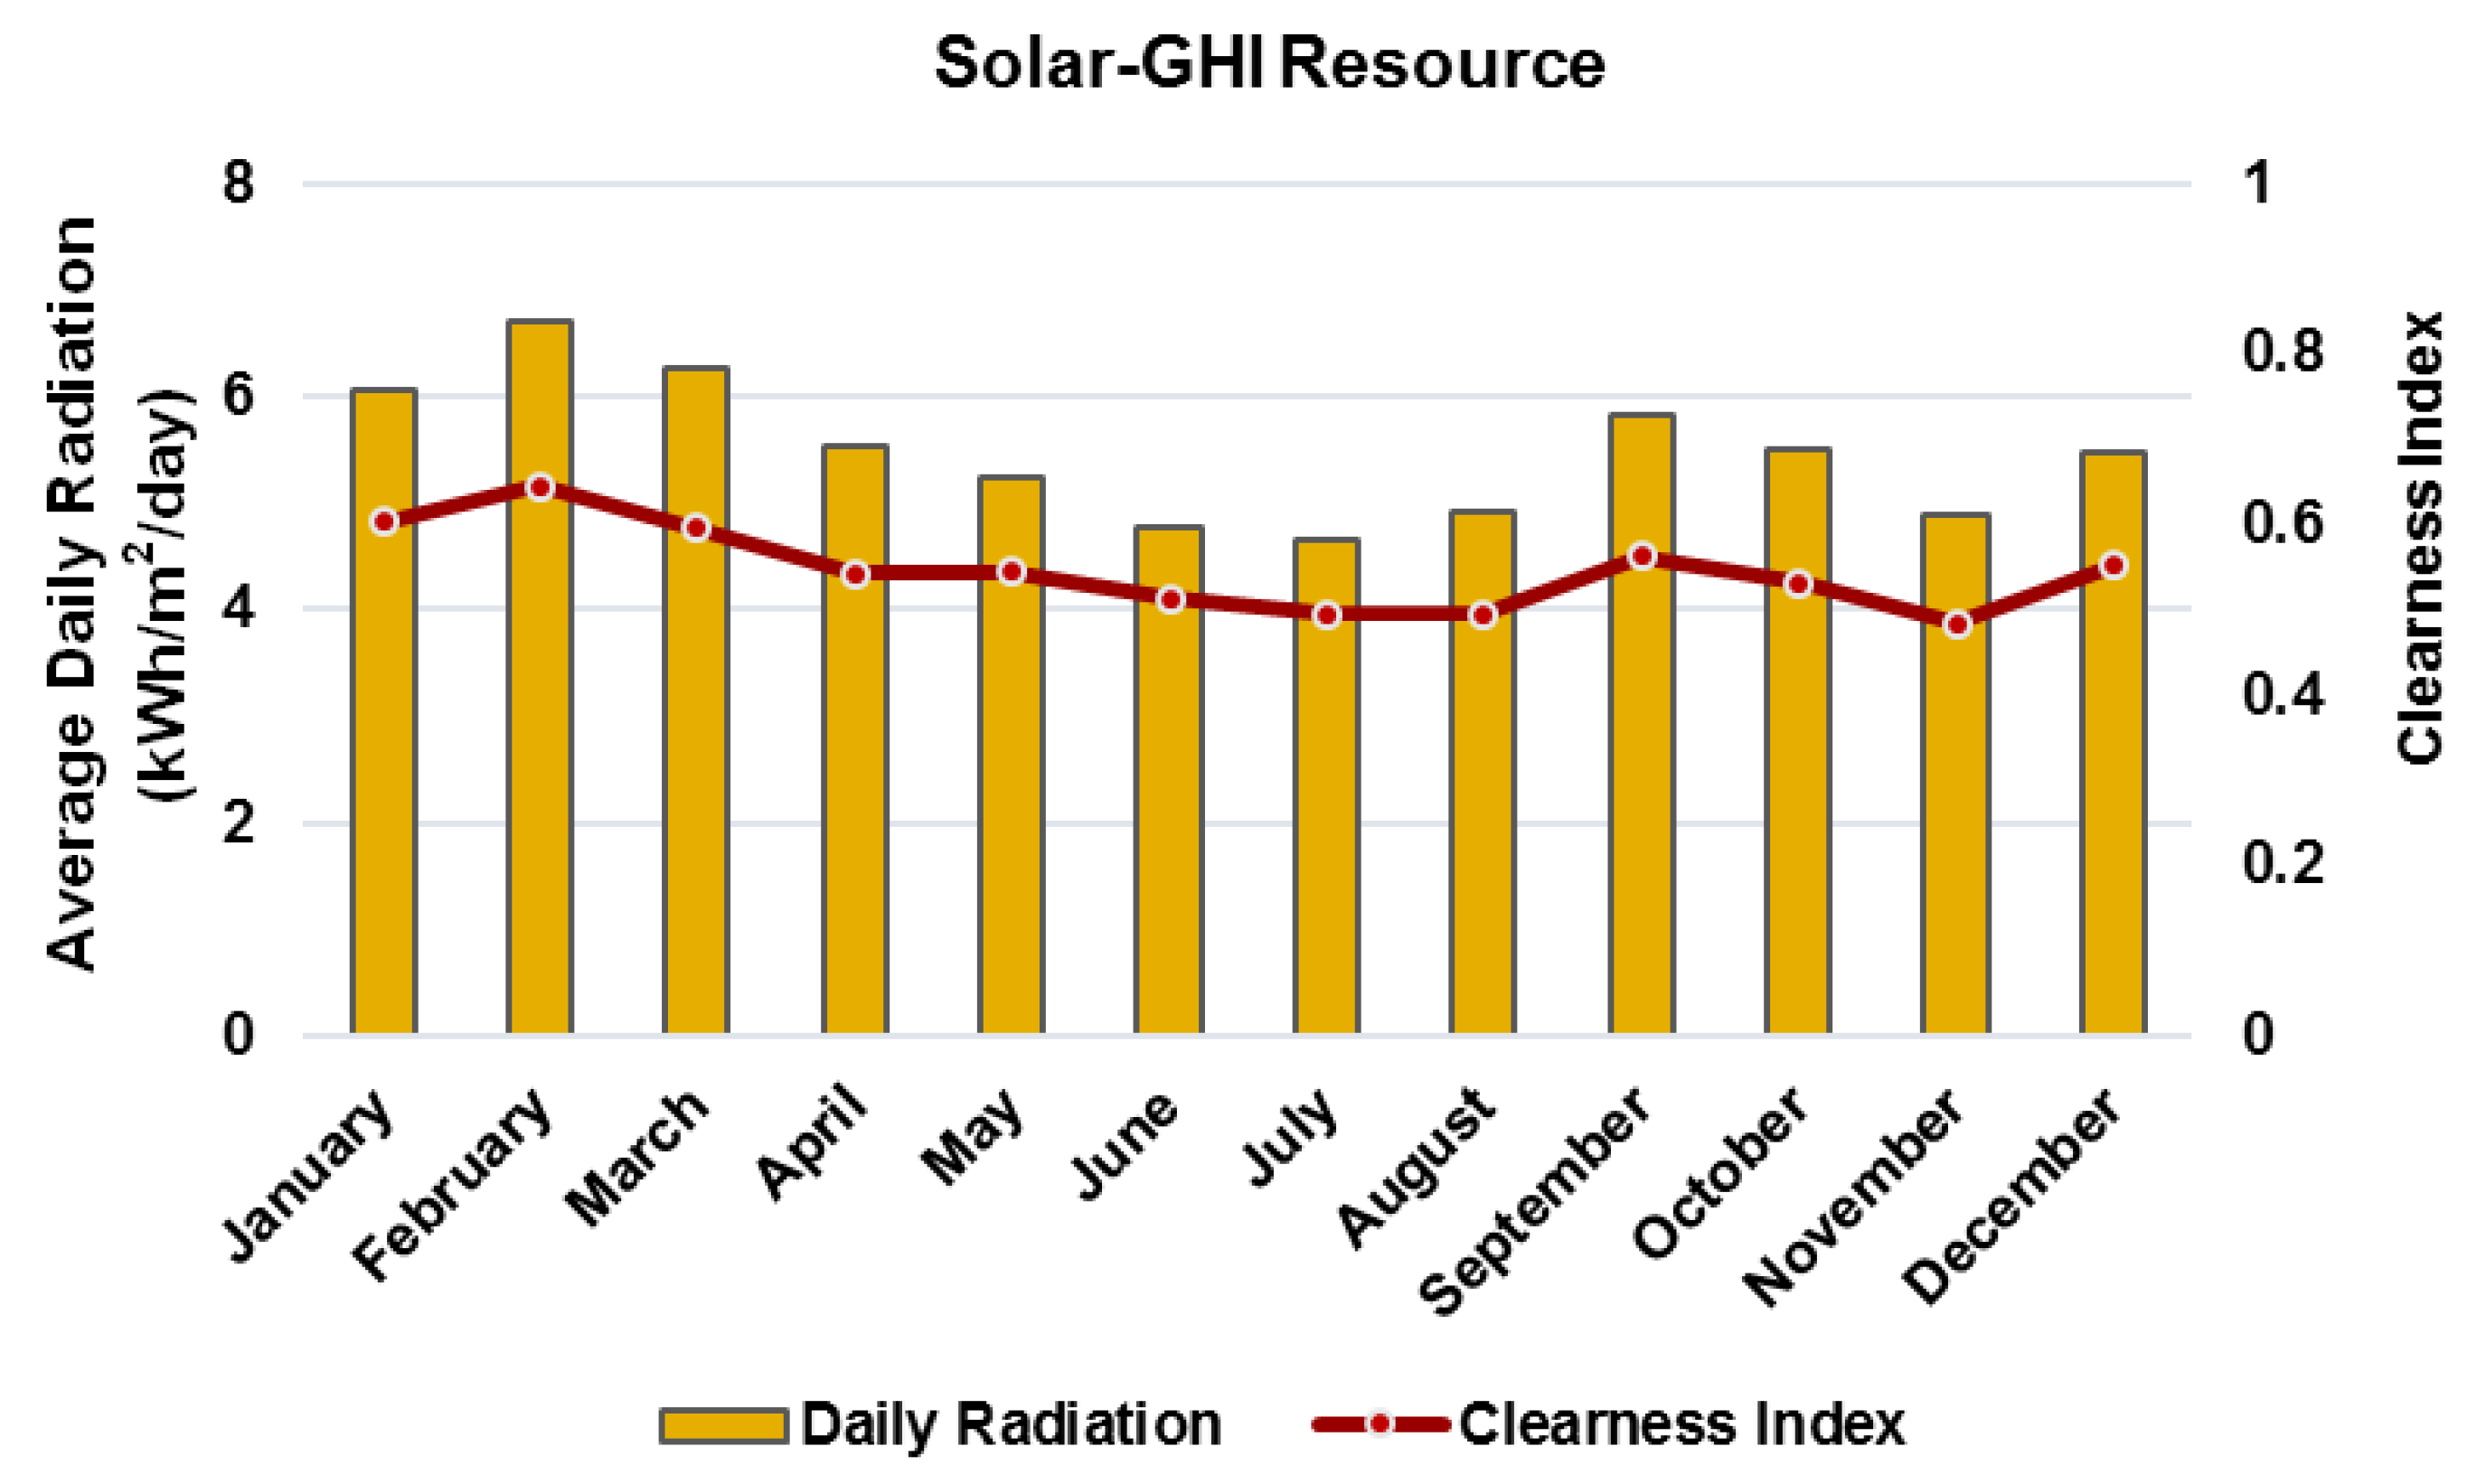
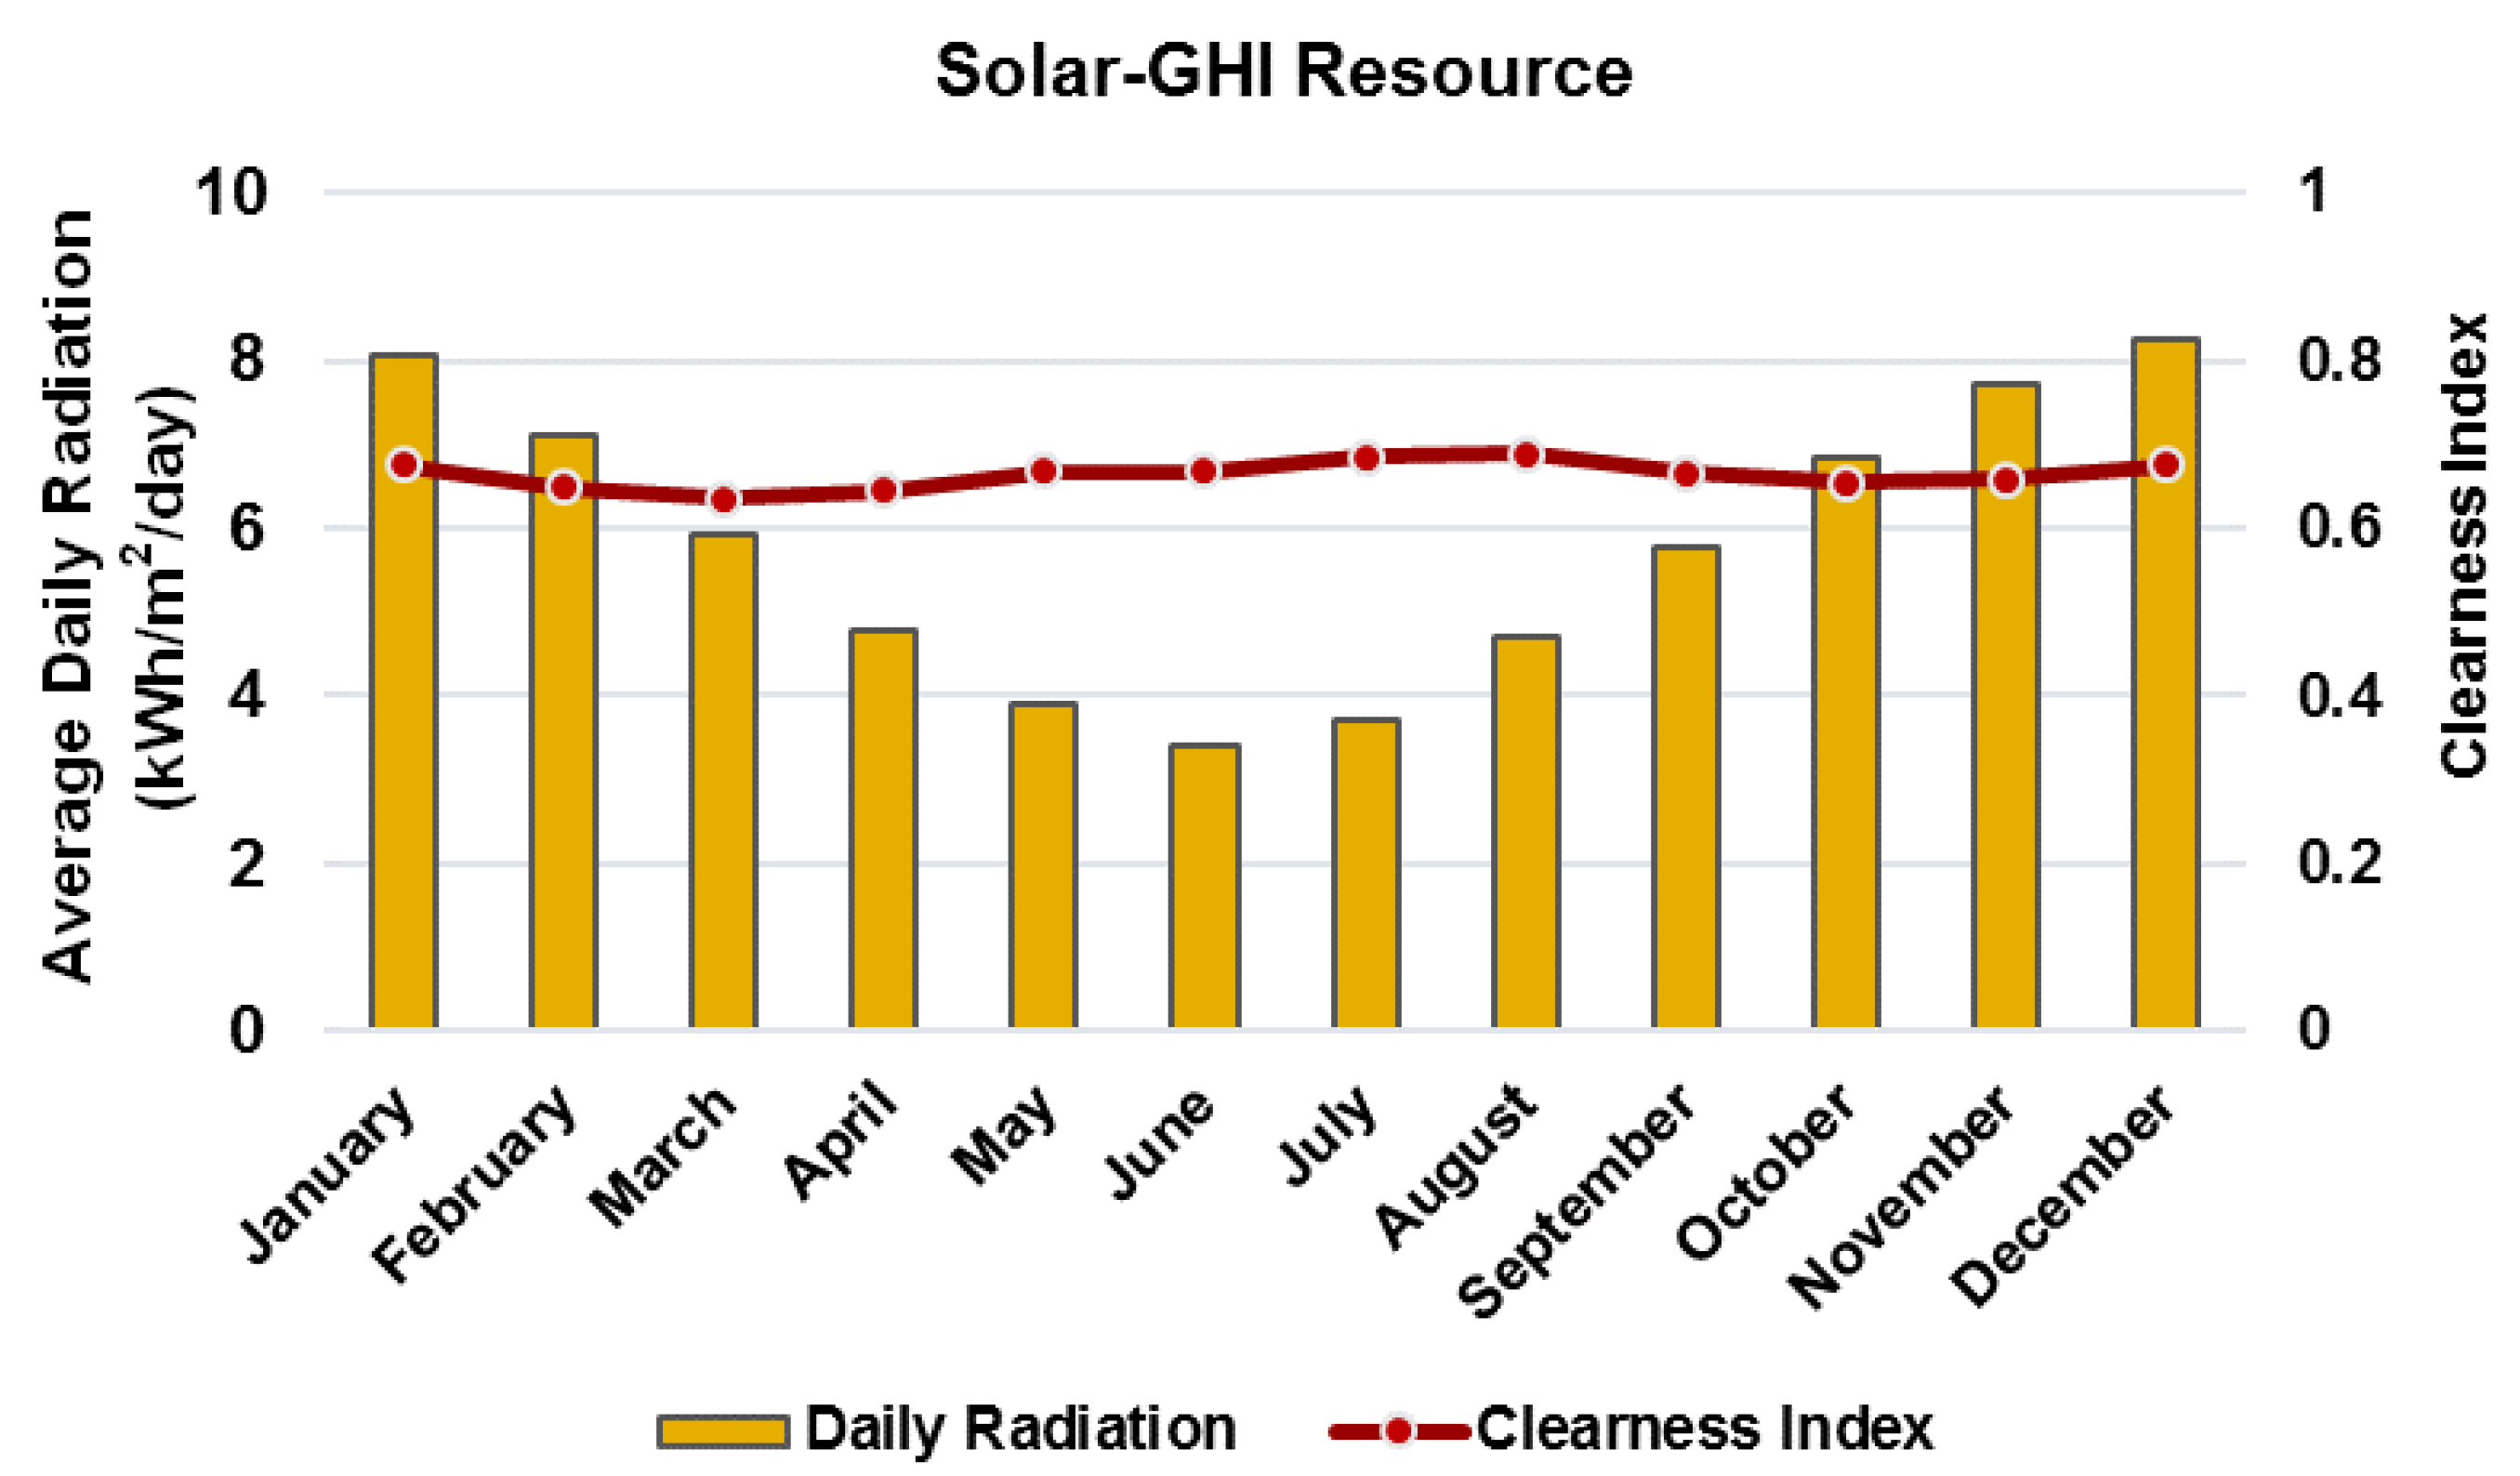
The solar and wind resource data required for the estimation of the photovoltaic (PV) panel and wind turbine power output has been obtained for the selected location of Kenya (latitude: 0°1.4′ S; longitude: 37°54.4′ E) and South Africa (latitude: 30°33.6′ S; longitude: 22°56.3′ E) from the “NASA Surface meteorology and Solar Energy” dataset, which is embedded in HOMER software. The annual average solar irradiance has been determined for the case of Kenya and South Africa to 5.48 kWh/m
2/day and 5.85 kWh/m
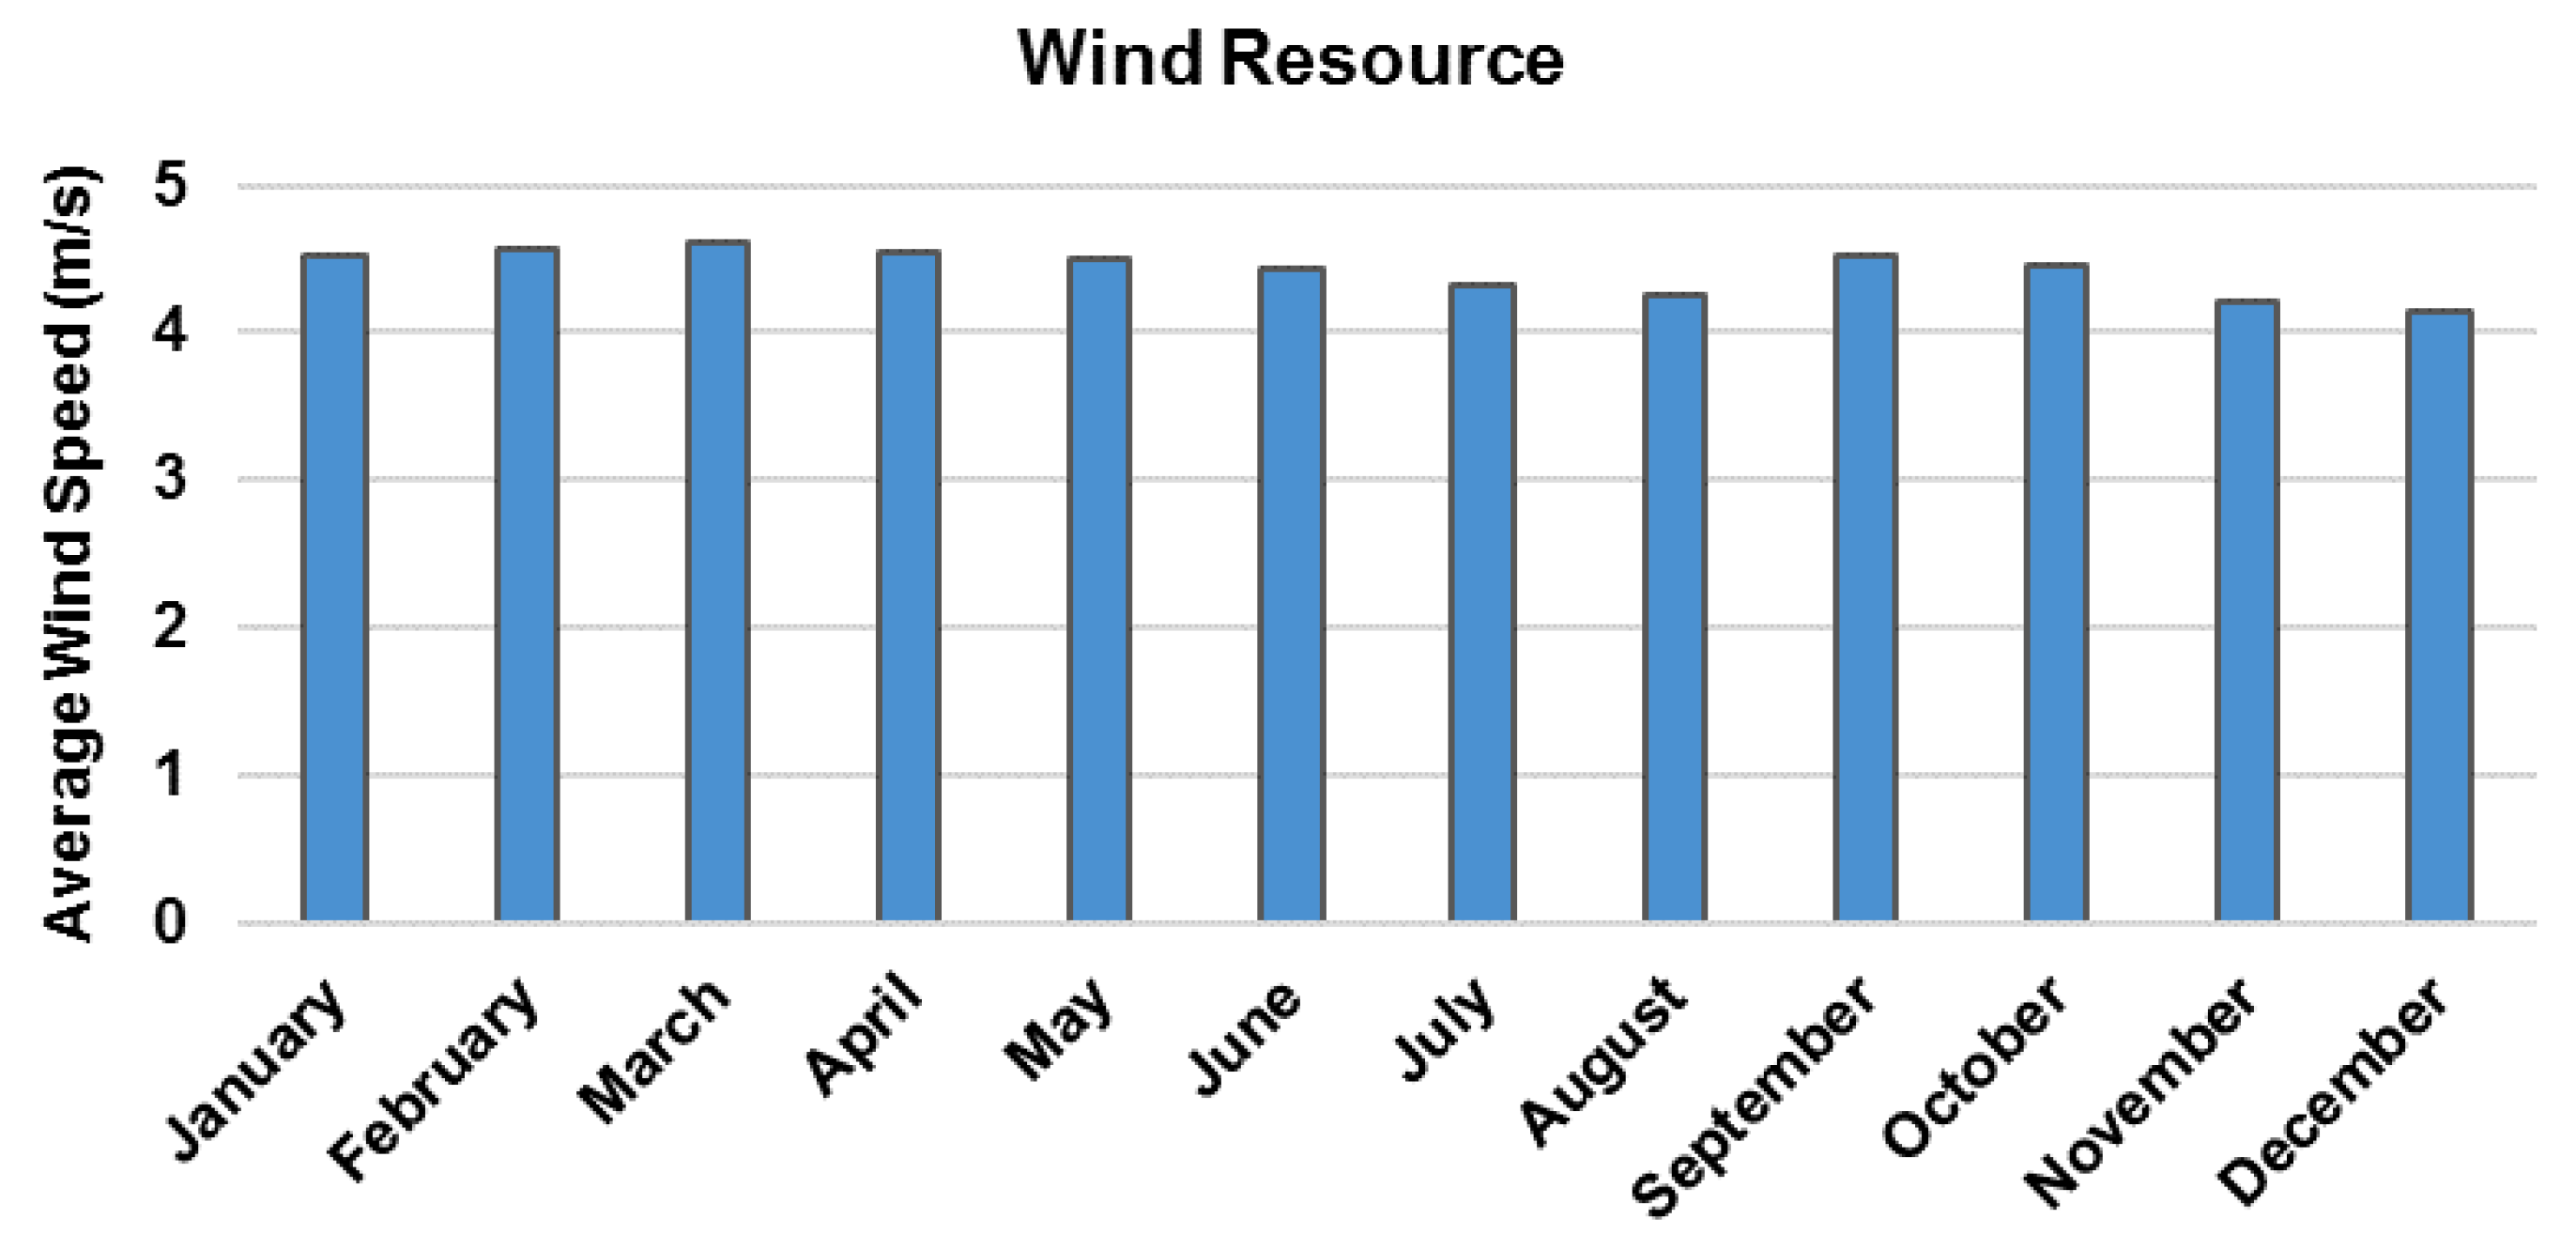
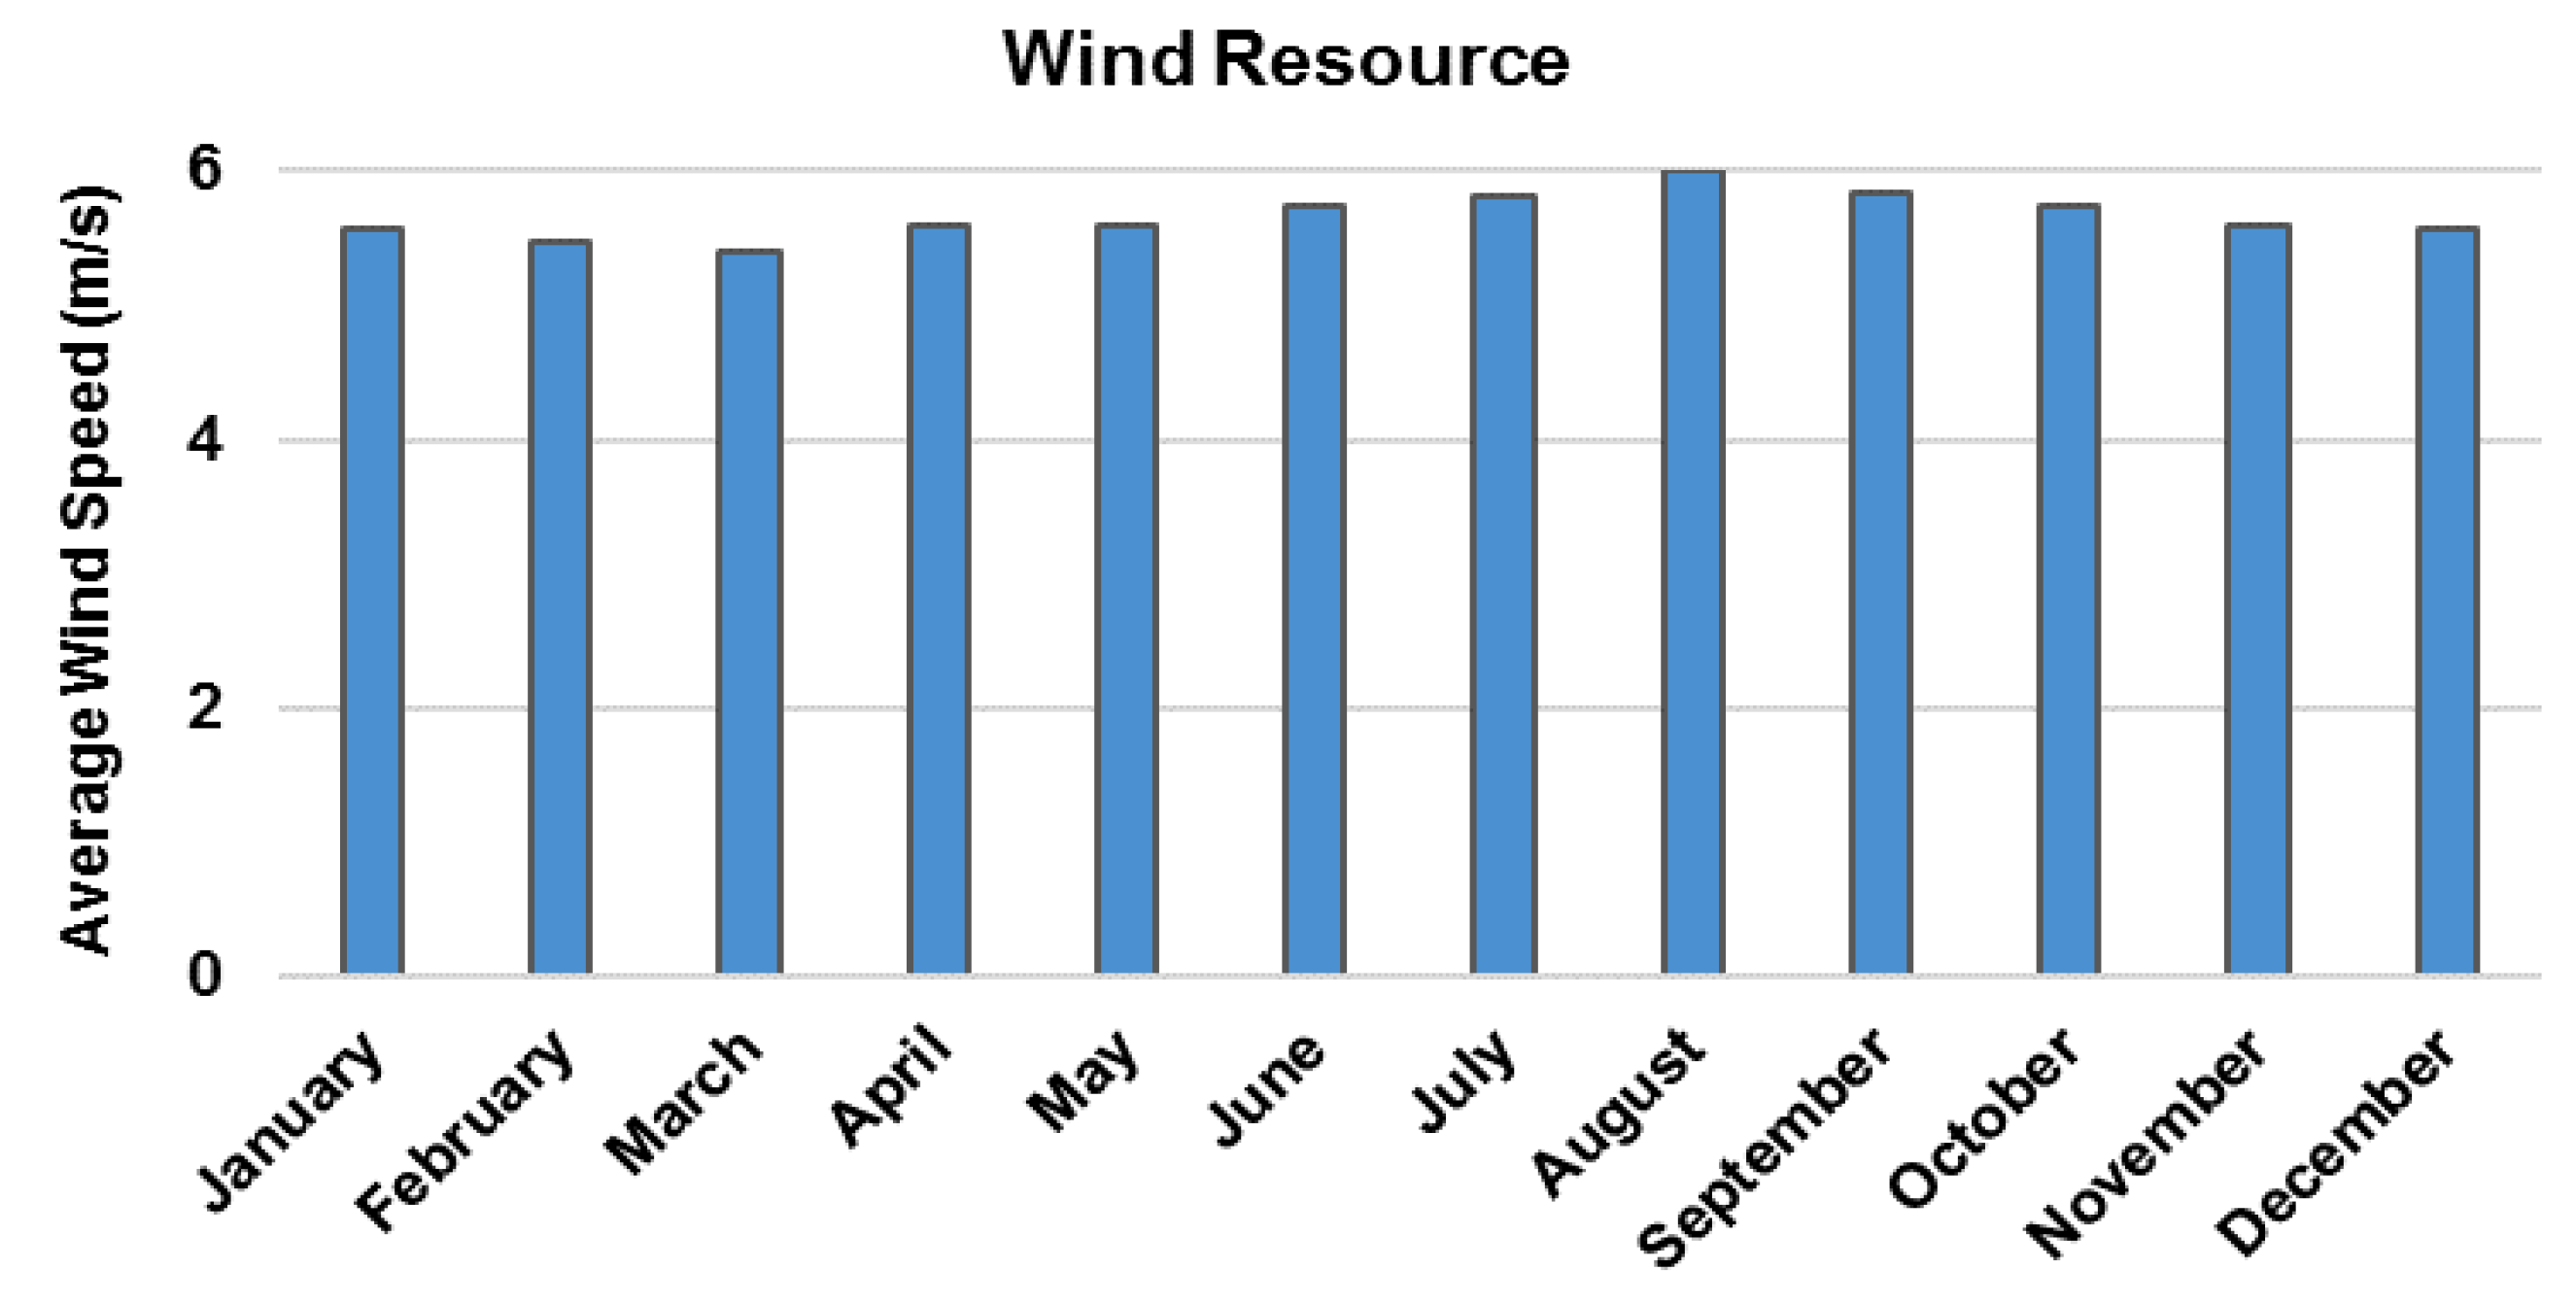
2/day, respectively, whereas the corresponding average wind speed is 4.42 m/s and 5.66 m/s. In
Figure 2,
Figure 3,
Figure 4 and
Figure 5, the corresponding monthly average solar global horizontal irradiance and wind speed profiles for both countries are presented.
2.3. System Components
For the renewable power generation systems considered in this study, four main electrical components have to be modeled in the HOMER software. These are the PV array panels, the wind turbine, the battery and the converter. For each component, an in-built unit in the HOMER software has been employed and its specifications, as well as the size range that has been considered for the optimization procedure, are provided below.
2.3.1. PV Array
For modeling the solar power system, a flat plate PV panel has been selected with a derating factor of 80% and a lifetime of 25 years. The size of the PV configuration has been set for scenario A to 1000–16,000 kW and for scenario B from 1000 to 40,000 kW.
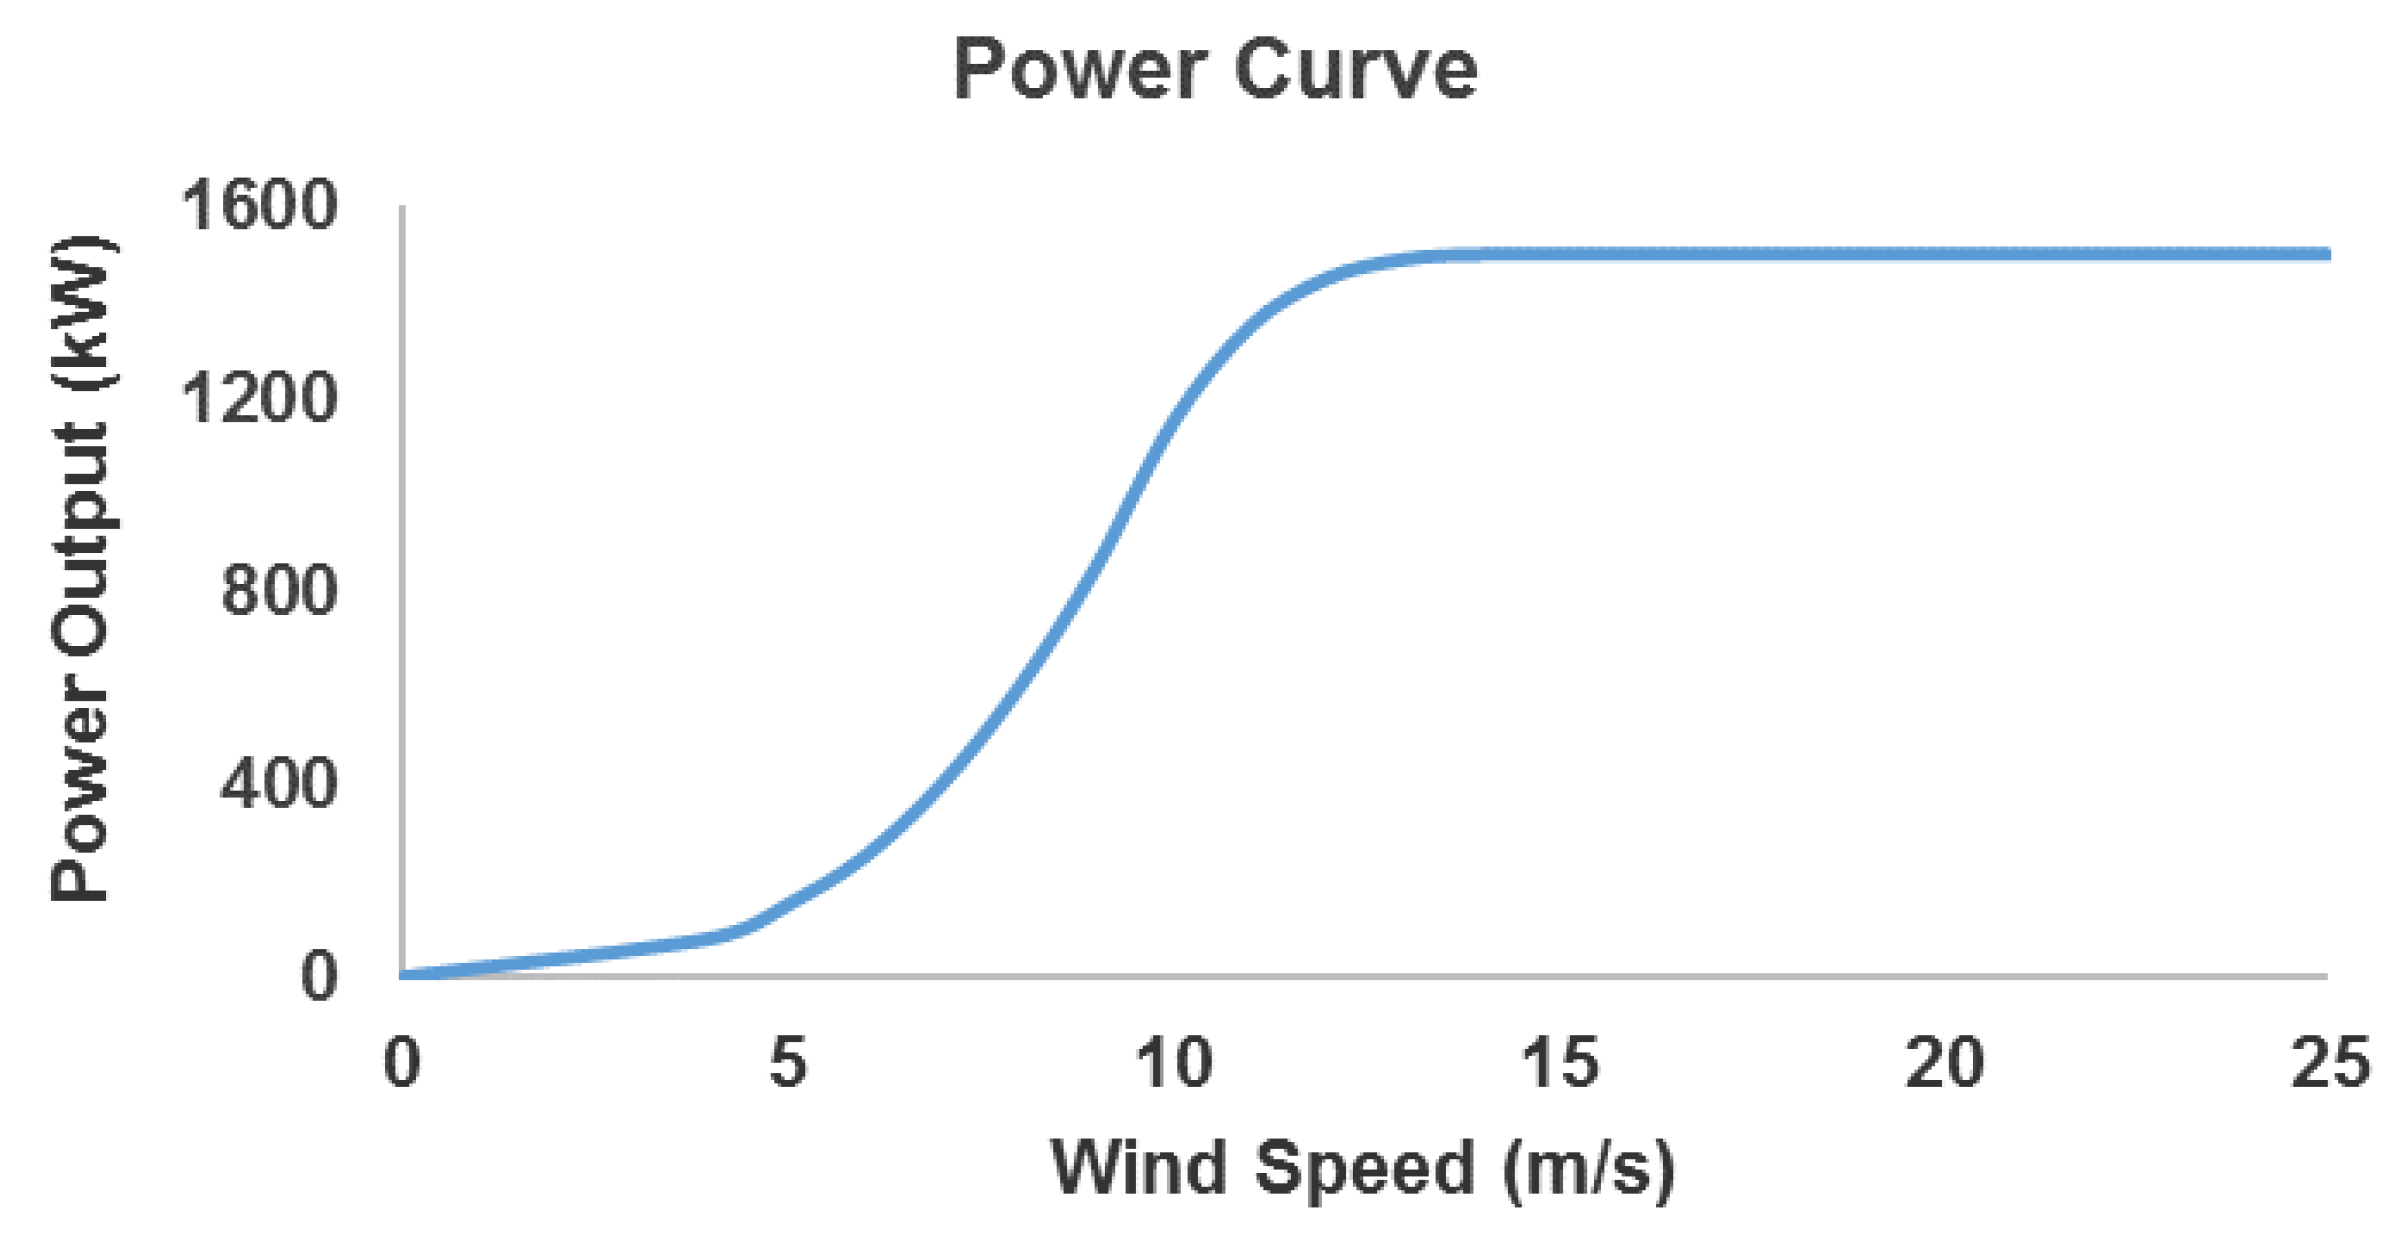
2.3.2. Wind Turbine
The generic wind turbine of 1.5 MW capacity has been utilized in the simulations with a hub height of 80 m. The lifetime of the turbine has been defined to 20 years and its characteristic power curve is provided in
Figure 6. The number of turbines has been defined for scenario A in the range of 2 to 25, and for scenario B from 5 to 50.
2.3.3. Battery
As wind and solar power generation systems are associated with high fluctuations in their electricity output, a system of batteries is required to ensure a constant power provision. For that purpose, a high capacity in-built battery model, the CELLCUBE FB 200-1600 (GILDEMEISTER energy solutions GmbH, Würzburg, Germany), has been selected in the given study with a nominal voltage of 700 V and capacity of 2308 kWh. The roundtrip efficiency and the lifetime of the battery are 65% and 20 years, respectively. The size range of the battery system has been specified for both scenarios from 20 to 200 units.
2.3.4. Converter
An EnerSection converter (EnSync Energy Systems, Menomonee Falls, WI, USA) has been selected for converting the direct current (DC) power output of the solar panel and battery systems to alternating current (AC) load with a lifetime of 20 years. The given converter operates in both inverter and rectifier modes with corresponding efficiencies of 95% and 90%. Its size range has been delineated for both scenarios from 1000 to 30,000 kW.
2.4. Economic Considerations and Constraints
The estimation of the Net Present Cost (NPC), against which the proposed electrical systems in HOMER software are evaluated and optimized, requires the input data of the capital, replacement, maintenance and operating costs of the involved components. In this case, the relevant costs of the PV panel and wind turbine, as shown in
Table 2, have been extracted from research studies conducted for the country of Kenya and South Africa. However, due to the unavailability of similarly reliable and coherent data for the cost of the converter and battery system, generic values have been used in both cases from other relevant literature, and operating costs have been assumed to be 2% of the capital cost [
20].
In addition to the aforementioned economic parameters, the project lifetime of each proposed renewable power system has been set to 25 years. In the case of Kenya, the discount and the inflation rates have been set to 10% and 6.5%, correspondingly, reflecting the most up-to-date investment environment [
21]. The feed-in tariff for solar and wind generated electricity has been selected to be 0.12 $/kWh and 0.11 $/kWh, respectively [
22]. For the hybrid system, the tariff has been assumed to be the average value of the two main systems—0.115 $/kWh. In the case of South Africa, discount and inflation rates have been determined to be 9% and 6%, correspondingly [
23]. The feed-in tariff for solar and wind electricity is 0.066 $/kWh and 0.052 $/kWh [
24], whereas, for the hybrid system, it has been assumed to be 0.059 $/kWh.
In order to ensure the safe operation of the small-scale chemical plant regardless of the load fluctuations, the operating reserve has been determined as 10% of the hourly electrical load, 25% of the solar and 50% of the wind power output. Additionally, the capacity shortage has been fixed to 0%.
3. Results
Manifold simulations have been conducted for each renewable power system examined in both process design scenarios for the two selected countries, and the optimized configurations with respect to the minimum net present cost (NPC) have been determined.
Table 3a and
Table 4a present the number and the capacity of the components comprising each optimized power system configuration for each scenario, whereas
Table 3b and
Table 4b show the respective economic factors that have been calculated: initial investment; annual operating and maintenance costs; cost of electricity (COE); net present cost and the annual amount of excess electricity being sold to the grid. The simulation results for the two selected locations will be presented below per electrical load scenario.
3.1. Scenario A
For scenario A and the case of Kenya, as it can be deduced from
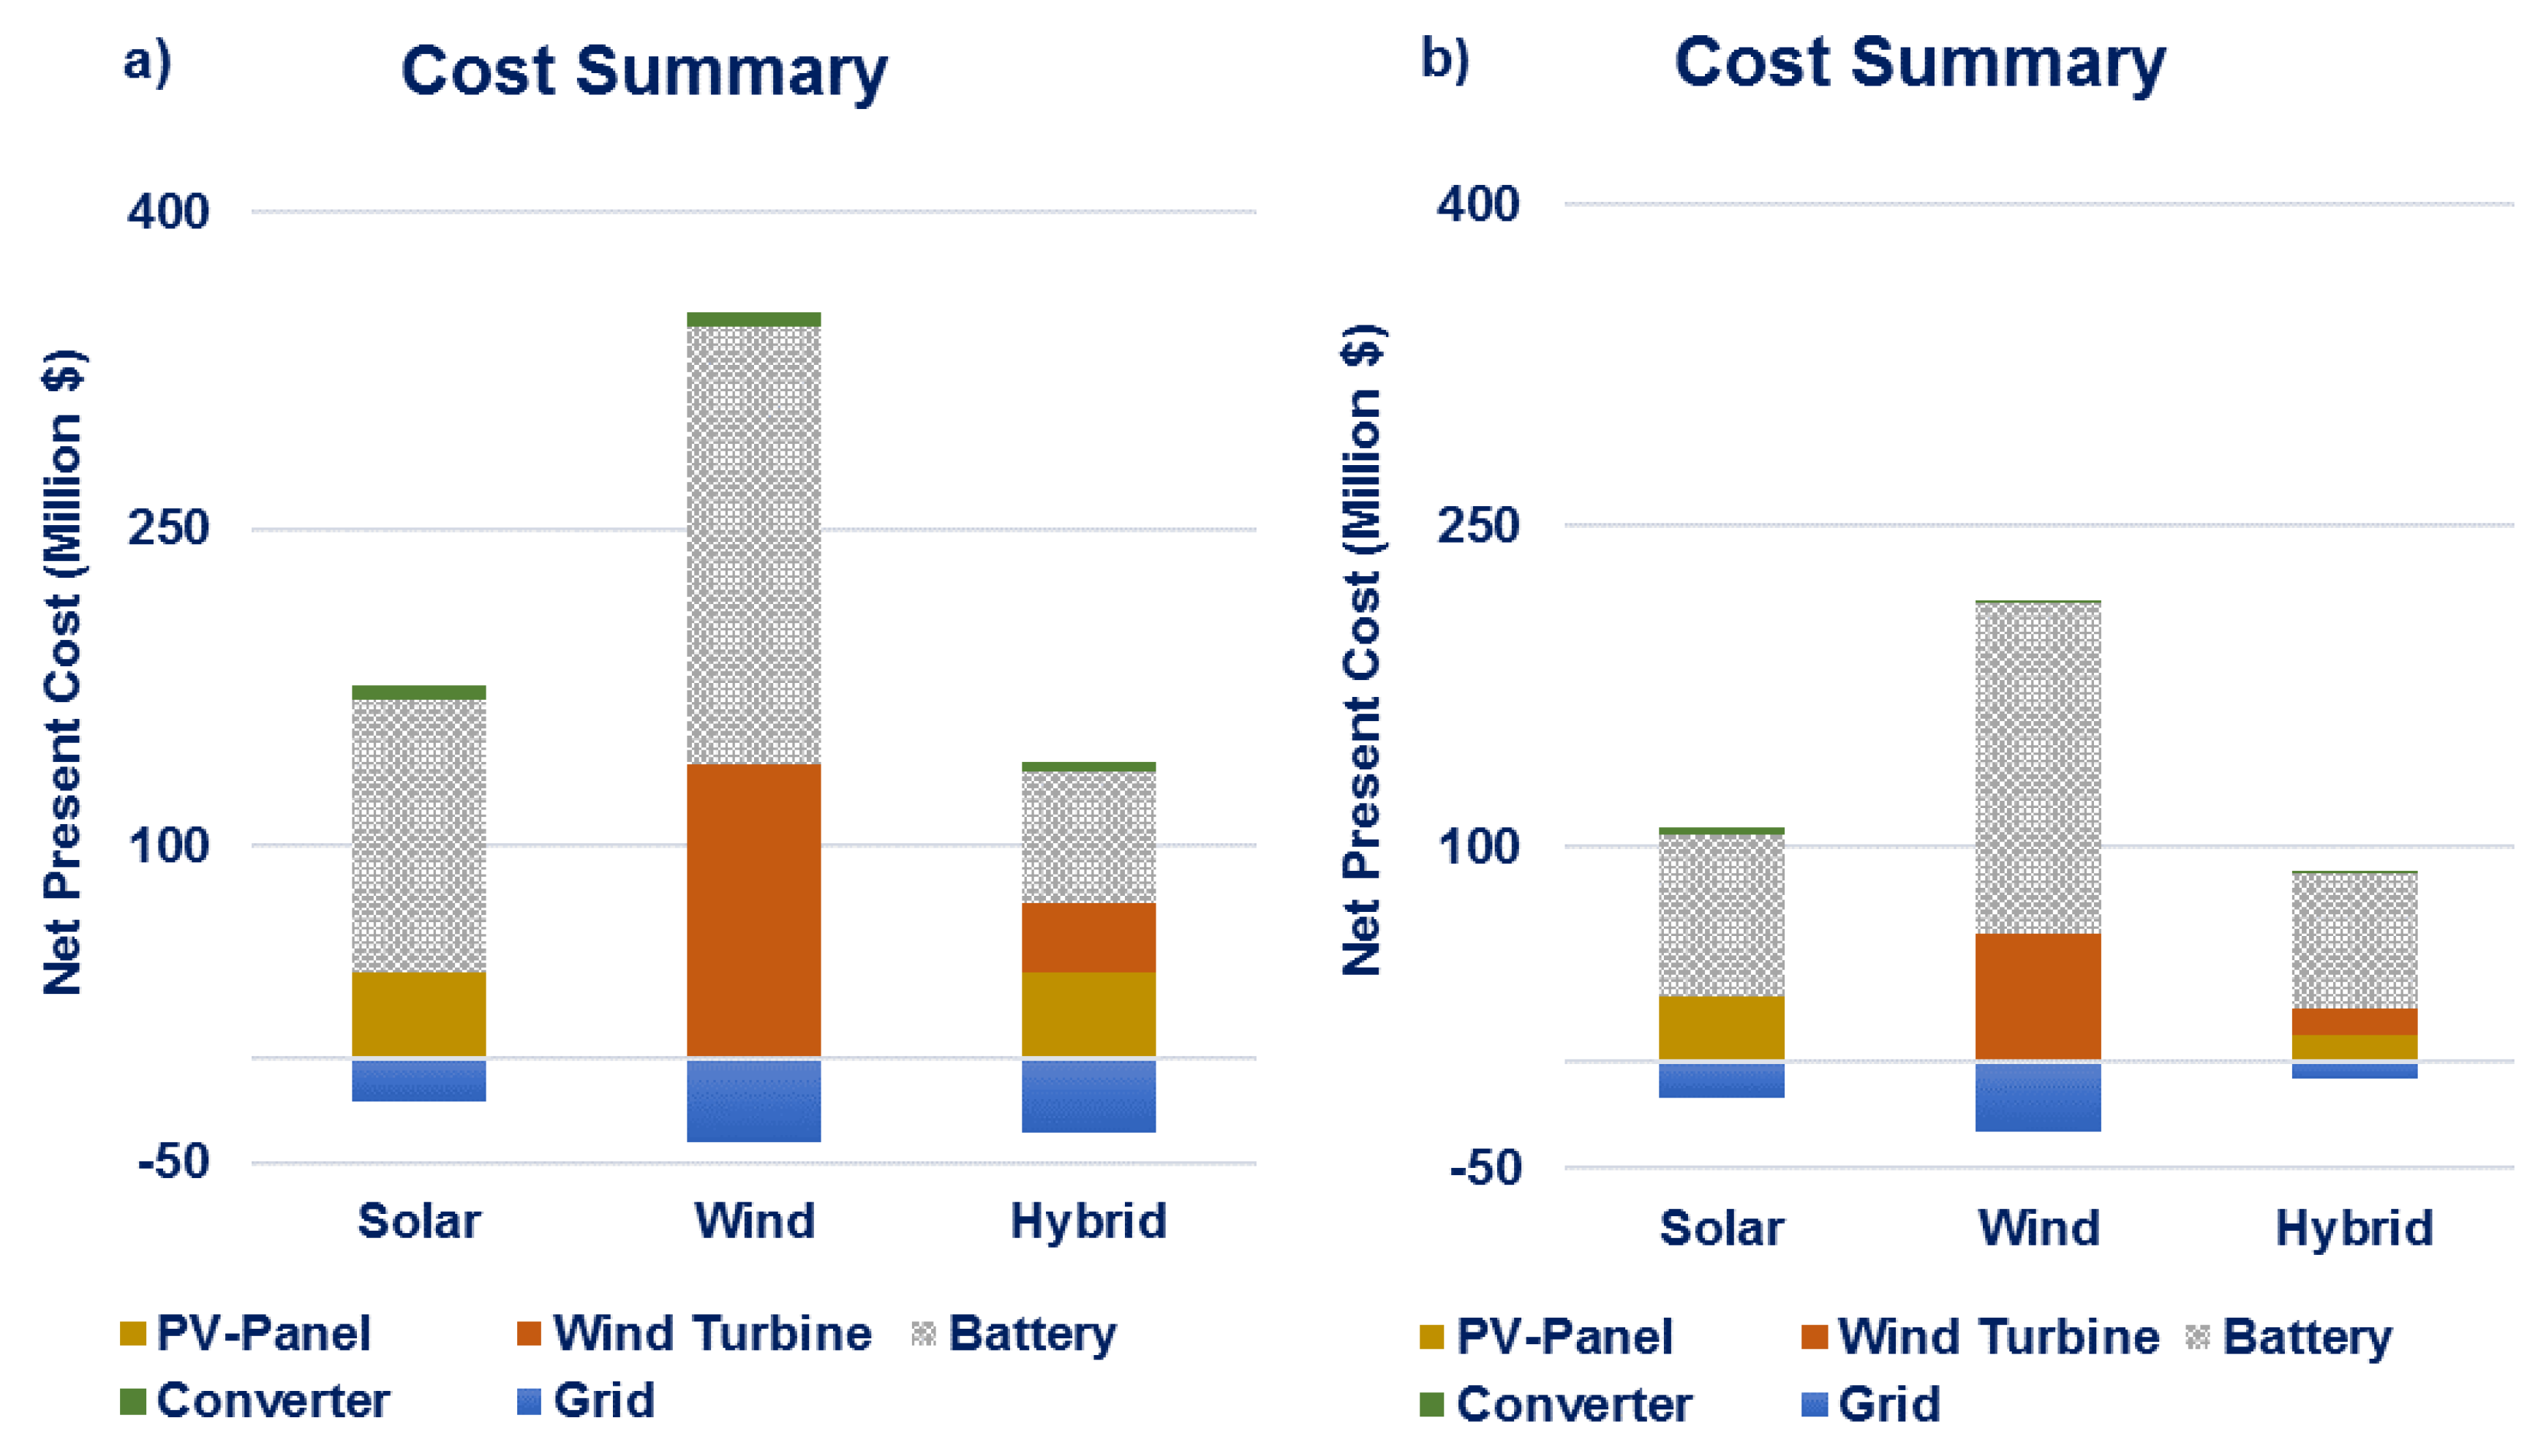
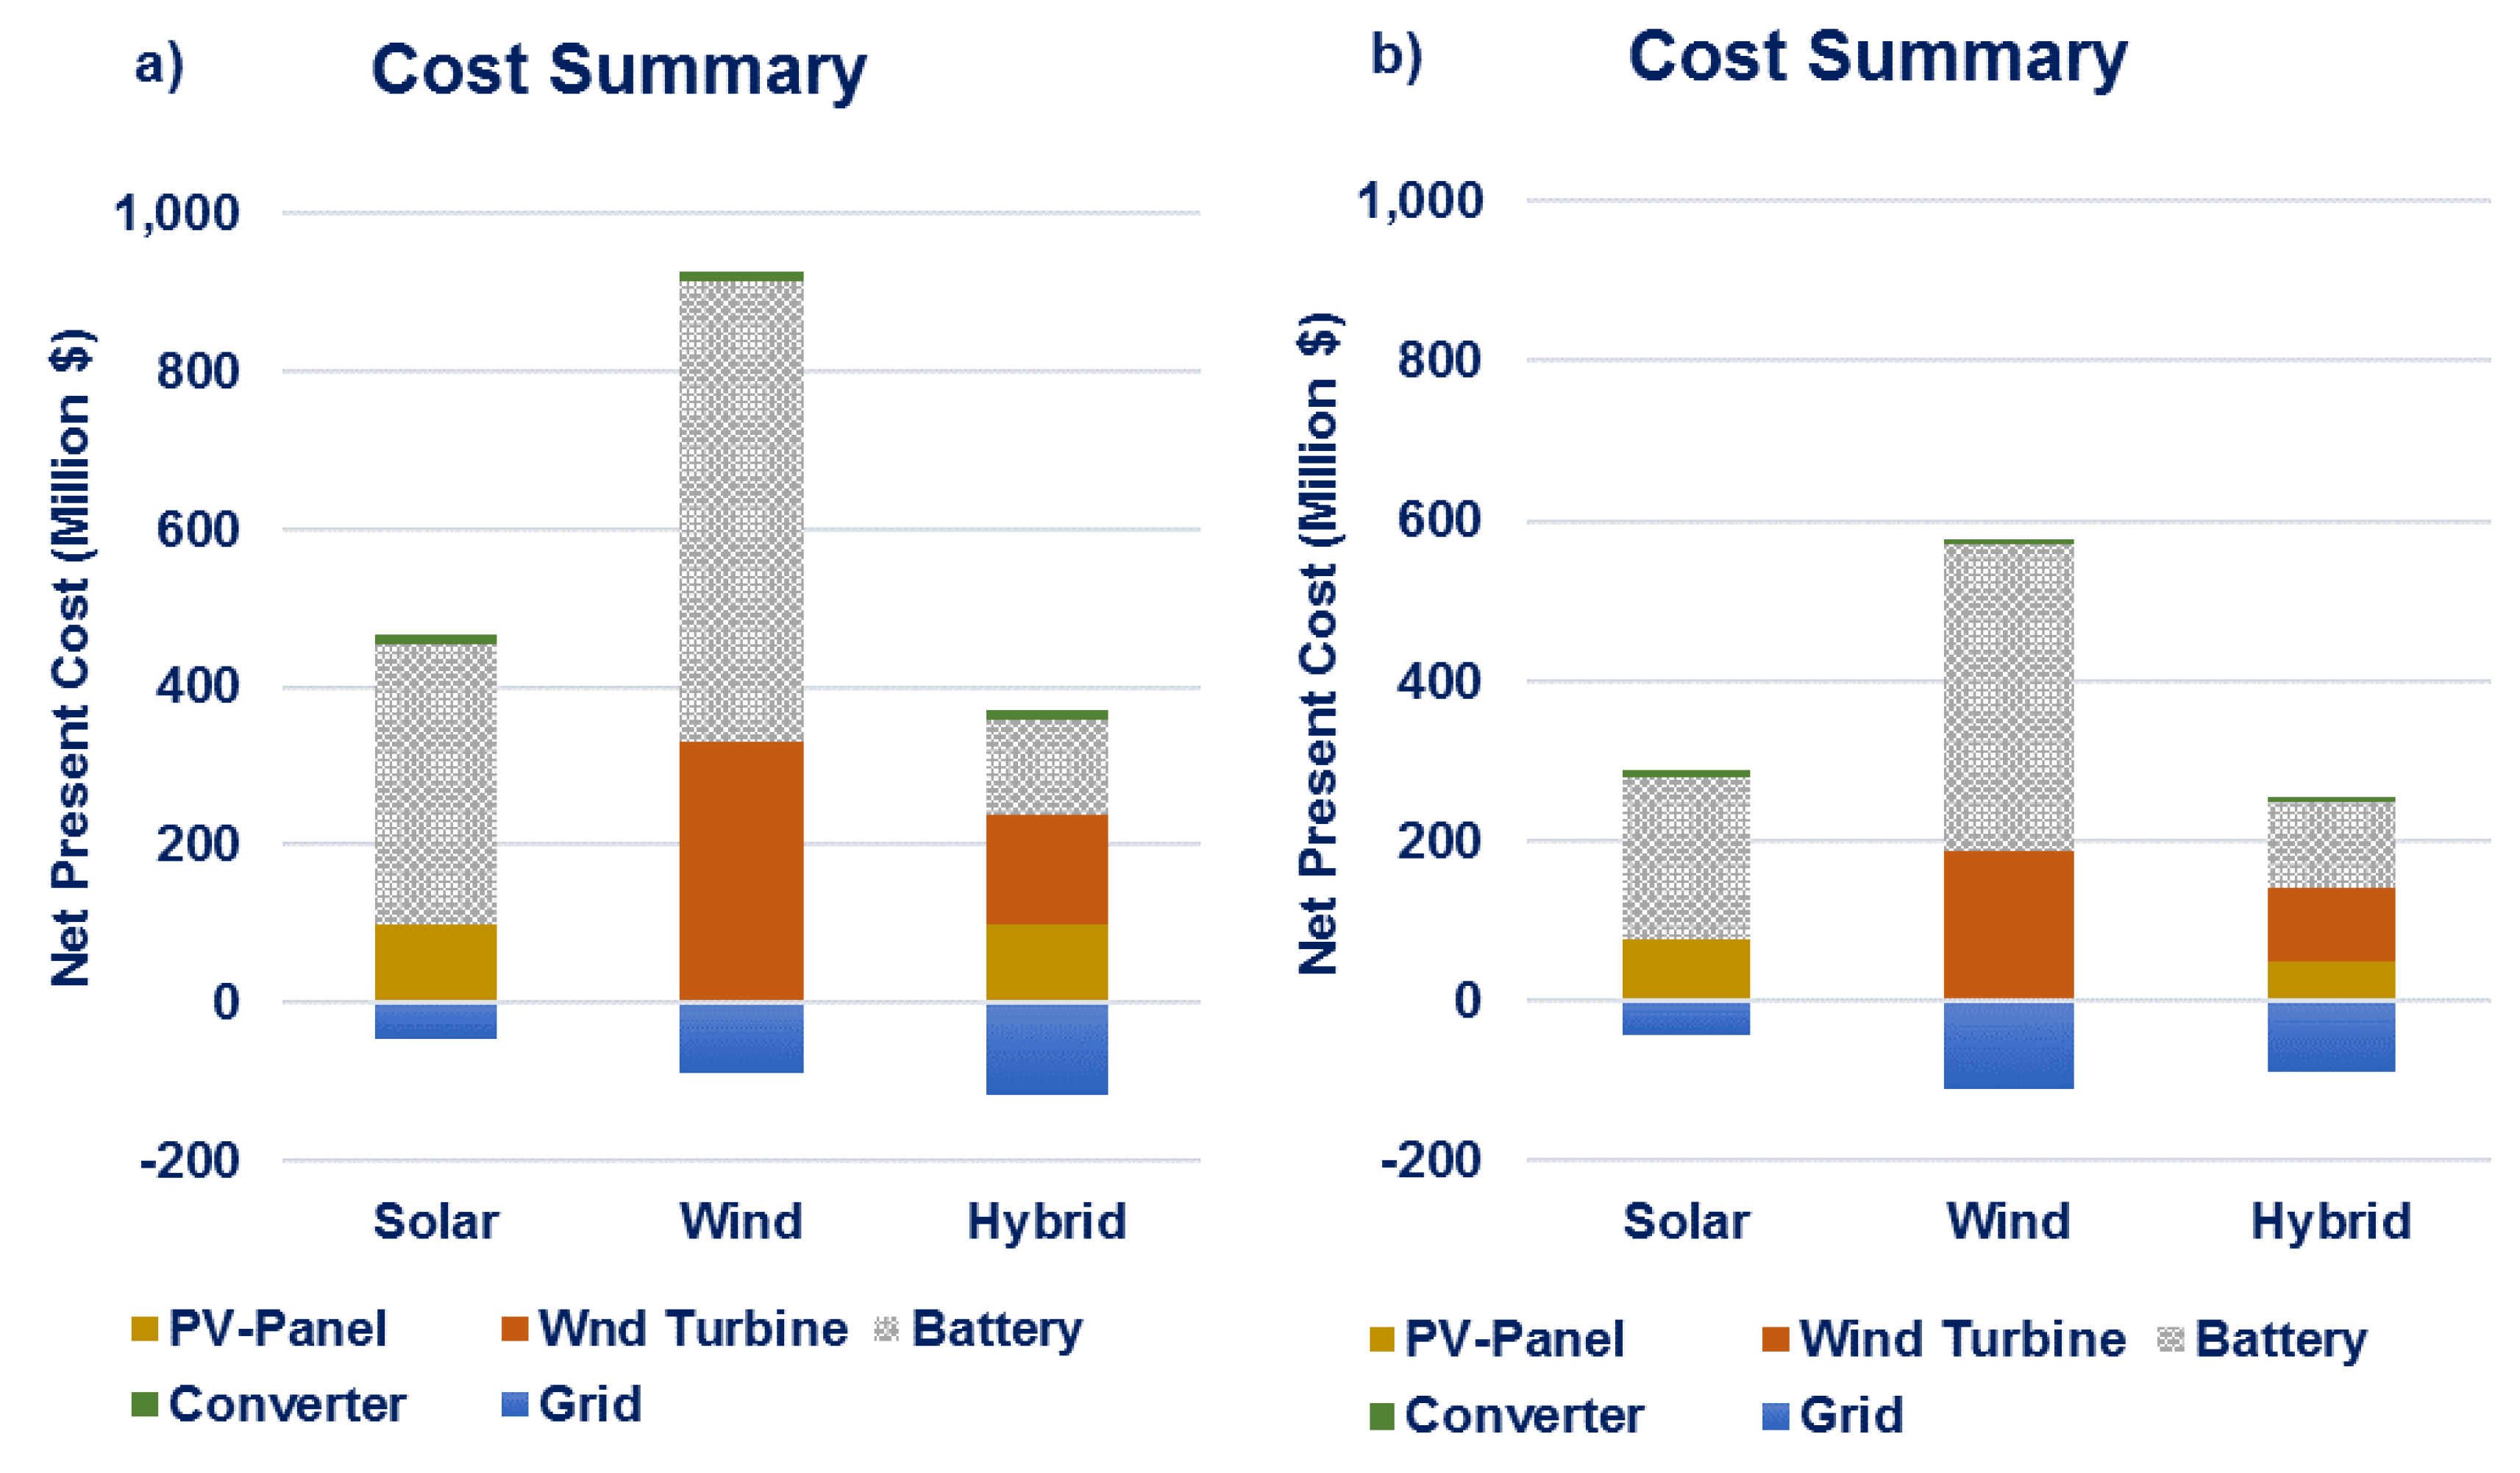
Table 3b, the best performing power system with respect to the lowest NPC and the COE is the hybrid system, in which PV panels and wind turbines contribute overall by 74% and 26%, respectively, to the total electricity production. As compared to the configuration of the standalone solar power system, the lower NPC can be mainly attributed, according to
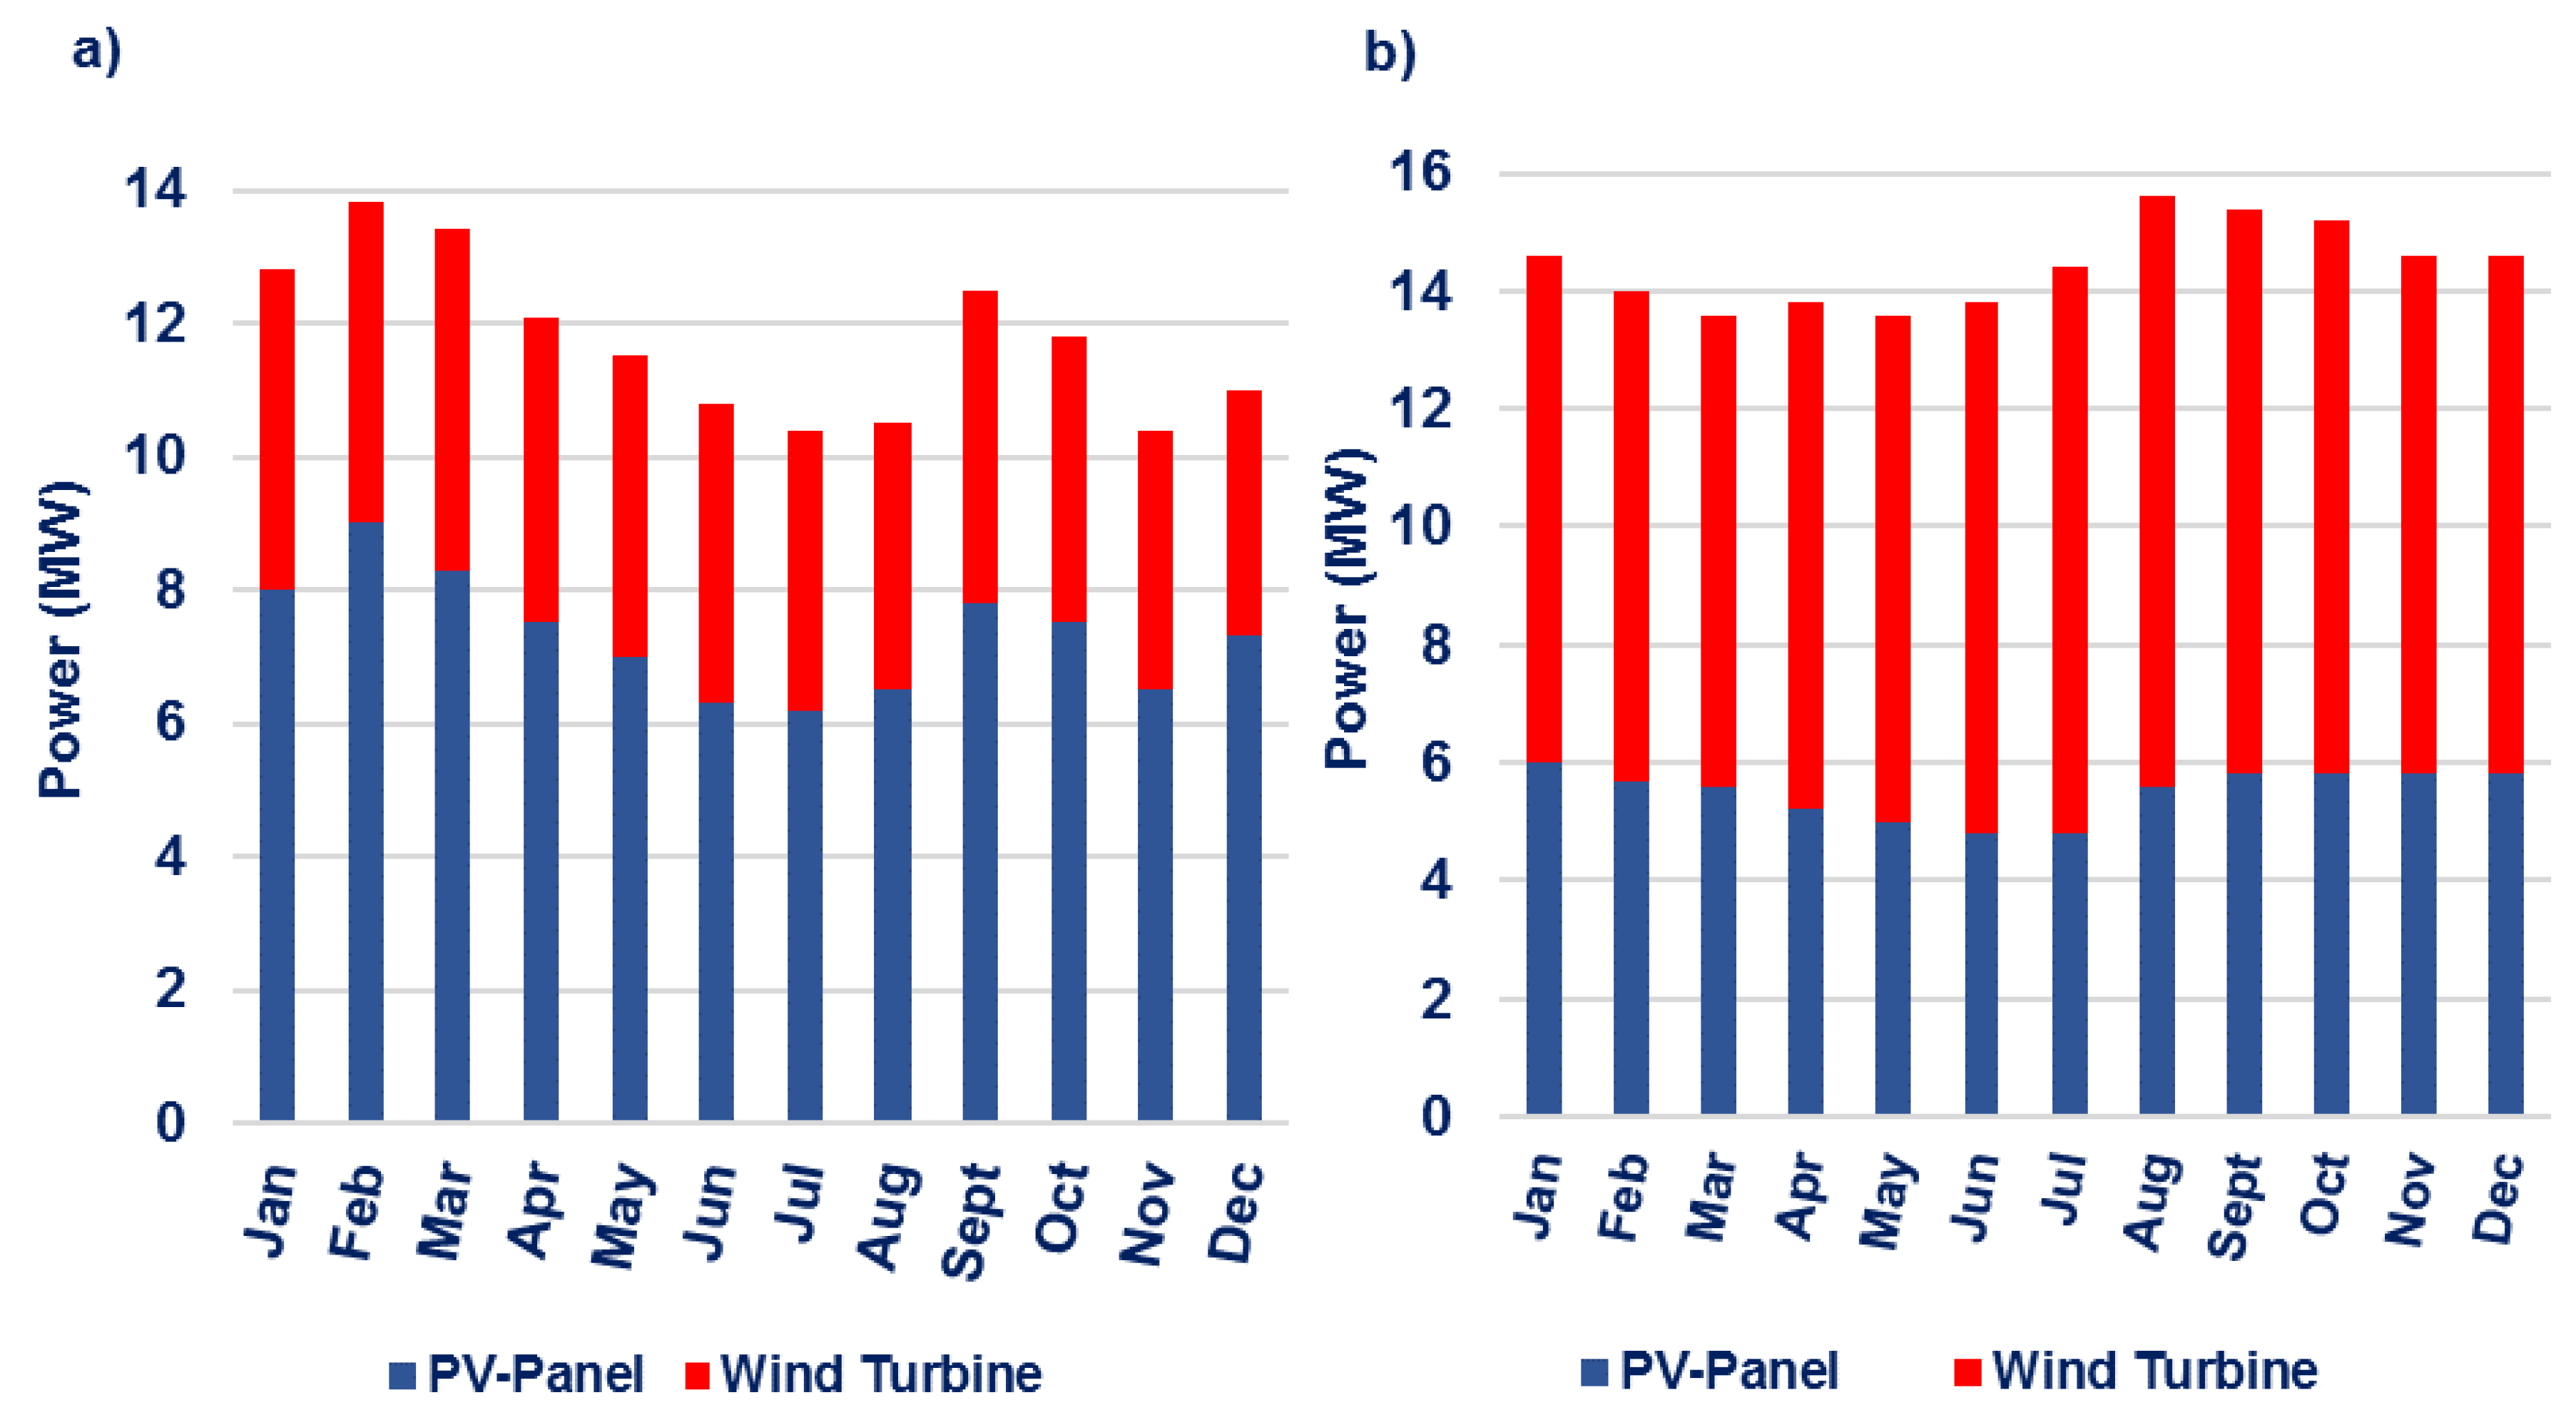
Figure 7, to the reduction of the number of batteries. To elaborate, the incorporation of the five wind turbines provides basically greater power provision and reliability to the existing solar power system due to the variability of the natural resources, and this, in turn, connotes less energy storage and, thus, lower battery capacity required. As it can be verified from
Figure 2 and
Figure 8, in the months of June and July, when the solar radiation is relatively not so high, wind power is capable of supplying approximately 30% of the required electricity. However, as the cost of batteries primarily dominates the NPC—44%, 59% and 74% of the NPC (without the contribution of the grid sales) of hybrid, wind and solar power systems, correspondingly—the penetration of the wind power is therefore highly dictated by this factor.
Regarding the standalone wind power system considered in the case of Kenya, the lower energy potential of the wind resource as to the solar one, as well as the relatively large operating reserve required for the given power system, result in both a high amount of wind turbines and required batteries, and, thus, the system turns into an unfavorable economic option. Nevertheless, the grid-connection has led to a significantly lower cost of energy when compared without grid-connection for all studied electricity generation systems since there is great amount of excess electricity that cannot be utilized by the system and, hence, operating costs are reduced remarkably. In essence, for the hybrid system, this consideration has resulted in negative operating and maintenance costs as shown in
Table 3b, practically denoting earnings rather than expenses, which can result in a faster payback period as compared to the other two examined power systems.
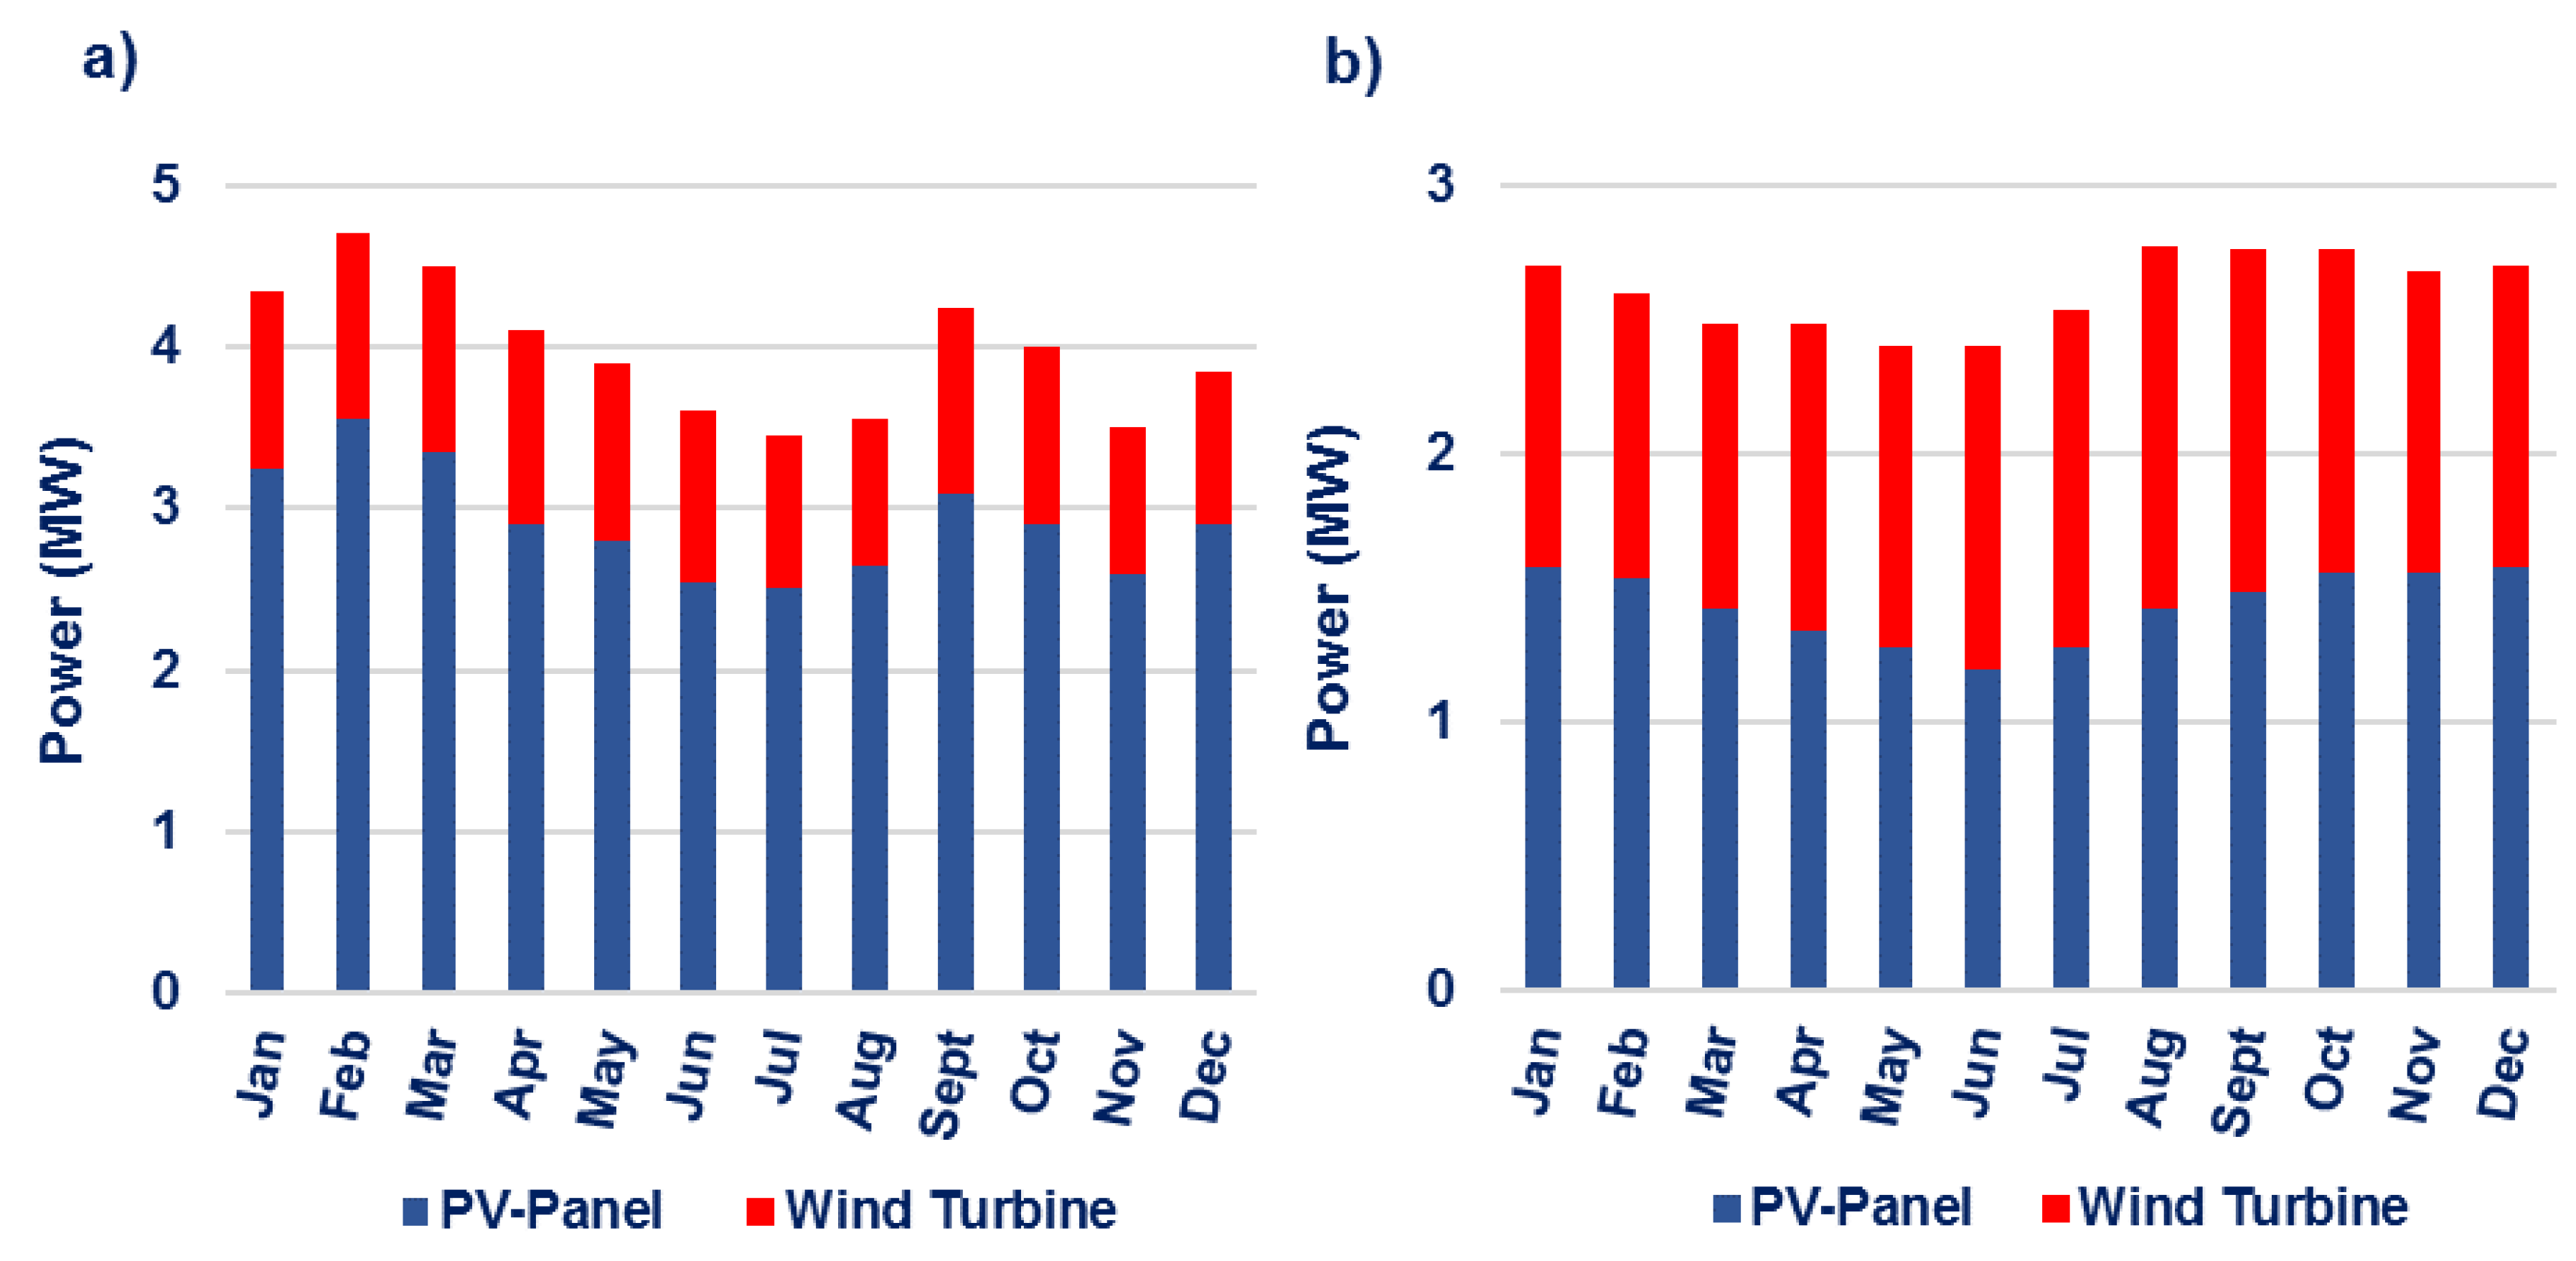
In the case of South Africa, the optimum power system based on the NPC is also the hybrid system with a value lower by 12% and 55% than the standalone solar and wind power systems, respectively. The penetration of the PV panels and wind turbines to the overall electricity production of the given system, as shown in
Figure 8, accounts for 55% and 45%, correspondingly. The large contribution of the wind resource is justified, in this case, by the higher wind speed prevailing in the selected country along with the comparable cost of the wind turbine to that of the solar panels. Nonetheless, in terms of the COE, the solar power system seems to outperform the hybrid one by 17% and the wind one by 8%. The latter fact actually connotes cost-competitiveness among the two standalone energy resources, which obscures the allocation of a clear economic advantage to one of them.
On a comparative basis, due to the improved solar and wind resource profiles, as well as the lower cost of the solar panels and wind turbines, the case of South Africa provides a better investment environment than that of Kenya for the renewable electricity generation systems examined in this study. For the latter location, the capital expenditures are higher by 37% for all power systems, whereas the COE shows an increase only for the solar and wind power systems by 52% and 61%, respectively. As far as the hybrid system examined in the case of Kenya is concerned, the lower COE can be attributed to the greater electricity production, which is reflected by the amount of the excess electricity, and the higher feed-in tariff.
3.2. Scenario B
Α similar profile to scenario A is also exhibited in scenario B for the case of Kenya with an increased number of components and higher capital investment, as practically expected due to the higher electrical load. In this case, it is remarkable that, in comparison with scenario A, solar and wind power systems demonstrate an increase in the cost of energy in the range of 4%–7%, whereas the hybrid one shows a decrease of 19%. This trend could be associated with the amount of excess electricity generated by the hybrid power system and the earnings with respect to the system operation and maintenance, which are approximately three times and six times higher, respectively, as to the corresponding power system in scenario A. Hence, lower costs that incur over the project lifetime are divided by a greater energy output, and, consecutively, lower cost of energy is yielded.
From
Figure 9, it can be inferred that the electricity produced from the hybrid system is allocated mainly to the solar panels by an overall percentage of 63%, and less to the wind turbines by 37%. The optimized configuration of the given power system is likely to have been determined principally by the total cost of the battery system, as its impact remains determinant on the NPC even in scenario B as can be concluded by
Figure 10, ranging from 32% to 70% for the examined power systems.
With respect to the case of South Africa, the best performing electricity generation system is the hybrid one with a penetration of 38% and 62% for the solar and wind energy sources, correspondingly. As compared to the standalone solar and wind power systems, the hybrid one demonstrates a NPC lower by 33% and 65%, respectively. Considering the similar cost of the major system components, the cost of the battery system is primarily responsible for determining the optimized configuration and the associated economic factors, as it can also be confirmed from
Figure 10. However, it is noteworthy that, among the standalone renewable power systems, the wind power system yields the lowest cost of energy, a fact that supports the aforementioned assertion regarding the cost-competitiveness of these two power systems.
Similar to scenario A, the case of South Africa outperforms the case of Kenya in terms of both NPC and COE of the examined power systems in the particular scenario. Based on previous discussion, the different potential and variability of the energy resources of each studied country, as well as the cost of the major system components, is the most dominant factor influencing the optimization procedure of each simulated renewable power system.
4. Conclusions
A primary feasibility study of an optimized renewable energy-based electricity system has been carried out for the small-scale plasma-assisted nitric acid plant as elaborated in a previous research work. Standalone solar, wind and hybrid (wind/solar) power systems have been considered for two electrical load scenarios. The modeling and optimization of the examined power systems have been implemented in the HOMER software based on the minimization of the NPC. The simulation results have shown for scenario A and the case of Kenya that the hybrid system is likely to be the best economical solution with a proposed configuration of 5 wind turbines of 1.5 MW capacity, 15,990 kW solar panels and 20 batteries. In the case of South Africa, the optimum with respect to the NPC power system is also the hybrid one, comprising 6633 kW solar panels, 3 wind turbines and 20 batteries. Similarly, for scenario B, the optimum economic system configuration for both studied locations is also the hybrid electricity system consisting, in the case of Kenya, of 40,000 kW solar panels, 21 wind turbines and 39 batteries, whereas, in the case of South Africa of 25,031 kW solar panels, 23 turbines and 34 batteries.
It is worth mentioning that, apart from the NPC, which is the main parameter against which the simulated power systems are optimized, the COE can also be a basis of decision-making for future investments. The selection of the best indicator depends merely on the investor’s particular investment criteria and goals. To exemplify, in the given study it has been observed that the COE does not necessarily follow the same trend as that of the NPC. In the case of South Africa, the standalone wind power system demonstrates lower COE value than that of the hybrid one for scenario A, a fact which also promotes the implementation of standalone wind power generation and emphasizes the idea of “Fertilizer Production by Wind” [
11].
In general, all optimized configurations of the studied renewable power systems may require a relatively high initial capital investment. However, there are certain parameters that serve as prime counterweights, such as the long-term environmental sustainability linked to the operation of such power systems, as well as the financial benefits associated with the reduction of atmospheric emissions, which have not been considered in this study. Perhaps, a stronger economic incentive can be the capitalization of existing or upcoming renewable energy parks in Kenya and South Africa [
21], which have demonstrated a proactive approach towards the establishment of “green” energy as the main electricity source.
In conclusion, the particular study gives primary insights on the size and economics of “green” power provision for the synthesis of nitric acid by plasma technology in a decentralized production mode. Since the given chemical process is of high importance in the context of Kenya’s and South Africa’s agriculture, the profitability of such investment on renewable energy sources should be thoroughly considered along with the possible long-term financial and societal benefits of the proposed small-scale plant. Last but not least, it is also very important to mention that, apart from the plasma-assisted nitric oxide, and, in turn, nitric acid production that has been presented so far from this research group, ammonia synthesis by means of non-thermal plasma and packed-bed catalysts (DBD reactor) is thoroughly investigated. However, as experiments are in progress, a comparative assessment of both plasma-assisted processes from an environmental and economic perspective will be provided at a later stage.


 ,
, 


