Development of Molecular Distillation Based Simulation and Optimization of Refined Palm Oil Process Based on Response Surface Methodology


1
Department of Chemical Engineering, Prince of Songkla University, Songkhla 90112, Thailand
2
Chemical Engineering Division, School of Engineering, University of Bradford, West Yorkshire BD7 1DP, UK
*
Author to whom correspondence should be addressed.
Processes 2017, 5(3), 40; https://doi.org/10.3390/pr5030040
Submission received: 1 June 2017
/
Revised: 3 July 2017
/
Accepted: 3 July 2017
/
Published: 16 July 2017
(This article belongs to the Collection Process System Engineering for More Efficient Power and Chemicals Production)
Abstract
:The deodorization of the refined palm oil process is simulated here using ASPEN HYSYS. In the absence of a library molecular distillation (MD) process in ASPEN HYSYS, first, a single flash vessel is considered to represent a falling film MD process which is simulated for a binary system taken from the literature and the model predictions are compared with the published work based on ASPEN PLUS and DISMOL. Second, the developed MD process is extended to simulate the deodorization process. Parameter estimation technique is used to estimate the Antoine’s parameters based on literature data to calculate the pure component vapor pressure. The model predictions are then validated against the patented results of refining edible oil rich in natural carotenes and vitamin E and simulation results were found to be in good agreement, within a ±2% error of the patented results. Third, Response Surface Methodology (RSM) is employed to develop non-linear second-order polynomial equations based model for the deodorization process and the effects of various operating parameters on the performance of the process are studied. Finally, an optimization framework is developed to maximize the concentration of beta-carotene, tocopherol and free fatty acid while optimizing the feed flow rate, temperature and pressure subject to process constrains. The optimum results of feed flow rate, temperature, and pressure were determined as 1291 kg/h, 147 °C and 0.0007 kPa respectively, and the concentration responses of beta- carotene, tocopherol and free fatty acid were found to be 0.000575, 0.000937 and 0.999840 respectively.
1. Introduction
Palm oil is consumed worldwide. It is known that edible palm oil is full of nutrients that contribute to daily energy needs. The general compositions of crude palm oil are 95% of triglycerides, 3%–5% of fatty acid and 1% of minor trace component (phytonutrient). Palm oil is rich in phytonutrients; it provides a valuable source of beta-carotene and tocopherol (vitamin E). Crude palm oil has carotenes concentration of 1000 ppm–3000 ppm [1]. The carotenes from palm oil are a source of pro-vitamin A and recent findings have demonstrated that beta-carotene is used to inhibit tumor progression and hence, reduces cancer formation in humans. The purpose of the refined palm oil process is to remove unwanted fatty acid and impurities. It can be classified as both chemical and physical refining method. However, the physical method is proven to be more effective compared to the chemical method in terms of food safety and environment [2]. The physical method consists of three processes; degumming, bleaching and deodorization. The pre-process of deodorization involves operation at a temperature higher than 200 °C at normal pressure. It is performed to remove odor from the oil and additional fat. It generally results in not only removing fatty acid but also destroying all carotenes. Most of the carotenes in palm oil are destroyed in the conventional refining process to produce a lighter color oil [3].
The molecular distillation (MD) technique is a viable process to recover carotene from the palm oil and is suitable for such high a value-added product [4]. It is an important thermal separation technology. Typical application involves high boiling substances mainly of temperature-sensitive compounds. The compounds are distilled at a pressure range from 1 atmosphere to high vacuum [5]. At this pressure the evaporation temperature will fall during the short residence time, hence, no thermal decomposition can occur. Due to pressure being low as vacuum sometimes, it is known as a vacuum distillation column. Mean free path has an effect on this separation process. The mean free path of MD column is longer than the distance of evaporator and condenser. As a result, the molecules reach the condensing surface without being swerved on collision of others foreign gas. The larger molecule size has a shorter mean free path. Therefore, MD separates substances by its molecular weight. The main objectives of this research are divided into four sections: (a) MD process development and validation for a binary system from literature; (b) Application of the MD process for palm oil deodorization and validation of the process against patented experimental data; (c) Design of experiment by Response Surface Methodology (RSM) leading to the development of non-linear equations based MD model for palm oil deodorization; and (d) Optimization of the deodorization process based on the non-linear equations developed in (c). Note, there are many prevalent applications of RSM in food science, chemical and biological engineering related to molecular distillation [6,7,8,9].
Optimization in engineering shows an important methodology to enhance the process rather than making decisions intuitively. Many techniques and algorithms, such as neural network, genetic algorithm, Monte Carlo, Excel solver and others have been successfully applied in various processes. Here, Excel solver has been used for optimizing the operation of the refined palm oil process. The simulation, design of experiment and optimization are presented and discussed in later sections.
2. Molecular Distillation Process: Modeling and Validation
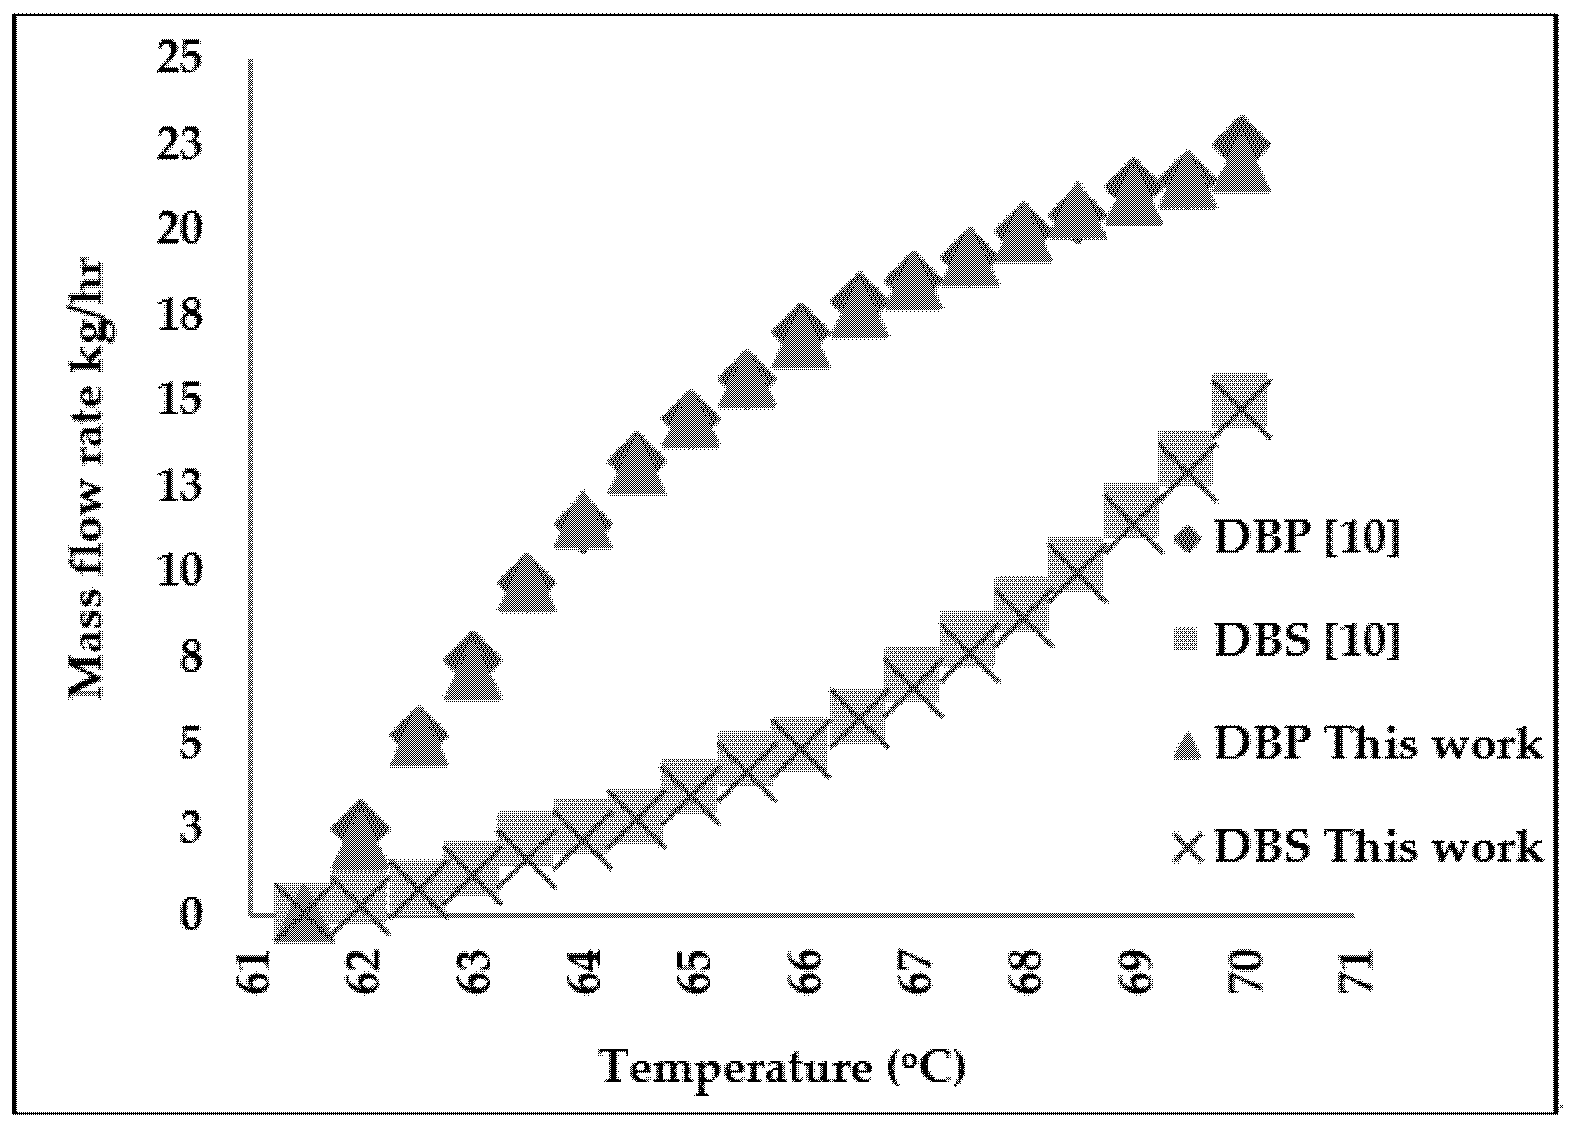
In this work, MD is used for the deodorization of palm oil. The objective of this section is to develop and simulate a molecular distillation process. Since there was no library model available in ASPEN HYSYS to simulate a falling film molecular distillation therefore, a simulation of single flash vessel was proposed to represent MD, as considered by other authors in previous studies [10]. In order to ensure that the simulation of MD in ASPEN HYSYS was valid, we referred to the study by the authors of [10] for the development of a computational tool for simulating MD process in oil refining using ASPEN PLUS and validation of the results against those predicted by DISMOL (a dedicated molecular distillation process simulator). In their study, an equi-molar mixture of Dibutyl phthalate (DBP) and Dibutyl sebacate (DBS) was fed to the flash process at pressure 0.133 Pa with an initial feed flow rate of 50 kg/h. Temperature was manipulated to achieve the same distillation mass ratio with DISMOL simulator (0.2120). Their ASPEN PLUS results are shown in Figure 1 and Figure 2 together with the results of this work, which used ASPEN HYSYS with Redlich Kwong Soave with Wong Sandler mixture rules (RKSWS) for the calculation of thermo-physical properties.
The plotted data between ASPEN PLUS and ASPEN HYSYS seem to be in very good agreement. In order to achieve the same distillation mass ratio obtained by DISMOL, the flash equipment for ASPEN PLUS and ASPEN HYSYS had to operate at a temperature of 63.1 °C and 63.5 °C respectively. Both temperatures result in higher molar fraction of DBP in distillate and lower DBP at residue. Equation 1 was proposed by the authors of [10] to transform the flash result into MD. The efficiency factor is multiplied with the molar fraction for DBP at distillate and DBP molar fraction at residue before mass balance equations are solved.
The results are summarized in Table 1. It is clear that the predictions of ASPEN HYSYS are close to that of ASPEN PLUS in terms of temperature and close to DISMOL in terms of Residue DBP molar fraction. In terms of distillation of DBP molar fraction, both ASPEN PLUS and ASPEN HYSYS predictions are within ±2% of that predicted by DISMOL. Thus, the developed flash process within ASPEN HYSYS can be applied to any MD process, such as the palm oil deodorization process considered in this work.
3. Refined Palm Oil Deodorization Process Simulation by ASPEN HYSYS
The MD process model developed and validated in Section 2 is now used for the simulation of the deodorization of refined palm oil process in ASPEN HYSYS. Figure 3 shows the MD process for deodorization in refined palm oil. The operation is carried out at a high vacuum pressure between 5 × 10⁻⁴ and 8 × 10⁻⁴ kPa, at a temperature of 175 °C–180 °C and a feed flow rate between 250 and 2000 kg/h [11]. The vapor pressure estimations and the simulation of refined palm oil are discussed below.
3.1. Vapor Pressure Estimation
To design and simulate a molecular distillation, thermo-physical properties, vapor pressure of each component and the thermodynamic model are all required. This process used Redlich Kwong ASPEN (RK-Aspen) as a thermodynamic model or property method to calculate physical properties. The RK-Aspen is an equation of state model (EOS) that is good for vapor phase modeling with fewer binary parameters required and is consistent in critical region [12].
The feed stream of the process consists of five main components: tripalmitin triolein, oleic acid, tocopherol and beta-carotene. The mass fraction of each component is shown in Table 2. For a multicomponent system, it was not an easy task to calculate molar fraction by use of mass and component balances in an underdetermined situation. Consequently, thermodynamic properties and vapor pressure or pure component parameters for Antoine equations are required, and must be established.
The thermo-physical properties are introduced in the simulation in terms of physical properties such as boiling point (TB), critical temperature (TC), critical pressure (PC), acentric factor (ω) and liquid molar volume (Vl20) for each component, and can be seen in Table A1 in the Appendix, as accomplished by Lim et al. [13]. Equation (2) refers to an extension of the Antoine equation from Lim et al.’s work, and its parameters are shown in Table 3. However, the equation available in ASPEN HYSYS is shown in Equation (3). Therefore, the parameters of the Antoine equation used in this study were obtained by minimizing the least square error of Equation (4) through Solver Add-in, in Microsoft Excel and Matlab optimization.
where A, B, C, D and E are the Antoine Parameters. P is the vapor pressure in kPa, and T is temperature in K.
where S is sum of the squared error, m is the number of experimental data point within the temperature range of 373 K–503 K, is the calculated vapour pressure obtained from Lim et al.’s work [13] using Equation (2) and is the expected vapour pressure in Equation (3) (as available in ASPEN HYSYS). The pure component parameters for modified Antoine equation (Equation (3)) and coefficient of determination (R2) of each component are summarized in Table 4. The coefficient of determination was calculated by regression data analysis in Microsoft Excel between the correlation of lnPcalc and lnPexp as Equation (5).
where and are the observed values of the dependent variable, mean or average and fitted values, respectively.
lnPcalc = A1 − B1/T + C1T + D1·lnT + E1T6
lnPexp = A2 + B2/(T + C2) +D2·lnT + E2T6
3.2. Refined Palm Oil Deodorization Process Simulation and Validation
The main task of this part is to simulate, validate, and compare the performance of molecular distillation with 4 experiments reported in the patent of refining of edible oil rich in natural carotene and vitamin E [11]. The distillation mass ratio for the process was 0.036. The MD process was simulated, and prediction error of the simulations is shown in Table 5.
4. RSM-Based Process Model
While we could use the ASPEN HYSYS based process model developed in Section 3 for further simulation and optimisation, here, we have decided to develop a Response Surface Methodology (RSM)-based process model and we resort to Design of Experiments (DoE). Like many authors [14,15] who have considered process simulator as an alternative to real process experiments and applied RSM on the simulated data in the past, we assume the ASPEN HYSYS based MD process described in Section 3 as the real process for the deodorization of refined palm oil.
The design of experiment (DoE) consists of three stages which are (i) screening methodology (preliminary research) to identify the vital factors, (ii) response surface methodology and (iii) model validation. The screening method is to detect factors that impact the process. In preliminary research for molecular distillation [6,7,8,9], it is found that temperatures at feed container, temperature at condenser and rotation speed of the design are the factors that had effects on the concentration of beta-carotene, tocopherol and free fatty acid. Therefore, these parameters are kept constant. Both temperatures at feed container and at condenser are fixed at 150 °C. In this work, the feed flow rate, column pressure and column temperature are manipulated for further investigation of the process.
RSM with Central Composite Design (CCD) is applied to develop, and obtain a quadratic model. The CCD consists of three portions which are the fraction of 2k factorial design (level are coded as 1 and −1), 2k axial portion and the number of center point. In this case, the least number of 3 center points is used. Therefore, the design contained a total of 17 simulation runs according to Equation (6) [16]:
where N is the number total runs, k is independent variable, n0 is number of center points.
N = 2k + 2k + n0
The feed flow rate (x1), distillation temperature (x2), and pressure (x3) were independent variables. These three variables are used and assumed to influence the responses of beta-carotene concentration (y1), tocopherol concentration (y2) at residue stream and free fatty acid (oleic acid) concentration (y3) in the distillate stream.
In CCD, the axial value is set as 0.59. High value and low value are coded as 1 and -1 respectively while 0 was the center point code [17]. The coded values and its design range are shown in Table 6 and Table 7 respectively. Those values are coded according to the following Equations (7)–(9) [17].
where Xi and xi are coded and actual values of variable i, respectively; and subscript i are 1 = feed flow rate, 2 = column temperature and 3 = column pressure, and H, L are highest and lowest values.
The regression analysis of the responses is fitted with non-linear second-order polynomial equation represented by Equation (10):
where y is the responses, is constant number, and are coefficients for the linear, quadratic and interaction, respectively.
Table 8 shows the experimental (simulated by MD process described in Section 3) results for 17 runs of independent variables with respect to responses: (y1), (y2) and (y3). The regression coefficient value for linear, quadratic and interaction are shown in Table 9.
4.1. The Effect of Feed Flow Rate on Responses
The results of feed flow rate on the responses of beta-carotene (y1), tocopherol (y2) and FFA (y3) are investigated at a temperature of 150 °C and pressure of 5.05 × 10⁻⁴ kPa (run No. 2 and 3). Decreasing the feed flow rate from 1500 to 1000 kg/h at constant temperature and pressure does not make any changes to the responses. The contour plots and response surface curves in Figure 5, Figure 6 and Figure 7, reveal that the feed flow rate does not show significant deviation on responses.
4.2. The Effect of Temperature on Responses
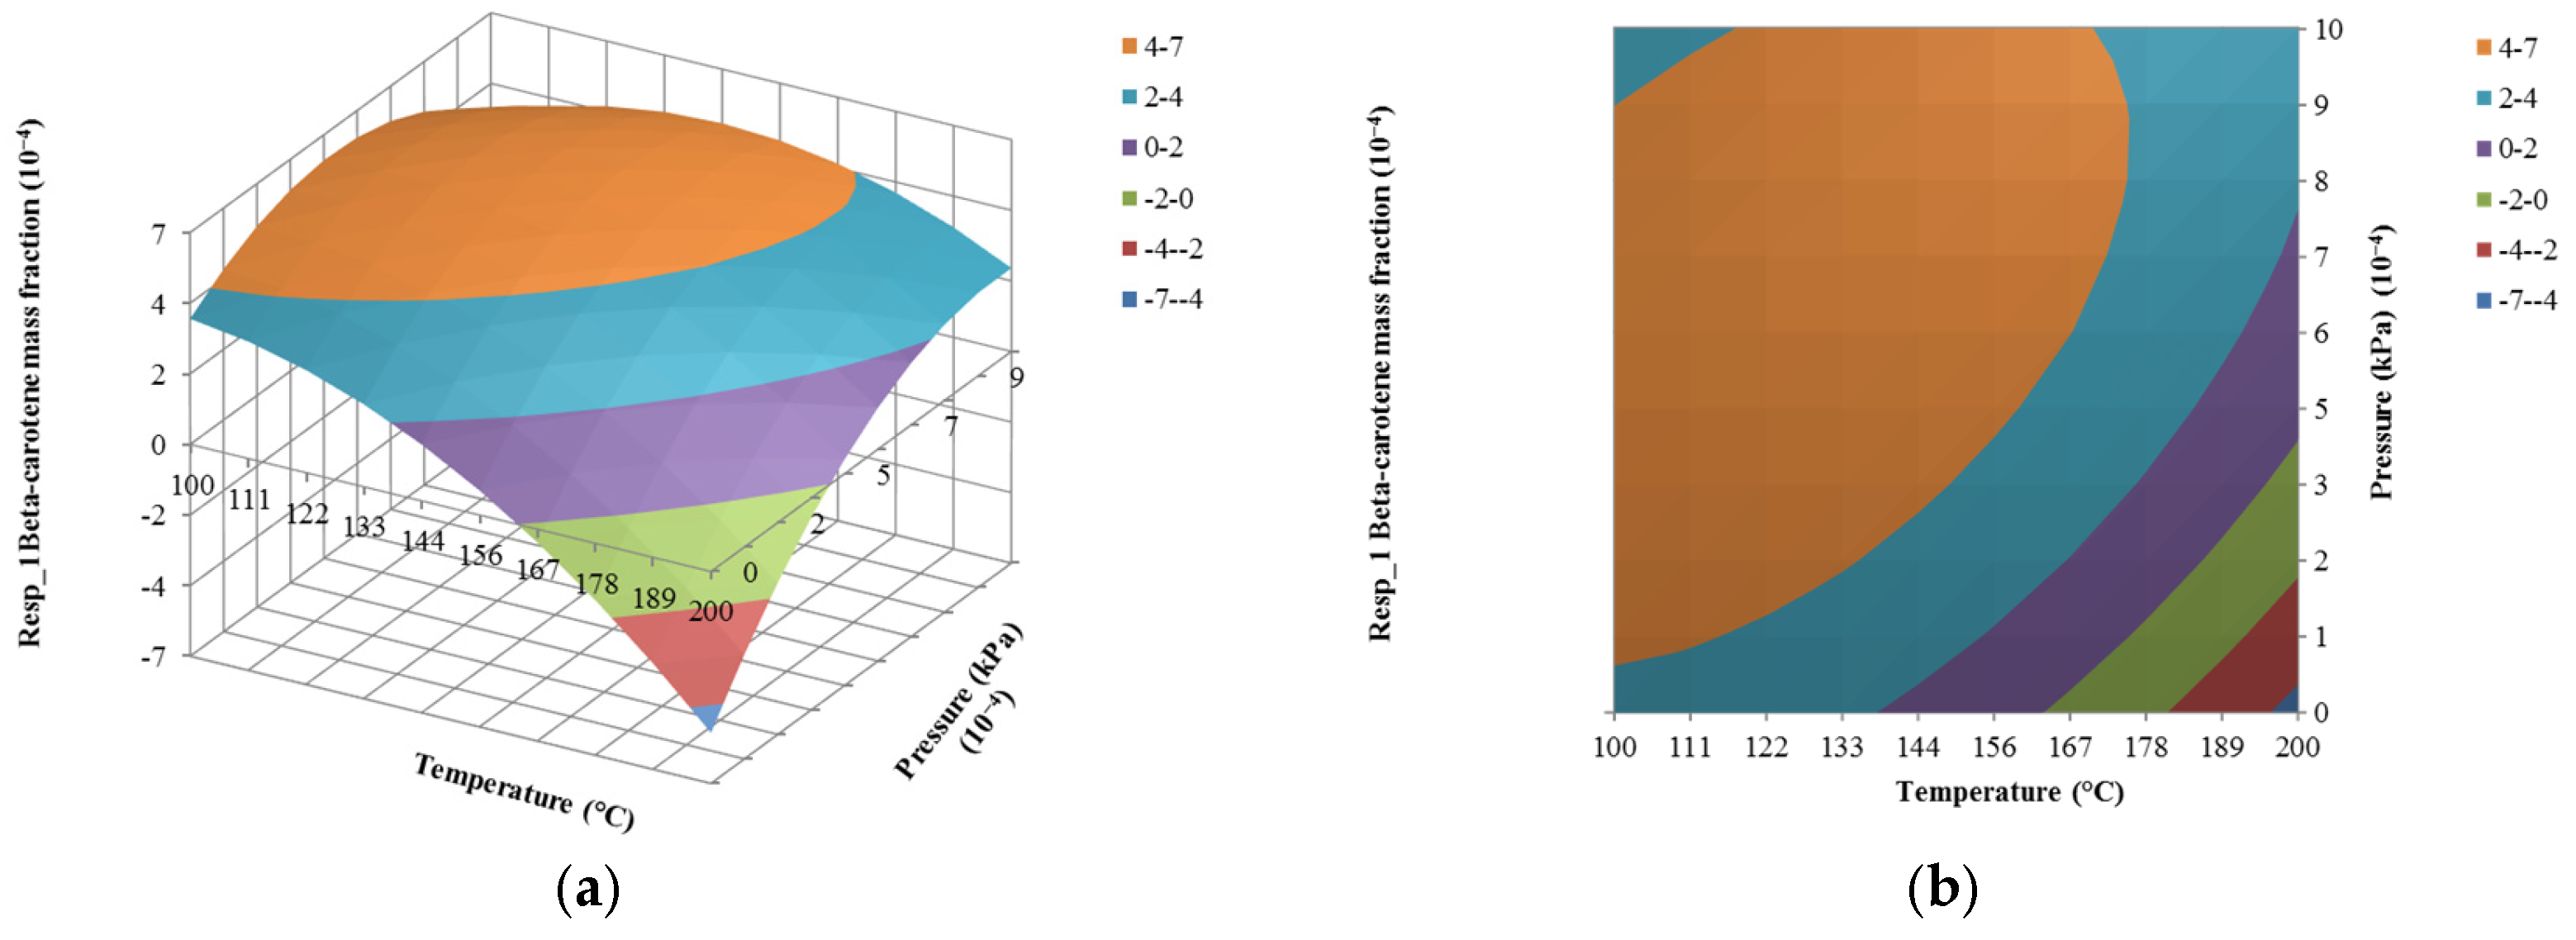
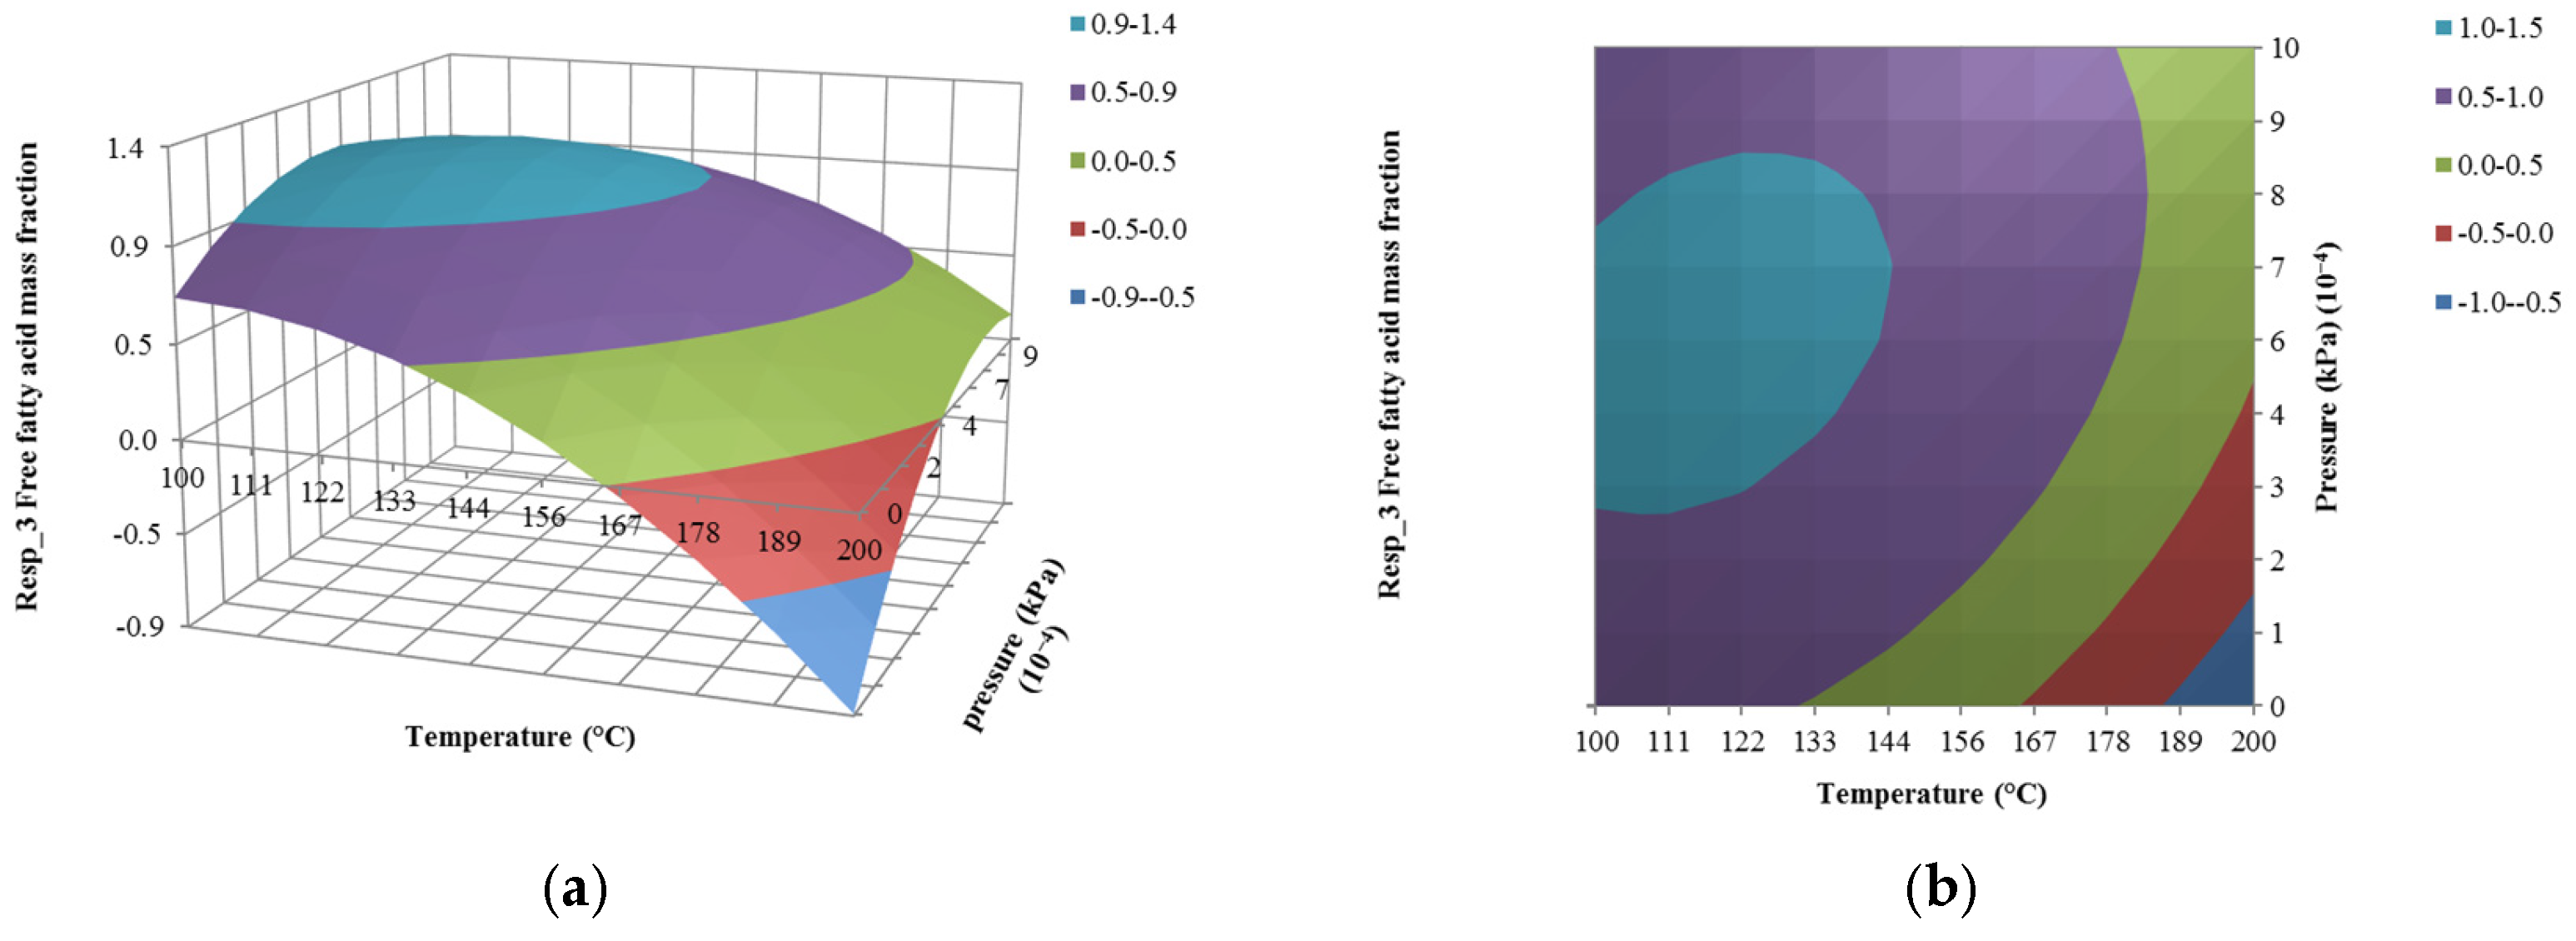
Concentration of beta-carotene, tocopherol and FFA as a function of temperature are investigated at constant feed flow rate and pressure at 1500 kg/h and 5.05 × 10⁻⁴ kPa respectively (run no. 4 and 5). In Figure 8, Figure 9 and Figure 10, the temperature shows significant deviation in the responses of beta-carotene (y1), tocopherol (y2) and FFA (y3). It can be clearly seen that, the concentrations of the responses decrease with increasing the distilling temperature. According to the Clauses Clapeyron relation, the vapor pressure of substance increases non-linearly with temperature. Therefore, increasing temperature (Equation (11)) will increase mean free path which will lengthen the average distance of traveling molecule reaching the condensation board. The longer the distance of molecule travels the higher the rate of vaporization of molecule. As a result, low concentration of beta-carotene and tocopherol are found in the residue and low concentration of free fatty acid is found in the distillate.
4.3. The Effect of Pressure on Responses
The effect of pressure on responses (composition of beta-carotene, tocopherol and FFA) is investigated at feed flow 1500 kg/h and at temperature of 150 °C (run no. 1, 2, 7 and 15). The responses are found to increase with the increase of pressure, as can be seen in Figure 8, Figure 9 and Figure 10. In agreement with the theory of mean free path for molecular distillation as shown in Equation (11), increasing the pressure will reduce the mean free path, which shortens the average distance of molecules reaching the condensation board. The shorter the average distance of traveling molecule the lesser the vaporization of molecule. Consequently, high concentration of beta-carotene and tocopherol are achieved at residue stream which consequently increase the free fatty acid concentration at the distillate.
where λ is the mean free path, R is gas constant, d is molecular diameter NA is Avogadro’s number and P is the pressure.
The independent variables and responses are fitted by the following second order polynomial Equations (12)–(14) which show complex relationships between the independent variables and the responses. In addition, term constants of x1, x1x2, and x1x3 are not considered in this case due to the insignificant effect to the responses.
y1 = 5.25 × 10⁻⁴ − 2.49 × 10−4x2 + 1.83 × 10−4x3+2.42 × 10−5x12 − 1.88 × 10−4x22 − 2.15 × 10−4x32 + 2.07 × 10−4x2x3
y2 = 8.60 × 10⁻⁴ − 4.12 × 10−4x2 + 2.92 × 10−4x3 + 3.54 × 10−5x12 − 3.31 × 10−4x22 − 3.56 × 10−4x32 + 3.38 × 10−4x2x3
y3 = 9.15 × 10⁻¹ − 5.34 × 10−1x2 + 2.69 × 10−1x3 − 1.63 × 10−3x12 − 3.74 × 10−1x22 − 3.91 × 10−1x32 + 2.50 × 10−1x2x3
The R2 value of responses, concentration of beta-carotene, tocopherol and FFA are 0.959, 0.961 and 0.951 respectively, show a very good fit. The nonlinear Equations (12)–(14) now represent the MD process model which will be used for optimizing the process in the next section.
It is observed that the response surface curves of beta-carotene, tocopherol and FFA concentration display a similar relationship with respect to independent variables. The concavity of the curves shows the optimum point of each of the responses. However, those concavities are not high enough to indicate the visually maximum point of responses.
5. Optimization of MD for Refined Palm Oil Process
In this section the aim is to find the optimum operating parameters that will maximize the concentration of beta-carotene, tocopherol at the residue and concentration of FFA at the distillate stream. The mathematical model (Equations (12)–(14)) and the objective function have been written in Equation (15). This work is more concerned with the enhancement of concentration of beta-carotene and tocopherol as 70%, than it is with reducing the concentration of free fatty acid. Therefore, in the objective function, different weighting was applied by a factor of 0.7 in y1, y2 and 0.3 for y3. The optimization variables are feed flow rate, temperature and pressure. Lower and upper bounds for variables are specified between a valid lower and upper bound. The actual (re-scaled) upper bound and lower bound is shown in the Table 10.
Maximize: f(x) = 0.7(y1 + y2) + 0.3y3
Subject to: h(x) = 1000 ≤ x1 ≤ 2000, 100 ≤ x2 ≤ 200, 0.00001 ≤ x3 ≤ 0.001, 0≤ y1 ≤ 1, 0 ≤ y2 ≤ 1, 0 ≤ y3 ≤ 1.
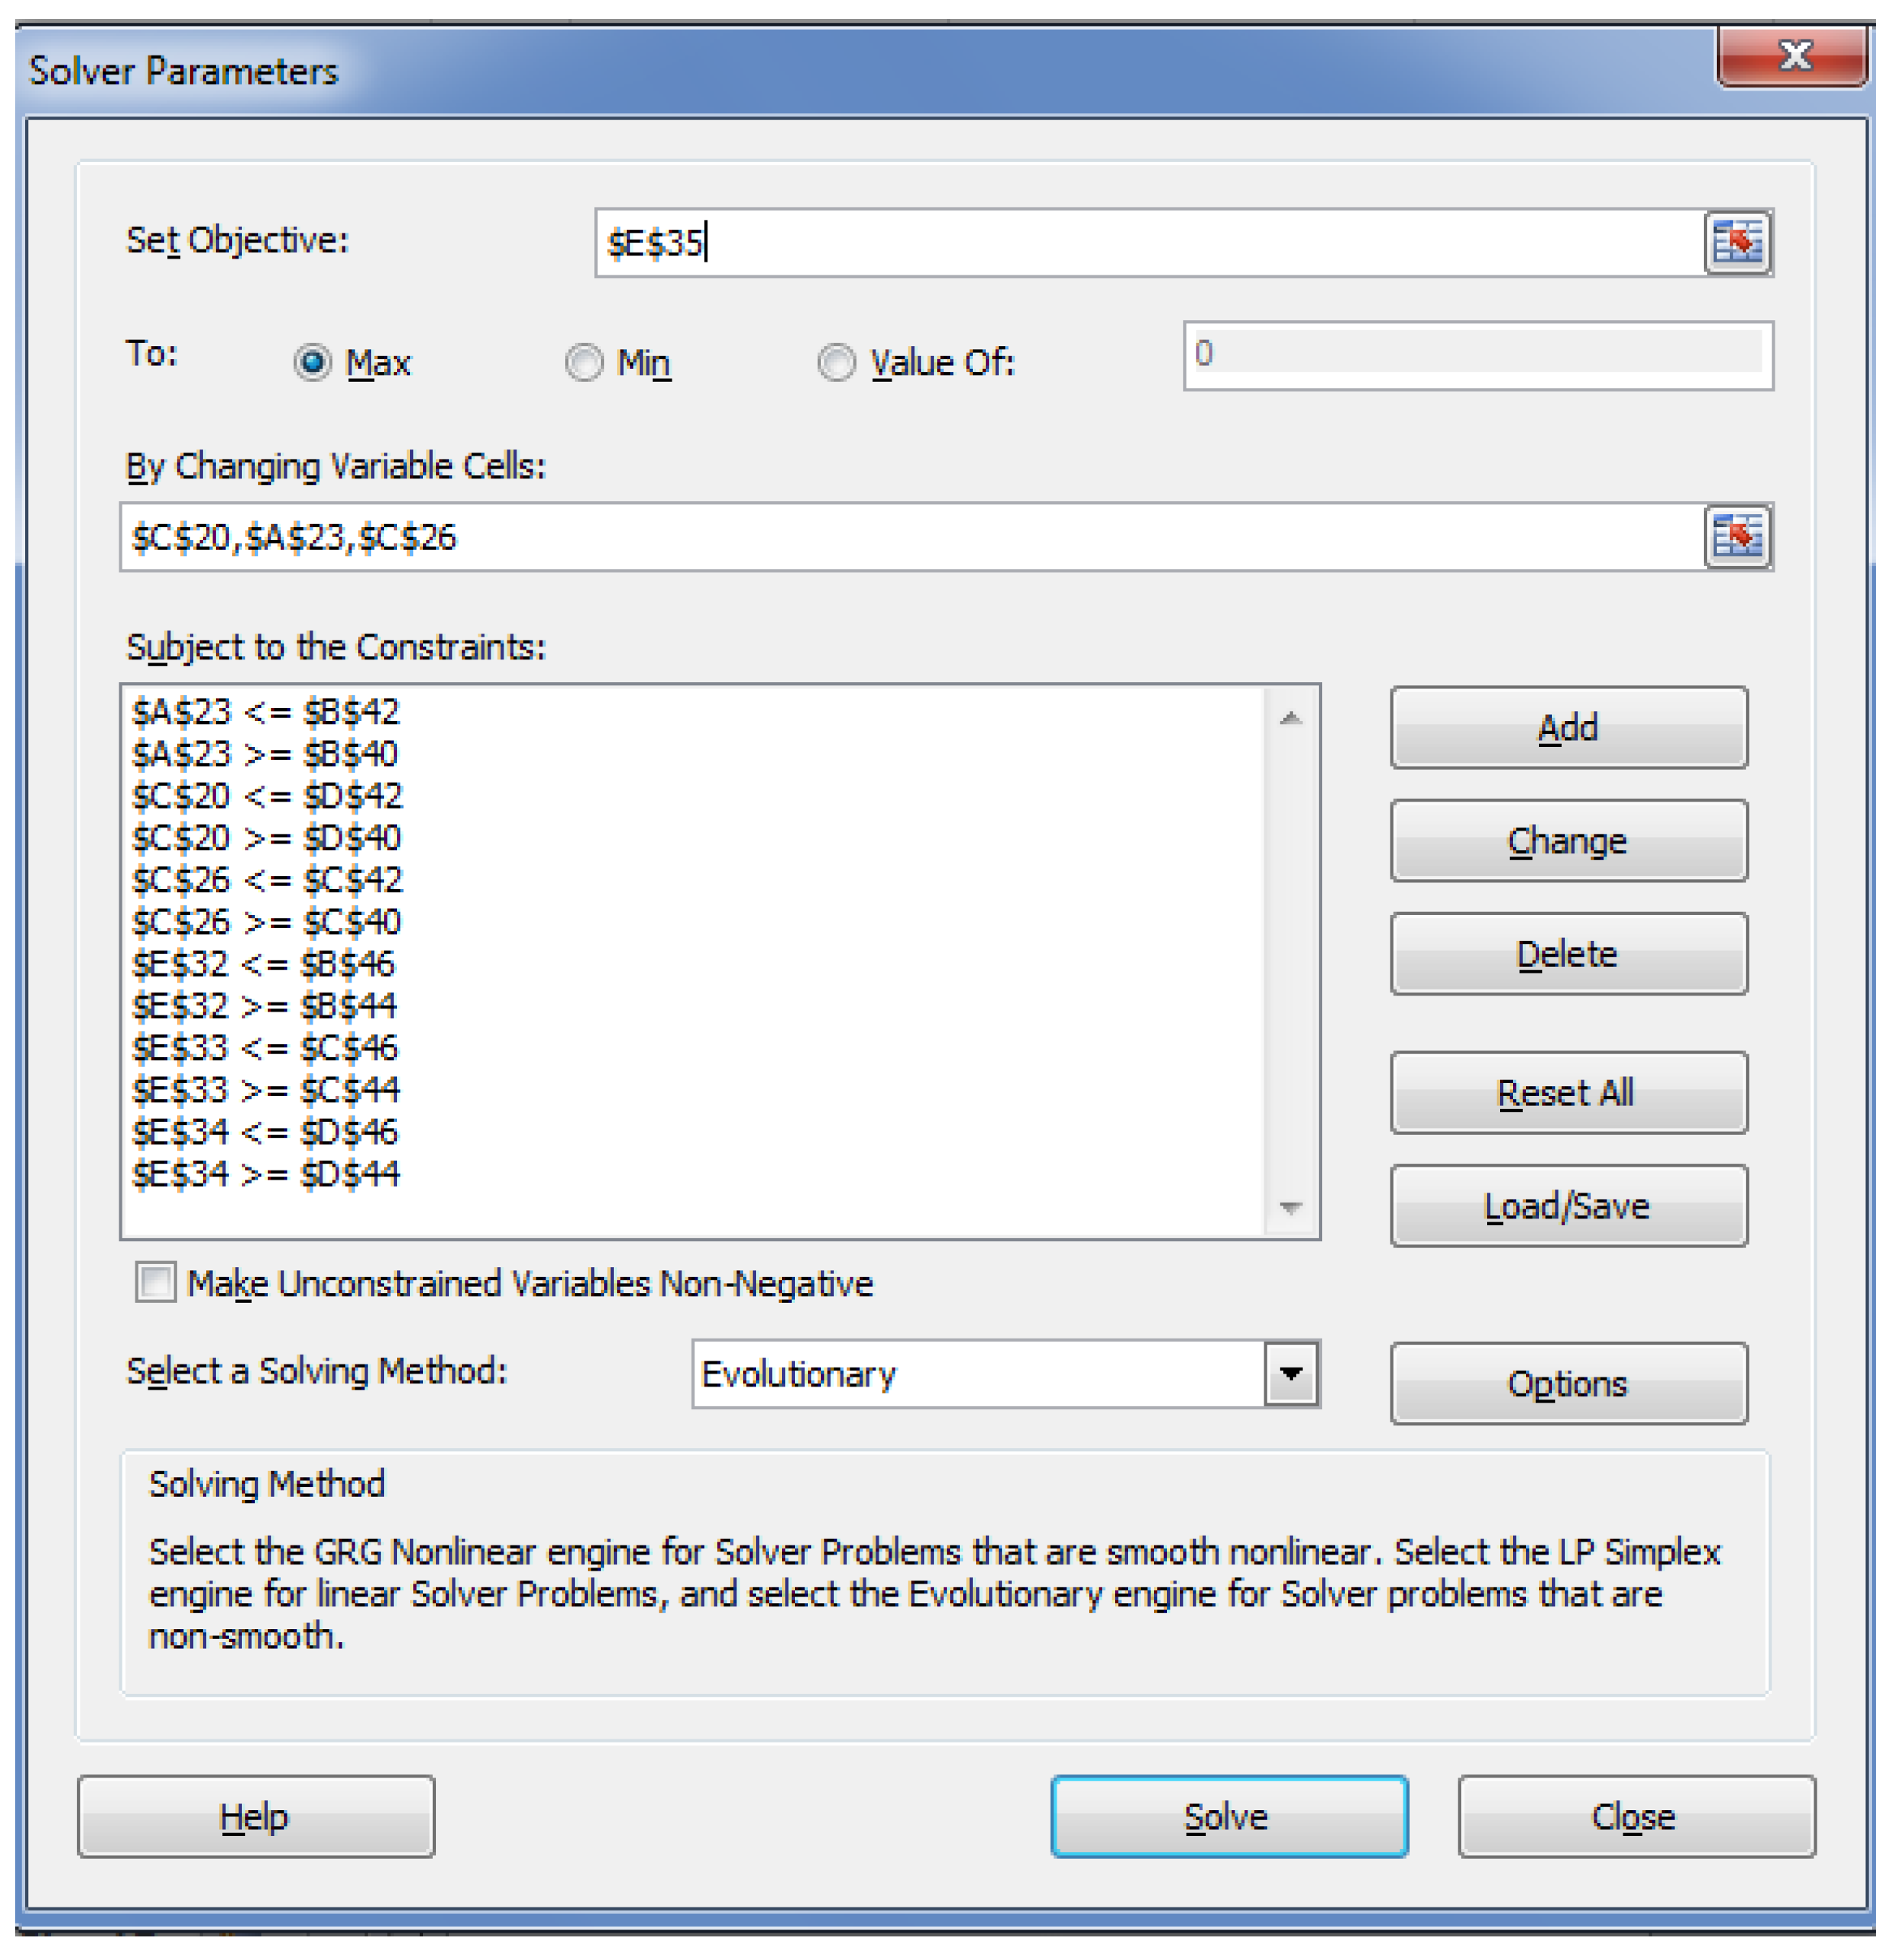
Solver in Microsoft Excel is an efficient tool to solve both equality and inequality constrained non-linear optimization problem [18]. An Excel worksheet for optimization is prepared as shown in Figure A1. The objective function is set to target cell for maximization by changing the independent variables (refer to Figure A2). Initial value for feed flow rate, temperature and pressure were set as 1500 kg/h, 150 °C and 0.00055 kPa, respectively. The solution method used for this work is evolutionary; it is for solving a non-smooth non-linear equation. The optimum results of x1, x2 and x3 were found to be 1291 kg/h, 147 °C and 0.0007 kPa, respectively, and the corresponding responses of y1, y2 and y3 were 0.000575, 0.000937 and 0.999840, respectively.
Lastly, model validation is performed to ensure that data inserted into simulation satisfied the prediction. ASPEN HYSYS is simulated using the optimum operating conditions. The responses are shown in Table 11 and regression statistic of model and simulation is shown in Table 12. Clearly, the model equations developed from RSM can be used for predicting responses of the deodorization process.
6. Conclusions
Simulation and optimization of the refined palm oil process has been considered in this work. A single flash vessel model is developed in ASPEN HYSYS to represent Molecular Distillation (MD) of the refined palm oil process, which has been validated with experimental results from the literature with prediction efficiency errors of less than 3%. Response surface methodology with central composite design was then applied to design of experiments with the validated ASPEN HYSYS model to investigate the effects of feed flow rate, temperature and pressure on concentration of beta-carotene, tocopherol and free fatty acid (FFA) in the MD. The results show that response surface curves of beta-carotene, tocopherol and FFA displayed a similar relationship with respect to temperature and pressure. The result suggested that temperature and pressure and their interaction significantly influences the responses of beta-carotene, tocopherol and FFA, while feed flow rate and their interaction less significantly affected by the responses of beta-carotene, tocopherol and FFA. Finally, the process optimization through Excel solver was carried out using RSM equations, and the optimum operating parameters of MD for refined palm oil process were obtained. These parameters are feasibly suitable for refined palm oil in industrial manufacturing.
Acknowledgments
The authors would like to acknowledge the Prince of Songkla University, Songkhla, Thailand for providing financial support (Grant code: PSU2554-022) for research work.
Author Contributions
This research was carried out in collaboration of all authors. Noree Tehlah performed the simulation and wrote the manuscript. Pornsiri Kaewpradit and Iqbal M. Mujtaba supervised statistical analysis, analysed results, oversaw and approved the final manuscript.
Conflicts of Interest
The authors declare no conflict of interest.
Appendix

Table A1.
Physical properties of pure components in palm oil, reproduced with permission from [13]. Copyright Springer, 2003.
Table A1.
Physical properties of pure components in palm oil, reproduced with permission from [13]. Copyright Springer, 2003.
| Component | TB (K) | TC (K) | PC (kPa) | ω | Vl20 (m3/kmol) |
|---|---|---|---|---|---|
| Tripalmitin | 864.21 | 947.10 | 396.82 | 1.6500 | 0.8906 |
| Triolein | 879.92 | 954.10 | 360.15 | 1.8004 | 0.9717 |
| Oleic acid | 646.52 | 813.56 | 1250.2 | 0.8104 | 0.3172 |
| Tocopherol | 794.52 | 936.93 | 838.45 | 1.1946 | 0.4533 |
| Beta-carotene | 908.58 | 1031.1 | 678.41 | 1.6255 | 0.5348 |
Figure A1.
The solver Excel spread sheet.
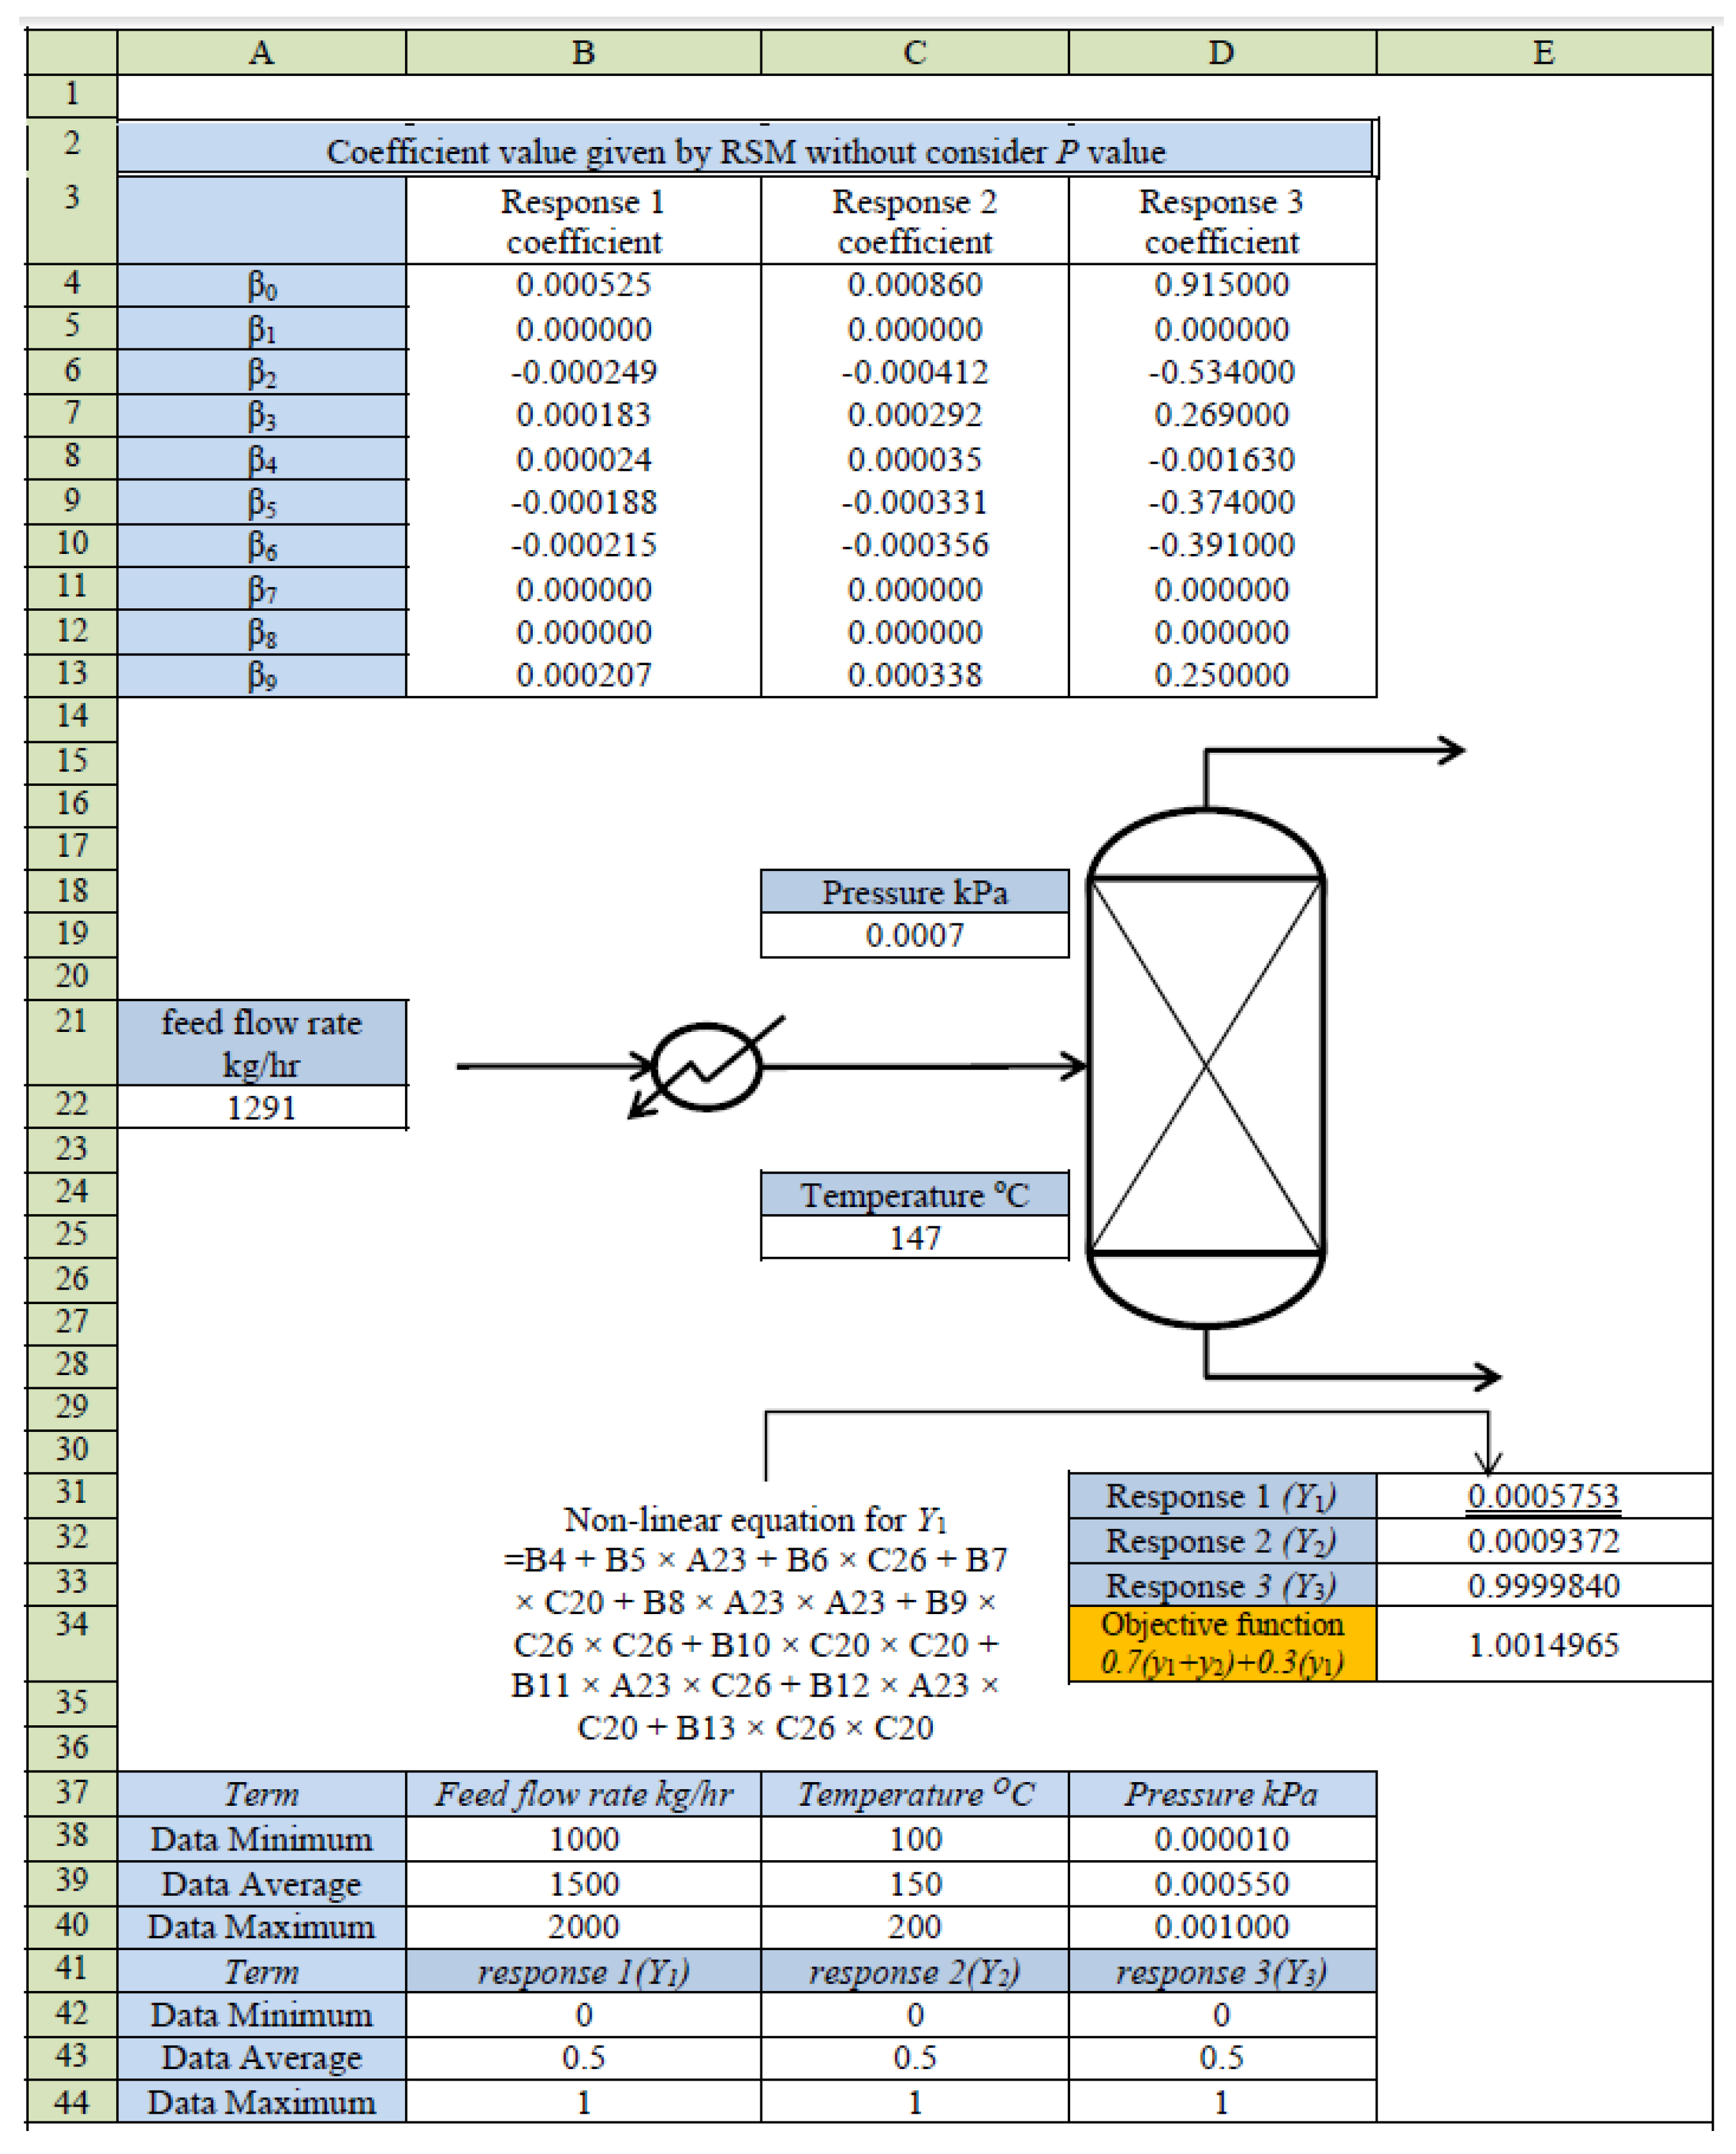
Figure A2.
The solver parameters.

References
- Nagendran, B.; Unnithan, U.R.; Choo, Y.M.; Sundram, K. Characteristics of red palm oil, a carotene and vitamin E rich refined oil for food uses. Food Nutr. Bull. 2000, 21, 189–194. [Google Scholar] [CrossRef]
- Rohani, O.; Sharifah, S.A.; MohdRafii, Y.; Ong, M.; Tarmizi, A.H.; Zamzuri, I. Advances in oil palm Research. Adv. oil palm res. 2000, 1, 238–331. [Google Scholar]
- Batistella, C.B.; Maciel, M.R.W. Recovery of caroteniods from palm oil by molecular distillation. Comput. Chem. Eng. 1998, 22, 53–60. [Google Scholar] [CrossRef]
- Huang, H.-J.; Ramaswamy, S.; Tschirner, U.W.; Ramarao, B.V. A review of separation technologies in current and future bio refineries. Sep. Purif. Technol. 2008, 62, 1–21. [Google Scholar] [CrossRef]
- Casilio, D.; Dunford, N.T. Nutritionally Enhanced Edible Oil and Oilseed Processing; AOCS Press: Champaign, IL, USA, 2004; pp. 178–192. [Google Scholar]
- Chen, F.; Cai, T.; Zhao, G.; Liao, X.; Guo, L.; Hu, X. Optimization conditions for the purification of crude octacosanol extract from rice bran wax by molecular distillation analyzed using response surface methodology. J. Food Eng. 2004, 70, 47–53. [Google Scholar] [CrossRef]
- Jiang, S.T.; Shao, P.; Pan, L.J.; Zhao, Y.Y. Molecular distillation for recovering tocopherol and fatty acid methyl ester from rapeseed oil deodorizer distillate. Biosyst. Eng. 2006, 93, 383–391. [Google Scholar] [CrossRef]
- Wu, W.; Wang, C.; Zheng, J. Optimization of deacidification of low calorie cocoa butter by molecular distillation. Food Sci. Technol. 2011, 46, 563–570. [Google Scholar] [CrossRef]
- Zhang, G.; Liu, J.; Liu, Y. Concentraton of omega 3 polyunsaturated fatty acid from oil of schizochytrium limacinum by molecular distillation: Optimization of techonological condition. Ind. Eng. Chem. Res. 2013, 52, 3918–3925. [Google Scholar]
- Mallmann, E.S.; Costa, C.B.B.; Maciel, M.R.W.; Filho, M.R. Development of a Computational Tool for simulating falling film molecular design. Comput. Aided Chem. Eng. 2009, 26, 743–748. [Google Scholar]
- Unnikrishnan, R. Refining of Edible Oil Rich in Natural Carotenes and Vitamin E. United State Patent 6,177,114 B1, 23 January 2001. [Google Scholar]
- Aspen Technology Aspen Plus User Guide. Available online: https://web.ist.utl.pt/ist11038/acad/Aspen/AspUserGuide10.pdf (accessed on 7 July 2017).
- Lim, C.S.; Manan, Z.A.; Sarmidi, M.R. Simulation Modeling of the Phase Behavior of Palm Oil-Supercritical Carbon Dioxide. JAOCS 2003, 80, 1147–1156. [Google Scholar] [CrossRef]
- Kalil, S.J.; Mauger, F.; Rodrigues, M.I. Response Surface Analysis and Simulation as a Tool for Bioprocess Design and Optimization. Process Biochem. 1999, 35, 539–550. [Google Scholar]
- Wang, H.; Cui, X. Response Surface Optimization of the Operating Parameters for a Complex Distillation Column Based on Process Simulation. Energy Procedia 2012, 16, 571–578. [Google Scholar] [CrossRef]
- Khuri, A.I.; Siuli, M. Response Surface Methodology; John Wiley & Sons: New York, NY, USA, 2010. [Google Scholar]
- Elhameh, N. Optimal of Gasoline Vacuum Layer Using Response Surface Methodology. Chem. Eng. Technol. 2013, 37, 229–239. [Google Scholar]
- Arora, J.S. Chapter 6 Optimum Design with Excel solve. In Introduction to Optimum Design; Elsevier Inc.: Amsterdam, The Netherlands, 2012; pp. 213–273. [Google Scholar]
Figure 1.
Comparison of distillated mass flow rate in study [10] and this work as a function of flash vessel operating temperature (°C).
Figure 1.
Comparison of distillated mass flow rate in study [10] and this work as a function of flash vessel operating temperature (°C).

Figure 2.
Comparison of distillate mole fraction in study [10] and this work as a function of flash vessel operating temperature (°C).
Figure 2.
Comparison of distillate mole fraction in study [10] and this work as a function of flash vessel operating temperature (°C).
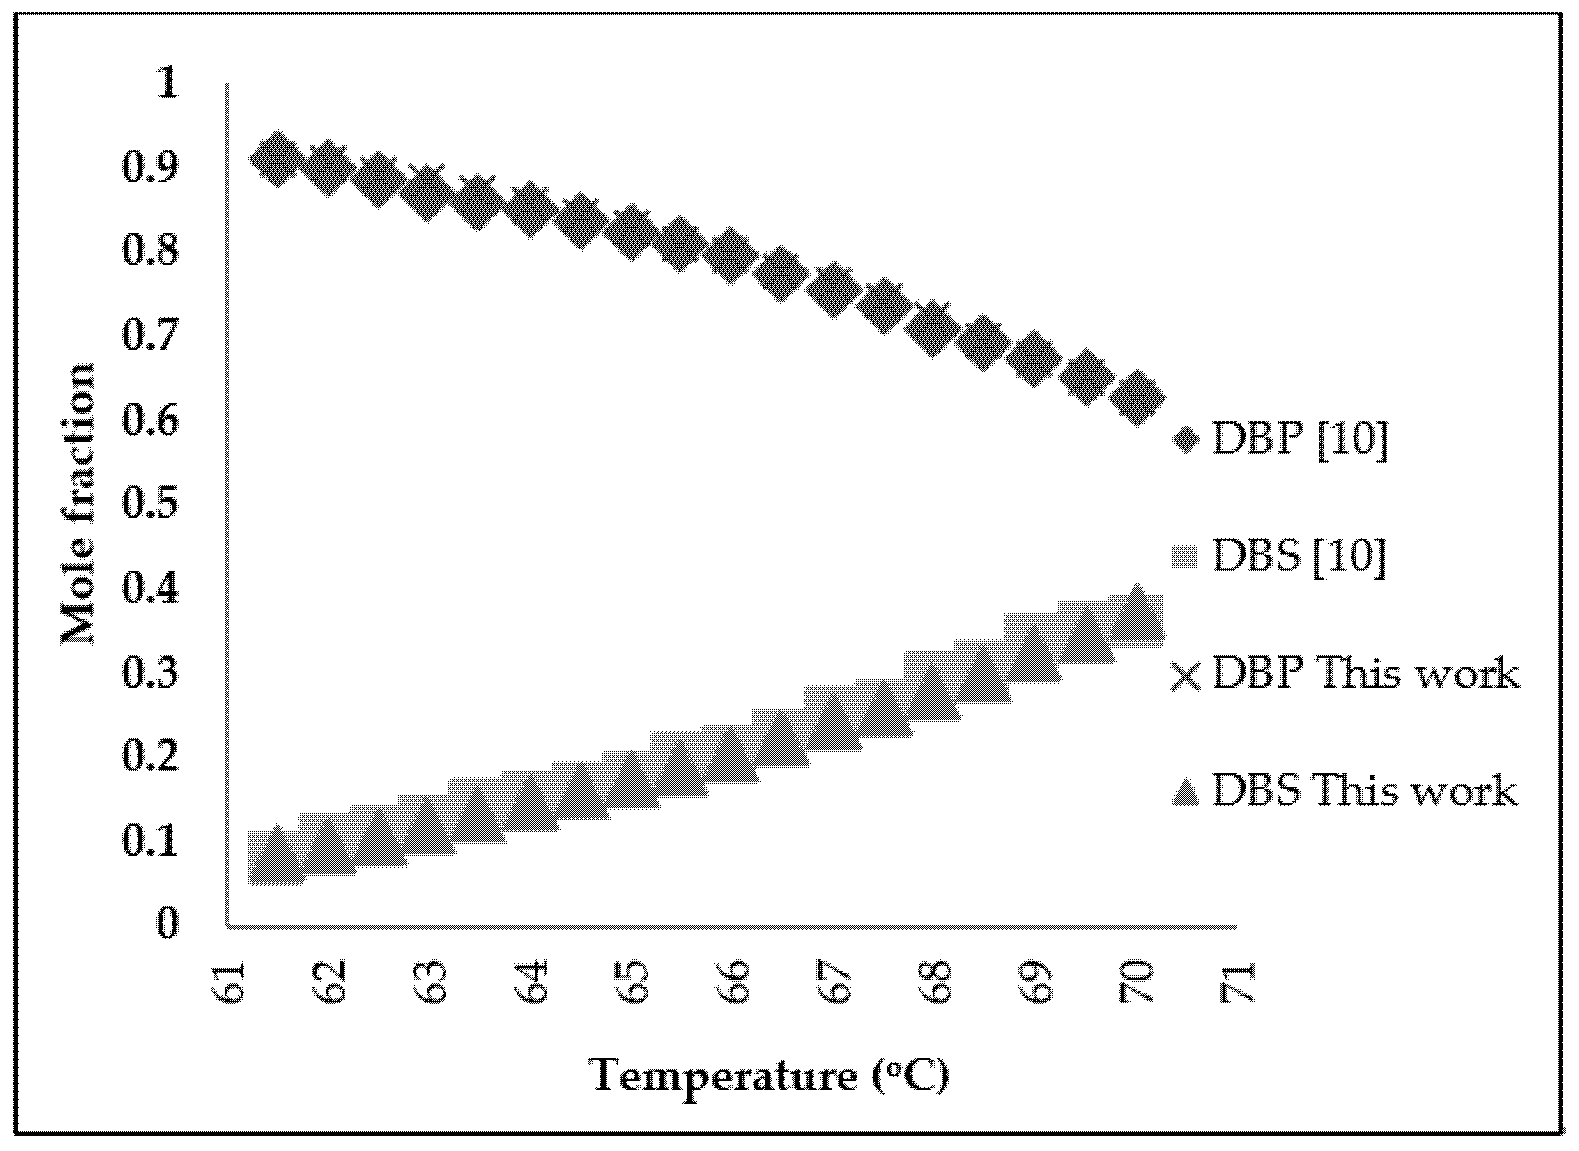
Figure 3.
Refined palm oil deodorization process.
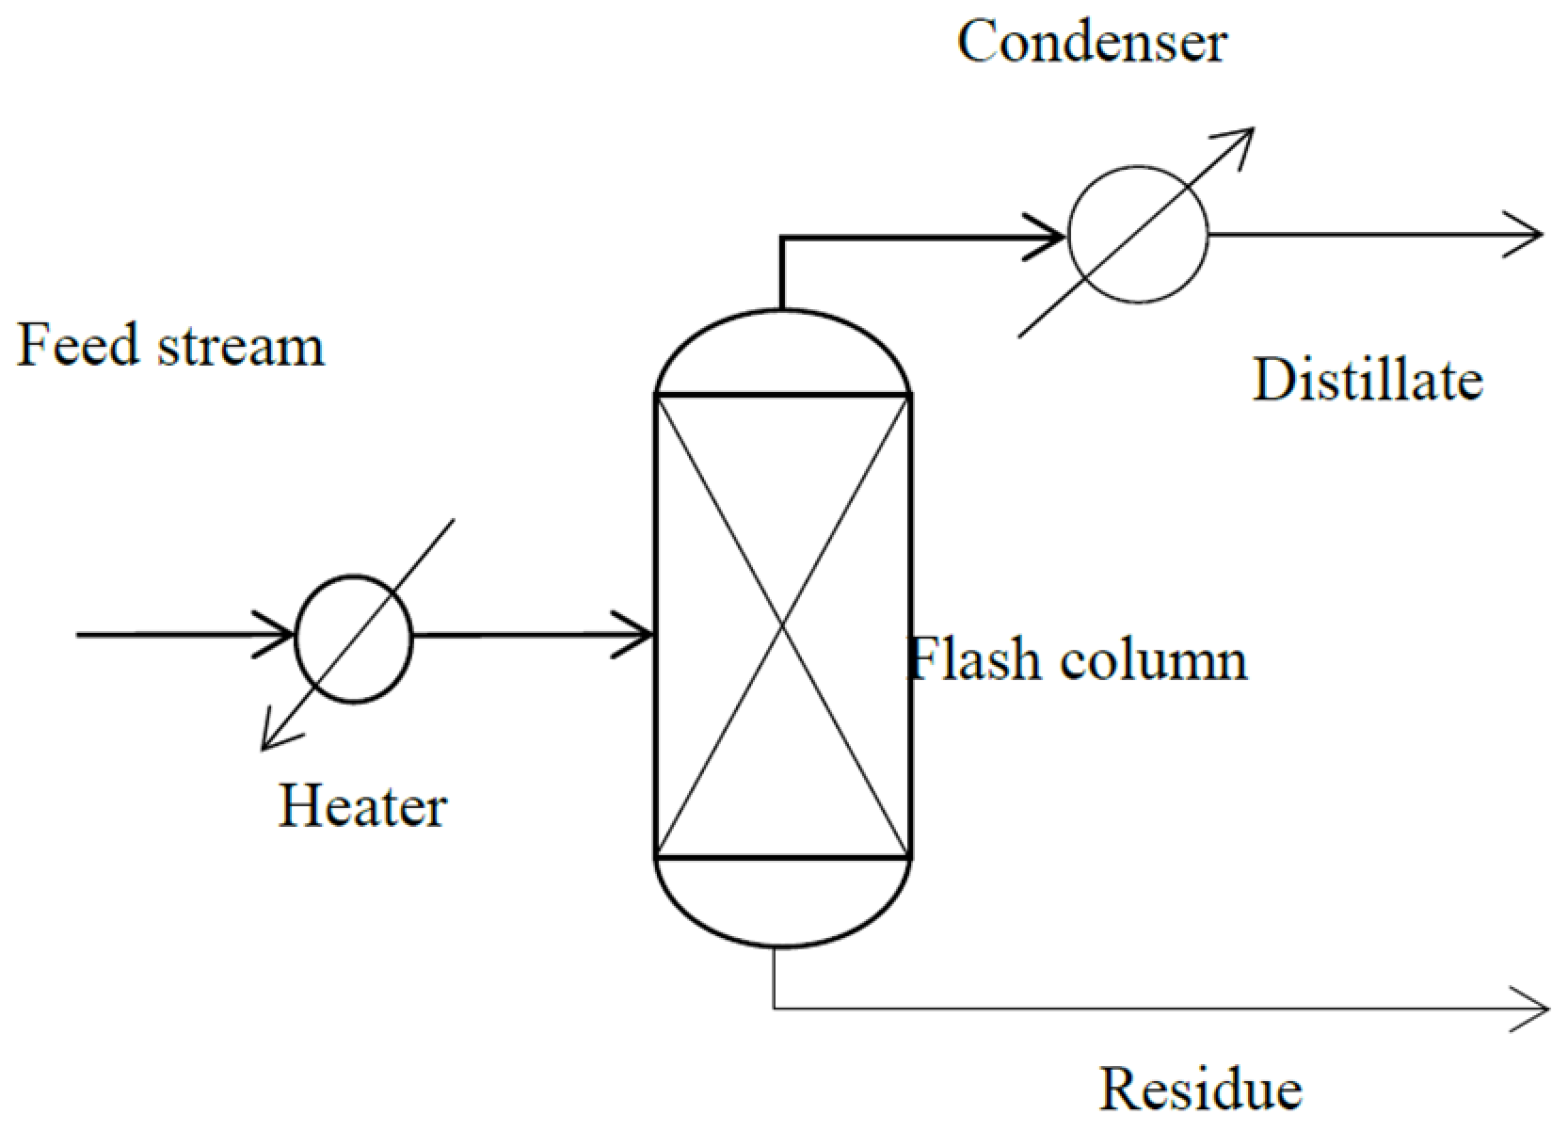
Figure 4.
Carotene recovery of refining of edible oil in study [11] and this work.
Figure 4.
Carotene recovery of refining of edible oil in study [11] and this work.
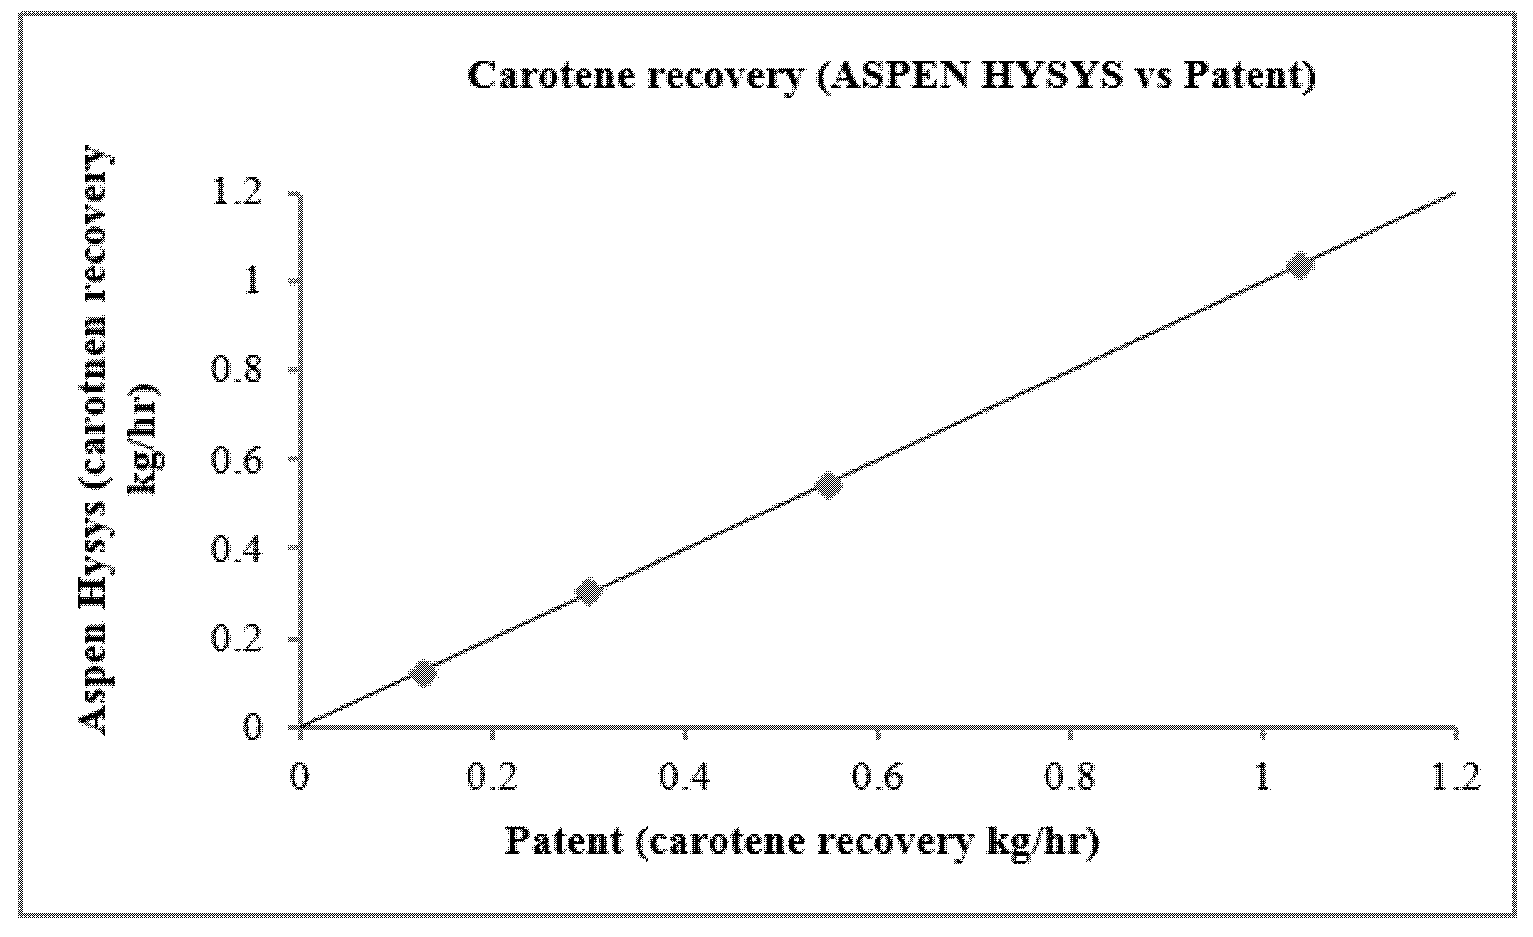
Figure 5.
Response surface curve (a) and contour plot (b) of beta-carotene concentration as a function of temperature and feed flow rate.
Figure 5.
Response surface curve (a) and contour plot (b) of beta-carotene concentration as a function of temperature and feed flow rate.
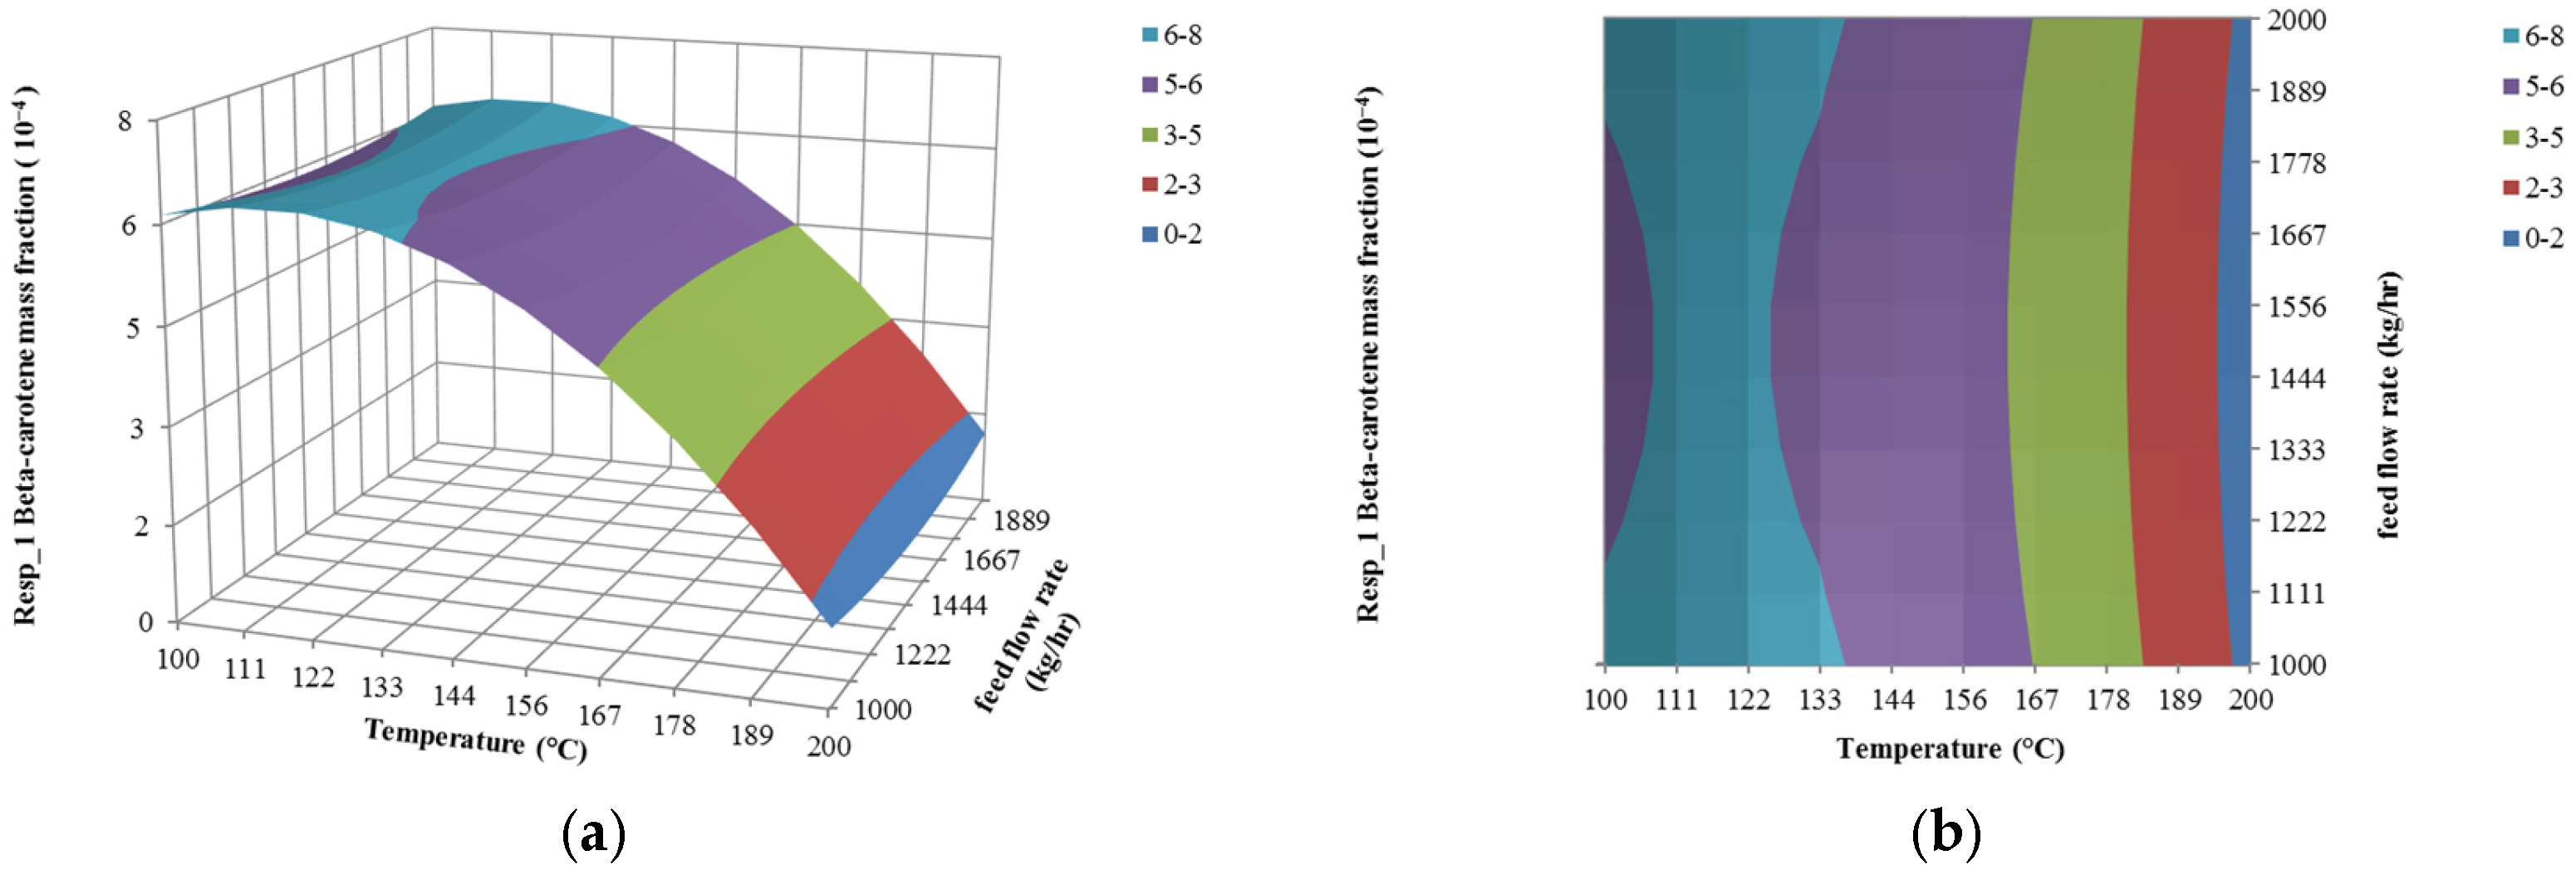
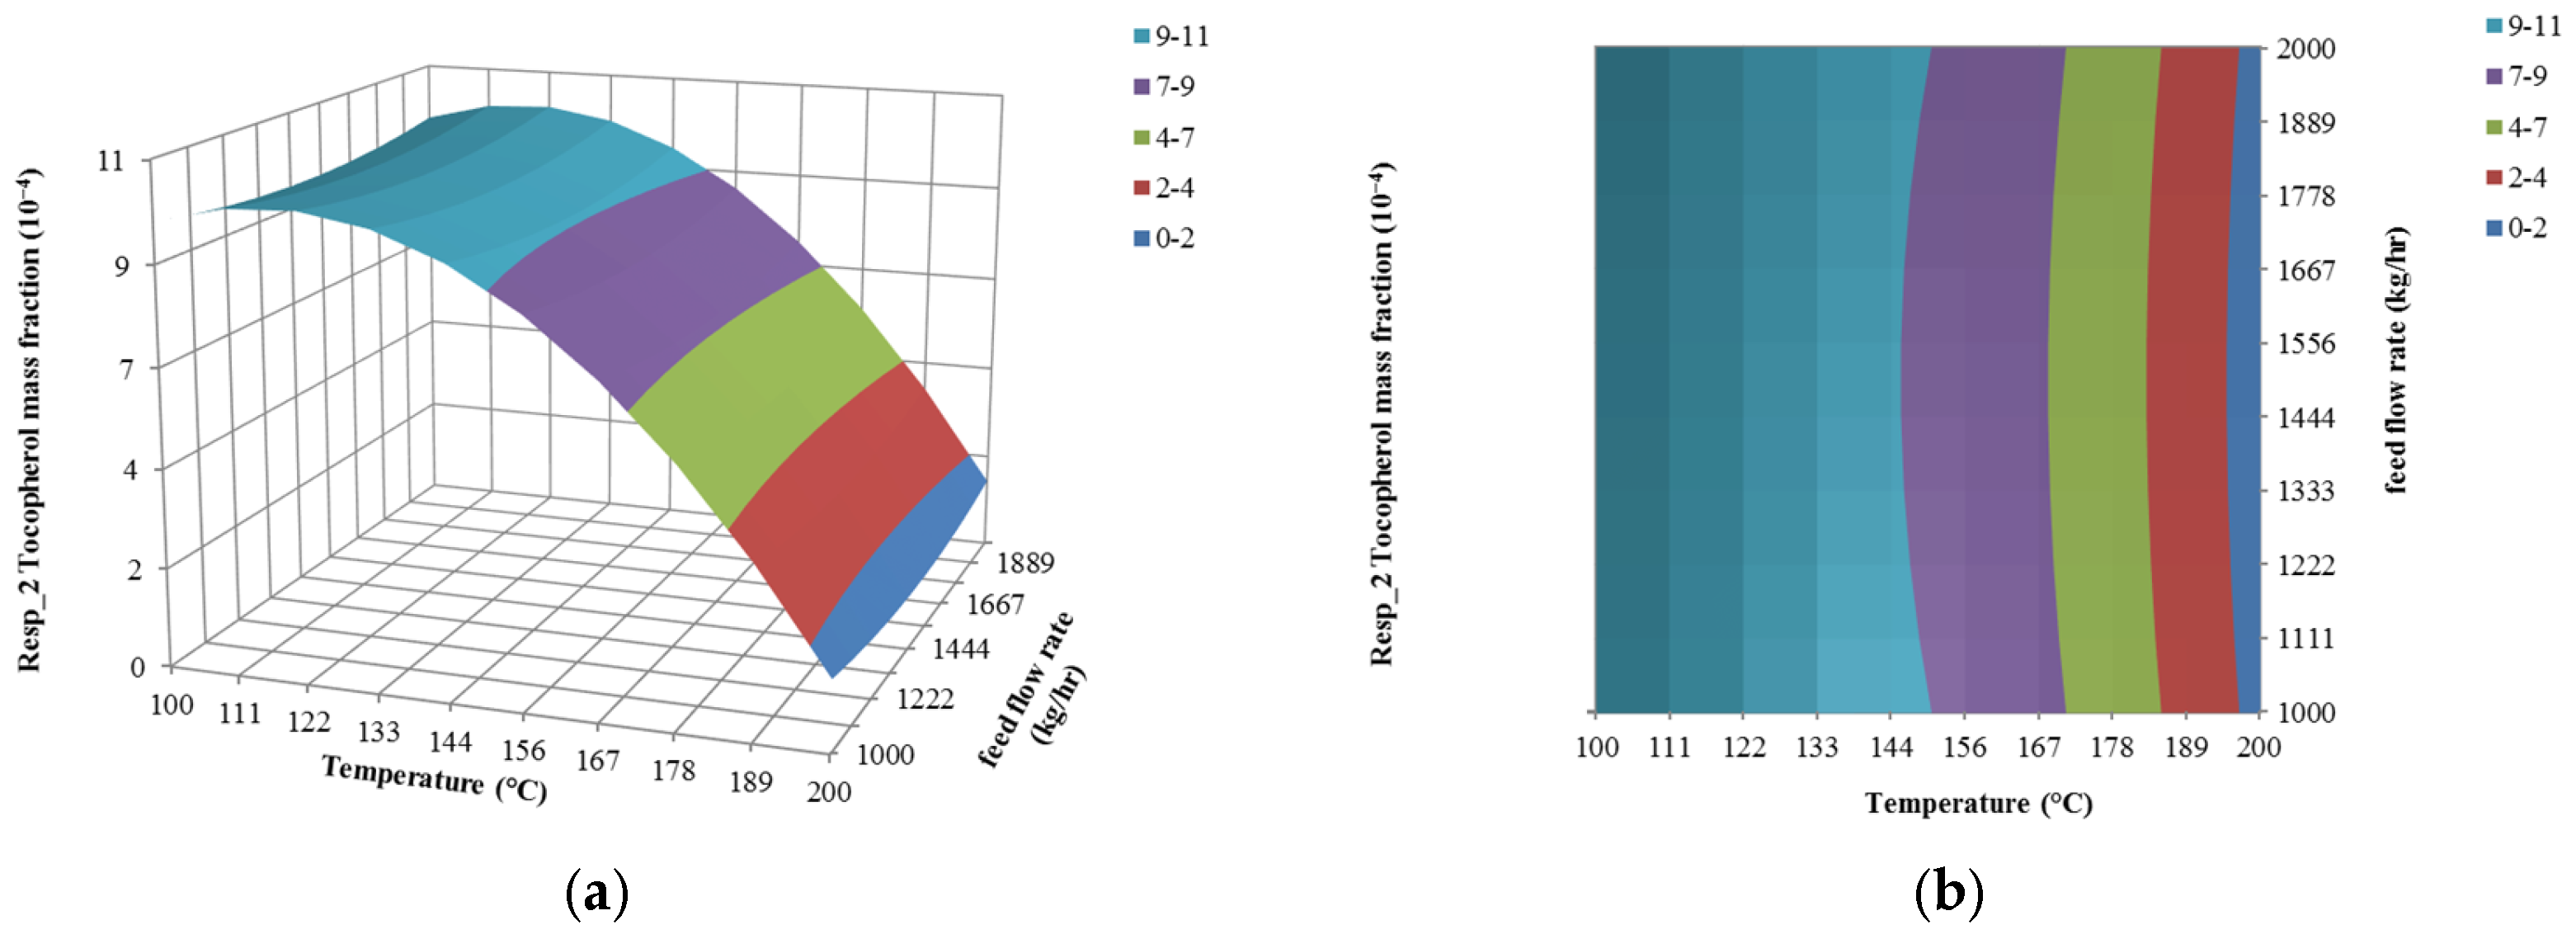
Figure 6.
Response surface curve (a) and contour plot (b) of tocopherol concentration as a function of temperature and feed flow.
Figure 6.
Response surface curve (a) and contour plot (b) of tocopherol concentration as a function of temperature and feed flow.

Figure 7.
Response surface curve (a) and contour plot (b) of FFA concentration as a function of temperature and feed flow.
Figure 7.
Response surface curve (a) and contour plot (b) of FFA concentration as a function of temperature and feed flow.
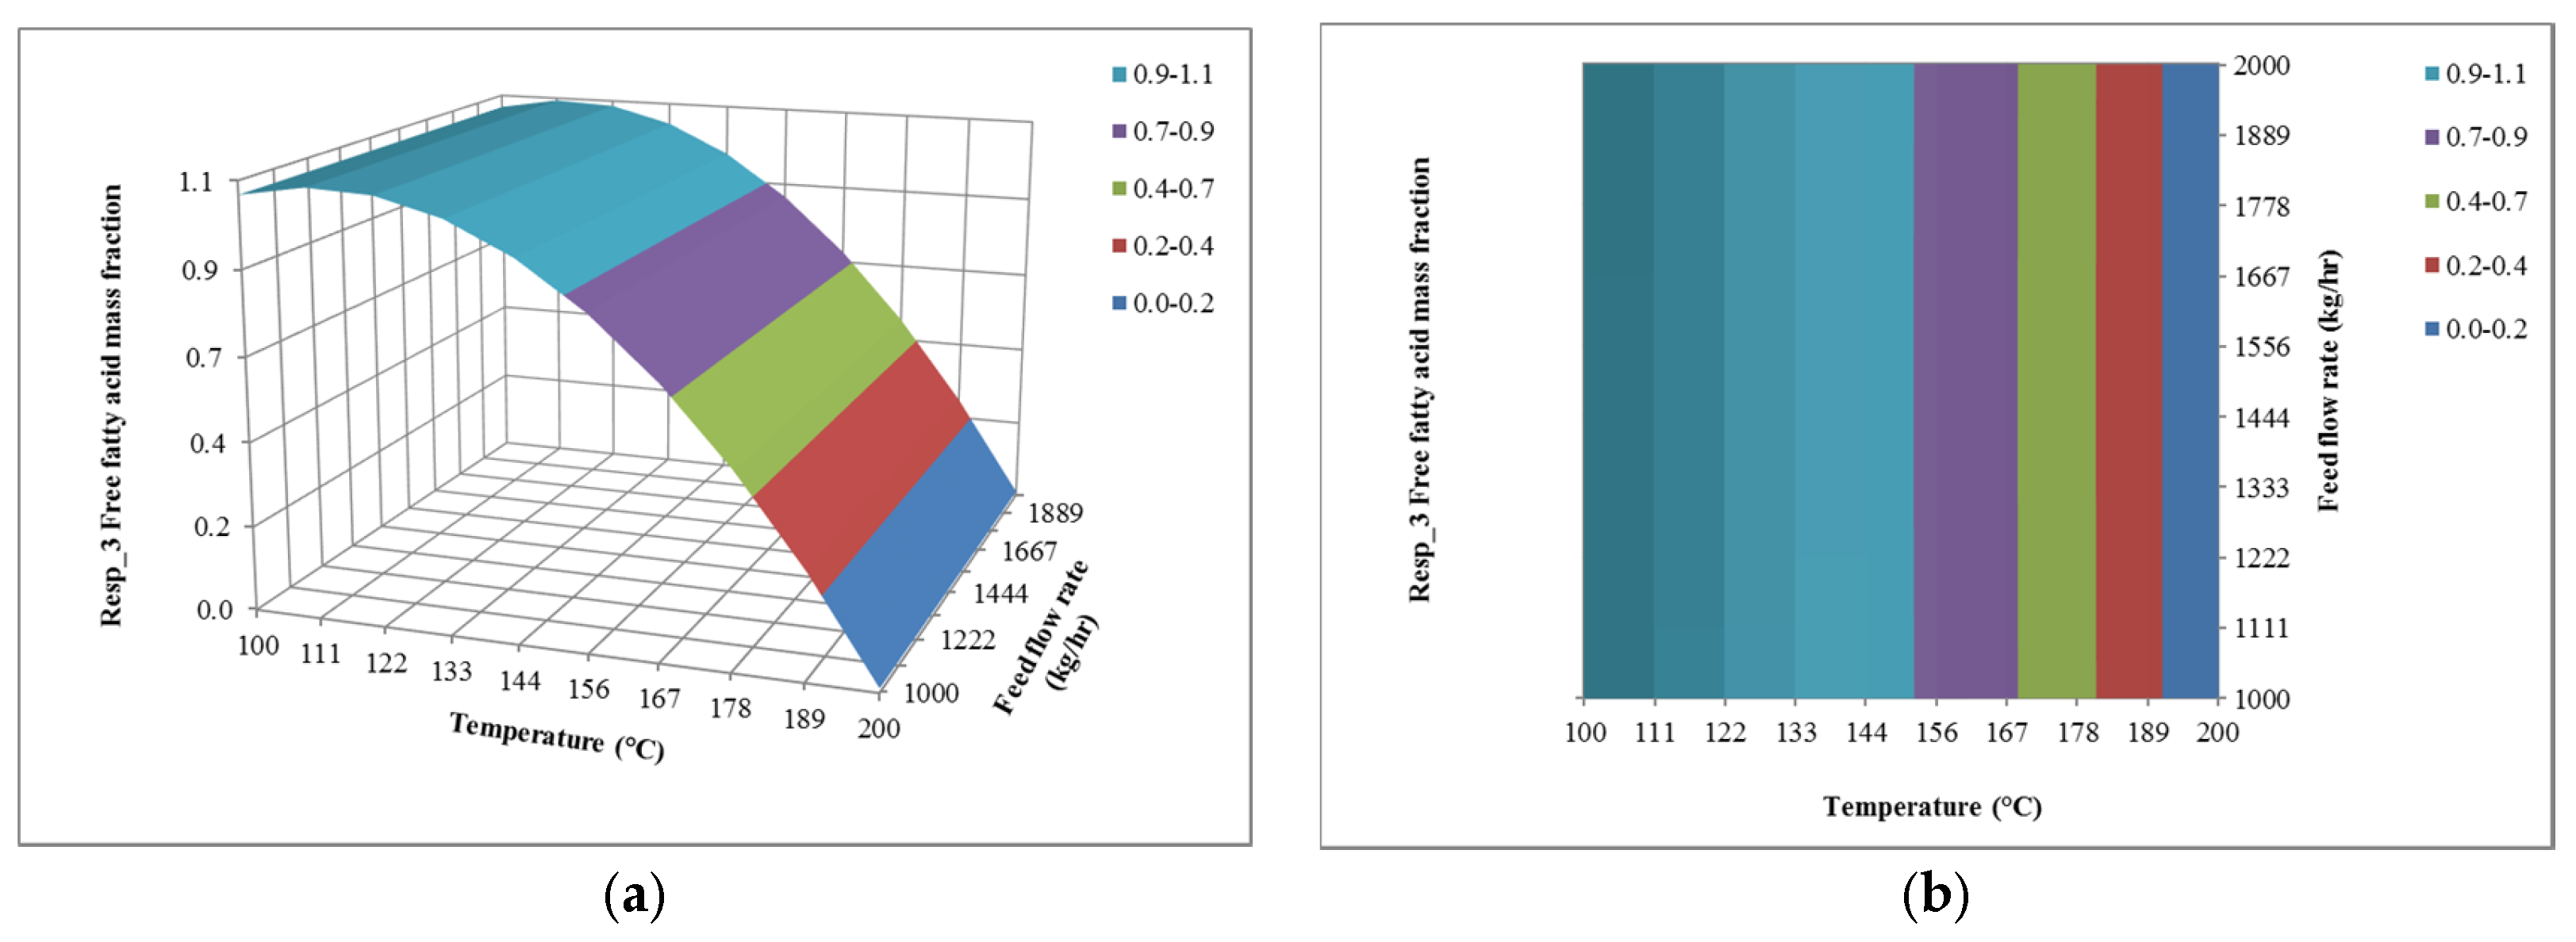
Figure 8.
Response surface curve (a) and contour plots (b) of beta-carotene concentration as a function of temperature and pressure.
Figure 8.
Response surface curve (a) and contour plots (b) of beta-carotene concentration as a function of temperature and pressure.

Figure 9.
Response surface curve (a) and contour plot (b) of tocopherol concentration as a function of temperature and pressure.
Figure 9.
Response surface curve (a) and contour plot (b) of tocopherol concentration as a function of temperature and pressure.
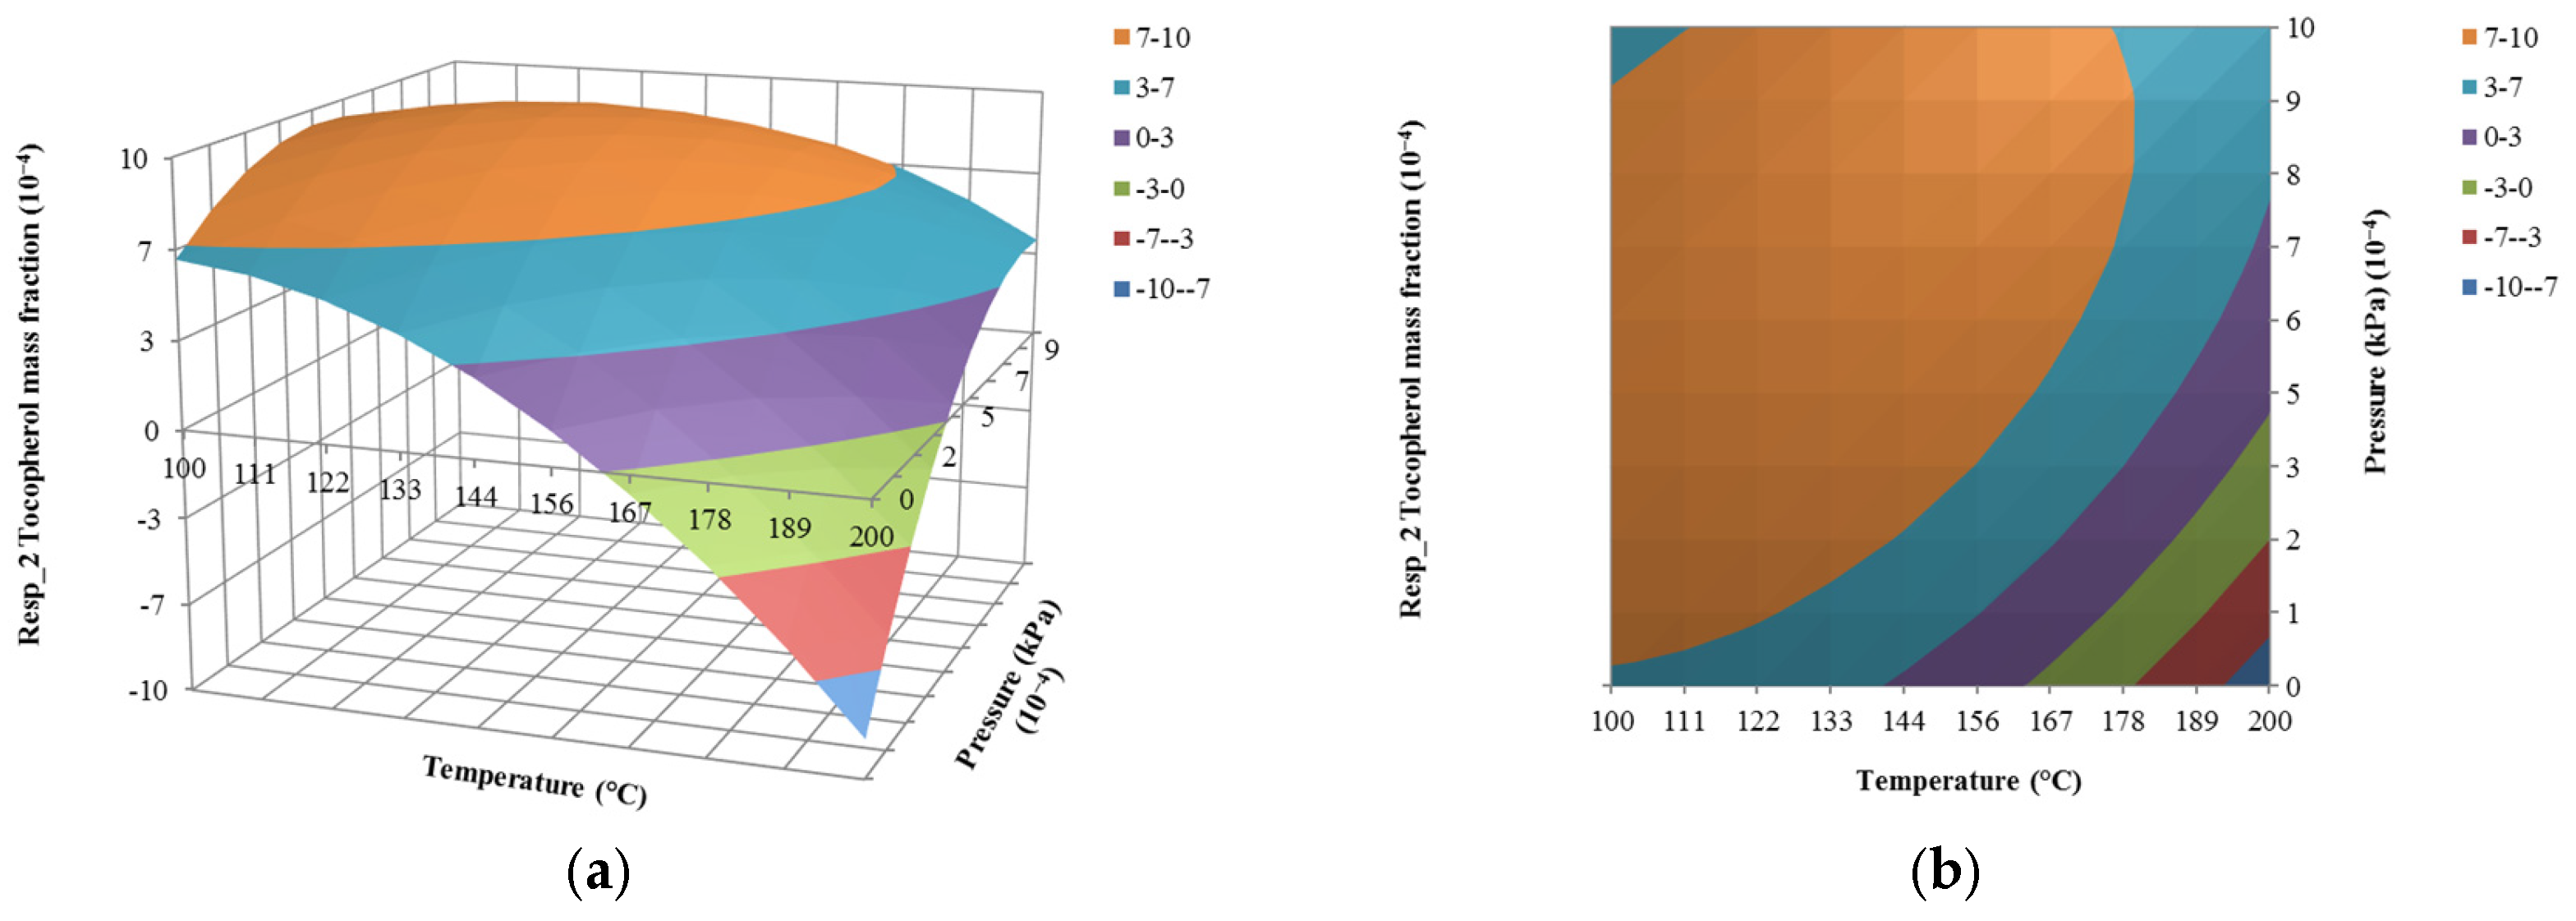
Figure 10.
Response surface curve (a) and contour plot (b) of free fatty acid (FFA) concentration as a function of temperature and pressure.
Figure 10.
Response surface curve (a) and contour plot (b) of free fatty acid (FFA) concentration as a function of temperature and pressure.

Table 1.
Results of the DISMOL simulator, ASPEN PLUS and that developed in ASPEN HYSYS.
| Parameters | DIMSOL | ASPEN PLUS [10] | ASPEN HYSYS (This Work) |
|---|---|---|---|
| Operating temperature (K) | 369 | 336 | 336 |
| Distillation mass ratio | 0.212 | 0.212 | 0.212 |
| Distillation DBP molar fraction | 0.775 | 0.790 | 0.793 |
| Residue DBP molar fraction | 0.429 | 0.409 | 0.420 |
Table 2.
Composition of refined palm oil and its properties.
| Components | Mass Fraction | MW | Formula | CAS No. |
|---|---|---|---|---|
| Tripalmitin | 0.493682 | 807.320 | C51H98O6 | 555-44-2 |
| Triolein | 0.470891 | 885.449 | C57H104O6 | 122-32-7 |
| Oleic acid | 0.033899 | 282.467 | C18H34O2 | 112-80-1 |
| Tocopherol | 0.000886 | 430.706 | C29H50O2 | 59-02-9 |
| Beta-carotene | 0.000552 | 536.873 | C40H56 | 7235-40-7 |
Table 3.
Pure component parameters for Equation (2), reproduced with permission from [13]. Copyright Springer, 2003.
Table 3.
Pure component parameters for Equation (2), reproduced with permission from [13]. Copyright Springer, 2003.
| Component | Antoine Parameters | ||||
|---|---|---|---|---|---|
| A1 | B1 | C1 | D1 | E1 | |
| Tripalmitin | 108,841 | −4,098,952 | 19.96 | −17,792 | −3.6 × 10⁻¹⁵ |
| Triolein | −514,215 | 19,737,838 | −91.13 | 83,685 | 1.4 × 10⁻¹⁵ |
| Oleic acid | 136.45 | −19,702 | −0.01 | −14.87 | 7.2 × 10⁻¹⁹ |
| Tocopherol | −15.90 | −5118 | 0.05 | 0 | 0.00 |
| β-carotene | −91.32 | −15.90 | 0.239 | 0 | 0.00 |
Table 4.
Estimated pure component parameters for modified Antoine equation (Equation (3)).
| Component | Antoine Parameters | R2 | ||||
|---|---|---|---|---|---|---|
| A2 | B2 | C2 | D2 | E2 | ||
| Tripalmitin | 1.509 × 10⁵ | 1.196 × 10⁵ | −0.074 × 10⁵ | −0.21 × 10⁵ | 0.00 | 0.99 |
| Triolein | −0.013 × 10⁷ | −3.170 × 10⁷ | 0.000 | 0.000 | 0.00 | 0.99 |
| Oleic acid | 519.688 | −0.106 | −399.010 | −71.37 | 0.00 | 0.99 |
| Tocopherol | −64.849 | 594.994 | −219.253 | 13.052 | 0.00 | 0.99 |
| β-carotene | 24.079 | −16,160 | −100.623 | 5.191 | 0.00 | 0.99 |
Table 5.
Simulations results of refining of edible oil in study [11] and this work.
Table 5.
Simulations results of refining of edible oil in study [11] and this work.
| Condition | Distillation Mass Ratio | Patent Recovery | Simulation Recovery | Prediction Error | ||
|---|---|---|---|---|---|---|
| kg/h | Percent (%) | kg/h | Percent (%) | (%) | ||
| Simulation 1 | 0.036 | 1.0395 | 95.98% | 1.0351 | 98.96% | 3.1% |
| Simulation 2 | 0.036 | 0.5449 | 98.73% | 0.5467 | 99.03% | 0.3% |
| Simulation 3 | 0.036 | 0.1249 | 98.03% | 0.1266 | 99.29% | 1.218% |
| Simulation 4 | 0.036 | 0.2969 | 97.38% | 0.3258 | 99.25% | 1.87% |
Table 6.
Central composite circumscribed (Min and Max = Star Points) design with three independent variables.
Table 6.
Central composite circumscribed (Min and Max = Star Points) design with three independent variables.
| Coded Variables | |||
|---|---|---|---|
| Run | X1 | X2 | X3 |
| 1 | 0 | 0 | −1 |
| 2 | 0 | 0 | 0 |
| 3 | −1 | 0 | 0 |
| 4 | 0 | 0 | 0 |
| 5 | 0 | 1 | 0 |
| 6 | −0.59 | 0.59 | −0.59 |
| 7 | 0 | 0 | 0 |
| 8 | 0.59 | −0.59 | 0.59 |
| 9 | −0.59 | −0.59 | −0.59 |
| 10 | 0.59 | 0.59 | 0.59 |
| 11 | 0 | −1 | 0 |
| 12 | 0.59 | 0.59 | −0.59 |
| 13 | -0.59 | 0.59 | 0.59 |
| 14 | 0.59 | −0.59 | −0.59 |
| 15 | 0 | 0 | 1 |
| 16 | 1 | 0 | 0 |
| 17 | −0.59 | −0.59 | 0.59 |
Table 7.
Coded variables and design range.
| Variables | Coded Variables and Design Range | ||||
|---|---|---|---|---|---|
| Feed flow rate (kg/h) | 1000 (−1) | 1203 (−0.59) | 1500 (0) | 1797 (0.59) | 2000 (1) |
| Temperature (°C) | 100 (−1) | 120 (−0.59) | 150 (0) | 180 (0.59) | 200 (1) |
| Pressure (kPa) | 1.00 × 10⁻⁵ (−1) | 2.11 × 10⁻⁴ (−0.59) | 5.05 × 10⁻⁴ (0) | 7.99 × 10⁻⁴ (0.59) | 1.00 × 10⁻³ (1) |
Table 8.
Experimental design using Central Composite Design (CCD) of 17 runs.
| Run | Input Variables | Composition Mass Fraction (Responses) | ||||
|---|---|---|---|---|---|---|
| x1 (kg/h) | x2 (°C) | x3 (10−4 kPa) | y1 (10−4) | y2 (10−4) | y3 | |
| 1 | 1500 | 150 | 0.10 | 0.28 | 0.54 | 0.09 |
| 2 | 1500 | 150 | 5.05 | 5.27 | 8.62 | 0.91 |
| 3 | 1000 | 150 | 5.05 | 5.27 | 8.62 | 0.91 |
| 4 | 1500 | 150 | 5.05 | 5.27 | 8.62 | 0.91 |
| 5 | 1500 | 200 | 5.05 | 7.27 | 9.63 | 0.08 |
| 6 | 1203 | 180 | 2.11 | 1.13 | 1.73 | 0.12 |
| 7 | 1500 | 150 | 5.05 | 5.27 | 8.62 | 0.91 |
| 8 | 1797 | 120 | 7.99 | 5.64 | 9.07 | 1.00 |
| 9 | 1203 | 120 | 2.11 | 5.57 | 9.04 | 0.99 |
| 10 | 1797 | 180 | 7.99 | 4.07 | 6.45 | 0.48 |
| 11 | 1500 | 100 | 5.05 | 5.57 | 8.95 | 1.00 |
| 12 | 1797 | 180 | 2.11 | 1.13 | 1.73 | 0.12 |
| 13 | 1203 | 180 | 7.99 | 4.07 | 6.45 | 0.48 |
| 14 | 1797 | 120 | 2.11 | 5.57 | 9.04 | 0.99 |
| 15 | 1500 | 150 | 1.00 | 5.48 | 8.89 | 0.96 |
| 16 | 2000 | 150 | 5.05 | 5.27 | 8.62 | 0.91 |
| 17 | 1203 | 120 | 7.99 | 5.64 | 9.07 | 1.00 |
The effect of each independent variable on the responses according to 17 runs is described below.
Table 9.
Estimated regression coefficient for refined palm oil.
| Term | Coefficient | Coefficient | Coefficient |
|---|---|---|---|
| Constant | 5.25 × 10⁻⁴ | 8.60 × 10⁻⁴ | 9.15 × 10⁻¹ |
| x1 | 1.35 × 10⁻²⁰ | 3.49 × 10⁻²⁰ | −1.27x10⁻¹⁸ |
| x2 | −2.49 × 10⁻⁴ | −4.12 × 10⁻⁴ | −5.34 × 10⁻¹ |
| x3 | 1.83 × 10⁻⁴ | 2.92 × 10⁻⁴ | 2.69 × 10⁻¹ |
| x1x1 | 2.42 × 10⁻⁵ | 3.54 × 10⁻⁵ | −1.63 × 10⁻³ |
| x2x2 | −1.88 × 10⁻⁴ | −3.31 × 10⁻⁴ | −3.74 × 10⁻¹ |
| x3x3 | −2.15 × 10⁻⁴ | −3.56 × 10⁻⁴ | −3.91 × 10⁻¹ |
| x1x2 | 6.88 × 10⁻²¹ | −1.38 × 10⁻²⁰ | 2.82 × 10⁻¹⁷ |
| x1x3 | −1.38 × 10⁻²⁰ | 9.01 × 10⁻²¹ | 2.73 × 10⁻¹⁷ |
| x2x3 | 2.07 × 10⁻⁴ | 3.38 × 10⁻⁴ | 2.50 × 10⁻¹ |
Table 10.
Upper bound and lower bound for independent variables.
| Variable Description | Low Bound | High Bound |
|---|---|---|
| Inlet Mass flow rate (kg/h) | 1000 | 2000 |
| Temperature (°C) | 100 | 200 |
| Pressure (kPa) | 0.001 | 0.00001 |
Table 11.
Predicted result from the Response Surface Methodology (RSM) model and ASPEN HYSYS Simulation.
Table 11.
Predicted result from the Response Surface Methodology (RSM) model and ASPEN HYSYS Simulation.
| Components | Responses Result from RSM Model | Responses Result from ASPEN HYSYS Simulation |
|---|---|---|
| Beta-carotene | 0.000554 | 0.000545 |
| Tocopherol | 0.000896 | 0.000890 |
| FFA | 0.999000 | 0.953000 |
Table 12.
The regression statistics of model and simulation.
| Parameters | Regression Statistics |
|---|---|
| Multiple R | 1 |
| R Square | 1 |
| Adjusted R Square | 1 |
| Standard Error | 3.18 × 10⁻⁶ |
| Observations | 3 |
© 2017 by the authors. Licensee MDPI, Basel, Switzerland. This article is an open access article distributed under the terms and conditions of the Creative Commons Attribution (CC BY) license (http://creativecommons.org/licenses/by/4.0/).
Share and Cite
MDPI and ACS Style
Tehlah, N.; Kaewpradit, P.; Mujtaba, I.M. Development of Molecular Distillation Based Simulation and Optimization of Refined Palm Oil Process Based on Response Surface Methodology. Processes 2017, 5, 40. https://doi.org/10.3390/pr5030040
AMA Style
Tehlah N, Kaewpradit P, Mujtaba IM. Development of Molecular Distillation Based Simulation and Optimization of Refined Palm Oil Process Based on Response Surface Methodology. Processes. 2017; 5(3):40. https://doi.org/10.3390/pr5030040
Chicago/Turabian StyleTehlah, Noree, Pornsiri Kaewpradit, and Iqbal M. Mujtaba. 2017. "Development of Molecular Distillation Based Simulation and Optimization of Refined Palm Oil Process Based on Response Surface Methodology" Processes 5, no. 3: 40. https://doi.org/10.3390/pr5030040
Note that from the first issue of 2016, this journal uses article numbers instead of page numbers. See further details here.