Energy Optimization of Gas–Liquid Dispersion in Micronozzles Assisted by Design of Experiment

Laboratory of Equipment Design, Department of Biochemical and Chemical Engineering, TU Dortmund University, Emil-Figge-Str. 68, 44227 Dortmund, Germany
*
Author to whom correspondence should be addressed.
Processes 2017, 5(4), 57; https://doi.org/10.3390/pr5040057
Submission received: 15 September 2017
/
Revised: 6 October 2017
/
Accepted: 7 October 2017
/
Published: 12 October 2017
(This article belongs to the Collection Process System Engineering for More Efficient Power and Chemicals Production)
Abstract
:In recent years gas–liquid flow in microchannels has drawn much attention in the research fields of analytics and applications, such as in oxidations or hydrogenations. Since surface forces are increasingly important on the small scale, bubble coalescence is detrimental and leads to Taylor bubble flow in microchannels with low surface-to-volume ratio. To overcome this limitation, we have investigated the gas–liquid flow through micronozzles and, specifically, the bubble breakup behind the nozzle. Two different regimes of bubble breakup are identified, laminar and turbulent. Turbulent bubble breakup is characterized by small daughter bubbles and narrow daughter bubble size distribution. Thus, high interfacial area is generated for increased mass and heat transfer. However, turbulent breakup mechanism is observed at high flow rates and increased pressure drops; hence, large energy input into the system is essential. In this work Design of Experiment assisted evaluation of turbulent bubbly flow redispersion is carried out to investigate the effect and significance of the nozzle’s geometrical parameters regarding bubble breakup and pressure drop. Here, the hydraulic diameter and length of the nozzle show the largest impacts. Finally, factor optimization leads to an optimized nozzle geometry for bubble redispersion via a micronozzle regarding energy efficacy to attain a high interfacial area and surface-to-volume ratio with rather low energy input.
1. Introduction
Gas–liquid chemical reactions include a broad range of highly relevant chemistries such as halogenation, oxidation, and hydrogenation, which are of great importance for fine chemical and pharmaceutical industries [1,2,3,4,5,6,7]. Gaseous reagents are prone to be atom economic [8]; however, they are often used in large stoichiometric excess because of insufficient interfacial mixing [9]. This can lead to extended reaction times and, consequently, prohibitively slow processes, which underlines the importance of gas–liquid mixing [10]. Here, microstructured fluidic systems with increased surface-to-volume ratio can enhance reaction rates, especially when mass transfer is limiting [11]. Heat transfer rate is simultaneously raised, making highly exothermic reactions easier to control and reducing safety risks at microscale [12]. For these reasons, gas–liquid reactions can be improved by employing flow conditions [13]. As a consequence, interfacial area mixing and flow of gas–liquid systems in confined spaces have been subject to extensive research by academia [14,15,16,17,18,19,20,21].
Once the two phases are brought in contact, the type of flow pattern depends on the channel characteristics, respective fluid properties, e.g., surface tension and wetting behavior, and process parameters such as the flow rates and ratio of the two phases [8]. Typical flow regimes encountered in gas–liquid flow in capillaries are parallel flow, Taylor bubble flow, and bubbly flow, with increasing interfacial area per unit volume from first to last [22,23].
In general, two principles exist for the contact of gaseous and liquid phases. On one side, both phases can be kept continuous, while the contactor device creates a stabilized interface [24]. Dispersion of the one phase into the other using appropriate inlets or micromixers can be utilized on the other side, which is of interest in this study. While active micromixers are employed in gas–liquid–solid systems to handle solid phase, passive micromixers are often used for phase contacting of gaseous and liquid phase only [25]. Here, T- or Y-mixers are most common for microstructured reactors at the laboratory scale [21]. Multilamination, flow focusing, and split-and-recombine can be employed as well [11,26,27,28]. However, mainly Taylor bubble flow is achieved due to dominating surface forces in microchannels [29], if no surfactants are present. Here, refinement of gas–liquid dispersion using converging–diverging micronozzles has been found to be highly effective by breaking up larger bubbles into considerably smaller ones [30,31,32,33,34,35]. This results in a bubbly flow regime with increased interfacial area per unit volume and, hence, increased interfacial area. However, most studies use micro bubble generators for industrial applications and there is a lack of deeper analysis of fundamental bubble breakup phenomena behind Venturi micro bubble generators [34].
The intensity of bubble breakup behind micronozzles is strongly affected by energy dissipation rates, which depend on nozzle-induced pressure drop [13]. Once external forces surpass the bubble-stabilizing Laplace pressure, the mother bubble is broken up. Various micronozzle-induced bubble breakup regimes have been identified and related breakup mechanisms have been proposed in fundamental studies [36,37]. Laminar breakup regime is characterized by binary breakup or the shearing off of small daughter bubbles at the rear cap of the mother bubble at moderate flow rates and energy dissipation rates. Rather large daughter bubble diameters are prominent and a broad daughter bubble size distribution is obtained, often featuring a bimodal shape. Turbulent bubble disruption is obtained at higher flow rates, which results in increased energy dissipation rates due to larger pressure drops across the micronozzle. Therefore, large energy input is needed, leading to the generation of interfacial area. The mother bubble is broken up into numerous daughter bubbles of similar size and a unimodal and narrow daughter bubble size distribution is obtained at smaller mean bubble diameters. Furthermore, observations of internal jet flow formation within bubbles have been made, which can be used for bubble breakup, too [38].
In this work generating microdispersions employing a microchannel nozzle and the turbulent bubble breakup are investigated for energy efficacy using a microreactor concept developed by the Laboratory of Equipment Design at the TU Dortmund University [39]. A combination of flow-through millistructured channels with integrated micronozzles is employed for high flow rates along with reduced pressure loss. Therefore, throughput is increased while micro-scale effects are maintained, which is beneficial for industrial applications. First-phase contacting is realized via T-junction and further refinement of two phase flow is achieved by means of micronozzle. This investigation is carried out for bubbly flow and turbulent bubble breakup regime since the highest values are exhibited for the phase boundary area. A Design of Experiment (DoE) is employed to evaluate the significance of the nozzle’s geometrical parameters in turbulent bubble breakup and their quantitative impact. Energy efficacy for bubble breakup is then assessed, taking the daughter bubble diameter and the respective pressure drop into account. An optimal redispersion nozzle is designed by factor optimization within a response surface design. The novel optimized nozzle design can be used for gas–liquid industrial applications.
2. Theoretical Background
2.1. Gas–Liquid Flow and Bubble Generation
Bubble generation is a highly dynamic process including surface forces with fluid flow and structure interaction on short time and length scales. A distinction has to be made between primary bubble generation and further refinement of gas–liquid flow. However, both processes depend on the hydrodynamics of continuous phase liquid flow [40].
Reynolds number characterizes single phase liquid flow and classifies laminar, transient, and turbulent flow regimes [41]. The definition of is
with mean velocity and kinematic viscosity of the liquid phase . Typically for single phase, tubular flow, the transient regime range is 2300 < < 10,000, while the laminar flow regime is existent at lower and turbulent flow at higher numbers. Since rectangular ducts are employed in this study, a hydraulic diameter has to be adopted to determine the number. The hydraulic diameter is defined by the ratio of cross-sectional area and perimeter of the rectangular cross section, which can also be expressed by channel width and channel height [42]:
The reduction of the channel dimensions significantly increases the impact of frictional forces. Hence, high energy input is necessary to sustain flow. Therefore, rather low Reynolds numbers are often prominent in microchannels [43]. Turbulent flows can only be achieved with comparatively high energy input. In this study, turbulent conditions are obtained at a relatively low pressure drop due to combination of millichannels and micronozzles.
2.2. Two-Phase Flow
Various flow regimes are established for gas–liquid flow depending on the process parameters, particularly, void fraction resulting from respective flow rates, material properties of the two phases e.g., density, interfacial tension, and viscosity as well as the geometric dimensions of the microchannel [44]. Void fraction is defined by the ratio of gas to total volumetric flow rate:
In gas–liquid systems bubble, slug, and parallel/annular flows are observed in most cases. Additionally, transition regimes can be observed between the main regimes. Inertia force is predominant in parallel flow, whereas surface force is prominent in bubble and plug flow [21]. Flow regimes, which are obtained during experiments after primary bubble generation, are shown in Figure 1.
Transitions between the individual flow regimes can be visualized by employing flow maps. For example, void fraction can be plotted over flow velocity or a characteristic dimensionless number and flow behavior for each experimental point is entered into the diagram. Subsequently, the flow maps enable the definition of an operating window, for which the desired flow regime is present. In this study the focus is on bubbly flow as this regime exhibits the highest interfacial area per unit volume.
2.3. Primary Bubble Generation at T-Junction
The formation of bubbles depends on the predominant forces in continuous phase liquid flow [27]. Systems always tend to adopt the energetically most favorable state. Therefore, immiscible fluids minimize their phase boundary surface. External energy must be introduced into the system for the generation of dispersions [47]. As pressure in the gas inlet exceeds the pressure in the liquid channel in a T-junction, the gaseous phase enters the continuous phase’s channel. Pressure and shear force gradients from the continuous phase cause disturbances at the phase boundary surface equilibrium. Once a critical value of external forces is exceeded, a bubble is released into the main channel. In T-junctions, three mechanisms of bubble formation are described: dripping, squeezing, and jetting. These depend on the geometry of the mixer, respective flow rates, and the material properties (interfacial tension, viscosity, and density) [48].
The classification of bubble formation mechanisms can be carried out using dimensionless numbers [42]. Here, capillary number is characteristic, which is defined as
The dynamic viscosity of the liquid is indicated by , is the velocity, and is the interfacial tension. Dripping mechanism is observed at 0.01 < < 0.1, where the surface tension force is dominant [49]. First, a meniscus forms at the gas inlet and the gaseous phase penetrates into the main channel and subsequently tears off due to local shear stress gradients within the continuous liquid phase. The resulting bubbles are smaller than the channel diameter and have little effect on the flow of the continuous phase. Squeezing, jetting, and dripping mechanisms were all observed in experiments. However, only the latter produced a stable bubbly flow regime, which is focused on in this study.
2.4. Bubbly Flow Refinement via Micronozzle
In order to achieve high interfacial area, mother bubbles generated at T-junction are broken up into smaller daughter bubbles using a micronozzle. External energy input is needed to exceed the bubble stabilizing Laplace pressure, triggering breakup of the dispersed phase:
The Laplace pressure depends on bubble diameter and surface tension. Accordingly, small bubbles feature higher resistance towards external forces than larger ones.
Bubble breakup-inducing forces result from the hydrodynamics of the liquid phase. In the converging nozzle part, potential energy in the form of pressure is transformed into kinetic energy [50]. Hence, the constriction of the cross section leads to flow acceleration, which favors turbulence in the diverging nozzle part as pressure is regained in the downstream channel. Depending on , a laminar or turbulent regime is established downstream of the nozzle [50]. Shear stress gradients prevail in the laminar regime due to layered flow, and laminar bubble breakup can occur [36]. These gradients act on the phase boundaries, trigger interfacial instabilities, and deform the bubble. If the deformation is sufficiently strong (macro deformation), the bubble breaks up, preferably into two daughter bubbles. Another laminar breakup mechanism shows shearing off of satellite daughter bubbles at the rear cap of the mother bubble [36]. However, the mother bubble nearly keeps its former size and the increase in interfacial area is comparably small.
The Weber number forms the ratio of inertia forces to surface tension, taking relative velocity , liquid density , bubble diameter , and surface tension into account. The stability of a dispersed bubble is described by [51]:
In this study, a detailed investigation of turbulent bubble breakup is of interest due to the increased interfacial area per unit volume. Turbulent liquid flow regime is characterized by strong velocity oscillations and, therefore, high velocity and pressure gradients are present [52]. As a result, stronger forces are present compared to the laminar regime. The extent of the turbulent field highly depends on nozzle geometry and flow rate and can be classified into macro and micro turbulence, taking vortex size into account [53]. Macro turbulence scale is in the order of magnitude of the turbulence generator, which is the hydraulic diameter of the smallest cross section. The scale for micro turbulence determines the range of the smallest eddies. According to Kolmogorov [54], the dimension of micro turbulence is given by
Local energy dissipation rate displays the local gradient of velocity oscillation and, hence, mean energy dissipation rate represents the energy that is available for bubble breakup. It can be obtained using the pressure loss , the total volumetric flow rate , density of continuous liquid phase , and the dissipation volume [13]. The energy dissipation rate can be determined by
and dissipation volume is calculated by [55]:
Thus, depends on the geometry of the turbulence generator (hydraulic diameter , length , and height of smallest cross section) and the downstream channel depth . Characteristic nozzle parameters are given with respective angles ( and ), hydraulic channel diameters (, and ), aspect ratios (, and ), and length of the smallest cross section. The index “−1” is linked to the converging inlet nozzle region, index “0” indicates parameters in the smallest cross section, and index “1” relates to parameters of the diverging outlet nozzle part. This is shown in Figure 2 next to a turbulent field of single-phase liquid flow in the diverging nozzle section.
The prevailing velocity and pressure gradients act on the phase boundary between the liquid continuum and a bubble and lead to the turbulent breakup of the mother bubble into numerous daughter bubbles with narrow daughter bubble size distribution. Turbulent eddies equaling the bubbles’ size can also trigger their breakup in case of eddy–bubble collision [56]. However, at some point daughter bubbles are too small for further breakup, since the Laplace pressure is high. Therefore, it is of interest to determine the nozzle geometry and process settings at which the energy dissipation rate efficiently breaks up bubbles in a turbulent regime, indicating the aim of this study. Bubbly flow refinement is shown in Figure 3.
3. Materials and Methods
3.1. Design of Experiment for Efficient Turbulent Redispersion
For the design of an efficient process, such as the energy-efficient turbulent bubble breakup in micronozzles, the effects of individual process inputs on the respective process outputs have to be known and predictable. Hence, a DoE is employed in order to reveal significant geometrical parameters of the nozzle, significant process parameters, and determine their quantitative impact on turbulent refinement of bubbly flow behind micronozzles. A DoE not only includes the selection of suitable input and outcome variables, but planning the delivery of the experiment under statistically optimal conditions given the constraints of available resources. All the experimental points span an experimental space. Interpolation between the experimental points reduces experimental effort compared to One-Factor-at-Time method. In a DoE, several influencing factors are varied simultaneously and systematically during a single experiment. A regression model can be obtained, which describes the influence of single parameters and their interactions on a process output. For a case in which two or more process outputs are present, the models can be used for factor optimization, resulting in optimized processes [57].
3.1.1. Determination of Process Inputs, Process Outputs, and Disturbance Variables
To begin with process inputs, process outputs, and potential disturbance variables, which would falsify the results, have to be specified. According to the aim of the study, the mean daughter bubble size is the process output of particularly high interest as the interfacial area increases to the power of a third during the breakup of a mother bubble into numerous small daughter bubbles. Since the energy input needs to be low at the same time, the pressure drop is the other process output of interest. The energy dissipation rate depends on the pressure drop according to Equation (7) and it is linked to the bubble breakup.
For process inputs, potential bubble breakup-influencing parameters have to be determined. It is worthwhile to exclude process inputs from the DoE, which obviously lack influence on the bubble breakup, because every process input considered significantly increases the number of experiments necessary.
The range of adjustable process inputs covers nozzle geometry parameters and process parameters for gas–liquid refinement behind micronozzles. For chemical gas–liquid reaction systems, fluid properties such as the surface tension and wettability of the channel material would have to be taken into account. Here, nitrogen and deionized water are employed for phenomenological studies and chemical system parameters are neglected. All adjustable process and nozzle parameters are summed up in Table 1.
The liquid volumetric flow rate is an important process input as it directly influences the obtained Re number and the hydrodynamics of the liquid phase and, thus, bubble breakup. Gaseous volumetric flow rate is adopted to maintain a void fraction of = 0.1. Experiments have shown stable bubbly flow for this value as shown in the results (Section 3.1.1). As the void fraction is constant, the total volumetric flow rate is considered within the DoE instead of liquid volumetric flow rate . The ambient temperature is kept constant at = 22 °C and is not considered in the DoE. In previous studies, Tollkötter showed that the geometry of the converging nozzle part has a negligible effect on redispersion compared to that of the diverging nozzle section [39]. As a result, parameters regarding the converging part are not included in the DoE and are kept constant at = 8° and = 1 mm. Channels with a squared cross section (aspect ratio = 1) are beneficial for bubbly flow refinement via micronozzles [36]. Consequently, channels with a squared cross section are chosen for this work. A bend in the smallest cross section leads to increased energy input; however, the daughter bubble size is not decreased compared to straight nozzles [30]. Consequently, only straight nozzles are investigated in this work. The length and hydraulic diameter of the smallest cross section influence the pressure drop and thus bubble breakup. These two parameters are incorporated in the DoE. The same applies for . Depending on the nozzle’s outlet angle, recirculation zones and flow detachment can occur, which both increase pressure drop to a large extent. The hydraulic diameter of the downstream channel is also included in the DoE. Larger channel diameters lead to a decrease in flow velocity. Therefore, has an effect on the turbulent field behind the nozzle and pressure regain process.
Potential process disturbance variables are fluctuations in process parameters, which would lead to varying void fractions. Therefore, this is studied in preliminary tests, where no significant deviation between set point and actual value was found. Manufacturing tolerances could also lead to distorted results. However, nozzle geometries are manufactured with a high-precision mechanical milling machine. Therefore, disturbance variables are neglected. An overview of DoE, including process inputs and outputs, is given in Figure 4.
In order to create the DoE, suitable ranges for process inputs have to be determined. The operating range of 80–120 mL/min is selected for the total volumetric flow rate . Preliminary experiments showed bubbly flow and turbulent bubble breakup upstream and downstream of the nozzle, respectively. The hydraulic diameter of the smallest cross section is varied between 0.75 mm and 0.25 mm. The dimensions of the upstream channel give the upper limit, since the nozzle diameter has to be noticeably smaller than the upstream channel. The lower limit is determined by pressure drop as it reaches high values, if combined with other extremes of the remaining parameters. The length of the smallest cross section was found to be in the range of 0.5–4.5 mm, as the upper limit results from a lack of space in the channel arrangement to investigate even longer nozzles. The nozzle’s outlet angle is investigated in the region of 5–90°. The smaller angle is the limit at which jet flow is observed [39], while 90° is the largest reasonable angle. Finally, the hydraulic diameter of the downstream channel is varied between 0.75–1.75 mm. Table 2 sums up all five parameters and their investigated ranges, which are included in the DoE.
3.1.2. Selection and Generation of an Experimental Design
Statistical software Minitab® 17 (Minitab Inc., State College, PA, USA) is used to create the DoE matrix. First, a suitable DoE method has to be chosen. With respect to the objective, a response surface design is chosen, as they are generally used to investigate the relationships between a process output (response variable) and a set of process inputs (experimental variables). These methods are employed after the identification of significant and controllable variables and for the finding of an optimal factor setting to optimize the response [57].
In combination with the chosen parameter ranges, the experimental design can be created. The number of single experiments can be determined by
with the number of parameters , the extent of the experimental design and repetition of the central point . According to Section 3.1.1, five parameters are included ( = 5). Furthermore, one half of a surface response plan is chosen ( = 1), while the central point ( = 6) is measured six times. The choice of half of the surface response plan does not allow for analyzing all single interactions; however, this most likely does not affect the results, since interactions of the third order or higher are negligible in most cases [58]. The DoE comprises 32 individual experiments results: six repetition experiments of the center point, 10 star points, and 16 corner points. All parameter combinations are summed up in Table 3.
3.2. Experimental Set-Up
The core element of the experimental set-up is the plate-type microreactor, which consists of a reaction plate including interchangeable nozzle geometry inlays. The microreactor’s 3D-model (a); an image of the reaction plate including the exchangeable nozzle element (b); and a close-up of the nozzle inlay element (c) are given in Figure 5.
A rectangular channel ( = 5 mm and = 1 mm) is milled into the upper side of the reaction plate downstream of the nozzle element. Two outer flanges press a view glass onto the upper side of the reaction plate to assure the watertightness of the channel. At the same time, the highly transparent polymethylmethacrylate (PMMA) plate and view glass, in combination with a light-emitting diode (LED) panel that is placed below the microreactor, allow for optical observation of the bubble breakup by a high-speed camera from above. The entire experimental set-up (a) and a flow chart (b) are displayed in Figure 6.
Fluidic connections for liquid and gas supply as well as outlet flow are laterally attached to the reaction plate. Continuous liquid phase is conveyed by means of a micro-gear pump (type mzr-7255, HNP Mikrosysteme GmbH, Schwerin, Germany) with an upstream inline filter (F-MI2, HNP Mikrosysteme GmbH, Schwerin, Germany) in order to avoid solid particles damaging the pump. The deionized water is stored in an open storage vessel, wherein the level is held constant to avoid pressure fluctuations due to a change in static pressure. This is realized by directing the water back into the storage vessel, once it has flowed through the microreactor. The liquid flow rate is measured with a Coriolis-type mass flow meter (mini Cori-Flow, Bronkhorst, The Netherlands) with an attached non-return valve (H 400 SS L, HAM-LET, Sugar Land, TX, USA). The gaseous flow rate is controlled by a pressure controller with a needle valve (MS4-LR-1/4-D6-A4, Festo AG & Co. KG, Esslingen am Neckar, Germany) and is measured by the mass flow meter EL-Flow (Bronkhorst HIGH-TECH B.V., Ruurlo, The Netherlands). Subsequently, the disperse phase passes through a non-return valve and the pressure sensor (type A-10, WIKA Alexander Wiegand SE & Co. KG, Klingenberg am Main, Germany) at the entry of the microreactor. The flow meters are calibrated before and after the experiments; the liquid phase with mechanical balances and the gaseous phase with volume measurement at a constant flow rate. Here, soap solution is brought into a measuring cylinder, which was manufactured at the faculty’s glass blowing workshop, and a soap meniscus is created at the zero level. The gas is then introduced through a lateral entrance beneath the zero level and the rising of the soap meniscus can be observed with influent nitrogen. All measured values are recorded for three minutes at constant flow rate and mean values are formed. Two-phase flow is generated in the T-mixer. It then passes through the nozzle and the adjacent channel. The pressure at the reactor outlet is measured with a second pressure sensor (type A-10, WIKA Alexander Wiegand SE & Co. KG, Klingenberg am Main, Germany). An LED panel is placed underneath the microreactor, while a high-speed camera (type Xtra Motion NR4, Imaging Solutions GmbH, Eningen, Germany) is set above the viewing glass. For additional optical zoom an objective is used (type macro zoom, Computar, Cary, NC, USA). The recording rate during the experiments varies between 10,000 and 20,000 fps and the exposure time is set to 22 μs for sharp contours in all experiments.
All nozzle elements are fabricated by mechanical precision milling by the faculty’s mechanical workshop according to the DoE values. A reference element is manufactured without the micronozzle. Therefore, the pressure drop induced by adjacent channels can be determined and subtracted from the measurements using nozzle inlays to obtain solely the pressure drop induced by the micronozzle. Table 4 gives an overview of fabricated nozzles.
3.3. Bubble Measurement
Bubble diameter measurement is done with open-source image processing software ImageJ v1.51d (National Institutes of Health, Rockville, MD, USA) for characterizing the dispersions. A known reference length is taken to translate pixels to real length. To obtain reliable data and defined bubbles, pixel errors and miniature bubbles are filtered. Serving as exclusion criteria, 0.05 mm in minimum bubble size is introduced. Since the pictures show a 2D view from above instead of a 3D view, bubble diameters have to be determined carefully. Bubble diameters are derived from the mean Feret diameter, projection area of the respective bubble, and bubble perimeter. An average of the three values is determined and employed as the representative mean bubble diameter. In order to provide an adequate statistical basis, experiments are performed in triplicate and 600 bubbles are analyzed per experiment, resulting in 1800 bubbles per experimental point. Therefore, resulting standard deviations are shown in the diagrams as bubble breakup in fluctuating jet flow shows a certain distribution. Finally, size and density distributions are obtained with [45]
and
Here represents the cumulative distribution and the relative frequency for i = 0, length distributions for i = 1, surface distributions for i = 2 and volume distribution for i = 3 [59]. Respective Sauter diameters are obtained from bubble size distributions.
4. Results
This section starts with a brief overview of generated flow maps. The selected parameters’ qualitative effect regarding turbulent bubble breakup and pressure drop is evaluated in Section 4.2 Subsequently, the results of the DoE are presented and models for daughter bubble size and pressure drop are derived. Parameter optimization regarding energy-efficient turbulent bubble breakup is carried out. Finally, a micronozzle featuring an optimized parameter setting is manufactured, tested, and compared with obtained models.
4.1. Flow Regimes
Flow maps for primary bubble generation and bubbly flow refinement via a micronozzle are produced to identify parameter ranges for the DoE. The focus is on bubbly flow during first-phase contacting and the turbulent breakup pattern induced by the micronozzle. Furthermore, it is tested how mother bubble size effects daughter bubble size.
4.1.1. Primary Bubble Generation at T-Mixer
Flow regime maps are created, using nozzle inlay A, as it represents the central point within the DoE. Total volumetric flow rate and gas content are varied and the resulting flow regime is observed. Additionally, capillary numbers reveal prevailing forces. Figure 7 depicts the flow maps.
Single-phase liquid flow is obtained at small total volumetric flow rates and low void fractions according to Figure 7a. Minimum volumetric gas flow rate with the gas flow meter is = 3 mL/min. At increased flow rates, bubbly flow is obtained for void fractions < 20%. Here, the liquid phase rapidly entrains bubbles at the T-mixer and bubbles are generated in a dripping regime. Accordingly, capillary numbers are in the range of 0.01 < < 0.1, see Figure 7b. This matches the literature data well [48]. For bubbly flow, shear stress caused by the continuous phase drove and collapsed the gaseous thread. Values of > 20% quickly lead to a transition from dripping to squeezing regime and from bubbly to slug flow pattern. At = 30%, exclusively slug flow is found in the investigated range. Here, pressure in the obstructed liquid phase is the main driver for bubble generation. Comparably high gaseous flow rates result in complete filling of the main channel by the gaseous phase. Surface tension is prominent, indicated by small numbers. The shear stress caused by the liquid phase to the gaseous thread is significantly smaller than the surface tension force in slug flow.
Resulting from these experiments, the region of interest is narrowed down to 10% < < 20% and 20 mL/min < < 160 mL/min, as the aim of this study is the refinement of bubbly flow.
4.1.2. Jet Flow Induced Bubble Redispersion
A breakup regime map is produced using nozzle inlay A to specify an operating window for turbulent bubble breakup behind the micronozzle. Since the potential operating window for the process parameters has been reduced by primary bubble generation, the main focus is on the process parameter region selected in Section 3.1.1. A bubble breakup map for total volumetric flow rate is shown in Figure 8a and dependencies on the dimensionless number in Figure 8b.
A deformation of a bubble is observed for low volumetric flow rates only. The external forces acting on the surface boundary result in phase boundary oscillation. However, they obviously cannot exceed the bubble’s stabilizing Laplace pressure. Therefore, the bubble keeps its size and no disruption is observed behind the micronozzle. However, bubbles are disrupted with laminar breakup at increased flow rates starting from = 40 mL/min, with mainly binary bubble breakup. A critical Weber number for laminar breakup is derived from Figure 8b and determined as ≈ 3. Data from simulations [60] and experiments [61] show similar critical Weber numbers for initial bubble breakup. The related number is on the order of ≈ 1330.
Turbulent bubble breakup starts at total volumetric flow rates of 60 mL/min and is observed throughout for higher flow rates. A critical number, marking the transition from laminar to turbulent breakup, is found for the ≈ 7–9 range depending on flow rate and void fraction. Related number is in the range of ≈ 2300–2660 depending on void fraction. The literature data show similar [62]. Consecutive incoming bubbles coalesce within the smallest cross section of the nozzle at high gaseous volumetric flow rates and void fractions > 20%. Here, two other regimes are observed. Annular flow is obtained behind the micronozzle starting at ≈ 6 and related ≈ 1600. In case of further increase of the liquid flow rate, disturbed annular flow is observed, which nicely displays turbulent eddies at > 10–12 and related ≥ 2660–3660 depending on . The observed breakup and flow regimes behind the micronozzle are shown in Figure 9.
The bubble, which is about to break up, is highlighted in the laminar regime in Figure 9. The bubble has taken a characteristic dumbbell shape and the neck is about to snap. Regarding the DoE, a range of = 80−120 mL/min is chosen at a constant void fraction of = 10%. Therefore, bubbly flow as well as turbulent bubble breakup is obtained and a distance to other breakup and flow regimes exists.
4.1.3. Relation between Mother and Daughter Bubble Size
Bubble generation is a highly dynamic process, especially in dripping mode and resulting bubbly flow. Consequently, bubbles of slightly varying size can be generated at the same time. This raises the question of whether the primary bubble size has a significant influence on the size of the daughter bubbles. According to Equation (5), smaller bubbles feature higher Laplace pressures. It is likely that smaller mother bubbles cannot be broken up as easily as comparably larger mother bubbles. In order to determine the influence of primary bubble size on the daughter bubble size, further preliminary experiments are carried out. In a first experimental series, the void fraction = 10% is held constant and the total volumetric flow rate is varied in the range of 50–150 mL/min. The second experimental series is carried out at constant liquid flow rate = 100 mL/min and varied gas flow rate in the range of = 8–18 mL/min. Results are shown in Figure 10a,b, respectively. Figure 10a shows that mother bubble size and daughter bubble size decrease at increasing total flow rates. On the one hand, increased total flow rate leads to a more rapid entrainment of the bubbles during formation. On the other hand, an increased number behind the micronozzle entails a higher degree of bubbly flow refinement. Standard deviations are prominent for mother and daughter bubbles, since bubble generation is a highly dynamic process. Interestingly, daughter bubbles show smaller standard deviations than mother bubbles, which means the bubble size distribution is narrower. Figure 10b shows a rather constant level of mother and daughter bubble size ratio. A slight decline can be seen with a closer look. Accordingly, smaller bubbles are disrupted nearly in the same ratio as larger mother bubbles. This can be explained by the rise in pressure drop; hence, energy dissipation is induced by the micronozzle at higher flow rates. Consequently, mother bubbles are harder to break up due to increased Laplace pressure. However, more energy is available for the bubble breakup behind the micronozzle at the same time. The slope of a linear trend line for the ratios in Figure 10b is determined as = −0.0004 min/mL. This indicates that the Laplace pressure rises marginally faster than the energy dissipation rate. Nonetheless, the effect is negligible, especially in the range of interest for 80 mL/min < < 120 mL/min.
In order to exclude the effect of increasing energy dissipation rate at higher liquid flow rates, a second experimental series is carried out at constant liquid flow rate = 100 mL/min. However, similar results are obtained. Figure 10c shows increasing mother bubble size at higher gaseous flow rates. More nitrogen penetrates into the liquid channel before the mother bubble is entrained by the liquid phase. It can also be seen that larger mother bubbles resulted in daughter bubbles with an increased bubble diameter. Figure 10d depicts the ration of refined bubbles and primary bubbles. Again an insignificant decline is found and a rather constant level can be assumed. Therefore, the effect is not included within the DoE. All preliminary experiments are completed and the qualitative effect of the selected parameters on the turbulent bubble breakup is investigated.
4.2. Redispersion Parameters
In order to determine the qualitative effect of the redispersion influencing parameters, an experimental series is executed. Nozzle inlays featuring the central point parameters and the star points’ parameters from the DoE are employed. The nozzle of the central point shows mean parameter values for all factors. The star point nozzles vary in only one parameter from each other, which is the minimum and maximum value of each single parameter. All other factors remain constant at mean values. This experimental series is carried out at total volumetric flow rates of 60, 80, 100, and 120 mL/min, respectively, while the gas content is set to = 10%.
4.2.1. Influence of Hydraulic Diameter
For the investigation of the smallest cross section hydraulic diameter and its effect on bubble refinement, nozzle inlays A, H, and I are investigated according to Table 4. All geometrical parameters have the same values besides the hydraulic diameter . Nozzle inlay A exhibits a hydraulic diameter of 0.5 mm in the smallest cross section, nozzle inlay H 0.25 mm, and nozzle inlay I 0.75 mm, respectively. Figure 11 displays the results for resulting Sauter and mean daughter bubble diameter at varied total volumetric flow rates.
Figure 11a shows decreasing Sauter diameters at higher volumetric flow rates, which can be derived from the results of each single nozzle. The largest Sauter bubble diameters are obtained for nozzle H with = 0.75 mm, followed by nozzle A with = 0.5 mm. The smallest bubbles are obtained by employing nozzle inlay I, which exhibited the smallest hydraulic diameter, = 0.25 mm. The strong impact of on bubble disruption is evident. The acceleration and speed of liquid flow through narrower nozzles lead to higher pressure differences in front of and within the nozzle. Additionally, higher numbers are obtained and the grade of turbulence behind the micronozzle is increased. Therefore, velocity oscillations and pressure fluctuations result in increased bubble breakup. Figure 11b shows the mean daughter bubble diameter plotted over mean energy dissipation rates. The dissipation rates increase by several magnitudes the narrower the nozzles are. Interestingly, even the highest volumetric flow rate for nozzle I shows a lower energy dissipation rate than the lowest flow rate employed for nozzle A. The same applies for the maximum flow rate of inlay element A and the minimum flow rate of nozzle H. In general, nozzles with smaller may produce finer dispersions; however, they do not exhibit the most energetically favorable solution. As an example, using nozzle I at high flow rates results in daughter bubbles, which are slightly smaller than those generated with nozzle A at low flow rates. Still, a smaller energy dissipation rate is obtained for nozzle I. The same results are obtained for a comparison of nozzle A and nozzle geometry H. This displays the necessity of energetic evaluation of the bubble breakup process to increase the nozzle’s efficacy. Standard deviations are prominent in Figure 11b. However, it is observed that mean daughter bubble size standard deviations decrease at smaller hydraulic diameters. Therefore, a smaller standard deviation is obtained next to smaller daughter bubbles.
4.2.2. Influence of Length of Smallest Cross Section
Nozzle geometries A, F, and G (see Table 4) are employed to examine the qualitative impact of the smallest cross section’s length for bubble refinement. These nozzles possess geometrical parameters of the same values besides the nozzle’s length . Nozzle inlay A has a length of 2.5 mm, nozzle element F features 0.5 mm length, and geometry G 4.5 mm. Figure 12 displays the results for varied total volumetric flow rates regarding Sauter and mean bubble diameter. Figure 12a displays results for Sauter diameter obtained at different . A decrease in bubble size is observed for higher flow rates, similar to previous experiments. The length of the nozzle’s smallest cross section also affects the refinement of the dispersed phase. At constant , shorter nozzles result in coarser daughter bubbles. Nozzle inlay F shows the largest values for Sauter diameter, followed by the center point inlay A and, subsequently, the longest nozzle length in geometry G with the smallest Sauter diameters. However, the variations are comparably small.
Figure 12b shows a declining mean bubble size as the energy dissipation rate increases. An extension of the nozzle length shifts the energy dissipation rates to higher values. Comparing nozzle geometry A and F, experimental points for the same volumetric flow rate are close to each other. Further elongation of the smallest cross section leads to significant shifts of energy dissipation rates to higher and bubble size to smaller values. Thus, finer bubble fragments are obtained. At first glance this seems physically reasonable. However, taking a look at the respective pressure losses in Figure 12c reveals higher pressure drops for nozzle F compared to inlay A, even though F features the smallest cross section. Flow development within the nozzle has to be taken into account here. For extremely short nozzles such as nozzle F, converging and diverging nozzle regions are close to each other and flow is immediately disturbed again as soon as it enters the smallest cross section. This results in an unsteady flow behavior and increased pressure loss and can be explained by an orifice effect, which causes strong turbulence in the wake of a sharp edge. Strong eddies lead to higher pressure loss and can also have a positive effect on the bubble breakup process. Flow through nozzle inlay A is obviously able to develop and is disturbed further on. The change from converging to diverging flow is less abrupt and a lower pressure drop is attained. For extremely long nozzles such as nozzle G, the orifice effect is eliminated, but the influence of wall friction increases. Hence, flow development effects are subordinate and a higher pressure drop is attained. These effects could be interesting regarding bubble breakup efficacy and are further investigated in the DoE.
4.2.3. Influence of Diffusor Angle
Nozzle geometries A, J, and K (see Table 4) are employed to examine the impact of diffusor angle on bubble disruption behind the micronozzle. Geometrical parameters are identical except for the divergence angle. Nozzle inlay A has a diffusor angle of 47.5°; nozzle element J possesses a nozzle outlet angle of 5°, and geometry K 90°, respectively. Figure 13 displays the results for varied total volumetric flow rates regarding Sauter and mean bubble diameter. According to Figure 13a, the diffusor angle has an impact on the redispersion behavior; however, it is comparably low. Larger volumetric flow rates produce finer dispersions for respective nozzle geometries reinforcing the influence of volumetric flow rate. Larger nozzle outlet angles result in smaller daughter bubble fragments behind the micronozzle. This tendency applies for Sauter and mean bubble diameter, confirming results from previous studies [39].
At the same time, energy dissipation rate decreases, as displayed in Figure 13b. Thus, greater diffusor angles show more efficient bubble breakup, which can be linked to improved pressure recovery. Furthermore, large nozzle outlet angles lead to the formation of recirculation zones at large nozzle outlet angles, favoring finer dispersions. Shear forces and velocity gradients between core jet flow and adjacent recirculation zones act strongly on the phase boundaries. Consequently, bubble disruption is obtained. The downward ramp in the nozzle outlet, as a consequence from squared channels, results in remarkable recirculation zones even at small diffusor angles.
4.2.4. Influence of Downstream Channel Hydraulic Diameter
Nozzle geometries A, J, and K (see Table 4) are employed to examine the impact of diffusor angle on bubble disruption behind the micronozzle. Geometrical parameters are identical besides the divergence angle. Nozzle inlay A features a diffusor angle of 47.5°; nozzle element J possesses a nozzle outlet angle of 5°, and geometry K 90°, respectively. Figure 14 displays the results for varied total volumetric flow rates regarding Sauter and mean bubble diameter.
The size of bubble fragments increases with larger hydraulic channel diameters behind the nozzle (see Figure 14a). Smaller dimensions of the outlet channel keep numbers at higher levels downstream of the smallest cross section and, thus, the degree of turbulence stays elevated. Simultaneously, the energy dissipation rate is shifted to higher values due to greater pressure losses for smaller hydraulic diameters. Velocity fluctuations contribute to increased energy dissipation rates at the same time. The results are pronounced velocity and pressure gradients in the channel that promote the generation of finer dispersions. The impact of larger dissipation volumes in the case of larger channels and pressure recovery seems to possess a subordinate role, as can be concluded from Figure 14b. Also, higher collision probability and, hence, coalescence of daughter bubbles seem to be less important. Therefore, parameter could be an interesting parameter regarding the energy optimization of bubble breakup.
Despite the smaller mean bubble diameters, relatively large bubble fragments are observed for smaller hydraulic diameters of the outlet channel. When the bubble exits the nozzle’s smallest cross section, the disperse phase displaces the continuous phase and pushes it forward. In this way, the bubble is quickly stabilized by the channel wall, so that large bubble fragments remain next to many small daughter bubbles.
4.2.5. Influence of Volumetric Flow Rate
Most of the above results show a strong influence of volumetric flow rate on bubble breakup. In this section a closer look is taken at this process parameter and its impact on bubble breakup. Figure 15 shows the experimentally determined pressure drop Δp and the derived mean energy dissipation rate as a function of the volumetric flow for nozzle geometries A, G, and I. Furthermore, the obtained Sauter diameter and bubble density distribution are shown for various flow rates in Figure 15c,d. In Figure 15a pressure drop can be seen, which occurs in nozzles A, G, and I for various flow rates. An increase in pressure loss for elevated flow rates is evident for all tested geometries. With higher flow rates wall friction increases and more energy is dissipated into the system, thus, energy for bubble breakup is provided. Nozzle inlay G shows highest pressure drops. Compared to nozzle inlay A ( = 2.5 mm), geometry G features an increased nozzle length of 4.5 mm, which explains this result. Nozzle geometry I exhibits a larger hydraulic diameter within the smallest cross section ( = 0.75 mm) in contrast to A and G ( = 0.5 mm). Therefore, pressure drop induced by nozzle I is the smallest for all volumetric flow rates.
The increased pressure drop is accompanied by higher energy dissipation rates, which is displayed in Figure 15b. For a single nozzle, energy dissipation rates are enhanced by increasing volumetric flow rate and, thus, the observed trends are similar to those for pressure drops. Nozzle G displays the largest energy dissipation rates, while geometry A and geometry I have the lowest values. Thus, the breakup of mother bubbles is intensified for nozzle G, as shown in Figure 15c. For a single nozzle, smaller daughter bubbles are obtained for increased volumetric flow rates. In particular, the first experimental point of nozzle I ( = 60 mL/min) displays large daughter bubbles. Here, laminar breakup is observed. The other nozzles show a steady decrease in daughter bubble size. Due to high energy dissipation rates, small daughter bubbles are obtained and result in higher interfacial area.
Figure 15d shows the bubble density distribution for nozzle A. The impact of volumetric flow rate on bubble disruption is evident. Small volumetric flow rates lead to broad distributions at comparably large bubble diameters. The distribution is narrowed and shifted towards smaller bubble diameters for increased flow rates. However, all distributions show a unimodal shape, hence turbulent breakup is attained.
4.2.6. Evaluation of Energy Efficacy of Redispersion
The ratio of Sauter diameters is plotted over the pressure loss ratio for energy evaluation of the parameter impact on bubble breakup in Figure 16. Low diameter ratios indicate increased bubble refinement. Pressure loss ratio displays, at what expense the refinement is obtained. The best configuration would be a pressure loss ratio near 1, indicating no change in pressure loss, and small ratios of at the same time. The ratio of Sauter diameters is determined by the minimum Sauter diameter of an experimental point divided by the maximum attained Sauter diameter at the same volumetric flow rate. To further clarify this, an example is given for the impact of . The Sauter diameter ratio is determined by / for a similar flow rate, since the daughter bubble diameter is smaller for = 0.25 mm than for = 0.75 mm. The corresponding pressure loss ratio is determined by /. Four different flow rates are employed, resulting in four points for each parameter in Figure 16. Here, bubble diameter ratios for different pressure drop ratios are shown and the energy efficacy of bubble breakup is derived.
Obviously, nozzle length extension does not significantly affect the refinement of bubbly flow. The size of obtained bubbles varies marginally, as indicated by a relatively large ratio near 1. Enlargement of the diffusor angle proves to be slightly more effective, since resulting ratios are lower and, at the same time, the resulting pressure loss ratio is smaller. An increase in the volumetric flow rate leads to even finer bubbles, while the pressure loss ratio increases again. The energetically more efficient solution appears to be the reduction of the hydraulic diameter in the channel behind the nozzle. Here, bubble size decreases significantly; however, the pressure loss ratio increases only slightly. The reduction of the smallest cross section’s hydraulic diameter is particularly influential. The ratio of Sauter diameters and the pressure drops ratio differ strongly from the other parameters. The reduction in the nozzle gap results in the ratio of = 0.25−0.35 and pressure loss ratio of = 180−900. Small nozzle cross sections lead to considerably smaller bubbles, but also push the pressure loss to significantly higher values. Therefore, they do not form the most energy-efficient bubble breakup parameter.
4.3. Energy Optimization of Turbulent Bubble Breakup Assisted by Design of Experiment
In the following section, insights gained concerning the effect of the respective parameters are further analyzed with regard to quantitative influence. For this purpose, two separate models for the obtained bubble size and the resulting pressure loss are successively generated from the experimental DoE results. A factor setting optimization is carried out in order to identify an energy-efficient bubble breakup.
The results of all experiments executed within the DoE are displayed in Figure 17, which shows obtained bubble diameters in dependence on corresponding pressure losses. Regression models are derived from this data.
At first, a steep decline is evident for mean daughter bubble diameters at increasing pressure drops. Here, bubbles rapidly break up in turbulent flow behind the micronozzle. However, the curve indicates asymptotic behavior, starting at around 600 mbar. Despite pressure drops of 4 bar, the refinement of dispersion is not significantly enhanced and a minimum bubble diameter seems to be existent around 0.1 mm. Laplace pressure and surface tension is assumed to be predominant at this scale. According to the Kolmogorov–Hinze theory, the Laplace pressure increases with decreasing bubble size and stabilizes the bubble against external stress forces so that no further breakup of the bubbles occurs. Therefore, it can be assumed that efficient breakup is obtained at comparably low pressure drop.
4.3.1. Regression Models for Daughter Bubble Size and Pressure Drop Derived from DoE
Regression calculations are performed using the Minitab® 17 analyzer tool. In the first step, all parameters along with their quadratic terms and interactions are included. Pareto charts of effects are generated for mean daughter bubble diameter and pressure drop. Here, the most important parameters are evaluated regarding their significance for the respective output variable. In order to assess a high-quality model, non-significant parameters have to be excluded. They are identified with the assistance of Pareto charts of effects and then successively removed from the regression models. Factors are non-significant when their t-value is below 2.13 in the Pareto chart of effects [63], as the t-value characterizes the difference between a single sample statistic and the mean of the total population [64]. The representation in the Pareto chart is carried out with absolute t-values. Statistically significant parameters are identified by the fact that they exceed the reference line, which indicates the critical t-value as shown in Figure 18 for mean daughter bubble size. The elimination leads to an adapted regression model regarding the daughter bubble size and pressure drop. Main effects (single parameter) are included in the models despite non-significance in case related interactions or quadratic terms are significant. The corresponding Pareto chart for mean daughter bubble size and the associated main effect diagram are shown in Figure 18. The Pareto chart of effects for bubble size in Figure 18a shows that parameters , , , and have a particularly significant influence on the resulting bubble size. This result corresponds well with the qualitative observations made in Section 3.2. Smaller hydraulic diameters of the nozzle’s smallest cross section lead to higher velocities in the nozzle. Thus, stronger pressure and velocity gradients within the liquid flow are present in the diverging nozzle part. This also accounts for the increase in volumetric flow rate. Smaller dimensions of the channel behind the nozzle also lead to a decrease in bubble size. Higher degrees of turbulence due to higher speed in the confined channel result in enhanced bubble breakup. The quadratic terms of and have a significant effect. As the nozzle length is increased, the orifice effect is dampened and the mean bubble diameter increases. Above a nozzle length of 2.0 mm, the mean daughter bubble size decreases again.
The main effect diagram in Figure 18b shows the regression models for each main parameter. The ordinate displays obtained daughter bubble mean diameters. The abscissa is divided into various sections for each main parameter. The quadratic correlation of the nozzle length and daughter bubble size can be seen clearly. A steep increase in bubble diameter is found at larger values for the hydraulic diameter of the smallest cross section. The rather low influence of the nozzle’s outlet angle is evident as the slope of the graph within the main effect diagram is small.
Finally, the quality of the regression model is evaluated. The lack of adaptation of the model is non-significant, with a t-value of 0.071. Thus, large residuals between the experimental data and regression for response variables do not exist. The degree of determination is obtained at R2 = 96.3% and standard deviation of bubble size is as low as 0.015 mm for bubble diameter. Therefore, the model indicates high quality. Figure 19 displays the Pareto chart of effects (a) and the main effect diagram (b) for the pressure drop.
The parameters and exhibit a reasonable impact on the pressure drop. Both linear and quadratic terms feature the largest t-values and, thus, have the strongest effect on pressure loss. The high significance of the squared -term along with the calculated main effect diagram confirm the theory of diaphragm effect for short nozzle lengths. Nonetheless, the hydraulic diameter of the nozzle has the strongest effect on pressure drop. The enormous increase in flow velocity results in a rapid increase in pressure loss, which can also be noticed in the main effects diagram. The influence of and on the pressure loss is also significant. A higher volumetric flow rate leads to enhanced velocities and higher pressure losses. A smaller hydraulic diameter of the duct downstream of the nozzle results in a more significant pressure drop. However, the impact is comparably small, which can also be linked to rather small slopes in the main effects diagram regarding the downstream channel diameter. The effect of the diffusor angle on the pressure loss shows no significance. Standard deviation of the residuals is obtained at 26.21 mbar and the degree of determination of the regression is R2 = 95.83%. These values indicate that the model is well adapted to the experimental data.
4.3.2. Geometry for Energy-Optimized Bubble Breakup
In order to determine the optimal geometry with regard to an efficient bubble breakup, a response optimization is carried out with the generated models in the factor optimization tool in Minitab® 17. The aim is to minimize the bubble size at reasonable pressure drops. Since these two output variables are contrary, a compromise has to be found. Both response variables are evenly weighted during optimization and the model is shown in Figure 20.
The model shows the predicted values (y-values) for the mean bubble diameter and the pressure loss for the respective factor settings. In addition, the degree of desirability is indicated for the individual response variables (d-values) and the composite overall desirability (D-value). In general, the desirability values can take a value between zero and one. Here, a value of 1 indicates that the level of desirability has completely met the needs. For the individual response variables, the degree of desirability indicates the extent to which the selected parameter settings are compatible with the respective selected target. In the optimization of the target variables the focus is on the composite desirability that characterizes the conformity of both objectives. In order to determine the optimal settings of the parameters, the maximum must be found in the curves of the composite desirability.
Maximum composite desirability can be located easily if the portrayed function features a global maximum. The graph for nozzle length has such an optimum at 1.5 mm. Hence, this length is chosen for the optimal bubble dispersing nozzle. The optimum for the nozzle’s hydraulic diameter regarding efficient bubble breakup is 0.5 mm. At smaller diameters, considerably finer bubble fragments are produced; however, the pressure loss also increases immensely. Larger diameters than 0.5 mm are accompanied by lower pressure losses; however, the resulting bubble size increases significantly at the same time. In case a linear composite desirability graph is present, the highest values can be chosen, bearing in mind the distance to the model’s boundaries, as this is where the highest inaccuracies are found. A linear curve is found for the diffusor angle . Large diffusor angles have a slightly positive effect on the bubble diameter and the resulting pressure drop. Consequently, the combined desirability increases at larger diffusor angle and 80° is selected for the optimum setting. For larger , the composite desirability shows decreasing behavior. On the one hand, there is a decrease in the pressure loss at larger . On the other hand, the mean bubble diameter increases at larger . Finally, a hydraulic diameter of the downstream channel of = 1 mm is preferred. High volumetric flow rates lead to increased pressure loss. Nonetheless, the decrease in daughter bubble size seems to be dominant and leads to higher values of composite desirability. A volumetric flow rate of 115 mL/min is selected. For these parameters the model predicts a bubble diameter of = 0.106 mm at a pressure drop of = 442 mbar. The geometrical measures for the micronozzle are summed up in Table 5. The nozzle with the optimal parameter settings is manufactured and tested for the validation of the parameter optimization and the regression models. The micronozzle is displayed in Figure 21.
4.3.3. Model Validation Experiment Using Optimal Parameter Settings
Predicted values for the chosen parameter settings regarding bubble size and pressure drop are = 0.106 mm and = 442 mbar. Conformity is verified in an additional experiment, which is carried out according to Section 2 using the optimal nozzle inlay, a volumetric flow rate of 115 mL/min, and a void fraction of 0.1%.
The results of the validation experiment show good agreement with the predicted values using the regression model. The obtained mean daughter bubble diameter in the validation experiment is determined to be 0.104 mm. When compared to the predicted diameter, a deviation of 2% is evident. Thus, it is within the range of the model’s standard deviation of 0.01 mm for daughter bubble diameter. The pressure drop induced by the micronozzle in the validation experiment is determined to be 358 mbar. This presents a deviation from the predicted value of 443 mbar. However, it is within three times the standard deviation. Consequently, the experimental point obtained with optimal parameter settings is close to the potential trend line from DoE results, which is shown in Figure 22a. As expected, it is located at the steep decrease of the trend line. The obtained bubble density distribution (Figure 22b) is narrow. This feature is characteristic of all experiments, indicating turbulent bubble breakup. However, the distribution for optimal parameter settings is even narrower compared to other distributions in the turbulent breakup regime (compare to Figure 15d) and monodispersity is approached. Standard deviations are observed to be more prominent at larger daughter bubbles and smaller pressure drop. As the pressure drop increases, standard deviations decrease.
5. Conclusions
This study aims at energy-efficient bubble breakup in the turbulent regime for gas–liquid applications in a microstructured reactor. A combination of a millichannel and a micronozzle is employed to realize turbulent breakup regime and, therefore, the controlled generation of increased interfacial area at rather low pressure drops.
First, a suitable process window is derived for a subsequent DoE, including bubbly flow upstream of the nozzle and turbulent breakup downstream of the nozzle. Primary bubble generation and regimes in a T-mixer and various bubble breakup regimes behind the micronozzle are identified and characterized, which comprised laminar, turbulent, and coalescing regimes. Bubble generation regime maps and bubble breakup regime maps indicated suitable parameter ranges for a DoE. Volumetric flow rate, nozzle diameter, and nozzle length are identified as most influential, which is supported by the DoE results. Regression models are obtained using the DoE and Minitab® 17 statistical software, which allow for the prediction of daughter bubble diameters and pressure drops. Parameter optimization led to optimal settings for geometrical nozzle parameters and volumetric flow rate for energy-efficient bubble breakup. The models are validated using the micronozzle featuring the optimal geometrical parameters.
With the obtained models it is possible to manufacture micronozzles according to process demands for gas–liquid dispersions, and resulting bubble diameters and nozzle-induced pressure drops can be predicted prior to experiments. However, this is limited to the observed parameter ranges for now. The accuracy for extrapolation still has to be tested and will be a subject for future studies. The optimal parameter setting for efficient turbulent bubble breakup allows for the generation of small bubbles with high interfacial area at a reasonable pressure drop. Future studies will be dedicated to a universal physical model using dimensionless numbers. Since this study presents phenomenological investigations, future studies will also contain a visualization of interfacial mass transport by using color changing redox systems.
Acknowledgments
The authors would like to acknowledge the excellent support of scientific workshop of TU Dortmund University, which manufactured the microreactor and nozzle inlay elements.
Author Contributions
Fabian Varel and Felix Reichmann conceived and designed the experiments; Fabian Varel performed the experiments; Fabian Varel and Felix Reichmann analyzed the data; Felix Reichmann and Norbert Kockmann wrote the paper.
Conflicts of Interest
The authors declare no conflict of interest. The founding sponsors had no role in the design of the study; in the collection, analyses, or interpretation of data; in the writing of the manuscript, and in the decision to publish the results.
Nomenclature
| Latin Symbols | |
| a | aspect ratio, - |
| channel width, m | |
| Sauter diameter, m | |
| bubble diameter, m | |
| hydraulic diameter, m | |
| channel height, m | |
| number of parameters, - | |
| length, m | |
| Kolmogorov length scale, m | |
| extent of DoE, - | |
| number of experiments, - | |
| pressure difference, bar | |
| relative frequency of size distribution, m−1 | |
| cumulative size distribution, - | |
| area, m2 | |
| mean velocity, m·s−1 | |
| velocity, m·s−1 | |
| perimeter, m | |
| temperature | |
| volumetric flow rate, m3 s−1 | |
| volume, m3 | |
| number of repetitions of one experimental point, - | |
| Greek Symbols | |
| angle, ° | |
| mean energy dissipation rate, m2 s−3 | |
| local energy dissipation rate, m2 s−3 | |
| dynamic viscosity, kg·m−1·s−1 | |
| kinematic viscosity, m2·s−1 | |
| density, kg·m−3 | |
| surface tension, kg·s−2 | |
| void fraction, % | |
| Subscripts | |
| parameter regarding upstream channel of the nozzle, - | |
| parameter regarding nozzle’s smallest cross section, - | |
| parameter regarding downstream channel of the nozzle, - | |
| bubble | |
| critical number for laminar breakup | |
| critical number for turbulent breakup | |
| dissipation | |
| gaseous phase | |
| component , … | |
| component , … | |
| liquid phase | |
| pressure loss | |
| relative | |
| total | |
| Abbreviations | |
| DoE | Design of Experiment |
| LED | light-emitting diode |
| Dimensionless Numbers | |
| Capillary number, - | |
| Reynolds number, - | |
| Weber number, - | |
References
- Gutmann, B.; Cantillo, D.; Kappe, C.O. Continuous-flow technology—A tool for the safe manufacturing of active pharmaceutical ingredients. Angew. Chem. Int. Ed. 2015, 54, 6688–6728. [Google Scholar] [CrossRef] [PubMed]
- Roberge, D.M.; Ducry, L.; Bieler, N.; Cretton, P.; Zimmermann, B. Microreactor Technology: A Revolution for the Fine Chemical and Pharmaceutical Industries? Chem. Eng. Technol. 2005, 28, 318–323. [Google Scholar] [CrossRef]
- Brzozowski, M.; O’Brien, M.; Ley, S.V.; Polyzos, A. Flow chemistry: Intelligent processing of gas-liquid transformations using a tube-in-tube reactor. Acc. Chem. Res. 2015, 48, 349–362. [Google Scholar] [CrossRef] [PubMed]
- Cantillo, D.; Kappe, C.O. Halogenation of organic compounds using continuous flow and microreactor technology. React. Chem. Eng. 2017, 2, 7–19. [Google Scholar] [CrossRef]
- Jähnisch, K.; Baerns, M.; Hessel, V.; Ehrfeld, W.; Haverkamp, V.; Löwe, H.; Wille, C.; Guber, A. Direct fluorination of toluene using elemental fluorine in gas/liquid microreactors. J. Fluor. Chem. 2000, 105, 117–128. [Google Scholar] [CrossRef]
- Irfan, M.; Glasnov, T.N.; Kappe, C.O. Heterogeneous catalytic hydrogenation reactions in continuous-flow reactors. ChemSusChem 2011, 4, 300–316. [Google Scholar] [CrossRef] [PubMed]
- Zhao, C.X. Multiphase flow microfluidics for the production of single or multiple emulsions for drug delivery. Adv. Drug Deliv. Rev. 2013, 65, 1420–1446. [Google Scholar] [CrossRef] [PubMed]
- Plutschack, M.B.; Pieber, B.; Gilmore, K.; Seeberger, P.H. The Hitchhiker’s Guide to Flow Chemistry. Chem. Rev. 2017, 117, 11796–11893. [Google Scholar] [CrossRef] [PubMed]
- Mallia, C.J.; Baxendale, I.R. The Use of Gases in Flow Synthesis. Org. Process Res. Dev. 2016, 20, 327–360. [Google Scholar] [CrossRef] [Green Version]
- Elvira, K.S.; i Solvas, X.C.; Wootton, R.C.R.; deMello, A.J. The past, present and potential for microfluidic reactor technology in chemical synthesis. Nat. Chem. 2013, 5, 905–915. [Google Scholar] [CrossRef] [PubMed]
- Hartman, R.L.; Jensen, K.F. Microchemical systems for continuous-flow synthesis. Lab Chip 2009, 9, 2495–2507. [Google Scholar] [CrossRef] [PubMed]
- Kockmann, N.; Gottsponer, M. Heat Transfer Limitations of Gas-Liquid Exothermic Reactions in Microchannels. In Proceedings of the 8th International Conference on Nanochannels, Microchannels and Minichannels-2010, Montreal, QC, Canada, 1–5 August 2010; ASME: New York, NY, USA, 2011; pp. 193–199. [Google Scholar] [CrossRef]
- Kockmann, N.; Roberge, D.M. Harsh Reaction Conditions in Continuous-Flow Microreactors for Pharmaceutical Production. Chem. Eng. Technol. 2009, 32, 1682–1694. [Google Scholar] [CrossRef]
- Chen, G.; Yue, J.; Yuan, Q. Gas-Liquid Microreaction Technology: Recent Developments and Future Challenges. Chin. J. Chem. Eng. 2008, 16, 663–669. [Google Scholar] [CrossRef]
- Kashid, M.N.; Renken, A.; Kiwi-Minsker, L. Gas–liquid and liquid–liquid mass transfer in microstructured reactors. Chem. Eng. Sci. 2011, 66, 3876–3897. [Google Scholar] [CrossRef]
- Kashid, M.N.; Kiwi-Minsker, L. Microstructured Reactors for Multiphase Reactions: State of the Art. Ind. Eng. Chem. Res. 2009, 48, 6465–6485. [Google Scholar] [CrossRef]
- Noël, T.; Hessel, V. Membrane microreactors: Gas-liquid reactions made easy. ChemSusChem 2013, 6, 405–407. [Google Scholar] [CrossRef] [PubMed]
- Ward, K.; Fan, Z.H. Mixing in microfluidic devices and enhancement methods. J. Micromech. Microeng. 2015, 25. [Google Scholar] [CrossRef] [PubMed]
- Hessel, V.; Angeli, P.; Gavriilidis, A.; Löwe, H. Gas−Liquid and Gas−Liquid−Solid Microstructured Reactors: Contacting Principles and Applications. Ind. Eng. Chem. Res. 2005, 44, 9750–9769. [Google Scholar] [CrossRef]
- Abiev, R.; Svetlov, S.; Haase, S. Hydrodynamics and Mass Transfer of Gas-Liquid and Liquid-Liquid Taylor Flow in Microchannels. Chem. Eng. Technol. 2017, 60, 5895. [Google Scholar] [CrossRef]
- Fu, T.; Ma, Y. Bubble formation and breakup dynamics in microfluidic devices: A review. Chem. Eng. Sci. 2015, 135, 343–372. [Google Scholar] [CrossRef]
- Xu, J.; Cheng, P.; Zhao, T. Gas–liquid two-phase flow regimes in rectangular channels with mini/micro gaps. Int. J. Multiph. Flow 1999, 25, 411–432. [Google Scholar] [CrossRef]
- Triplett, K.A.; Ghiaasiaan, S.M.; Abdel-Khalik, S.I.; Sadowski, D.L. Gas–liquid two-phase flow in microchannels Part I: Two-phase flow patterns. Int. J. Multiph. Flow 1999, 25, 377–394. [Google Scholar] [CrossRef]
- Hessel, V.; Renken, A.; Schouten, J.C.; Yoshida, J. Micro Process Engineering: A Comprehensive Handbook; Wiley-VCH: Berlin, Germany, 2009. [Google Scholar]
- Hessel, V.; Löwe, H.; Schönfeld, F. Micromixers—A review on passive and active mixing principles. Chem. Eng. Sci. 2005, 60, 2479–2501. [Google Scholar] [CrossRef]
- Anna, S.L.; Bontoux, N.; Stone, H.A. Formation of dispersions using “flow focusing” in microchannels. Appl. Phys. Lett. 2003, 82, 364–366. [Google Scholar] [CrossRef]
- Garstecki, P.; Gitlin, I.; DiLuzio, W.; Whitesides, G.M.; Kumacheva, E.; Stone, H.A. Formation of monodisperse bubbles in a microfluidic flow-focusing device. Appl. Phys. Lett. 2004, 85, 2649–2651. [Google Scholar] [CrossRef]
- Nguyen, N.T. Micromixers: Fundamentals, Design and Fabrication, 2nd ed.; Elsevier: Amsterdam, The Netherlands, 2012. [Google Scholar]
- Nagy, K.D.; Shen, B.; Jamison, T.F.; Jensen, K.F. Mixing and Dispersion in Small-Scale Flow Systems. Org. Process Res. Dev. 2012, 16, 976–981. [Google Scholar] [CrossRef]
- Reichmann, F.; Tollkötter, A.; Körner, S.; Kockmann, N. Gas-liquid dispersion in micronozzles and microreactor design for high interfacial area. Chem. Eng. Sci. 2017, 169, 151–163. [Google Scholar] [CrossRef]
- Rothstock, S.; Hessel, V.; Löb, P.; Werner, B. Characterization of a Redispersion Microreactor by Studying its Dispersion Performance. Chem. Eng. Technol. 2008, 31, 1124–1129. [Google Scholar] [CrossRef]
- Reichmann, F.; Tollkötter, A.; Kockmann, N. Investigation of Bubble Break-Up in Microchannel Orifices. In Proceedings of the ASME 14th International Conference on Nanochannels, Microchannels, and Minichannels-2016, Washington, DC, USA, 10–13 July 2016; The American Society of Mechanical Engineers: New York, NY, USA, 2016. [Google Scholar] [CrossRef]
- Zheng, C.; Tan, J.; Wang, K.; Luo, G.S. Stability and pressure drop of gas–liquid micro-dispersion flows through a capillary. Chem. Eng. Sci. 2016, 140, 134–143. [Google Scholar] [CrossRef]
- Gordiychuk, A.; Svanera, M.; Benini, S.; Poesio, P. Size distribution and Sauter mean diameter of micro bubbles for a Venturi type bubble generator. Exp. Therm. Fluid Sci. 2016, 70, 51–60. [Google Scholar] [CrossRef]
- Uesawa, S.I.; Kaneko, A.; Nomura, Y.; Abe, Y. Fluctuation of Void Fraction in the Microbubble Generator with a Venturi Tube. In Proceedings of the ASME/JSME/KSME Joint Fluids Engineering Conference-2011, Hamamatsu, Japan, 24–29 July 2011; The American Society of Mechanical Engineers: New York, NY, USA, 2012; pp. 2483–2492. [Google Scholar] [CrossRef]
- Reichmann, F.; Koch, M.J.; Kockmann, N. Investigation of Bubble Breakup in Laminar, Transient, and Turbulent Regime behind Micronozzles. In Proceedings of the ASME 15th International Conference on Nanochannels, Microchannels, and Minichannels-2017, Cambridge, MA, USA, 27–30 August 2017; The American Society of Mechanical Engineers: New York, NY, USA, 2017. in press. [Google Scholar]
- Nomura, Y.; Uesawa, S.I.; Kaneko, A.; Abe, Y. Study on Bubble Breakup Mechanism in a Venturi Tube. In Proceedings of the ASME/JSME/KSME Joint Fluids Engineering Conference-2011, Hamamatsu, Japan, 24–29 July 2011; The American Society of Mechanical Engineers: New York, NY, USA, 2012; pp. 2533–2540. [Google Scholar] [CrossRef]
- Reichmann, F.; Koch, M.J.; Körner, S.; Kockmann, N. Internal Jet Formation during Bubble Generation in Microchannels. In Proceedings of the ASME 15th International Conference on Nanochannels, Microchannels, and Minichannels-2017, Cambridge, MA, USA, 27–30 August 2017; The American Society of Mechanical Engineers: New York, NY, USA, 2017. in press. [Google Scholar]
- Tollkötter, A. Mikrostrukturierte Baukastensysteme für Mehrphasenströmungen. Ph.D. Thesis, TU Dortmund University, Dortmund, Germany, 2016. [Google Scholar]
- Garstecki, P.; Stone, H.A.; Whitesides, G.M. Mechanism for flow-rate controlled breakup in confined geometries: A route to monodisperse emulsions. Phys. Rev. Lett. 2005, 94, 164501. [Google Scholar] [CrossRef] [PubMed]
- Munson, B.R. Fundamentals of Fluid Mechanics, 7th ed.; Wiley: Hoboken, NJ, USA, 2013. [Google Scholar]
- Verein Deutscher Ingenieure. In VDI Heat Atlas, 2nd ed.; Springer: Berlin, Germany, 2010.
- Jensen, K.F.; Reizman, B.J.; Newman, S.G. Tools for chemical synthesis in microsystems. Lab Chip 2014, 14, 3206–3212. [Google Scholar] [CrossRef] [PubMed]
- Anna, S.L. Droplets and Bubbles in Microfluidic Devices. Annu. Rev. Fluid Mech. 2016, 48, 285–309. [Google Scholar] [CrossRef]
- Oliveira, M.S.N.; Ni, X.W. Characterization of a gas-liquid OBC: Bubble size and gas holdup. AIChE J. 2004, 50, 3019–3033. [Google Scholar] [CrossRef]
- Moruzzi, R.B.; Reali, M.A.P. Characterization of micro-bubble size distribution and flow configuration in DAF contact zone by a non-intrusive image analysis system and tracer tests. Water Sci. Technol. 2010, 61, 253–262. [Google Scholar] [CrossRef] [PubMed]
- Sevik, M.; Park, S.H. The Splitting of Drops and Bubbles by Turbulent Fluid Flow. J. Fluids Eng. 1973, 95, 53–60. [Google Scholar] [CrossRef]
- Fu, T.; Ma, Y.; Funfschilling, D.; Zhu, C.; Li, H.Z. Squeezing-to-dripping transition for bubble formation in a microfluidic T-junction. Chem. Eng. Sci. 2010, 65, 3739–3748. [Google Scholar] [CrossRef]
- Garstecki, P.; Fuerstman, M.J.; Stone, H.A.; Whitesides, G.M. Formation of droplets and bubbles in a microfluidic T-junction-scaling and mechanism of break-up. Lab Chip 2006, 6, 437–446. [Google Scholar] [CrossRef] [PubMed]
- Oertel, H.; Böhle, M.; Reviol, T. Strömungsmechanik: Für Ingenieure und Naturwissenschaftler, 7 überarb. Aufl. ed; Springer: Wiesbaden, Germany, 2015. [Google Scholar]
- Martínez-Bazán, C.; Montanés, J.L.; Lasheras, J.C. On the breakup of an air bubble injected into a fully developed turbulent flow. Part 2. Size PDF of the resulting daughter bubbles. J. Fluid Mech. 1999, 401, 183–207. [Google Scholar] [CrossRef] [Green Version]
- Herwig, H. Strömungsmechanik: Einführung in die Physik von Technischen Strömungen, 2. überarb. und erw. Aufl. ed; Springer: Wiesbaden, Germany, 2016. [Google Scholar]
- Mersmann, A.; Großmann, H. Dispergieren im flüssigen Zweiphasensystem. Chem. Ing. Tech. 1980, 52, 621–628. [Google Scholar] [CrossRef]
- Kolmogorov, A.N. Dissipation of Energy in the Locally Isotropic Turbulence. Proc. Math. Phys. Sci. 1991, 434, 15–17. [Google Scholar] [CrossRef]
- Matsuyama, K.; Mine, K.; Kubo, H.; Aoki, N.; Mae, K. Optimization methodology of operation of orifice-shaped micromixer based on micro-jet concept. Chem. Eng. Sci. 2010, 65, 5912–5920. [Google Scholar] [CrossRef] [Green Version]
- Van Steijn, V. Formation and Transport of Bubbles in Microfluidic Systems; Ponsen en Looijen: Wageningen, The Netherlands, 2010. [Google Scholar]
- Antony, J. Design of Experiments for Engineers and Scientists, 2nd ed.; Elsevier: Amsterdam, The Netherlands, 2014. [Google Scholar]
- Siebertz, K.; van Bebber, D.; Hochkirchen, T. Statistische Versuchsplanung: Design of Experiments (DoE); Springer: Heidelberg, Germany, 2010. [Google Scholar]
- Stieß, M. Mechanische Verfahrenstechnik 1; Zweite, Neubearbeitete Auflage; Springer: Berlin, Germany, 1995. [Google Scholar]
- Qian, D.; McLaughlin, J.B.; Sankaranarayanan, K.; Sundaresan, S.; Kontomaris, K. Simulation of bubble breakup dynamics in homogeneous turbulence. Chem. Eng. Commun. 2006, 193, 1038–1063. [Google Scholar] [CrossRef]
- Risso, F.; Fabre, J. Oscillations and breakup of a bubble immersed in a turbulent field. J. Fluid Mech. 1998, 372, 323–355. [Google Scholar] [CrossRef]
- Galinat, S.; Risso, F.; Masbernat, O.; Guiraud, P. Dynamics of drop breakup in inhomogeneous turbulence at various volume fractions. J. Fluid Mech. 2007, 578, 85. [Google Scholar] [CrossRef]
- Ryan, B.F.; Joiner, B.L.; Cryer, J.D. Minitab Handbook: Updated for Release 16, 6th ed.; Brooks/Cole: Boston, MA, USA, 2013. [Google Scholar]
- Kleppmann, W. Taschenbuch Versuchsplanung: Produkte und Prozesse Optimieren, 4. überarb. Aufl. ed; Hanser: Munich, Germany, 2006. [Google Scholar]
Figure 1.
Experimentally observed gas–liquid flow regimes in millichannel (1.0 × 1.0 mm) upstream of the micronozzle. Arrows indicate direction of flow. Gaseous phase is marked with “g”, liquid phase with “l”. (a) Bubbly flow at = 15%, = 40 mL/min; (b) slug flow at = 25%, = 40 mL/min; (c) parallel flow at = 40%, = 60 mL/min.
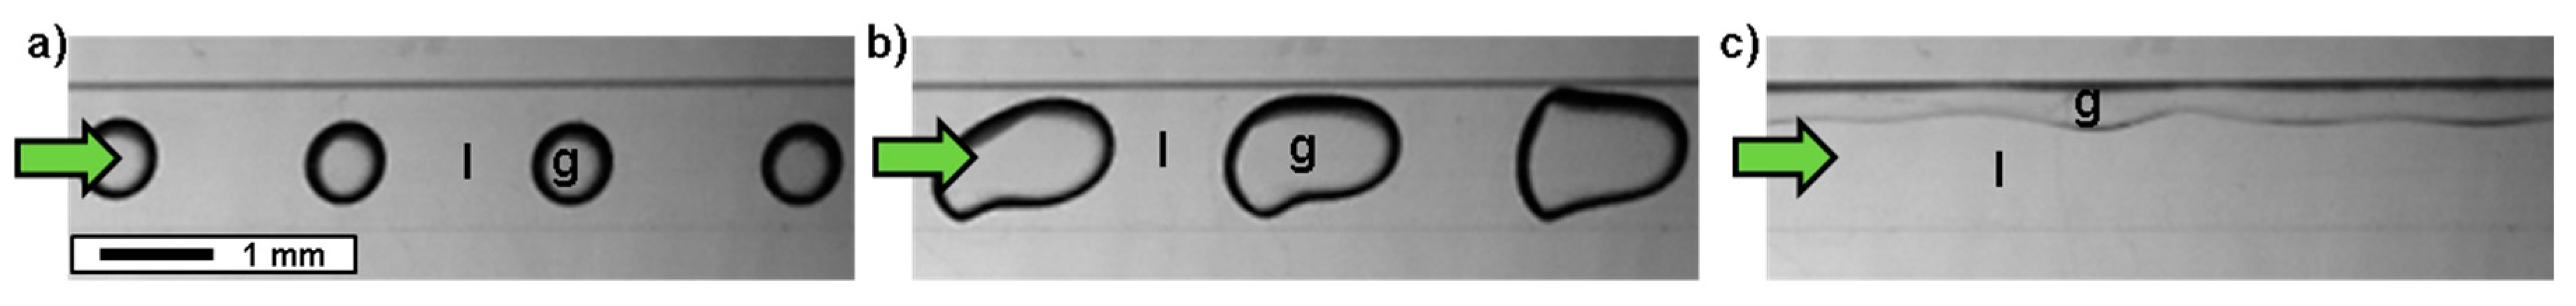
Figure 2.
(a) Characteristic geometrical parameters of the micronozzle; (b) turbulent field in diverging nozzle section. Dissipation volume is marked grey and regions of macro and micro turbulence are given.
Figure 2.
(a) Characteristic geometrical parameters of the micronozzle; (b) turbulent field in diverging nozzle section. Dissipation volume is marked grey and regions of macro and micro turbulence are given.
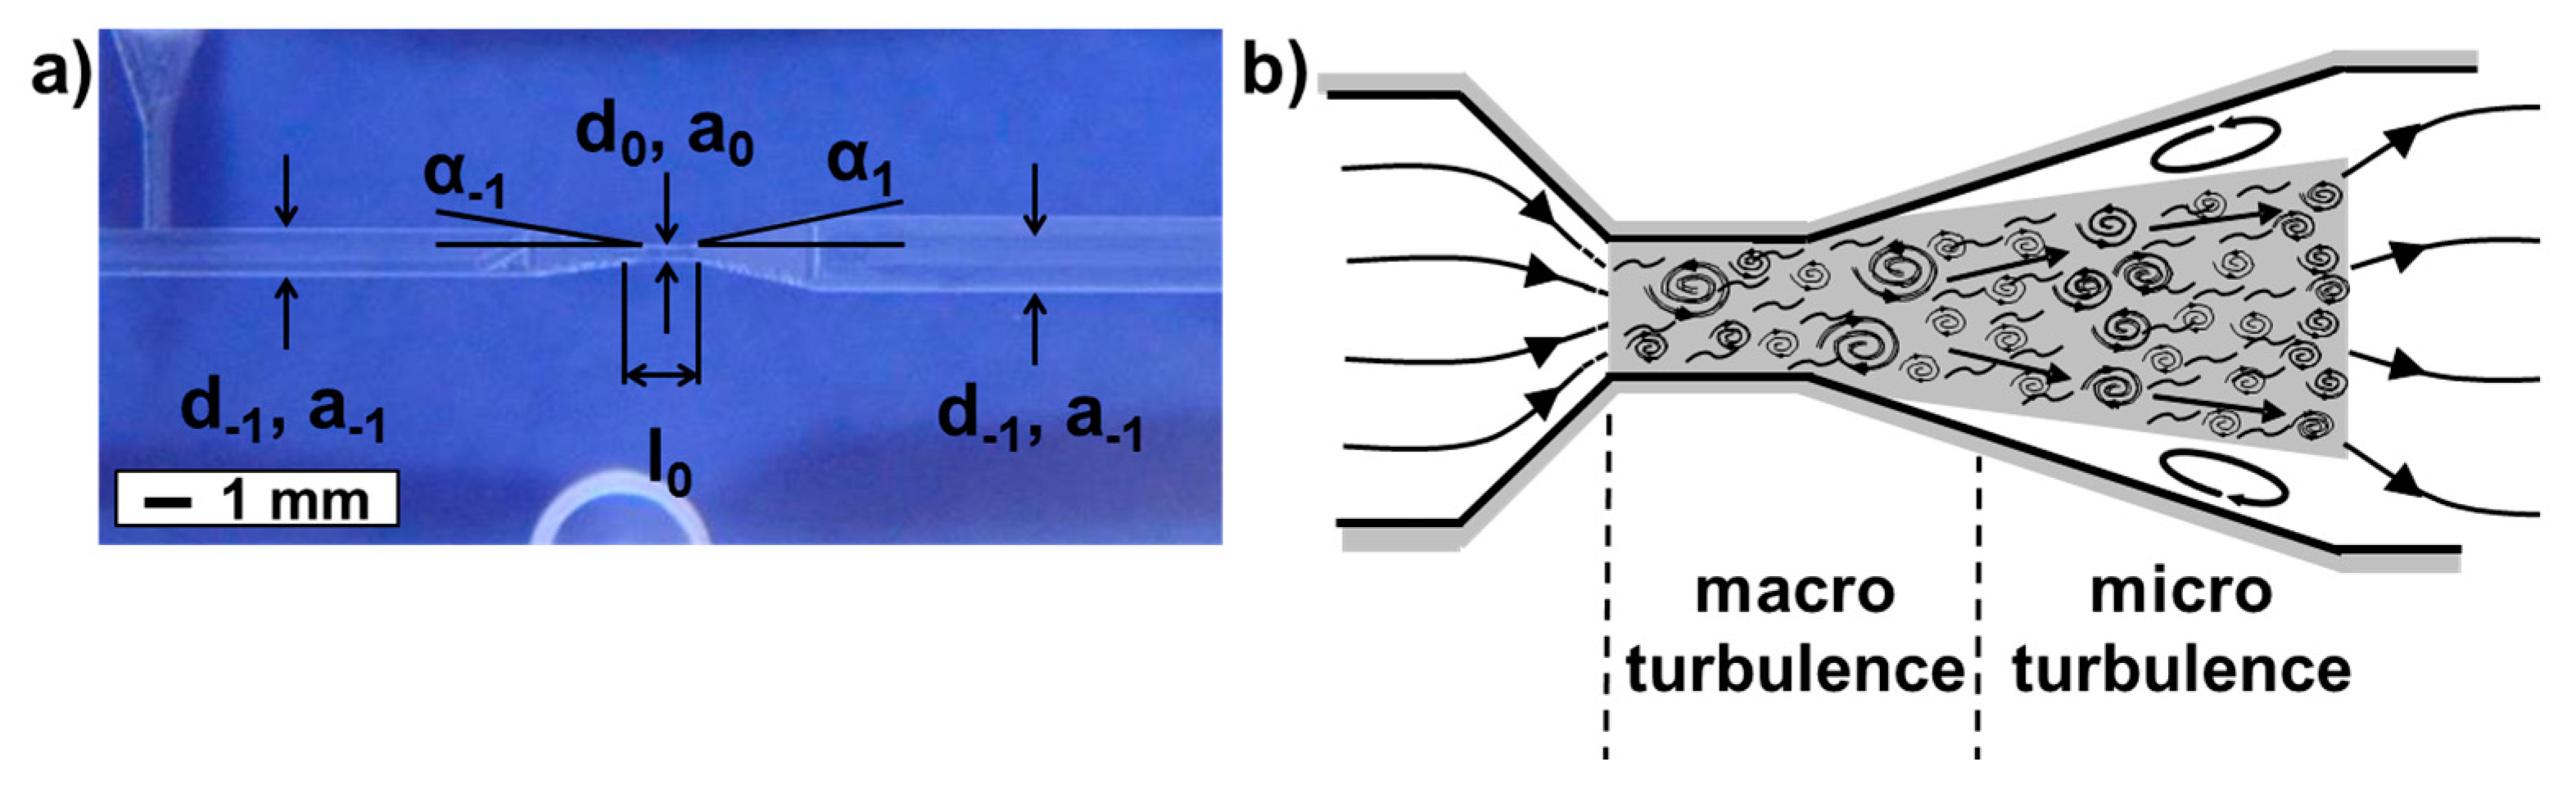
Figure 3.
Bubble generation in T-junction (left) and turbulent dispersion downstream of the nozzle with = 3732 and = 1846.
Figure 3.
Bubble generation in T-junction (left) and turbulent dispersion downstream of the nozzle with = 3732 and = 1846.

Figure 4.
Process inputs and outputs in Design of Experiments set-up for turbulent bubble breakup in microchannel nozzle.
Figure 4.
Process inputs and outputs in Design of Experiments set-up for turbulent bubble breakup in microchannel nozzle.
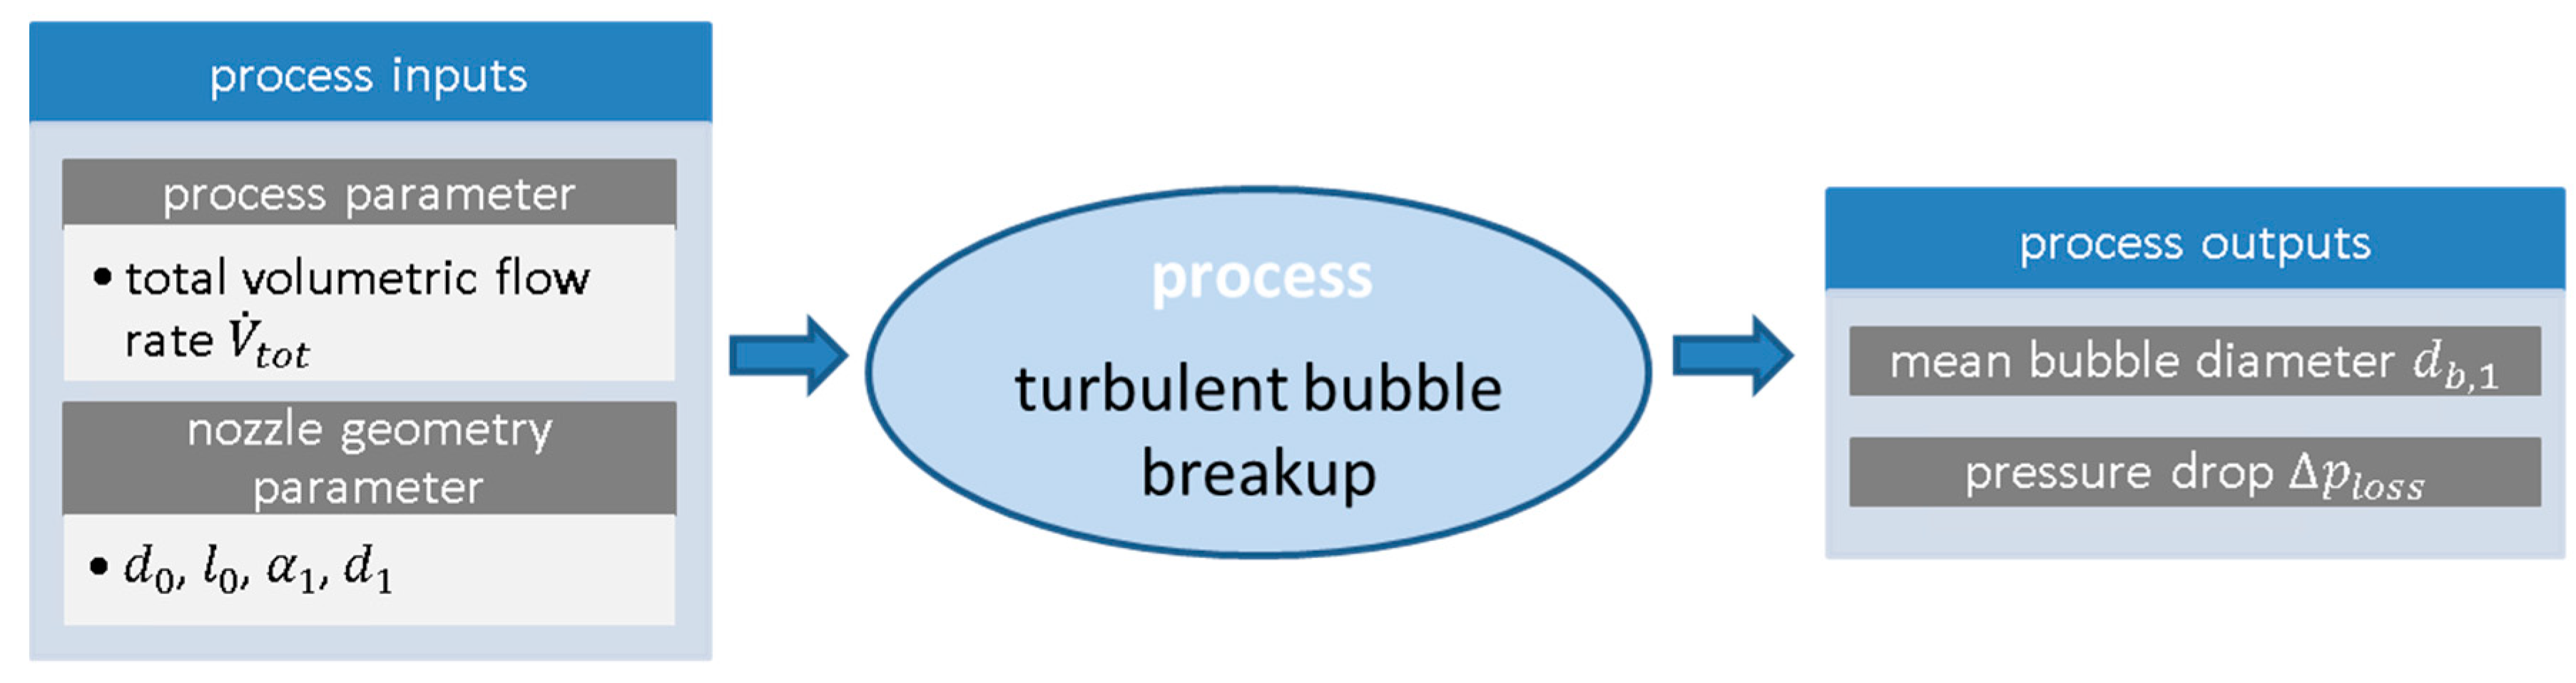
Figure 5.
(a) 3D model of the microreactor set-up with reaction plate, exchangeable nozzle element, view glass, and outer flanges; (b) reaction plate and nozzle insert made from PMMA; (c) exchangeable inlet element with micronozzle.
Figure 5.
(a) 3D model of the microreactor set-up with reaction plate, exchangeable nozzle element, view glass, and outer flanges; (b) reaction plate and nozzle insert made from PMMA; (c) exchangeable inlet element with micronozzle.

Figure 6.
(a) Experimental set-up for energy-efficient turbulent bubble breakup investigations; (b) accompanying flow chart.
Figure 6.
(a) Experimental set-up for energy-efficient turbulent bubble breakup investigations; (b) accompanying flow chart.

Figure 7.
Flow maps for varying total volumetric flow rates and void fraction. (a) Void fraction plotted over total volumetric flow rate with observed flow regimes; (b) void fraction plotted over capillary number Ca with observed flow regimes. Legends are included in the diagram.
Figure 7.
Flow maps for varying total volumetric flow rates and void fraction. (a) Void fraction plotted over total volumetric flow rate with observed flow regimes; (b) void fraction plotted over capillary number Ca with observed flow regimes. Legends are included in the diagram.

Figure 8.
Bubble breakup regime maps using nozzle inlay A. Regions outside of 10% < < 20% and 20 mL/min < < 160 mL/min are faded due to earlier exclusion. (a) Bubble breakup map for void fraction plotted over total volumetric flow rate; (b) bubble breakup map for void fraction plotted over characteristic Weber number.

Figure 9.
Observed bubble breakup and flow regimes behind the micronozzle. The arrow marks the direction of flow. Process parameters are given next to the respective picture. From top to bottom: Laminar bubble breakup with ≈ 5 and ≈ 1660, turbulent breakup with ≈ 7 and ≈ 2300, annular flow with ≈ 10 and ≈ 2330, disturbed annular flow with ≈ 10 and ≈ 2660.

Figure 10.
Influence of mother bubble size on daughter bubble size. The top row diagrams (a,b) show results for constant void fraction = 10% and varied total volumetric flow rate. The bottom row diagrams; (c,d) show same diagrams for constant liquid flow rate = 100 mL/min and varied gas flow rate.
Figure 10.
Influence of mother bubble size on daughter bubble size. The top row diagrams (a,b) show results for constant void fraction = 10% and varied total volumetric flow rate. The bottom row diagrams; (c,d) show same diagrams for constant liquid flow rate = 100 mL/min and varied gas flow rate.

Figure 11.
Influence of hydraulic diameter on bubble breakup behind micronozzles. Constant geometrical nozzle parameter for all displayed inlay elements: = 1 mm, = 8°, = 2.5 mm, = 47.5°, = 1.25 mm. Nozzle inlay A: = 0.5 mm, nozzle inlay H: = 0.25 mm, and nozzle inlay I: = 0.75 mm. Volumetric flow rates are = 60, 80, 100, and 120 mL/min. (a) Sauter diameter plotted over Reynolds number in smallest cross section for varied ; (b) mean daughter bubble diameter over mean energy dissipation rate for varied .

Figure 12.
Figure 12. Influence of length of smallest cross section on size of refined bubbles behind micronozzles. Constant geometrical nozzle parameter for all displayed inlay elements: = 1 mm, = 8°, = 0.5 mm, = 47.5°, = 1.25 mm. Length of nozzle’s smallest cross section exhibited different values, i.e., for nozzle F: = 0.5 mm, for nozzle A: = 2.5 mm, and for nozzle G: = 4.5 mm. Volumetric flow rates of = 60, 80, 100, and 120 mL/min are employed for each nozzle inlay. (a) Sauter bubble diameter plotted over Reynolds number in smallest cross section for varied ; (b) mean bubble diameter of refined dispersed phase plotted over mean energy dissipation rate for varied ; (c) pressure drop for tested nozzle inlays A, F, and G.
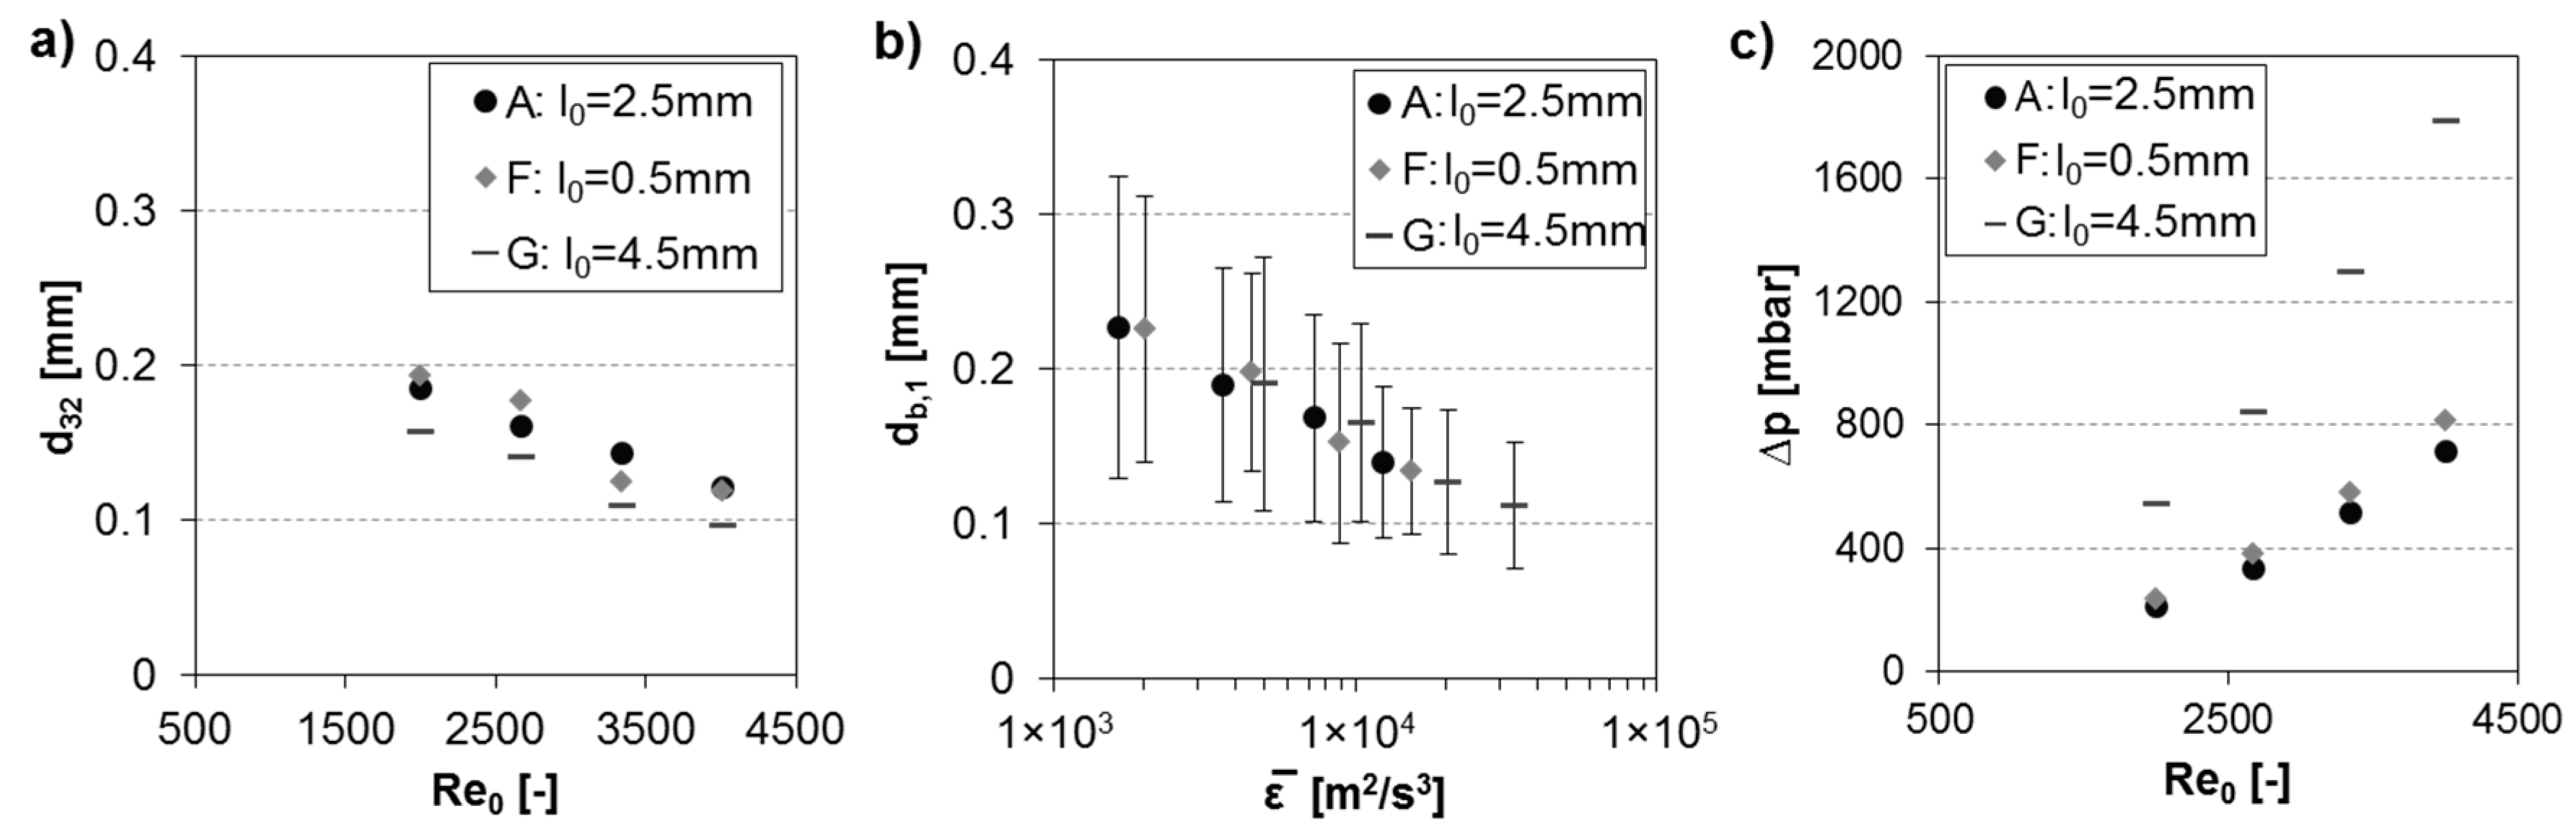
Figure 13.
Influence of diffusor angle on bubble breakup behind micronozzles. Geometrical nozzle parameter besides are held constant for investigated inlay elements: = 1 mm, = 8°, = 0.5 mm, = 2.5 mm, = 1.25 mm. Diffusor angle possessed varied values, i.e., nozzle inlay J: = 5°, nozzle inlay A: = 47.5°, and nozzle inlay K: = 90°. Volumetric flow rates of = 60, 80, 100, and 120 mL/min are employed for each nozzle inlay. (a) Obtained Sauter diameter of broken up bubbles plotted over Renumber in smallest cross section for different ; (b) mean bubble diameter of refined dispersed phase plotted over mean energy dissipation rate for various .
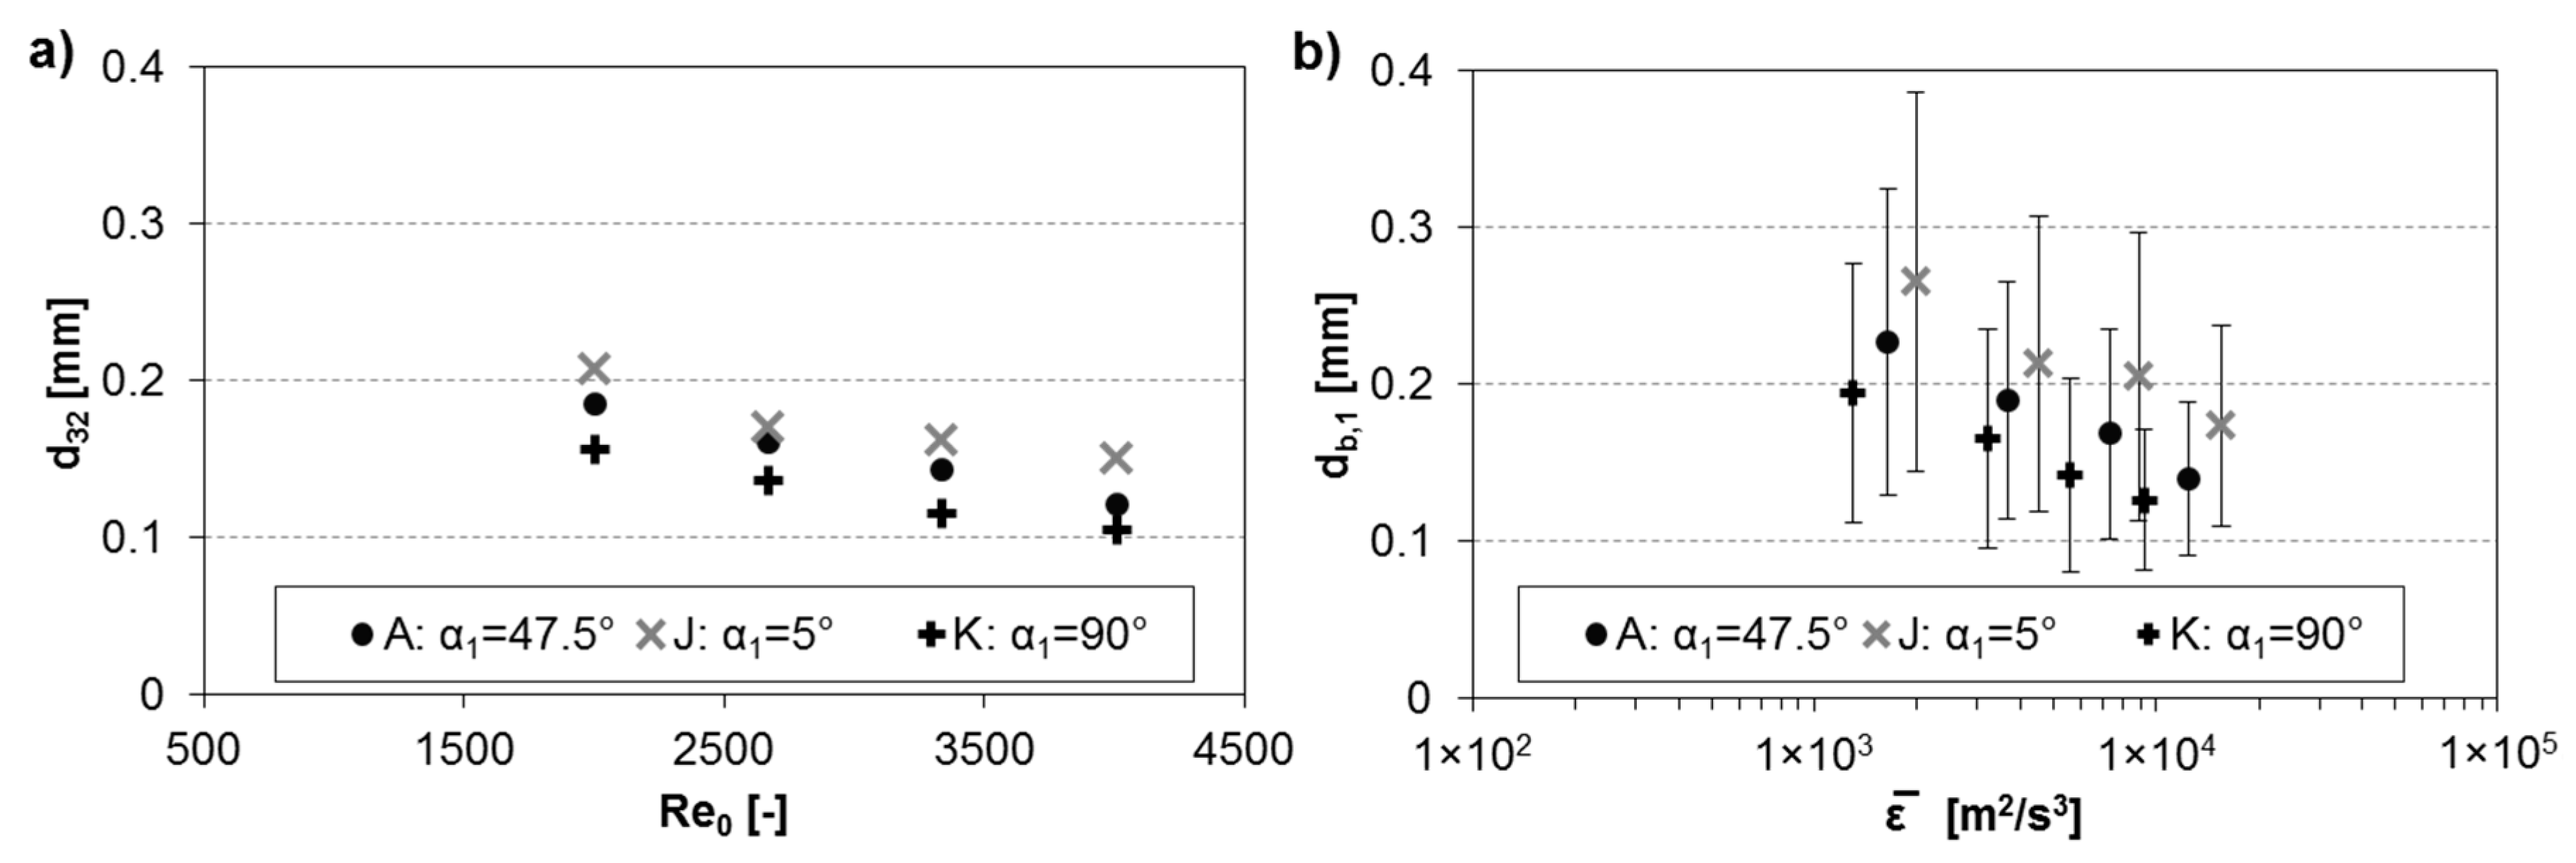
Figure 14.
Impact of downstream channel hydraulic diameter on micronozzle induced turbulent bubble breakup. Geometrical nozzle parameter besides are held constant for investigated inlay elements: = 1 mm, = 8°, = 0.5 mm, = 2.5 mm, = 47.5°. Hydraulic diameter exhibited following values, i.e., nozzle inlay L: = 0.75 mm, nozzle inlay A: = 1.25 mm, nozzle inlay M: = 1.75 mm. Volumetric flow rates of = 60, 80, 100, and 120 mL/min are employed for each nozzle inlay. (a) Obtained Sauter diameter of broken up bubbles plotted over Reynolds number in smallest cross section for different ; (b) mean bubble diameter of refined dispersed phase plotted over mean energy dissipation rate for various .
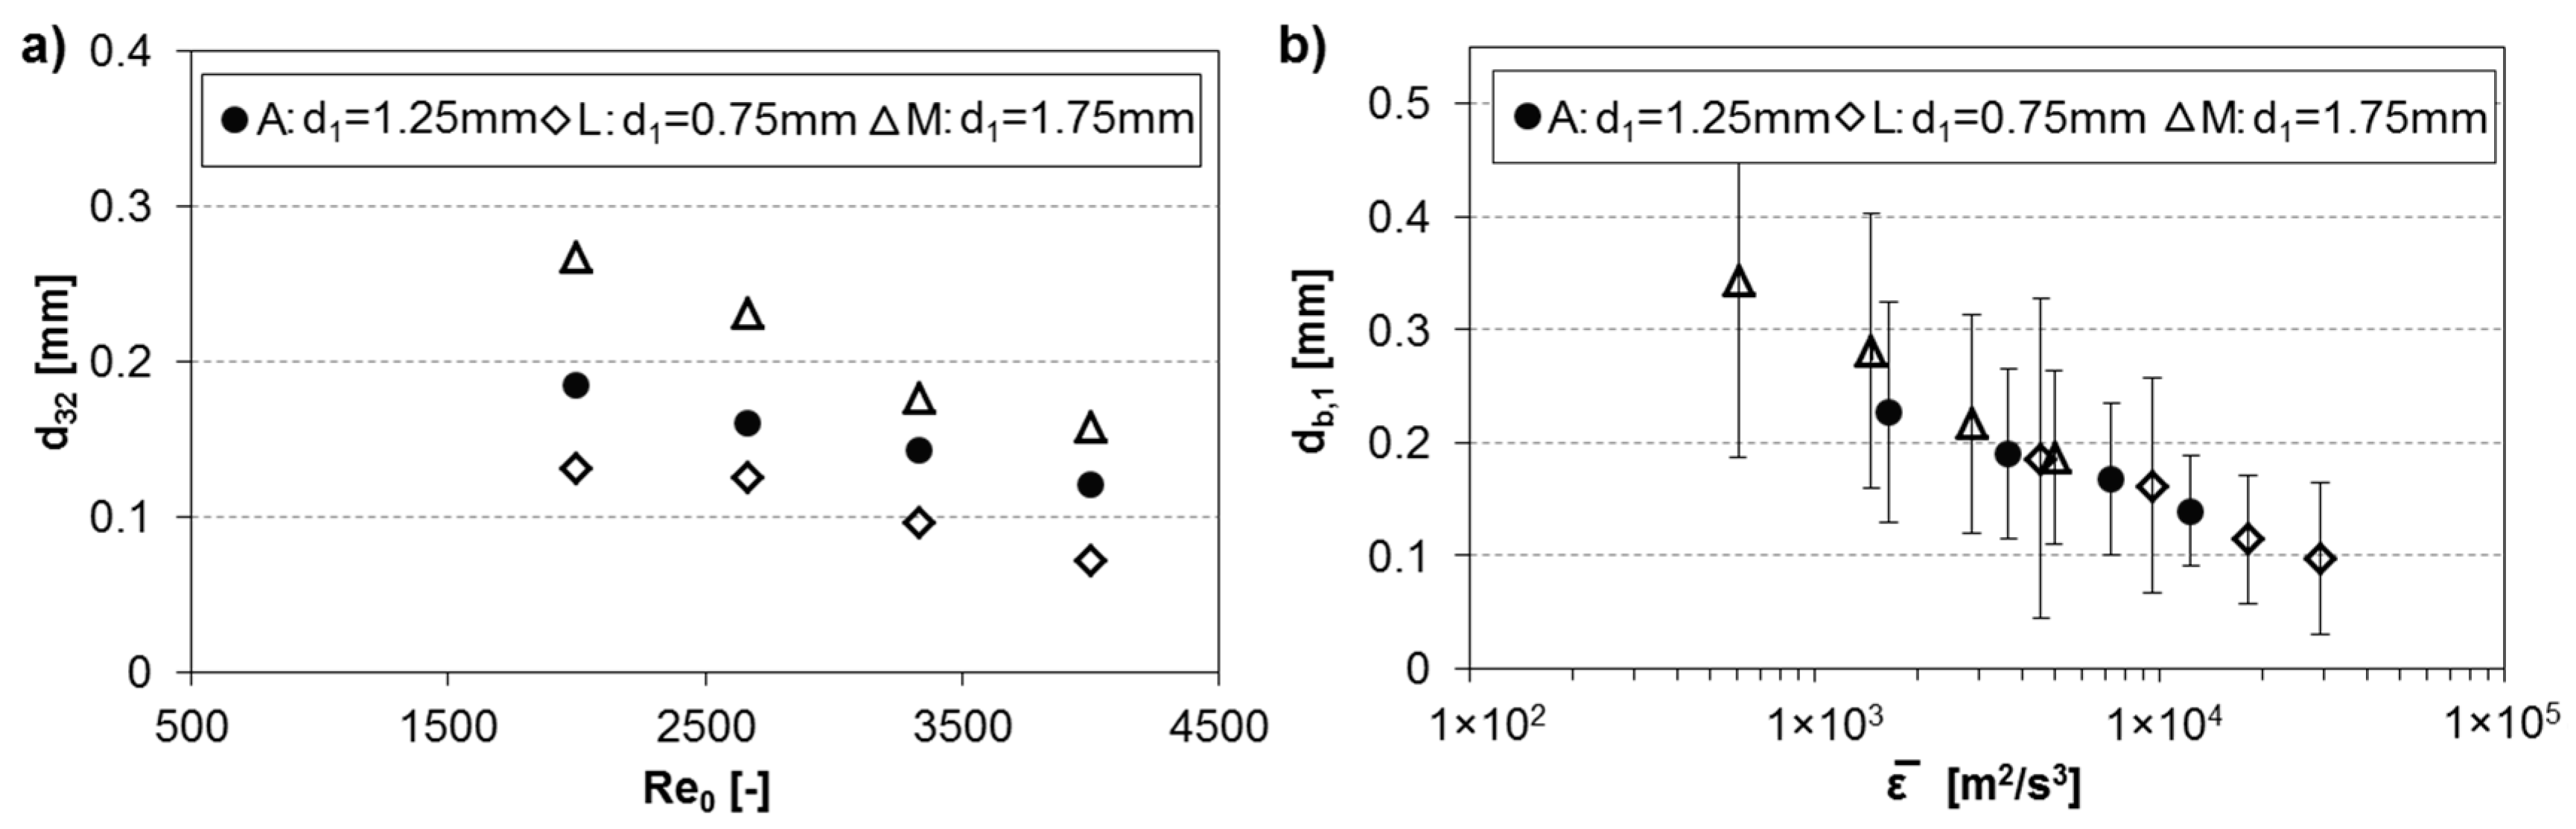
Figure 15.
Impact of total volumetric flow rate on bubble breakup for varied nozzle geometries, see Table 4. Volumetric flow rates of = 60, 80, 100, and 120 mL/min are used at void fraction of 0.1 for each nozzle inlay. (a) Obtained pressure drop plotted over total volumetric flow rate for nozzle inlays A, G, and I; (b) mean energy dissipation rates plotted over total volumetric flow rate for nozzle inlays A, G, and I; (c) obtained Sauter diameter of dispersed bubbles plotted over total volumetric flow rate for nozzle inlays A, G, and I; (d) bubble density distribution for nozzle inlay A at various total volumetric flow rates.
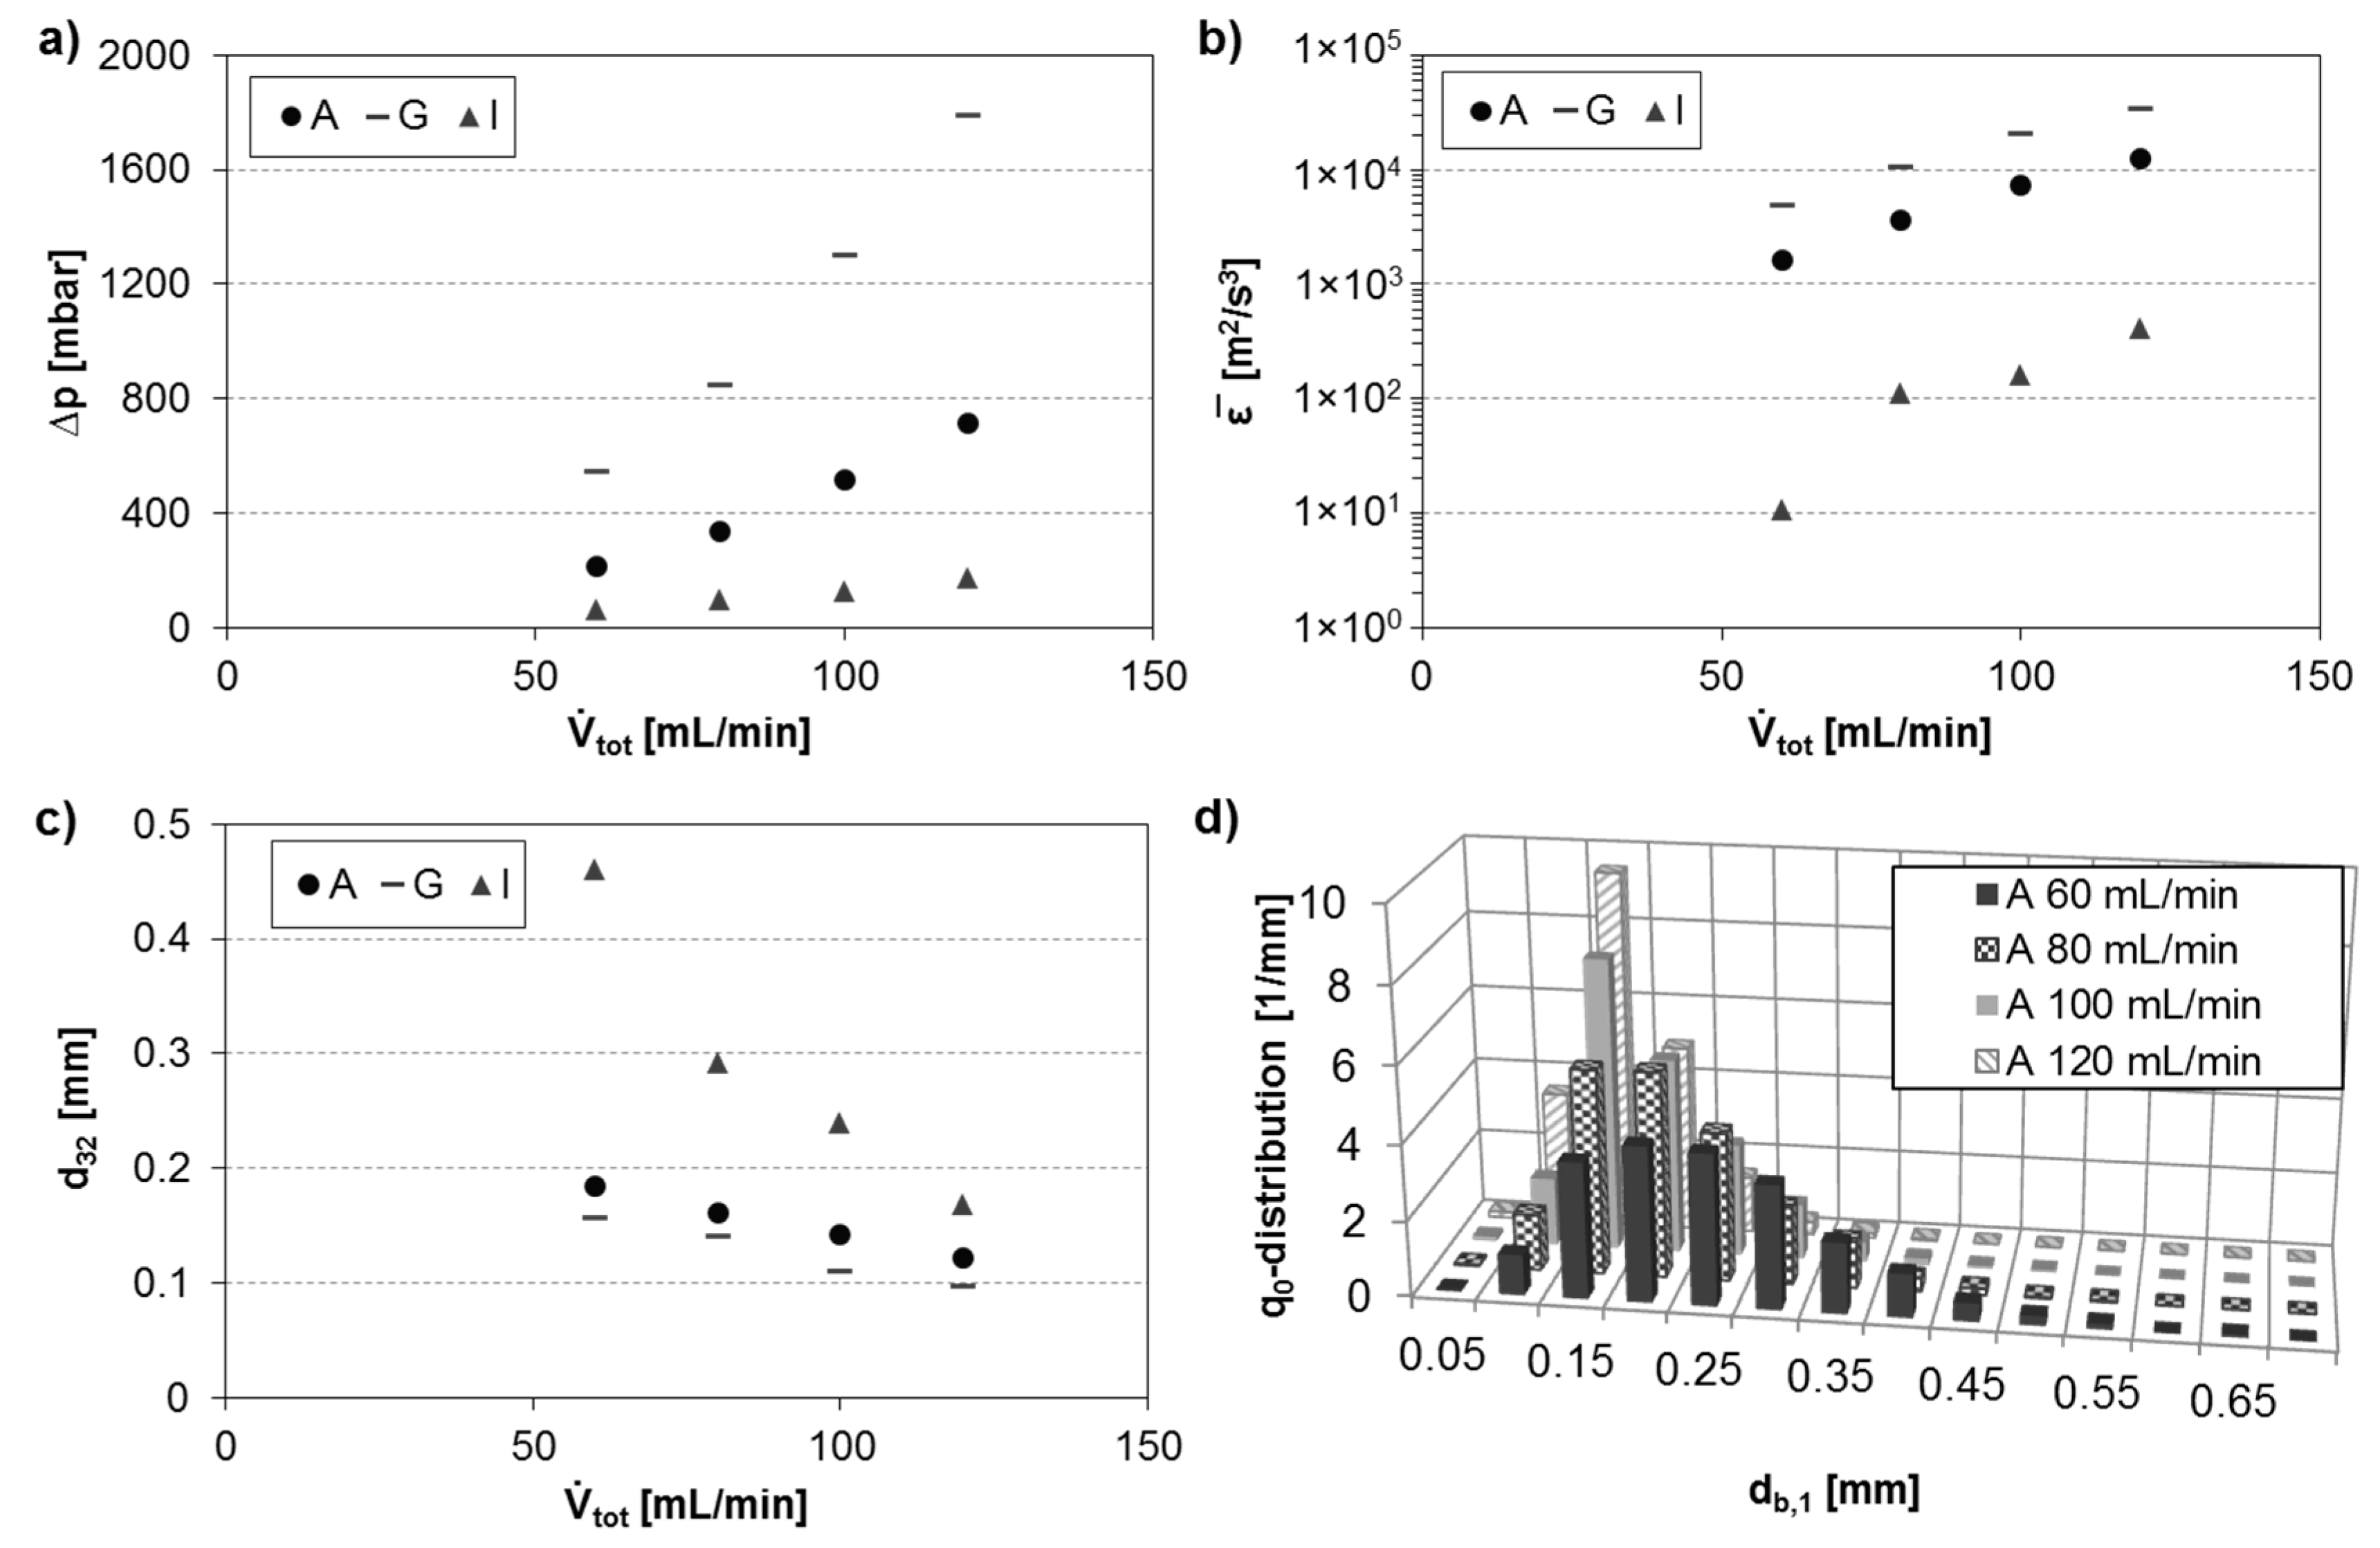
Figure 16.
Diameter ratio for different pressure drop ratios indicating bubble breakup efficacy.

Figure 17.
All obtained mean bubble diameters plotted over corresponding pressure drops within the DoE.
Figure 17.
All obtained mean bubble diameters plotted over corresponding pressure drops within the DoE.
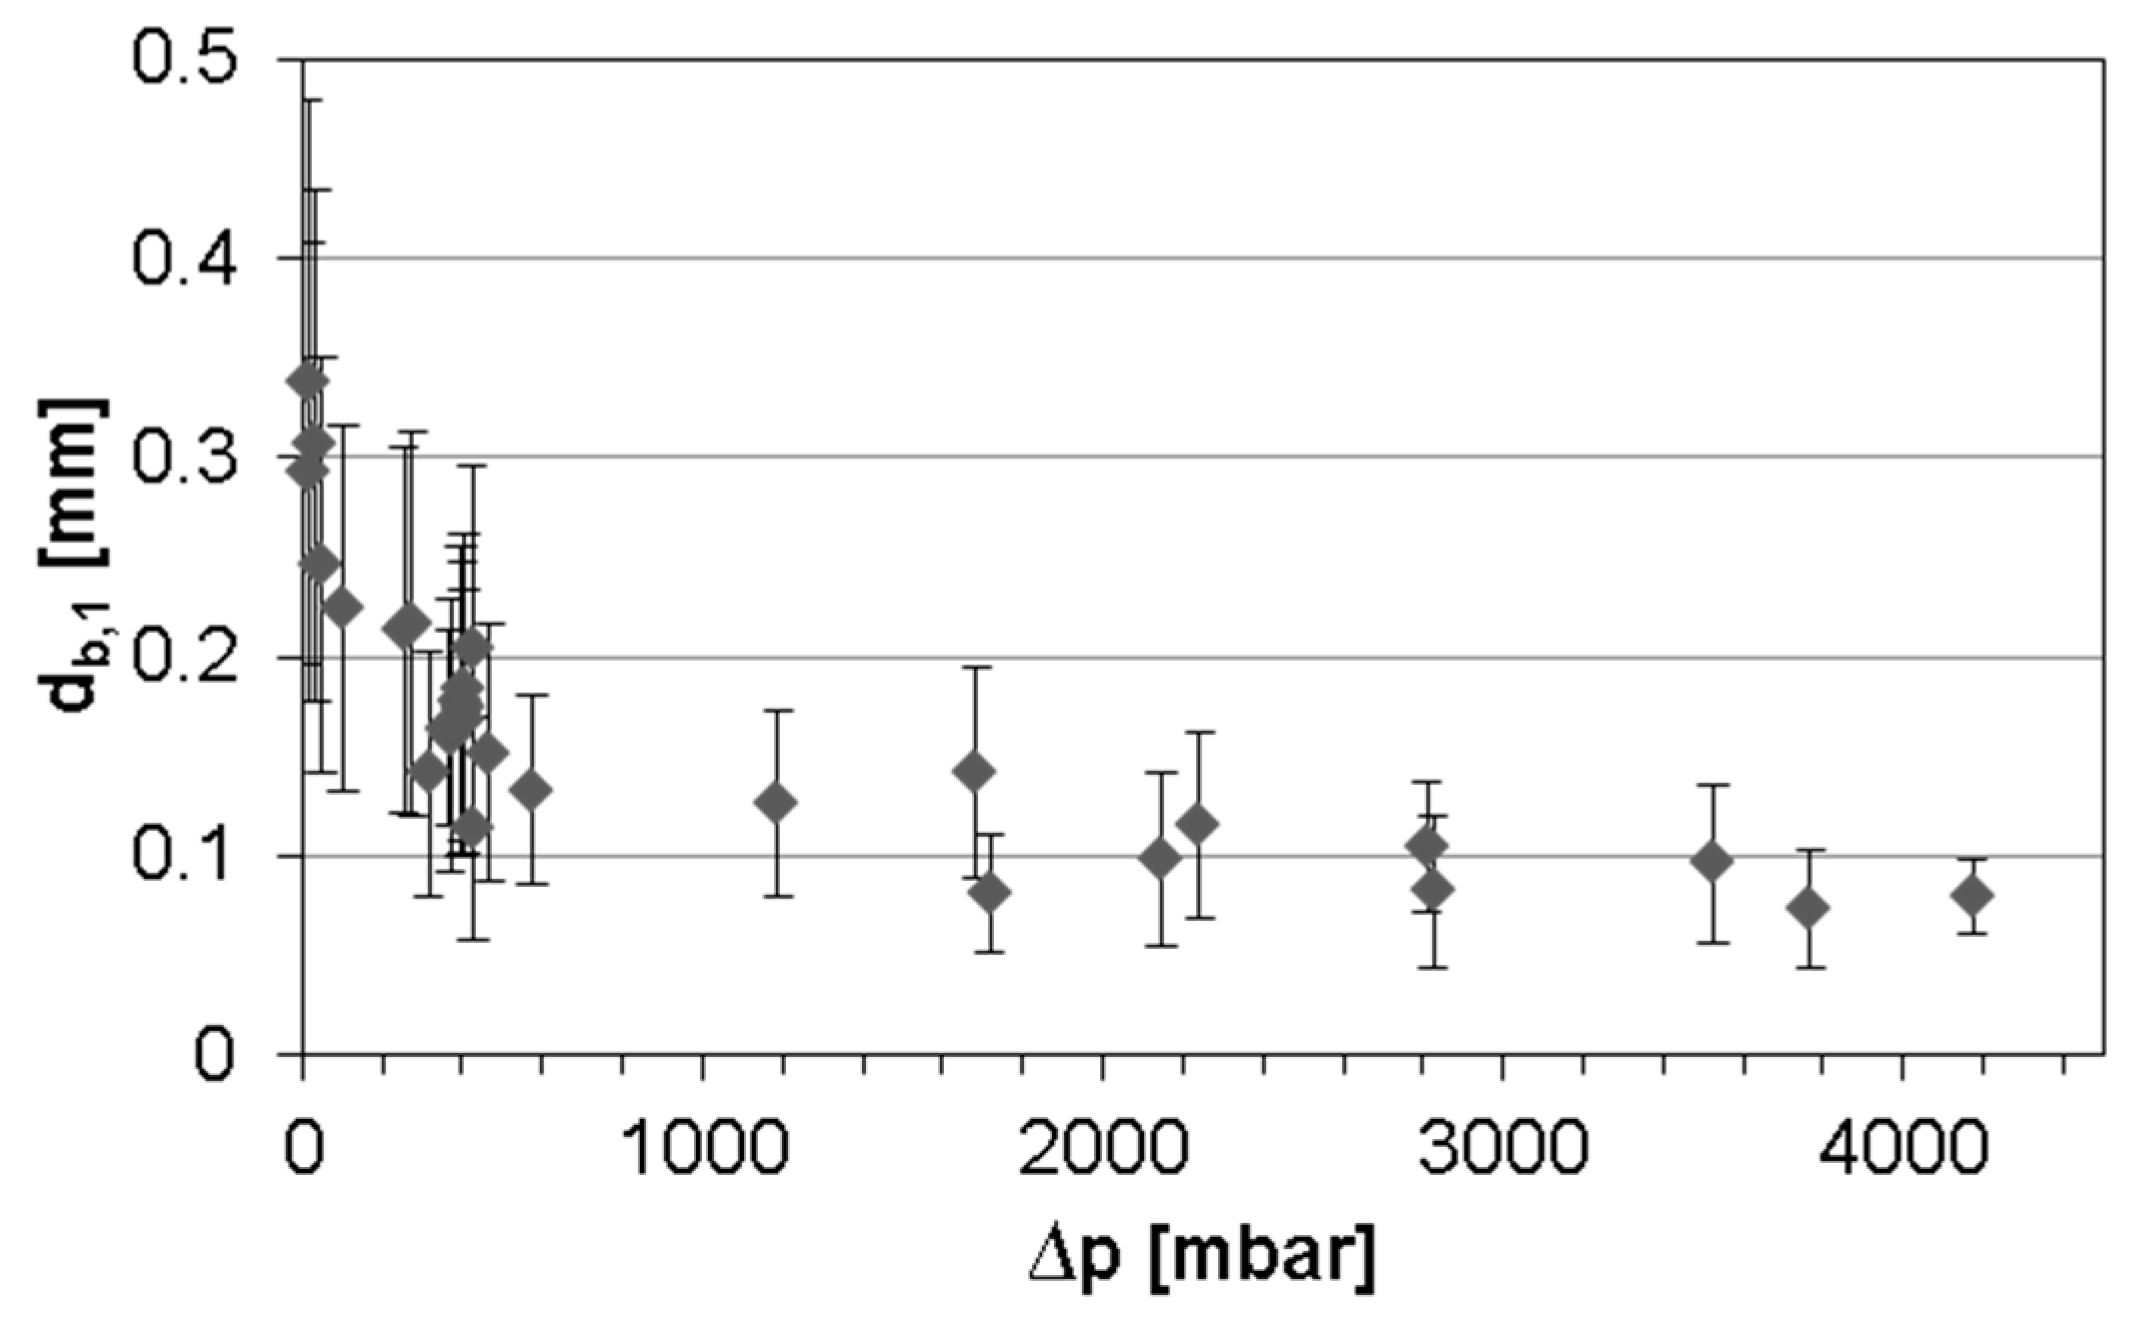
Figure 18.
Final Pareto chart of effects (a) for mean daughter bubble size after exclusion of non-significant parameters and corresponding main effect diagram (b).
Figure 18.
Final Pareto chart of effects (a) for mean daughter bubble size after exclusion of non-significant parameters and corresponding main effect diagram (b).

Figure 19.
Final Pareto chart of effects (a) for pressure drop after exclusion of non-significant parameters and corresponding main effects diagram (b).
Figure 19.
Final Pareto chart of effects (a) for pressure drop after exclusion of non-significant parameters and corresponding main effects diagram (b).
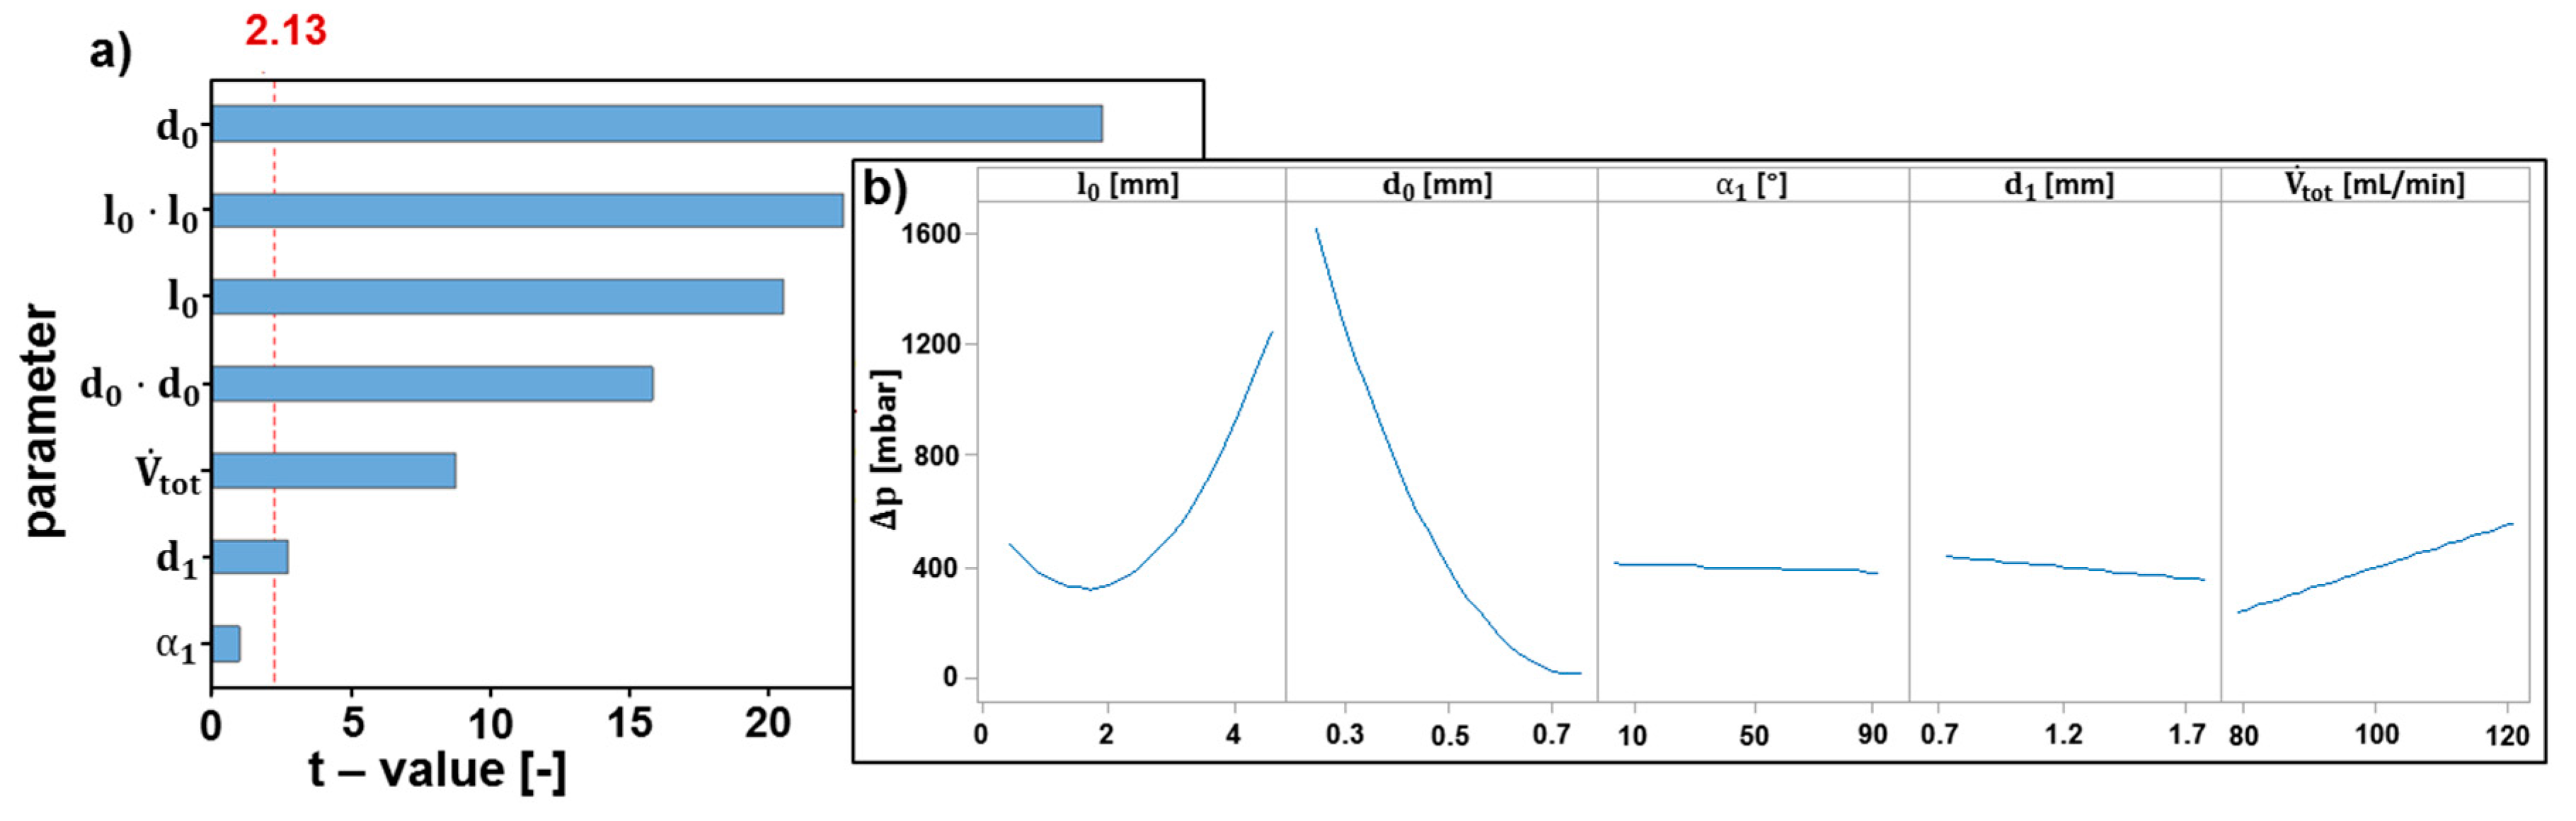
Figure 20.
Factor optimization tool in Minitab® 17 for daughter bubble size and pressure drop.

Figure 21.
Manufactured micronozzle with optimal parameter settings.

Figure 22.
(a) Mean daughter bubble diameter in dependence of the nozzle induced pressure drop including DoE results and the experimental point for the optimal parameter settings; (b) bubble size density distribution for optimal parameter settings experiment.
Figure 22.
(a) Mean daughter bubble diameter in dependence of the nozzle induced pressure drop including DoE results and the experimental point for the optimal parameter settings; (b) bubble size density distribution for optimal parameter settings experiment.


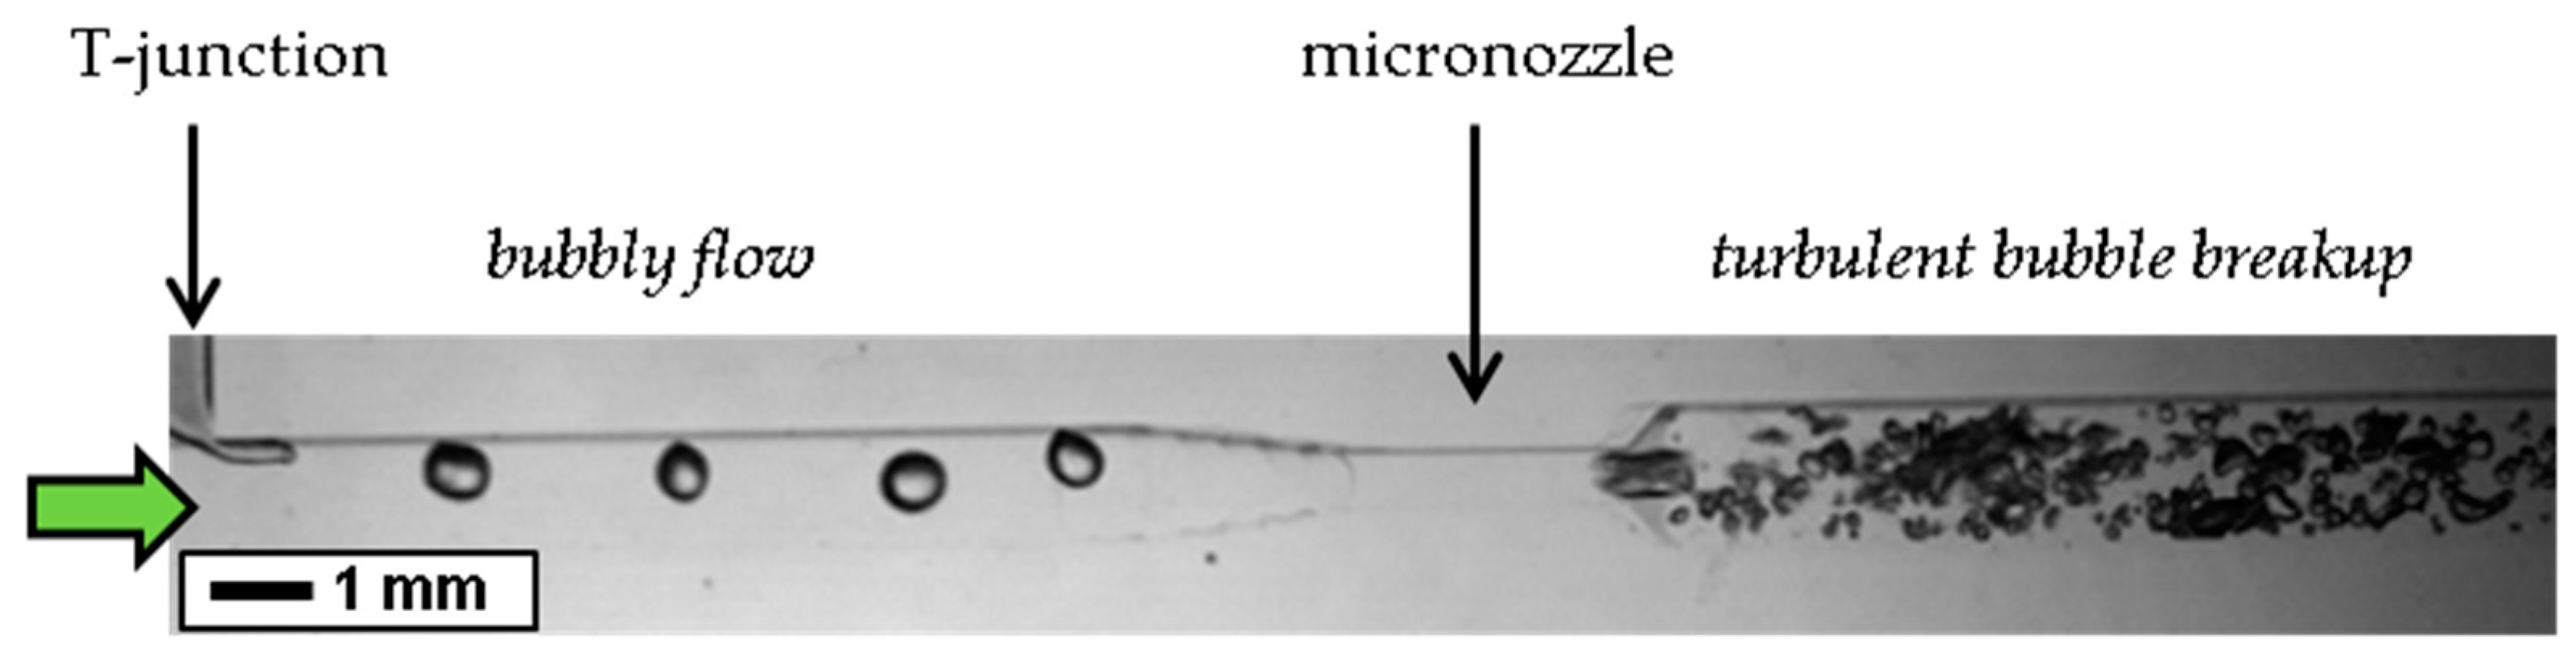
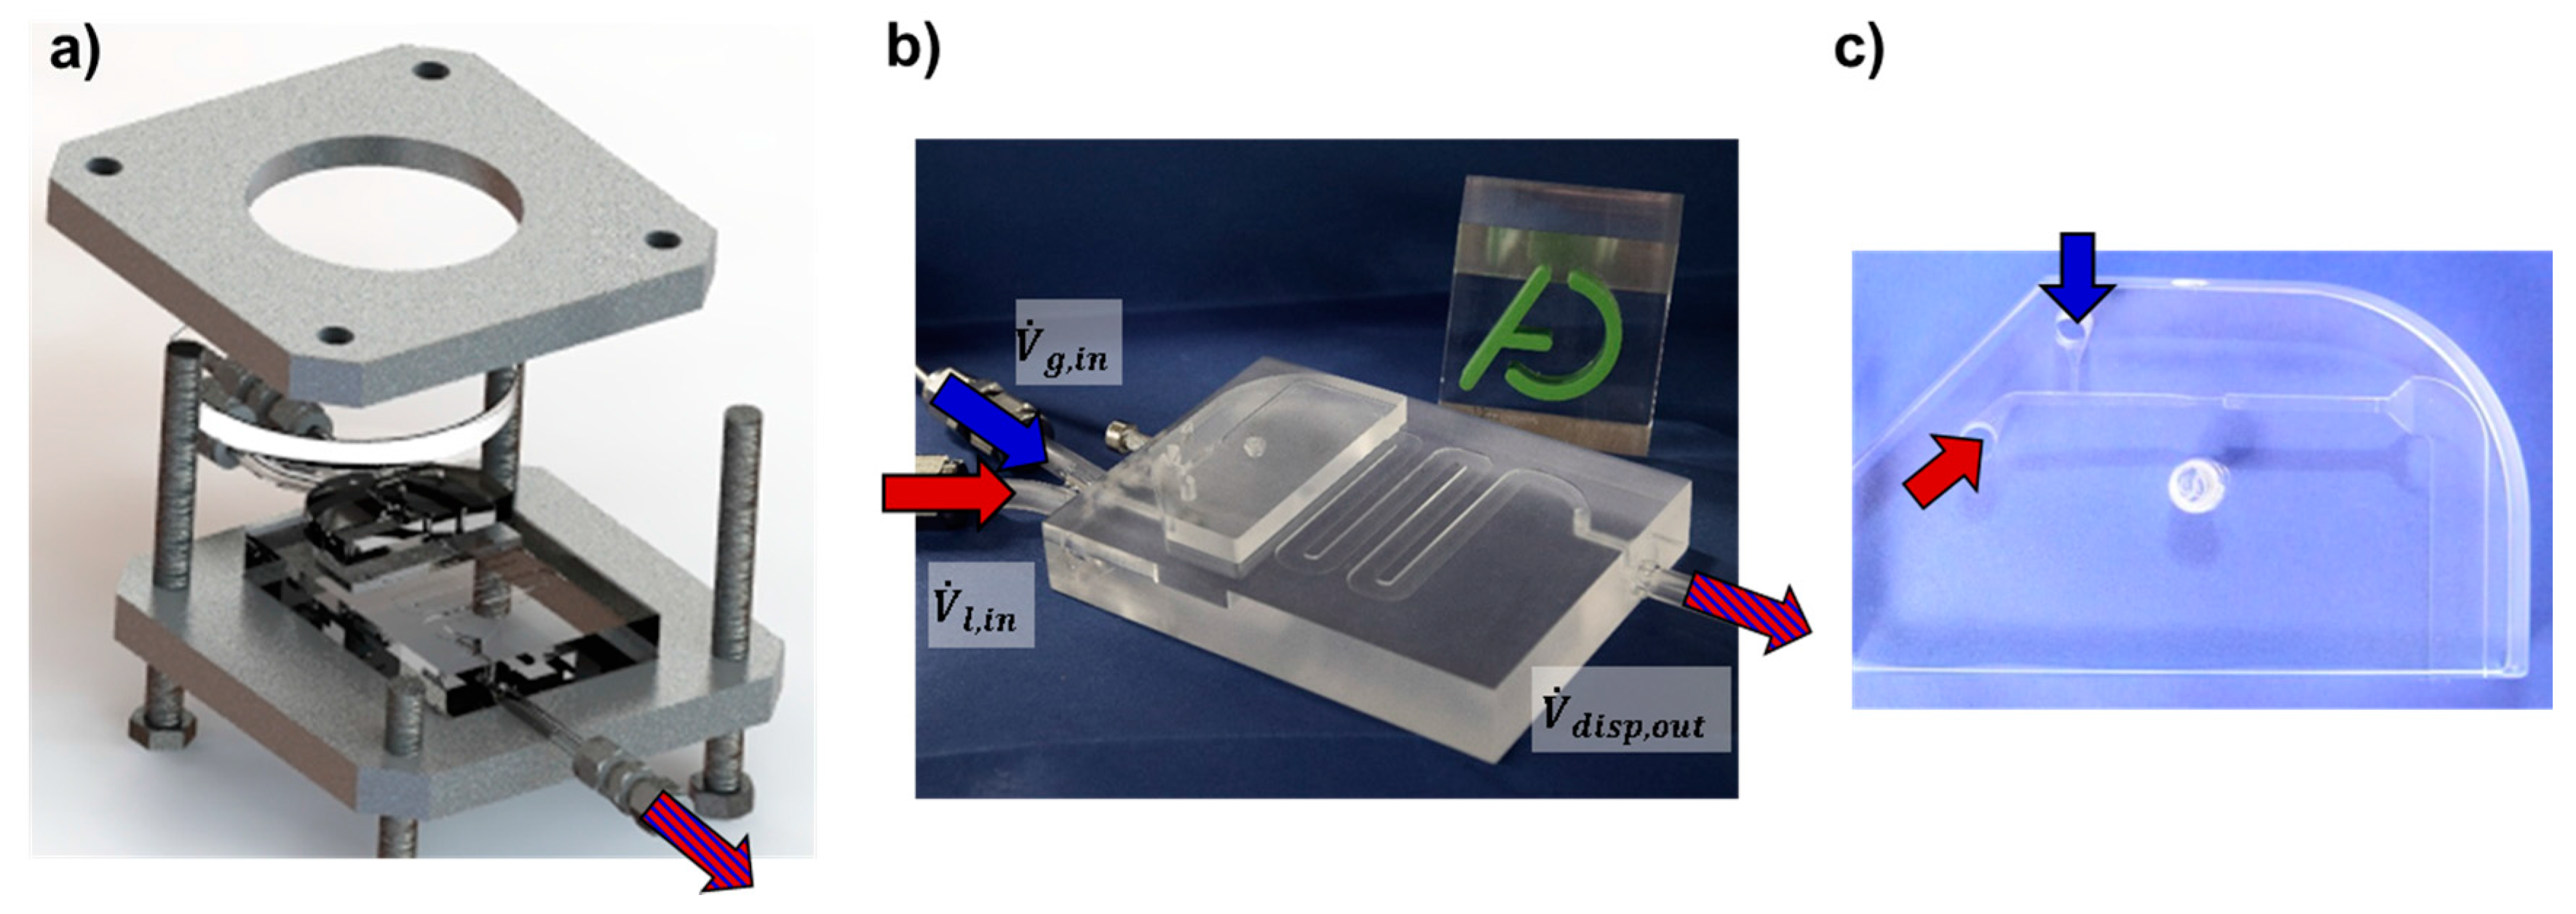
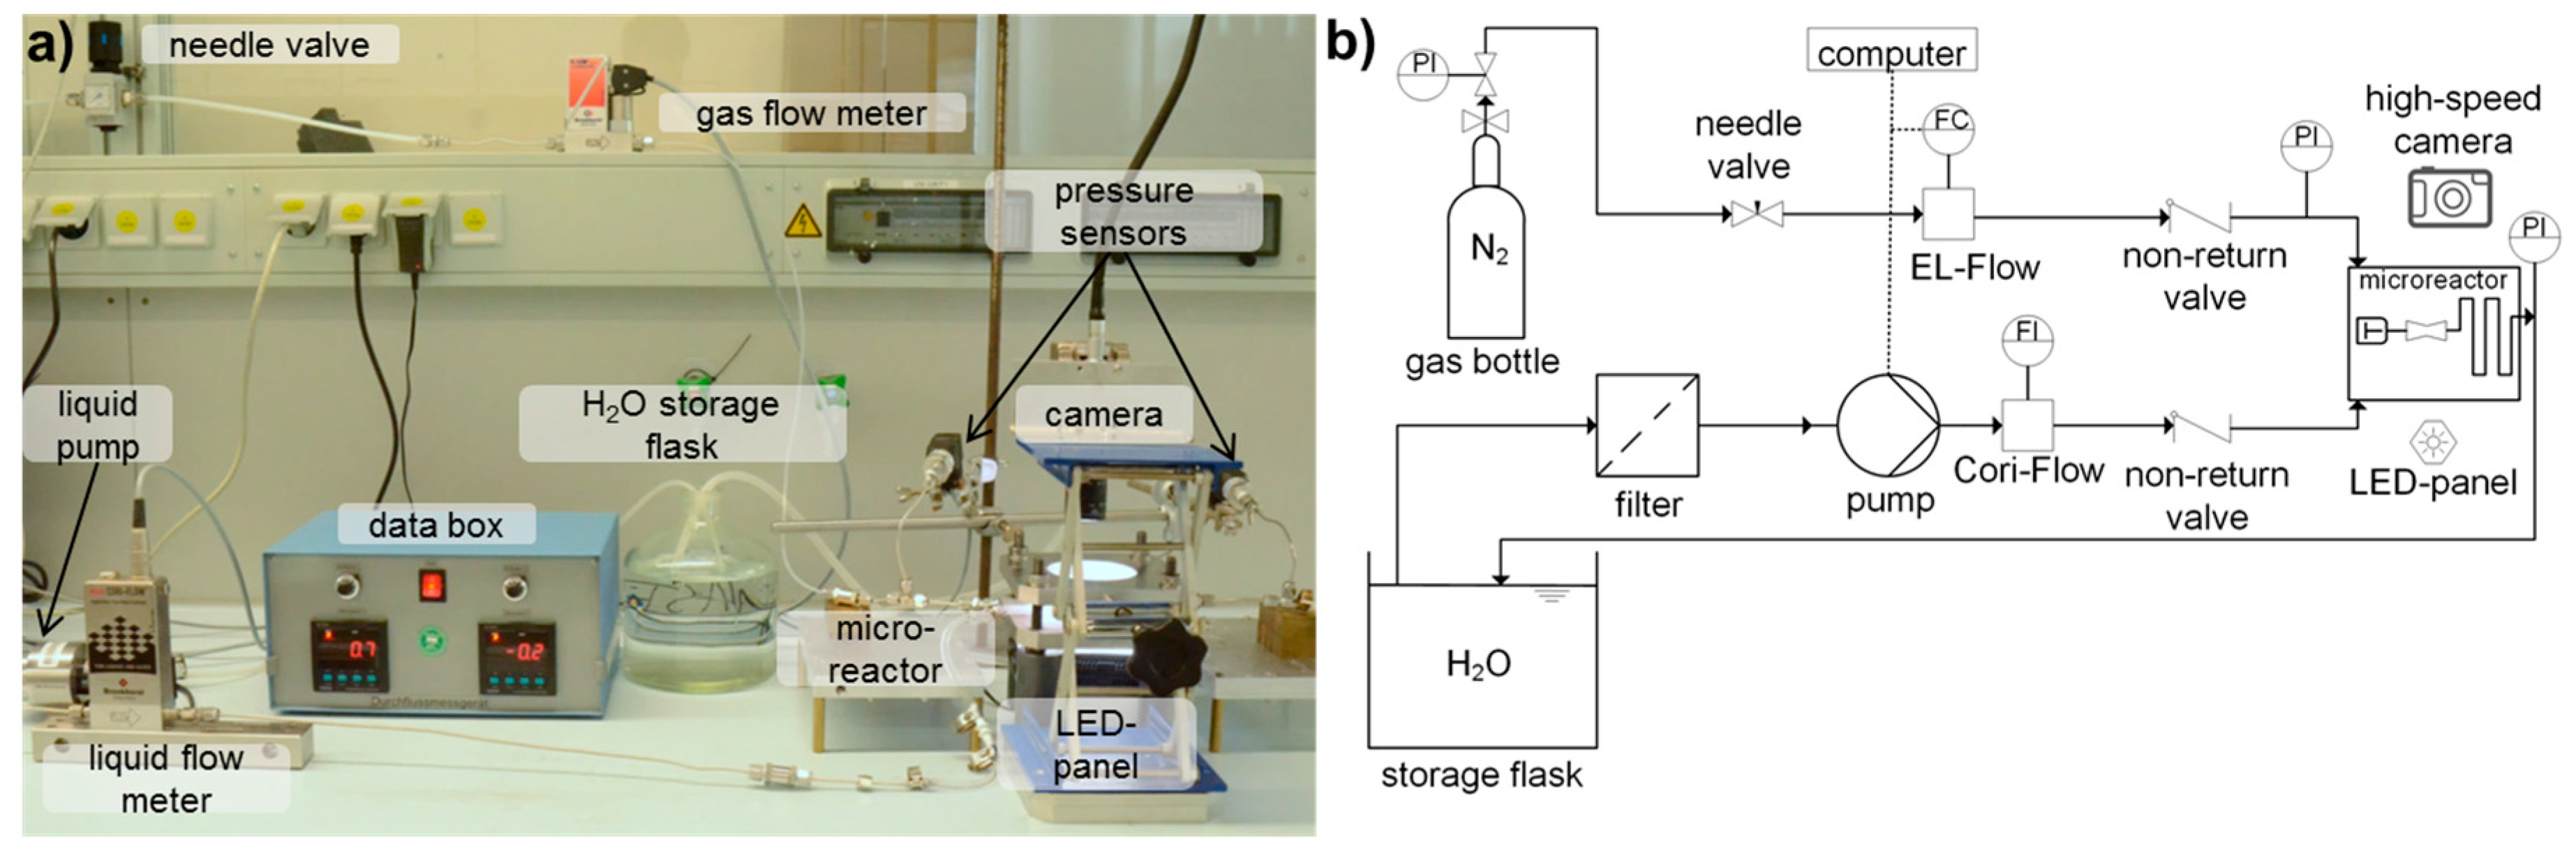
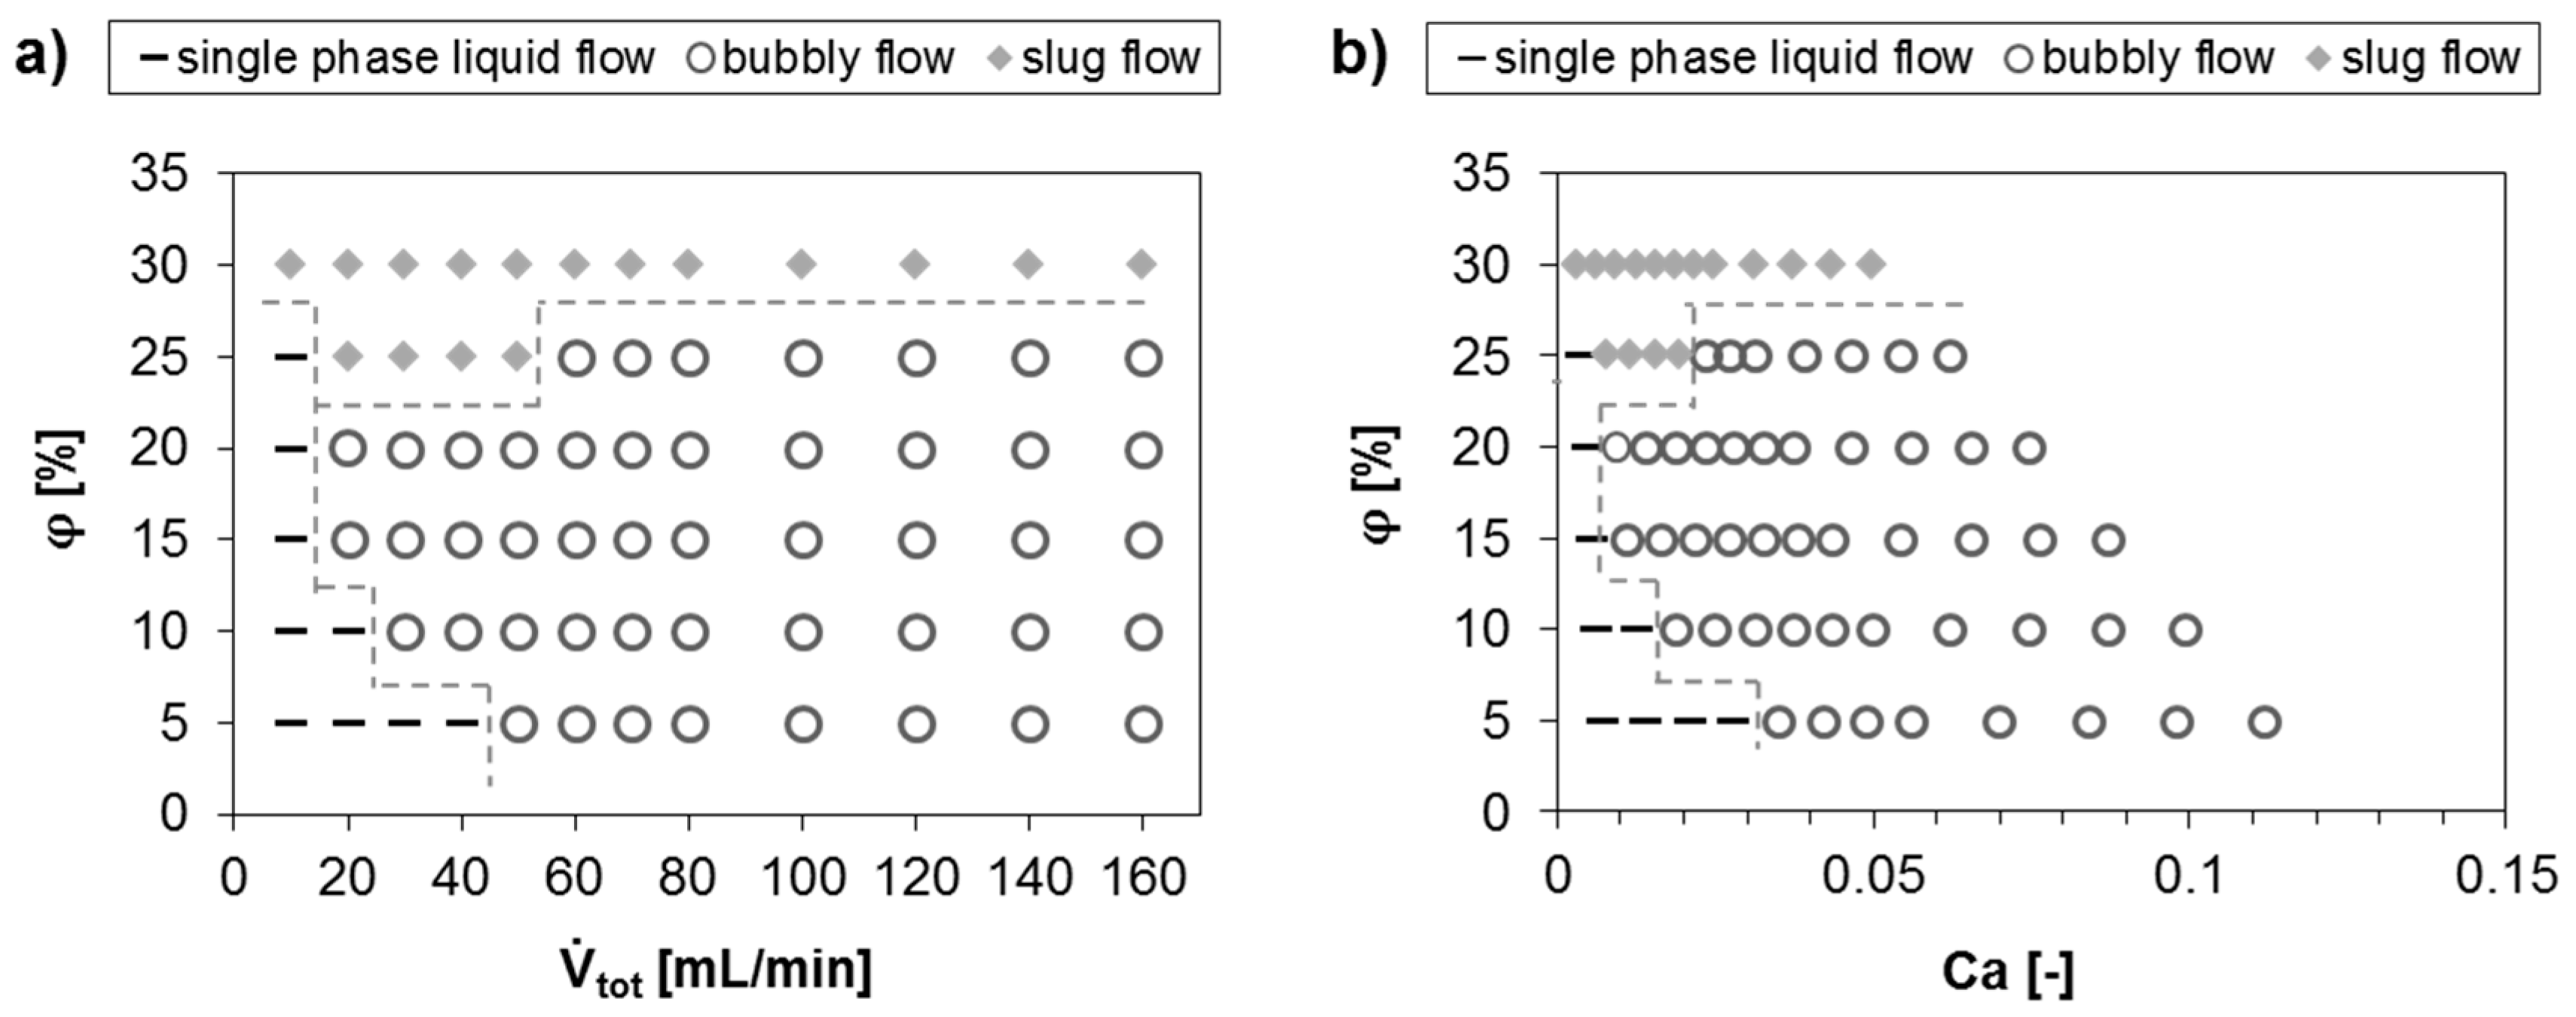
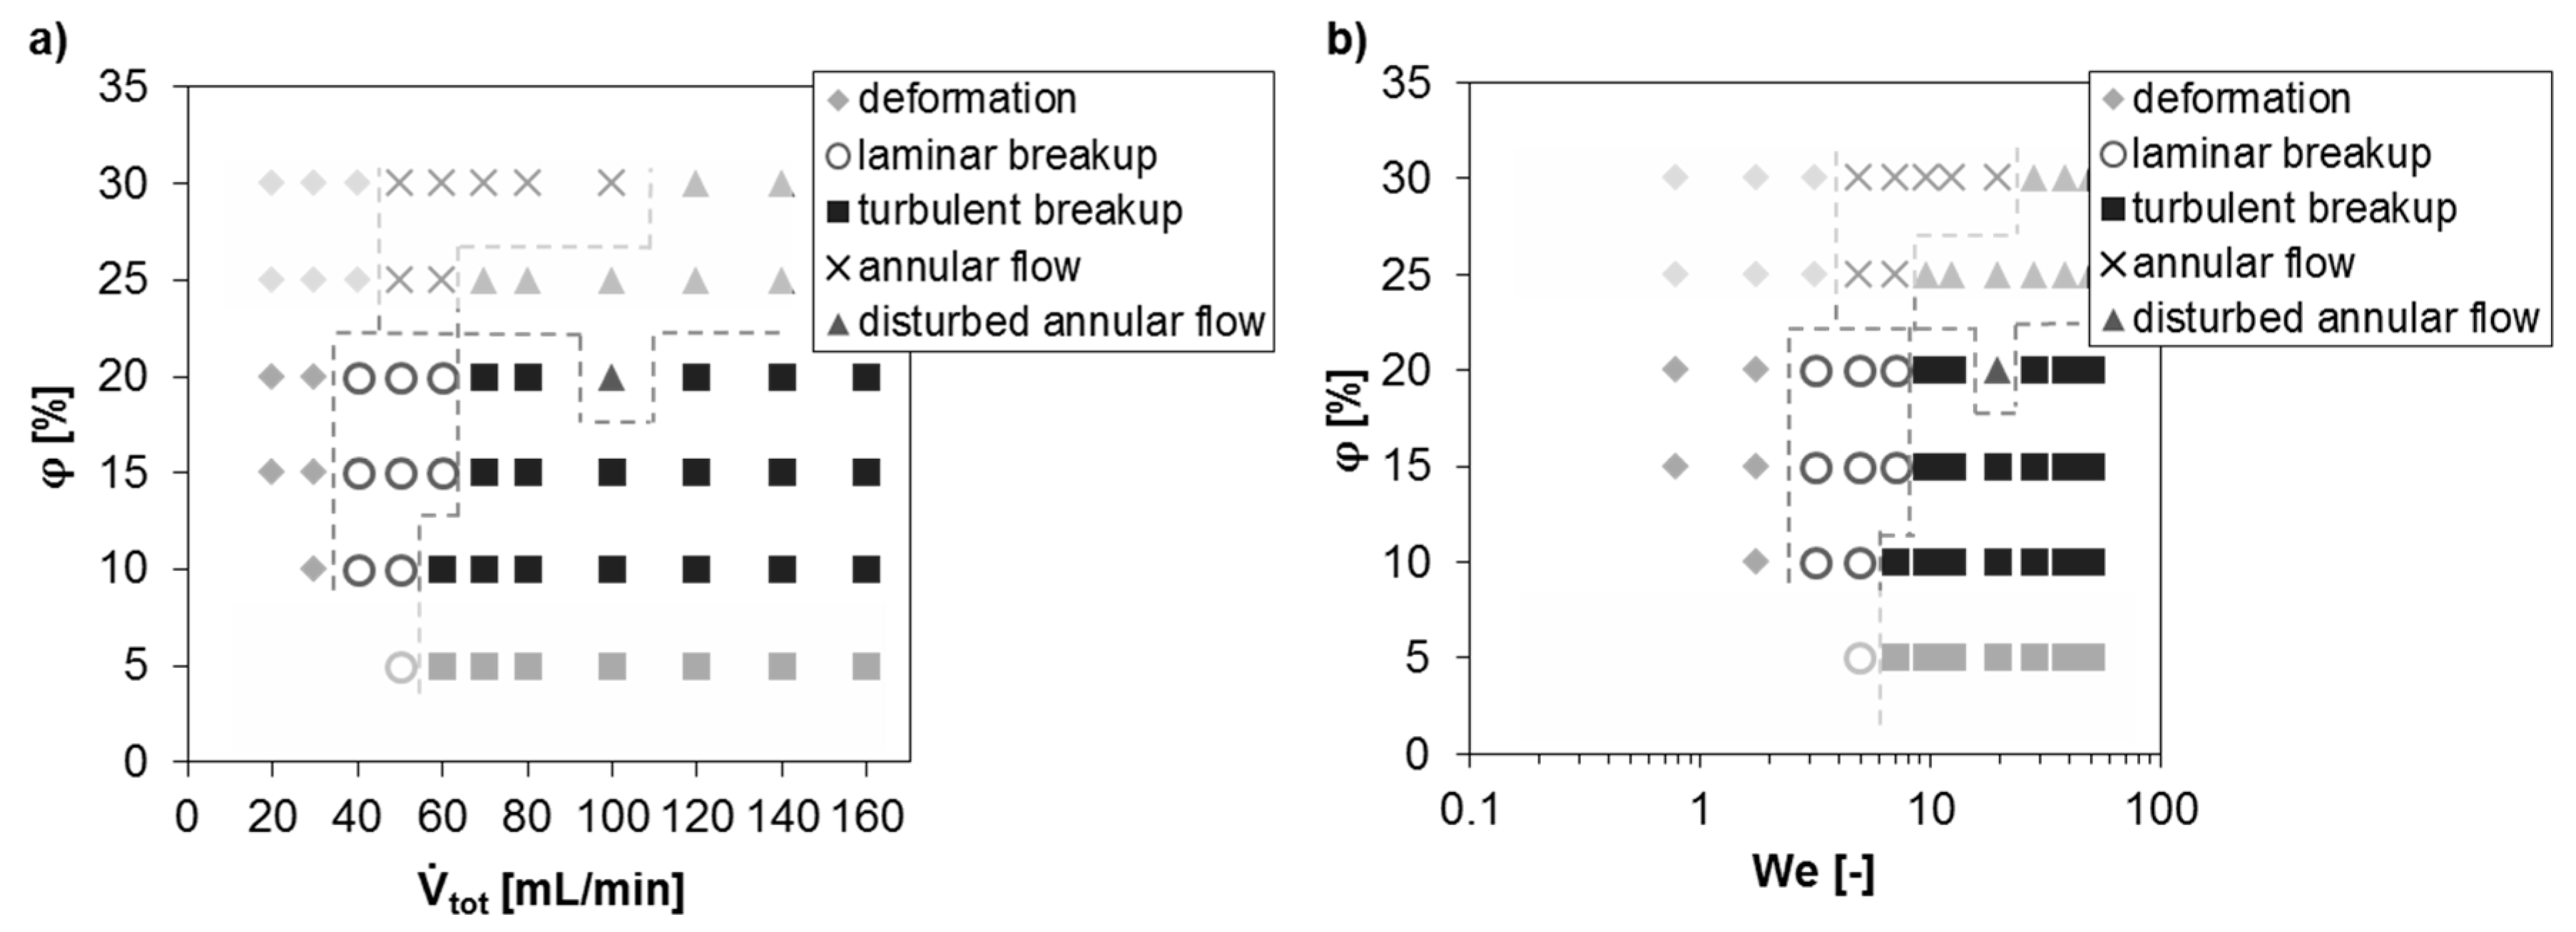
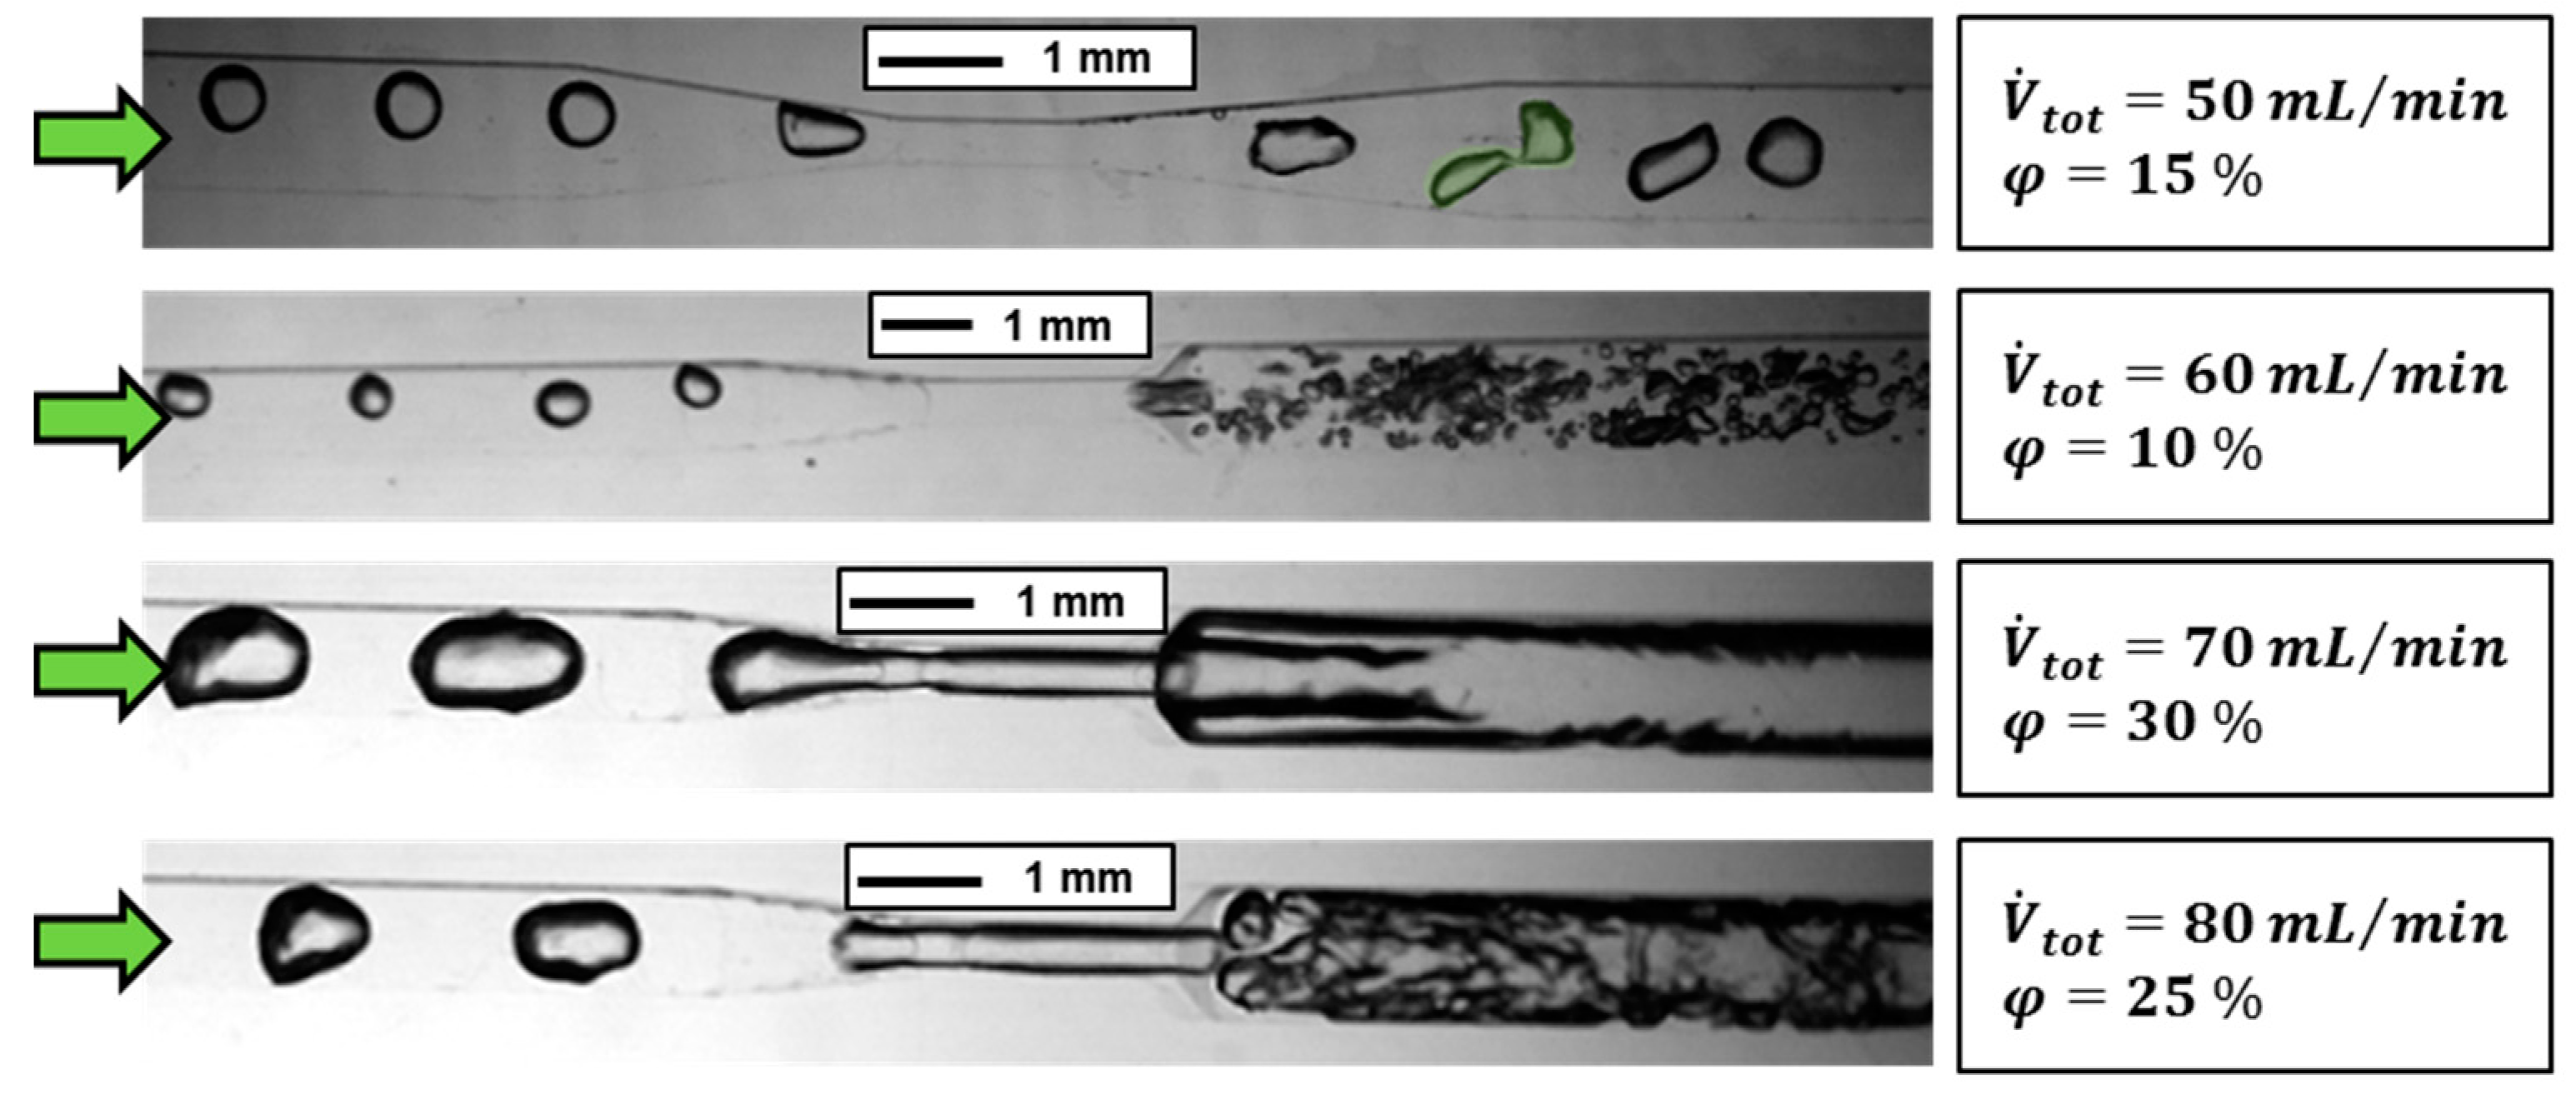
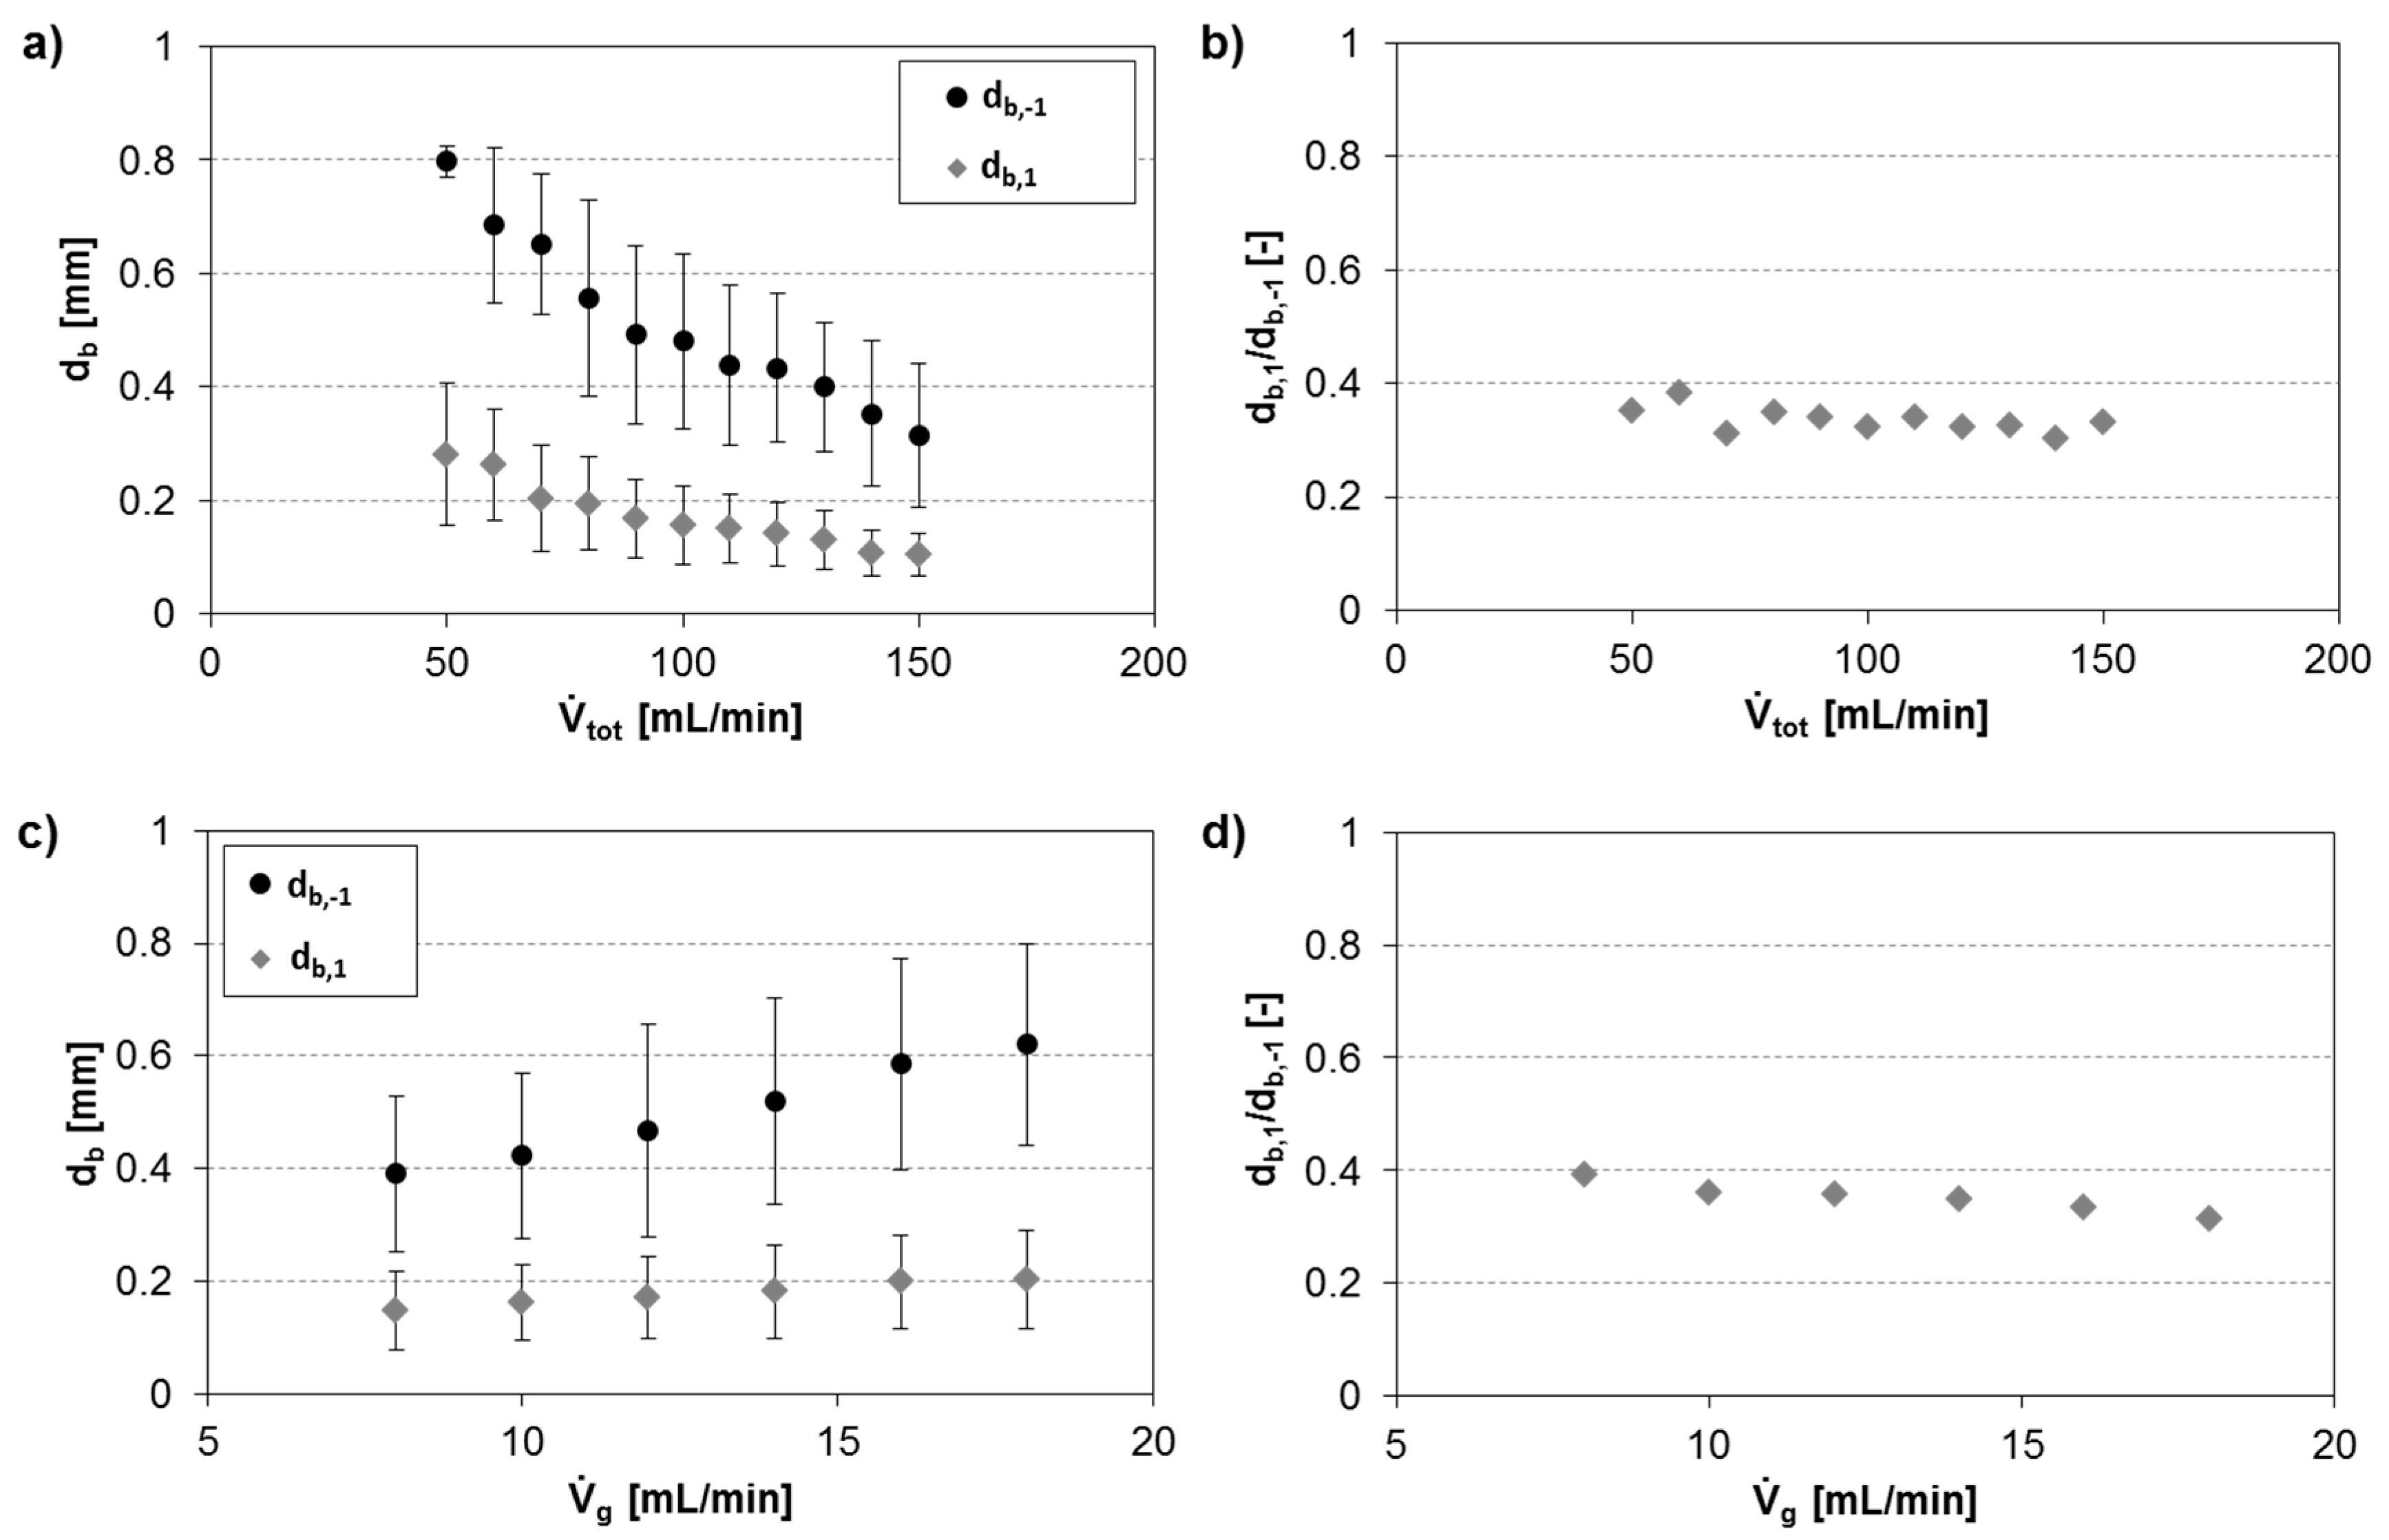
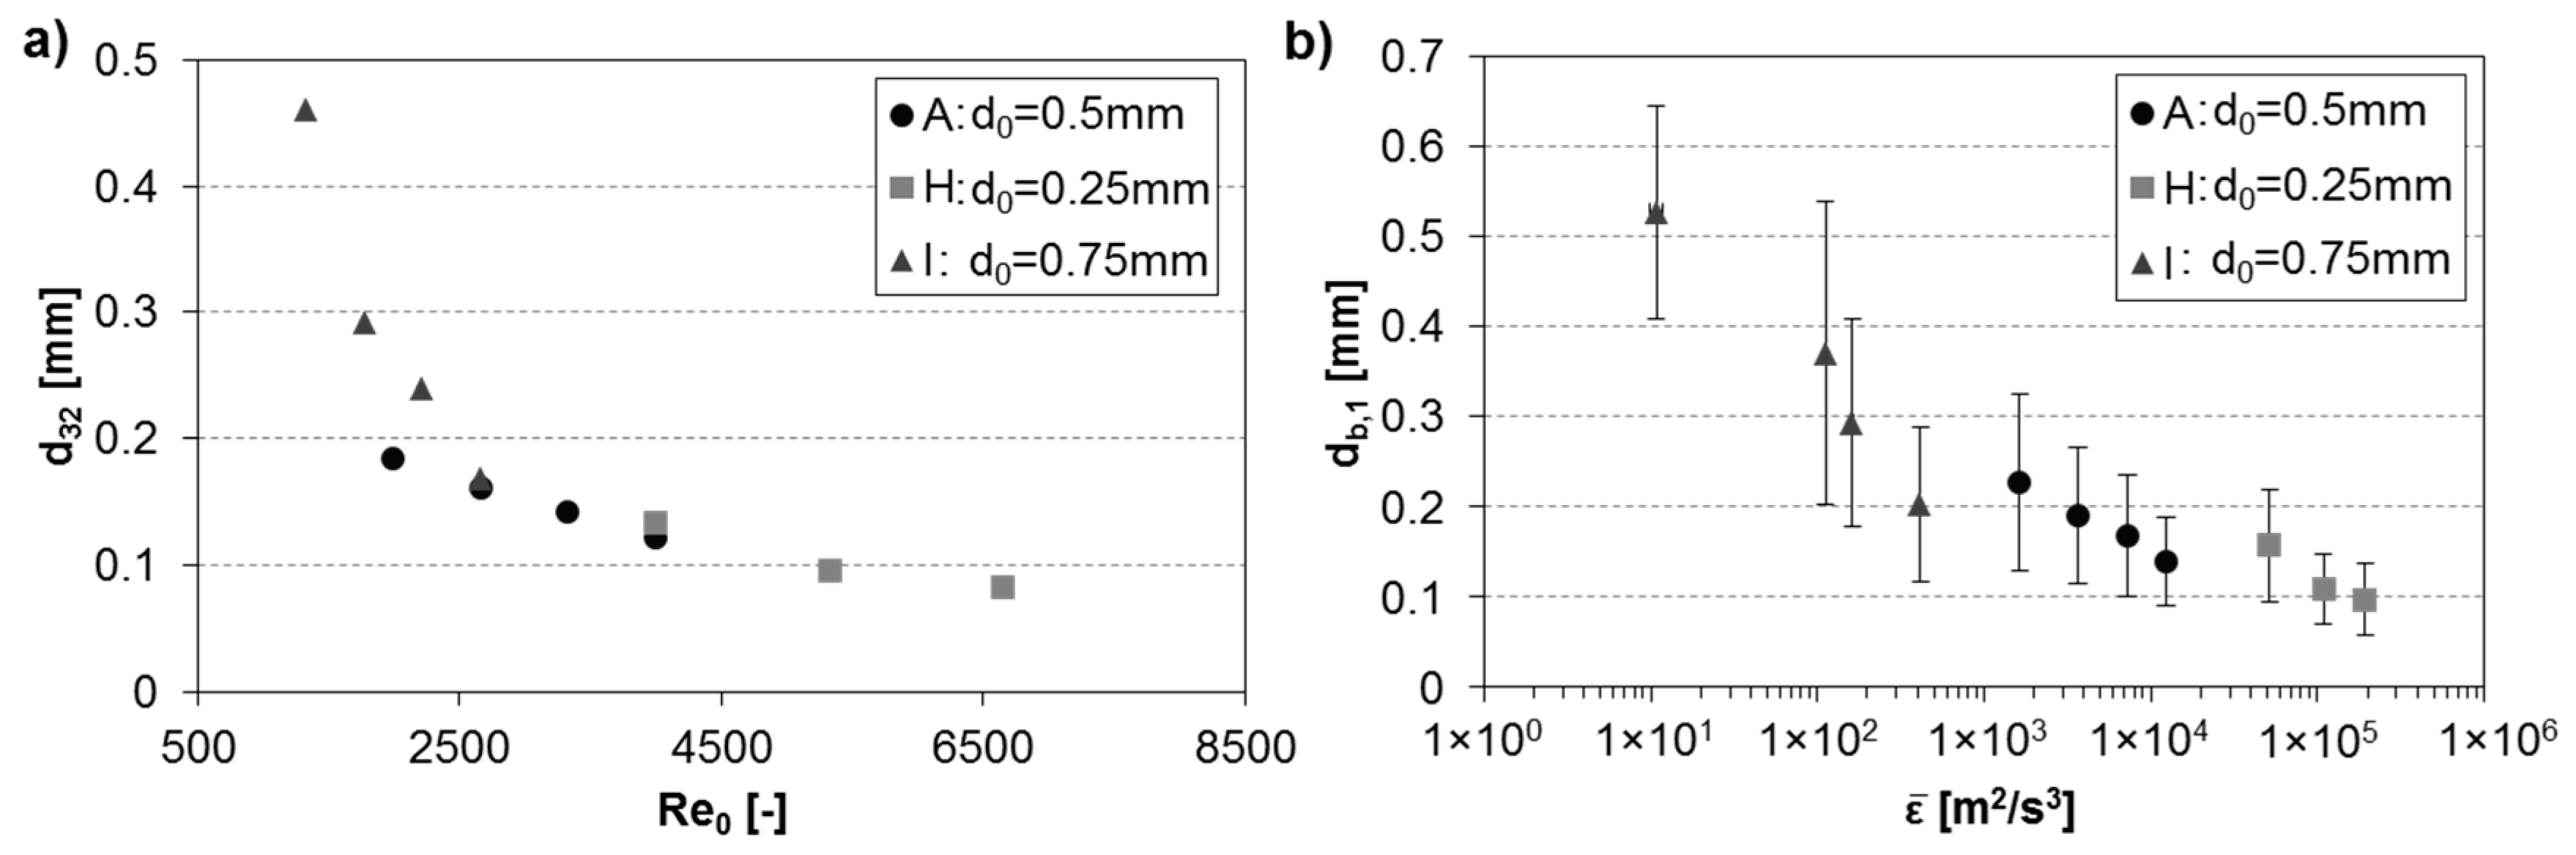
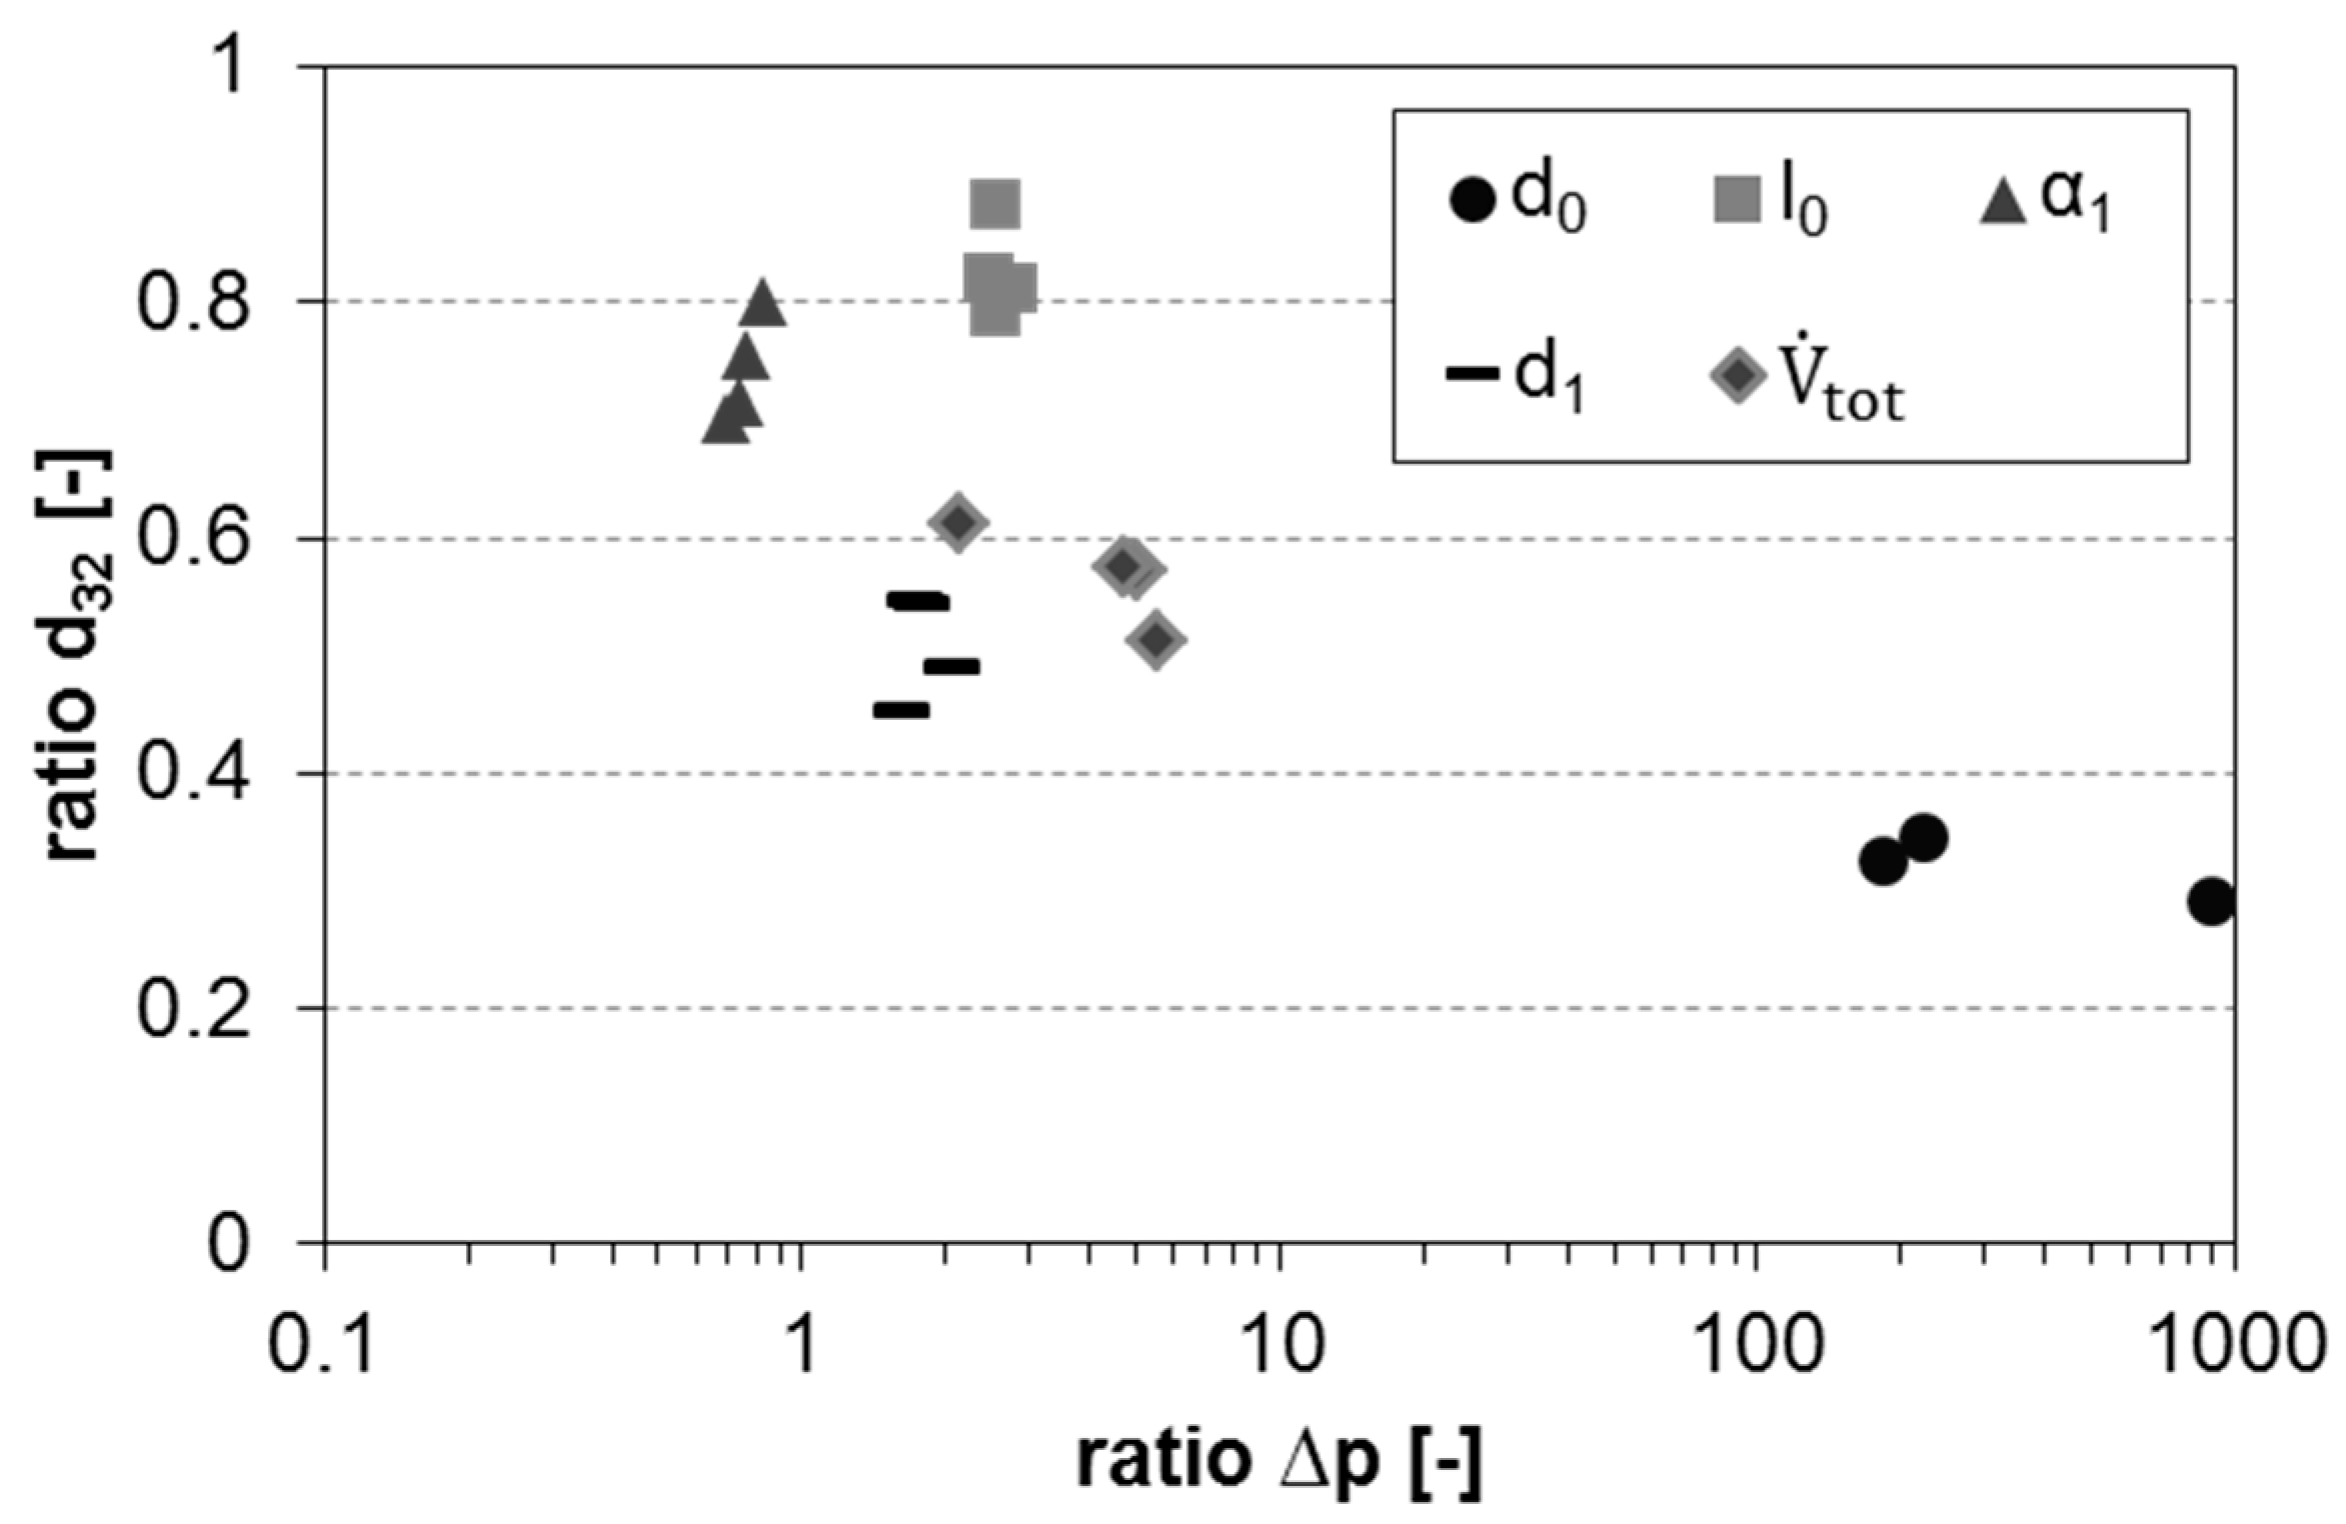
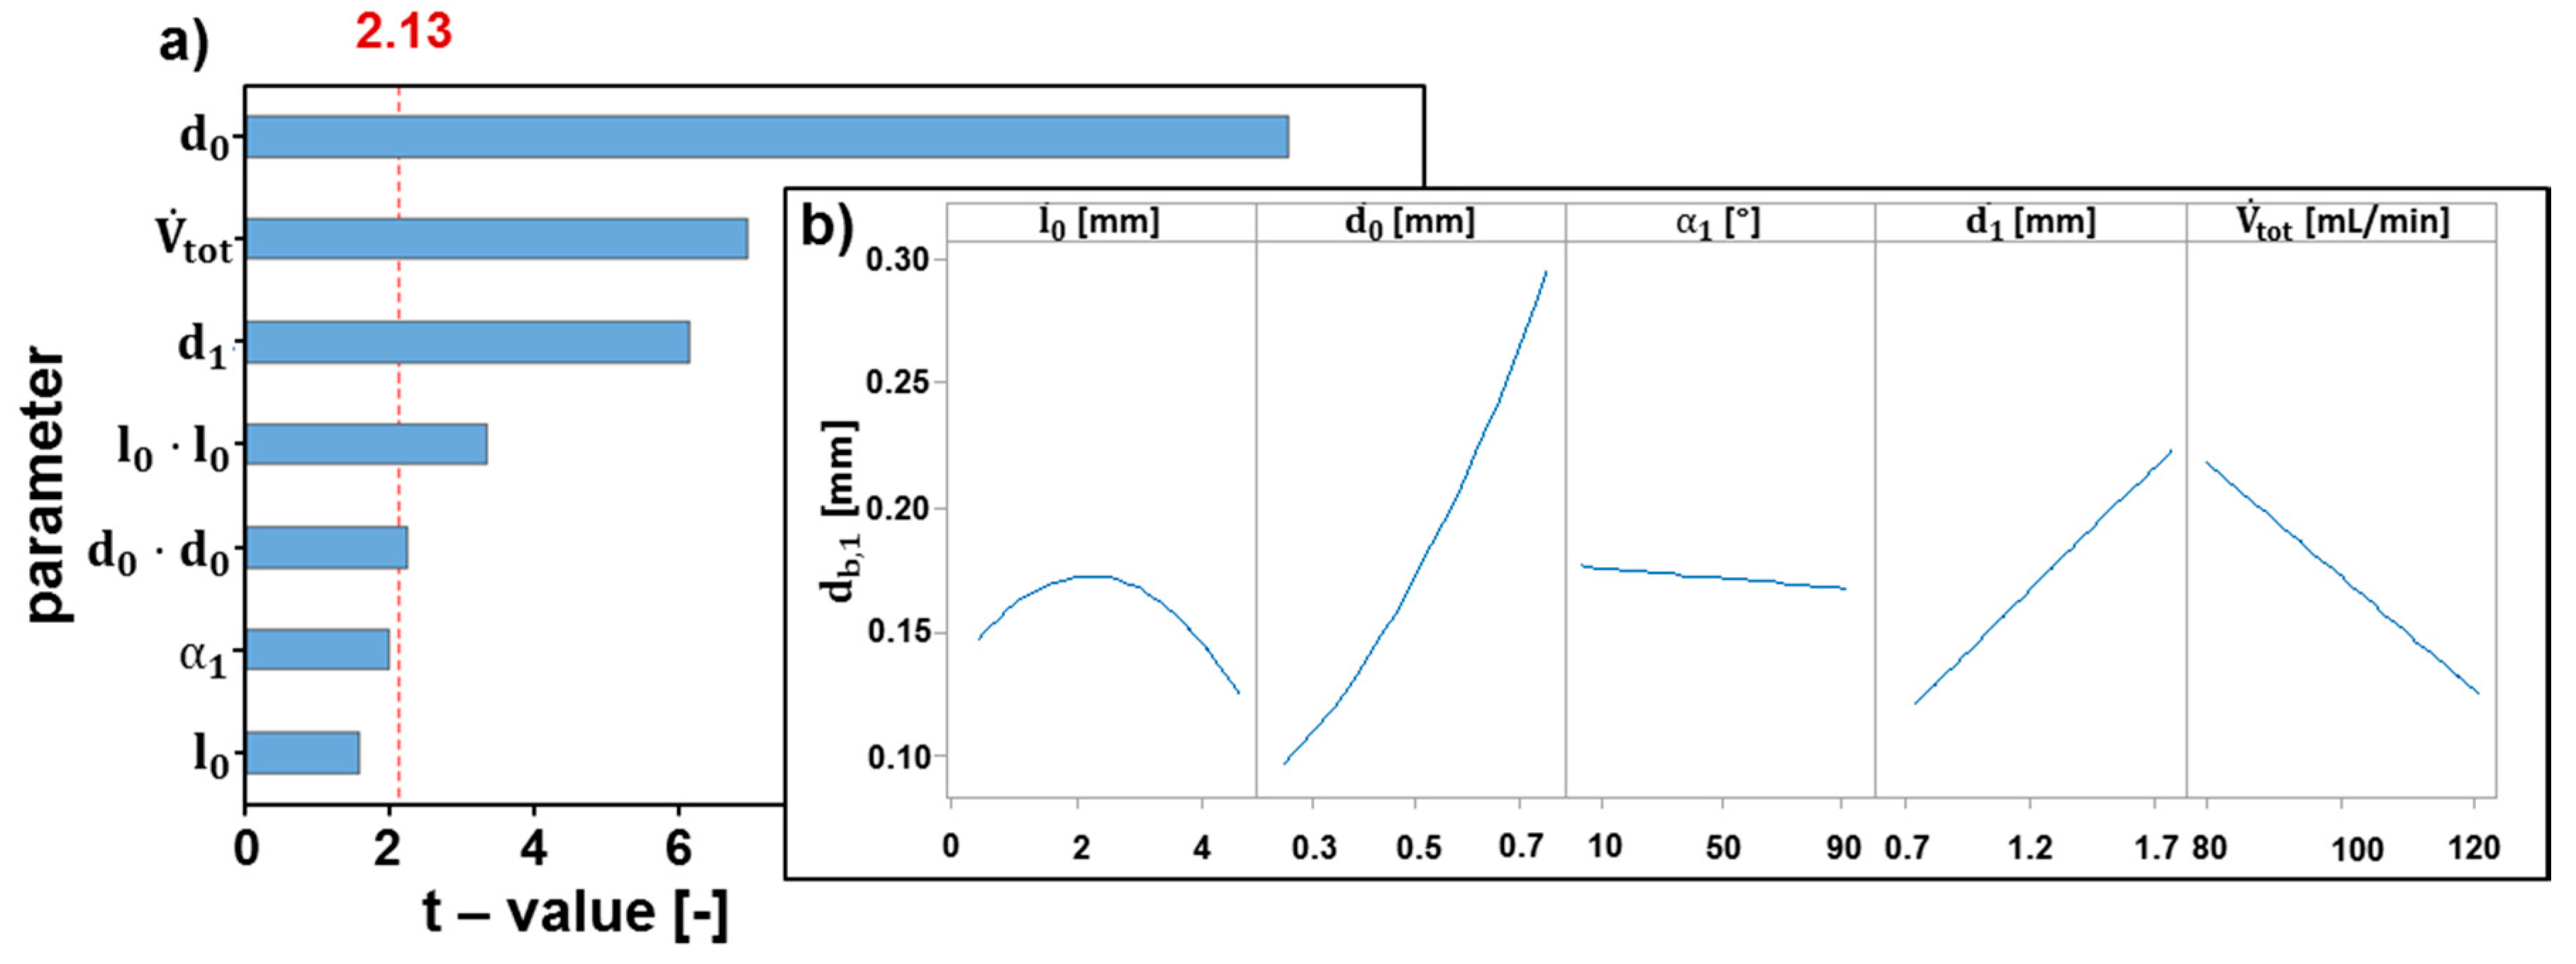
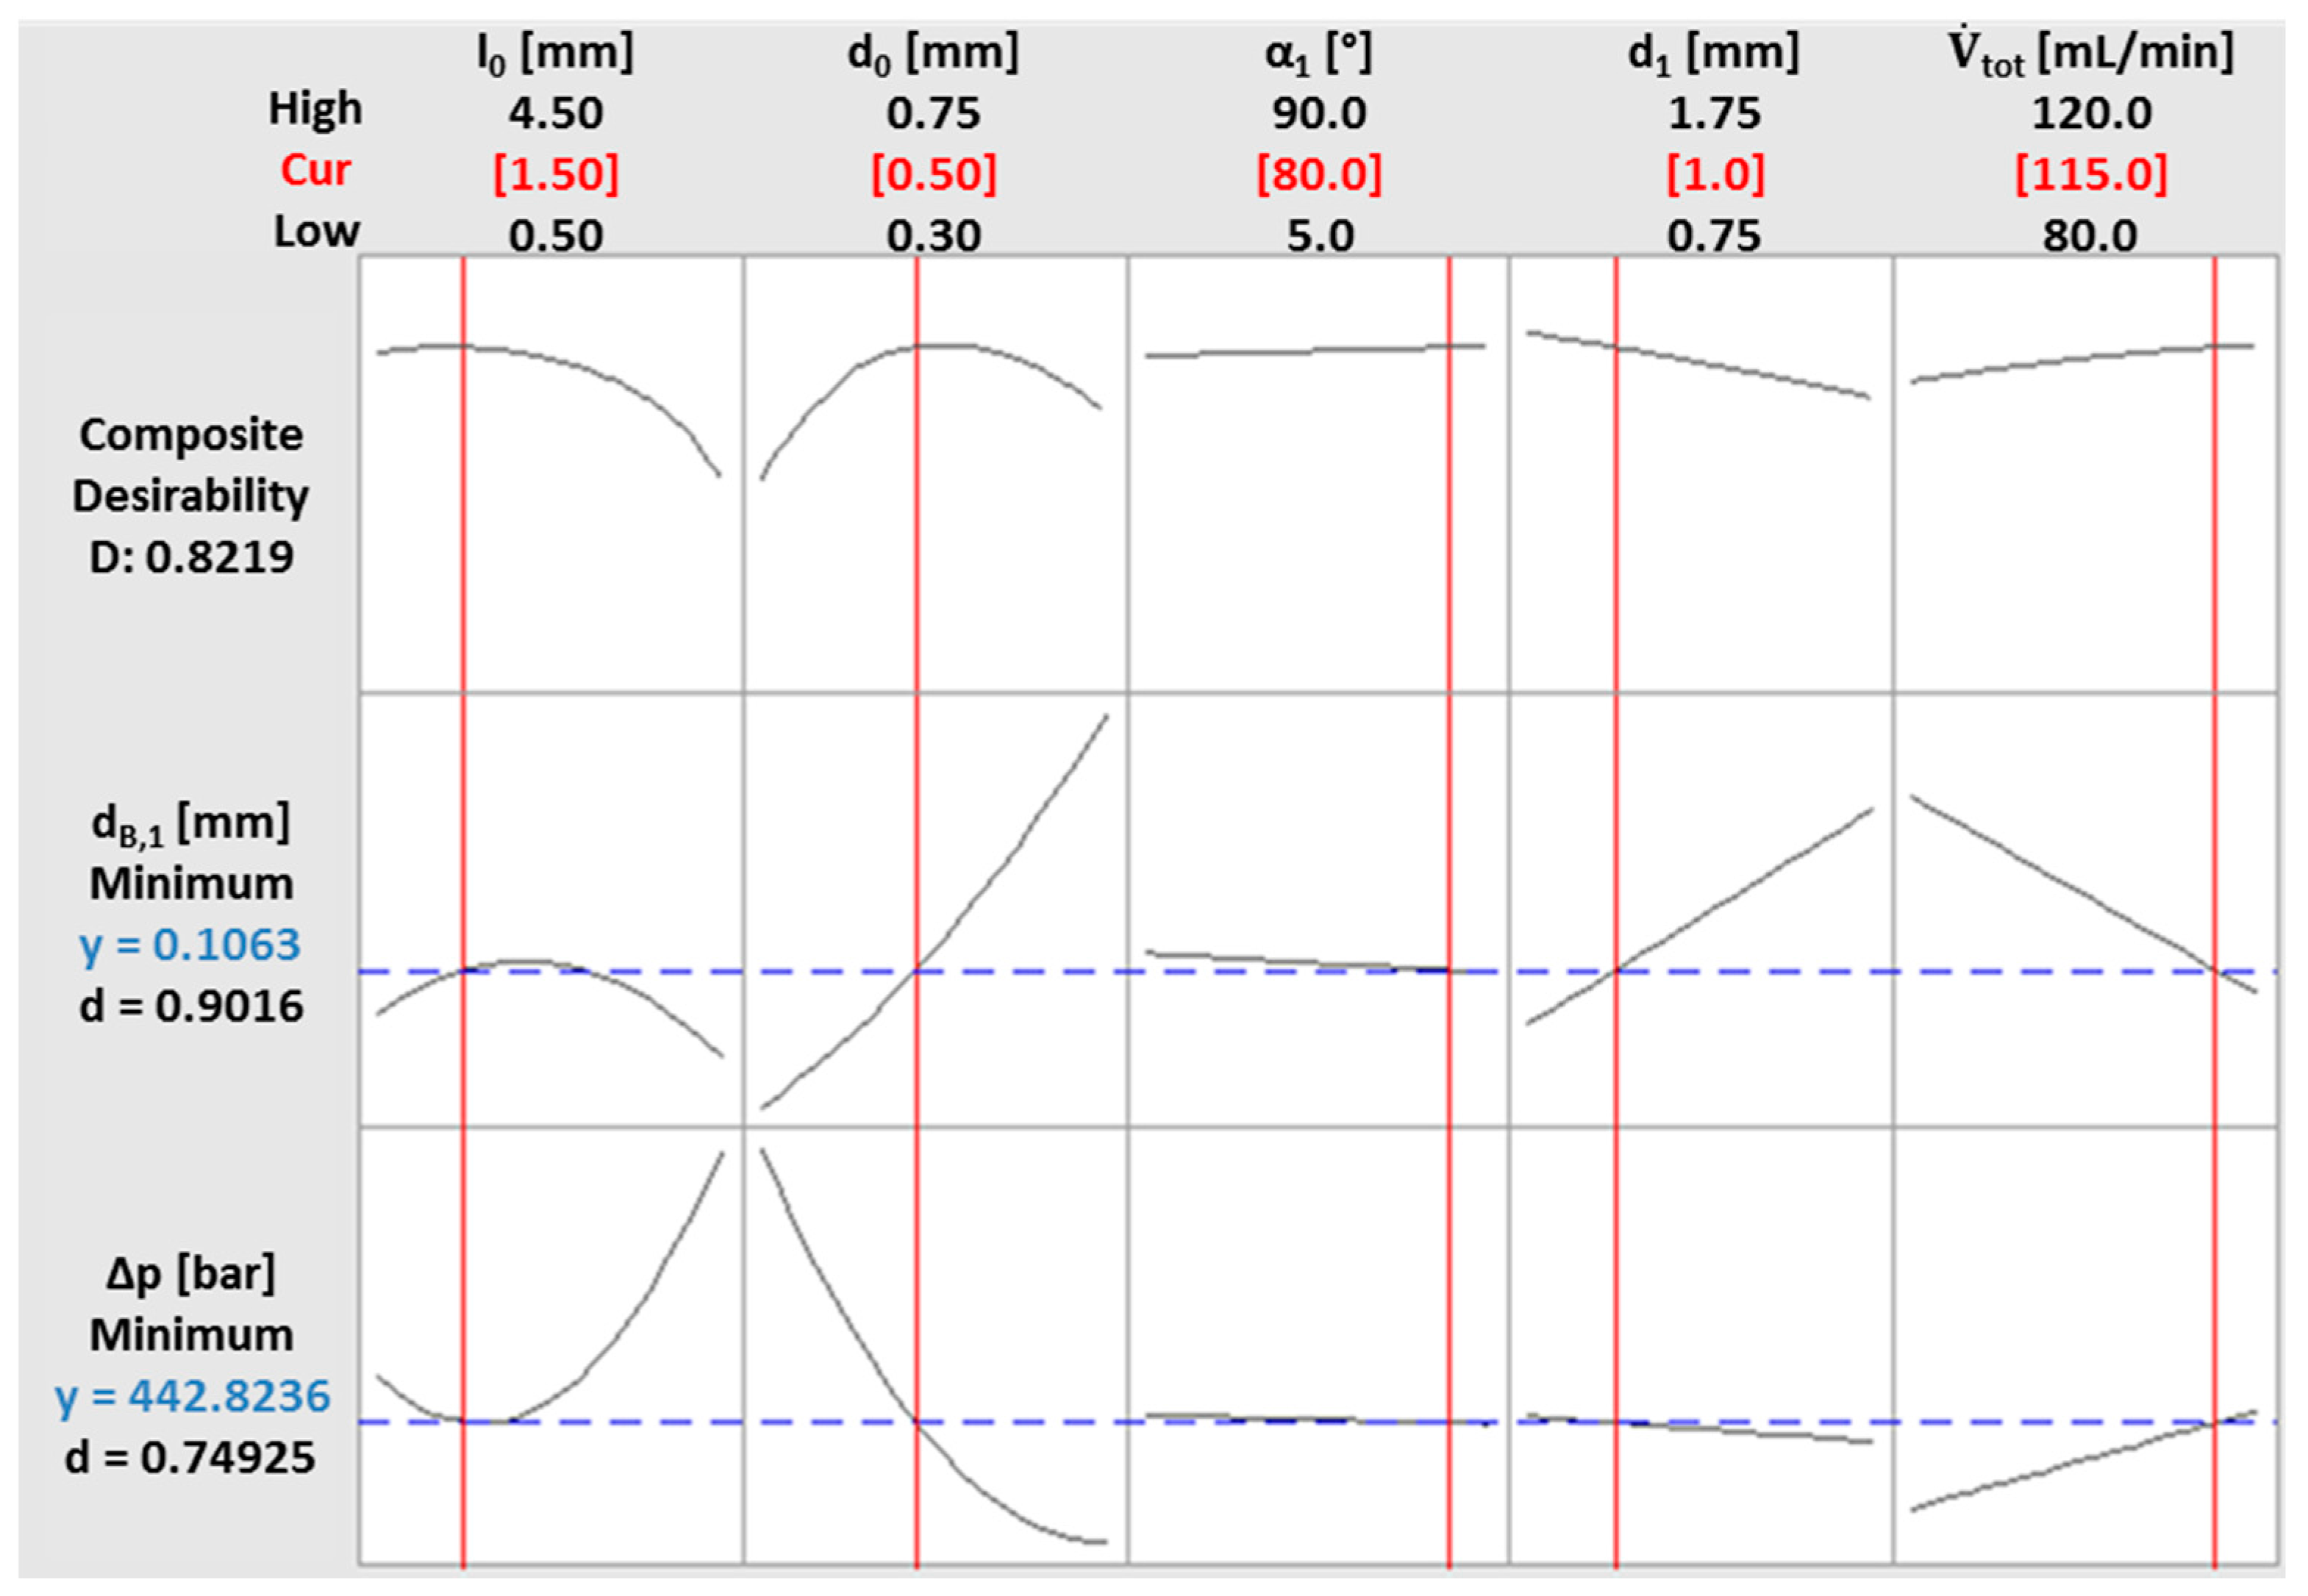
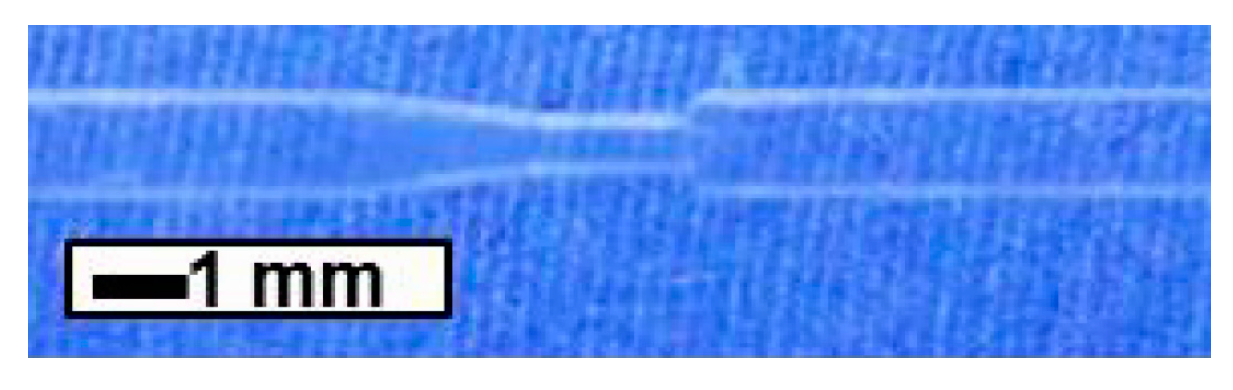
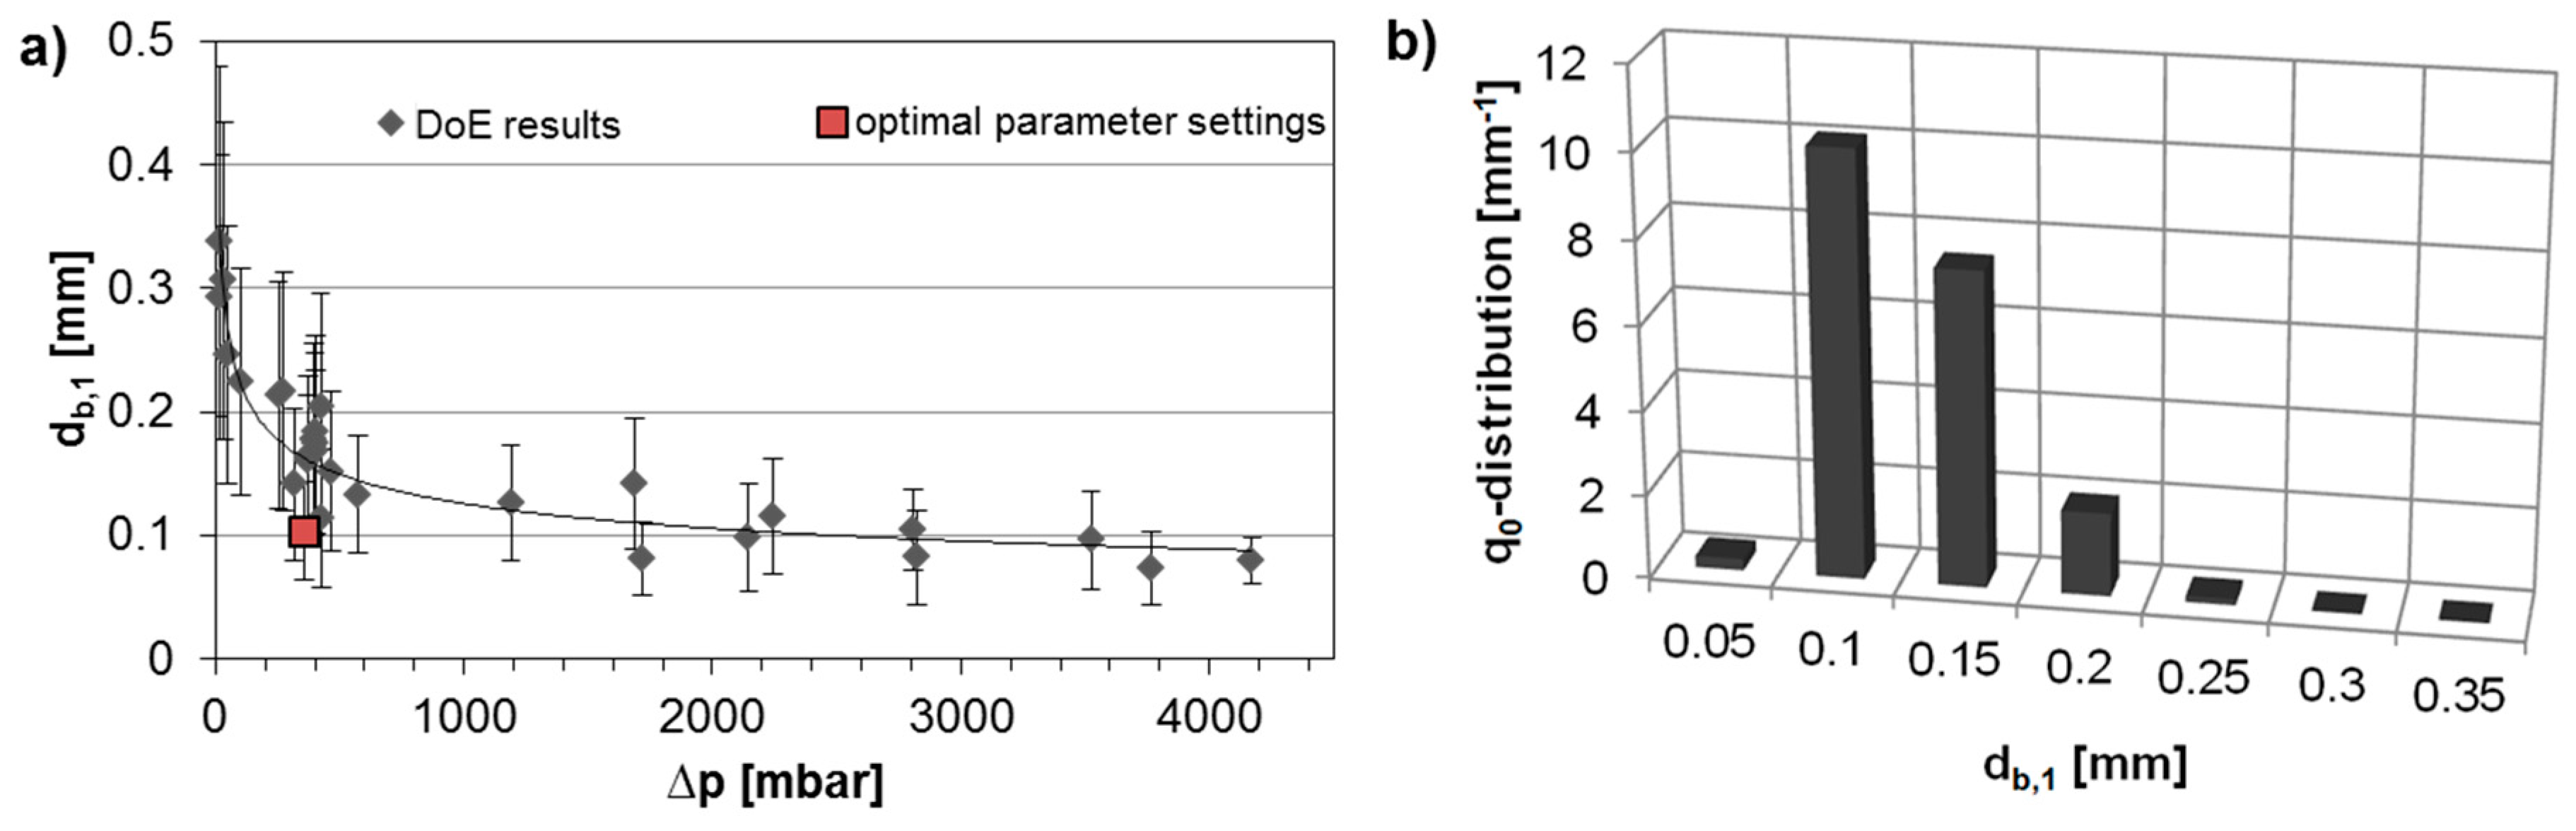
Table 1.
All adjustable process inputs with potential influence on turbulent bubble breakup.
| Process Parameters | Nozzle Parameters |
|---|---|
|
|
Table 2.
Parameters included in the DoE with investigated value range.
| Parameters [Unit] | Minimum Value | Maximum Value |
|---|---|---|
| [mm] | 0.25 | 0.75 |
| [mm] | 0.5 | 4.5 |
| [°] | 5 | 90 |
| [mm] | 0.75 | 1.75 |
| [mL/min] | 80 | 120 |
Table 3.
Generated DoE using statistical software Minitab® 17 for the investigation of energy optimized turbulent bubble breakup.
Table 3.
Generated DoE using statistical software Minitab® 17 for the investigation of energy optimized turbulent bubble breakup.
| Experiment No. | [mm] | [mm] | [°] | [mm] | [mL/min] | Point Type |
|---|---|---|---|---|---|---|
| 1 | 2.5 | 0.5 | 47.5 | 1.25 | 100 | central point |
| 2 | 0.9 | 0.7 | 81.5 | 1.65 | 84 | corner point |
| 3 | 0.9 | 0.7 | 13.5 | 0.85 | 84 | corner point |
| 4 | 4.1 | 0.7 | 81.5 | 1.65 | 116 | corner point |
| 5 | 4.1 | 0.3 | 13.5 | 1.65 | 116 | corner point |
| 6 | 0.9 | 0.3 | 13.5 | 0.85 | 116 | corner point |
| 7 | 2.5 | 0.5 | 47.5 | 1.25 | 120 | star point |
| 8 | 4.1 | 0.3 | 81.5 | 1.65 | 84 | corner point |
| 9 | 0.5 | 0.5 | 47.5 | 1.25 | 100 | star point |
| 10 | 2.5 | 0.5 | 47.5 | 1.25 | 100 | central point |
| 11 | 2.5 | 0.5 | 90 | 1.25 | 100 | star point |
| 12 | 2.5 | 0.5 | 47.5 | 1.25 | 100 | central point |
| 13 | 2.5 | 0.5 | 47.5 | 0.75 | 100 | star point |
| 14 | 0.9 | 0.3 | 81.5 | 0.85 | 84 | corner point |
| 15 | 4.1 | 0.7 | 13.5 | 0.85 | 116 | corner point |
| 16 | 2.5 | 0.5 | 5 | 1.25 | 100 | star point |
| 17 | 0.9 | 0.3 | 81.5 | 1.65 | 116 | corner point |
| 18 | 2.5 | 0.5 | 47.5 | 1.25 | 100 | central point |
| 19 | 2.5 | 0.5 | 47.5 | 1.25 | 80 | star point |
| 20 | 2.5 | 0.5 | 47.5 | 1.25 | 100 | central point |
| 21 | 2.5 | 0.25 | 47.5 | 1.25 | 100 | star point |
| 22 | 2.5 | 0.5 | 47.5 | 1.75 | 100 | star point |
| 23 | 4.1 | 0.3 | 81.5 | 0.85 | 116 | corner point |
| 24 | 0.9 | 0.7 | 81.5 | 0.85 | 116 | corner point |
| 25 | 4.1 | 0.7 | 13.5 | 1.65 | 84 | corner point |
| 26 | 2.5 | 0.5 | 47.5 | 1.25 | 100 | central point |
| 27 | 4.5 | 0.5 | 47.5 | 1.25 | 100 | star point |
| 28 | 0.9 | 0.7 | 13.5 | 1.65 | 116 | corner point |
| 29 | 4.1 | 0.7 | 81.5 | 0.85 | 84 | corner point |
| 30 | 4.1 | 0.3 | 13.5 | 0.85 | 84 | corner point |
| 31 | 0.9 | 0.3 | 13.5 | 1.65 | 84 | corner point |
| 32 | 2.5 | 0.75 | 47.5 | 1.25 | 100 | star point |
Table 4.
Fabricated micronozzle inlay elements for investigation of turbulent bubble breakup. Nozzle parameters are varied as shown. Close up images of the micronozzles are given. T-mixer geometry, = 8°, and = 1 mm are held constant for all inlay elements.
Table 4.
Fabricated micronozzle inlay elements for investigation of turbulent bubble breakup. Nozzle parameters are varied as shown. Close up images of the micronozzles are given. T-mixer geometry, = 8°, and = 1 mm are held constant for all inlay elements.
| Name | Picture | [mm] | [mm] | [°] | [mm] |
|---|---|---|---|---|---|
| A | 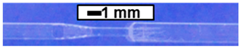 | 0.5 | 2.5 | 47.5 | 1.25 |
| B | 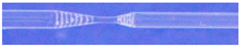 | 0.3 | 0.9 | 13.5 | 0.85 |
| C | 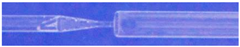 | 0.3 | 0.9 | 81.5 | 1.65 |
| D | 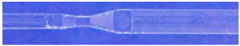 | 0.7 | 0.9 | 13.5 | 1.65 |
| E |  | 0.3 | 0.9 | 13.5 | 1.65 |
| F |  | 0.5 | 0.5 | 47.5 | 1.25 |
| G |  | 0.5 | 4.5 | 47.5 | 1.25 |
| H | 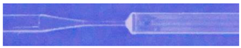 | 0.25 | 2.5 | 47.5 | 1.25 |
| I | 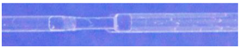 | 0.75 | 2.5 | 47.5 | 1.25 |
| J | 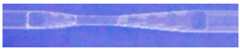 | 0.5 | 2.5 | 5 | 1.25 |
| K | 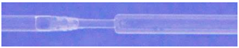 | 0.5 | 2.5 | 90 | 1.25 |
| L | 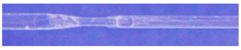 | 0.5 | 2.5 | 47.5 | 0.75 |
| M | 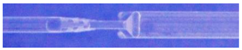 | 0.5 | 2.5 | 47.5 | 1.75 |
| N |  | 0.3 | 4.1 | 13.5 | 1.65 |
| O | 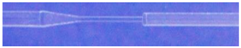 | 0.3 | 4.1 | 81.5 | 0.85 |
| P | 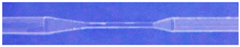 | 0.3 | 4.1 | 13.5 | 0.85 |
| Q | 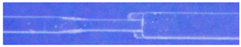 | 0.7 | 4.1 | 81.5 | 1.65 |
| R | 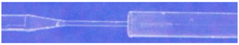 | 0.3 | 4.1 | 81.5 | 1.65 |
| S | 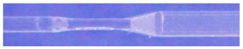 | 0.7 | 4.1 | 13.5 | 1.65 |
| T | 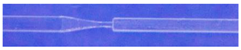 | 0.3 | 0.9 | 81.5 | 0.85 |
| U |  | 0.7 | 0.9 | 81.5 | 1.65 |
| reference |  | 1 | - | - | 1 |
Table 5.
Optimum factor setting for efficient turbulent bubble breakup.
| Parameter | Value |
|---|---|
| 2.5 mm | |
| 0.9 mm | |
| 80° | |
| 1.0 mm | |
| 115 mL/min |
© 2017 by the authors. Licensee MDPI, Basel, Switzerland. This article is an open access article distributed under the terms and conditions of the Creative Commons Attribution (CC BY) license (http://creativecommons.org/licenses/by/4.0/).
Share and Cite
MDPI and ACS Style
Reichmann, F.; Varel, F.; Kockmann, N. Energy Optimization of Gas–Liquid Dispersion in Micronozzles Assisted by Design of Experiment. Processes 2017, 5, 57. https://doi.org/10.3390/pr5040057
AMA Style
Reichmann F, Varel F, Kockmann N. Energy Optimization of Gas–Liquid Dispersion in Micronozzles Assisted by Design of Experiment. Processes. 2017; 5(4):57. https://doi.org/10.3390/pr5040057
Chicago/Turabian StyleReichmann, Felix, Fabian Varel, and Norbert Kockmann. 2017. "Energy Optimization of Gas–Liquid Dispersion in Micronozzles Assisted by Design of Experiment" Processes 5, no. 4: 57. https://doi.org/10.3390/pr5040057
Note that from the first issue of 2016, this journal uses article numbers instead of page numbers. See further details here.