Article

Stochasticity in the Parasite-Driven Trait Evolution of Competing Species Masks the Distinctive Consequences of Distance Metrics

by
Christian Alvin H. Buhat
1,
Dylan Antonio S. J. Talabis
1,
Anthony L. Cueno
1,
Maica Krizna A. Gavina
1,2,
Ariel L. Babierra
1,
Genaro A. Cuaresma
1 and
Jomar F. Rabajante
1,*
1
Institute of Mathematical Sciences and Physics, University of the Philippines Los Baños, Los Baños, Laguna 4031, Philippines
2
Graduate School of Science and Technology, Shizuoka University, 3-5-1 Johoku, Naka-ku, Hamamatsu 432-8561, Japan
*
Author to whom correspondence should be addressed.
Processes 2017, 5(4), 74; https://doi.org/10.3390/pr5040074
Submission received: 28 September 2017 / Revised: 10 November 2017 / Accepted: 13 November 2017 / Published: 17 November 2017

Abstract

:
Various distance metrics and their induced norms are employed in the quantitative modeling of evolutionary dynamics. Minimization of these distance metrics, when applied to evolutionary optimization, are hypothesized to result in different outcomes. Here, we apply the different distance metrics to the evolutionary trait dynamics brought about by the interaction between two competing species infected by parasites (exploiters). We present deterministic cases showing the distinctive selection outcomes under the Manhattan, Euclidean, and Chebyshev norms. Specifically, we show how they differ in the time of convergence to the desired optima (e.g., no disease), and in the egalitarian sharing of carrying capacity between the competing species. However, when randomness is introduced to the population dynamics of parasites and to the trait dynamics of the competing species, the distinctive characteristics of the outcomes under the three norms become indistinguishable. Our results provide theoretical cases of when evolutionary dynamics using different distance metrics exhibit similar outcomes.

1. Introduction

Parasitism-induced coevolution is an interesting topic of evolutionary biology, as parasites can drive biodiversity and balance in communities [1,2,3,4]. Specifically, parasite infection greatly influences the population dynamics of species in a competitive environment [5,6]. Species maximize their fitness (measure of reproductive success) but resources are limited, leading to the competition for share in the environmental carrying capacity [6,7,8,9]. If one species wins, parasites could drive the winner to become a loser, giving other species the opportunity to dominate [5,6,7,8,9,10]. Both competition and parasitism arise as two candidate biotic factors for explaining the evolution of traits (e.g., phenotype and behavior) in populations [11].
The evolution of traits has been modeled using various mathematical techniques (e.g., game theory, dynamical systems, and probability theory). One of which is the selection gradient in differential equation form [12,13,14,15,16,17]. In this model, if the selection gradient results in a positive change in fitness value, then the trait becomes more favored and further improved. If it is negative, then the trait is reduced. Similarly, we use in this study the idea of selection ascent towards fitness maximization. The trait of a population is represented numerically, and the changes in the trait are modeled using a dynamical system. The quantitative trait dynamics is governed by the goal of the population (here, termed as evolutionary objective) and by the existent population dynamics of the species modeled using Lotka-Volterra-type equations. We study the population dynamics since the effect of evolution in species are often reflected in their population densities [18,19,20].
The evolutionary objective is represented by mathematical metrics [21,22,23,24,25]. A metric is a measure of distance between the desired goal and the instantaneous condition of the population. For example, if the evolutionary objective is to reach the maximum population density normalized to 1 and the current population density is X , then the metric can be represented by 1 X . Here, three common distance metrics are studied, namely the Manhattan norm (also known as Taxicab or 1-norm), the Euclidean norm (least squares or 2-norm), and the Chebyshev norm (supremum, uniform, or infinity norm) [26,27]. We investigate the differences in the effect of the three metrics to the resulting trait dynamics of competing populations.
The distance metric used in obtaining the desired evolutionary outcome is hypothesized to have a significant effect on the trait and population dynamics of species [28,29,30]. A notable example is how populations or societies adapt to their environment considering different strategies of distributing the available resources (e.g., welfare based on utilitarianism or egalitarianism) [30]. Predicting the population dynamics of species could be subject to the metric used in data analysis and simulations. This has crucial implications on formulating ecological conclusions. For this reason, it is imperative to determine the advantages and limitations of the metrics. We identify the distinctive characteristics of the resulting trait dynamics under the Manhattan, Euclidean, and Chebyshev norms. We also investigate whether these characteristics are robust under stochastic noise. Our results provide an answer to the question “Does the choice of measure for adaptation success matter in a stochastic environment?”
The study of evolutionary dynamics encompasses different dimensions. As in the concept of inclusive inheritance, information transfer and changes in traits can happen at genetic, epigenetic, ecological, and cultural levels [31,32,33]. The changes in traits can be transgenerational (e.g., genetic inheritance from parents to offspring) or intra-generational (e.g., cultural information transfer within the same generation). In this paper, we assume that novel traits of two competing species are selected (preferred) to adapt or defend against parasites [34,35,36,37,38,39]. The novel traits may arise in different evolutionary dimensions. As such, our results can be interpreted not only in the perspective of genetics, but also in the perspective of cultural societies where parasites are characterized by exploiters. Introductory background and discussion on advances in the fields evolutionary parasitology and evolution of exploitation are available in literature [40,41,42,43,44].

2. The Mathematical Model

Two competing species ( X 1 and X 2 ) maximize their population densities with respect to the environmental carrying capacity. In order to maximize their population, the two competing host species minimize the effect of antagonistic parasites ( P ) by changing the host defense trait. This can be achieved through minimizing the parasitism exploitation coefficient α (represented by α 1 and α 2 in our model). However, as the host species compete for available resources in the environment, they cooperatively assure that there is egalitarian (equal) sharing of resources. Our model represents competitive-cooperative interaction of two species that are evolving to defend against the negative influence of parasitism or exploitation [45,46].
We assume that the two competing host species have equal characteristics. This allows our analysis to focus on the effect of the different metrics to the evolutionary objective rather than on the differences between the two species. Without losing generality in our conceptual study, we use a basic Lotka-Volterra-type model [6,47,48,49,50] (with time step h << 1) for population dynamics with basal growth rate r i as follows:
X 1 ( t + h ) = X 1 ( t ) + h ( r 1 X 1 ( t ) × ( 1 X 1 ( t ) X 2 ( t ) ) α 1 X 1 ( t ) × P ( t ) )
X 2 ( t + h ) = X 2 ( t ) + h ( r 2 X 2 ( t ) × ( 1 X 1 ( t ) X 2 ( t ) ) α 2 X 2 ( t ) × P ( t ) )
P ( t + h ) = P ( t ) + h ( P ( t ) × ( β 1 X 1 ( t ) + β 2 X 2 ( t ) ) P ( t ) ) + n o i s e 1
where β i = γ α i ,   i = 1 , 2 . The parameter γ is the ratio between the parasitism numerical response coefficient ( β i ) and the parasitism exploitation coefficient ( α i ). When β i > α i ( β i < α i ), the parasites produce more (less) offspring compared to the number of parasitized hosts.
The evolutionary trait dynamics using Manhattan 1-norm, | 1 X 1 ( t ) | + | 1 X 2 ( t ) | , is modeled by:
α 1 ( t + h ) = α 1 ( t ) h ( ε | 1 X 1 ( t ) | + | 1 X 2 ( t ) | max { X 1 ( t ) , 10 6 } ) + n o i s e 2
α 2 ( t + h ) = α 2 ( t ) h ( ε | 1 X 1 ( t ) | + | 1 X 2 ( t ) | max { X 2 ( t ) , 10 6 } ) + n o i s e 3 .
Using Euclidean 2-norm, ( 1 X 1 ( t ) ) 2 + ( 1 X 2 ( t ) ) 2 , the evolutionary trait dynamics is represented by:
α 1 ( t + h ) = α 1 ( t ) h ( ε ( 1 X 1 ( t ) ) 2 + ( 1 X 2 ( t ) ) 2 max { X 1 ( t ) , 10 6 } ) + n o i s e 2
α 2 ( t + h ) = α 2 ( t ) h ( ε ( 1 X 1 ( t ) ) 2 + ( 1 X 2 ( t ) ) 2 max { X 2 ( t ) , 10 6 } ) + n o i s e 3 .
For the Chebyshev infinity-norm, max { | 1 X 1 ( t ) | , | 1 X 2 ( t ) | } , the model is:
α 1 ( t + h ) = α 1 ( t ) h ( ε max { | 1 X 1 ( t ) | , | 1 X 2 ( t ) | } max { X 1 ( t ) , 10 6 } ) + n o i s e 2
α 2 ( t + h ) = α 2 ( t ) h ( ε max { | 1 X 1 ( t ) | , | 1 X 2 ( t ) | } max { X 2 ( t ) , 10 6 } ) + n o i s e 3 .
For comparison, we also consider a model where the competing species evolve independently of each other. We use the following model that follows a non-cooperative optimization with no assured egalitarian sharing of resources:
α 1 ( t + h ) = α 1 ( t ) h ( α 1 ( t ) × max ( | X 1 ( t ) X 1 ( t 100 ) | , 10 6 ) )
α 2 ( t + h ) = α 2 ( t ) h ( α 2 ( t ) × max ( | X 2 ( t ) X 2 ( t 100 ) | , 10 6 ) ) .
In this model, α 1 is directly independent of X 2 . Also, α 2 is directly independent of X 1 .

3. Simulation Results and Discussion

Deterministic Case: Without stochastic noise, the population densities of the evolving competing host species converge to a stable equilibrium point (Figure 1). The evolutionary objective is to drive the parasitism exploitation coefficient α to zero as well as to reach the maximum population density (Figure 1a,b). We expect that the convergence to the desired evolutionary outcome is faster when using Manhattan, then Euclidean, and lastly, the Chebyshev norm (Figure 1a,b and Figure 2). This is because | 1 X 1 ( t ) | + | 1 X 2 ( t ) | ( 1 X 1 ( t ) ) 2 + ( 1 X 2 ( t ) ) 2 max { | 1 X 1 ( t ) | , | 1 X 2 ( t ) | } . In a biological or social context, this behavior implies that we may consider the Manhattan or Euclidean norm as the metric when the time of convergence is essential in evolutionary optimization (e.g., during crisis and catastrophes).
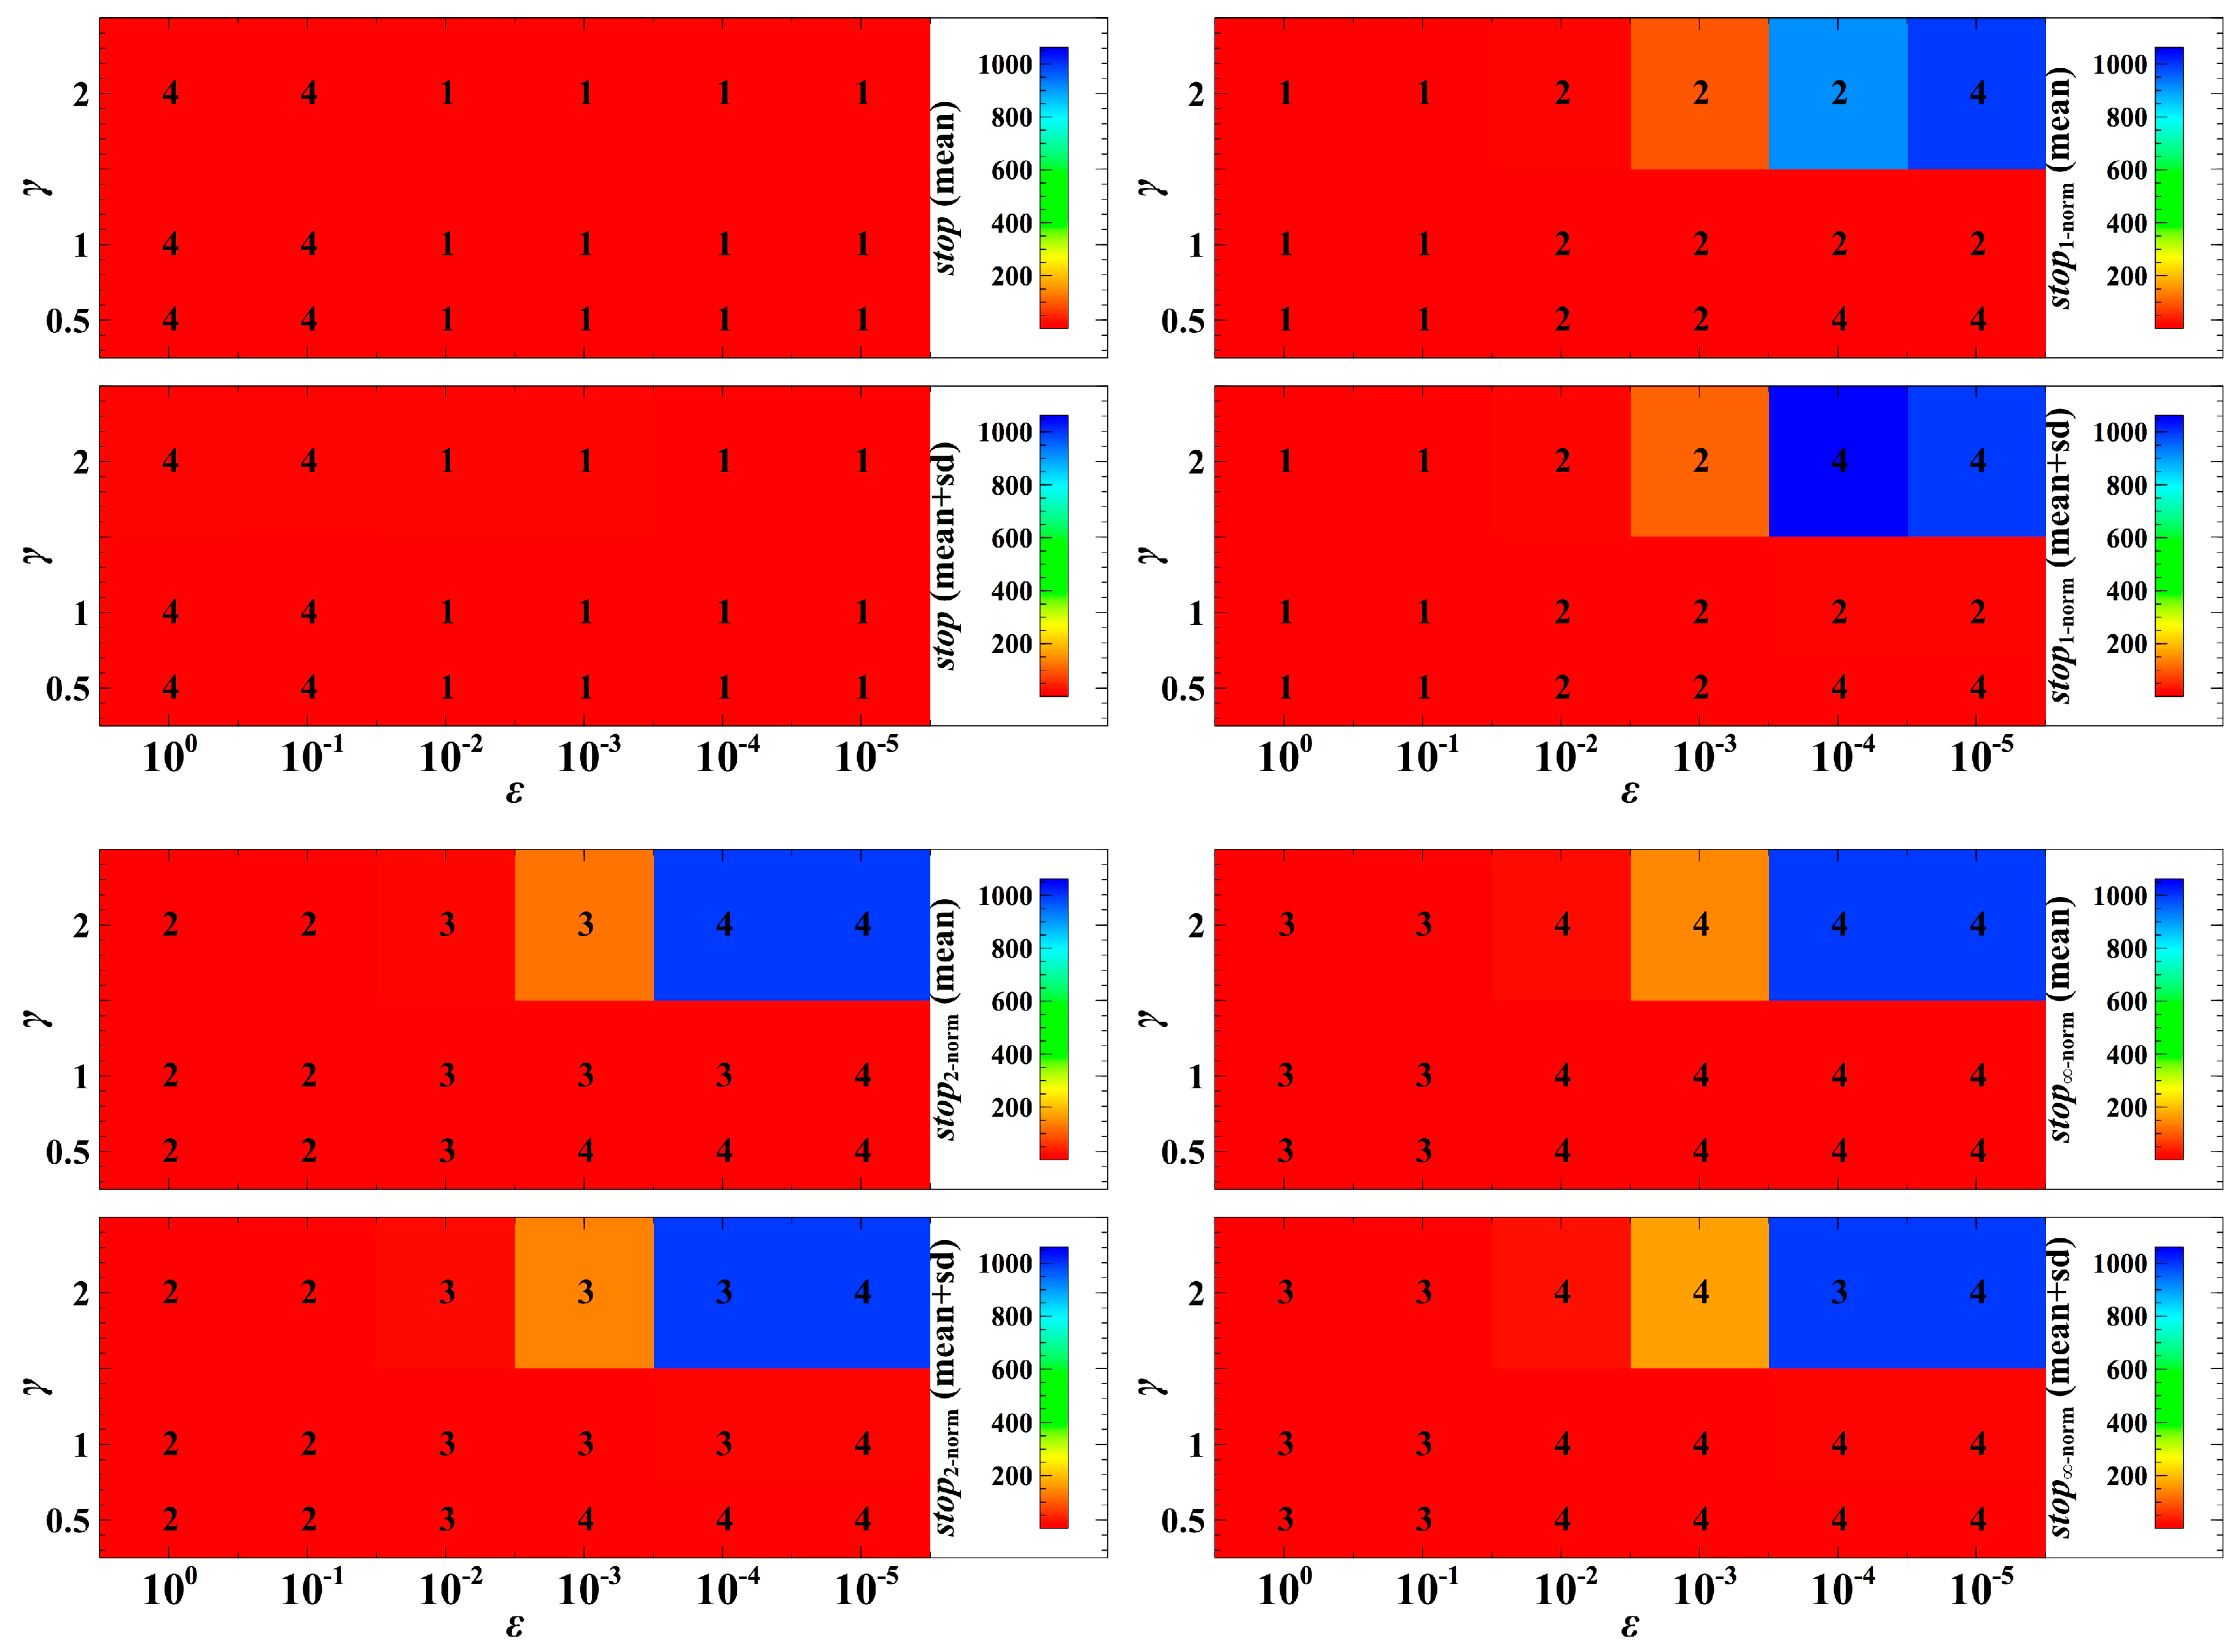
To understand the extent of the regularity of the trait dynamics convergence, we investigate the pattern of convergence under different parameter values of ε and γ (Figure 2). The parameter ε is the speed of evolutionary adaptation, which reflects the effect of the distance metric to the trait dynamics in one generation. In Figure 2, the speed of convergence of the trait dynamics following non-cooperative optimization is slowest in the cases when ε = 10 0 to 10 1 compared to the trait dynamics that utilize the Manhattan, Euclidean, and Chebyshev norms. In the cases when ε = 10 2 to 10 5 , the trait dynamics following non-cooperative optimization is fastest. In most cases, when ε and γ are varied, the convergence of the trait dynamics with the Manhattan norm is faster than the Euclidean norm, and the convergence of the trait dynamics with the Euclidean norm is faster than the Chebyshev norm.
In terms of egalitarian sharing of resources, each of the distance metrics provides opportunity for the competing species to maintain nearly equal sharing of available resources even though the species maximize their population densities in a zero-sum game. If the difference between the population densities of the competing species is near zero, it means that the competition system is egalitarian. The effect of the trait dynamics can be observed from the population densities of the competing species (Figure 3a). The population densities of the competing species following the trait dynamics with non-cooperative optimization can converge faster to the evolutionary objective. However, the outcome may not be egalitarian; that is, there may be large difference between the population densities of the competing species (Figure 3b).
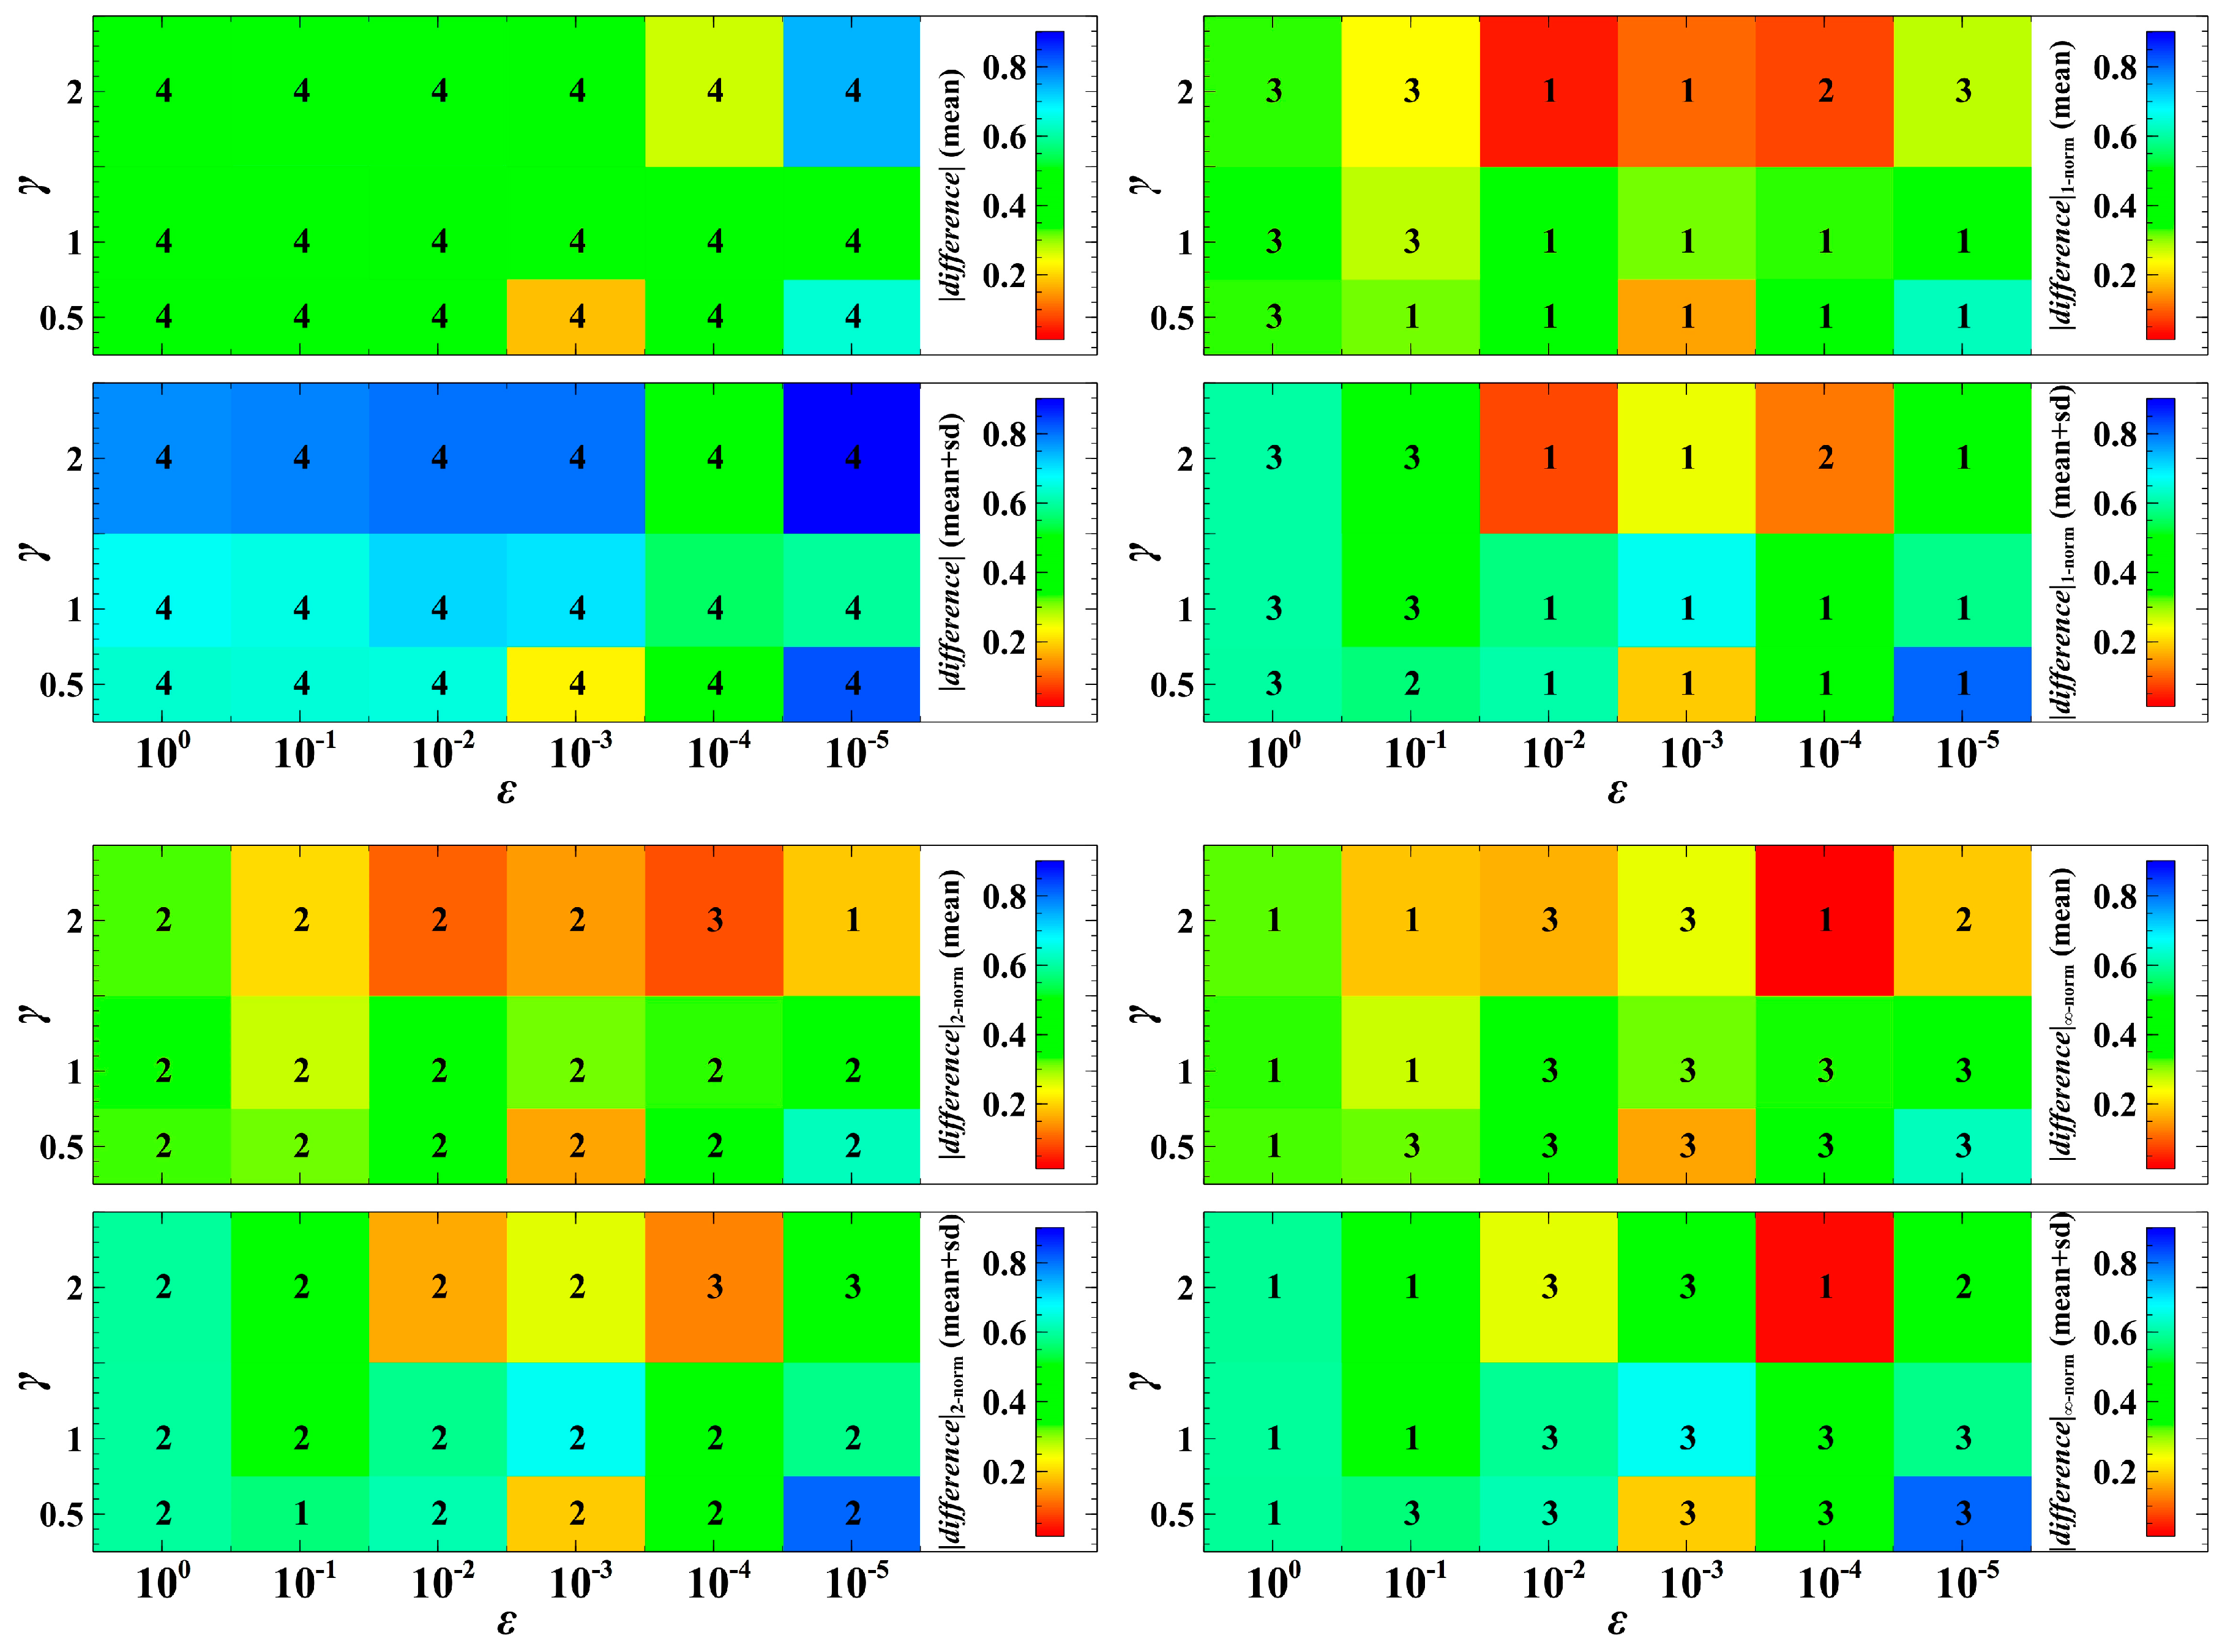
When varying the parameter values of ε and γ , the trait dynamics with non-cooperative optimization is ranked with very low egalitarian sharing of resources (Figure 4). In most cases in Figure 4, the degree of being egalitarian of the population dynamics with the Euclidean norm falls between that with the Manhattan and Chebyshev norms. The dynamics with the Chebyshev norm shows a very high degree of egalitarianism (rank 1 in most cases in Figure 4) when ε = 10 0 to 10 1 . This means that when the speed of adaptation is fast (e.g., the trait evolution significantly affects the current or first generation of offspring), the dynamics with the Chebyshev norm may result in almost equal population densities. In most cases, when ε = 10 2 to 10 5 , the dynamics with the Manhattan norm is the first in rank (Figure 4). That is, when the consequence of evolution is exhibited mostly in the second or later generations, the dynamics with the Manhattan norm results in a higher degree of egalitarianism. However, when γ = 2 , this pattern may not be always the case. A parameter γ > 1 indicates that infection of host leads to a high reproduction rate of parasites.
The trait dynamics using the Manhattan and Euclidean norms have advantages over the Chebyshev norm. Nevertheless, the speed of convergence entails evolutionary trade-off. The trait dynamics with the Manhattan norm requires higher energy cost compared to that with the Euclidean norm. Also, the trait dynamics with the Euclidean norm requires more energy cost than that with the Chebyshev norm. More so in the stochastic case, the distinctive advantages of the three metrics become indistinguishable.
Stochastic Case: Random perturbations, such as uncertain environmental noise, are frequent in biological and social systems [51,52]. The presence of randomness can be disadvantageous in predicting future events when perturbations do not follow the regularity posted by known probability distributions. However, randomness can also pose benefits to populations, and drive diversity in biological and social systems. A dominant species can lose its competitive advantage over its competitor because of environmental noise, resulting in the switching of winners [6,51].
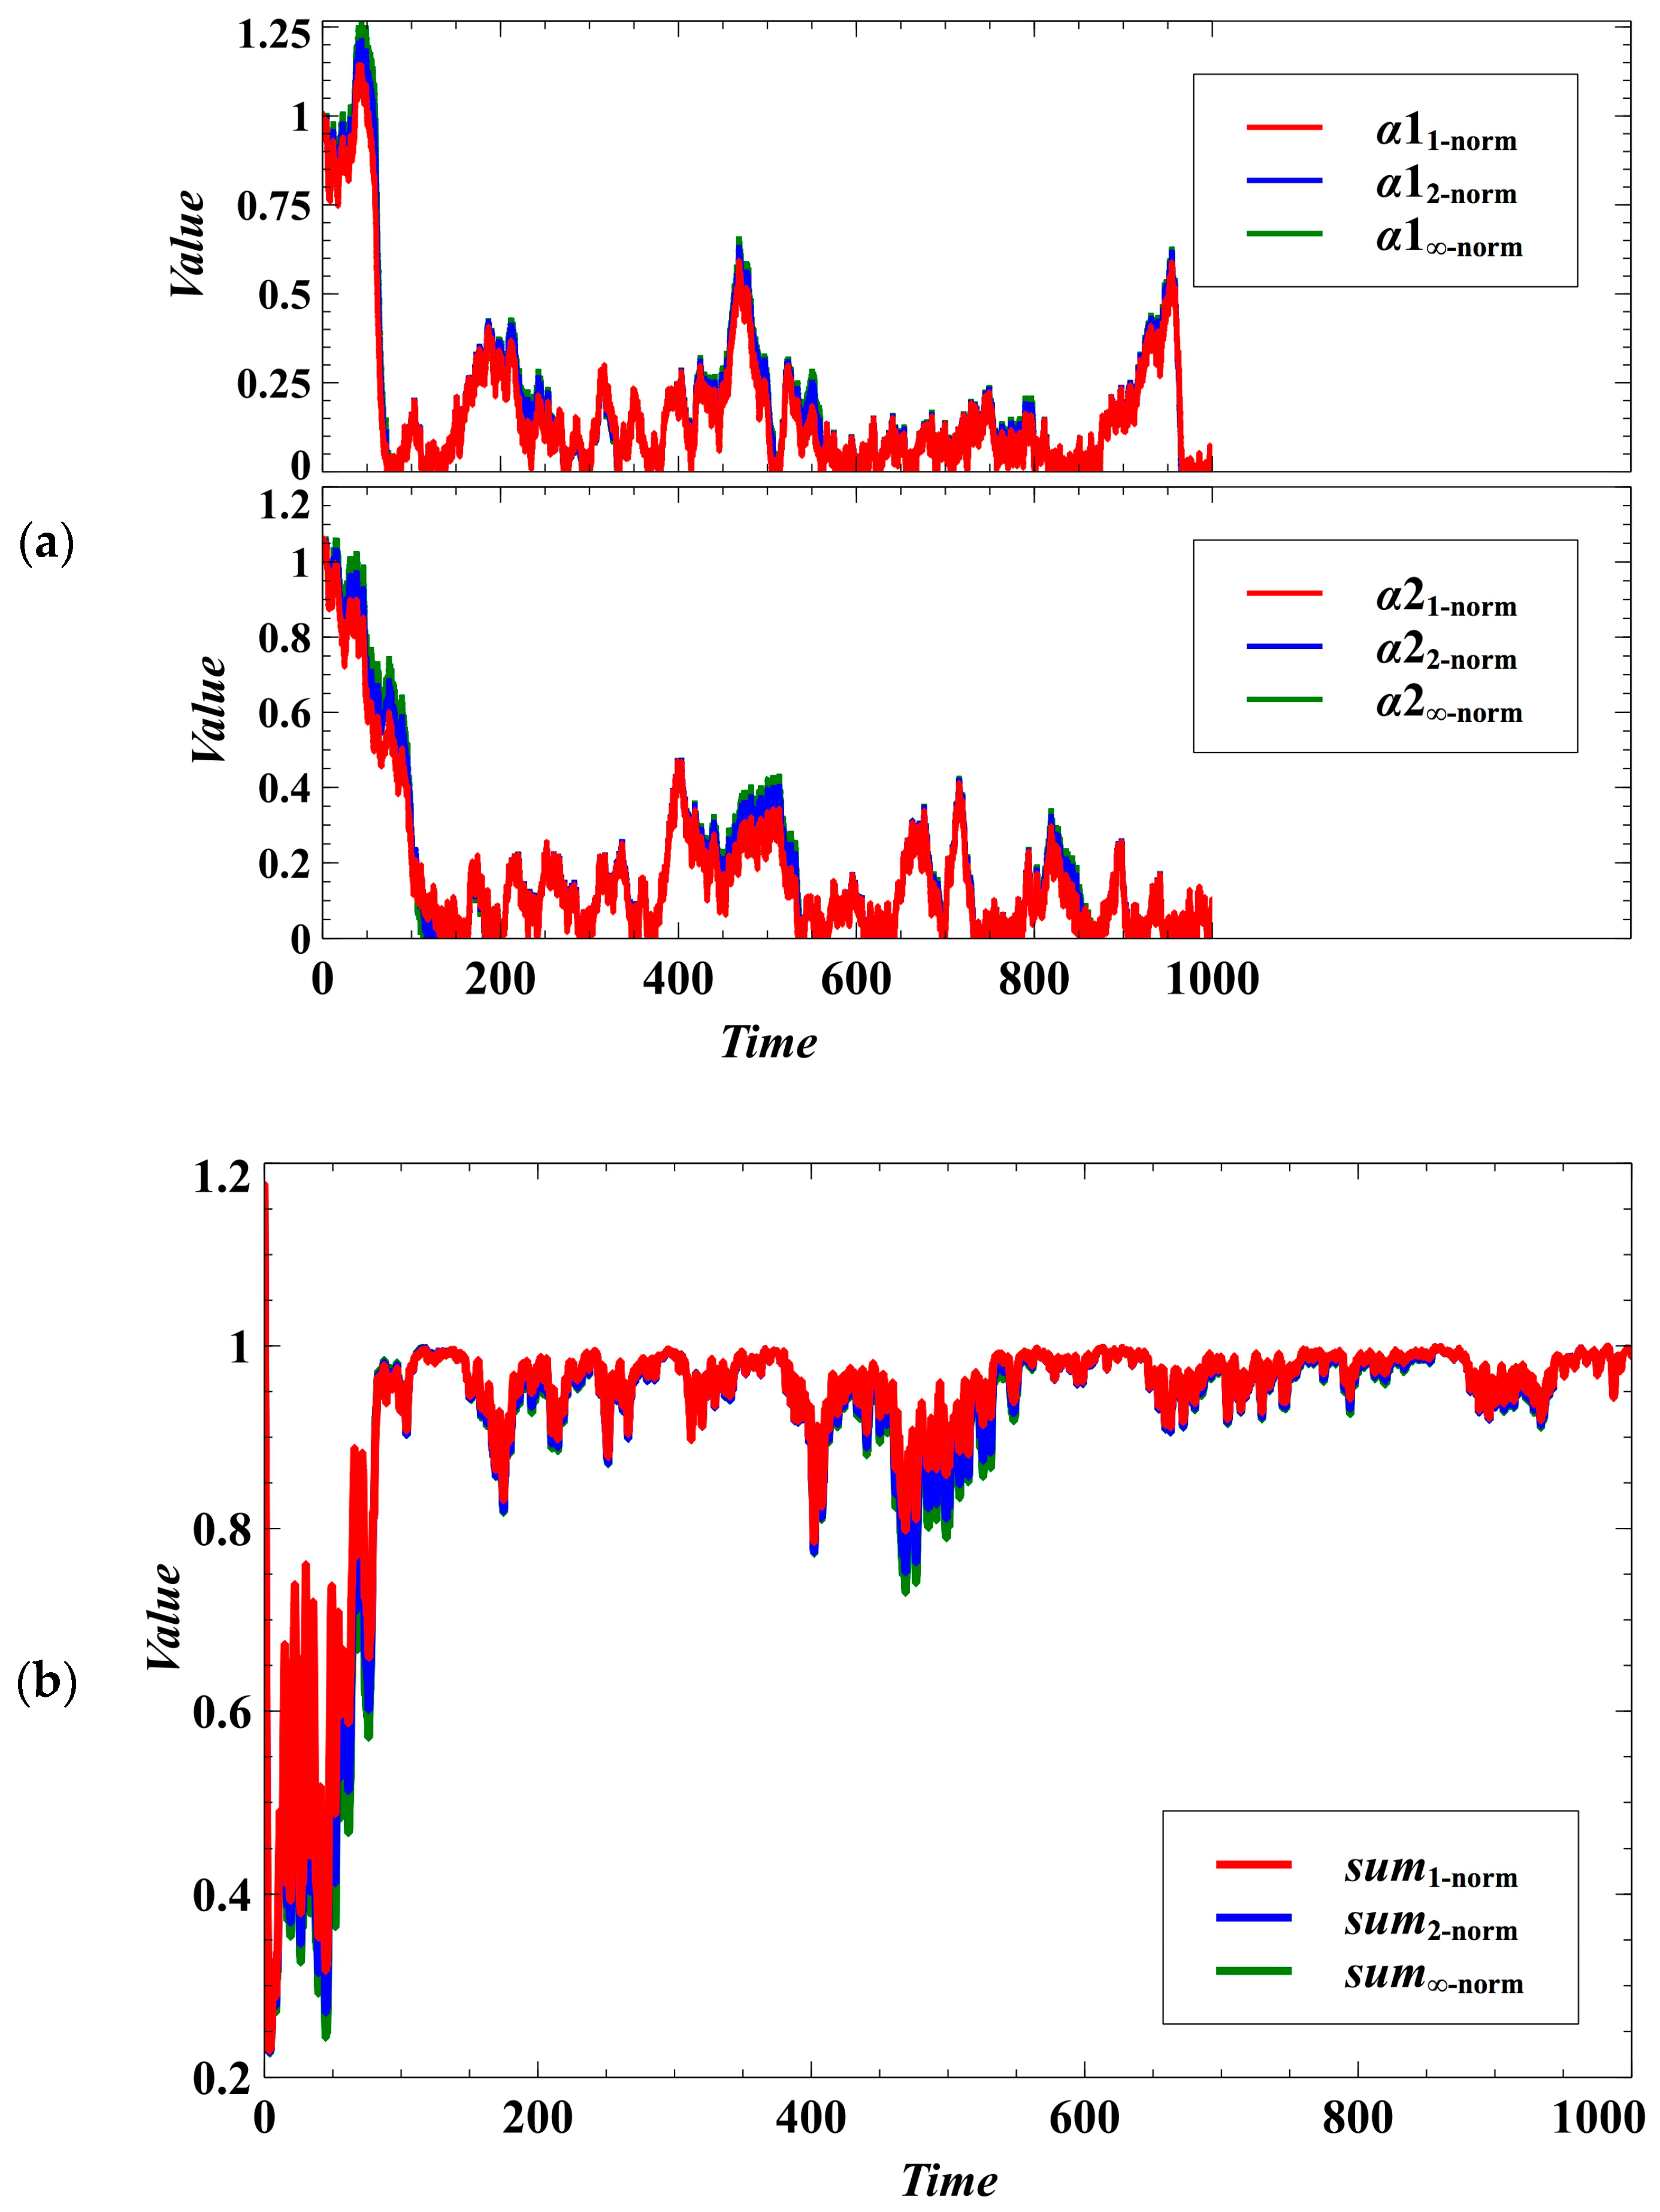
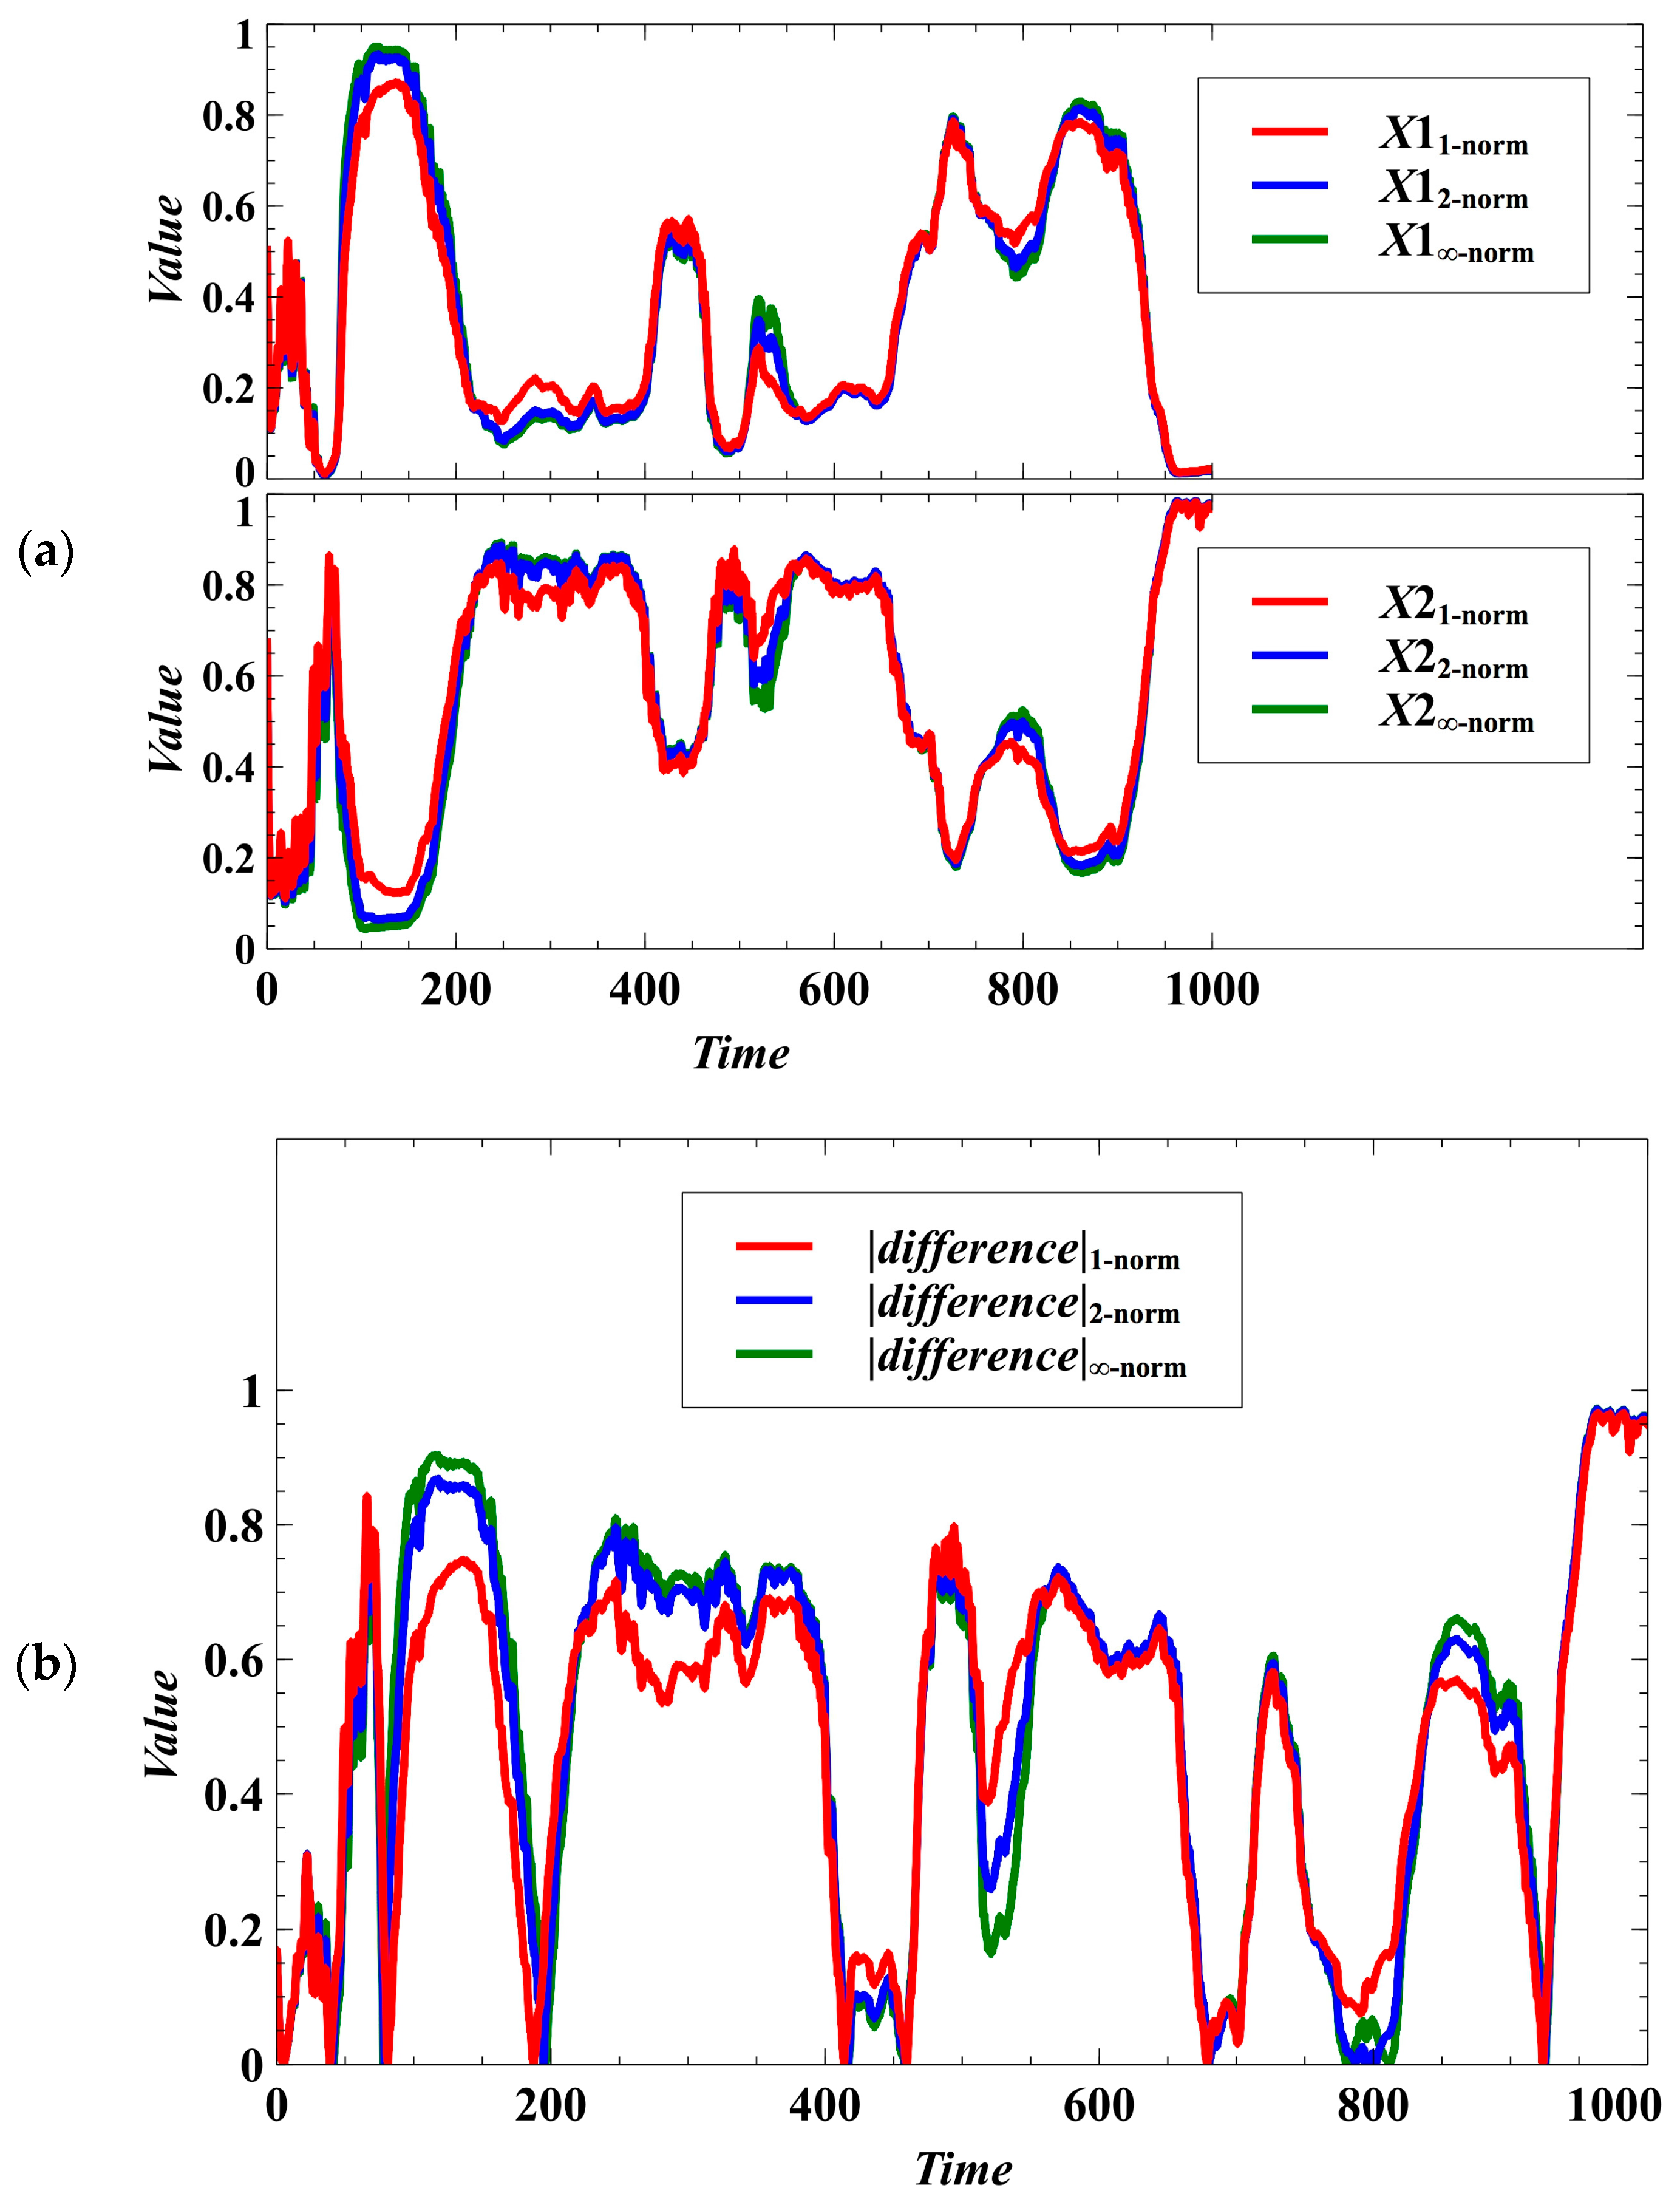
We have introduced a degree of stochastic noise to the population dynamics of parasites (Equation (3)) and to the trait dynamics of the competing species (Equations (4)–(9)). It is observable that the distinctive characteristics of the outcomes under the Manhattan, Euclidean, and Chebyshev norms become indistinguishable (Figure 5a). The patterns of convergence to the desired evolutionary outcomes, which are to drive the parasitism exploitation coefficient α to zero (Figure 5a) and to reach the maximum population density (Figure 5b), become almost similar for the trait dynamics under the three norms.
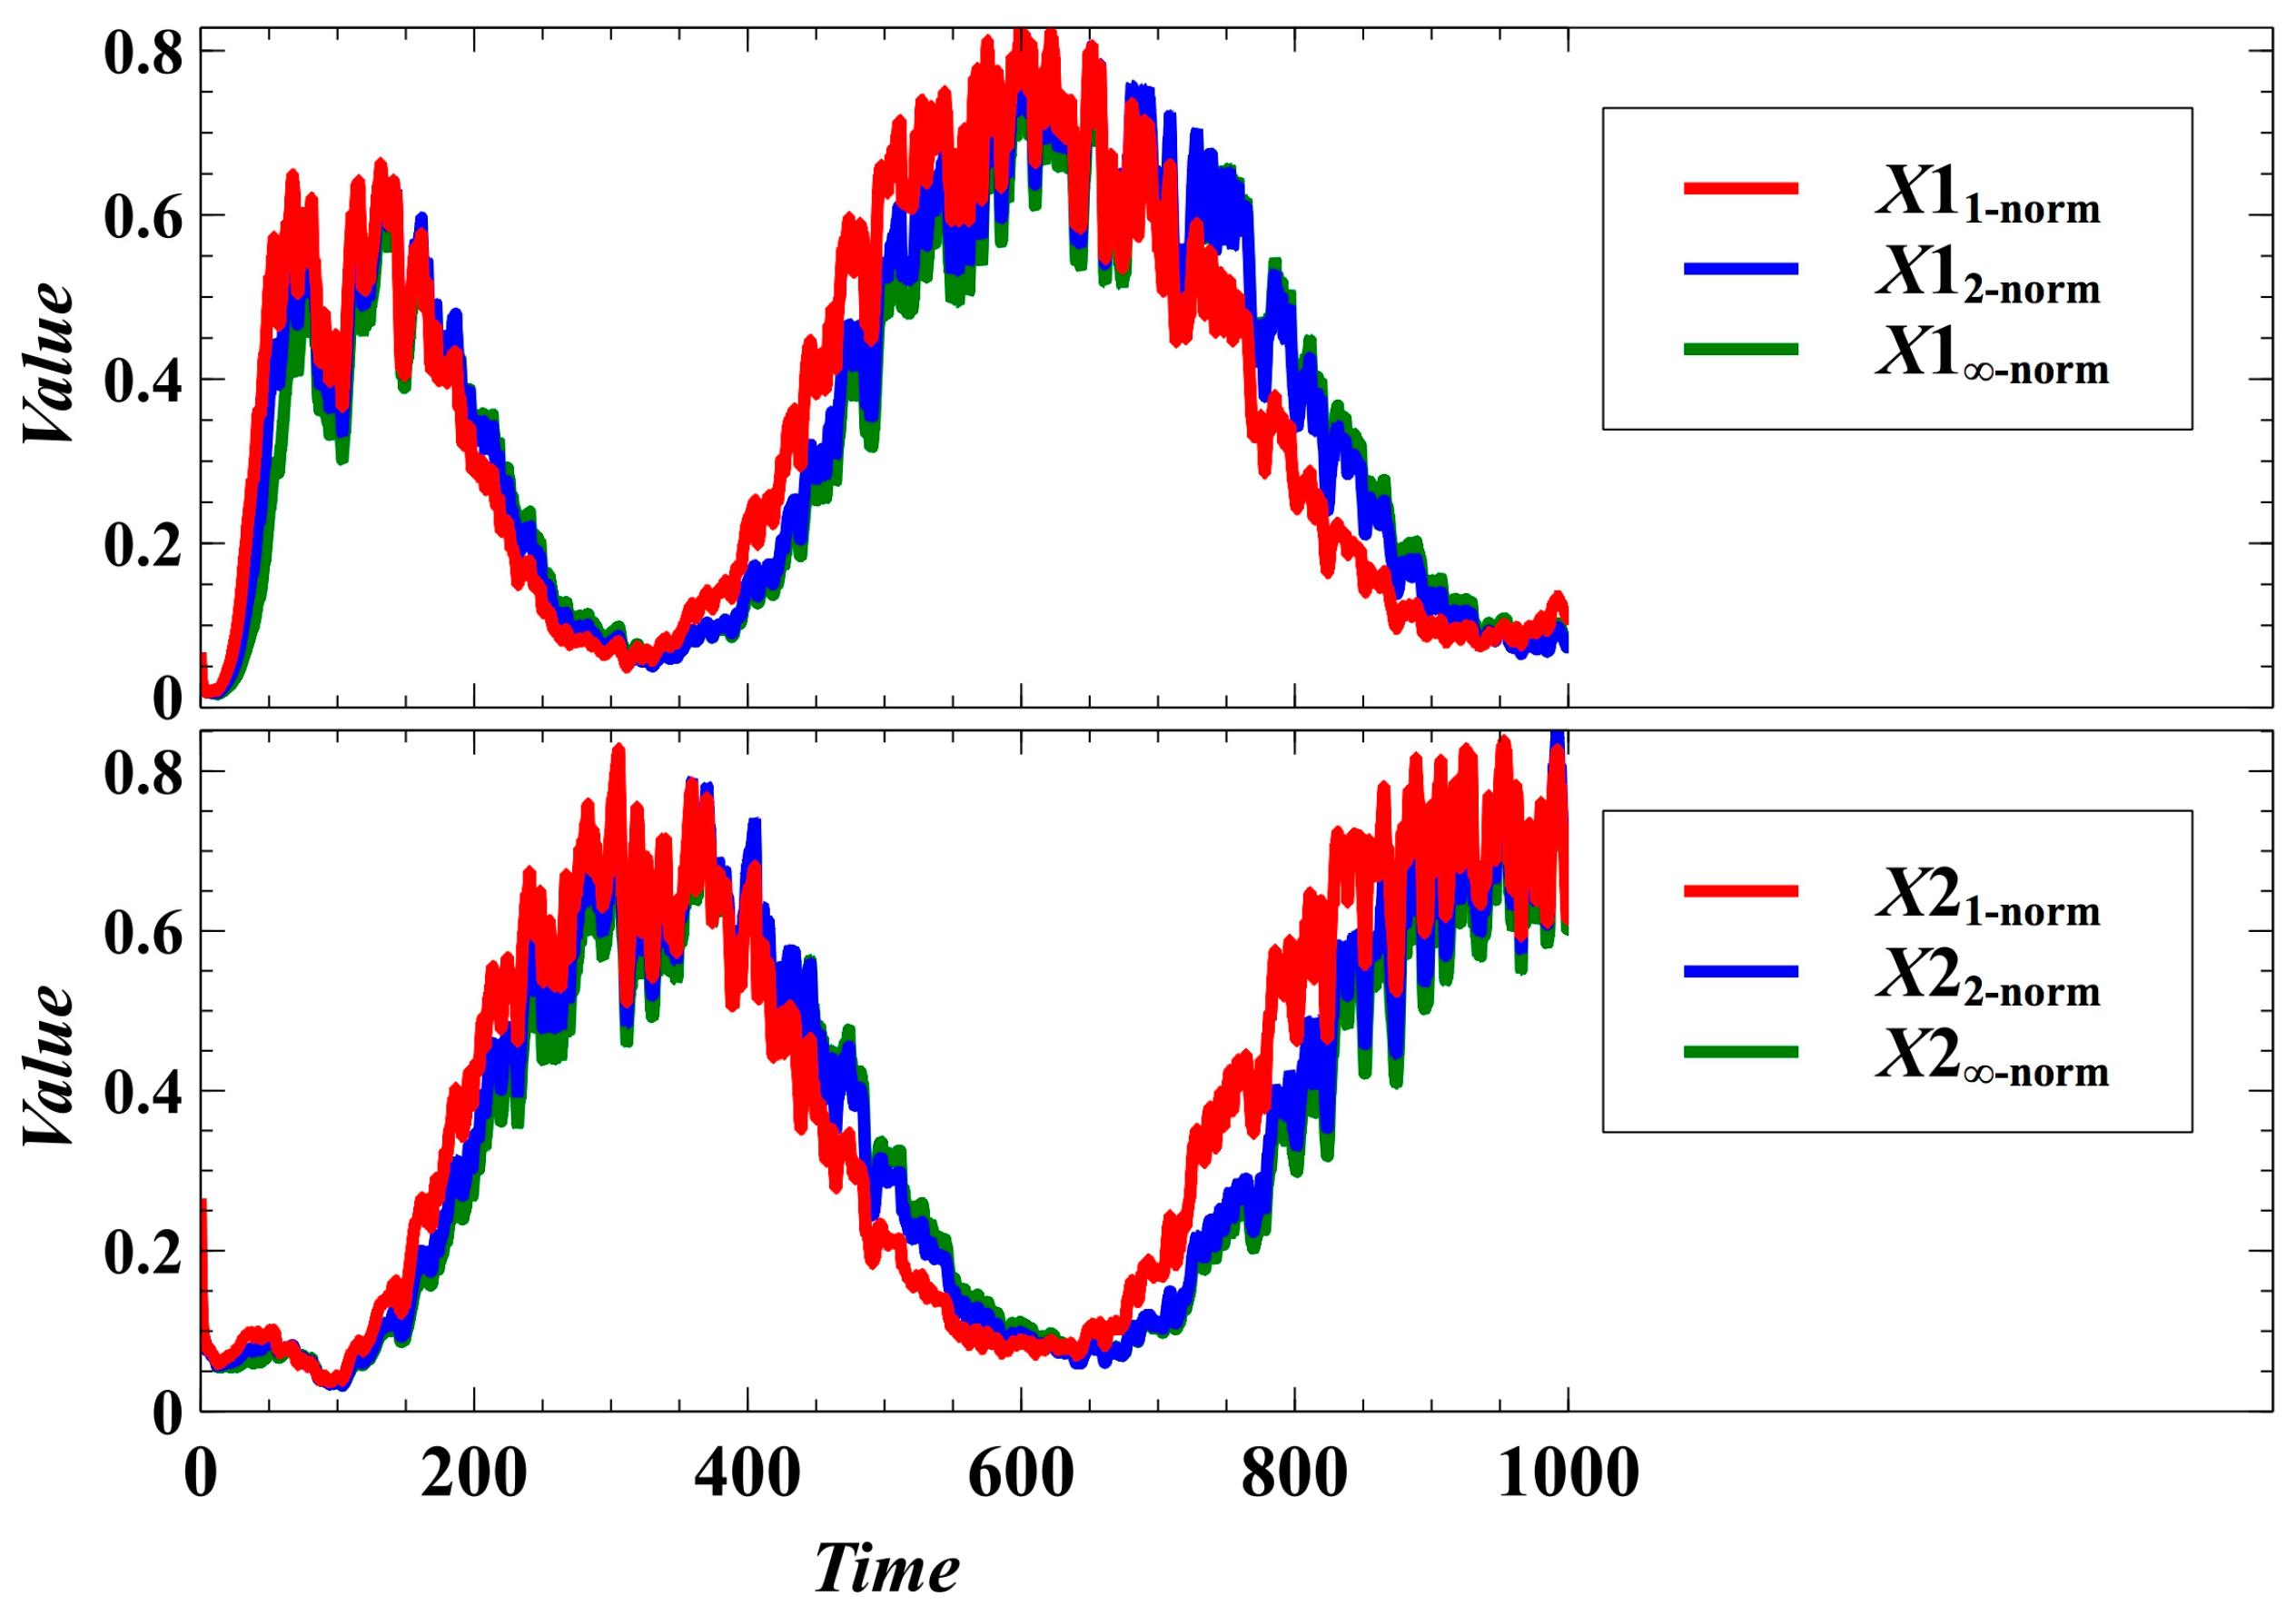
The patterns of egalitarian sharing of resources becomes indistinguishable when randomness is introduced (Figure 6). That is, the stochastic population dynamics with trait dynamics using the Manhattan, Euclidean, and Chebyshev norms are similar in many cases (Figure 6a). We cannot determine what norm could result in an observable higher degree of egalitarianism (Figure 6b). Moreover, randomness can result in negative frequency-dependent selection, as shown by the population fluctuations in Figure 6a. This reveals that randomness can drive the switching of winners (dominant populations). We also simulated a case where r 1 and r 2 are the evolving traits, and the result shows that there are only minute differences in the population densities using the Manhattan, Euclidean, and Chebyshev norms (Figure A1 in Appendix B).

4. Conclusions

In host-parasite or exploited-exploiter interaction, we hypothesized that the distance metric used in obtaining the desired evolutionary outcome (optimal use of environmental resources and without disease) has a significant effect on the trait and population dynamics of a species. To determine the advantages and limitations of the Manhattan, Euclidean, and Chebyshev metrics used in the trait dynamics simulation, we identified the distinctive characteristics of the resulting trait dynamics under deterministic and stochastic cases. Results show that without random noise, the different metrics lead to different dynamics. However, the characteristics are not robust under stochasticity, which means that the choice of measure for adaptation success could be immaterial in a stochastic environment.
Our results provide theoretical cases when evolutionary dynamics using different distance metrics exhibit distinguishable outcomes. These results can guide experimental studies on the behavior of evolution under host-parasite interaction. However, random perturbations could mask the effect of using different evolutionary measures. This has two important implications. First, the use of different metrics entails employing different strategies but, whatever metric is used, the outcomes may be indistinguishable in a stochastic environment. Consequently, a simpler metric can be used rather than using a metric that is too costly to implement in evolutionary dynamics. Second, when data are available, intrinsic and extrinsic noise may lead to difficulty in tracking the evolutionary measure that was utilized during evolutionary events. In investigating evolutionary strategies of populations, it is advisable to clear the data of randomness, for example by compressing the data to reflect only the deterministic trends.
This study is the first to investigate the effect of using different mathematical norms in evolutionary dynamics. Notably, we presented the advantages and disadvantages of the utilization of Manhattan and Chebyshev norms in the evolution of traits, especially with regard to the equal sharing of environmental carrying capacity. The outcome of the Euclidean norm is generally between that of the Manhattan and Chebyshev norms. It is possible that our deterministic and stochastic results are consistent with the situations when there are multi-hosts and multi-parasites. Our simulations can be extended by considering more than two hosts and more than one parasite, with multiple evolving traits, for further studies.

Acknowledgments

J.F.R. is supported by the UP System Enhanced Creative Work and Research Grant (ECWRG 2016-1-009).

Author Contributions

J.F.R. conceived the study and built the model; C.A.H.B. and D.A.S.J.T. ran the simulations and produced the results; A.L.C. summarized the simulation results and created the figures; A.L.B., G.A.C., and J.F.R. analyzed, interpreted and discussed the results; A.L.B., J.F.R., D.A.S.J.T., and M.K.A.G. wrote the paper; all authors reviewed the manuscript.

Conflicts of Interest

The authors declare no conflict of interest. The founding sponsors had no role in the design of the study; in the collection, analyses, or interpretation of data; in the writing of the manuscript, and in the decision to publish the results.

Appendix A. Methods

The deterministic evolutionary trait dynamics using a mathematical norm 1 X is modeled by:
α ( t + h ) = α ( t ) h ( ε 1 X max { X , 10 6 } ) .
The parameter ε is the speed of evolutionary adaptation. The quantitative trait α will increase when 1 X max { X , 10 6 } < 0 . On the other hand, the quantitative trait α will decrease when 1 X max { X , 10 6 } > 0 . The evolutionary effect of 1 X is regulated by the density of the population ( max { X , 10 6 } ), where the number 10 6 is introduced to avoid division by zero during numerical simulations. Here, low population size facilitates trait evolution.
The stochasticity in the model is represented by the following:
n o i s e 1 = σ 1 e P h N ( 0 , 1 )
n o i s e 2 = σ 2 h N ( 0 , 1 )
n o i s e 3 = σ 2 h N ( 0 , 1 )
where σ i is the amplitude of the noise, and N ( 0 , 1 ) is a normally distributed random number. The expression e P characterizes density-dependent noise in a parasite population, where a large parasite population leads to homogeneity. In the numerical simulations, it is assured that all state variables ( X ) and the quantitative trait ( α ) are nonnegative.
In the figures, we used the following values: α 1 ( 0 ) = α 1 ( 0 ) = 1 , h   =   0.01 , σ 1 = 10 0.5 , and σ 2 = 10 2 . A model with small h approximates the trait dynamics simulated using differential equations. Lower values of σ 1 and σ 2 may result in an approximately deterministic case (e.g., σ 1 = 10 1 and σ 2 = 10 3 ). The initial values for the 1000 simulation runs are uniformly distributed random numbers between 0 and 1 per host and parasite population state variables.

Appendix B.

We also simulated a case where r 1 and r 2 are the evolving traits with α 1 = α 2 = 1 . The quantitative trait evolution equations are:
r 1 ( t + h ) = r 1 ( t ) h ( ε 1 X max { X 1 ( t ) , 10 6 } ) + n o i s e 2
r 2 ( t + h ) = r 2 ( t ) h ( ε 1 X max { X 2 ( t ) , 10 6 } ) + n o i s e 3
where 1 X represents the corresponding mathematical norm. Figure A1 shows sample paths of the population dynamics with σ 1 = 10 1 and σ 2 = 0 .
Figure A1. Effect of using different norms in the population dynamics of the host species under the stochastic case, with r 1 and r 2 as the evolving traits.
Processes 05 00074 g0a1

References

  1. Dougherty, E.R.; Carlson, C.J.; Bueno, V.M.; Burgio, K.R.; Cizauskas, C.A.; Clements, C.F.; Seidel, D.P.; Harris, N.C. Paradigms for parasite conservation. Conserv. Biol. 2015, 30, 724–733. [Google Scholar] [CrossRef] [PubMed]
  2. Hatcher, M.J.; Dick, J.T.A.; Dunn, A.M. Diverse effect of parasites in ecosystems: Linking interdependent processes. Front. Ecol. Environ. 2012, 10, 186–194. [Google Scholar] [CrossRef]
  3. Hudson, P.J.; Dobson, A.P.; Lafferty, K.D. Is a healthy ecosystem one that is rich in parasites? Trends Ecol. Evol. 2006, 21, 381–385. [Google Scholar] [CrossRef] [PubMed]
  4. Horwitz, P.; Wilcox, B.A. Parasites, ecosystems and sustainability: An ecological and complex systems perspective. Int. J. Parasitol. 2005, 35, 725–732. [Google Scholar] [CrossRef] [PubMed]
  5. Cortez, M.J.V.; Rabajante, J.F.; Tubay, J.M.; Babierra, A.L. From epigenetic landscape to phenotypic fitness landscape: Evolutionary effect of pathogens on host traits. Infect. Genet. Evol. 2017, 51, 245–254. [Google Scholar] [CrossRef] [PubMed]
  6. Rabajante, J.F.; Tubay, J.M.; Ito, H.; Uehara, T.; Kakishima, S.; Morita, S.; Yoshimura, J.; Ebert, D. Host-parasite red queen dynamics with phase-locked rare genotypes. Sci. Adv. 2016, 2, e1501548. [Google Scholar] [CrossRef] [PubMed]
  7. Rabajante, J.F.; Tubay, J.M.; Uehara, T.; Morita, M.; Ebert, D.; Yoshimura, J. Red queen dynamics in multi-host and multi-parasite interaction system. Sci. Rep. 2015, 5, 10004. [Google Scholar] [CrossRef] [PubMed]
  8. Perc, M.; Gomez-Gardeñes, J.; Szolnoki, A.; Floria, L.M.; Moreno, Y. Evolutionary dynamics of group interactions on structured populations: A review. J. R. Soc. Interface 2013, 10, 20120997. [Google Scholar] [CrossRef] [PubMed]
  9. Perc, M.; Szolnoki, A. Coevolutionary games–A mini review. Biosystems 2010, 99, 109–125. [Google Scholar] [CrossRef] [PubMed]
  10. Maslov, A.; Sneppen, K. Population cycles and species diversity in dynamic Kill-the-Winner model of microbial ecosystems. Sci. Rep. 2017, 7, 39642. [Google Scholar] [CrossRef] [PubMed]
  11. Barraclough, T.G. How do species interactions affect evolutionary dynamics across whole communities? Annu. Rev. Ecol. Evol. Syst. 2015, 46, 25–48. [Google Scholar] [CrossRef]
  12. Raharinirina, N.A.; Brandt, G.; Merico, A. A trait-based model for describing the adaptive dynamics of coral-algae symbiosis. Front. Ecol. Evol. 2017, 5, 31. [Google Scholar] [CrossRef]
  13. Klauschies, T.; Vasseur, D.A.; Gaedke, U. Trait adaptation promotes species coexistence in diverse predator and prey communiteis. Ecol. Evol. 2016, 6, 4141–4159. [Google Scholar] [CrossRef] [PubMed]
  14. Rabajante, J.F.; Babierra, A.L. Branching and oscillations in the epigenetic landscape of cell-fate determination. Prog. Biophys. Mol. Biol. 2015, 117, 240–249. [Google Scholar] [CrossRef] [PubMed]
  15. Mougi, A.; Kondoh, M. Adaptation in a hybrid world with multiple interaction types: A new mechanism for species coexistence. Ecol. Res. 2014, 29, 113–119. [Google Scholar] [CrossRef]
  16. Mougi, A. Coevolution in a one predator-two prey system. PLoS ONE 2010, 5, e13887. [Google Scholar] [CrossRef] [PubMed]
  17. Abrams, P.A.; Matsuda, H.; Harada, Y. Evolutionarily unstable fitness maxima and stable fitness minima of continuous traits. Evol. Ecol. 1993, 7, 465–487. [Google Scholar] [CrossRef]
  18. Mougi, A. Stability of an adaptive hybrid community. Sci. Rep. 2016, 6, 28181. [Google Scholar] [CrossRef] [PubMed]
  19. Papkou, A.; Gokhale, C.S.; Traulsen, A.; Schulenburg, H. Host-parasite coevolution: Why changing population size matters. Zoology 2016, 119, 330–338. [Google Scholar] [CrossRef] [PubMed]
  20. Penczykowski, R.M.; Forde, S.E.; Duffy, M.A. Rapid evolution as a possible constraint on emerging infectious diseases. Freshw. Biol. 2011, 56, 689–704. [Google Scholar] [CrossRef]
  21. Yoshioka, H. A simple game-theoretic model for upstream fish migration. Theory Biosci. 2017, 136, 1–13. [Google Scholar] [CrossRef] [PubMed]
  22. Jost, J.; Pepper, J. Individual optimization efforts and population dynamics: A mathematical model for the evolution of resource allocation strategies, with applications to reproductive and mating systems. Theory Biosci. 2008, 127, 31–43. [Google Scholar] [CrossRef] [PubMed]
  23. Stone, E.A.; Sidow, A. Constructing a meaningful evolutionary average at the phylogenetic center of mass. BMC Bioinform. 2007, 8, 222–235. [Google Scholar] [CrossRef] [PubMed]
  24. Parker, G.A.; Smith, J.M. Optimality theory in evolutionary biology. Nature 1990, 348, 27–33. [Google Scholar] [CrossRef]
  25. Smith, J.M. Optimization theory in evolution. Annu. Rev. Ecol. Syst. 1978, 9, 31–36. [Google Scholar] [CrossRef]
  26. Hengenius, J.B.; Gribskov, A.E.; Rundell, A.E.; Umulis, D.M. Making models match measurements: Model optimization for morphogen patterning networks. Semin. Cell Dev. Biol. 2014, 35, 109–123. [Google Scholar] [CrossRef] [PubMed]
  27. Han, L.; Ma, Z.; Hethcote, H.W. Four predator prey models with infectious diseases. Math. Comput. Model. 2001, 34, 849–858. [Google Scholar] [CrossRef]
  28. Erwin, D.H. The topology of evolutionary novelty and innovation in macroevolution. Philos. Trans. R. Soc. B 2017, 372, 20160422. [Google Scholar] [CrossRef] [PubMed]
  29. Mitteroecker, P.; Huttegger, S.M. The concept of morphospaces in evolutionary and developmental biology: Mathematics and metaphors. Biol. Theory 2009, 4, 54–67. [Google Scholar] [CrossRef]
  30. Myerson, R.B. Utilitarianism, egalitarianism, and the timing effect in social choice problems. Econometrica 1981, 49, 883–897. [Google Scholar] [CrossRef]
  31. Dadlani, A.; Kumar, M.S.; Maddi, M.G.; Kim, K. Mean-field dynamics of inter-switching memes competing over multiplex social networks. IEEE Commun. Lett. 2017, 21, 967–970. [Google Scholar] [CrossRef]
  32. Sahneh, F.D.; Scoglio, C. Competitive epidemic spreading over arbitrary multilayer networks. Phys. Rev. E Stat. Nonlinear Soft Matter Phys. 2014, 89, 062817. [Google Scholar] [CrossRef] [PubMed]
  33. Danchin, E.; Charmantier, A.; Champagne, F.A.; Mesoudi, A.; Pujol, B.; Blanchet, S. Beyond DNA: Integrating inclusive inheritance into an extended theory of evolution. Nat. Rev. Genet. 2011, 12, 475–486. [Google Scholar] [CrossRef] [PubMed]
  34. Das, K. A mathematical study of a predator-prey dynamics with disease in predator. ISRN Appl. Math. 2011, 2011, 1–16. [Google Scholar] [CrossRef]
  35. Han, J.; Kamber, M.; Pei, J. Data Mining: Concepts and Techniques; Morgan Kaufmann Publishers: Burlington, MA, USA, 2012. [Google Scholar]
  36. Hudson, P.; Greenman, J. Competition mediated by parasites: Biological and theoretical progress. Trends Ecol. Evol. 1998, 13, 387–390. [Google Scholar] [CrossRef]
  37. Bowers, R.G.; Turner, J. Community structure and the interplay between interspecific infection and competition. J. Theor. Biol. 1997, 187, 95–109. [Google Scholar] [CrossRef] [PubMed]
  38. Yan, G. Parasite-mediated competition: A model of directly transmitted macroparasites. Am. Nat. 1996, 148, 1089–1112. [Google Scholar] [CrossRef]
  39. Price, P.W.; Westoby, M.; Rice, B. Parasite-mediated competition: Some predictions and tests. Am. Nat. 1988, 131, 544–555. [Google Scholar] [CrossRef]
  40. Schmid-Hempel, P. Evolutionary Parasitology: The Integrated Study of Infections, Immunology, Ecology, and Genetics; Oxford University Press: Hong Kong, China, 2011. [Google Scholar]
  41. Poulin, R. Evolutionary Ecology of Parasites, 2nd ed.; Princeton University Press: Princeton, NJ, USA, 2006. [Google Scholar]
  42. Ridley, M. Evolution, 3rd ed.; Blackwell Publishing: Hoboken, NJ, USA, 2004. [Google Scholar]
  43. Hendry, A.P.; Kinnison, M.T. (Eds.) Microevolution: Rate, Pattern, Process; Kluwer Academic Publisher: Dordrecht, The Netherlands, 2001. [Google Scholar]
  44. Oksanen, L. Evolution of exploitation ecosystems I. Predation, foraging ecology and population dynamics in herbivores. Evol. Ecol. 1992, 6, 15–33. [Google Scholar] [CrossRef]
  45. Weitz, J.S.; Eksin, C.; Paarporn, K.; Brown, S.P.; Ratcliff, W.C. An oscillating tragedy of the commons in replicator dynamics with game-environment feedback. Proc. Natl. Acad. Sci. USA 2016, 113, e7518–e7525. [Google Scholar] [CrossRef] [PubMed]
  46. Platt, T.G.; Bever, J.D. Kin competition and the evolution of cooperation. Trends Ecol. Evol. 2009, 24, 370–377. [Google Scholar] [CrossRef] [PubMed]
  47. Jover, L.F.; Cortez, M.H.; Weitz, J.S. Mechanism of multi-strain coexistence in host-phase systems with nested infection networks. J. Theor. Biol. 2013, 332, 65–77. [Google Scholar] [CrossRef] [PubMed]
  48. Lafferty, K.D.; Allesina, S.; Arim, M.; Briggs, C.J.; De Leo, G.; Dobson, A.P.; Dunne, J.A.; Johnson, P.T.; Kuris, A.M.; Marcogliese, D.J.; et al. Parasites in food webs: The ultimate missing links. Ecol. Lett. 2008, 11, 533–546. [Google Scholar] [CrossRef] [PubMed]
  49. Hochberg, M.E.; Holt, R.D. The coexistence of competing parasites. I. The role of cross-species infection. Am. Nat. 1990, 136, 517–541. [Google Scholar] [CrossRef]
  50. Anderson, R.M.; May, R.M. Regulation and stability of host-parasite population intersections: I. Regulatory processes. J. Anim. Ecol. 1978, 47, 219–247. [Google Scholar] [CrossRef]
  51. Brunner, F.; Eizaguirre, C. Can environmental change affect host/parasite-mediated speciation? Zoology 2016, 119, 384–394. [Google Scholar] [CrossRef] [PubMed]
  52. Nakajima, T. Probability in biology: Overview of a comprehensive theory of probability in living systems. Prog. Biophys. Mol. Biol. 2013, 113, 67–79. [Google Scholar] [CrossRef] [PubMed]
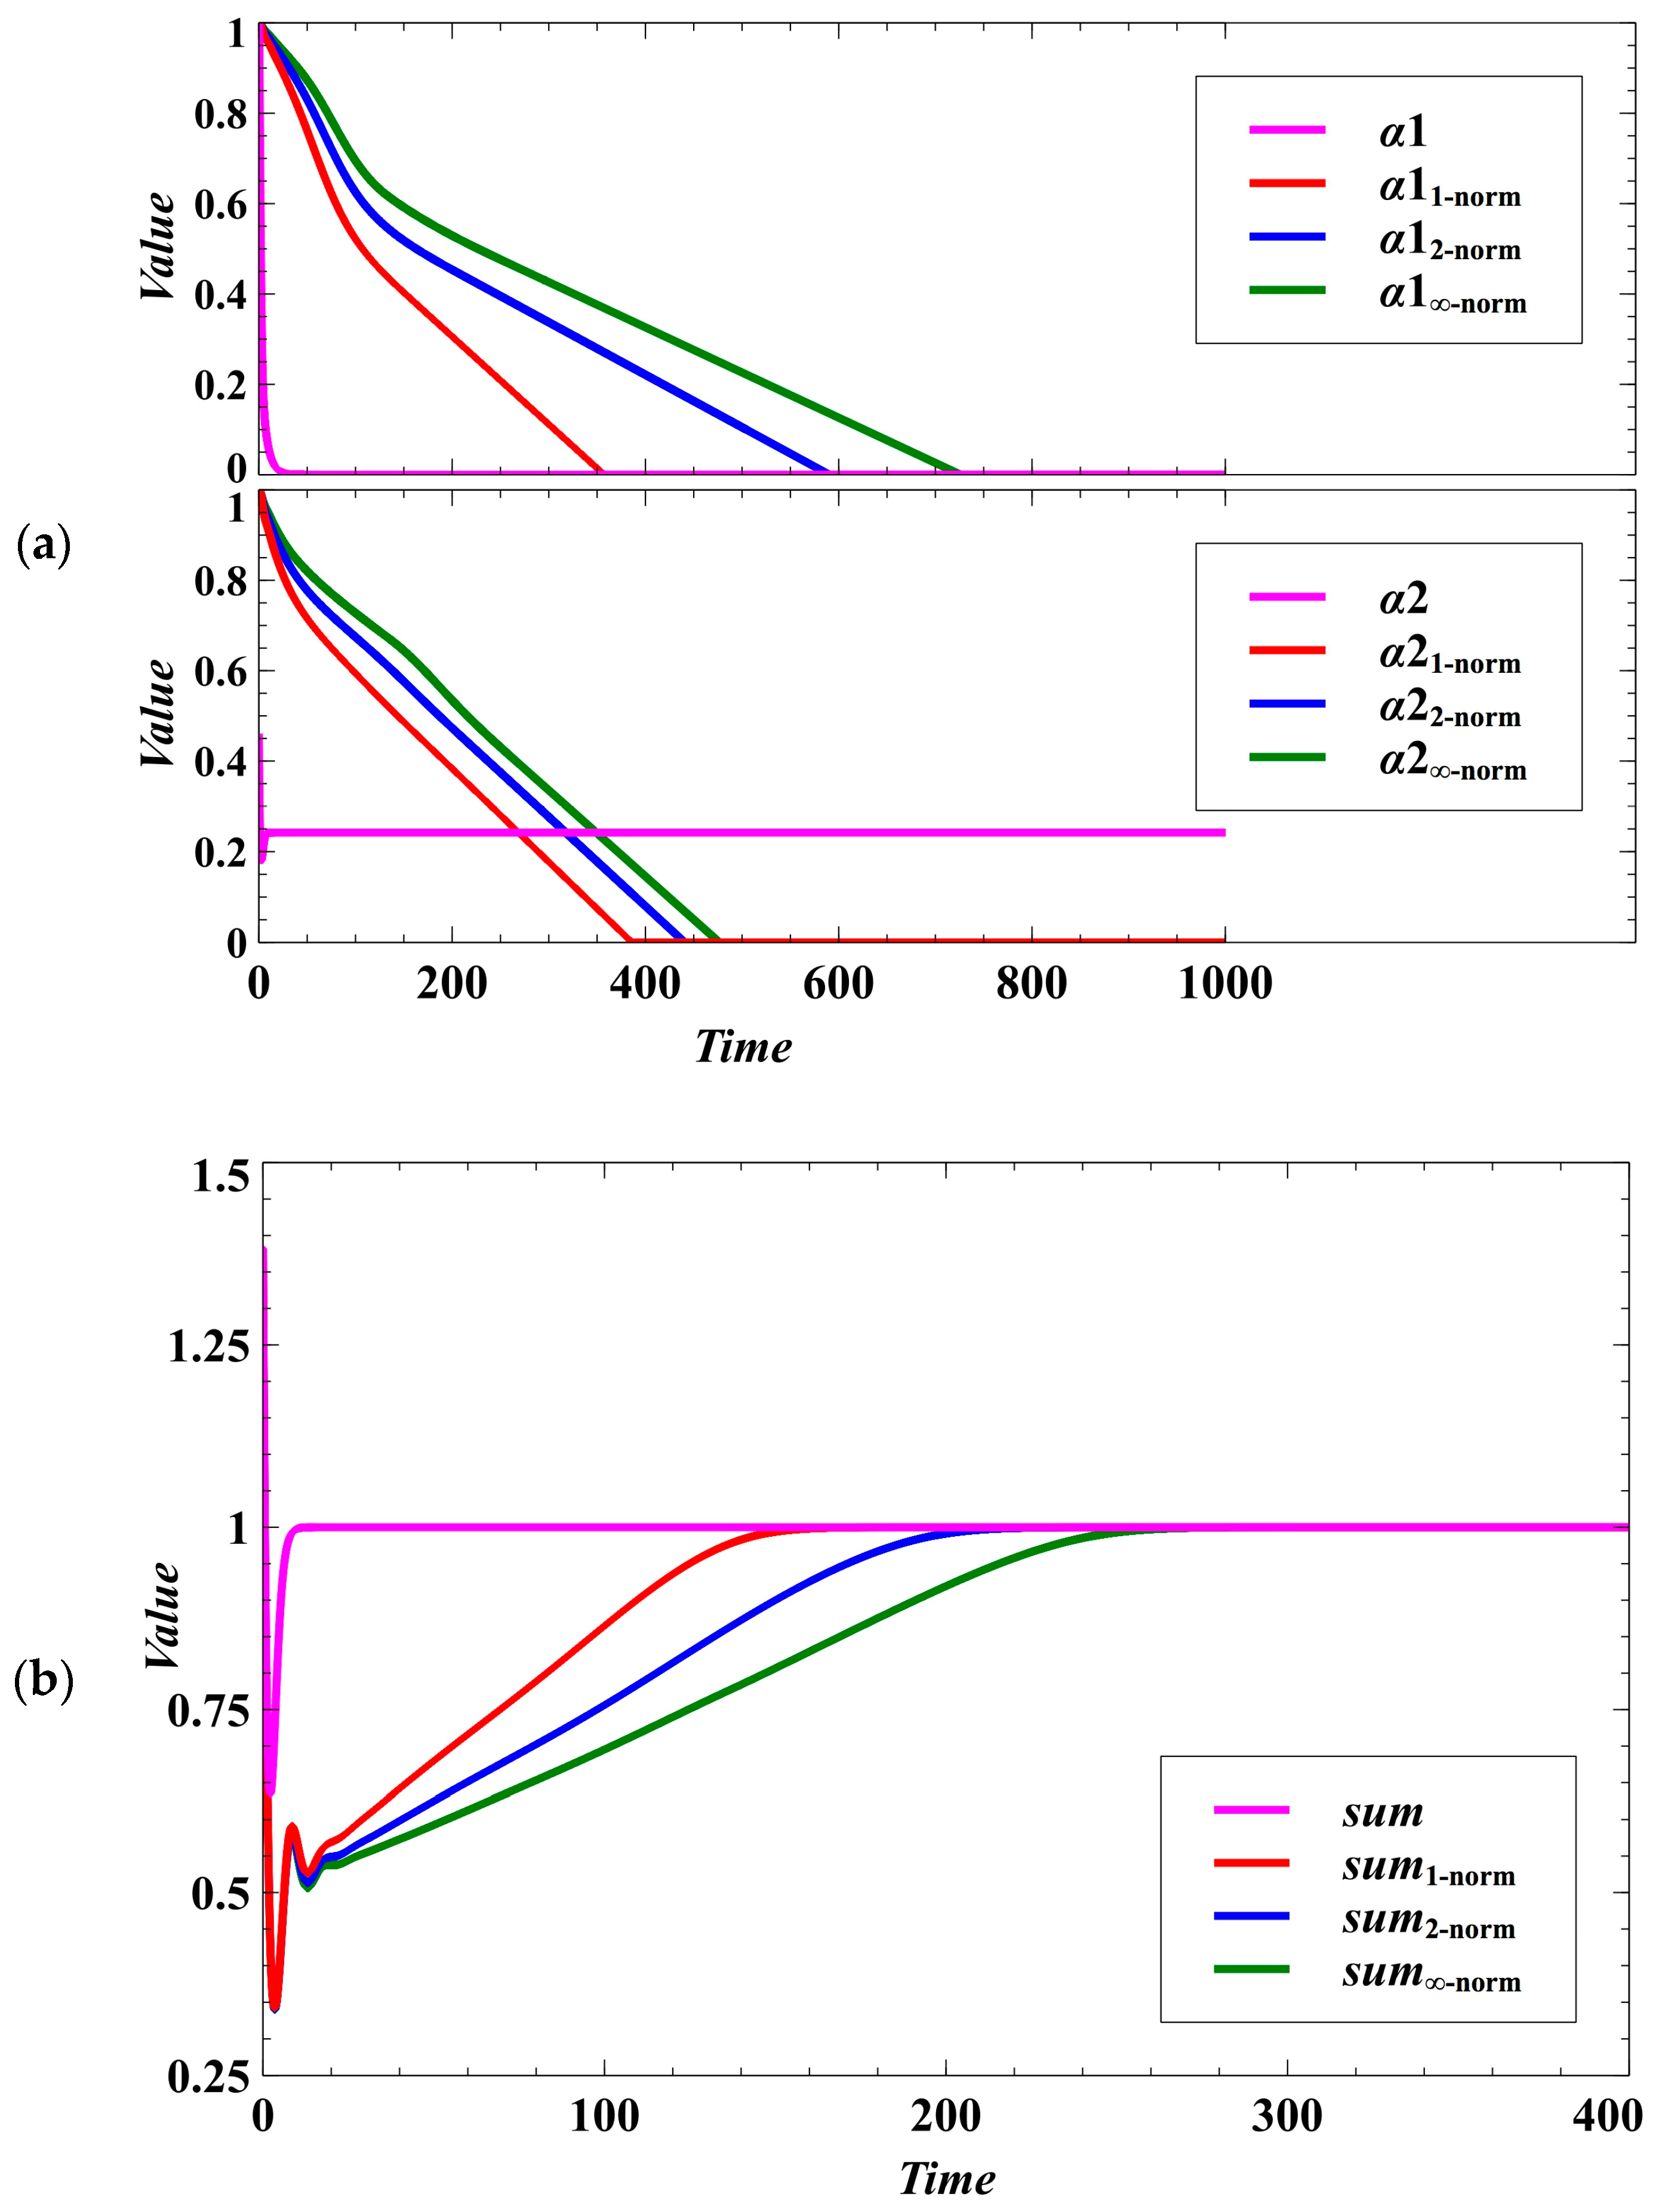
Figure 1. Effect of using different norms in the evolutionary objective under the deterministic case. (a) Effect on lowering the parasitism exploitation coefficient. The parameters α 1 , α 1 1 norm , α 1 2 norm and α 1 norm ( α 2 , α 2 1 norm , α 2 2 norm and α 2 norm ) are the parasitism exploitation coefficients for species 1 (species 2) using non-cooperative optimization, Manhattan, Euclidean, and Chebyshev norms, respectively. The figure shows which method converges faster to the desired value α = 0 (no disease). (b) In the figure, s u m = X 1 + X 2 (for non-cooperative optimization), s u m 1 norm = X 1 1 norm + X 2 1 norm , s u m 2 norm = X 1 2 norm + X 2 2 norm , and s u m norm = X 1 norm + X 2 norm . The desired goal is to maximize the utilization of the resources (sum equals 1). The variables X 1 , X 1 1 norm , X 1 2 norm , and X 1 norm ( X 2 , X 2 1 norm , X 2 2 norm , and X 2 norm ) are the population densities for species 1 (species 2) using non-cooperative optimization, Manhattan, Euclidean, and Chebyshev norms, respectively.
Processes 05 00074 g001
Figure 2. Convergence time to the evolutionary objective under the deterministic case. In this figure, ‘stop’ means time of convergence towards the evolutionary objective for non-cooperative optimization, and ‘stop’ with the index means time of convergence towards the evolutionary objective using the corresponding mathematical norm. The larger the ε , the larger the effect of the distance metric to the trait dynamics in one generation. Here, we consider γ = 0.5 , which means β i is half of α i , γ = 1 , which means β i equals α i , and γ = 2 , which means β i is double α i . The numerals 1 to 4 represent the ranking of convergence, where 1 denotes the fastest convergence while 4 denotes the slowest convergence. We took the mean and the mean plus standard deviation (sd) of 1000 numerical simulations with random population initial conditions.
Processes 05 00074 g002
Figure 3. Effect of using different norms in the population dynamics of the host species under the deterministic case. (a) Effect on the population densities. (b) In the figure, | d i f f e r e n c e | = | X 1 X 2 | , | d i f f e r e n c e | 1 norm = | X 1 1 norm X 2 1 norm | , | d i f f e r e n c e | 2 norm = | X 1 2 norm X 2 2 norm | , and | d i f f e r e n c e | norm = | X 1 norm X 2 norm | . Here, we can see what method provides opportunity for the competing species to maximize each of their population densities while maintaining equal sharing of the available resources. If the difference is near zero, it means that the competition system is egalitarian.
Processes 05 00074 g003
Figure 4. Absolute difference between the population densities of host species 1 and 2. If the difference is near zero, it means that the competition system is egalitarian. The numerals 1 to 4 represent the ranking of the degree of egalitarianism, where 1 denotes the most egalitarian while 4 denotes the least egalitarian. We took the mean and the mean plus standard deviation (sd) of 1000 numerical simulations with random population initial conditions.
Processes 05 00074 g004
Figure 5. Effect of using different norms in the evolutionary objective under the stochastic case. The distinctive characteristics of the outcomes under the Manhattan, Euclidean, and Chebyshev norms become homogeneous. (a) Effect on lowering the parasitism exploitation coefficient. (b) The sums represent the carrying capacity of the environment where species 1 and 2 compete for the available resources. The desired goal is to maximize the utilization of the resources (sum equals 1).
Processes 05 00074 g005
Figure 6. Effect of using different norms in the population dynamics of the host species under the stochastic case. Oscillations arise due to stochasticity, and the temporal patterns of egalitarian sharing of resources becomes indistinguishable. (a) Effect on the population densities. (b) If the difference is near zero, it means that the competition system is egalitarian.
Processes 05 00074 g006