A Validated Model for Design and Evaluation of Control Architectures for a Continuous Tablet Compaction Process

Engineering Research Center for Structured Organic Particulate Systems (ERC-SOPS), Department of Chemical and Biochemical Engineering, Rutgers, The State University of New Jersey, Piscataway, NJ 08854, USA
*
Author to whom correspondence should be addressed.
Processes 2017, 5(4), 76; https://doi.org/10.3390/pr5040076
Submission received: 2 October 2017
/
Revised: 27 November 2017
/
Accepted: 28 November 2017
/
Published: 1 December 2017
(This article belongs to the Special Issue Combined Scheduling and Control)
Abstract
:The systematic design of an advanced and efficient control strategy for controlling critical quality attributes of the tablet compaction operation is necessary to increase the robustness of a continuous pharmaceutical manufacturing process and for real time release. A process model plays a very important role to design, evaluate and tune the control system. However, much less attention has been made to develop a validated control relevant model for tablet compaction process that can be systematically applied for design, evaluation, tuning and thereby implementation of the control system. In this work, a dynamic tablet compaction model capable of predicting linear and nonlinear process responses has been successfully developed and validated. The nonlinear model is based on a series of transfer functions and static polynomial models. The model has been applied for control system design, tuning and evaluation and thereby facilitate the control system implementation into the pilot-plant with less time and resources. The best performing control algorithm was used in the implementation and evaluation of different strategies for control of tablet weight and breaking force. A characterization of the evaluated control strategies has been presented and can serve as a guideline for the selection of the adequate control strategy for a given tablet compaction setup. A strategy based on a multiple input multiple output (MIMO) model predictive controller (MPC), developed using the simulation environment, has been implemented in a tablet press unit, verifying the relevance of the simulation tool.
1. Introduction
Due to the enablement of more reliable and faster drug production; the pharmaceutical industry in recent times is showing great interest in continuous manufacturing (CM) technology. There are many advantages of adapting such a technology over batch manufacturing. The increased speed of production can help manufacturers respond in a faster manner to changes in demand. Integrating quality by design (QbD), quality by control (QbC), real time release (RTR) and efficient process analytical technology (PAT) can serve to cut down manufacturing costs and improve drug quality and thereby patient safety. This integration of concepts to enable the transition from batch to continuous manufacturing requires intensive research in terms of understanding processes from a mechanistic perspective rather than a black box approach.
Quality by design, as introduced by the ICH Q8 guidance on pharmaceutical development, has required that companies demonstrate an understanding of how various elements in the process affect the product quality [1,2]. This would entail being able to correlate critical process parameters to critical quality attributes within each unit operation. The development of such an understanding can help formulate control strategies that can efficiently either constrain variables within their design space or track their set points. The development of control strategies experimentally can be taxing on material, time and is subject to equipment related and operating constraints. The dependency on these factors lays the grounds for a need to create a virtual environment on which experiments can be simulated. Not only would this speed up the process development but also improve the operational efficiency through a model derived better process understanding.
There have been multiple works in the past that model the integrated pharmaceutical manufacturing plant. The work by Mesbah et al. involves simulating chemical synthesis, purification, formulation and tableting from start to finish in a continuous mode [3]. Work done by Sen et al. focuses on the influence of upstream API properties on downstream quality metrics [4]. Boukouvala et al. focuses on identifying the challenges in flowsheet model development and simulation for solid-based pharmaceutical processes [5]. Though these works incorporate dynamics of the unit operation, important interactions between process variables is lacking. This work will focus on capturing these interactions within the tablet compaction unit operation, which can in turn be integrated into a larger flow sheet model. The systematic modelling framework described in this manuscript will help guide future modelling efforts for pharmaceutical process controls.
Another motivation for this work lies in the fact that, during manufacturing, tablet compaction is subject to disturbances in density and concentration. This in turn can lead to product that is of low quality. Developing a control system that can effectively control the critical quality attributes (CQAs) within the tablet process is an essential requirement to fully establishing a robust continuous manufacturing process. Previous studies contribute significantly through experimental and simulated work, with respect to understanding compaction in terms of material properties and formulations [6,7,8]. Significant work has been done to create an understanding of the interaction between process parameters [9]. Previous studies also involved the modelling aspects of the tablet press [7,10,11,12,13]. The work developed so far has either been purely empirical or mechanistic FEA (Finite Element Analysis) or DEM (Discrete Element Modelling) based simulation. Although contributing greatly in developing an understanding of compaction, none of these works were oriented towards developing a control system.
The optimization based control scheme, that is, model predictive control (MPC) is inherently capable of dealing with multi input multi output (MIMO) interactive and dead time dominant systems. It also allows the inclusion of process related constraints in its design. These advantages have been manifested in its wide spread usage [14,15,16]. In recent years, multiple variations of the same have been developed [17,18,19,20]. There have been developments in MPC schemes that include model uncertainty to improve its robustness [18]. Another approach to deal with model uncertainty is explored through an MPC design called a scenario based MPC [21]. There is also a significant amount of literature and development in nonlinear model predictive control [22]. Depending on the situation these strategies maybe used to improve the efficiency of the control system. MPC has been very successful in chemical industries. However, much less attention has been paid to develop and implement the MPC in pharmaceutical tablet manufacturing process.
In terms of the work based in the domain of process control, there have been some contributions to expansion of the knowledge base in the pharmaceutical industry. However, these works were separated into two independent segments i.e., simulation and experimental. The simulation work is based on theoretically derived equations [23,24,25]. Model predictive control has been implemented in a number of simulation studies [23,24,26]. Experimental work has been conducted for feeder and blender unit operations [27]. There has been some work done in the development of PAT (Process Analytical Technology) for the utilization in control strategies [28]. Based on this, work hybrid control strategies have been developed for continuous pharmaceutical manufacturing [28,29,30,31]. There has also been experimental work done using a commercial model predictive control platform for the continuous direct compaction process [32]. Despite the breadth of the control work in the pharmaceutical space, there is still a disconnect between the simulation and experimental environments. With the best of authors knowledge, no effort has been made to integrate the simulation studies on pharmaceutical process control involving solid dosages forms with experimental implementation works. Therefore, the commercialization of the concepts developed through simulation is still a challenging task.
In this work, a transfer function based model of the tablet compaction process has been developed to enable the design and evaluation of control systems. The non-linear process behavior and the dependency of process delays on process operating parameters have been considered. The model was validated against experimental data and it was demonstrated that the selected modelling strategy, which is based on compression ratios, is capable of representing the nonlinear behavior of the compaction forces. The applications of the model for control system design, tuning and evaluation has been demonstrated. The performance of three control algorithms was evaluated to determine the control algorithm to be used in the evaluation of different control strategies. Selected control strategies were chosen based on process understanding of the compaction process–critical process parameter interaction with critical quality attributes; and were implemented on this model. The set point tracking and disturbance rejection capabilities were tested, and the results are contextualized in terms of their usage. The developed model is postulated to be applicable to a wide range of situations, but this paper focuses on its application to design a control system before implementation into a real manufacturing set up. The screened control strategies are then implemented into the pilot-pant for experimental verification. A comparison of the experimental and simulated results is also summarized. Results show that the model was successfully derived and can be an asset in the development and evaluation of new control systems, by reducing the time and cost involved in this process.
In next section, the continuous pharmaceutical tablet manufacturing process has been described. Materials and methods used in this study has been summarized in Section 3. The tablet compaction process model has been developed and validated in Section 4. Applications of the model for control system design and evaluation has been described in Section 5 while the controllers have been developed and tuned in Section 6. The results have been presented in Section 7. Finally, the manuscript has been concluded in Section 8.
2. Continuous Pharmaceutical Tablet Manufacturing Process
2.1. Pilot-Plant
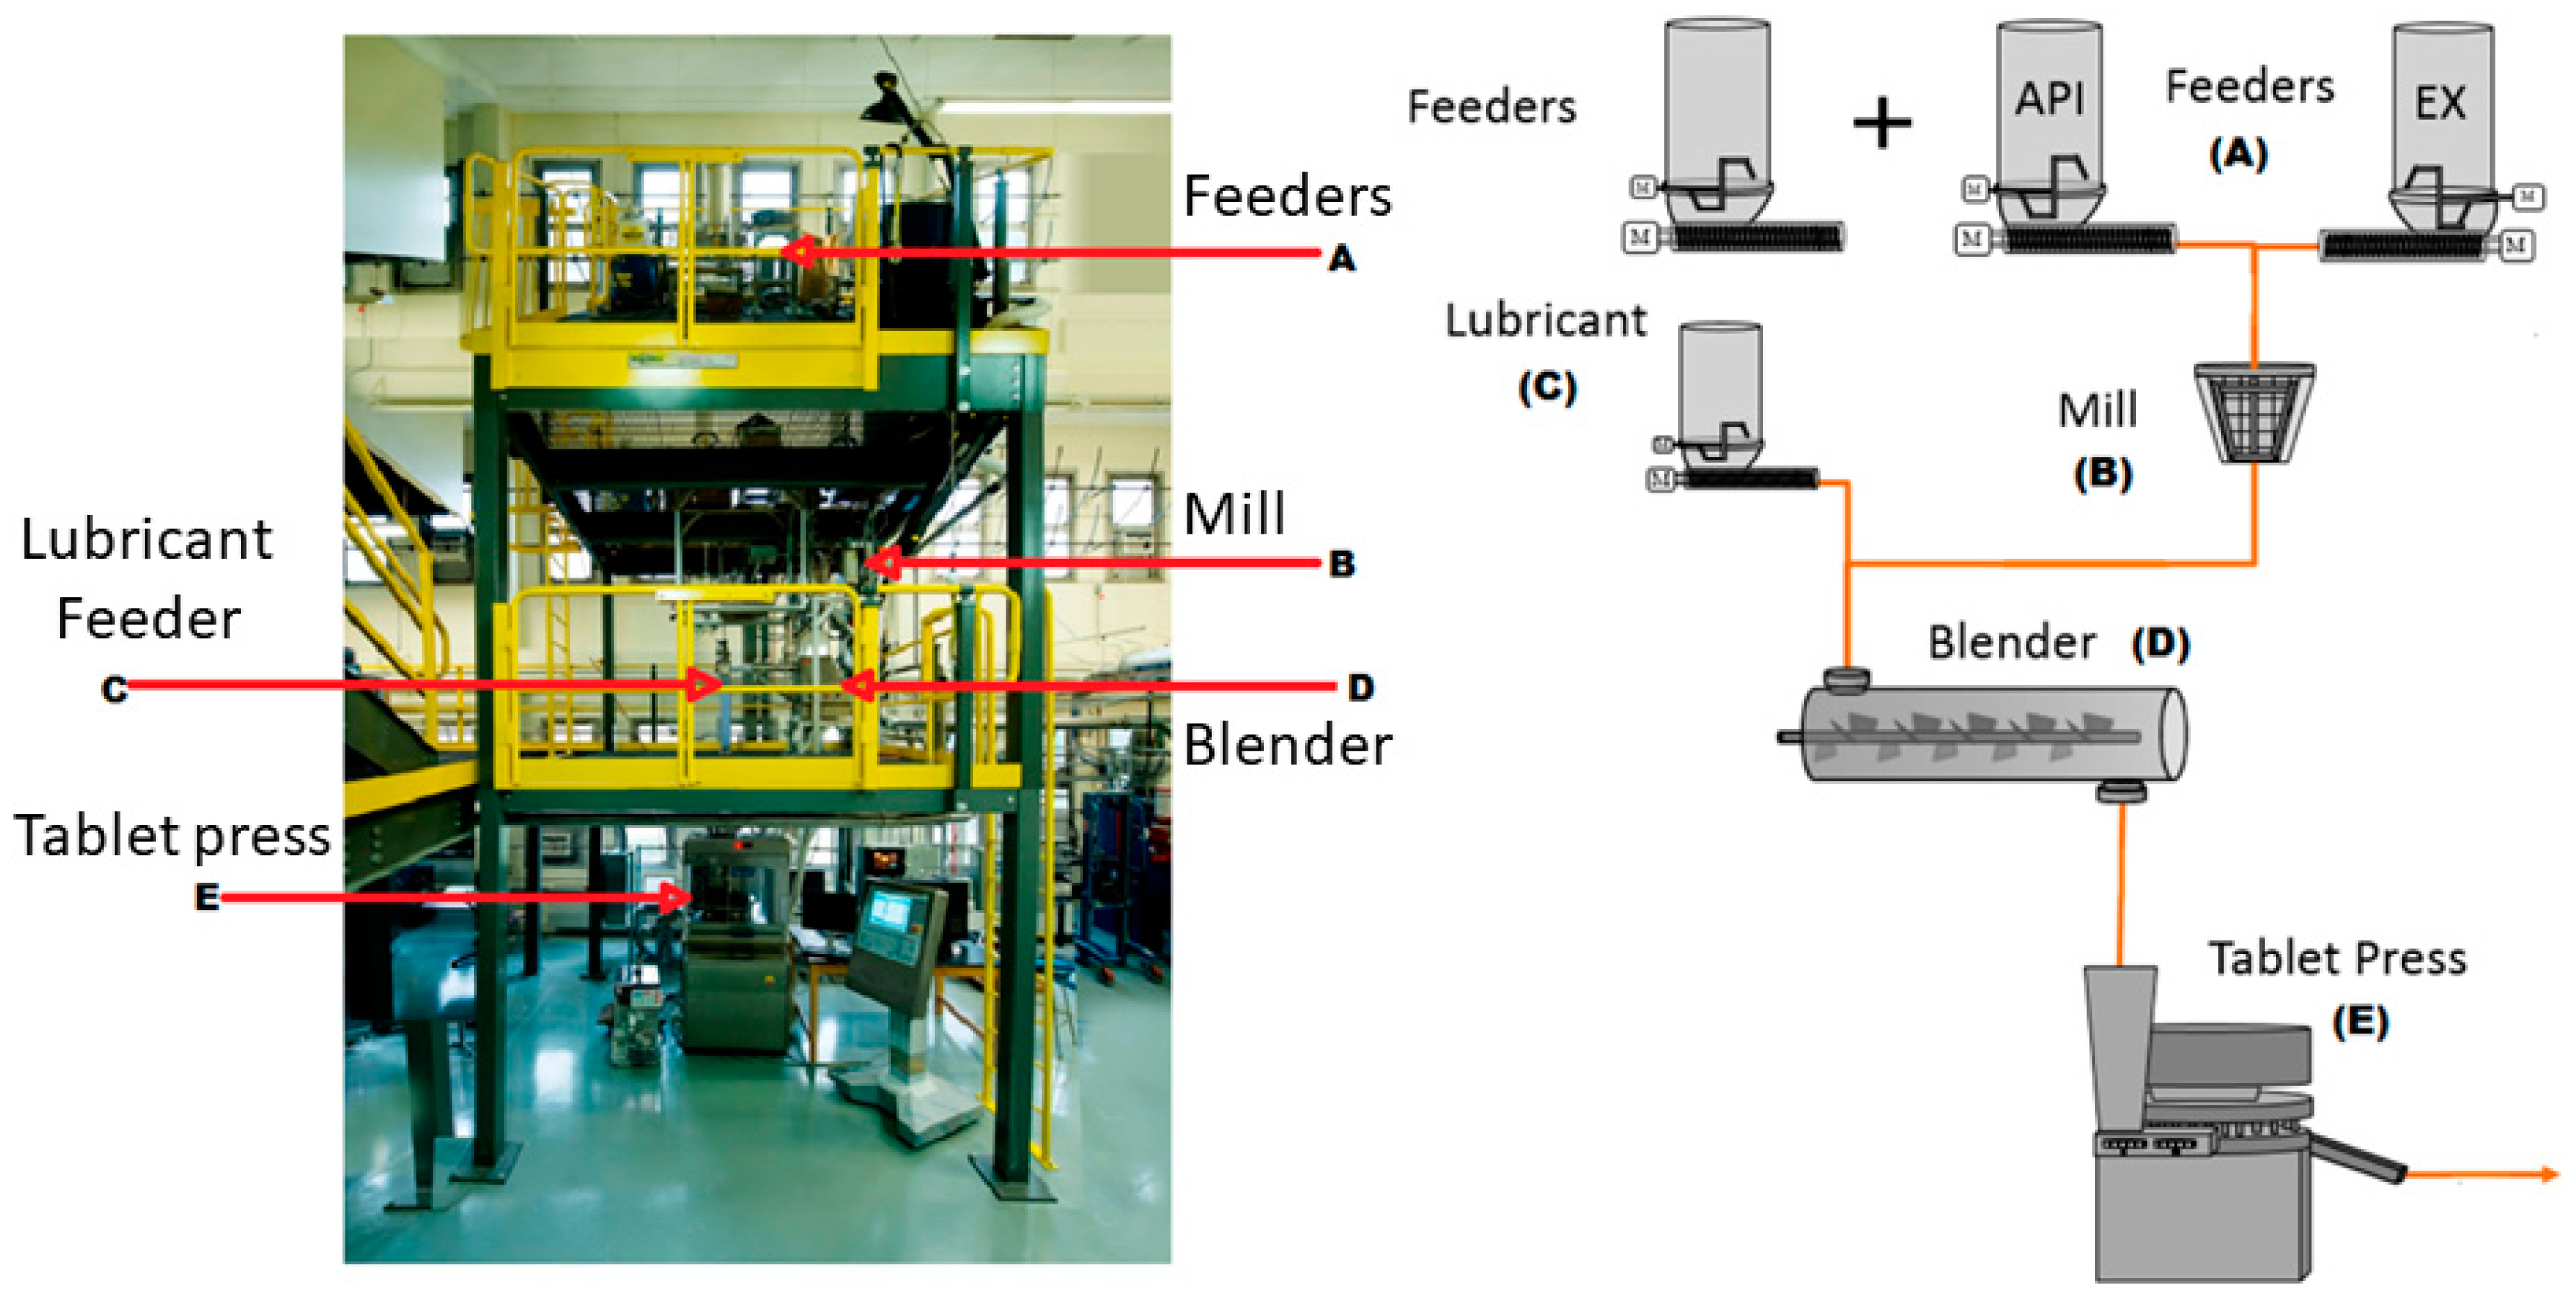
The continuous direct compaction tablet manufacturing pilot-plant that has been used for this study is shown in Figure 1. The pilot-plant is situated at ERC-SOPS, Rutgers University, USA [33]. The pilot-plant is built in three levels in such a way that gravity can be used as the driving force for material transport. The top most level is assigned to feeding and powder storage, the middle layer is designated to the task of blending and de-lumping and the bottom layer is used for compaction. Each of these levels spans an area of at least 10 × 10 square feet. The current equipment set includes three gravimetric feeders with the capability of expansion. Following the feeders, a co-mill is integrated for de-lumping the powders as mentioned before and creating contact between the components. The lubricant feeder is added after the co-mill to prevent over lubrication of the formulation in the co-mill. All these streams are then connected to a continuous blender to create a homogenous mixture of all the ingredients. The exit stream from the blender is fed to the tablet press via a rotary feed frame. The powder blend fills a die, which is subsequently compressed to create a tablet.
2.2. Compaction Process
Tablet compaction takes place through a systematic series of steps. At the start of this process, the powder is fed into a rotary tablet press through a mechanical chute. The material then enters a feed frame where rotating blades fill powder into the dies one by one. An increase or decrease in the feed frame speed can change the instantaneous density through consolidation or can decrease the instantaneous density by fluidization depending on the speed and material properties. Although this is an adjustable parameter, its effect has not been explored in this paper. Feed frame speed was kept constant throughout the experiments since, from a control perspective, this parameter is not considered to be an actuator in any of the tablet compaction control strategies. The effect of this parameter on the compression forces is outside the scope of this work. Another important parameter is the fill depth. This defines the total volume of powder that will be filled at this stage through an adjustable height. An increase in this parameter is essentially an increase in the depth to which powder can be filled thus, increasing the volume of powder that is filled and subsequently the weight. The powder, once filled in the dies has the excess removed by the scraper. Thus, at this stage the weight of the tablet is defined.
After this, the powder goes through two compression stages—the pre-compression stage and the main compression stage. With respect to both stages, the mechanics of this is such that two rotating drums on the top and bottom can be adjusted in terms of the spacing between them. The drum at the bottom can be moved vertically to change the spacing, while the upper drum is kept stationary. At their respective stations, the spacing between the two drums determines the final height that the powder will be compacted to. The two parameters that can be adjusted are the pre-compression height and the main compression height. When the dies come in contact with the drums during rotation the top die presses down towards the bottom one thus, generating a compaction. The force the upper die experiences during this process is essentially the compression force data that can be extracted from the press and used for control. The pre-compression force station is necessary as it reduces phenomena such as capping, increases the dwell time and also causes de-aeration of the powder [34]. The main compression force station is where the actual compaction takes place. For a certain fill depth, a decrease in main and pre-compression height increases the force the upper drum experiences. Subsequently, this also increases the breaking force and density of the tablets.
In the following sections, the incorporation of these mechanisms into the simulation tool Simulink (Mathworks) will be explored. The application of various control strategies to create a set of control options for different production scenarios will be elaborated in subsequent sections.
3. Materials and Methods
All the simulations were conducted in the Matlab and Simulink environment. Parameter Estimation Toolbox, Control System Toolbox and Model Predictive Control Toolbox, which are built into Matlab, were used for model regression and control system design.
The experiments conducted in this work used a blend with a composition of 89% lactose monohydrate (excipient), 9% acetaminophen (API) and 1% magnesium stearate (lubricant). The blend was prepared using a Glatt batch blender run at 25 revolutions per minute (rpm) for 30 min with a layered loading order to ensure that thorough mixing was achieved. The capacity of each batch was of 7 kg. Multiple batches had to be prepared throughout the experiments. Experimental data was collected through DeltaV (Emerson), which was also used as the platform for the implementation of control strategies into the pilot-plant.
Actuators for the control strategies used in this work were determined through a literature review, process understanding of the tablet compaction operation and a sensitivity analysis. Experiments were conducted to develop a main compression force, pre-compression force and simultaneous main and pre-compression force controllers. In these experiments, the fill depth and main compression height variables were used as manipulating variables. Each closed loop experiment was preceded by open loop experiments. During these experiments, the production rate was also varied to understand changes in transport delay. This experimental data has been used to develop the model and control architecture of tablet press.
4. Model Development and Validation
4.1. Systematic Modelling Framework for Pharmaceutical Process Control System Design
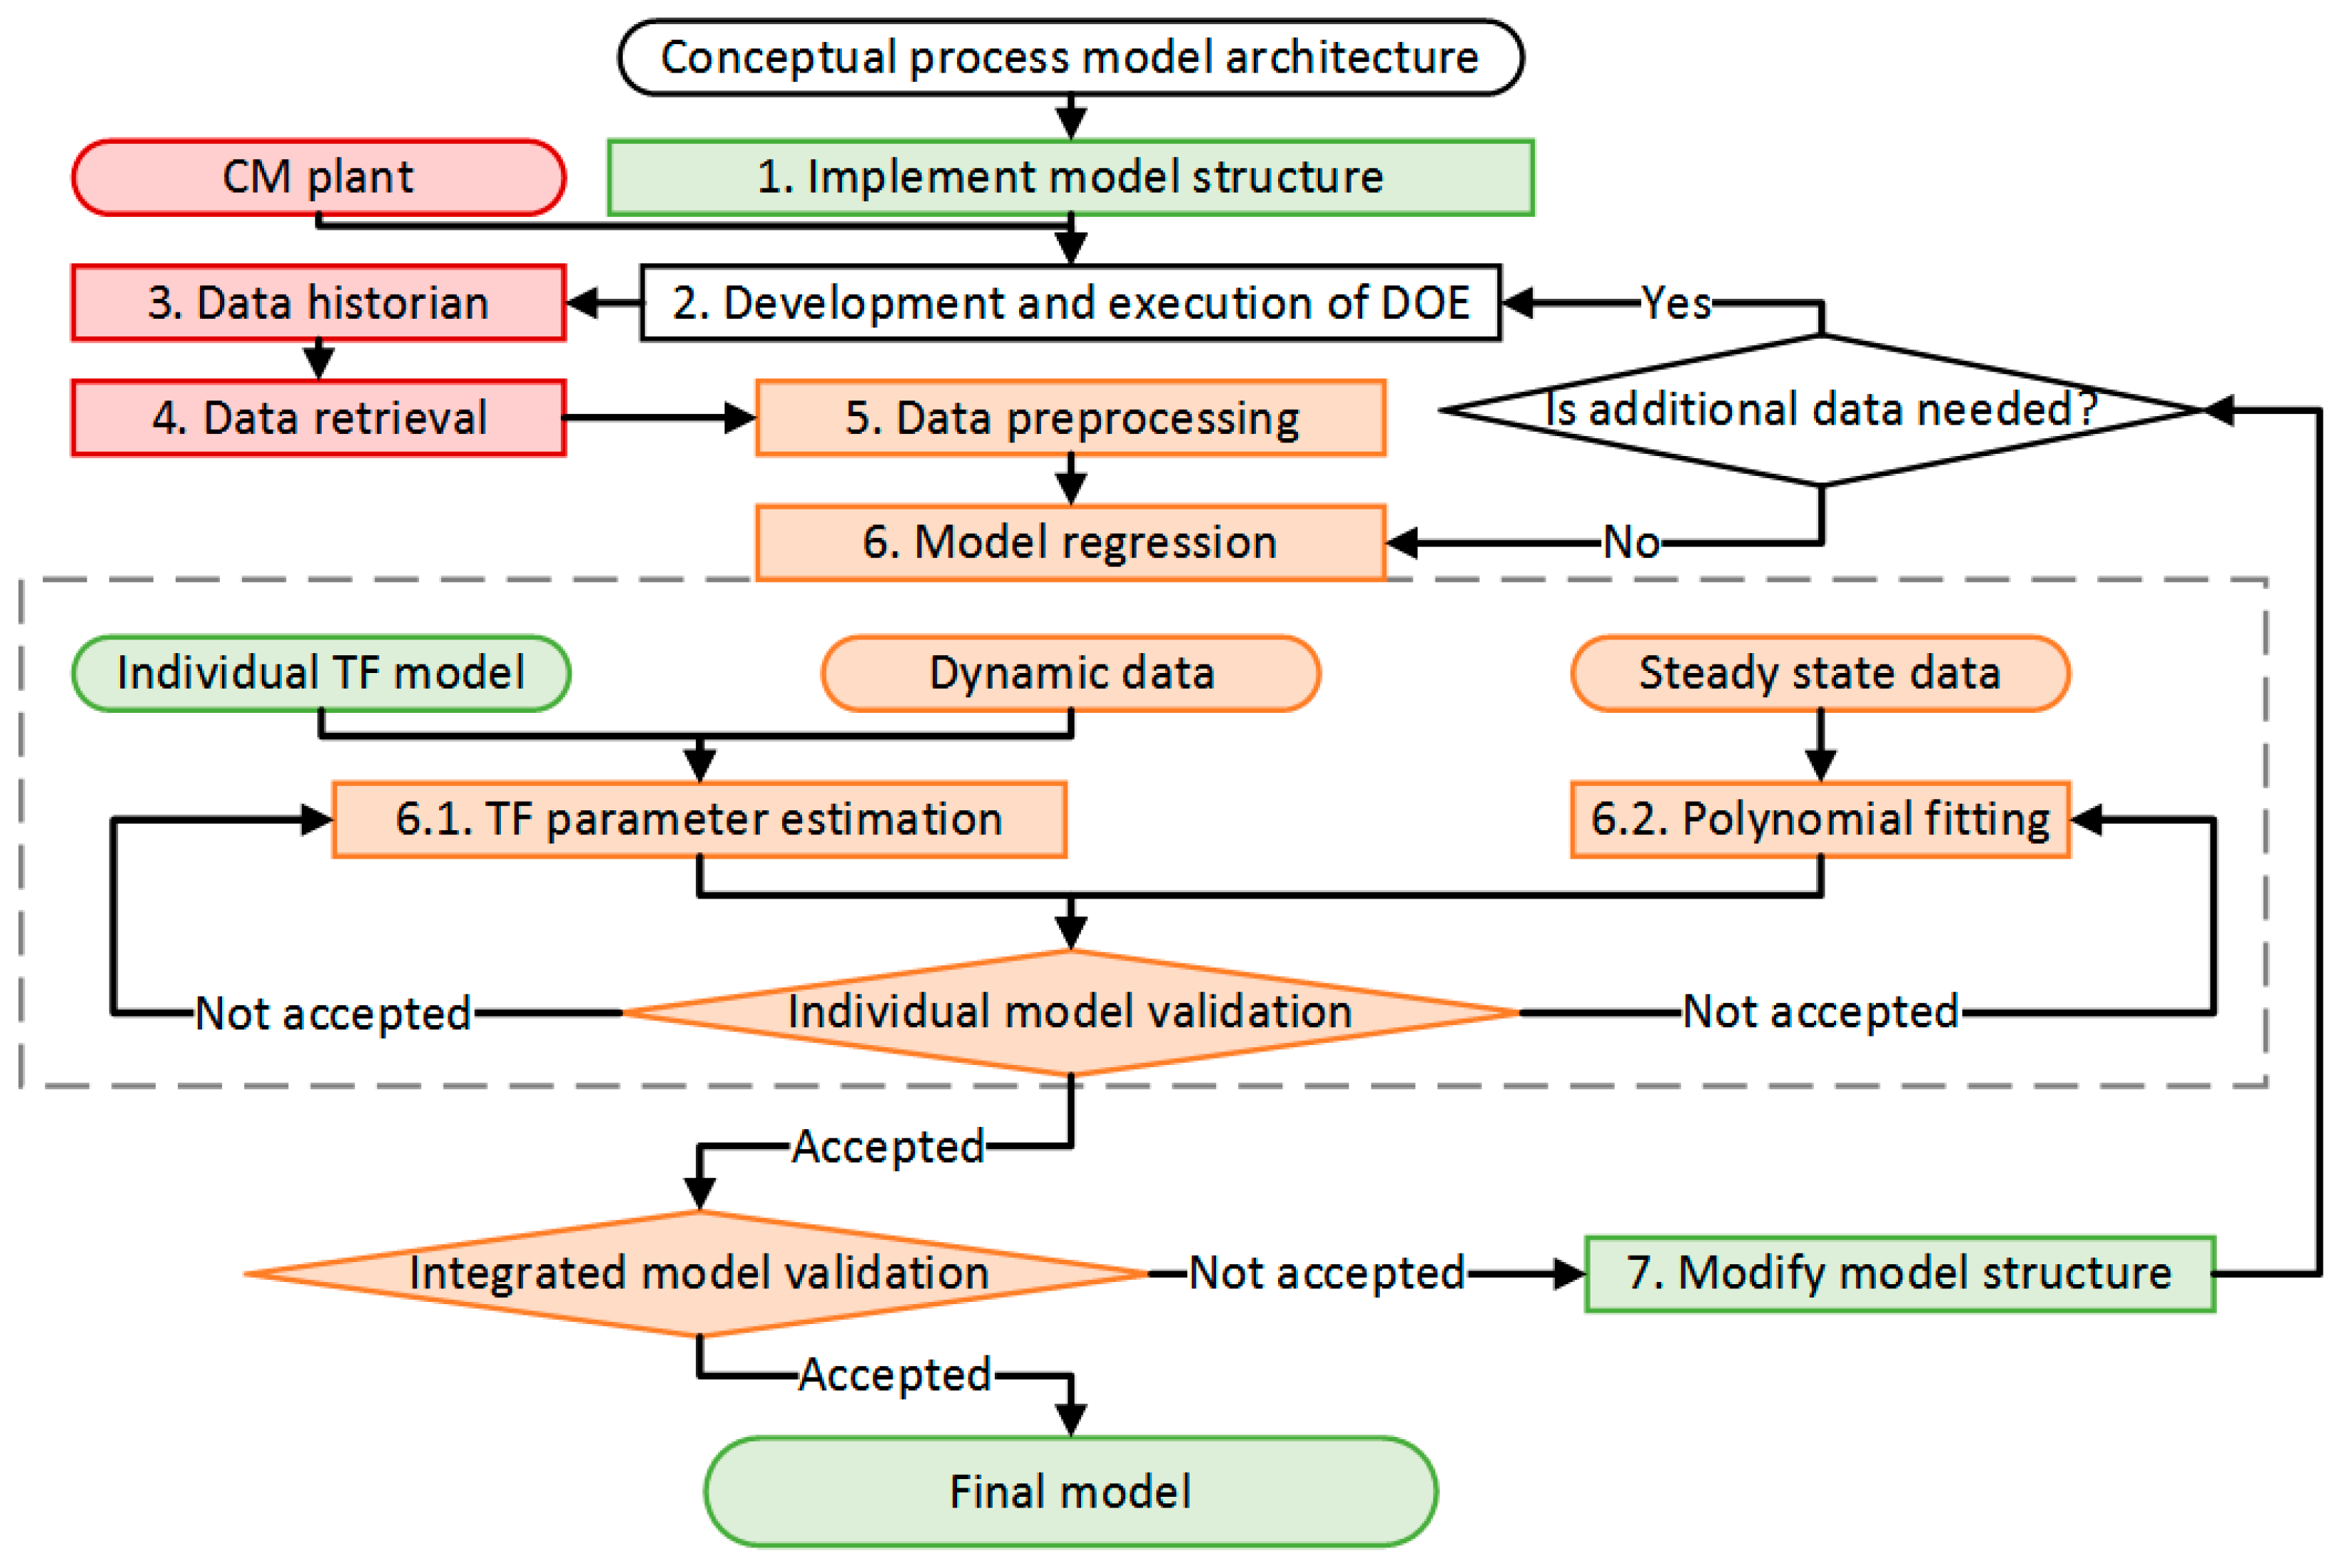
A systematic framework, shown in Figure 2, has been developed to guide future pharmaceutical modelling efforts. The framework starts with a conceptual model that is developed based on previous process knowledge. In this step, critical process parameters, critical quality attributes and any other relevant intermediate variables are identified. A simplified sensitivity analysis can help determine which variables should be integrated in the model. Once the model has been conceptualized, its architecture is implemented in Simulink (Mathworks). The model structure is defined according to the interaction between different variables and whether dynamic data can be obtained for all the variables. This structure can be derived empirically or based on first principles, being based on transfer functions, state-space and non-dynamic models.
The adequate experiments have been performed in order to generate process data. The materials and methods used in the experiments is described in Section 3. The control platform’s continuous historian automatically stores the raw data generated during the experiments. The raw data of an entire day is then imported to a spreadsheet, which can be read by Matlab. All the data preprocessing and organization, such as classifying the data by experiments and converting the timestamps to an adequate format is done in Matlab.
Each individual model is then regressed to closely fit the experimental data. The regression procedure varies according to the type of model implemented. This work followed two different procedures, one for the regression of linear dynamic models (transfer functions) and one for nonlinear steady state models (polynomial). The former entailed the estimation of transfer function parameters via Matlab’s Parameter Estimation Toolbox, while the latter was based on the Matlab’s polynomial fit functionality (polyfit). The models were then individually validated. If the fitting was not considered adequate the procedure was repeated. Once adequate individual fittings were achieved, an integrated model validation was conducted. This was done running a simulation where the inputs mimicked input data from a previous experiment. The simulated results were then compared to the experimental results and the fitness of the model was determined. If the model was rejected, the model structure was modified and the regression steps were repeated. A new DOE was executed if not enough data is available to support the updated model.
The accuracy of the models was quantified through the correlation coefficient (R2). Once an accurate model was achieved (), the model structure and its parameters were stored. The final model then has been used for the development and application of control systems.
4.2. Model Structure
4.2.1. Transfer Functions
Transfer functions are algebraic expressions that establish a dynamic relationship between an input and an output variable for a linear system [35]. The simulation model developed in this work consisted mostly of a series of empirical transfer functions of first and second order, each one representing a single input single output (SISO) system, arranged to capture the behavior of a multi input multi output system that is the tablet compaction equipment. The decision between first or second order transfer functions was based on the characteristic response of the process and on the regression coefficient (R2) of the fitted model. A lower order transfer function was always preferred if its performance was satisfactory. Transfer functions are a compact manner of expressing a model and were selected as the main model structure due to their ease of implementation, interpretation and solution using Simulink. The form of a transfer function that was implemented in Simulink can be seen in Equation (1). A first order transfer function can be obtained from Equation (1) by setting the value of to zero.
where and input and output signals, respectively, is process gain and is the time constant. The values of the transfer function parameters are selected to minimize the difference between the simulated and experimental data. The fitting procedure is described in Section 4.4.1.
4.2.2. Variable Transport Delays
Multiple transport delays are present in the simulation model. From process understanding, it was learned that some of these transport delays varied as a function of the turret speed. The variable delays consist of two independent fractions as seen in Equation (2). The first fraction has a constant value and is inherent of the sensing method. The second fraction is dependent on the turret speed and the number of stations between the processes, varying according to Equation (3).
where is the sensor time delay, is the process time delay, is the overall time delay, is turret speed, is the number of punches between actuation and sensing and is the total number of stations (punches).
4.3. Nonlinear Force Behavior
The main compression force and pre-compression force are the two main controlled variables as they directly affect the tablet breaking force and can be made to influence tablet weight. Previous literature provides information on the nonlinear correlation between tablet tensile strength and compaction force [36]. The Kawakita equation provides a correlation between the compaction pressure and volume [37]. In this work, a nonlinear correlation between compaction force and the ratio of the fill depth and the compaction height has been derived and presented. From the control perspective, this information is valuable as it gives direct information about the actuators and the controlled variables.
The experiments have been conducted to analyze the effect of compression ratio on main compression force. The compression ratio is defined as the ratio of fill depth and compression height. The steady state values of the force were plotted against their respective compression ratios. It is worth noting that the interactions between the fill depth and the compression forces are captured by relating the compression ratios to the compression forces. An increase in the fill depth and a decrease in the height would mean that more powder would have to be compressed to a smaller space, generating a higher force. A decrease in the fill depth and an increase in the height would result in the opposite scenario. Therefore, not only does this capture the dynamics of two actuators in one variable but it also assists in the modelling as it can be easily correlated to each of the forces.
From the plot (Figure 3), it was noticed that the steady state values of the force, as correlated with compression ratio, followed a nonlinear trend. Given a choice of an exponential equation and a second order polynomial equation, the latter provided a better fit to the experimental data. The form of the Equation (4) is shown below.
where is ratio of fill depth and compression height, is the compaction force and are the polynomial coefficients of the model. The numerical values of these constants are provided in Section 4.6.2.
It is important to note that this model was obtained using purely the steady state data. Hence, this gives only non-dynamic information of the system. In order to capture the dynamics of the system, this polynomial can be preceded by a transfer function with a unit gain. The polynomial equation is a characteristic nonlinear equation.
4.4. Model Regression
4.4.1. Linear Models
Prior to the transfer function fitting it was necessary to determine, the critical process parameters and how they are affected by different process inputs. It has been achieved based on experiments and process knowledge. Once the inputs and outputs are paired for each individual transfer function, the fitting can take place.
The transfer function parameters were fitted using Matlab, Simulink and the Parameter Estimation Toolbox. Experimental input and output data for a determined transfer function is loaded to the Matlab workspace. A Simulink model consisting of a parameterized transfer function followed by a parameterized transport delay is then loaded and the Parameter Estimation Toolbox is used. In the Parameter Estimation Toolbox, the error between the experimental output and simulated output for a given input is minimized by varying the transfer function and transport delay parameters. The minimization is based on the optimization algorithm selected by the user. The cost function to be minimized can also be set by the user. All the transfer functions used in this paper were fitted using the nonlinear least squares methods with the Trust-Region-Reflexive algorithm. The sum of the squared errors was used as the cost function.
The linear models that were used to approximate the nonlinear dynamics of the compression forces were fitted in the following ranges: pre-compression force (1.4 kN–3.2 kN), main compression force (5 kN–12 kN). This linearization can be justified by the fact that these models are operated within a narrow range where this assumption is valid.
4.4.2. Nonlinear Models
The nonlinear models consisted a transfer function with unitary gain followed by a second order polynomial as described in Section 4.3. The polynomial was fitted based on steady state data using the polynomial fitting function, polyfit, built into Matlab. Initially, the possibility of capturing the behavior of both pre- and main compression forces using a single polynomial was evaluated. This single polynomial did not successfully fit the data. An alternative approach, where pre- and main compression forces are modelled by two different polynomials successfully fitted the data. A correlation between breaking force and main compression ratio was also modelled by a second order polynomial equation.
4.5. Model Implementation
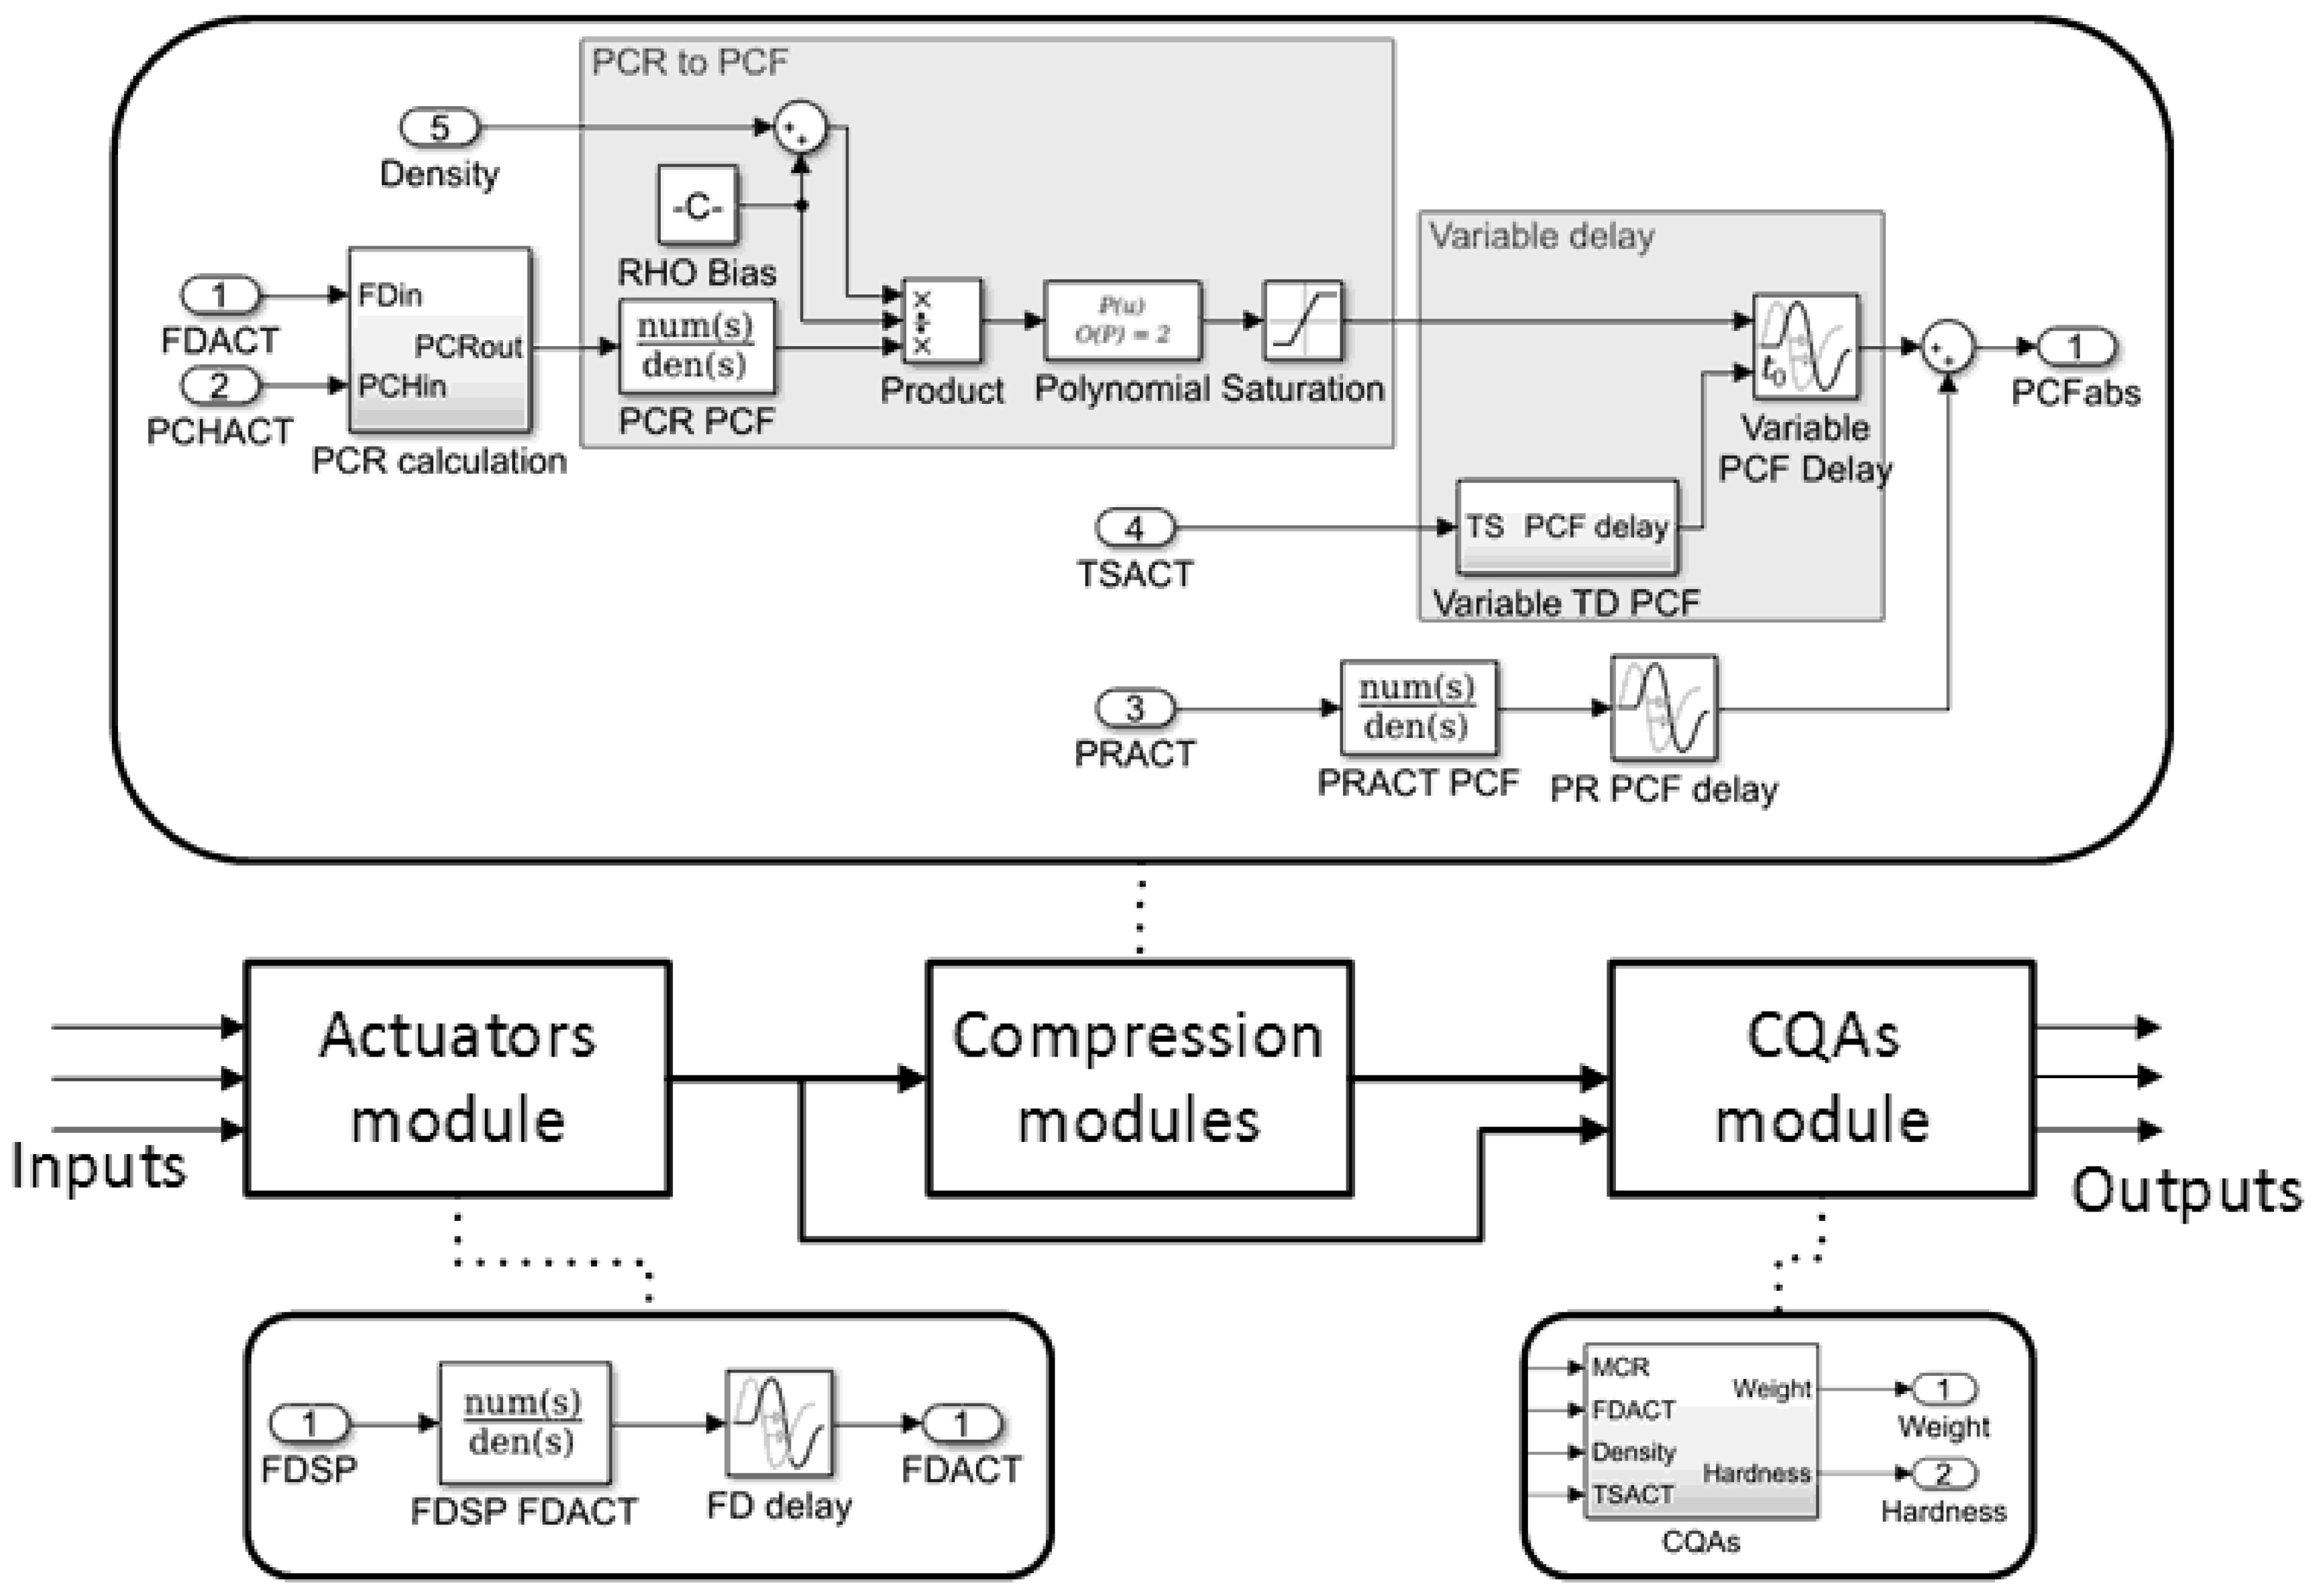
A flexible process model was developed (using Simulink) to allow virtual experiments to be done in a quick and simple manner. The key input and output parameters of the tableting process are available for manipulation and monitoring in the model. The structure of the model was developed in such a way that the user can access each individual step of the tableting process and consists of four main modules. The first four modules capture the dynamic behavior of the mechanical actuators, pre-compression force, main compression force and tablet CQAs. The last module represents the tablet rejection system. The system is organized using Subsystem masks to facilitate the understanding of the implementation. An overview of the model implementation is presented in Figure 4. Three main modules and a snapshot of their implementation can be seen in this image.
4.5.1. Actuators Module
The actuator module consists of a series of transfer functions relating the set point and actual values for the actuators. A first order dynamic behavior was considered to represent the fill depth, pre-compression height and main compression height actuators. A second order transfer function was used to represent the production rate actuator. In this module turret speed is also calculated based on the actual production rate () value using Equation (5).
where turret speed () is given in rotations per minute, production rate is given in thousands of tablets per hour and is the total number of stations (punches) in the press.
4.5.2. Compression Force Modules
In order to effectively represent the behavior of the compression forces, its interaction with fill depth, compression heights and production rate were modeled. From process understanding, it was recognized that the compression force is affected by a combination of the amount of powder filled into the die and the height to which this powder is compressed. This interaction was captured by relating the ratio of fill depth and compression height (compression ratio) to the compression force. This model consisted of the nonlinear model that is described in Section 4.3 and Section 4.4.2. The interaction between the production rate and the compression force was modelled using a second order transfer function and a constant transport delay. The response from the production rate model was added to the response from the nonlinear compression model. This signal is considered to be the final force value. It is important to note that the polynomial that was used in the nonlinear compression was fitted against the absolute values of the compression ratio. Since the variables in the module exist as deviation variables, it is appropriate to convert these variables into absolute values before using them as an input in the polynomial. Another important feature that was added to this module was a methodology to capture variations in the density. In the actual tablet press, a change in the powder density would result in an increased or decreased amount of powder being filled into the die. This behavior can be represented as linear changes in fill depth. The modified fill depth calculation is given in Equation (6).
where is the modified fill depth, is the actual fill depth, is the powder bulk density in the feed frame and is the reference value of bulk density at which the polynomial coefficients of Equation (5) were fitted.
4.5.3. Critical Quality Attributes Module
The critical quality attributes module uses fill depth, density, compression forces and turret speed to calculate the tablet weight and breaking force. A first order transfer function with unitary gain followed by a weight calculation (Equation (7)) and a variable transport delay is applied to model the tablet weight behavior. Tablet breaking force is calculated through a polynomial relationship between tablet breaking force and main compression ratio followed by a transport delay. Changes in density have a direct effect on both tablet weight and breaking force. The effect of density changes in tablet breaking force was modeled using the modified fill depth approach shown in the previous section. It is important to note that the tablet weight transfer function models the characteristic behavior of the weight sensing technique used in the experiments, which is coupled with the fill depth dynamics to represent the overall process dynamics of tablet weight. A transfer function is not used to model tablet breaking force since no dynamic data was available for this variable because of sensing limitations. The polynomial equation used to model tablet breaking force is based solely on steady state measurements, which, when coupled with the fill depth dynamic model can represent the breaking force dynamic behavior. A fixed transport delay is used to represent a hypothetical sensor behavior.
where is tablet weight, is the area of a tablet punch, is the powder density and is the fill depth.
4.5.4. Tablet Rejection Module
A module representing the tablet rejection system present in the tablet press was also developed. This module quantifies the total amount of tablet produces during the simulation as well as quantifying the number of tablet inside and outside specification. The total production is calculated by an integrator function that takes the production rate as an input. The good production is determined by multiplying the production rate signal by a series of logic signals coming from relay blocks and then integrating the resulting signal over time. The production is classified as good production if all the relays send a true signal. Each relay block represents a specific quality attribute and if the tablets are not within the specifications for that quality attribute the relay blocks sends a false signal (zero). If the tablet is within specifications, the relay sends a true signal (one). The bad production is calculated by simply subtracting the good production from the total production.
4.6. Model Validation
Through mathematical regression as described in Section 4.4, the dynamics of the interaction between the various parameters were captured in mathematical models. A key feature of this modelling methodology is the importance to detail in terms of capturing all the process dynamics. The interaction between the various critical process parameters was captured. The dynamic between the set point and actual values was also identified. This section is organized in terms of the variables where a dynamic existed between set point and actual, critical process parameter and a respective actuator and critical quality attribute and critical process parameter.
4.6.1. Set Point and Actual Response Dynamics
The models have been developed to capture the dynamics between an operator providing a set point and this value being tracked by the final control element.
In Figure 5a, the simulated, experimental and set point values are plotted for fill depth. This model is driven by a transfer function and the regressed parameters for the same are provided in Table 1. This model is characterized by a response that is of first order dynamics. The figure shows step changes going from 6.15 mm to 5.7 mm in a step down and from 5.7 to 6.15 mm in a step up. These step changes are made in arbitrary time intervals to make sure of the model robustness. The close correlation between the simulated and experimental fill depth along with an R2 value of 0.9966 indicates that the model is very accurate.
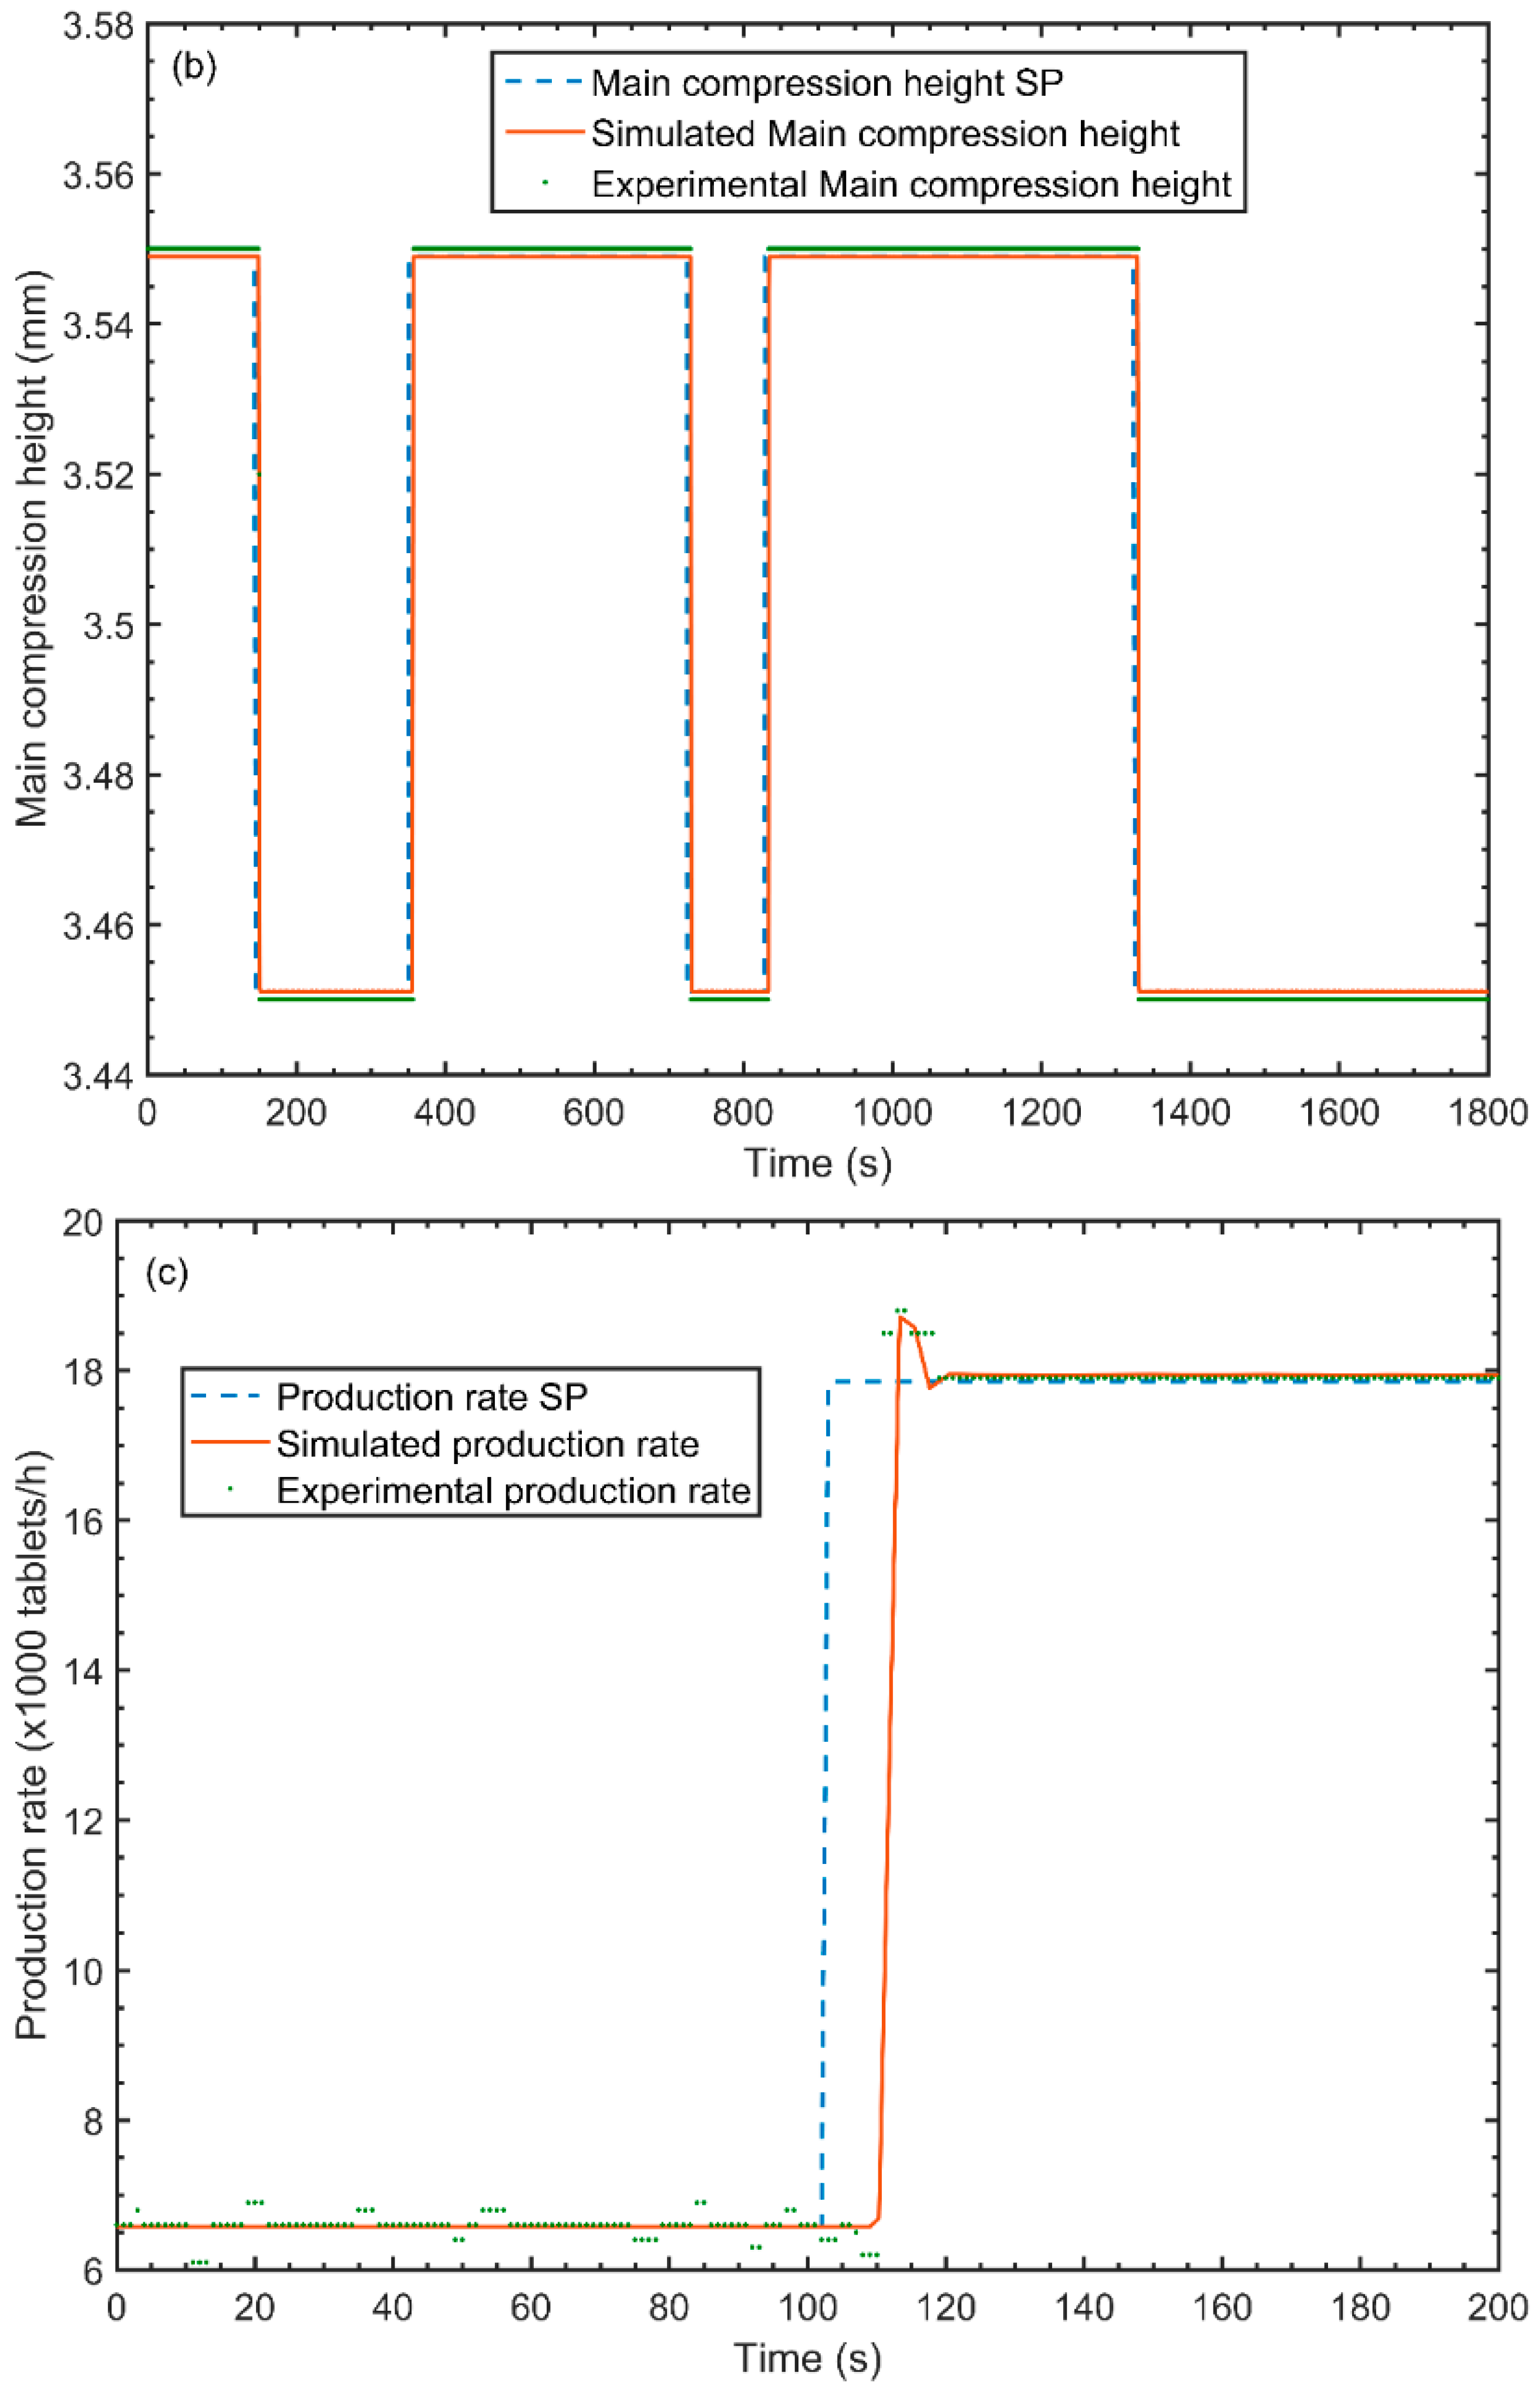
Figure 5b shows the model validation plot for the main compression height. It is similar to the fill depth dynamics in that it also follows a response characterized by a first order dynamic. Table 1 shows the regressed parameters that defined this transfer function. The figure describes the validation methodology. Step changes in the set point were provided and the experimental and simulated values were observed. The range of the step change is from 3.55 mm to 3.45 mm. As in the case of the fill depth, the step changes are made in arbitrary time intervals. This model is concluded to be accurate based on the R2 value (0.9973) and the graph. The same model has been used to calculate the pre-compression height by assuming that it followed the same dynamics as the main compression height. The reason that this assumption holds good is that both the pre- and the main compression height essentially perform the same action of moving a drum to adjust compaction height. The difference lies in the fact that in all cases the final compaction height is lesser than the pre-compaction height. It was presumed that this difference in magnitude should not affect the dynamics of the model significantly.
The production rate model validation is shown in Figure 5c. This model is characterized by a response that follows a second order dynamic. The regressed parameters for the same are provided in Table 1. This figure shows one step change and the simulated and experimental responses. As can be seen, a slight overshoot is observed which is followed by an immediate convergence to the set point. This is characteristic of second order dynamics. The model accurately captures this as seen in the graph. The R2 value (0.9824) is observed to be lower than the other models described in this section. This statistic is indicative of the inability of the model to capture slight variations that are observed in the graph.
4.6.2. Critical Process Parameter Interaction
As mentioned in Section 4.5.2, compression force modules were developed to capture the effects of the fill depth, pre and main compression heights, production rate and density on the pre- and main compression forces. Table 2 summarizes the details and parameters of the transfer function model for critical process parameters. Table 3 presents the polynomial coefficients from Equation (5) fitted to model the nonlinear behavior of the compression forces.
Figure 6a is a plot showing the model validation for the pre-compression force. The plot is divided into two levels. The top portion of the image shows changes in the pre-compression ratio, cause by variations in fill depth, while the bottom portion shows how these changes affect the pre-compression force in both the simulations and the experiments. Fill depth variations ranged from 6.6 mm to 5.8 mm. As observed in the image, there is a close matching between the developed model and the experimental values.
In Figure 6b, main compression force data, through both simulation and experiment, was plotted with respect to changes in main compression ratio caused by variations in both the fill depth and the main compression height. This model was developed to accommodate interaction in both its immediate actuators, that is, fill depth and main compression height. The image shows an increase in force for a decrease in the compaction height and a decrease in the force for a decrease in the fill depth. This is as expected and follows the same trend as the experimental data. The mismatches that are observed in the simulated signal’s main compression force are captured in the lower R2. This value is still considered to be high enough to use for control system development.
4.6.3. Critical Quality Attributes
As mentioned in Section 4.6.3, an attempt was made to model the influence of the critical process parameter’s influence on the critical quality attributes. In this attempt, the tablet weight and breaking force models were developed. These have been validated in this section.
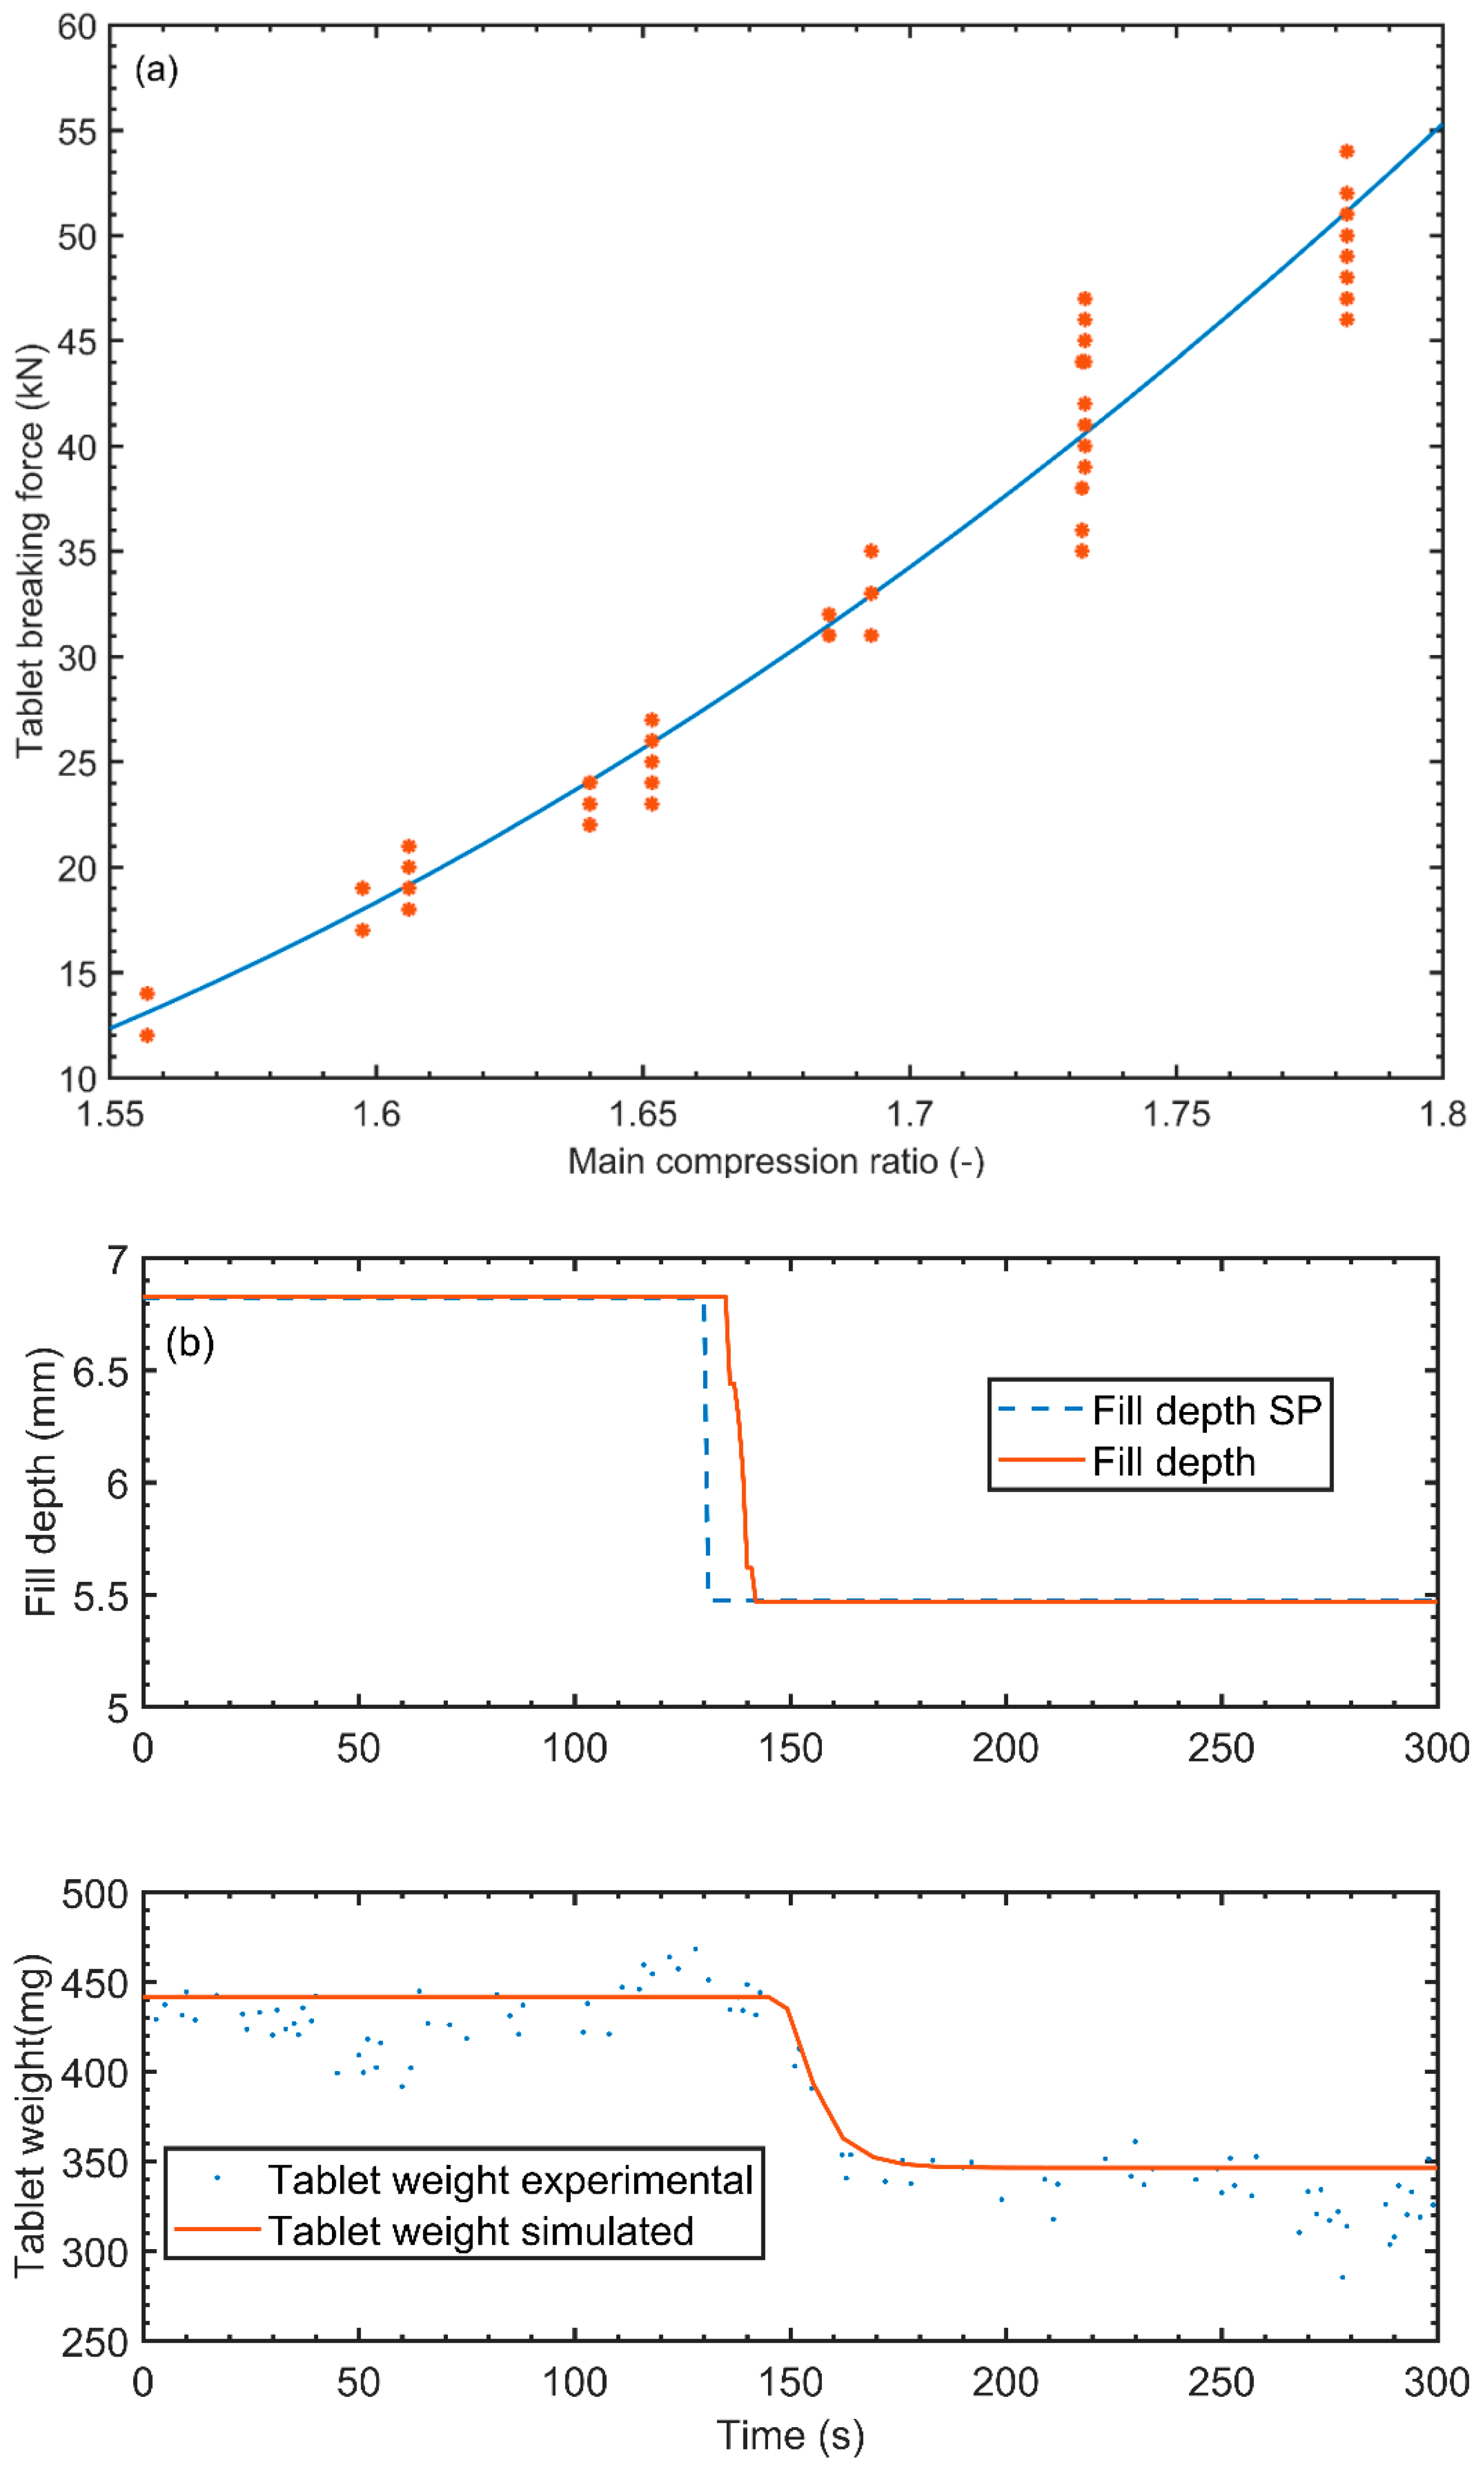
With respect to the tablet breaking force model, Figure 7a shows a graph plotting the breaking force versus the main compression ratio. It was previously mentioned that this model was developed based on steady state data. It is for this reason that the model was validated against more steady state data. As seen in the image the model used a second order polynomial to follow the nonlinear trend that is observed with the experimental data. The parameters for the polynomial that correlated main compression ratio and the tablet breaking force are a1 = 258.8846, a2= −695.3997 and a3 = 468.2229. This model was considered adequate for control system design. This section of the modelling is expected to be the focus of future research.
In Figure 7b, the model that was developed to predict continuous tablet weight was validated. Here, it is observed that when the fill depth is stepped down the experimental data follows a downward trend and stabilizes. The tablet weight reduces with a decrease in the fill depth. This experimental data follows the expected trend. Through regression, it was found that the downward dynamic trend could be captured using a first order transfer function. The parameters that were used to predict the dynamics of the tablet weight in the transfer function were a unit gain and a first order time constant of 6.5 s and a transport delay of 12 s.
5. Application of the Developed Model for Design and Evaluation of Control Systems
Designing a new control strategy can be time and cost intensive. The high material cost and the limited material availability, especially during process development phase, can be a barrier for the implementation of control systems in the pharmaceutical industry. The developed model enables extensive experiments to be conducted on a virtual tablet press unit with little to no cost, generating valuable insights about the process. The ease of experimentation provided by the model allows for in-depth dynamic sensitivity analyses. Different manipulated-controlled variable pairings can be explored, since interaction between process variables are captured by the model. The performance of different control algorithms and strategies on this specific system can be easily studied. More complex evaluations of control systems, such as stability analysis through root locus diagrams and frequency response analysis, can also be derived from this model.
By integrating the developed model with the control platform through OPC connection it is possible to ensure that all the developed control modules have no flaws. A preliminary tuning of the implemented controllers can also be achieved through simulation, reducing the number of experiments necessary to deploy a new control strategy.
5.1. Control Algorithm Comparison
The set point tracking ability of three different control algorithms, PI, MPC and MPC with unmeasured disturbance model (integrated white noise model), was compared to determine which algorithm was the most adequate to be used for the development of the control strategies studied in this paper. The MPC algorithm with an unmeasured disturbance model consists of a variation of the conventional MPC, which removes steady state errors caused by unmeasured disturbances and mismatches between the controller model and the actual plant. A control strategy which controls main compression force through fill depth was used for the comparison due to its wide applicability in commercial tablet presses. Most of the commercially available tablet press have an inbuilt control system for main compression force but none of them has employed MPC algorithm.
The control algorithm comparison was conducted in the DCS (DeltaV Control Studio) and the simulation platform (Matlab/Simulink). The goal of this multiplatform implantation was to evaluate which control algorithm presents superior performance and to check if this superiority is observed in both platforms. A few differences can be pointed out between the controller implementations in each platform. The first difference is that features like anti-windup and manipulated variable tracking (during open loop) are set-up by default in the DCS, whereas in Simulink these features must be manually set up by the user, which may cause confusion if the user is transitioning from the DCS to Simulink. A difference in the PI controller implementation lies in the fact that the DCS and Simulink have slightly different forms for the PI equation, requiring a conversion of parameters to transfer tuning parameters between the two platforms. The MPC implementation also differs slightly between the two platforms. In the DCS the user does not have the flexibility to change the optimization algorithm used in the MPC. The models that can be used by the MPC in the DCS have to be either transfer function models or finite impulse response models (FIR), whereas in Simulink, the models can be either transfer function models or state-space models.
5.2. Control Strategy Development and Closed Loop Simulation
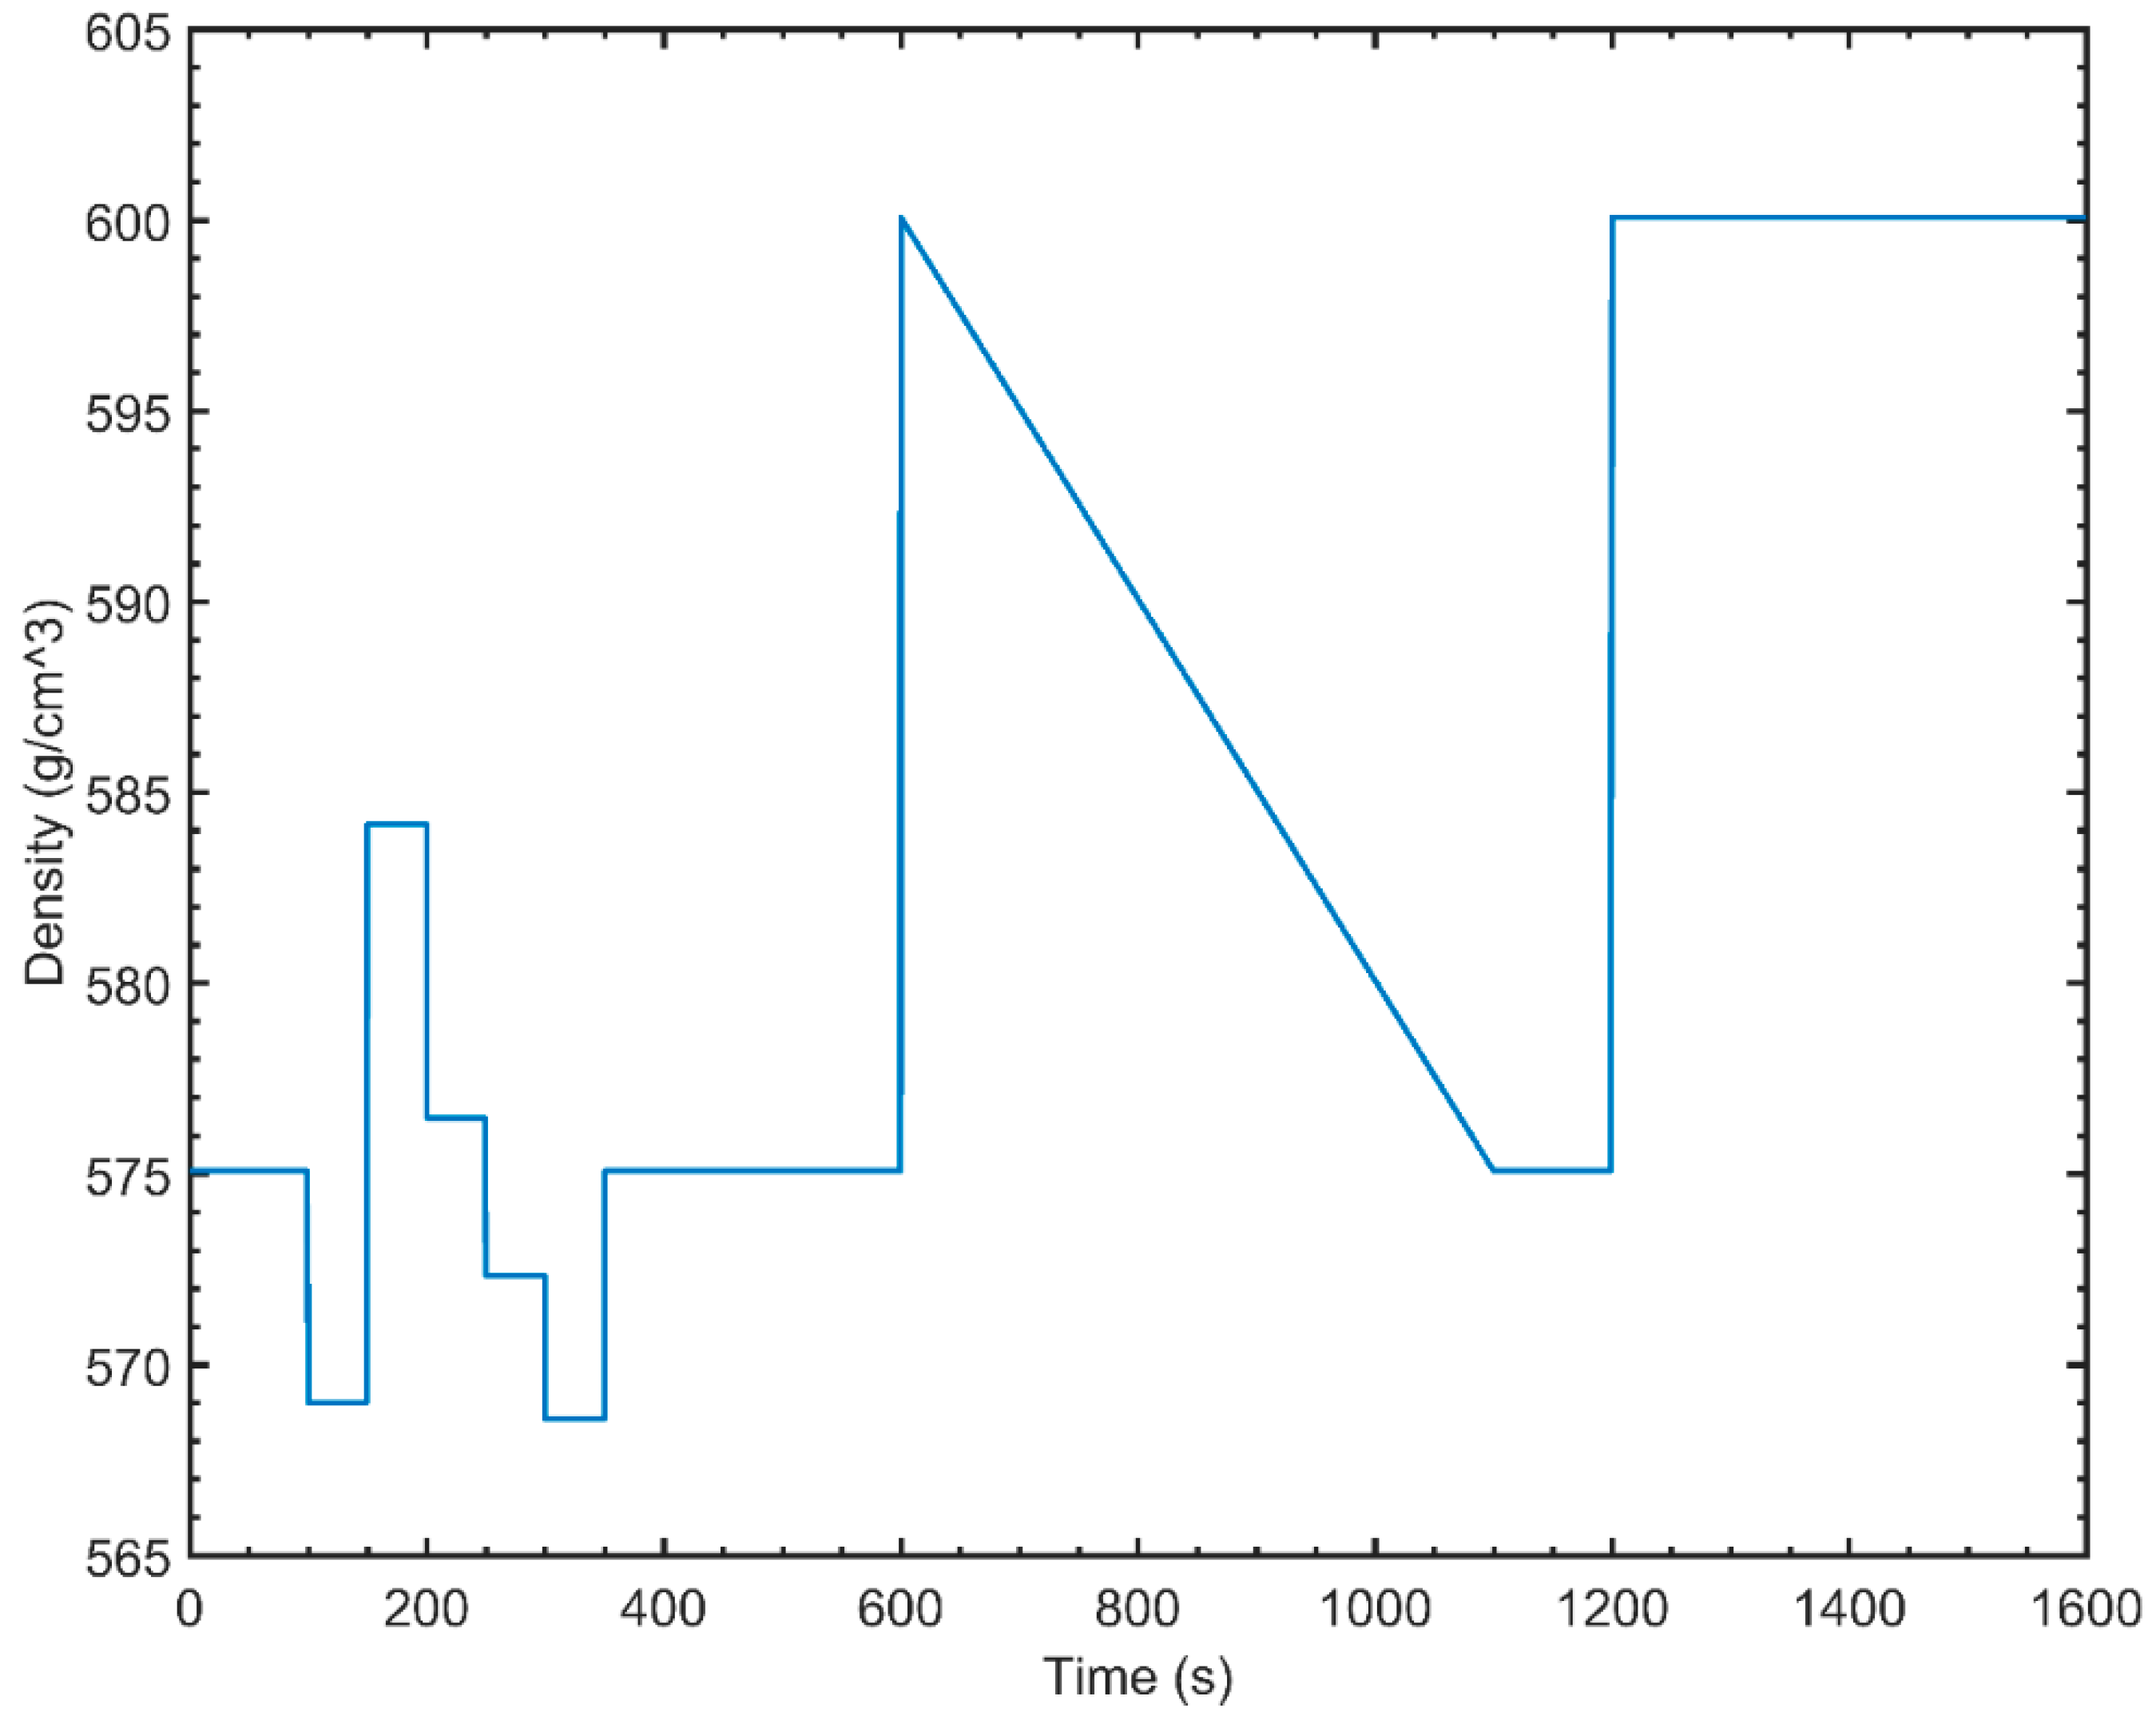
Three different novel control strategies were developed and evaluated as part of this study. The strategies were evaluated under two different scenarios. The first scenario consisted of a set point tracking experiment. The second scenario consisted of a disturbance rejection experiment, where variations in powder density were used as a disturbance. The variation in density used in the second scenario had the form of white noise disturbance, followed by ramp disturbance, succeeded by a step change in density (Figure 8).
5.2.1. Strategy 1—Simultaneous Control of Pre- and Main Compression Forces
A control strategy for simultaneous control of pre- and main compression forces through fill depth and main compression height, respectively, using a MIMO MPC has been evaluated. Through a review of the compaction process, it is postulated that controlling pre-compression force by manipulating fill depth gives indirect control over the tablet weight and control of the main compression force through manipulations in main compression height gives indirect control of the tablet breaking force.
This was the only strategy that was also implemented in the pilot plant. This implementation was used to validate the applicability of the developed model. Currently, it is not feasible to measure tablet CQAs in real time with the available state of the art technology, making it impossible to implement strategies 2 and 3 in the pilot plant.
5.2.2. Strategy 2—Cascade Control of Weight and Breaking Force
Under circumstances where the sensors for both weight and breaking force are available, it is possible to use a cascade control strategy where the slave controller manipulates the fill depth and main compression height to control the pre- and main compression force respectively. The master controller manipulates the set points of the pre- and main compression forces to track the set points provided for weight and breaking force. This strategy’s performance is dependent on the sampling rate of the sensors. A cascade control strategy works best when the slave controller is faster than the master controller. Given that available sensors for weight and tablet breaking force are slow due to their low sampling rates this control strategy is justified in its implementation.
5.2.3. Strategy 3—Direct Control of Tablet Weight and Cascade Tablet Breaking Force
A strategy where tablet weight is controlled directly through fill depth and tablet breaking force is controller through a cascade arrangement might be desired in when a fast sensor for tablet weight is available. Such sensor has been developed and implemented as a proof of concept in a previous work [32]. The strategy consists of a SISO main compression force controller, which manipulates the ratio between fill depth and main compression height. This ratio is used to calculate the value of main compression height while minimizing the interactions between fill depth and main compression force. A secondary MPC is used to control tablet weight and breaking force through fill depth and main compression force set point.
6. Controller Tuning and Implementation
6.1. PI Controller
6.1.1. Tuning Procedure
The PI controller used in this work was tuned according to the modified SIMC method introduced by Skogestad (2011). This method consists of a rule based approach and considers both controller performance and robustness. An advantage of the SIMC method is that only a single tuning parameter () needs to be adjusted. Lower values lead to a tighter controller (better performance), whereas higher values of lead to a smoother (more robust) controller. The value of was used to tune the PI controller, leading to values of and . This value of is recommended by Skogestad as the tightest value that maintains a smooth control.
6.1.2. Implementation of PI Controller
The steps that were necessary to incorporate the PID block within the Simulink environment are elaborated in this section. A switch which closed the control loop was implemented before the PID block. This was done to replicate the production environment where the manufacturing line would be run in open loop during startup to allow for parameters to reach steady state before the controller is switched on. The signal from the switch is sent to the simulated plant and to the TR (signal tracking) slot on the PID block. During open loop operation, the signal received by the TR port serves to cancel out any action taken by the controller during this period. The output of the PID is constrained according to the required control strategy. The anti-windup method is set to back-calculation. This is done to avoid the saturation of the integral action when the output of the controller is constrained. It is important to note the PID block in Simulink uses , and parameters, which need to be converted from the traditional , and parameters calculated through the tuning method described in Section 6.1.1.
6.2. MPC
6.2.1. Tuning Procedure
The MPC makes use of an available process model to make predictions of future states of the system. An important facet of this process is the generation of a plant model that represents the process behavior accurately within the operational range. The process of developing a controller model for the implementation on the developed tablet press model is unique and can be summarized as follows.
The two main critical process parameters, pre-compression force and main compression force, used as controlled variables are nonlinear in nature and this nonlinearity is characterized by the gain of the system as described in Section 4.3. To be able to control this using a linear MPC, it is required to develop a linear model for the same. It is observed that on differentiating Equation (4), with respect to the ratio at a specific value, one arrives at the gain of the system at that operational point (Equation (8)).
where is the desired value of ratio and is the gain of the system.
Subsequently, this gain can be used with the previously regressed time constants to arrive at a linearized model of the system at a specific value of ratio. The nonlinear model is then replaced by this linear model and the order of the Pade approximation for all the time delay blocks are set to 30. The inbuilt MPC controller design feature is then used to generate a model. In this case, we proceed by saving the model in the Matlab workspace. The nonlinear model that originally existed is put back into place and the generated MPC model is then loaded into the controller. Once the nominal values of the inputs and outputs are defined, the controller is tuned. During tuning the values of control horizon, prediction horizon, penalty on move and penalty on error are defined. Through controller testing it was found that this method worked well but an offset in the final value persisted. This problem was resolved by incorporating an integrated white noise output disturbance model to the controller. Table 4 presents the tuning parameters for the MPC controllers used in this work.
6.2.2. Implementation of MPC
Some key configurations were necessary to incorporate into the MPC block within the Simulink environment. A switch was implemented on the MPC block for the same as reason as in the case of the PI controller. In this case, the switch signal is sent to the MPC block through the mv target slot. The Time delay blocks were approximated internally by the choosing a high value of 30 of the Pade order. This is so done because the model generation feature is not capable of dealing with nonlinearities. The Pade approximation linearizes the exponential time delay function.
7. Results
This section elaborates on the application of the developed model to the design of control systems. This simulation environment provides flexibility in terms of the different control strategies that can be implemented, the speed to experimentation and the lack of any material needs. First, control algorithms are compared in order to determine the best alternative. Then the selected control algorithm is used in the implementation of various strategies. Individual characteristics of the strategies are then discussed in order to guide the selection of the best control strategy of a given system.
7.1. Control Algorithm Performance Analysis
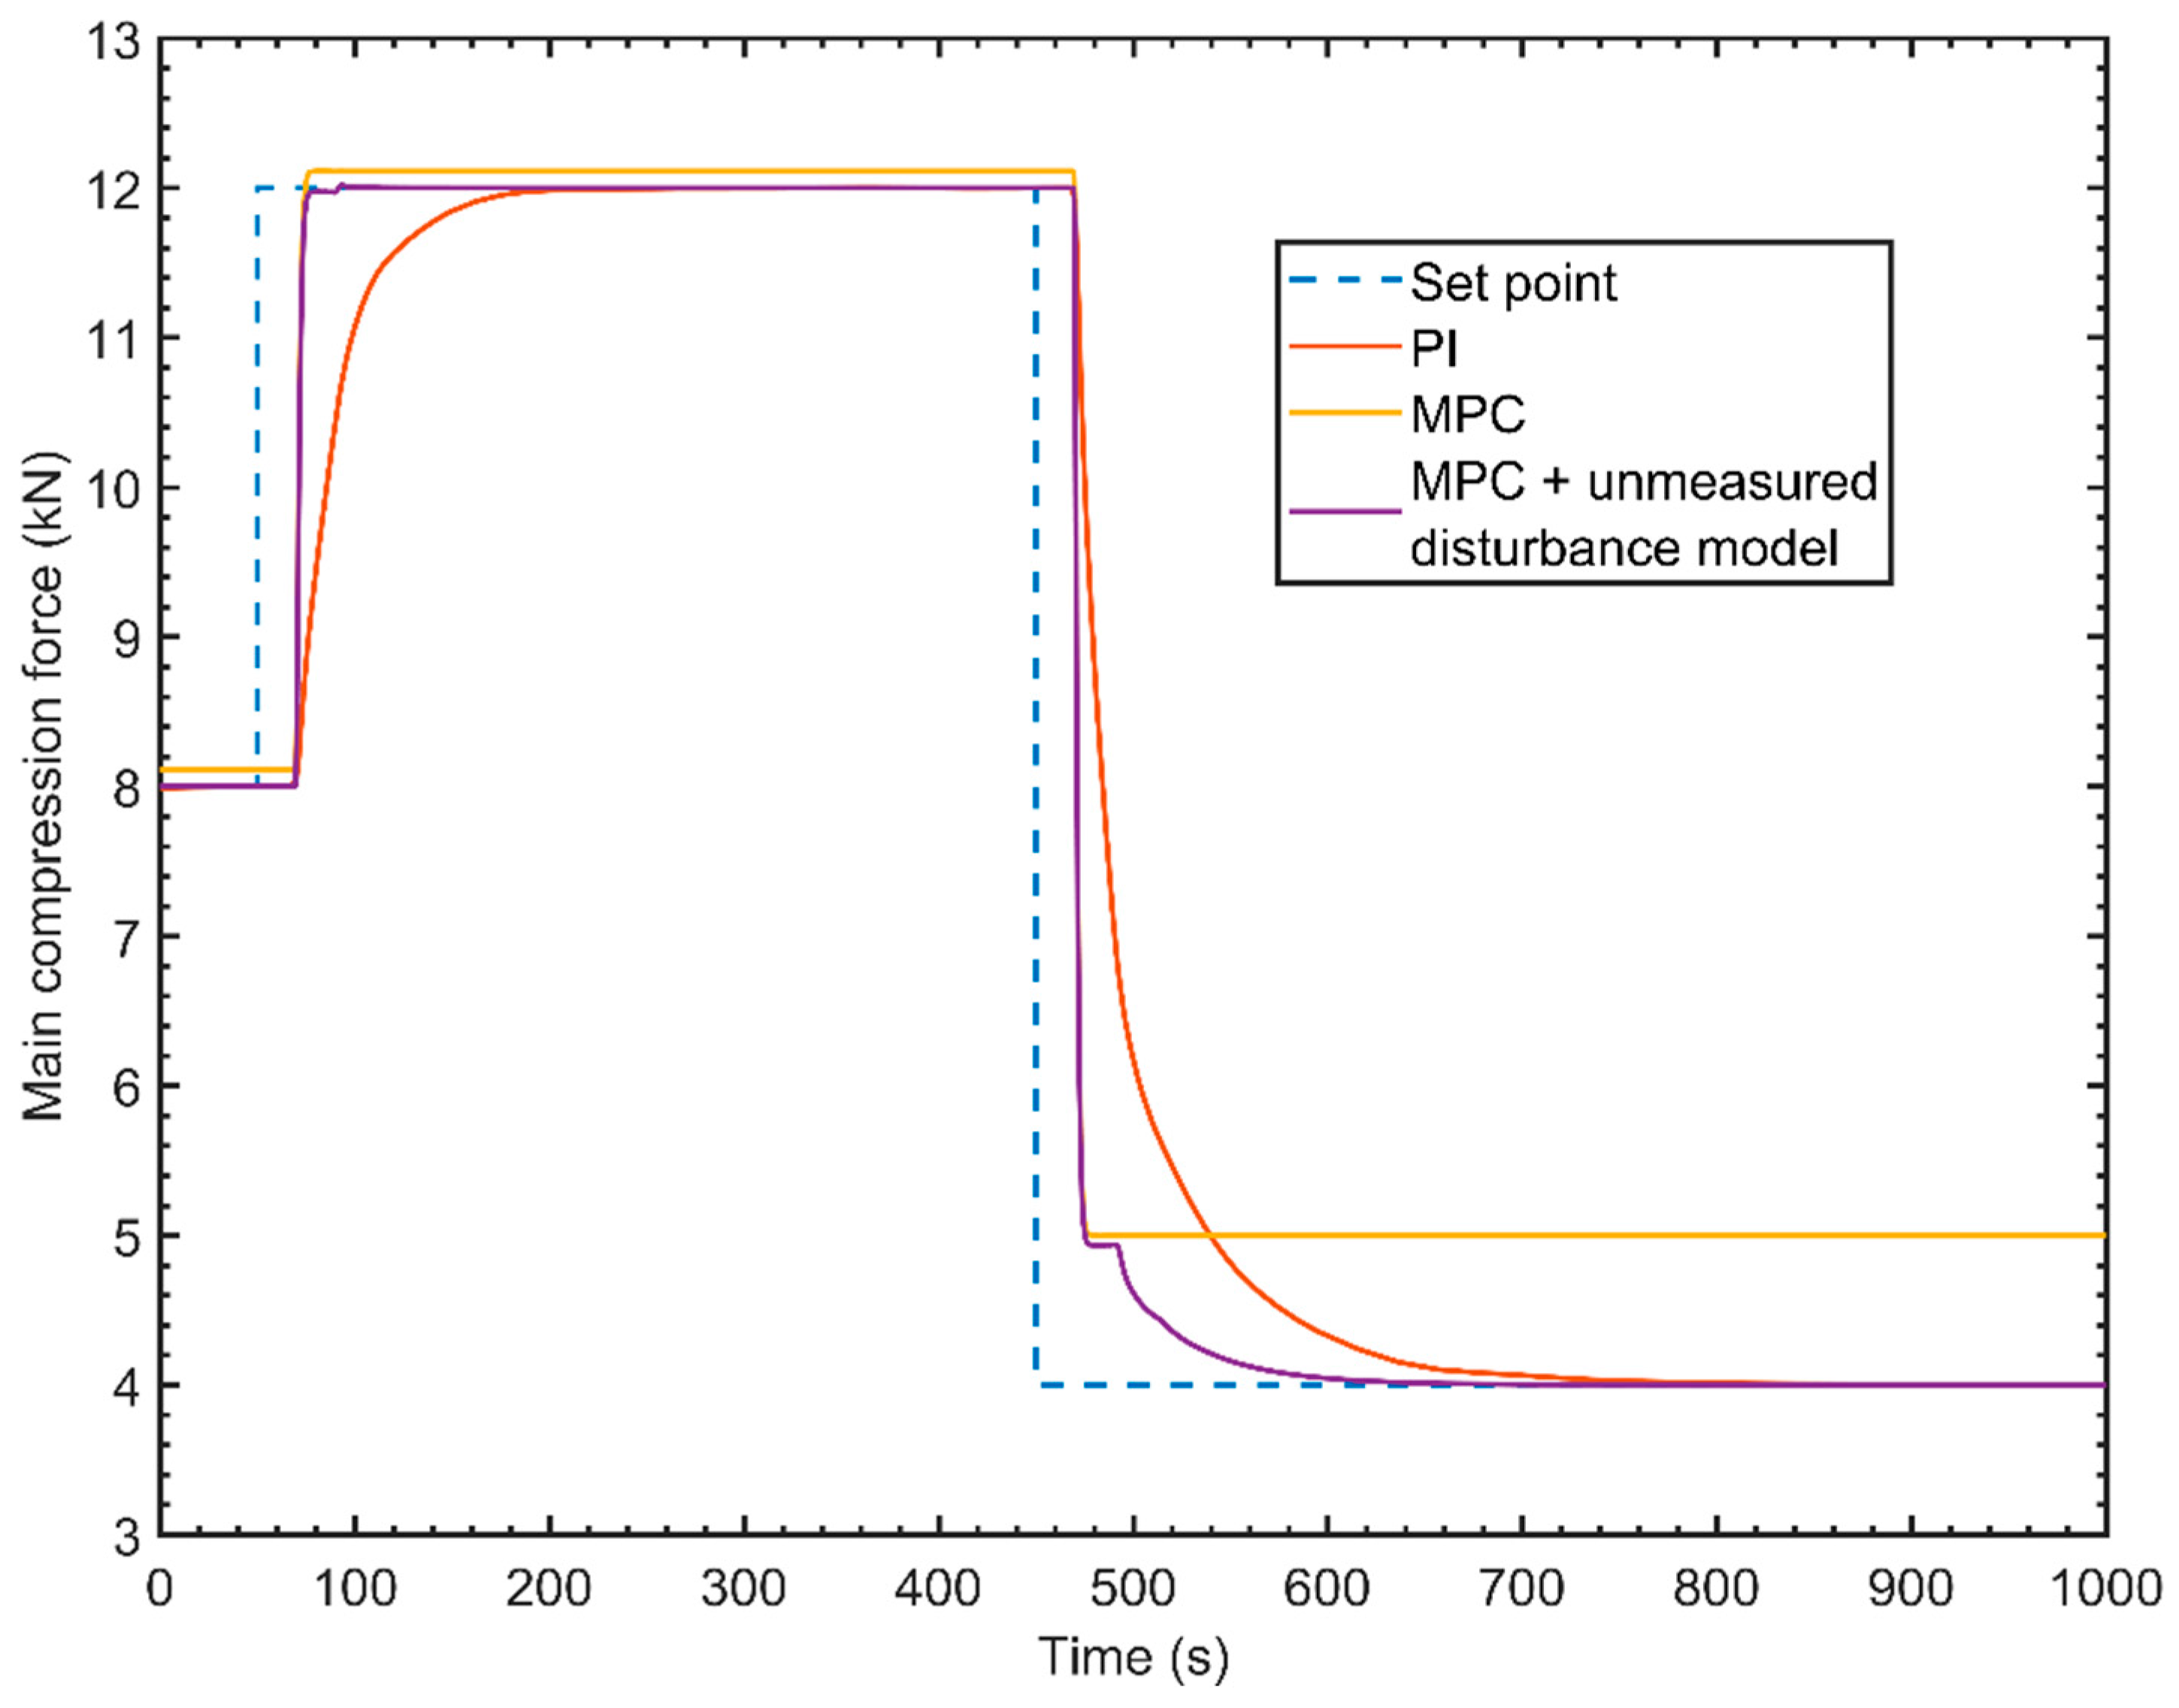
Two main compression force set point changes were applied to the system and its dynamic response was observed. The first step change was within the range at which the controllers were tuned and increased the MCF set point from 8 kN to 12 kN. The latter step change varied the MCF set point from 12 kN to 4 kN and was outside the range at which the controllers were tuned. The magnitude and range of the step changes were chosen in order to observe how linear controllers behave in different regions of a non-linear process.
Figure 9 shows the dynamic behavior of the different control algorithms in response to changes in the set point of the controlled variable.
From Figure 9, the percent overshoot and time to steady state are different for different step changes. This is expected since the linear controller are being implemented on a non-linear system. All three controllers presented a better performance when operated within the range at which they were tuned. A significant performance improvement can be noticed when an integrated white noise unmeasured disturbance model is added to the MPC controller. The unmeasured disturbance model can approximate mismatches between the linear MPC model and the non-linear behavior of the plant, eliminating the steady state error that is seen on the standard MPC controller. These mismatches become more significant as the set point moves away from the MPC ideal operational range. When a comparison between the PI controller and the MPC with unmeasured disturbance algorithms is made, the latter performs better than the former, giving a faster response with less overshoot.
The simulated experiments conducted using the model were replicated in pilot plant using the PI and MPC control algorithms available in the control platform (DeltaV). For this comparison, only the first step change was considered. Figure 10 shows both experimental and simulated results.
The superiority of MPC over the PI algorithm can also be seen in the experiments. A slight difference between the simulated and experimental results for similar control algorithms can be noticed in Figure 10. This difference is expected, since the controllers used in the experiments had a different tuning than the simulated controllers. The simulation environment allows for a better performing tuning to be achieved since there is no cost involved in iterating over different tuning parameters in order to find the optimal tuning.
Table 5 presents performance metrics for both simulated and experimental control algorithms. The MPC control algorithm will be used in all the following simulations conducted in this paper, since it is proven superior when compared to a PI algorithm.
7.2. Control Strategy Evaluation
7.2.1. Strategy 1—Simultaneous Control of Pre- and Main Compression Forces
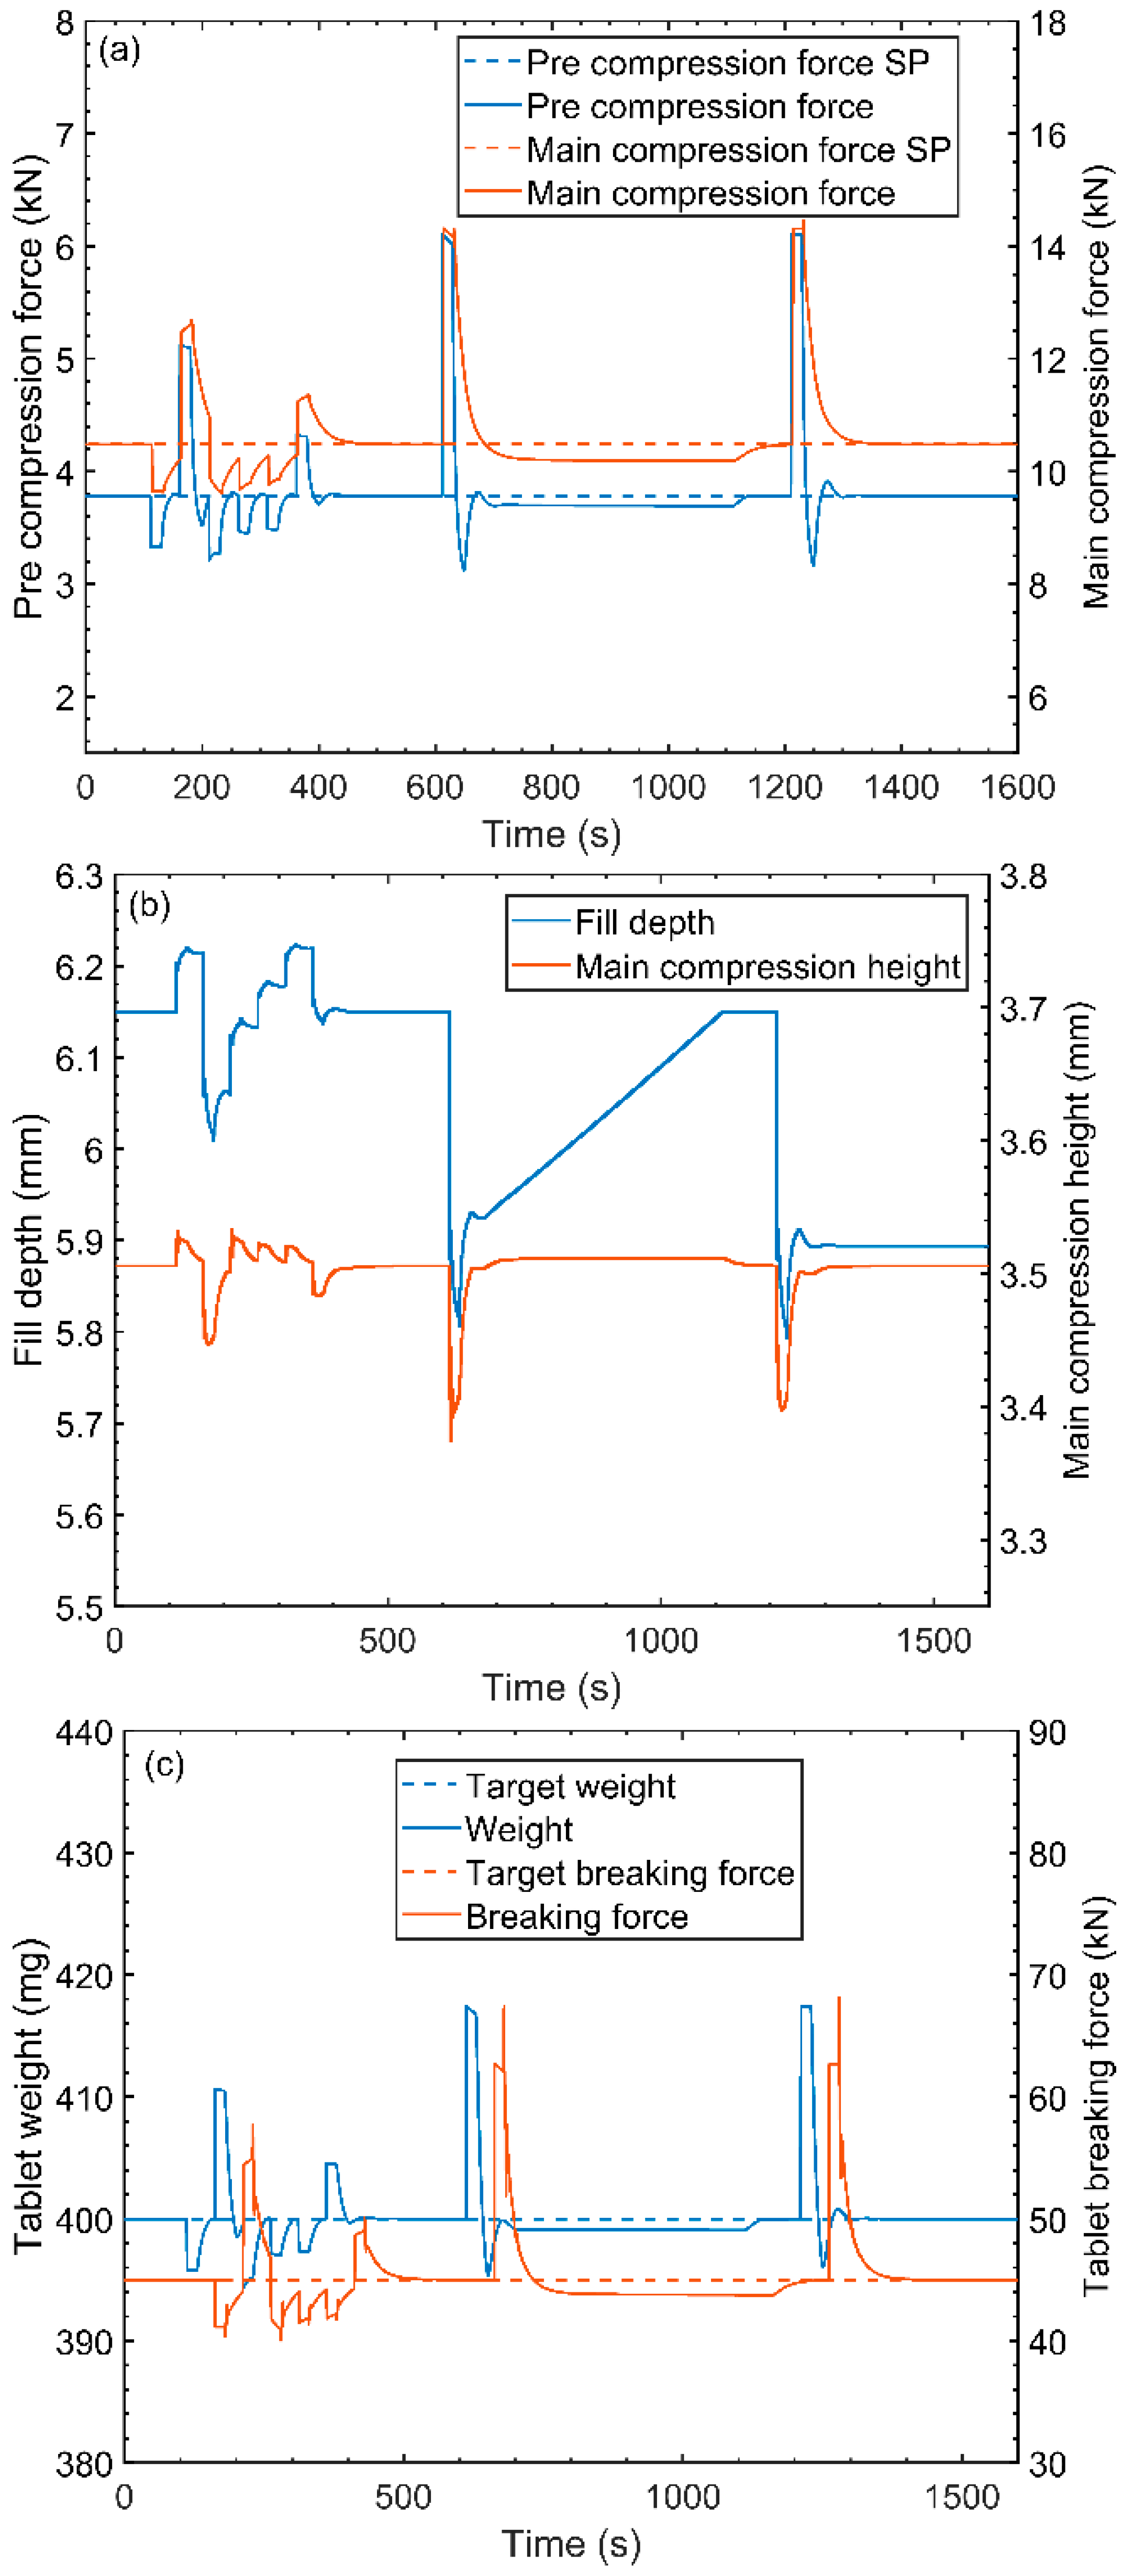
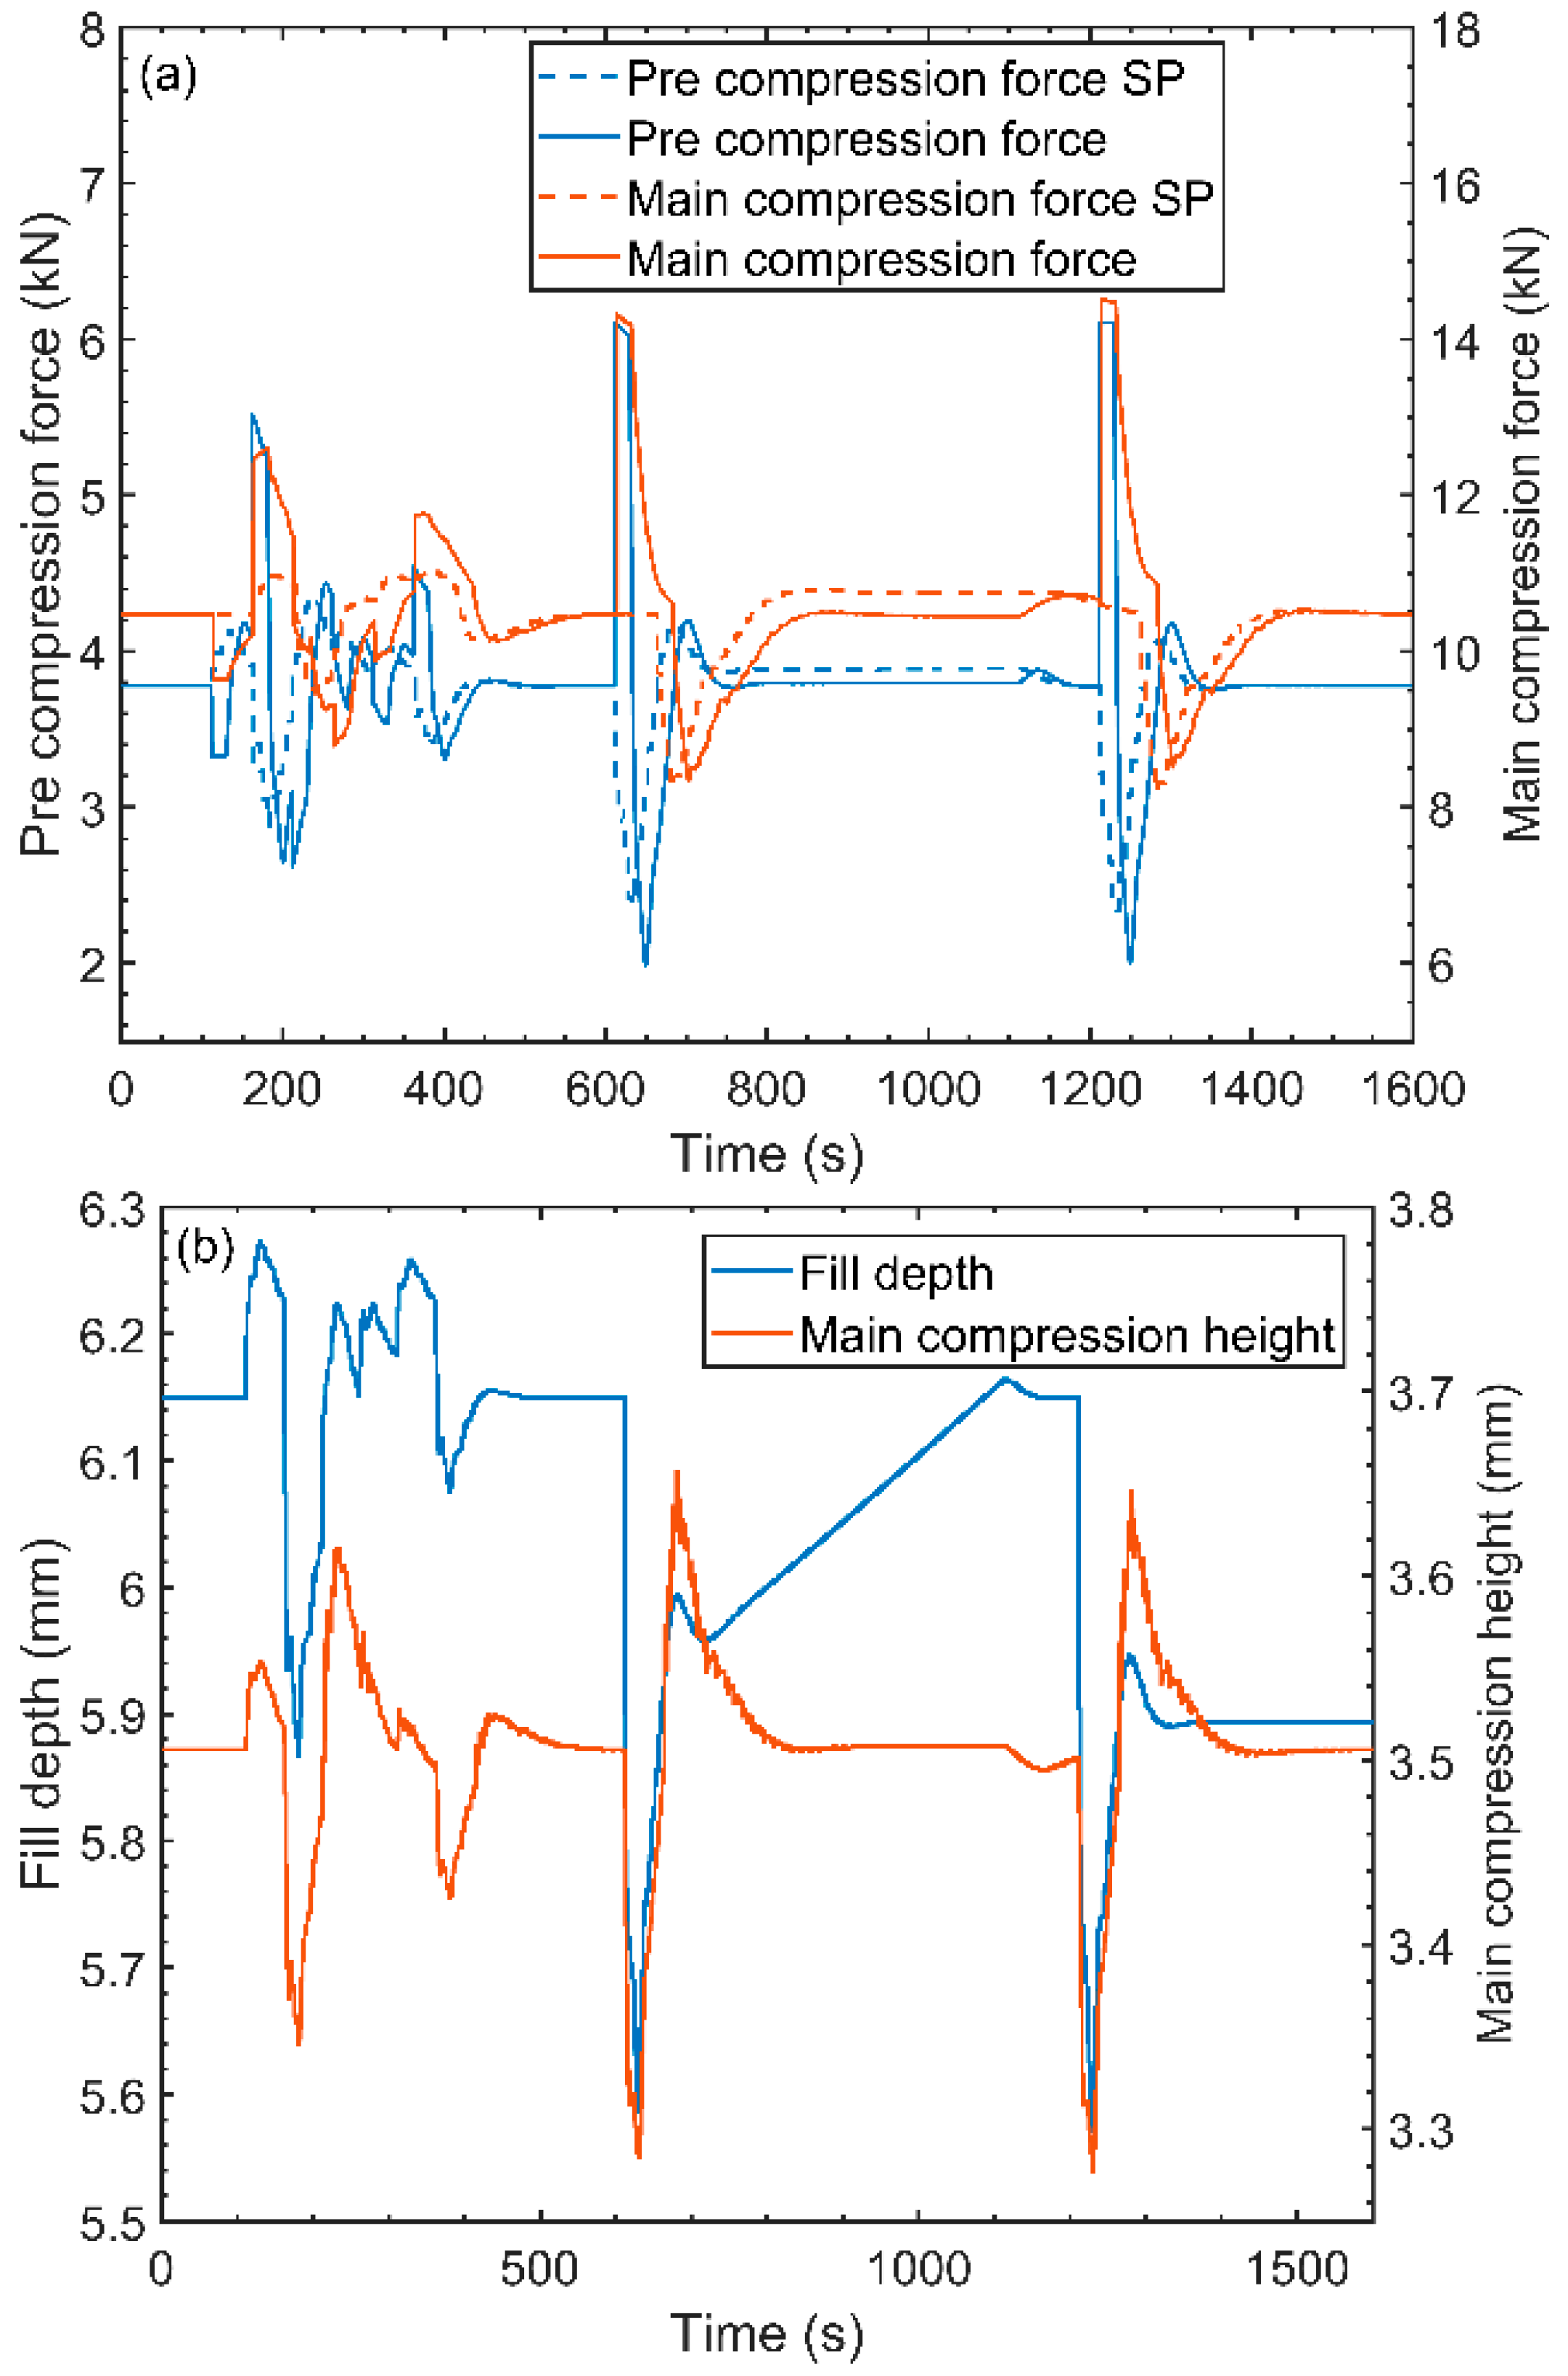
Figure 11a shows the dynamic response of the simulated system when set point changes are applied to both compression forces. The actuation signals are shown in Figure 11b. The implemented controller enables both variables to successfully track their respective set points. As expected, changes in main compression force set point have no effect on pre-compression force, since the main compression height (MCF actuator) does not interact with the pre-compression force. In an open loop scenario, manipulations in fill depth (PCF actuator) would lead to large variations in both forces. However, when the controller is on, changes in pre-compression force set point, which cause an actuation on fill depth, generate only a small deviation in main compression force. This occurs because the controller takes preventive actions on main compression height to mitigate the effect that fill depth changes have on main compression force. This indicates that the controller internal model is able to capture the interactions between manipulated and controller variables.
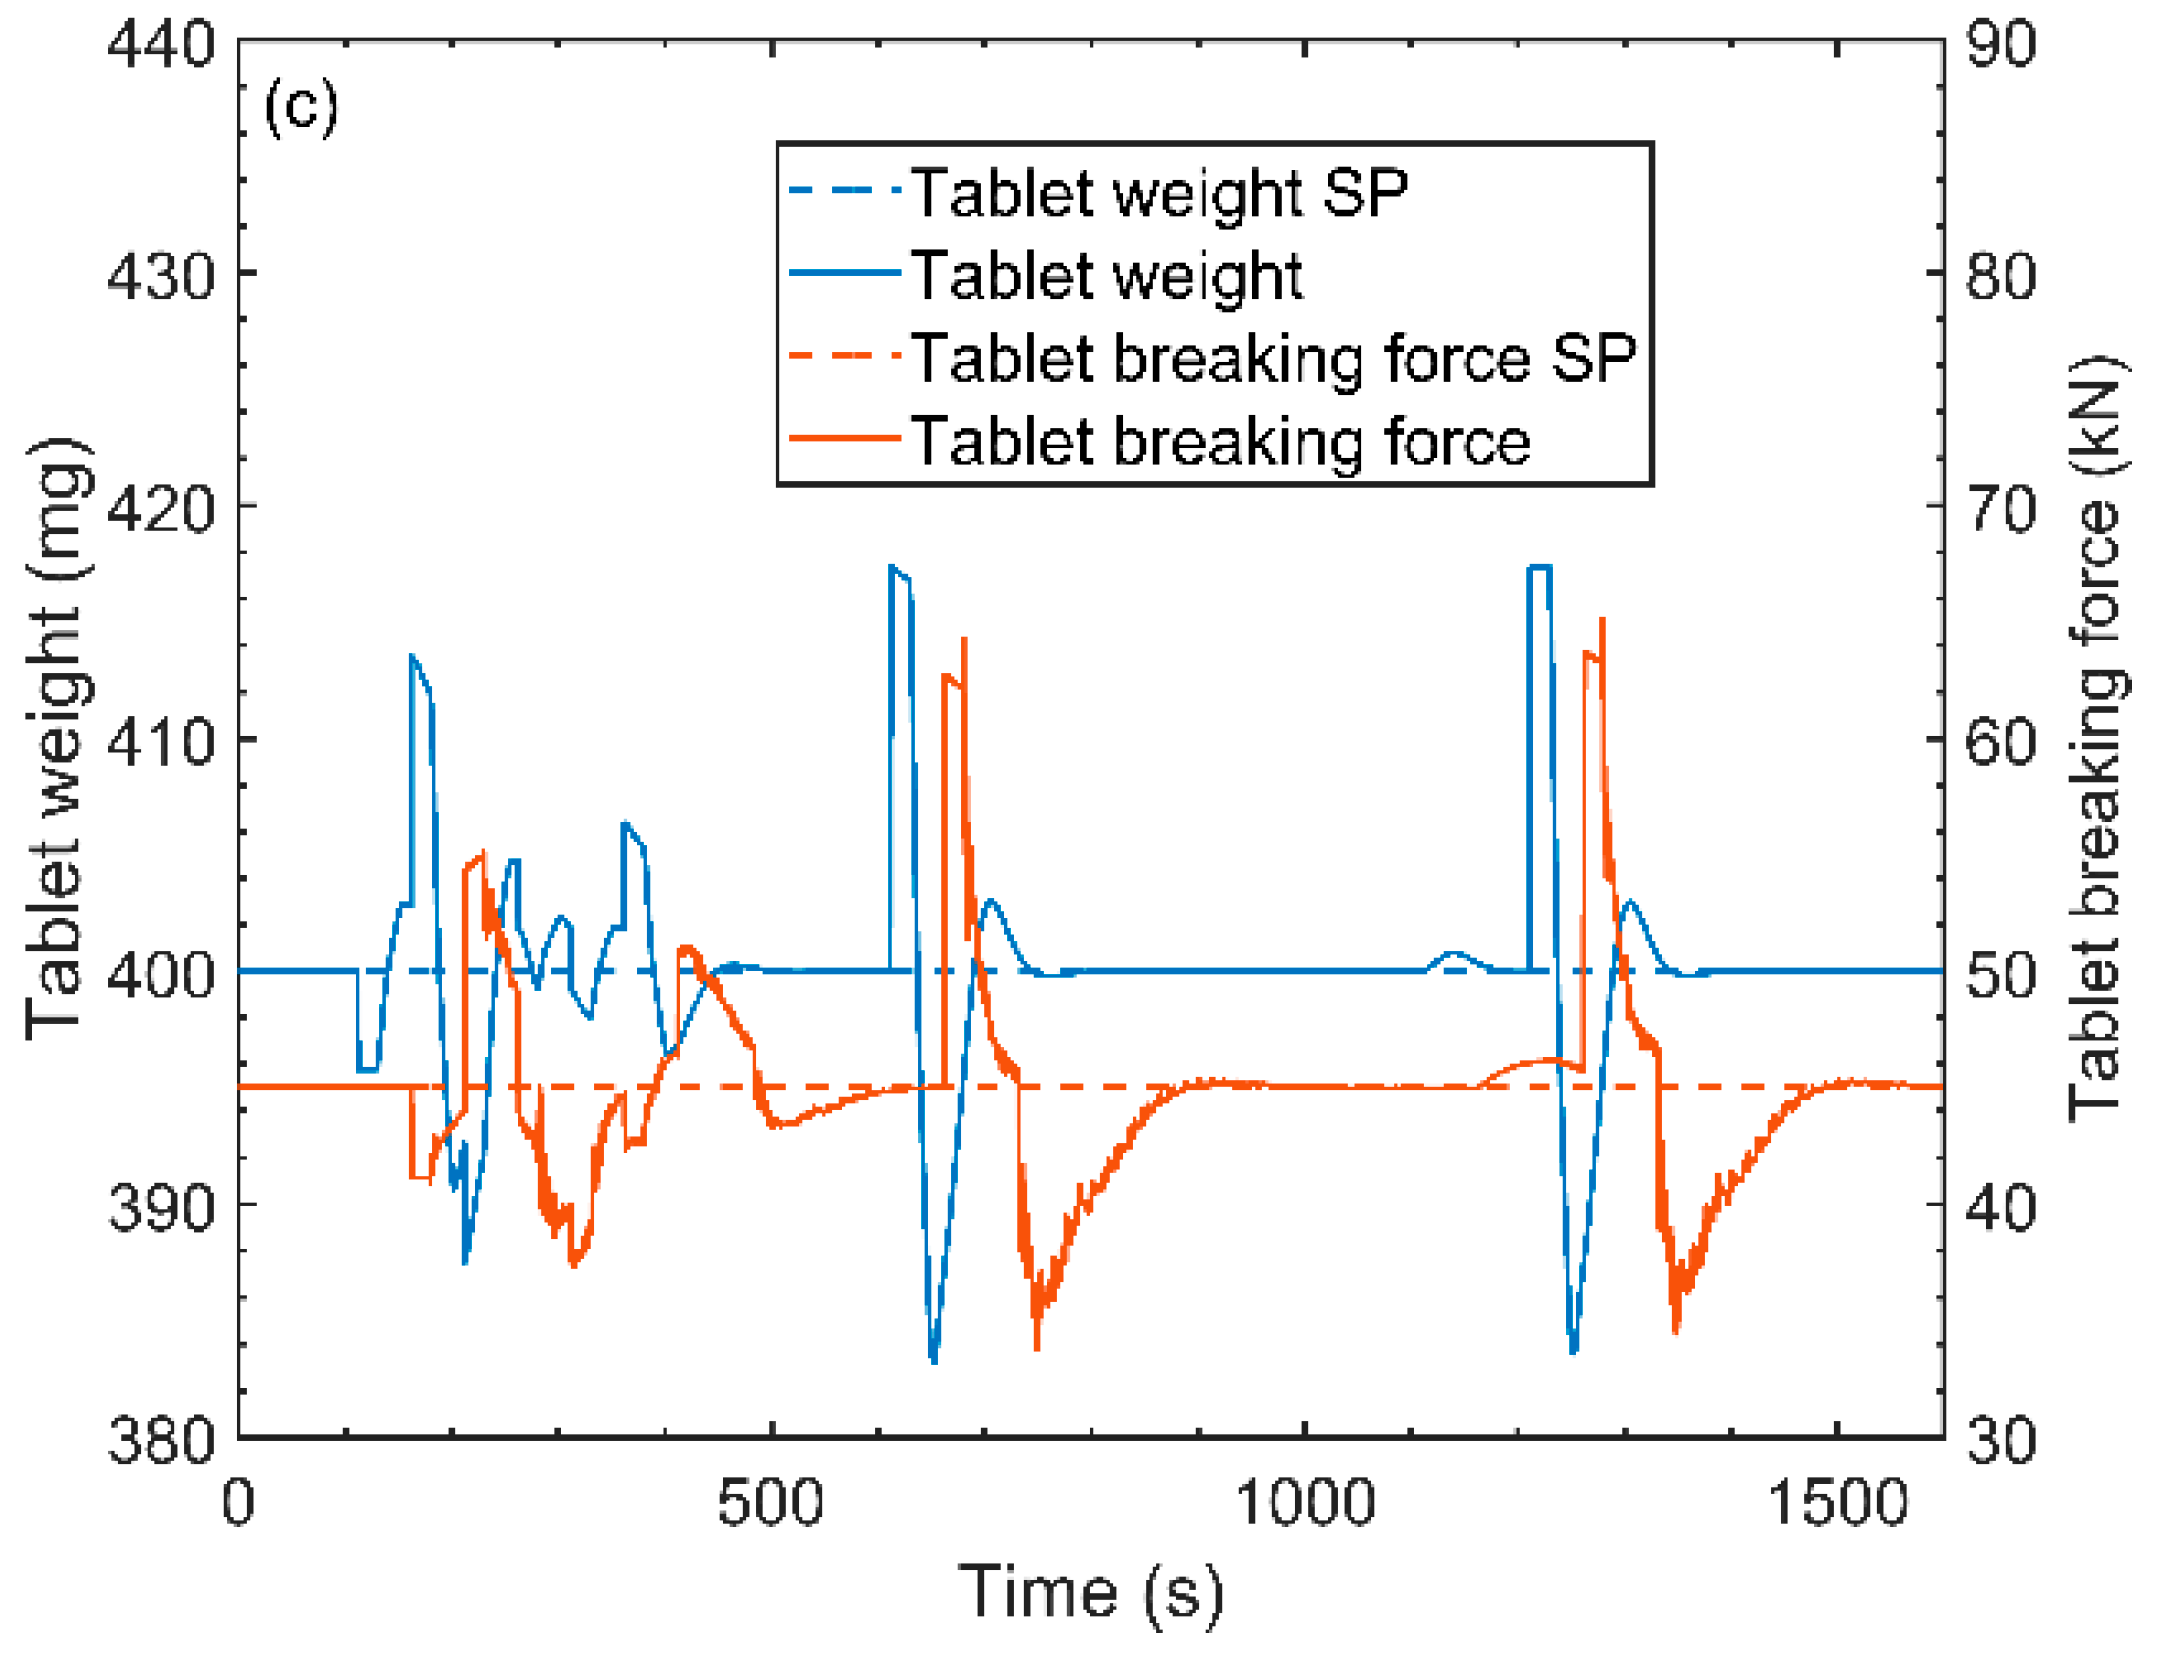
The effect that changes in the compression forces set points have on tablet weight and breaking force is shown in Figure 11c. Understanding the interaction between compression forces and tablet CQAs is necessary in order to achieve indirect control over them. No cross interaction between tablet weight and main compression force as well as tablet breaking force and pre-compression force is seen on the image, which indicates that tablet CQAs can be indirectly and independently controlled through the compression forces’ set points. These set points can be determined manually by the operator or remotely by a supervisory controller, depending on the real-time data availability for tablet CQAs.
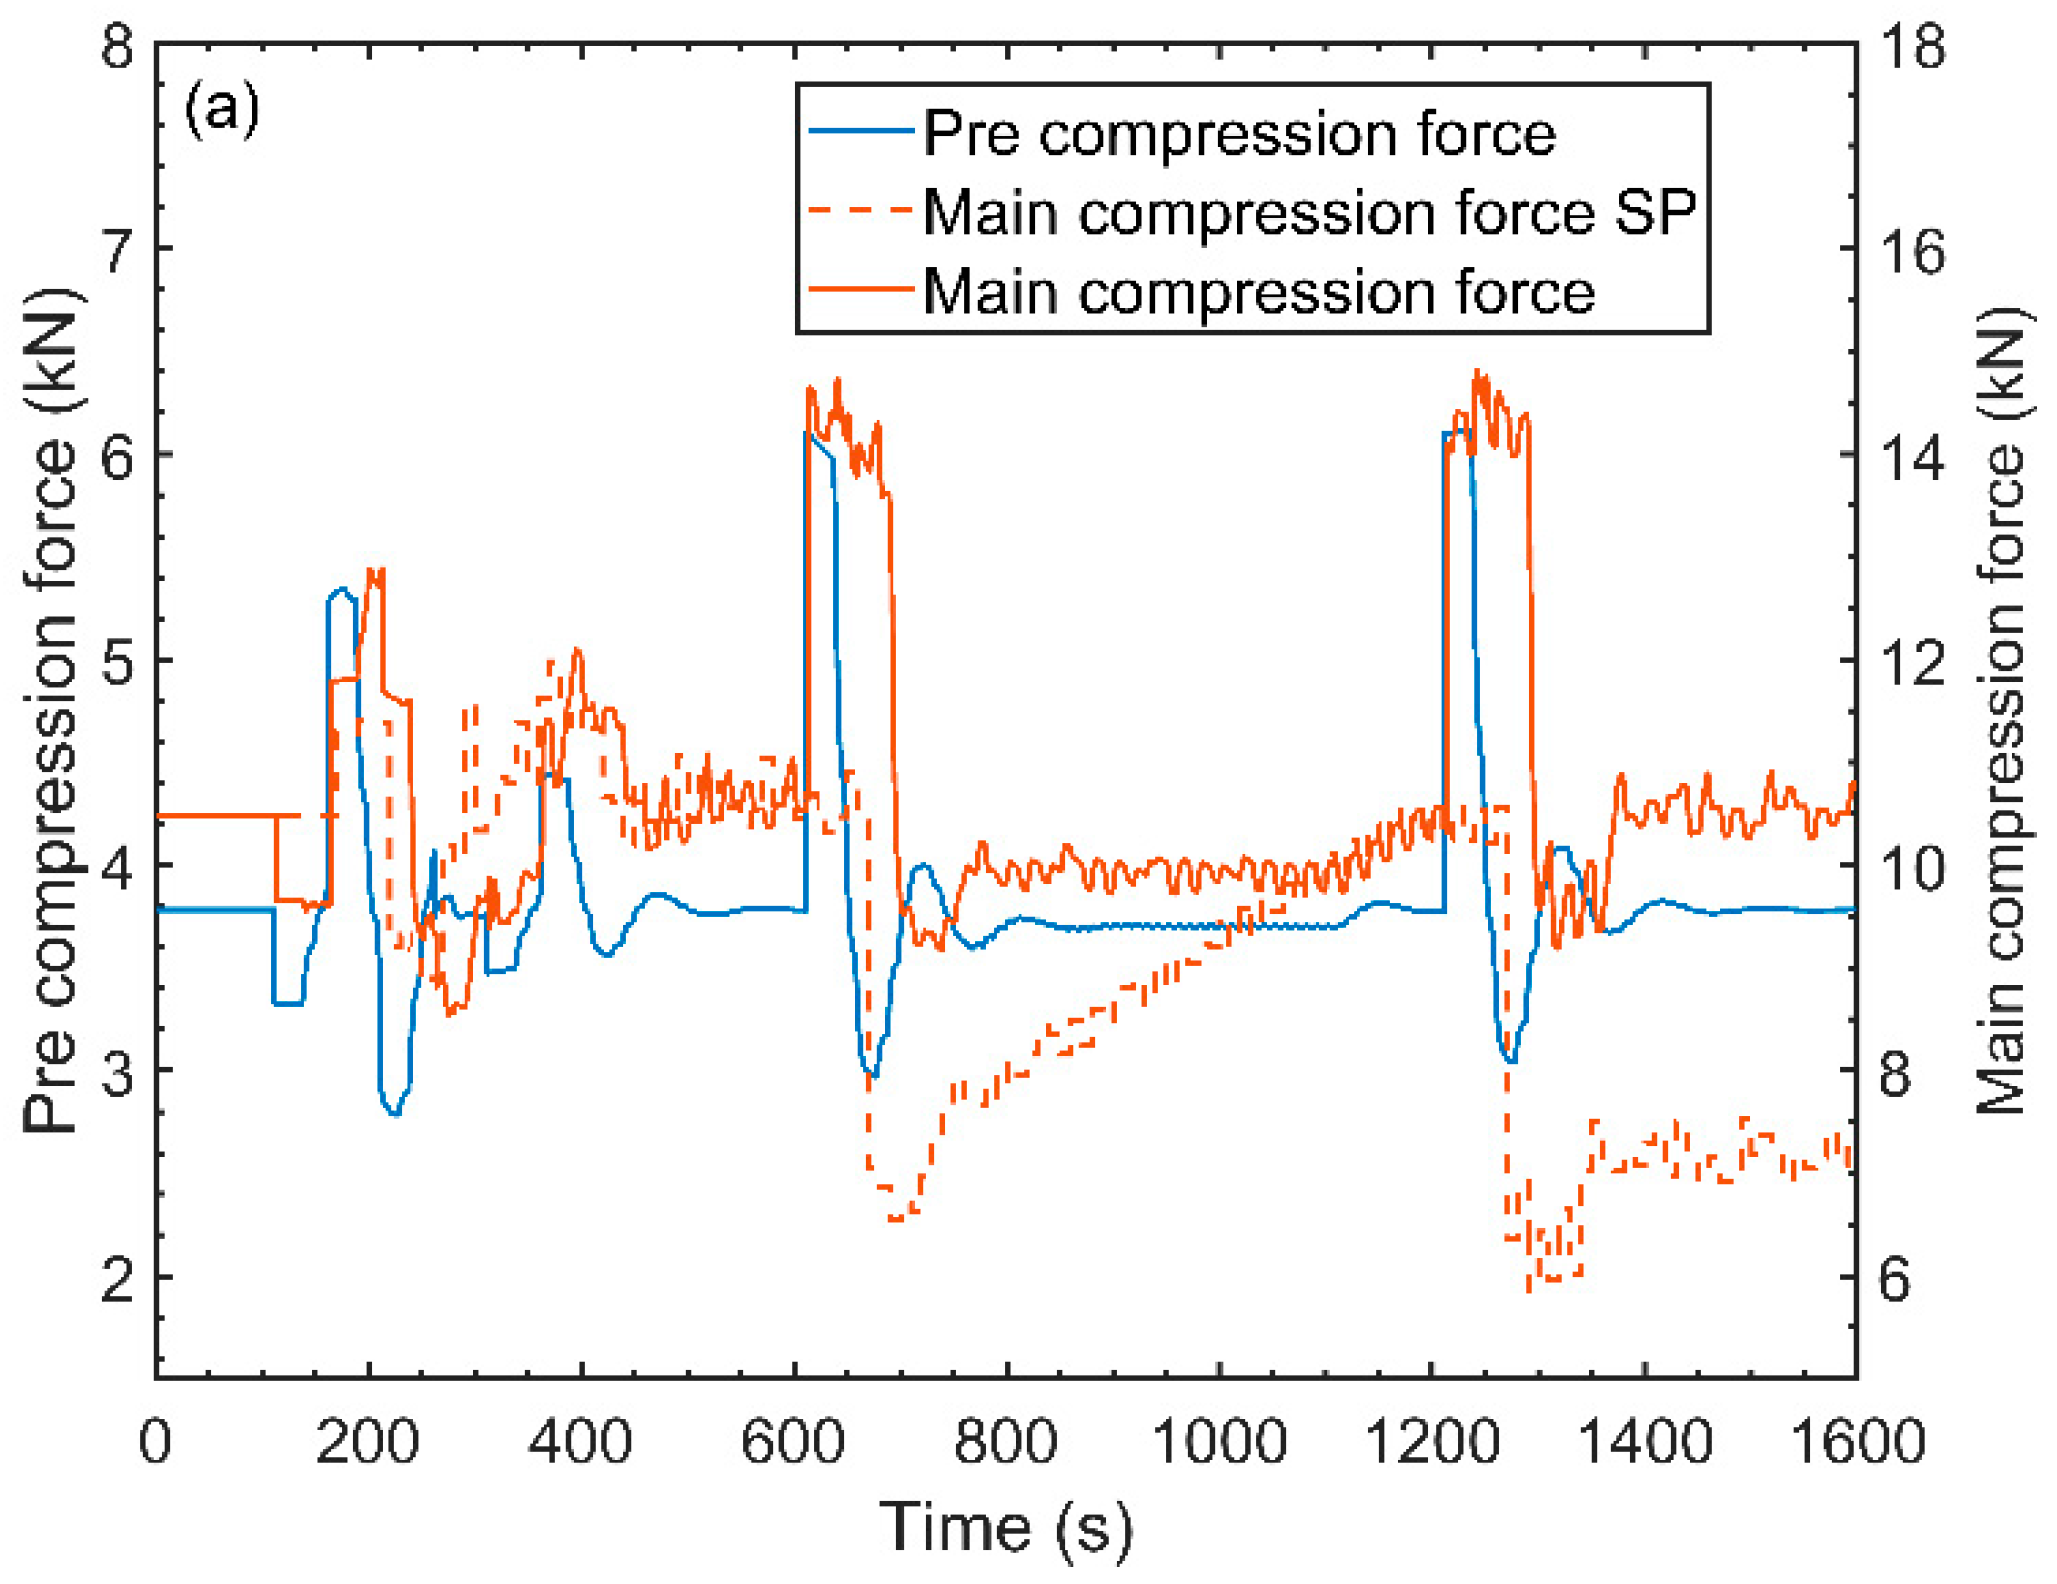
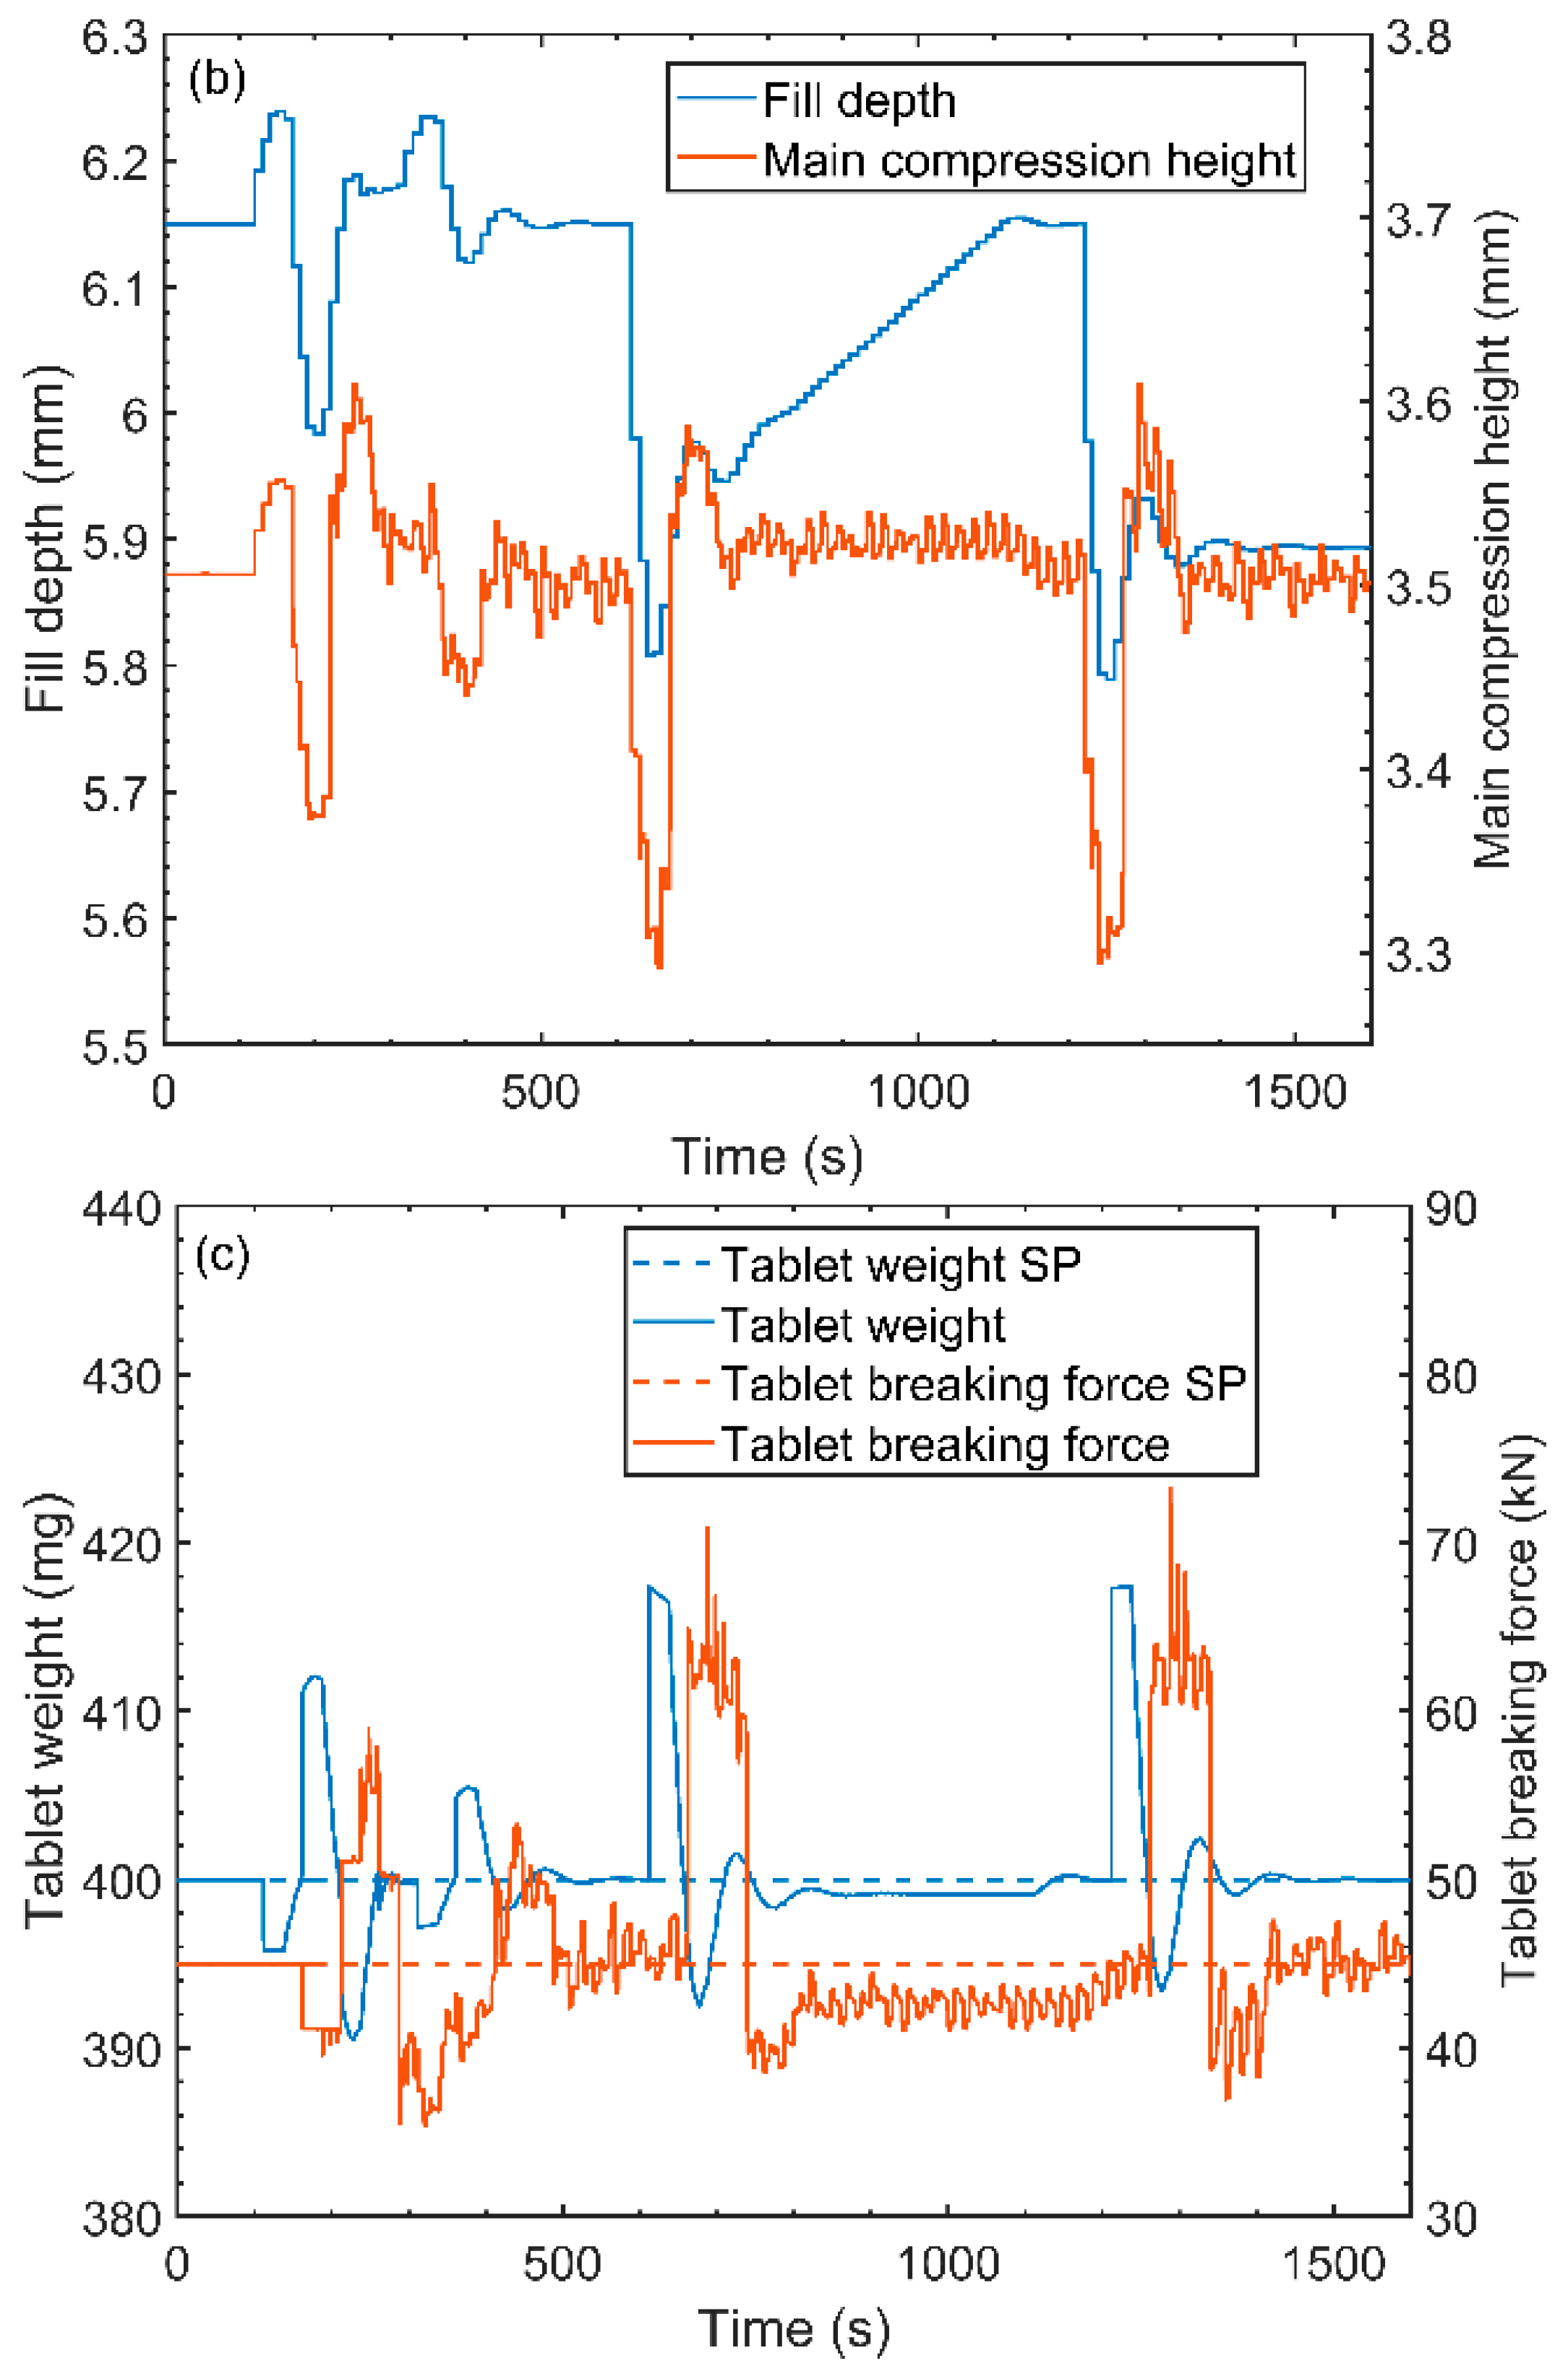
The system response to the disturbance rejection scenario is shown in Figure 12. When exposed to a white noise disturbance in density the controller takes action in order to bring the controlled variables back to their set points as seen in Figure 12a,b. The effect of the density variations is not fully mitigated by the controller due to the relatively high frequency of the white noise. A large oscillation followed by a steady state offset is observed when the system is submitted to a ramp like variation in density. The steady state offset is a characteristic response seen when ramp like disturbances are applied to systems with a MPC controller with an integrated white noise models [17]. A step change in density causes a large oscillation on the controlled variables, but this effect is compensated by the control system after approximately 100 s. Note that, a relatively high magnitude of disturbance has been introduced to evaluate the capability of the controller under extreme scenario. In practice, the magnitude of the disturbance will be relatively less and therefore the controller performance will be better.
The main advantage of this strategy is the fact that it does not require the use of online real-time sensors for tablet weight and breaking force, since these critical quality attributes are controlled indirectly through the compression forces. Another advantage of this strategy is its relatively fast response time when compared to strategies that involve a cascade arrangement of controllers. A major disadvantage of this control strategy is the fact that it requires a relationship between the compression force and tablet CQAs to be established experimentally during the setup of the system. In order to avoid tablet defects such as capping, it is necessary to tune the controller at the adequate pre-compression force and tablet weight ranges. The relation between the pre-compression force and tablet weight ranges can be manipulated by changing the pre-compression height at which the tablet press operates. It is important to note that the controller model should be regenerated whenever changes in pre-compression height are made. A few specific disturbances such as fluctuations in lubricant concentration may also cause the relation between main compression force and tablet breaking force to shift, leading to fluctuations in tablet breaking force which cannot be mitigated by this control strategy. The best way to avoid these fluctuations is by ensuring control of the blend composition, as proposed by Singh et al. [30].
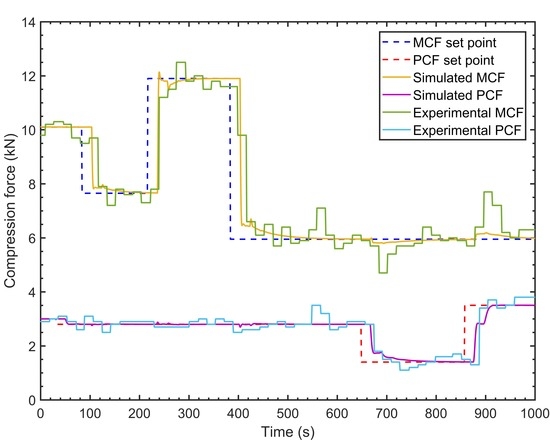
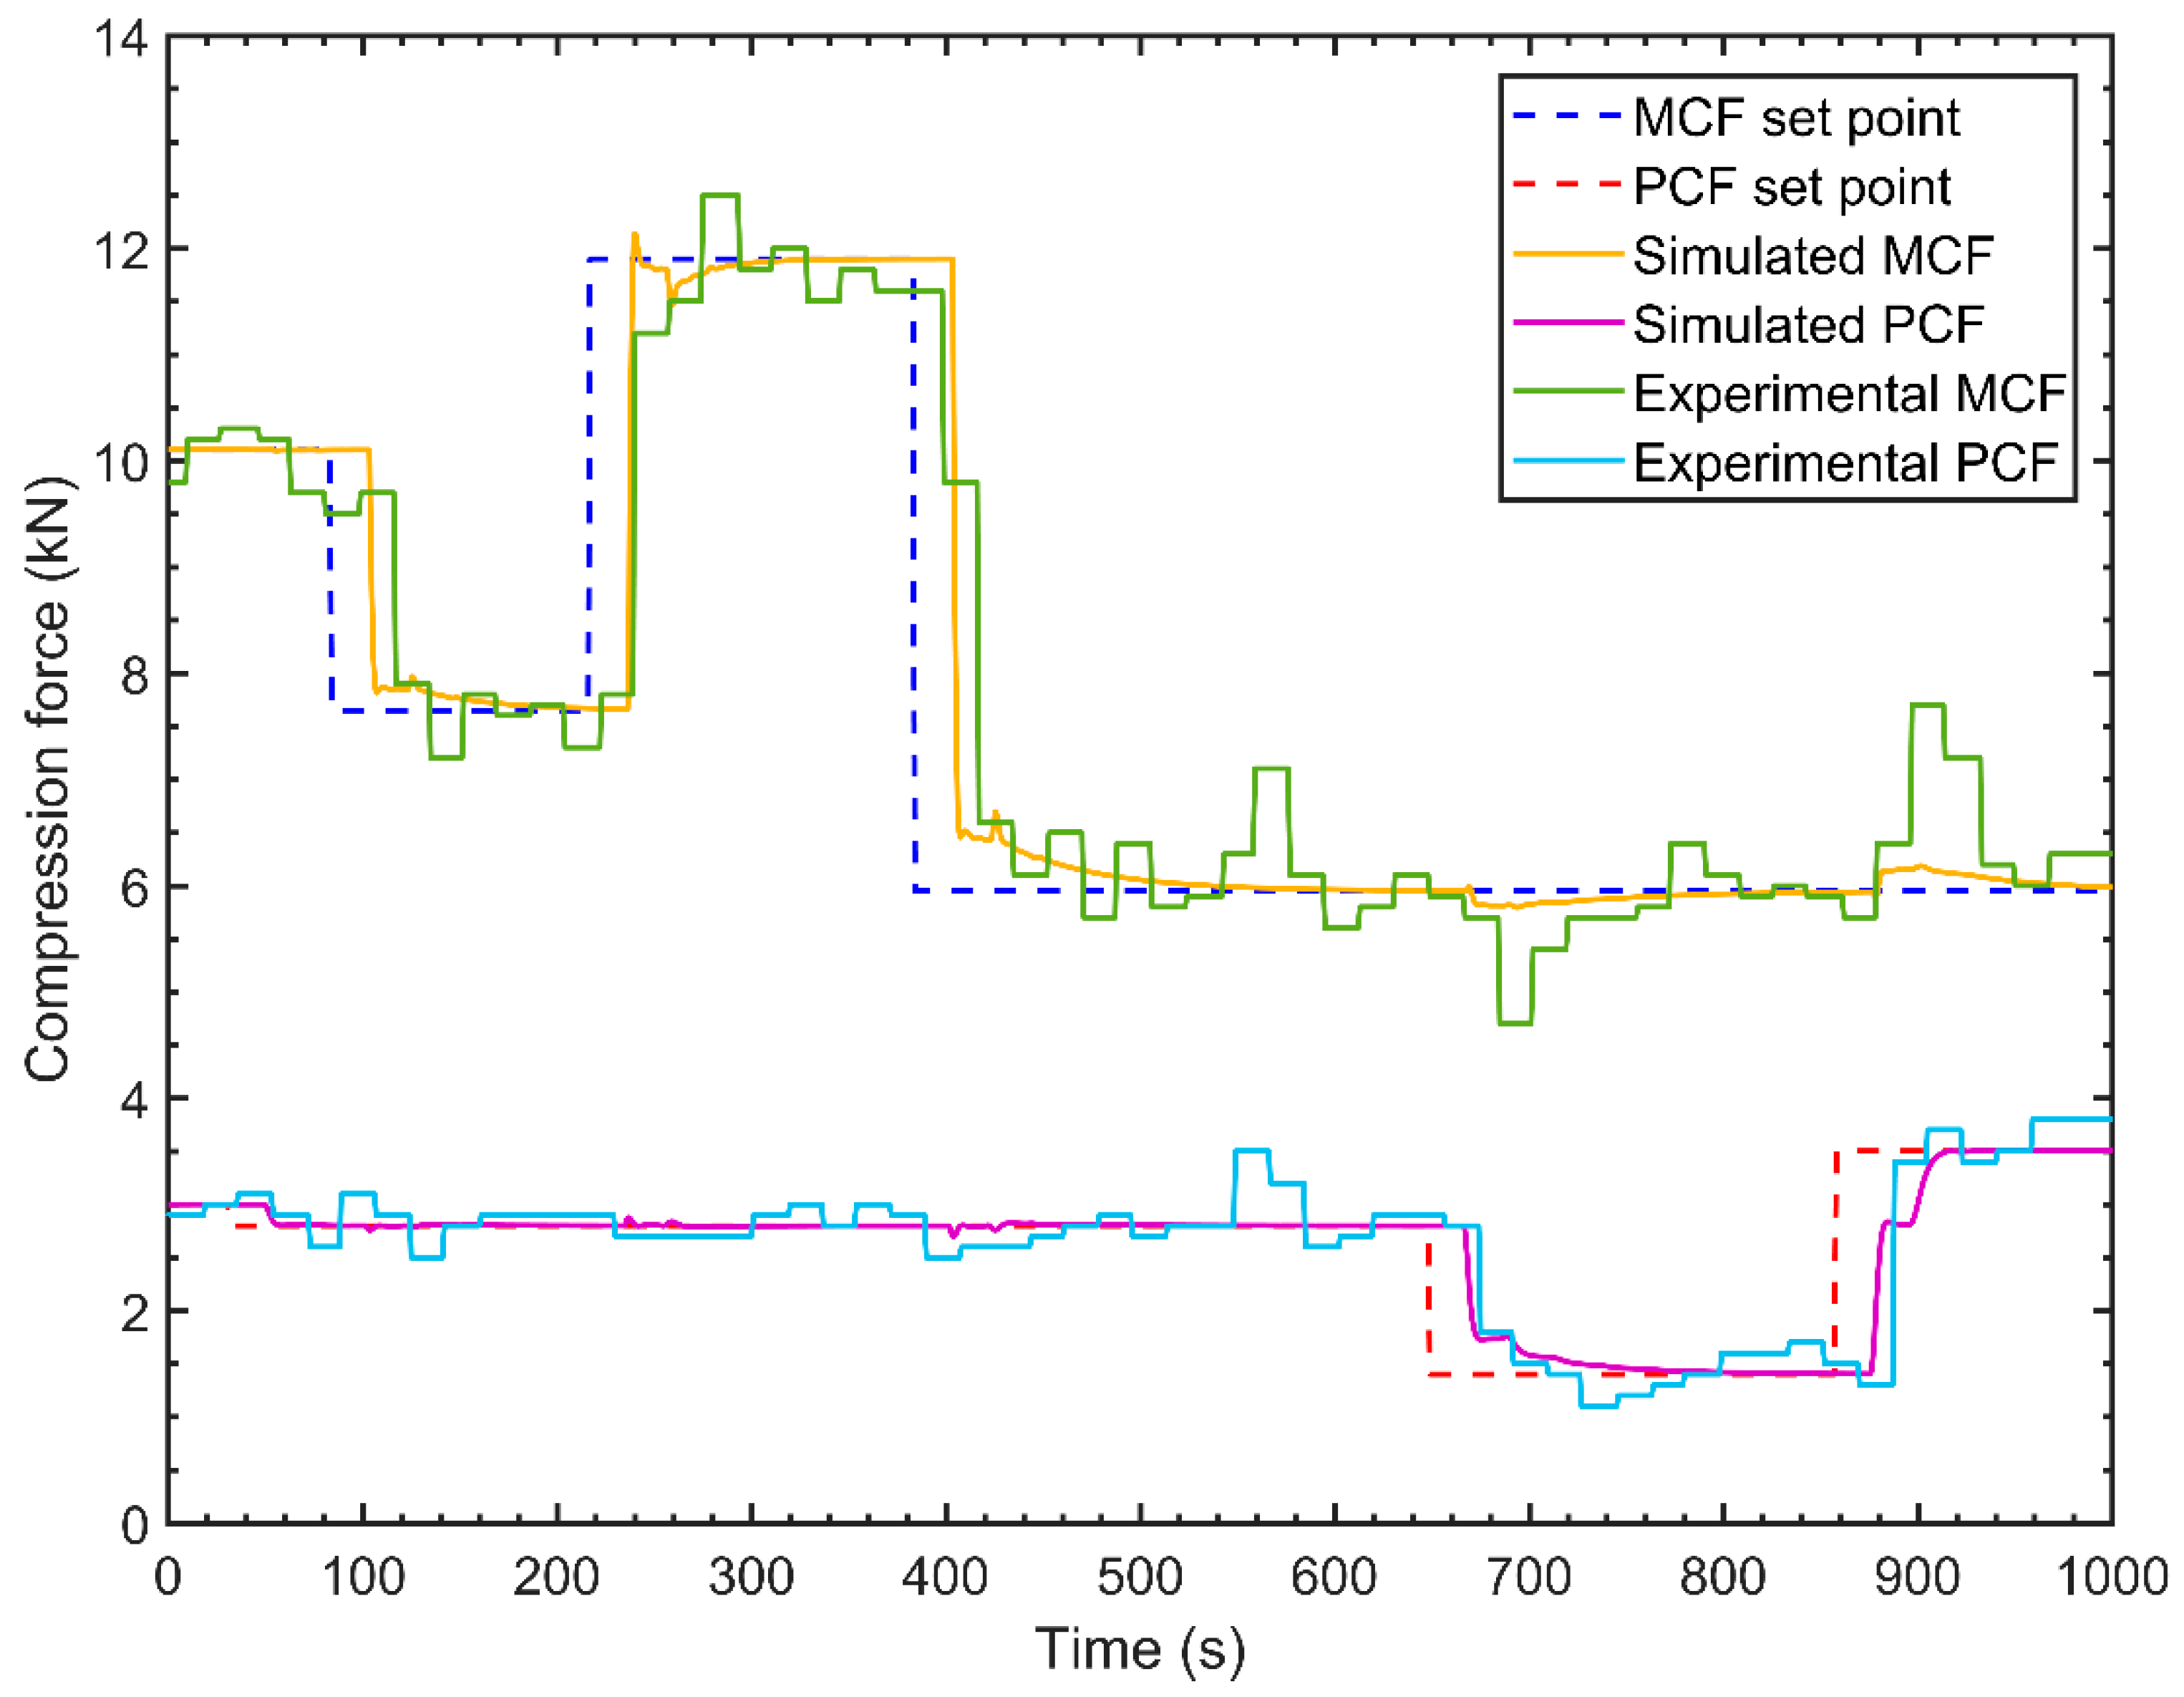
This control strategy has also been implemented in the pilot-plant for comparison with the simulation results. The effect that changes in the compression force set points have on tablet weight and breaking force was studied using only the simulation tool, since no experimental dynamic data could be obtained for those variables. The comparison is shown in Figure 13. Experimental results match the simulations, demonstrating the capabilities of the developed model for control system design.
7.2.2. Strategy 2—Cascade Control of Weight and Breaking Force
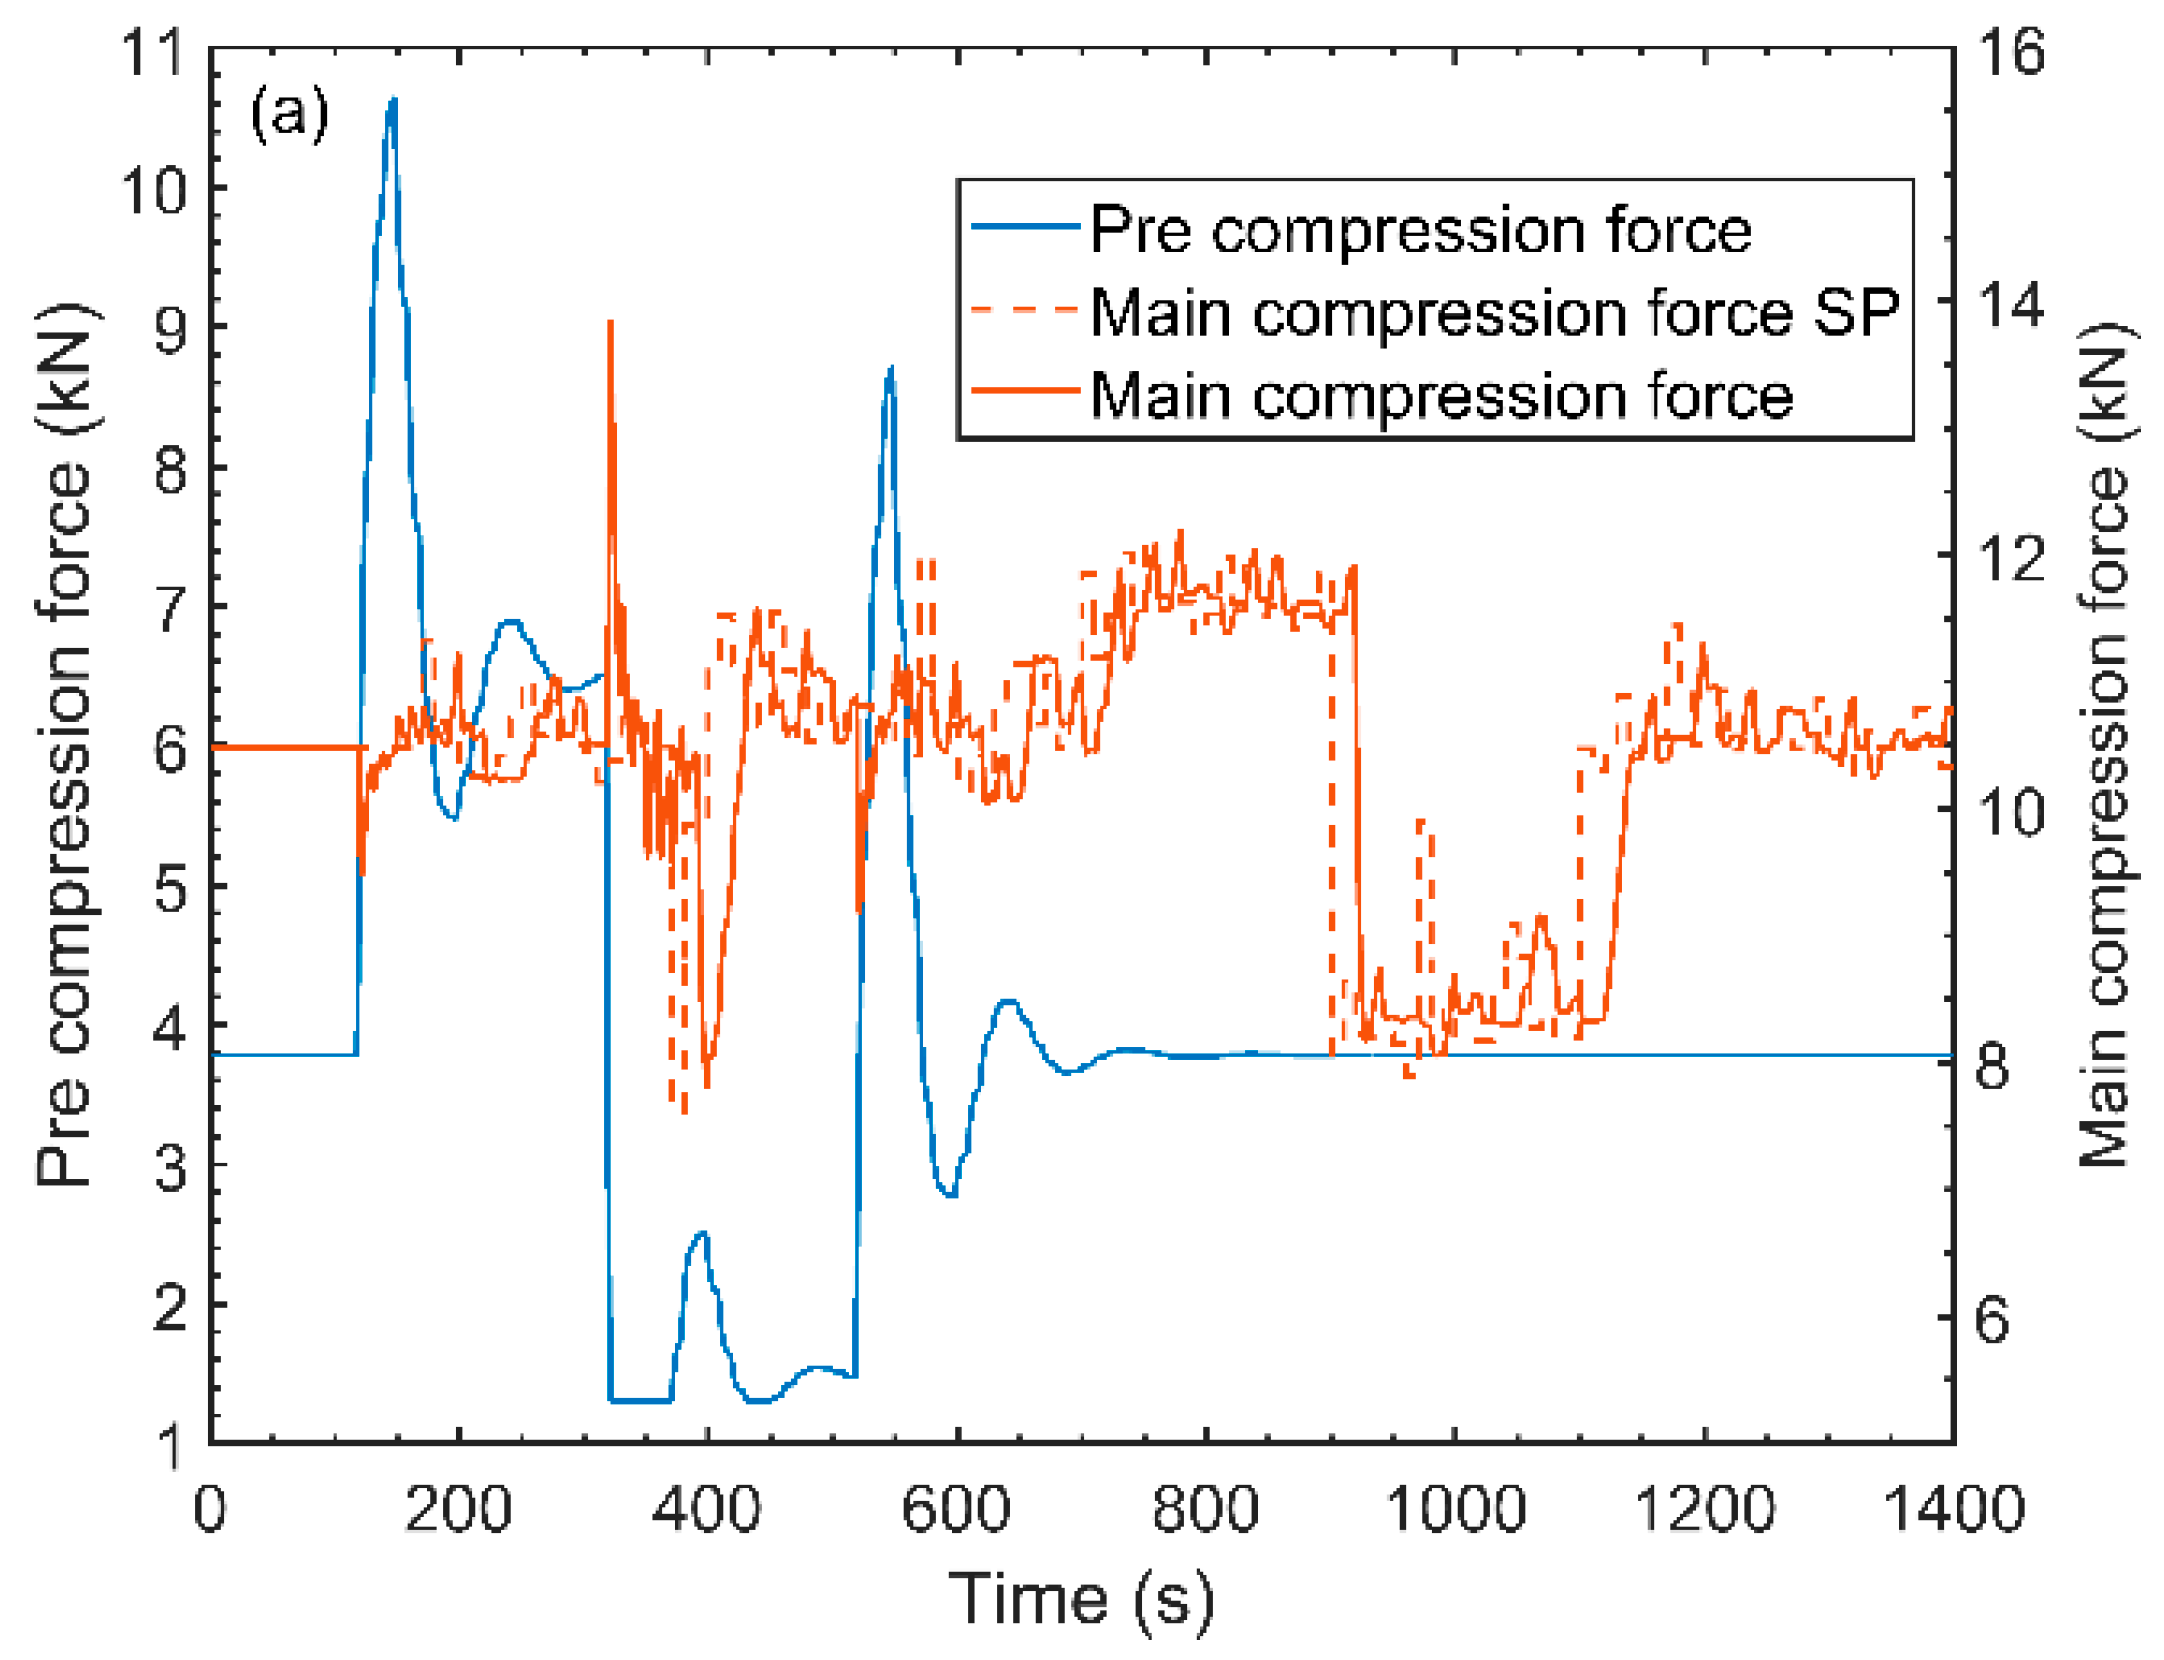
The dynamic response of the simulated system under a set point tracking scenario is shown in Figure 14. Both tablet weight and tablet breaking force are able to successfully track their set points by actuating on the compression forces. Oscillations are observed in the first and second tablet weight set point changes. These oscillations are also present in pre-compression force and can be explained by a model mismatch in the pre-compression force model due to the non-linear behavior of this variable, which becomes more pronounced as it moves away from the operating point at which the controller was tuned. Spikes in tablet breaking force are seen in Figure 14a as a response to changes in the CQAs set points. These spikes can be avoided by limiting the maximum rate of change of the manipulated variables of the slave controller.
The system’s reaction to a disturbance rejection scenario with changes in density is similar to what was observed for control strategy 1 and is shown in Figure 15. The main difference between the two strategies evident when a ramp disturbance is applied to density. Differently than what is seen in strategy 1, no offset between the CQAs set points and actual values are observed in strategy 2. This occurs because integrator of the inner control loop partially absorbs the ramp perturbation, yielding a step like disturbance in its controlled variables. The step disturbance is then completely eliminated by the master control loop, causing no offset to be observed between the CQAs set points and actual values.
Control strategy 2 advantages lie in the fact that tablet weight and breaking force are monitored in real time and controlled through a cascade arrangement. This arrangement allows the usage of tablet weight and breaking force sensors with relatively low sampling rate. Directly sensing of tablet CQAs eliminates the need of sometimes inaccurate inferences of these parameters from the compression forces. Certain disturbances are also more adequately handled by this control architecture as described above. The main disadvantages of this control strategy are that it adds another element of non-linearity to the system by relating tablet weight to pre-compression force, which is non-linearly related to its actuator (fill depth). These accumulated non-linearities result in a narrower stability margin. Control strategy 2, due to its cascade arrangement, has slightly longer response times when compared to strategy 1, which can be considered a minor disadvantage. It is important to note that, just as in strategy 1, it is necessary to tune the compression force controller with the adequate pre-compression force range in mind.
7.2.3. Strategy 3—Direct Control of Tablet Weight and Cascade Tablet Breaking Force Control
Figure 16 shows the systems response in a set point tracking scenario. Similar step responses in tablet weight are seen in all three weight set point changes, which is a characteristic of a linear system. An interaction between tablet weight and breaking force can be noticed in Figure 16a in the form of peaks. Changes in tablet weight set point result in fill depth manipulations, these manipulations lead to change in main compression height in order to maintain the main compression ratio at the desired value. There is a slight offset between the dynamics of fill depth and main compression height in the tablet press model, which causes the peaks seen in Figure 16a. Tablet breaking force is able to track its set points when no changes in tablet weight are made.
The system’s response to disturbances in powder density is shown in Figure 17. The response is similar to what was observed for strategy 1.
The main advantage of control strategy 3 lies in the fact that the inner main compression controller isolates the non-linear behavior of the compression forces from the master controller. The master controller actuates on variables that linearly affect tablet weight and breaking force. In this strategy, pre-compression force can be varied or controlled independently without affecting any tablet CQAs, making it easier to avoid tablet defects related to inadequate dwell times. Theoretically, if the controller models where adequately regressed, control strategy 3 should have the best performance among the three evaluated strategies. This strategy can be further improved by using fill depth as a measured disturbance signal in the main compression controller.
8. Discussion and Conclusions
A control relevant model for the tablet compaction unit was developed and validated. The developed model was able to successfully capture the non-linear behavior of the compaction process as well as tablet production rate dependent transport delays. The relevance of this model lies in its fast execution time while still accurately representing the dynamic behavior of the process.
The applicability of the model for control system design was evaluated and the developed control strategies were implemented on an experimental setup. A comparison between three control algorithms was conducted leading to the conclusion that an MPC with an unmeasured disturbance model was the most adequate control algorithm for the studied system. Three different strategies were explored. Their characteristics as well as their possible applications were studied through a set point tracking scenario and a disturbance rejection scenario. It was concluded that the selection of control strategies for a given compaction process is heavily depended on the availability and quality of real time data of tablet critical quality attributes. As far as the authors’ knowledge goes, this is the first work that involved the development of a control strategy for a tablet compaction unit in a simulation environment follow by experimental implementation.
This work should serve as a major stepping-stone for establishment of a fully integrated and controlled direct compaction process in commercial scale, leading to the achievement of true Quality by Control. The future work includes the development and implementation of RTD (residence time distribution) based control system.
Acknowledgments
This work is supported by the Rutgers Research Council, through grant 202342 RC-17-Singh R, the US Food and Drug Administration (FDA), through grant 5U01FD005535 and National Science Foundation Engineering Research Center on Structured Organic Particulate Systems, through Grant NSF-ECC 0540855.
Author Contributions
All the authors contributed equally to this work.
Conflicts of Interest
The authors declare no conflict of interest. The founding sponsors had no role in the design of the study; in the collection, analyses, or interpretation of data; in the writing of the manuscript and in the decision to publish the results.
References
- U.S. Department of Health and Human Services Food and Drug Administration Guidance for Industry: ICH Q8(R2) Pharmaceutical Development. Work. Qual. Des. Pharm. 2009, 8, 28.
- International conference on harmonisation of technical requirements for registration of pharmaceuticals for human use Pharmaceutical Development Q8(R2). In Proceedings of the ICH Harmonised Tripartite Guideline, Kuala Lumpur, Malaysia, 26–28 July 2010; pp. 1–28.
- Mesbah, A.; Paulson, J.A.; Lakerveld, R.; Braatz, R.D. Model Predictive Control of an Integrated Continuous Pharmaceutical Manufacturing Pilot Plant. Org. Process Res. Dev. 2017, 21, 844–854. [Google Scholar] [CrossRef]
- Sen, M.; Chaudhury, A.; Singh, R.; John, J.; Ramachandran, R. Multi-scale flowsheet simulation of an integrated continuous purification-downstream pharmaceutical manufacturing process. Int. J. Pharm. 2013, 445, 29–38. [Google Scholar] [CrossRef] [PubMed]
- Boukouvala, F.; Niotis, V.; Ramachandran, R.; Muzzio, F.J.; Ierapetritou, M.G. An integrated approach for dynamic flowsheet modeling and sensitivity analysis of a continuous tablet manufacturing process. Comput. Chem. Eng. 2012, 42, 30–47. [Google Scholar] [CrossRef]
- Jain, S. Mechanical properties of powders for compaction and tableting: An overview. Pharm. Sci. Technol. Today 1999, 2, 20–31. [Google Scholar] [CrossRef]
- Michaut, F.; Busignies, V.; Fouquereau, C.; Huet de Barochez, E.; Leclerc, B.; Tchoreloff, P. Evaluation of a Rotary Tablet Press Simulator as a Tool for the Characterization of Compaction Properties of Pharmaceutical Products. J. Pharm. Sci. 2010, 99, 2874–2885. [Google Scholar] [CrossRef] [PubMed]
- Sinka, I.C.; Cunningham, J.C.; Zavaliangos, A. The effect of wall friction in the compaction of pharmaceutical tablets with curved faces: A validation study of the Drucker-Prager Cap model. Powder Technol. 2003, 133, 33–43. [Google Scholar] [CrossRef]
- Mendez, R.; Muzzio, F.; Velazquez, C. Study of the effects of feed frames on powder blend properties during the filling of tablet press dies. Powder Technol. 2010, 200, 105–116. [Google Scholar] [CrossRef]
- Akande, O.F.; Rubinstein, M.H.; Ford, J.L. Examination of the compaction properties of a 1:1 acetaminophen:Microcrystalline cellulose mixture using precompression and main compression. J. Pharm. Sci. 1997, 86, 900–907. [Google Scholar] [CrossRef] [PubMed]
- Gonnissen, Y.; Gonçalves, S.I.V.; De Geest, B.G.; Remon, J.P.; Vervaet, C. Process design applied to optimise a directly compressible powder produced via a continuous manufacturing process. Eur. J. Pharm. Biopharm. 2008, 68, 760–770. [Google Scholar] [CrossRef] [PubMed]
- Haware, R.V.; Tho, I.; Bauer-Brandl, A. Application of multivariate methods to compression behavior evaluation of directly compressible materials. Eur. J. Pharm. Biopharm. 2009, 72, 148–155. [Google Scholar] [CrossRef] [PubMed]
- Seitz, J.A.; Flessland, G.M. Evaluation of the Physical Properties of Compressed Tablets I: Tablet Hardness and Friability. J. Pharm. Sci. 1965, 54, 1353–1357. [Google Scholar] [CrossRef] [PubMed]
- Mayne, D.Q. Model predictive control: Recent developments and future promise. Automatica 2014, 50, 2967–2986. [Google Scholar] [CrossRef]
- Di Cairano, S. An Industry perspective on MPC in large volumes applications: Potential benefits and open challenges. IFAC Proc. Vol. 2012, 45, 52–59. [Google Scholar] [CrossRef]
- Qin, S.J.; Badgwell, T.A. A survey of industrial model predictive control technology. Control Eng. Pract. 2003, 11, 733–764. [Google Scholar] [CrossRef]
- Zagrobelny, M.A. MPC Performance Monitoring and Disturbance Model Identification, University of Winsconsin-Madison. Diss. Theses Gradworks 2014. Available online: http://jbrwww.che.wisc.edu/theses/zagrobelny.pdf (accessed 30 November 2017).
- Mayne, D.Q.; Raković, S.V.; Findeisen, R.; Allgöwer, F. Robust output feedback model predictive control of constrained linear systems. Automatica 2006, 42, 1217–1222. [Google Scholar] [CrossRef]
- Mayne, D.Q.; Rawlings, J.B.; Rao, C.V.; Scokaert, P.O.M. Constrained model predictive control: Stability and optimality. Automatica 2000, 36, 789–814. [Google Scholar] [CrossRef]
- Streif, S.; Kögel, M.; Bäthge, T.; Findeisen, R. Robust Nonlinear Model Predictive Control with Constraint Satisfaction: A Relaxation-based Approach. FAC World Congr. 2014, 47, 11073–11079. [Google Scholar] [CrossRef]
- Maiworm, M.; Bäthge, T.; Findeisen, R. Scenario-based Model Predictive Control: Recursive feasibility and stability. IFAC PapersOnLine 2015, 28, 50–56. [Google Scholar] [CrossRef]
- Allgöwer, F.; Findeisen, R.; Ebenbauer, C. Nonlinear model predictive control. In Control Systems, Robotics and Automation; Birkhäuser: Basel, Basel-Stadt, Switzerland, 2009; Volume XI. [Google Scholar]
- Su, Q.; Moreno, M.; Giridhar, A.; Reklaitis, G.V.; Nagy, Z.K. A Systematic Framework for Process Control Design and Risk Analysis in Continuous Pharmaceutical Solid-Dosage Manufacturing. J. Pharm. Innov. 2017, 12, 1–20. [Google Scholar] [CrossRef]
- Singh, R.; Ierapetritou, M.; Ramachandran, R. System-wide hybrid MPC–PID control of a continuous pharmaceutical tablet manufacturing process via direct compaction. Eur. J. Pharm. Biopharm. 2013, 85, 1164–1182. [Google Scholar] [CrossRef] [PubMed]
- Singh, R.; Ierapetritou, M.; Ramachandran, R. An engineering study on the enhanced control and operation of continuous manufacturing of pharmaceutical tablets via roller compaction. Int. J. Pharm. 2012. [Google Scholar] [CrossRef] [PubMed]
- Rehrl, J.; Kruisz, J.; Sacher, S.; Khinast, J.; Horn, M. Optimized continuous pharmaceutical manufacturing via model-predictive control. Int. J. Pharm. 2016, 510, 100–115. [Google Scholar] [CrossRef] [PubMed]
- Zhao, X.J.; Gatumel, C.; Dirion, J.L.; Berthiaux, H.; Cabassud, M. Implementation of a control loop for a continuous powder mixing process. In Proceedings of the AIChE 2013 Annual Meeting, San Francisco, CA, USA, 6 November 2013. [Google Scholar]
- Singh, R.; Román-Ospino, A.D.; Romañach, R.J.; Ierapetritou, M.; Ramachandran, R. Real time monitoring of powder blend bulk density for coupled feed-forward/feed-back control of a continuous direct compaction tablet manufacturing process. Int. J. Pharm. 2015, 495, 612–625. [Google Scholar] [CrossRef] [PubMed]
- Singh, R.; Muzzio, F.; Ierapetritou, M.; Ramachandran, R. A Combined Feed-Forward/Feed-Back Control System for a QbD-Based Continuous Tablet Manufacturing Process. Processes 2015, 3, 339–356. [Google Scholar] [CrossRef]
- Singh, R.; Sahay, A.; Karry, K.M.; Muzzio, F.; Ierapetritou, M.; Ramachandran, R. Implementation of an advanced hybrid MPC-PID control system using PAT tools into a direct compaction continuous pharmaceutical tablet manufacturing pilot plant. Int. J. Pharm. 2014, 473, 38–54. [Google Scholar] [CrossRef] [PubMed]
- Sen, M.; Singh, R.; Ramachandran, R. A Hybrid MPC-PID Control System Design for the Continuous Purification and Processing of Active Pharmaceutical Ingredients. Processes 2014, 2, 392–418. [Google Scholar] [CrossRef]
- Bhaskar, A.; Barros, F.N.; Singh, R. Development and implementation of an advanced model predictive control system into continuous pharmaceutical tablet compaction process. Int. J. Pharm. 2017, 534, 159–178. [Google Scholar] [CrossRef] [PubMed]
- Singh, R.; Sahay, A.; Muzzio, F.; Ierapetritou, M.; Ramachandran, R. A systematic framework for onsite design and implementation of a control system in a continuous tablet manufacturing process. Comput. Chem. Eng. 2014, 66, 186–200. [Google Scholar] [CrossRef]
- Sarkar, S.; Ooi, S.M.; Liew, C.V.; Heng, P.W.S. Influence of Rate of Force Application during Compression on Tablet Capping. J. Pharm. Sci. 2015, 104, 1319–1327. [Google Scholar] [CrossRef] [PubMed]
- Seborg, D.; Edgar, T.; Mellichamp, D. Process Dynamics and Control, 2nd ed.; Wiley: Hoboken, NJ, USA, 2004; ISBN 0-471-00077-9. [Google Scholar]
- Patel, S.; Kaushal, A.M.; Bansal, A.K. Compression Physics in the Formulation Development of Tablets. Crit. Rev. Ther. Drug Carr. Syst. 2006, 23, 1–66. [Google Scholar] [CrossRef]
- Kawakita, K.; Lüdde, K.H. Some considerations on powder compression equations. Powder Technol. 1971, 4, 61–68. [Google Scholar] [CrossRef]
Figure 1.
Direct compaction pilot plant.

Figure 2.
Systematic modelling framework. DOE: Design of experiments.

Figure 3.
Main compression force (experimental data). Main compression ratio = FD/MCH.
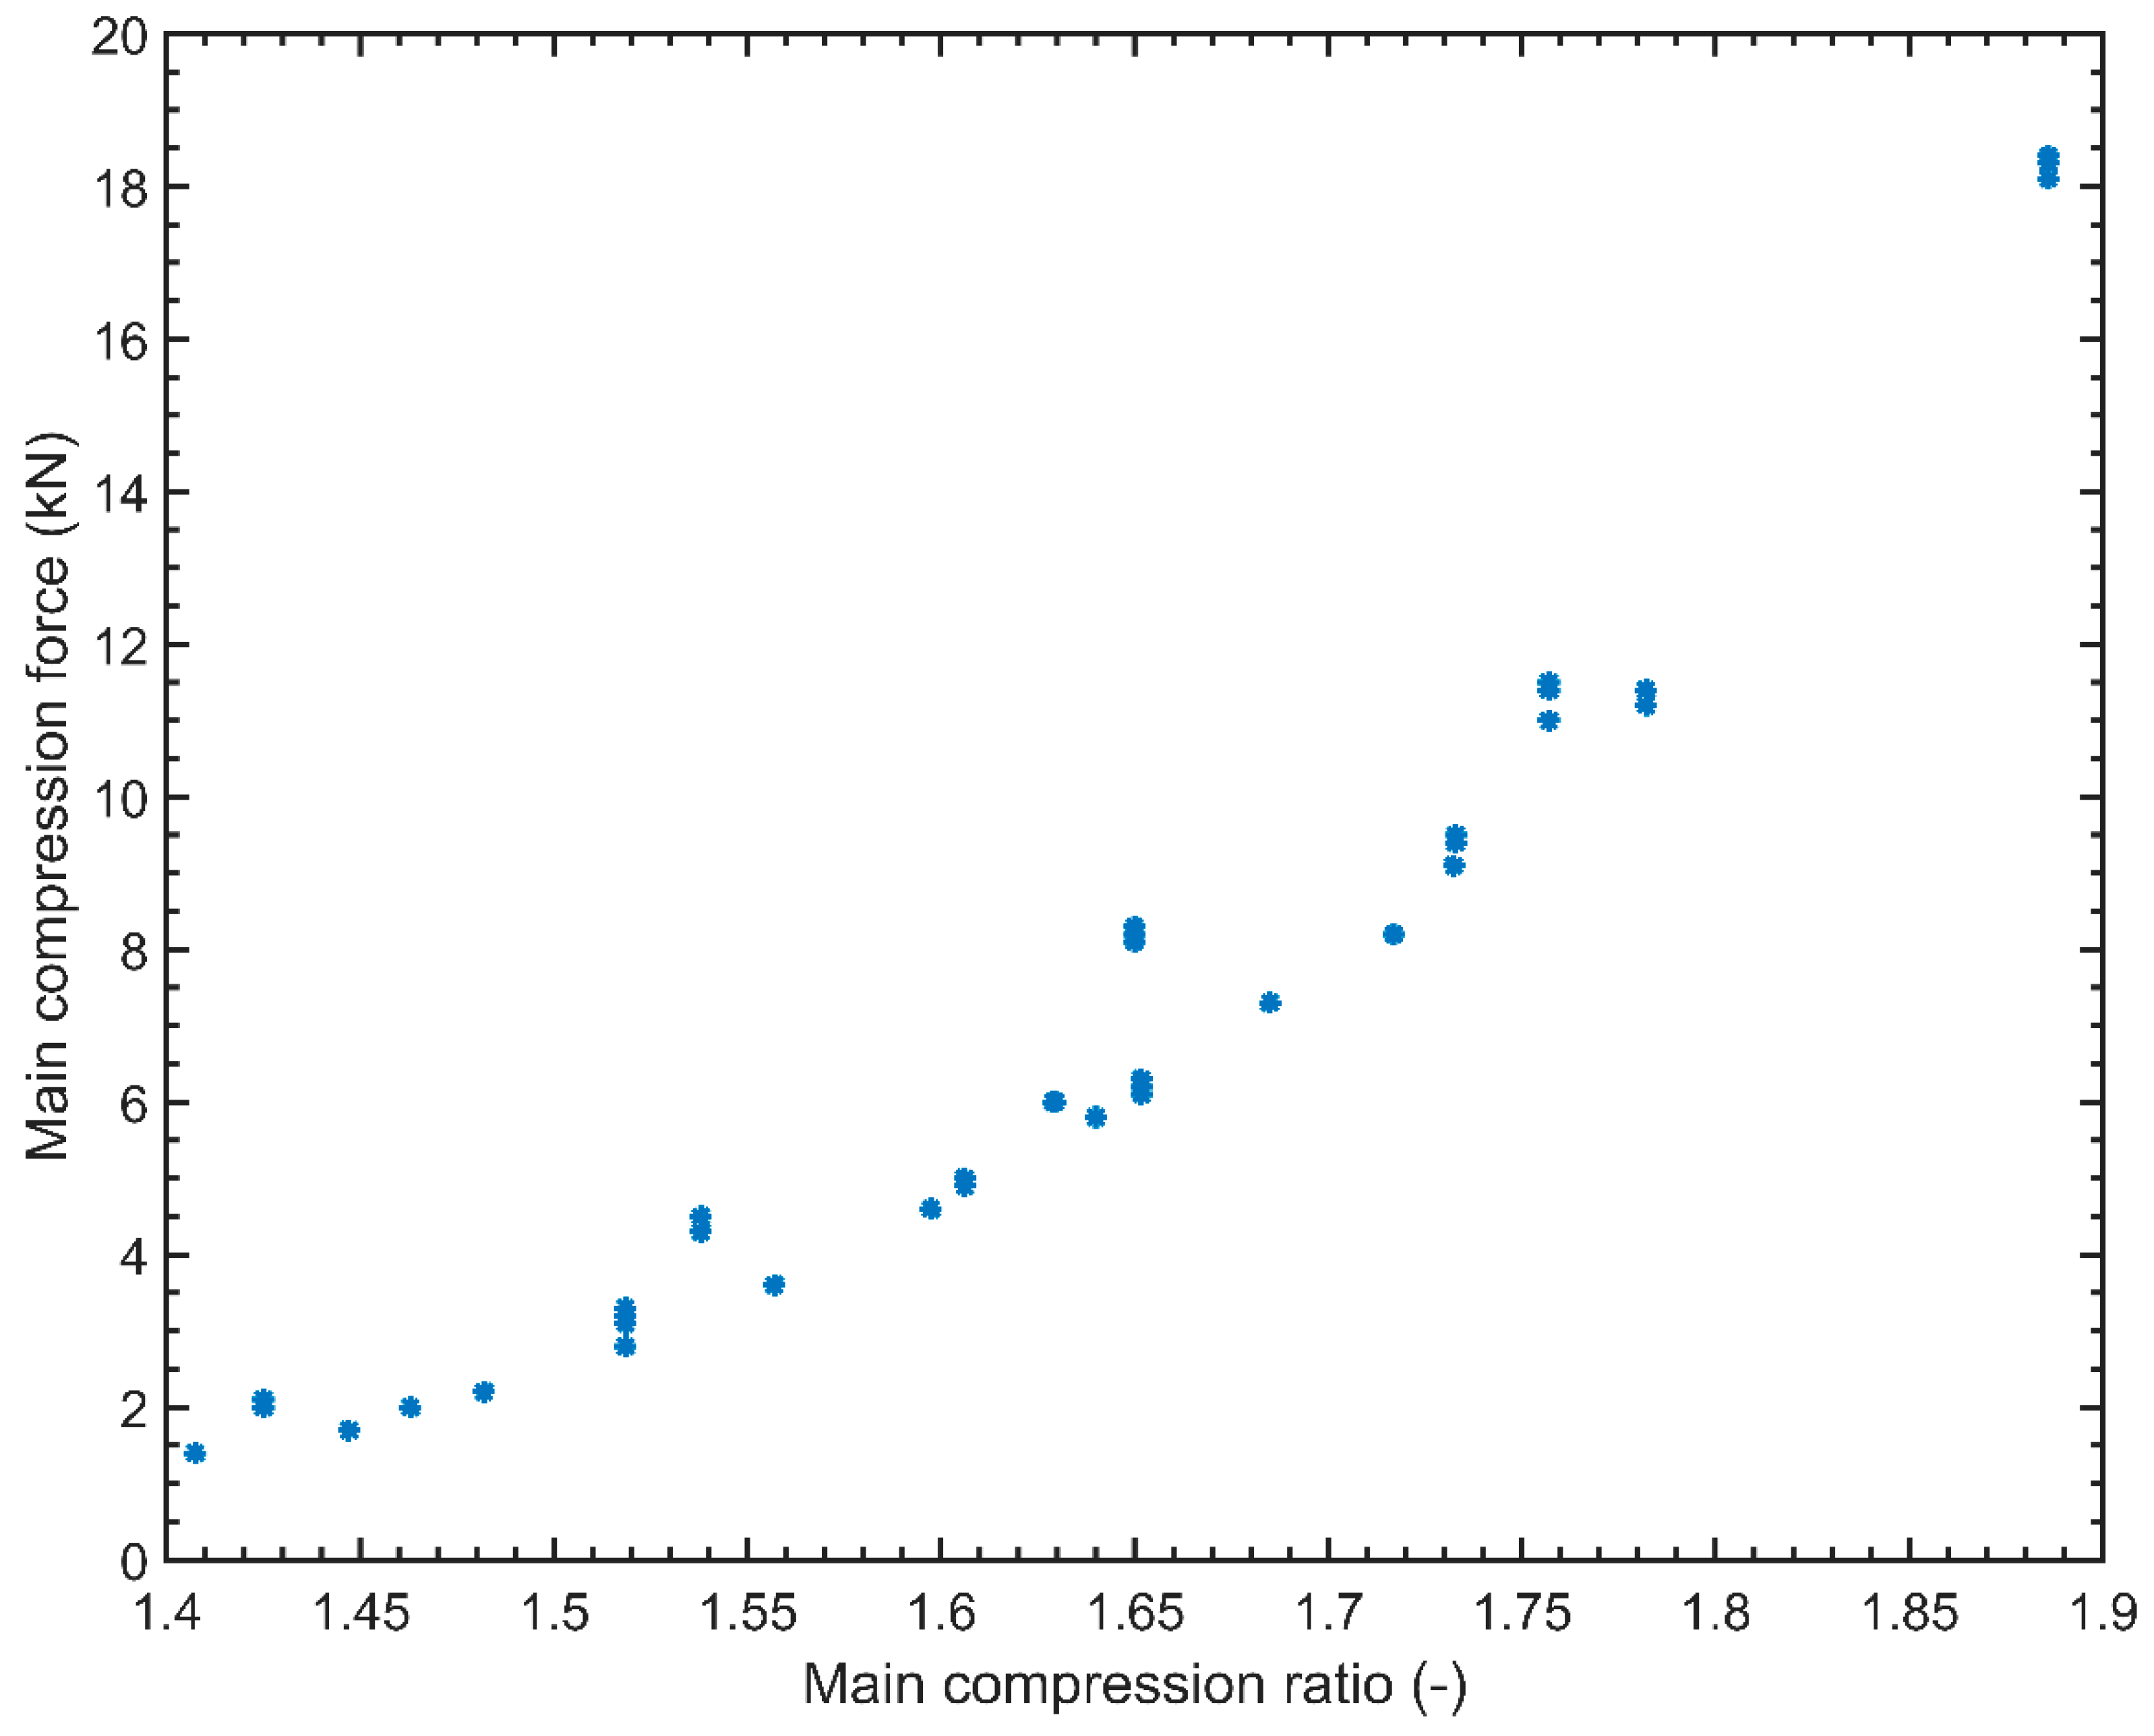
Figure 4.
Model implementation overview. FDACT: Fill depth; PCR: Pre-compression ratio; PCF: Pre-compression force; RHO: Density; PRACT and PR: Production rate; TD: Transport delay; FDSP: Fill depth set point; CQA: Critical quality attribute.
Figure 4.
Model implementation overview. FDACT: Fill depth; PCR: Pre-compression ratio; PCF: Pre-compression force; RHO: Density; PRACT and PR: Production rate; TD: Transport delay; FDSP: Fill depth set point; CQA: Critical quality attribute.

Figure 5.
(a) Fill depth model validation (b) Main compression height model validation (c) Production rate model validation (SP: set point).
Figure 5.
(a) Fill depth model validation (b) Main compression height model validation (c) Production rate model validation (SP: set point).
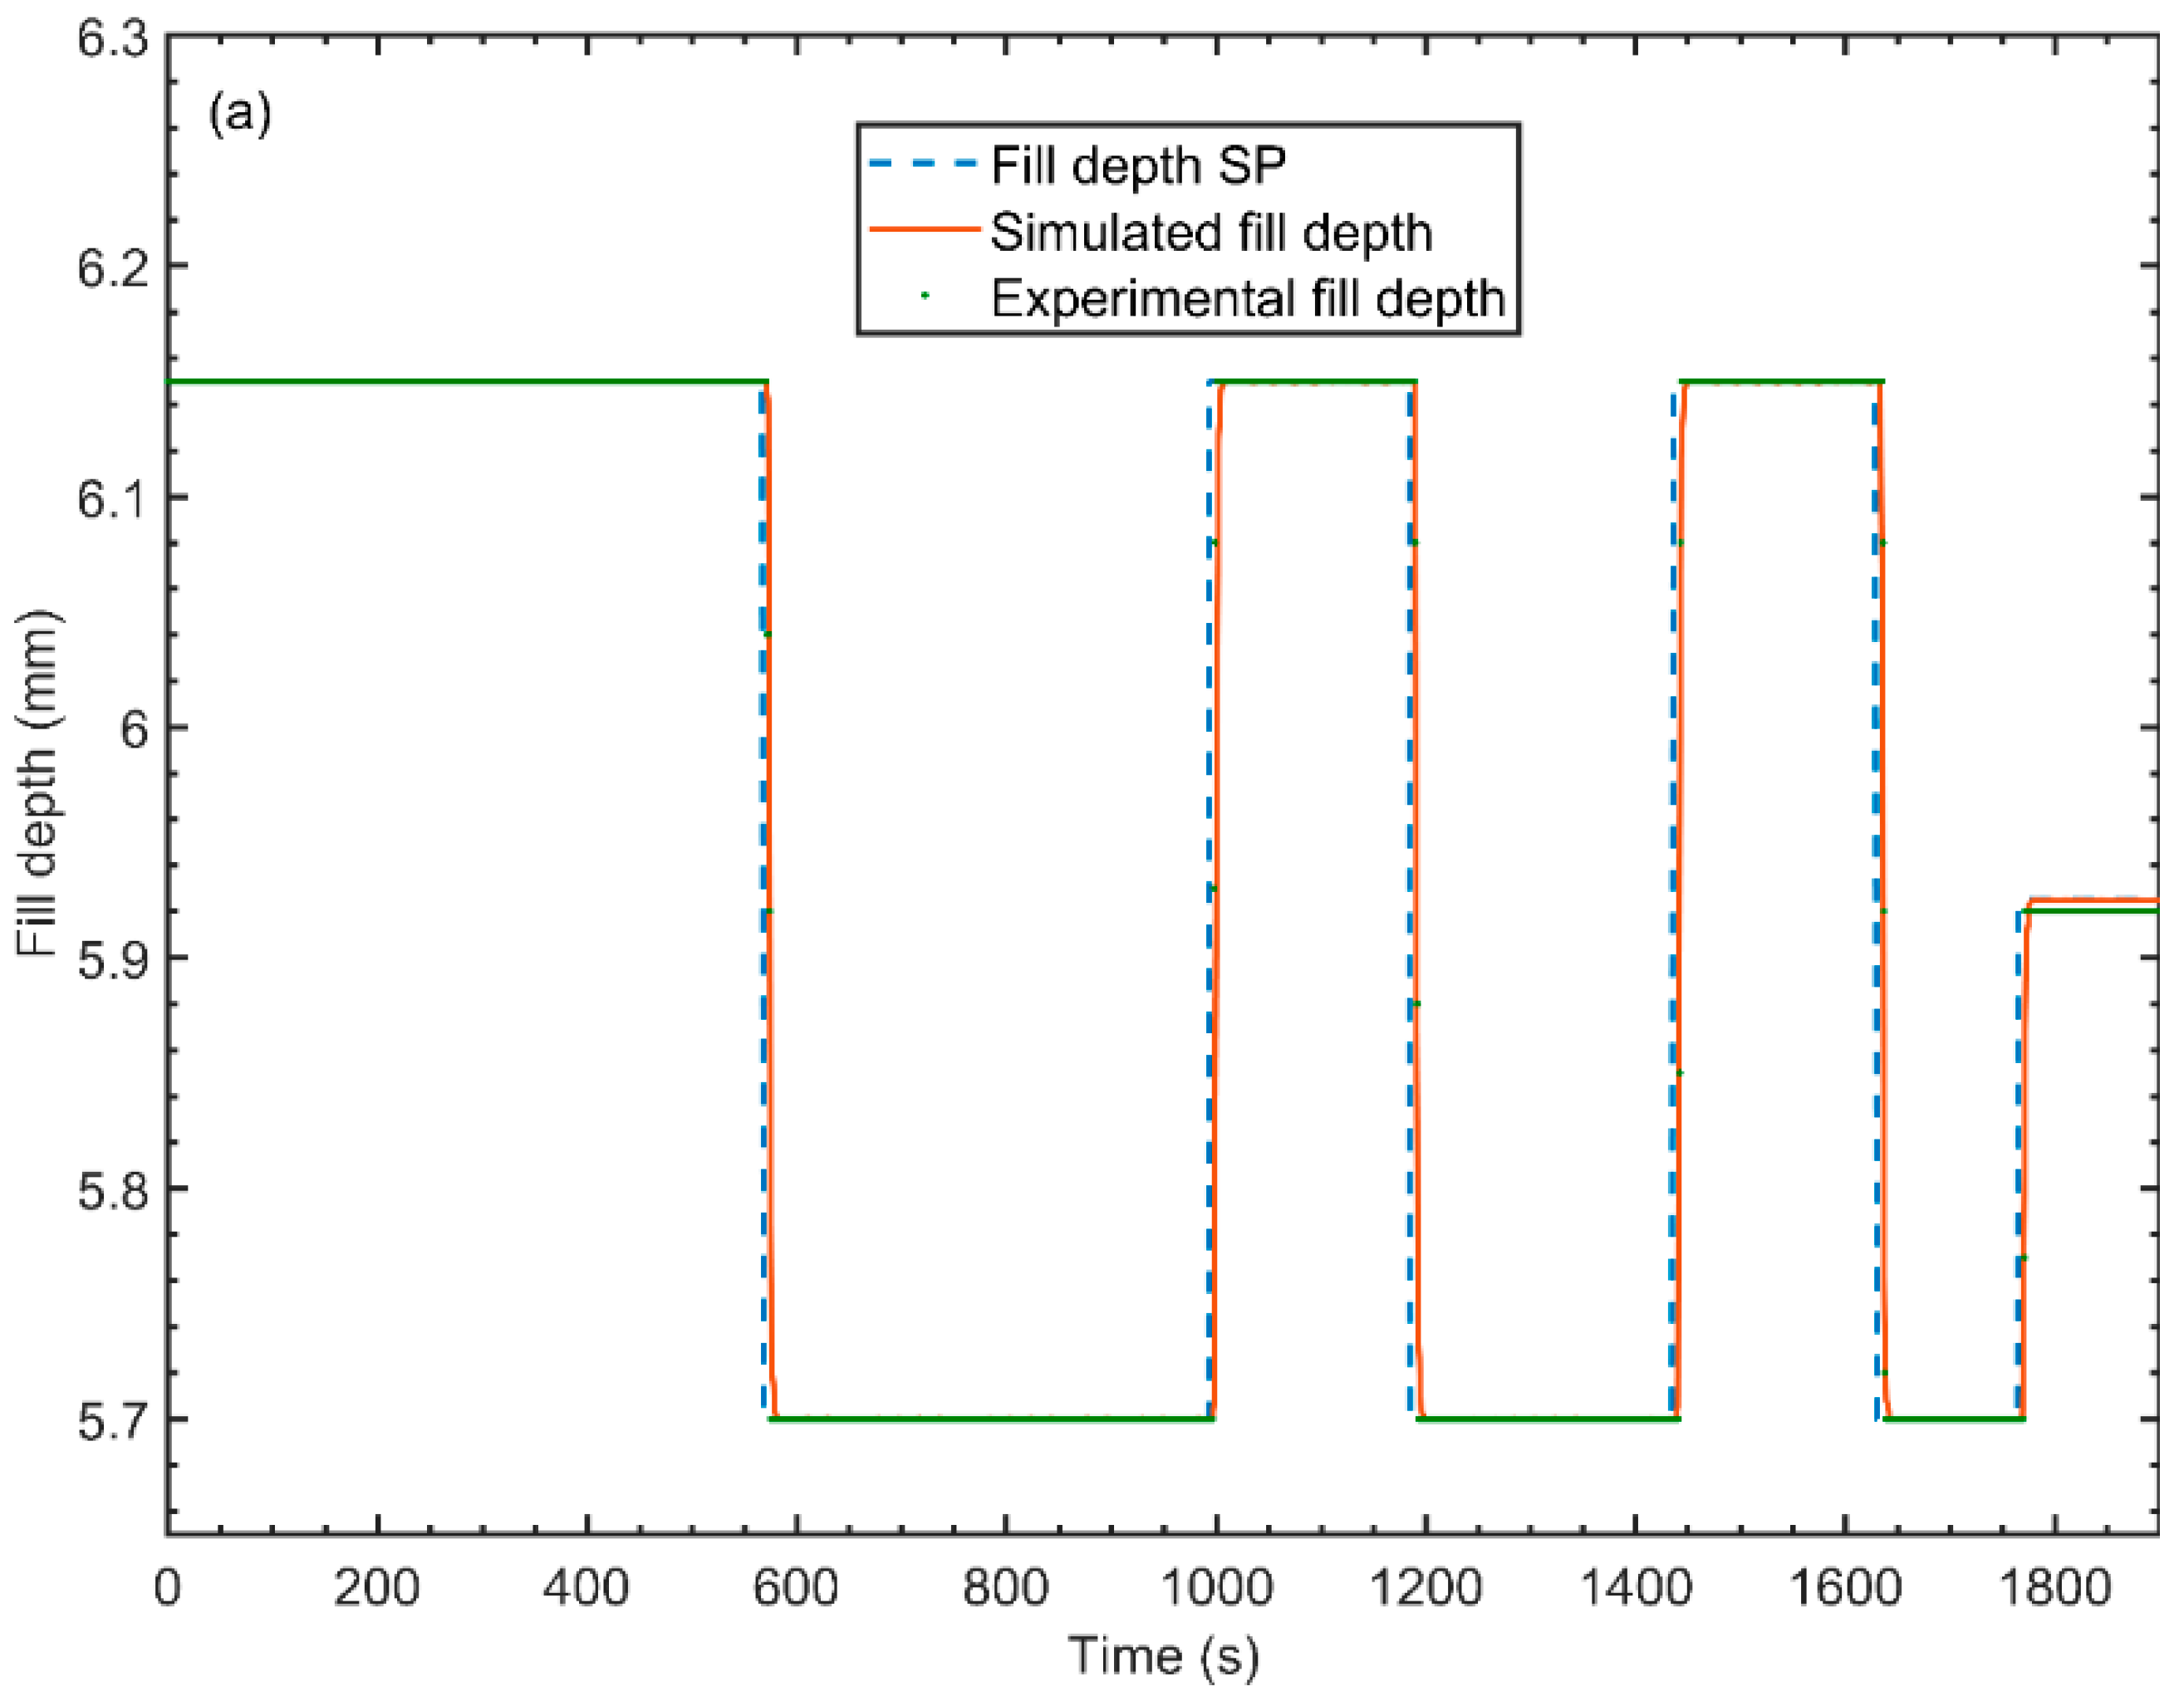

Figure 6.
(a) Pre-compression force model validation (b) Main compression force model validation.
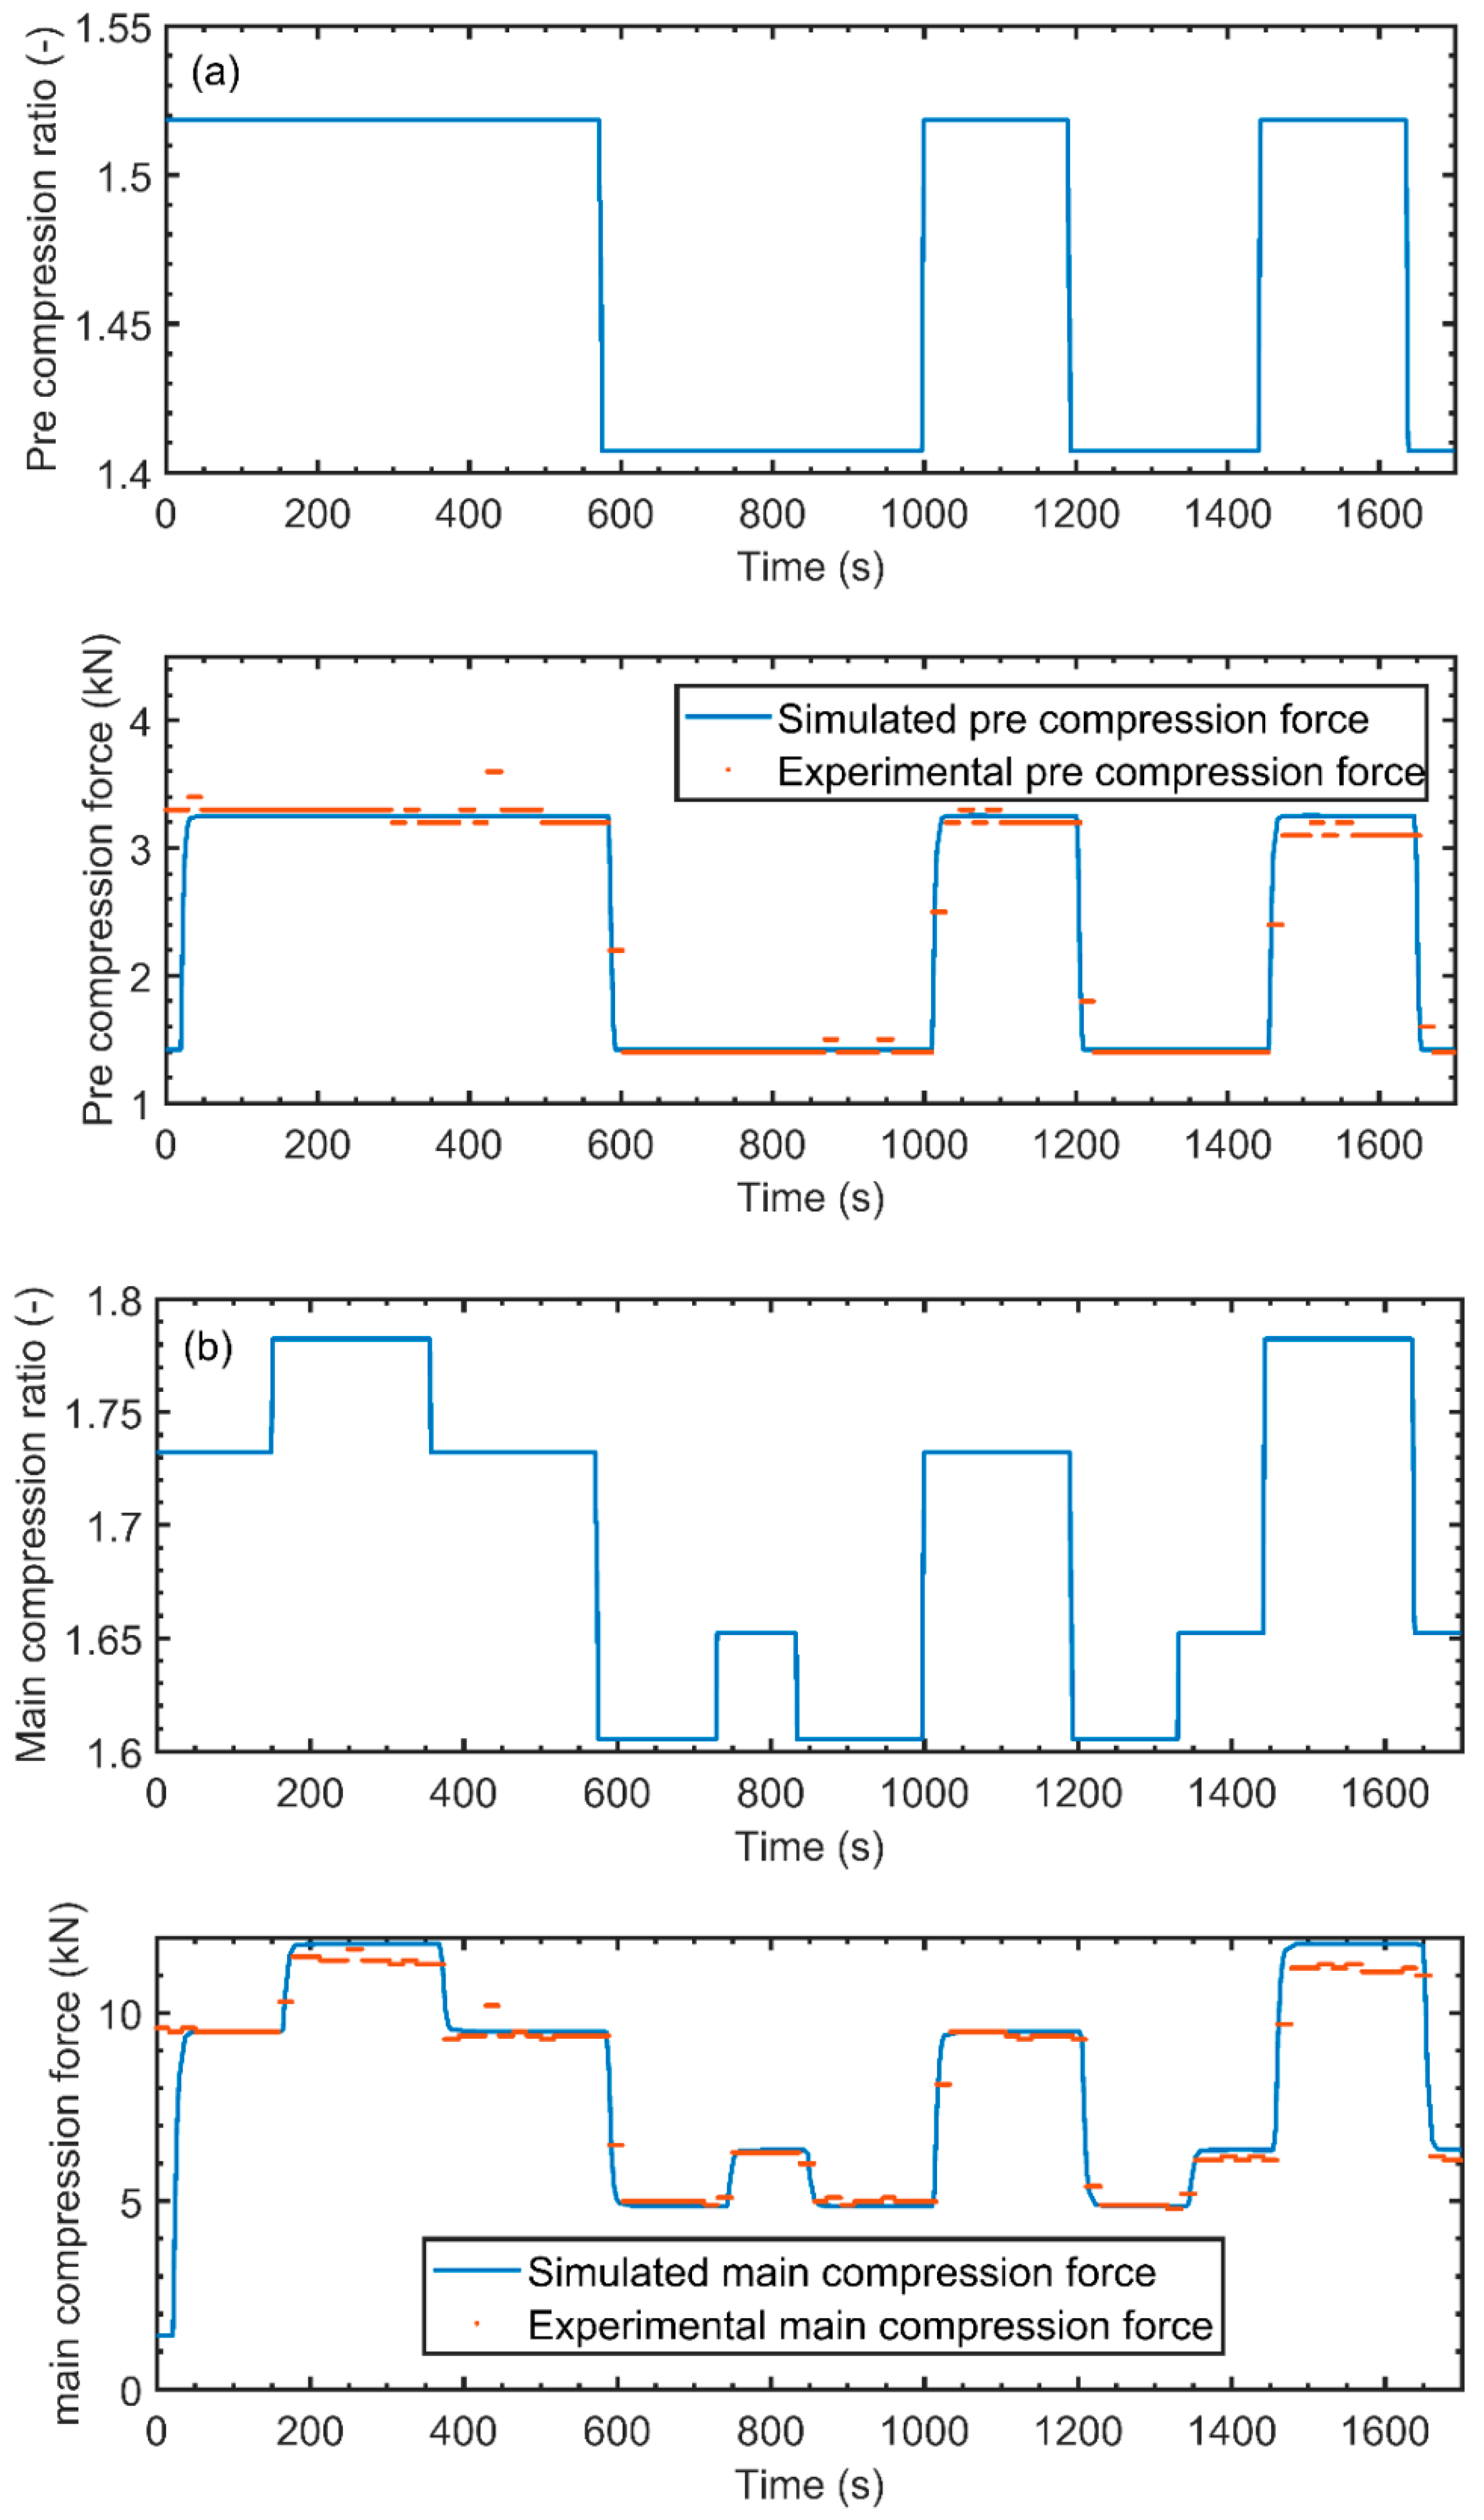
Figure 7.
(a) Tablet breaking force model validation (b) Tablet weight model validation.

Figure 8.
Density variations for disturbance rejection.

Figure 9.
Control algorithm comparison. PI: Proportional Integral controller; MPC: Model predictive control.
Figure 9.
Control algorithm comparison. PI: Proportional Integral controller; MPC: Model predictive control.

Figure 10.
Simulated and actual closed loop results compared using a step change.
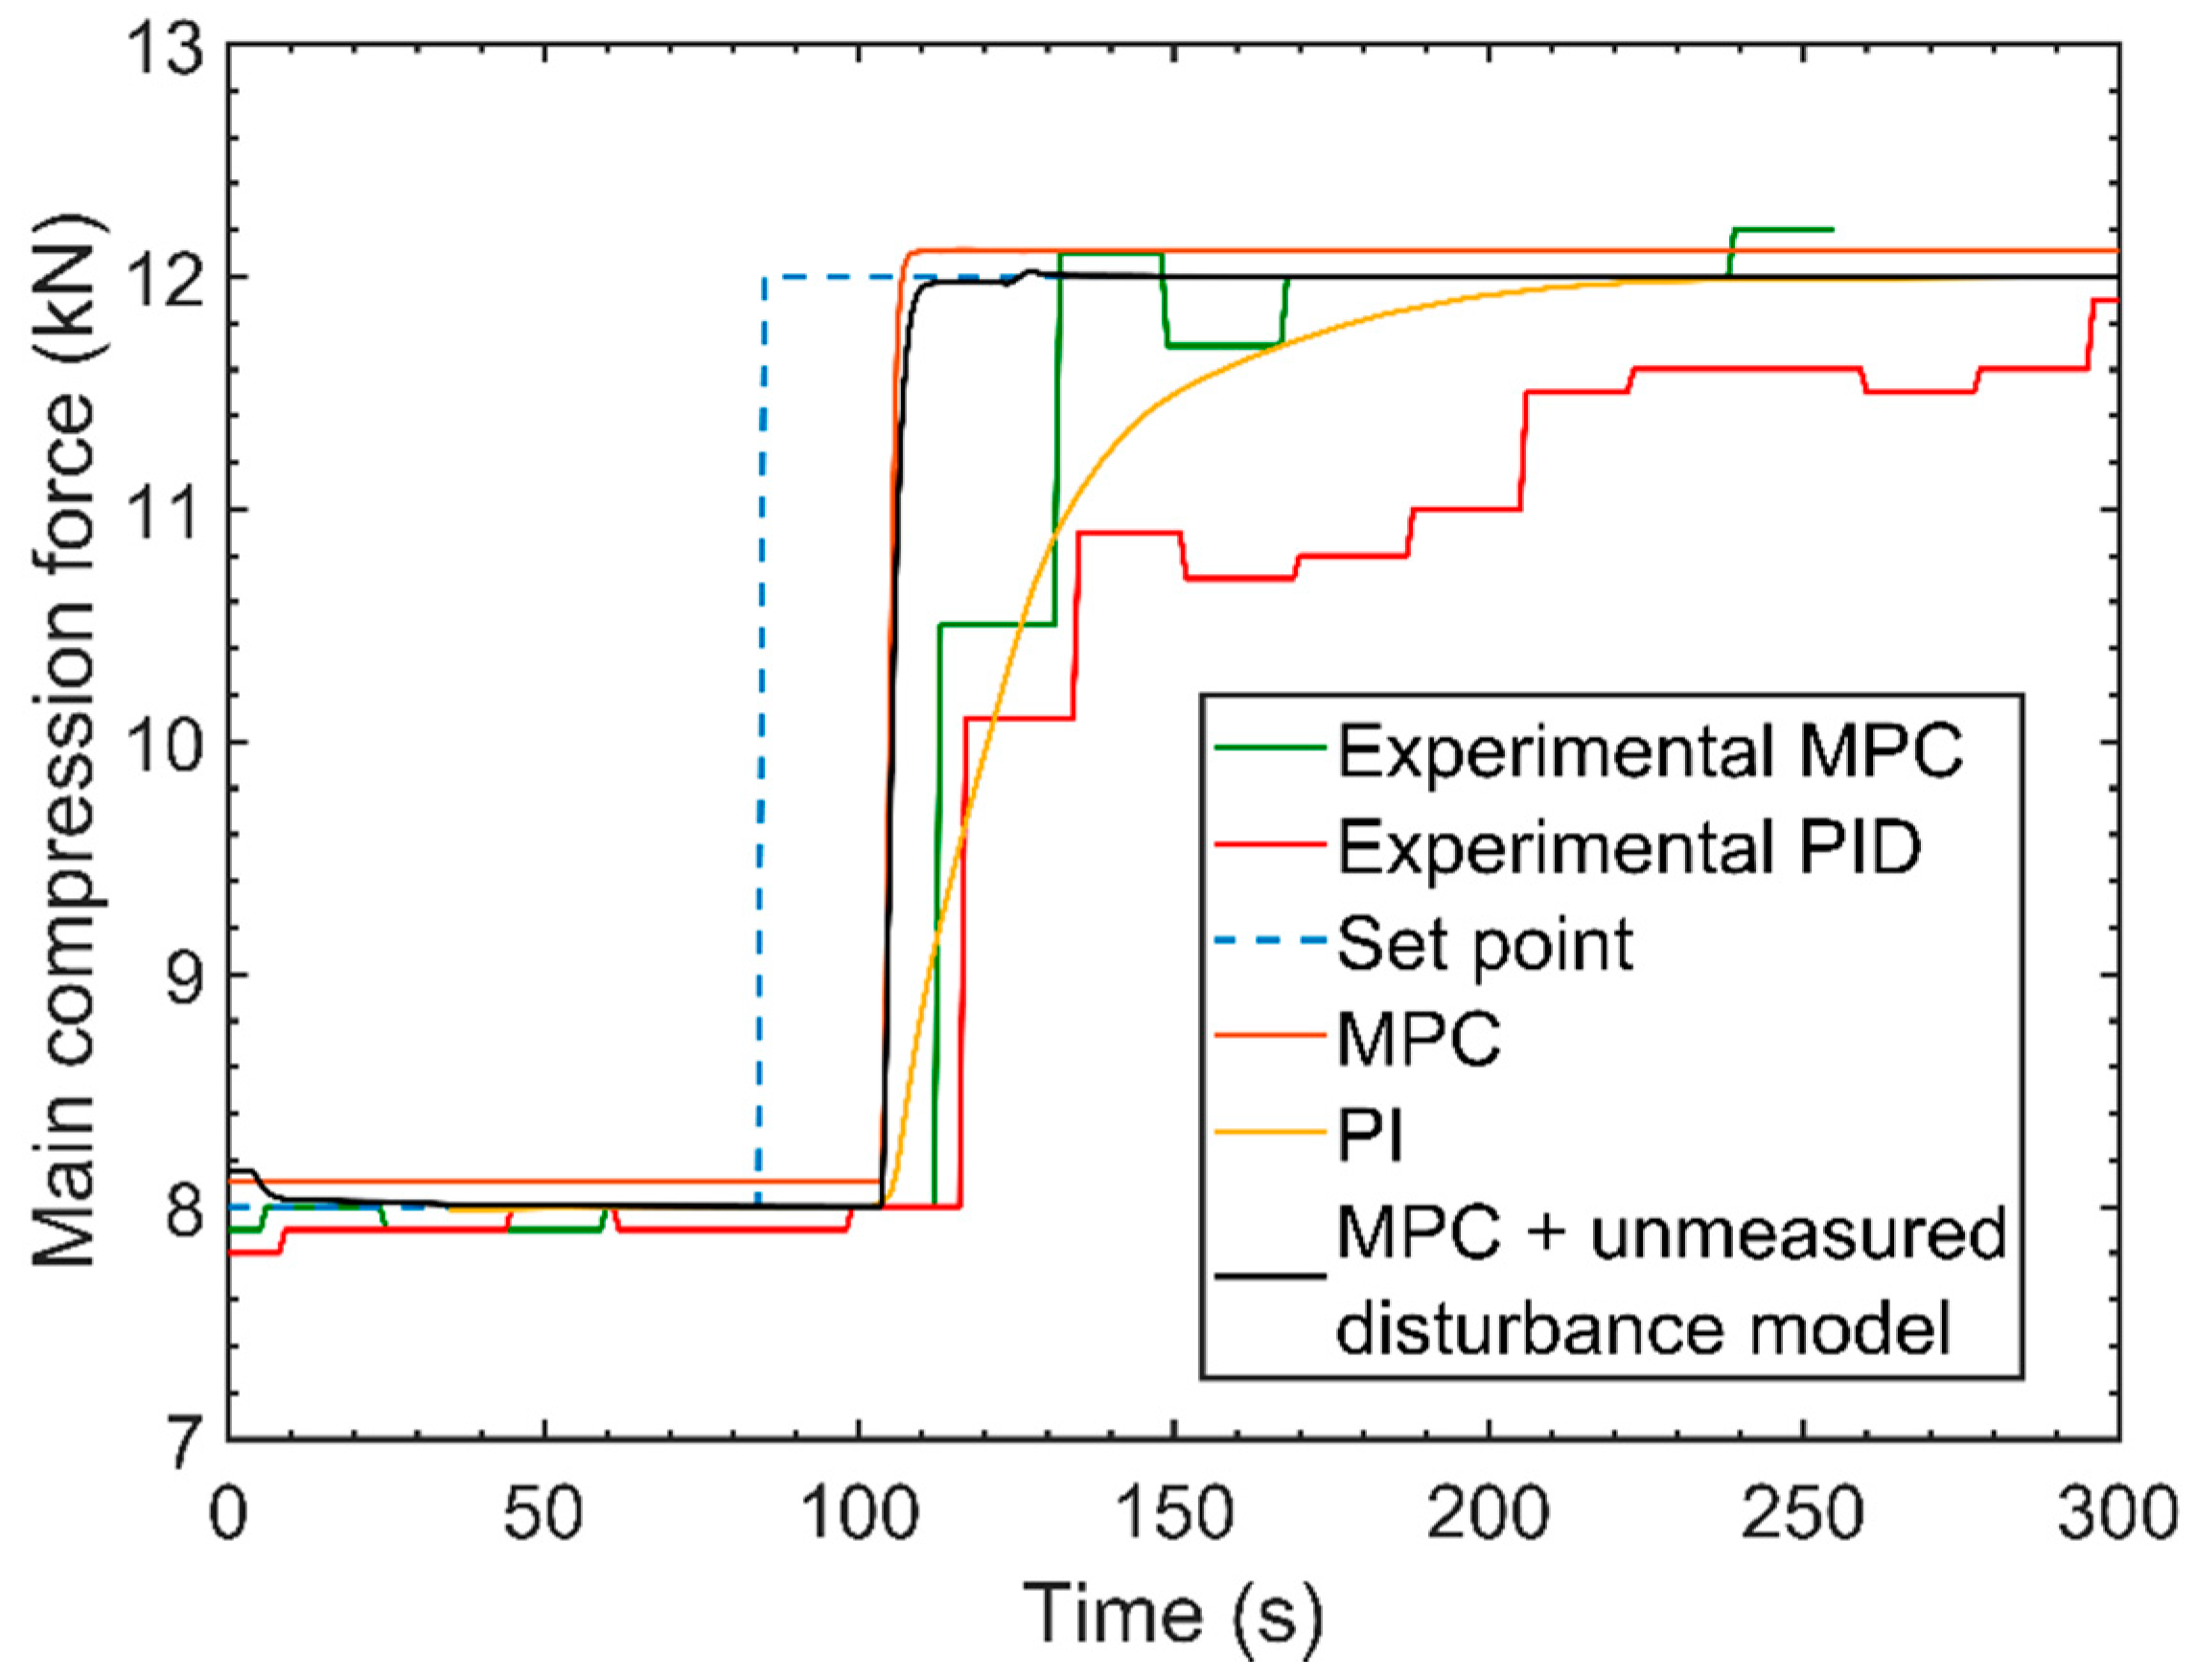
Figure 11.
Control strategy 1—Set point tracking scenario. (a) Critical process parameters (b) Actuators (c) Critical quality attributes.
Figure 11.
Control strategy 1—Set point tracking scenario. (a) Critical process parameters (b) Actuators (c) Critical quality attributes.
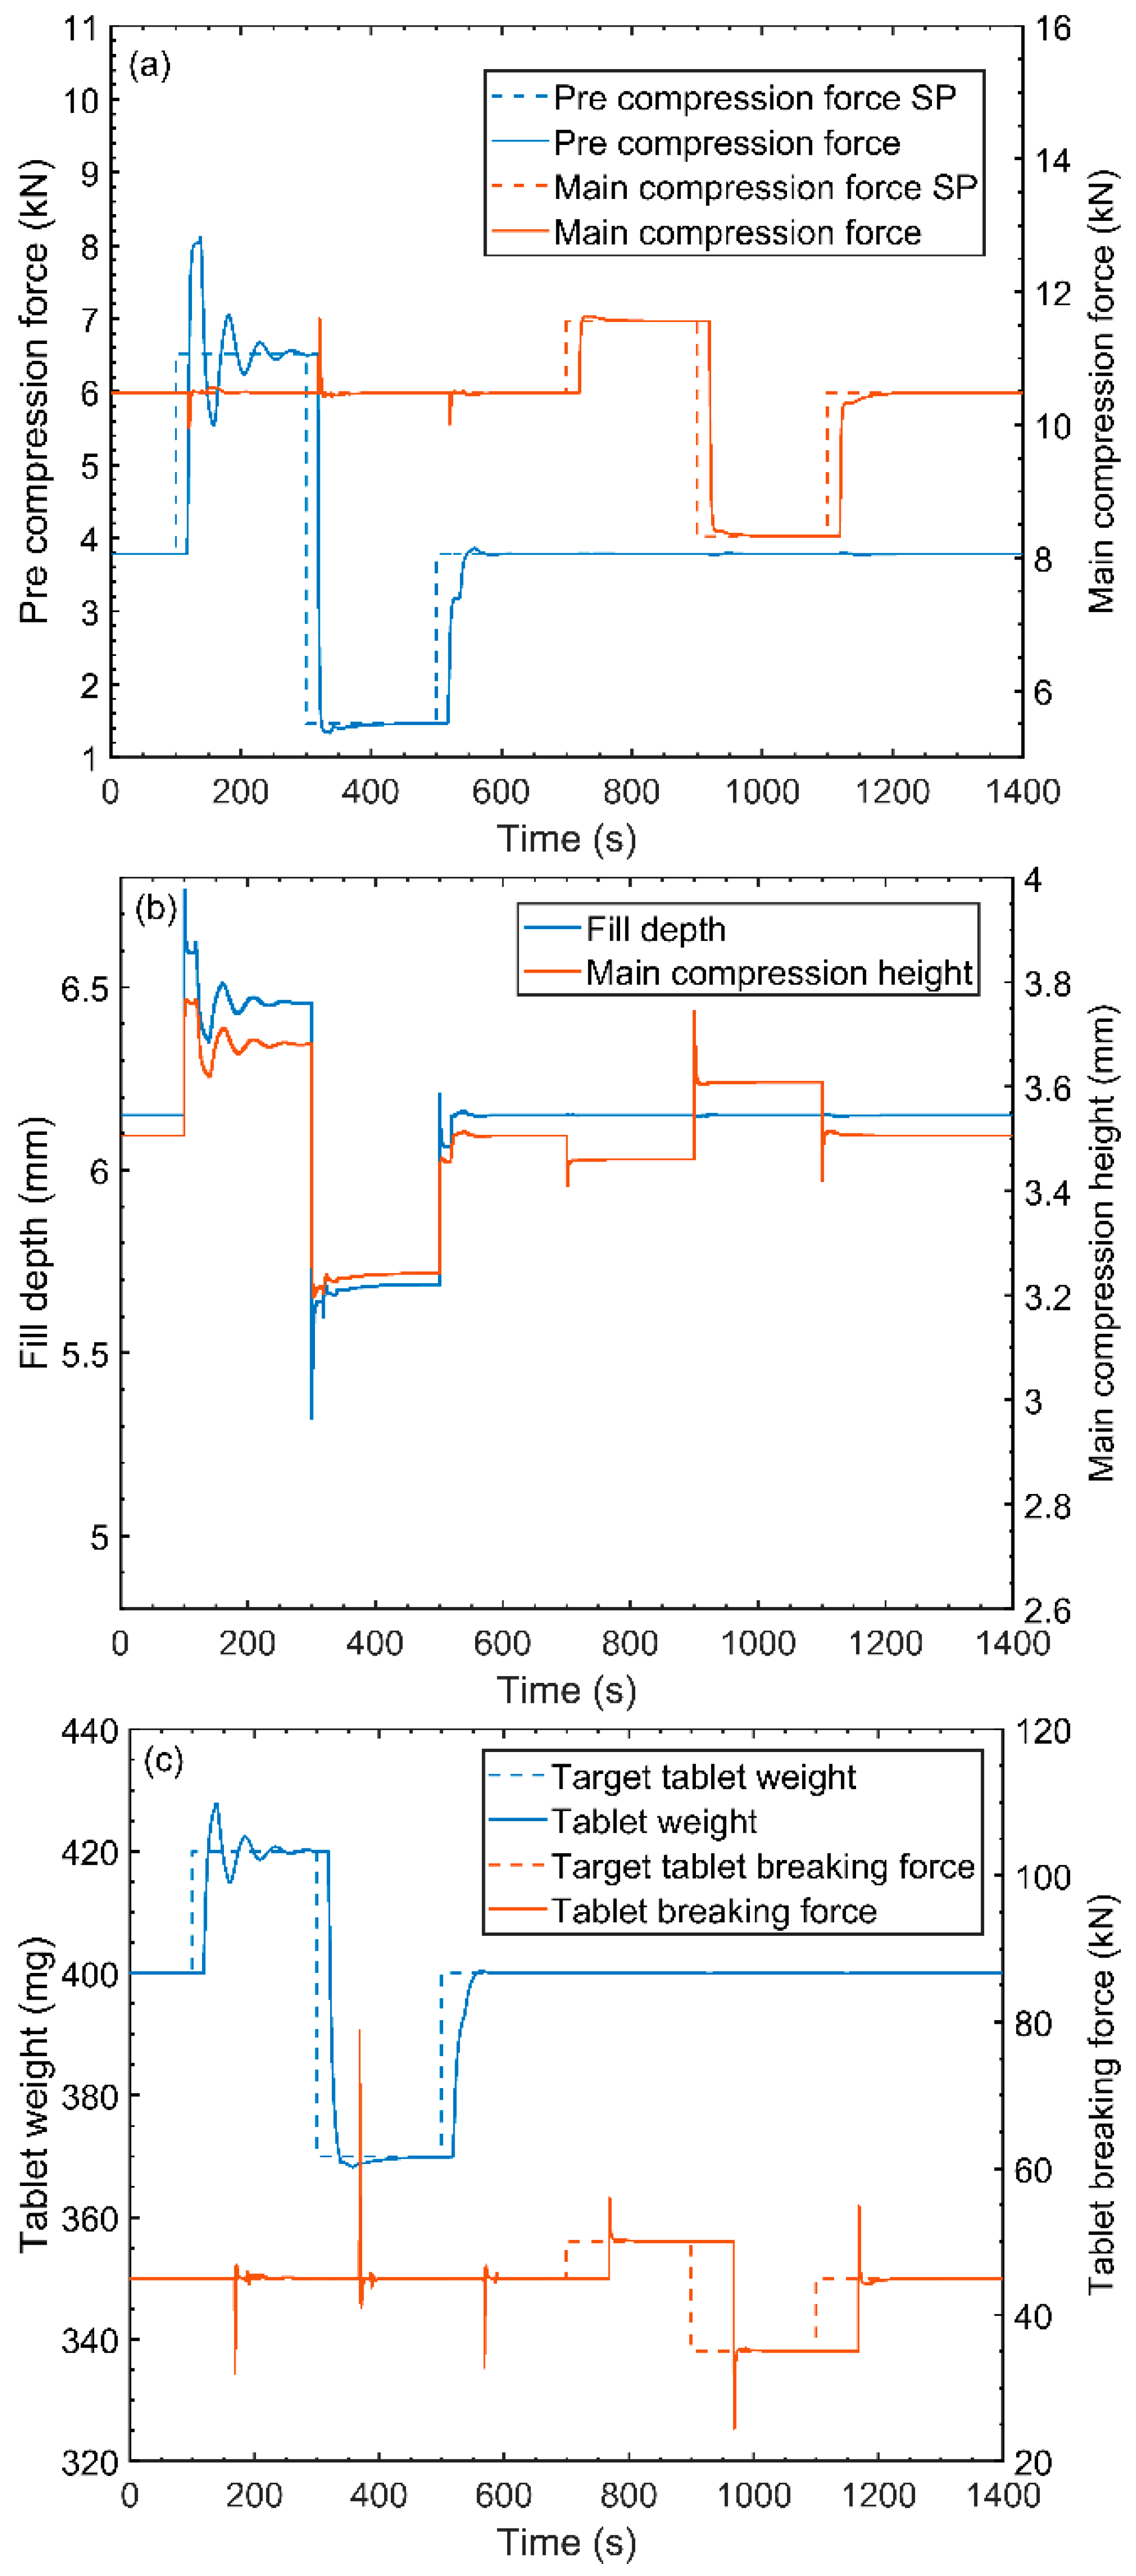
Figure 12.
Control strategy 1—Disturbance rejection scenario. (a) Critical process parameters (b) Actuators (c) Critical quality attributes.
Figure 12.
Control strategy 1—Disturbance rejection scenario. (a) Critical process parameters (b) Actuators (c) Critical quality attributes.

Figure 13.
Control strategy 1—Experimental validation.

Figure 14.
Control strategy 2—Set point tracking scenario. (a) Critical process parameters (b) Actuators (c) Critical quality attributes. SP: Set point.
Figure 14.
Control strategy 2—Set point tracking scenario. (a) Critical process parameters (b) Actuators (c) Critical quality attributes. SP: Set point.
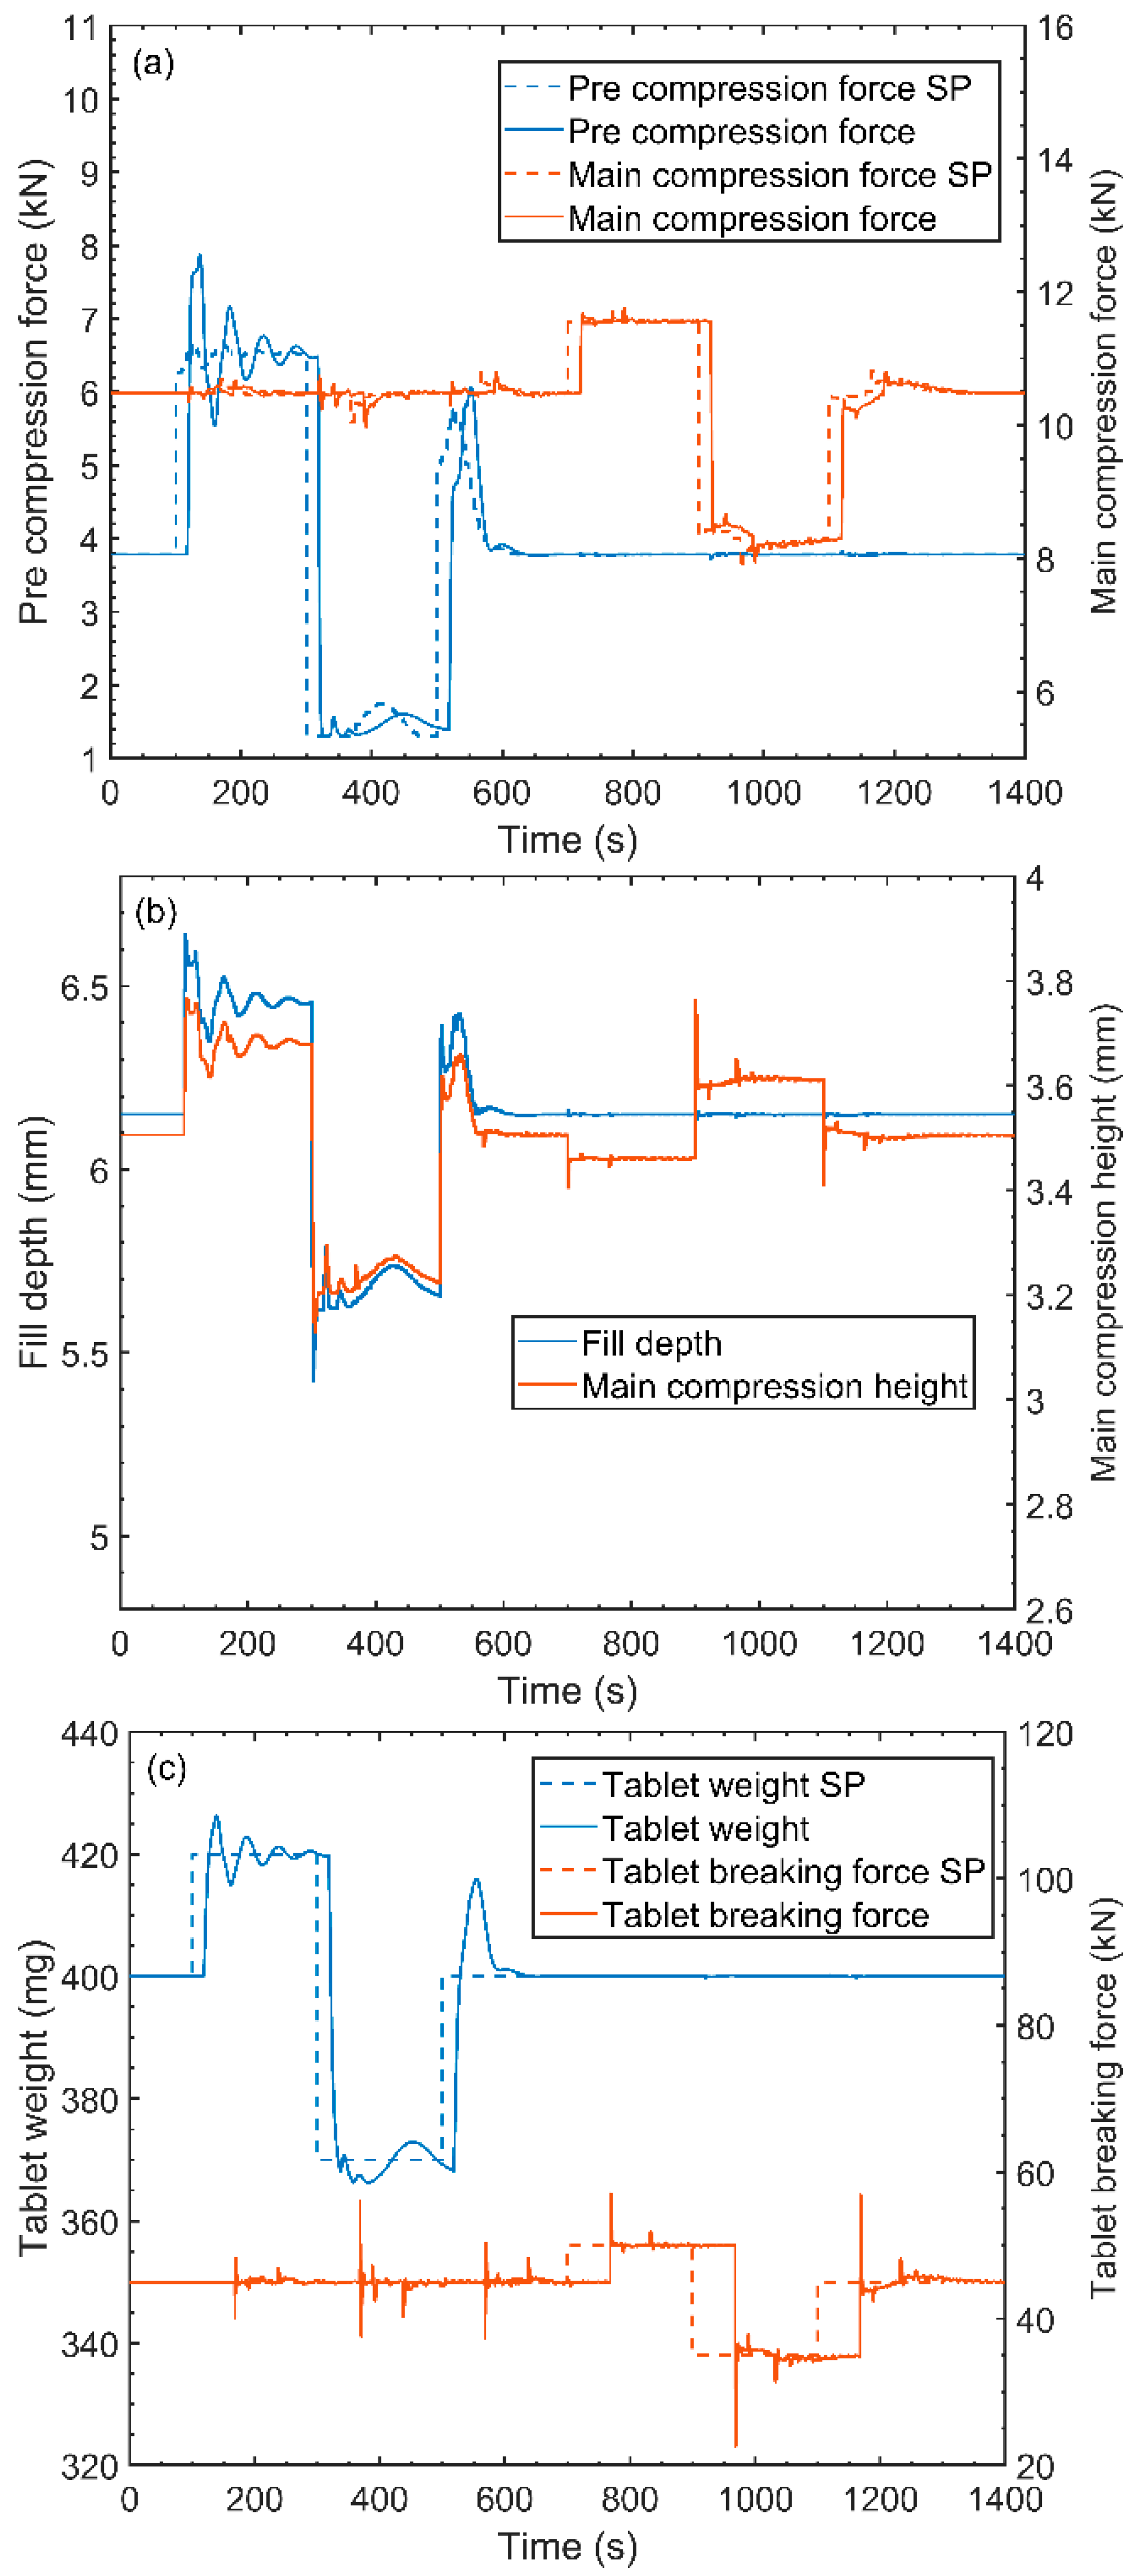
Figure 15.
Control strategy 2—Disturbance rejection scenario. (a) Critical process parameters (b) Actuators (c) Critical quality attributes.
Figure 15.
Control strategy 2—Disturbance rejection scenario. (a) Critical process parameters (b) Actuators (c) Critical quality attributes.


Figure 16.
Control strategy 3—Set point tracking scenario. (a) Critical process parameters (b) Actuators (c) Critical quality attributes.
Figure 16.
Control strategy 3—Set point tracking scenario. (a) Critical process parameters (b) Actuators (c) Critical quality attributes.

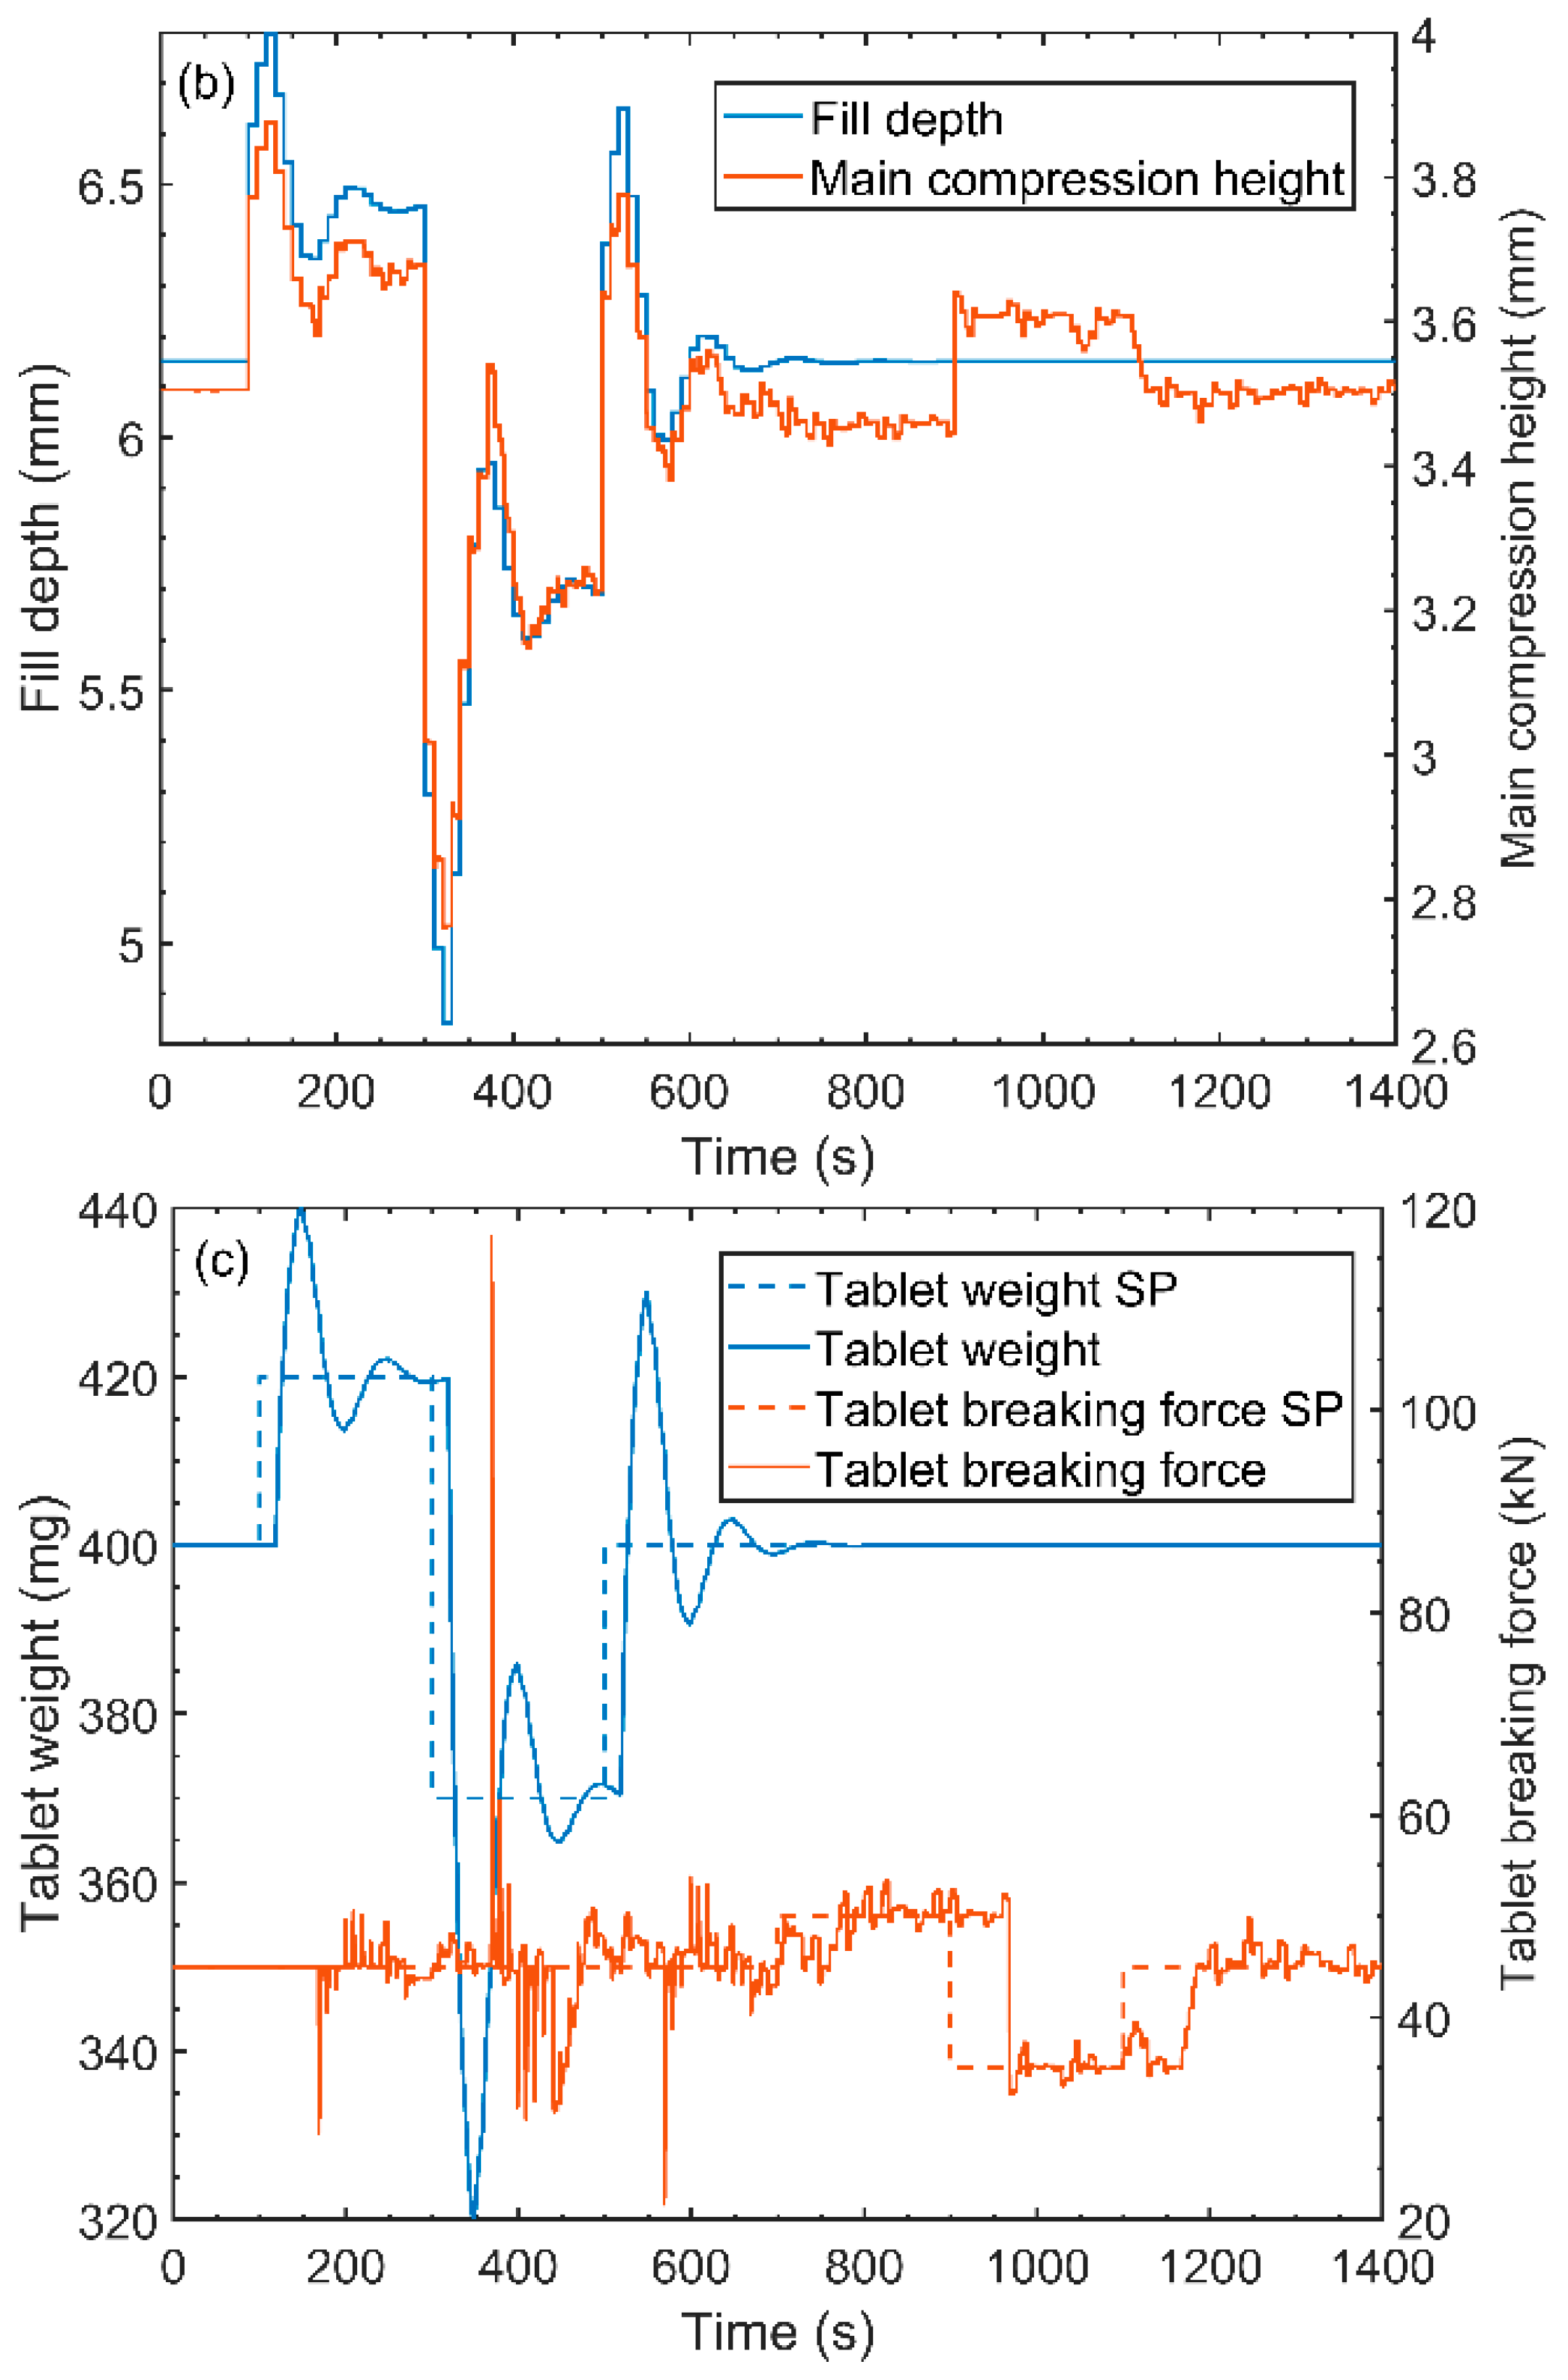
Figure 17.
Control strategy 3—Disturbance rejection scenario. (a) Critical process parameters (b) Actuators (c) Critical quality attributes.
Figure 17.
Control strategy 3—Disturbance rejection scenario. (a) Critical process parameters (b) Actuators (c) Critical quality attributes.


Table 1.
Model parameters—Actuators.
| Model Inputs | Model Outputs | Model Details | |||||
|---|---|---|---|---|---|---|---|
| Order | τ1 (s) | τ2 (s) | θ (s) | Gain | R2 | ||
| Fill depth SP | Fill depth | 1 | 1.0694 | - | 5.4986 | 1 | 0.9966 |
| Main compression height SP | Main compression height | 1 | 0.1658 | - | 5.3616 | 1 | 0.9973 |
| Pre-compression height SP | Pre-compression height | 1 | 0.1658 | - | 5.3616 | 1 | 0.9973 |
| Production rate SP | Production rate | 2 | 0.9 | 0.9968 | 8 | 1 | 0.9824 |
SP: Set point.
Table 2.
Model parameters—Critical process parameters.
| Model Inputs | Model Outputs | Model Details | |||||
|---|---|---|---|---|---|---|---|
| Order | τ1(s) | τ2(s) | Θmax(s) | Gain | R2 | ||
| Pre-compression ratio | Pre-compression force | 1 | 2.5058 | - | 12.5 | 1 | 0.9680 |
| Main compression ratio | Main compression force | 1 | 3.4244 | - | 15 | 1 | 0.9659 |
Table 3.
Polynomial coefficients.
| Polynomial Constants | Pre-Compression Force (−) | Main Compression Force (−) |
|---|---|---|
| a1 | 80.92 | 55.97 |
| a2 | −219.40 | −150.34 |
| a3 | 149.83 | 101.98 |
Table 4.
MPC tuning parameters.
| Controller | Ts (s) | P (Samples) | M (Samples) | Output Weight | Input Rate Weight | ||
|---|---|---|---|---|---|---|---|
| CV 1 (-) | CV 2 (-) | MV 1 (-) | MV 2 (-) | ||||
| MCF | 1 | 40 | 2 | 1 | - | 0.1 | - |
| Strategy 1 | 1 | 25 | 2 | 0.135 | 0.135 | 0.739 | 0.739 |
| Strategy 2—Master | 4 | 20 | 2 | 1 | 1 | 0.1 | 0.1 |
| Strategy 2—Slave | 1 | 25 | 2 | 0.135 | 0.135 | 0.739 | 0.739 |
| Strategy 3—Master | 4 | 20 | 2 | 1 | 1 | 0.1 | 0.1 |
| Strategy 3—Slave | 4 | 20 | 2 | 1 | - | 0.1 | - |
Ts: Sampling time, P: Prediction horizon, M: Control horizon CV: Controlled variable, MV: Manipulated variable.
Table 5.
Closed loop performance metrics.
| Strategy | IAE (kN s) | ITAE (kN s) | ISE (kN s) | Rise Time (s) | Settling Time (s) | Overshoot (%) | Steady State Error (%) |
|---|---|---|---|---|---|---|---|
| Experimental PI | 289.95 | 18506 | 693.45 | 121 | 211 | 0 | 0 |
| Simulated PI | 204.00 | 6596.2 | 626.48 | 64 | 120 | 6.11 | 0 |
| Experimental MPC | 180.50 | 5688.6 | 564.33 | 46 | 153 | 0 | −7.50 |
| Simulated MPC | 111.65 | 5216.2 | 317.78 | 23 | 24 | 0 | 2.788 |
| Simulated MPC with disturbance model | 86.830 | 954.490 | 333.68 | 23 | 25 | 0.448 | 0 |
IAE: Integral absolute error, ITAE: Integral time-weighted absolute error, ISE: Integral squared error.
© 2017 by the authors. Licensee MDPI, Basel, Switzerland. This article is an open access article distributed under the terms and conditions of the Creative Commons Attribution (CC BY) license (http://creativecommons.org/licenses/by/4.0/).
Share and Cite
MDPI and ACS Style
Nunes de Barros, F.; Bhaskar, A.; Singh, R. A Validated Model for Design and Evaluation of Control Architectures for a Continuous Tablet Compaction Process. Processes 2017, 5, 76. https://doi.org/10.3390/pr5040076
AMA Style
Nunes de Barros F, Bhaskar A, Singh R. A Validated Model for Design and Evaluation of Control Architectures for a Continuous Tablet Compaction Process. Processes. 2017; 5(4):76. https://doi.org/10.3390/pr5040076
Chicago/Turabian StyleNunes de Barros, Fernando, Aparajith Bhaskar, and Ravendra Singh. 2017. "A Validated Model for Design and Evaluation of Control Architectures for a Continuous Tablet Compaction Process" Processes 5, no. 4: 76. https://doi.org/10.3390/pr5040076
Note that from the first issue of 2016, this journal uses article numbers instead of page numbers. See further details here.