Dynamics of the Bacterial Community Associated with Phaeodactylum tricornutum Cultures
by
 , ,
, ,
Fiona Wanjiku Moejes
1 ,
,
Antonella Succurro
2,3,*,†,
Ovidiu Popa
2,4,†, 
Julie Maguire
1 and
Oliver Ebenhöh
2,4,* 1
Bantry Marine Research Station, Gearhies, Bantry P75 AX07, Co. Cork, Ireland
2
Cluster of Excellence on Plant Sciences (CEPLAS), Heinrich-Heine University, Universitätsstrasse 1, 40225 Düsseldorf, Germany
3
Botanical Institute, University of Cologne, Zülpicher Strasse 47b, 50674 Cologne, Germany
4
Institute of Quantitative and Theoretical Biology, Heinrich-Heine University, Universitätsstrasse 1, 40225 Düsseldorf, Germany
*
Authors to whom correspondence should be addressed.
†
These authors contributed equally to this work.
Processes 2017, 5(4), 77; https://doi.org/10.3390/pr5040077
Submission received: 17 October 2017
/
Revised: 24 November 2017
/
Accepted: 28 November 2017
/
Published: 7 December 2017
(This article belongs to the Special Issue Microbial Community Modeling: Prediction of Microbial Interactions and Community Dynamics)
Abstract
:The pennate diatom Phaeodactylum tricornutum is a model organism able to synthesize industrially-relevant molecules. Commercial-scale cultivation currently requires large monocultures, prone to bio-contamination. However, little is known about the identity of the invading organisms. To reduce the complexity of natural systems, we systematically investigated the microbiome of non-axenic P. tricornutum cultures from a culture collection in reproducible experiments. The results revealed a dynamic bacterial community that developed differently in “complete” and “minimal” media conditions. In complete media, we observed an accelerated “culture crash”, indicating a more stable culture in minimal media. The identification of only four bacterial families as major players within the microbiome suggests specific roles depending on environmental conditions. From our results we propose a network of putative interactions between P. tricornutum and these main bacterial factions. We demonstrate that, even with rather sparse data, a mathematical model can be reconstructed that qualitatively reproduces the observed population dynamics, thus indicating that our hypotheses regarding the molecular interactions are in agreement with experimental data. Whereas the model in its current state is only qualitative, we argue that it serves as a starting point to develop quantitative and predictive mathematical models, which may guide experimental efforts to synthetically construct and monitor stable communities required for robust upscaling strategies.
1. Introduction
Microalgae are photosynthesis-driven cells able to store light energy by converting carbon dioxide into carbohydrates, lipids, proteins, and other cellular components with potential biofuel, food, feed, and pharmaceutical and nutraceutical applications [1]. Novel applications also include the use of microalgae as an alternative sustainable development tool [2]. One such microalgae is the pennate diatom Phaeodactylum tricornutum that is able to synthesize a number of industrially relevant molecules applicable in: aquaculture as feed in e.g., bivalve, echinoderm, crustacean and fish hatcheries [3,4]; as biomass for biofuels [5,6]; pharmaceuticals and nutraceuticals [5,7,8,9]; and nanotechnology [10], and bioremediation industries [11]. To fully exploit the industrial potential of microalgal-derived products, substantial quantities of microalgal biomass is required, preferably obtained while maintaining low production costs. This is achieved by implementation of large-scale cultivation methods such as open raceway ponds and photobioreactors. The majority of conventional cultivation methods rely on keeping monocultures of the desired species, particularly if the final product is a bioactive molecule for human consumption [12]. Photobioreactors are closed systems that allow for the production of monoseptic cultures, fully isolated from potential contamination if cultivation protocols are followed correctly [13]. However, high operational costs of photobioreactors might not be sustainable. Another option is open raceway ponds, which are simple open-air cultivation systems that have been in use since the 1950s [1]. They are highly susceptible to contamination, and unless the desired species is a halophile or thermophile [14], it is hard to maintain monocultures. Irrespective of the cultivation method, the establishment of unwanted organisms such as amoeba, ciliates, rotifers, bacteria, viruses, and other photosynthetic organisms in microalgal cultures, is a serious obstacle for large-scale microalgae cultivation [15,16]. Although much research is carried out in the field of microalgal culture upscaling, very little is known about the true identity and characteristics of these invading organisms, responsible for microalgal culture “crashes” which lead to loss of biomass, and therefore, loss of revenue.
Microalgae are not found in monoculture in nature and it is not surprising that imposing such an artificial environment results in unstable large-scale cultures. By understanding rather than attempting to push out these micro-invaders, potential alternatives such as “synthetic ecology” as novel scaling up techniques should be explored [17]. This concept is based on the Competitive Exclusion Principle, or Gause’s Law, which states that two species competing for the same natural resource scarcely ever occupy a similar niche [18,19]. By “synthesizing” a community of organisms that fills every niche in the ecosystem of the microalgal culture and support, rather than harm, the growth of the phototroph, we would automatically optimize the utilization of nutrients and prevent the establishment of other potentially harmful organisms [17]. In order for synthetic ecology to be a legitimate contender as a novel scaling up technique, a greater understanding of species-specific interactions is required, starting with the bacterial faction, which are present in all of the Earths’ biomes [20], and arguably the key players in maintaining balance within a system. Theoretical ecology employs mathematical models to study the emergent patterns in ecosystems dynamics [21]. Because of the many industrial applications of microbial communities, current research has shown great interest in improving our understanding of such systems [22]. In particular, mathematical models and interdisciplinary approaches are fundamental to understanding the crucial underlying mechanisms that regulate community dynamics [23,24]. Since the same system can be inspected at different spatio-temporal scales and at a different degree of complexity, it is important to select the most suitable method to describe the biological phenomena under study in mathematical terms [25]. The first ecosystem models at the population-scale date back to the 1920s with the well-known Lotka-Volterra (LV) predator-prey model [26,27]. Since then, LV models have been extensively used to represent cooperation/competition population dynamics with a system of ordinary differential equations (ODEs). In generalized LV models (gLV) the system includes an arbitrary number of co-existing organisms and they directly represent positive/negative pairwise interactions as fixed parameters [28]. Today, a gLV model can be developed by inferring a co-occurrence network from a time series of metagenomics data [29]. This however requires a reasonable number of time resolved metagenomics data and will provide information on direct, one-on-one interactions only.
Diatoms and bacteria have co-evolved for more than 200 million years [30], and their co-existence is most likely based on a “biological barter trade system”, where substances such as trace metals, vitamins, and nutrients (nitrate, phosphate, silicate, carbon) are exchanged. In this work, we built on previous research that investigated algae-bacterial interactions including Provasoli’s work from 1958 where he suggested that bacteria can enhance the growth of algae [31], and subsequent species-specific studies that further corroborated his initial idea [32,33,34,35]. We first characterized the relative composition of the bacterial community in non-axenic P. tricornutum cultivated in the presence and absence of trace metals, vitamins and sodium metasilicate at different time points. Secondly, using critical peer-reviewed literature we defined the most likely functional roles of the bacterial factions and constructed a putative interaction network. Lastly, from the derived putative network of interactions, we built an ODE model with modified Verhulst equations [36] for microbial growth that included the direct effect of nutrient availability. Mortality rates were also introduced as dependent on specific bactericidal substances. The qualitative mathematical model, with parameters fitted to the available experimental data, served as a proof-of-concept that data as obtained here is sufficient to reconstruct a theoretical model that (a) reproduces the experimental observations, thus demonstrating consistency of our assumptions, and (b) allows for testing different hypotheses regarding the nature of the metabolic interactions underlying the ecosystem dynamics. It therefore represents a starting point to gain a deeper understanding of the principles of microbial community dynamics by an iterative experimental and theoretical approach.
2. Materials and Methods
2.1. Strains and Culture Conditions
All P. tricornutum strains were obtained from the Culture Collection of Algae and Protozoa (CCAP) based in Oban, Scotland [37]. All cultures were obtained non-axenic. Based on previous experimental evidence [38], the P. tricornutum strain CCAP1052/1B displayed optimal growth in 5L cultures. P. tricornutum was cultured in Guillard’s medium for diatoms (F/2 + Si) in filtered natural seawater chemically sterilised using sodium hypochlorite and sodium thiosulphate pentahydrate. P. tricornutum was grown in two media conditions; (1) complete F/2 medium containing sources of nitrogen (NaNO) and phosphorus (NaHPO·2HO), as well as trace metals and vitamins with the addition of sodium metasilicate, as per Guillard and Ryther 1962 [39] and Guillard 1975 [40], and (2) minimal media which contained just sources of nitrogen (NaNO) and phosphorus (NaHPO·2HO) at the same concentration as in the F/2 medium recipe. All cultures were grown in hanging 5L polyethylene bags with a “V” shaped bottom prepared using a heat sealer (Supplementary Figure S1). All cultures had a modified aeration system provided by a 10 mL pipette attached to the main pressurised air supply via 0.2 m sterile air filters. Cultures were kept at 18–20 °C and 24 h light at an average of 132.3 mol m s. All cultures, irrespective of media condition, were inoculated with 250 mL from the same 5L stock culture of actively growing non-axenic P. tricornutum.
2.2. Growth Measurements
Growth was monitored every 24 to 48 h using a light microscope and carrying out cell counts of each culture in quadruplicate. During the cell counts the ratios of the four different morphotypes (oval, fusiform, triradiate and cruciform) were recorded, and descriptions of each culture noted. Samples of each culture were subsequently taken using a sterile 10 mL syringe and placed in 50 mL Falcon centrifuge tubes and placed in a −20 °C freezer.
2.3. Genomic DNA Extraction
All samples from days 1, 8, 15, and 22 were thawed in a water bath set at 25 °C. As per de Gouvion Saint Cyr et al. [41], samples were centrifuged for 5 min at 2000 x g to gather the P. tricornutum in the pellet while particles such as debris, other organisms, bacteria, and soluble substances remain in the supernatant. Because the bacteria might be attached to the P. tricornutum cells in the pellet, the pellet was washed with deionised water and then centrifuged for 5 min at 2000× g. This was repeated twice to ensure that majority of the bacteria attached to the pellet were released and were included in the community analysis. Genomic DNA extraction was carried out in the Aquaculture and Fisheries Development Centre, University College Cork. Mo Bio’s PowerWater® DNA Isolation Kit (MO BIO Laboratories, Inc., Carlsbad, CA, USA, catalogue No. 14900-100-NF) was utilized to carry out the genomic DNA extraction. Presence of gDNA was detected by running a 1% agarose-ethidium bromide gel with 72 wells. The samples were sent on dry ice to Heinrich Heine University, Düsseldorf, for the V6 16S sequencing.
2.4. Barcoded 16S-V6-Next Generation Sequencing
Ion Torrent™ barcoded Next Generation Sequencing protocol (Thermo Fischer Scientific Inc., Waltham, MA, USA) was used to sequence the bacterial gDNA [42,43]. Amplification of the V6 hyper variable region of 16S rRNA with forward and reverse primers (Supplementary Table S1) was carried out. Ion Reporter™ software (Thermo Fischer Scientific Inc., Waltham, MA, USA) assembled all the raw sequencing data and sorted all the reads using the unique sample-specific barcode sequences and removed them from the reads. The outcome was raw FASTQ files which were ready for analysis using bioinformatics tools.
2.5. Bioinformatics Analysis
A total of 87,077,374 reads were identified. The smallest sample was just over 1 million reads; the largest sample was just under 10 million reads. The sequencing data was subjected to a pipeline adapted and modified from Pylro et al. [44]. Primers were trimmed with fastq-mcf (version 1.04.807) [45], the resulting sequences were quality filterted and clustered into OTUs with usearch (version 8.0.1517; 32Bit-opensource) [46,47]. Taxonomy assignment was done by QIIME (version 1.9.0) [48] with the implemented uclust classifier based on 97% sequence identity to the reference 16S sequences from SILVA 111 database [49]. Statistical analyses were performed in R [50]. The complete protocol containing all processing steps is available on GitHub (see Supplementary Materials).
2.6. Mathematical Model
Starting from our understanding of the organism-to-organism interactions, we developed a dynamic model consisting of 13 ordinary differential equations (ODEs) and including 56 (55 free) parameters (see Appendix B.1). The model was built from the following working hypotheses:
- (1)
- (2)
- the mortality rate of each population was inversely proportional to (1 + ), to account for the fact that cells during replication (high growth rate) were healthier;
- (3)
- additional contributions to population mortality was given by the presence in the environment of noxious elements like bactericidal substances;
- (4)
- changes in metabolite concentrations are in general directly proportional to the growth of the consumers and producers;
- (5)
- in the event of micronutrient scarcity (Iron and Vitamins in our model), P. tricornutum will secrete more organic carbons favored by those bacteria able to provide the needed micronutrients.
The initial conditions for simulations are different between minimal and complete media:
- (1)
- the initial quantity of Iron and Vitamins is 10 times higher in complete media;
- (2)
- the initial quantity of P. tricornutum biomass is matched to the first data point.
The parameters were fitted separately in minimal and complete media using a genetic algorithm [52] which was run in different steps to optimise the fit of P. tricornutum growth and/or the bacteria relative abundances to the experimental data in evolving system conditions (see Appendix B.2 and Supplementary Material 2). The model was written in Python (Python Software Foundation, https://www.python.org/) and is available on GitHub with instructions and scripts for running (see Supplementary Materials).
3. Results
3.1. Characteristics of Phaeodactylum tricornutum Growth
The media composition was shown to have a significant effect on the growth characteristics of P. tricornutum. P. tricornutum cultivated in minimal media exhibited a statistically significantly (, unpaired Wilcoxon signed rank) higher cell density ( cells/mL) when compared to cultivation in complete media ( cells/mL). The growth rates during the exponential phase in both cultures were d and d respectively. In contrast, the death rates when the cultures “crash” are d and d respectively.
3.2. Bacterial Community Profile of Phaeodactylum tricornutum Cultures
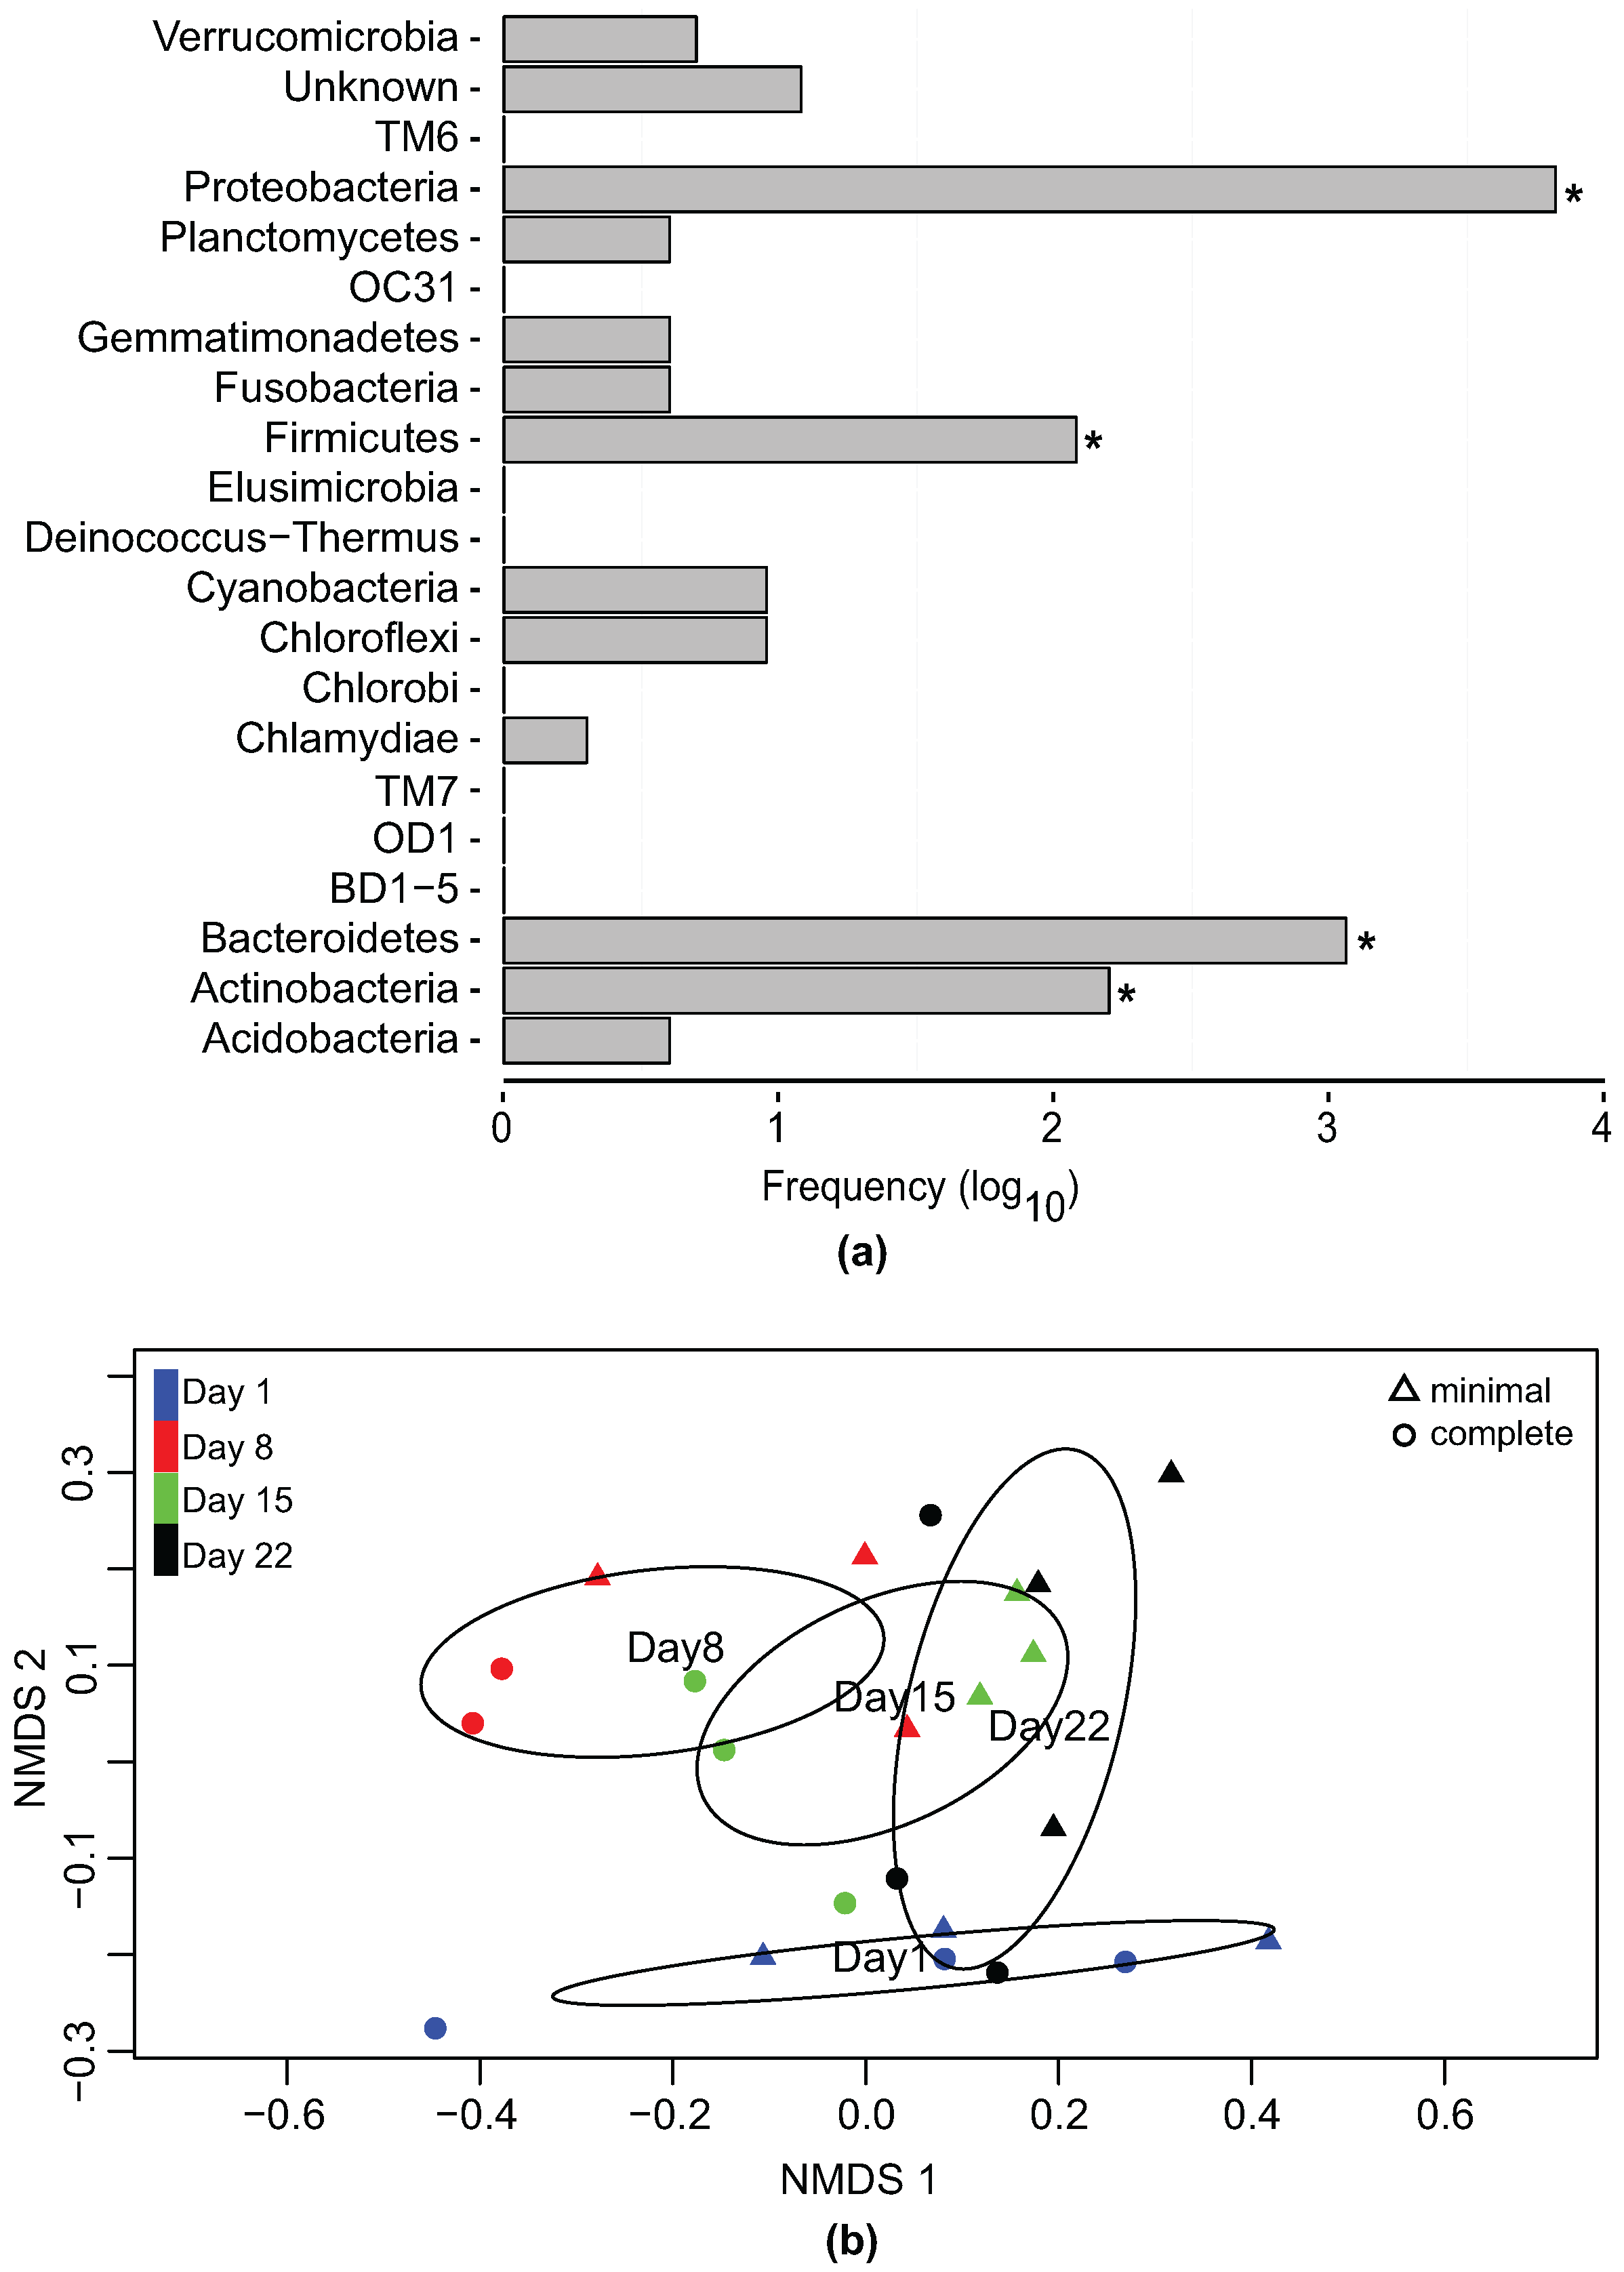
Bacterial gDNA analysis showed that most of the operational taxonomic units (OTUs) could be assigned to the genera level (Supplementary Figure S2). Of the 9727 OTUs identified, 8109 corresponded to known sequences in the SILVA database (v.118) [49]. The OTU abundance at the phylum level showed that 99.97% of all OTUs belonged to Proteobacteria, Bacteroidetes, Actinobacteria and Firmicutes (Figure 1a). A comparison of the number of individual reads to the number of unique OTUs showed that the high number of reads per phyla was not the result of a single OTU (Supplementary Figure S3). OTUs with hits to known 16S P. tricornutum sequences were discarded.
Rarefaction curves were used to evaluate the alpha diversity in the different media conditions as well as at the different time points (Supplementary Figure S4). Species richness in both minimal and complete media was ∼3000. Species richness over time remained between ∼2400 and ∼2600, with reduced species richness (∼1300) on day 8 (both minimal and complete media) possibly due to elevated levels of 16S P. tricornutum chloroplast reads which had to be omitted. Greatest species richness (∼3000) was shown on day 22. All datasets showed a diminished increase in the number of unique species as the sample size increased, confirming adequate species richness in all culture conditions. To compare the species composition between the different samples (days/media) we used a non-metric multidimensional scaling (NMDS) function based on generalized UniFrac distances [53]. This allowed us to characterize the relationship between the particular samples on a visual level by displaying the information contained in the distance matrix. Therefore, similar samples would be placed together in an N-dimensional space. Here we observed a clear gradient of similarity between the bacterial samples from the different time points. The ordination based on the sampling day indicated that the bacterial community was dynamic with a clear divergence visible between day 1 and the other three sampling days. Interestingly the similarity between the different time samples showed the evolving processes of the community over time (overlaps between day 8 with day 15 and day 15 with day 22) and the recovery to the original one (overlap day 22 and day 1) (Figure 1b).
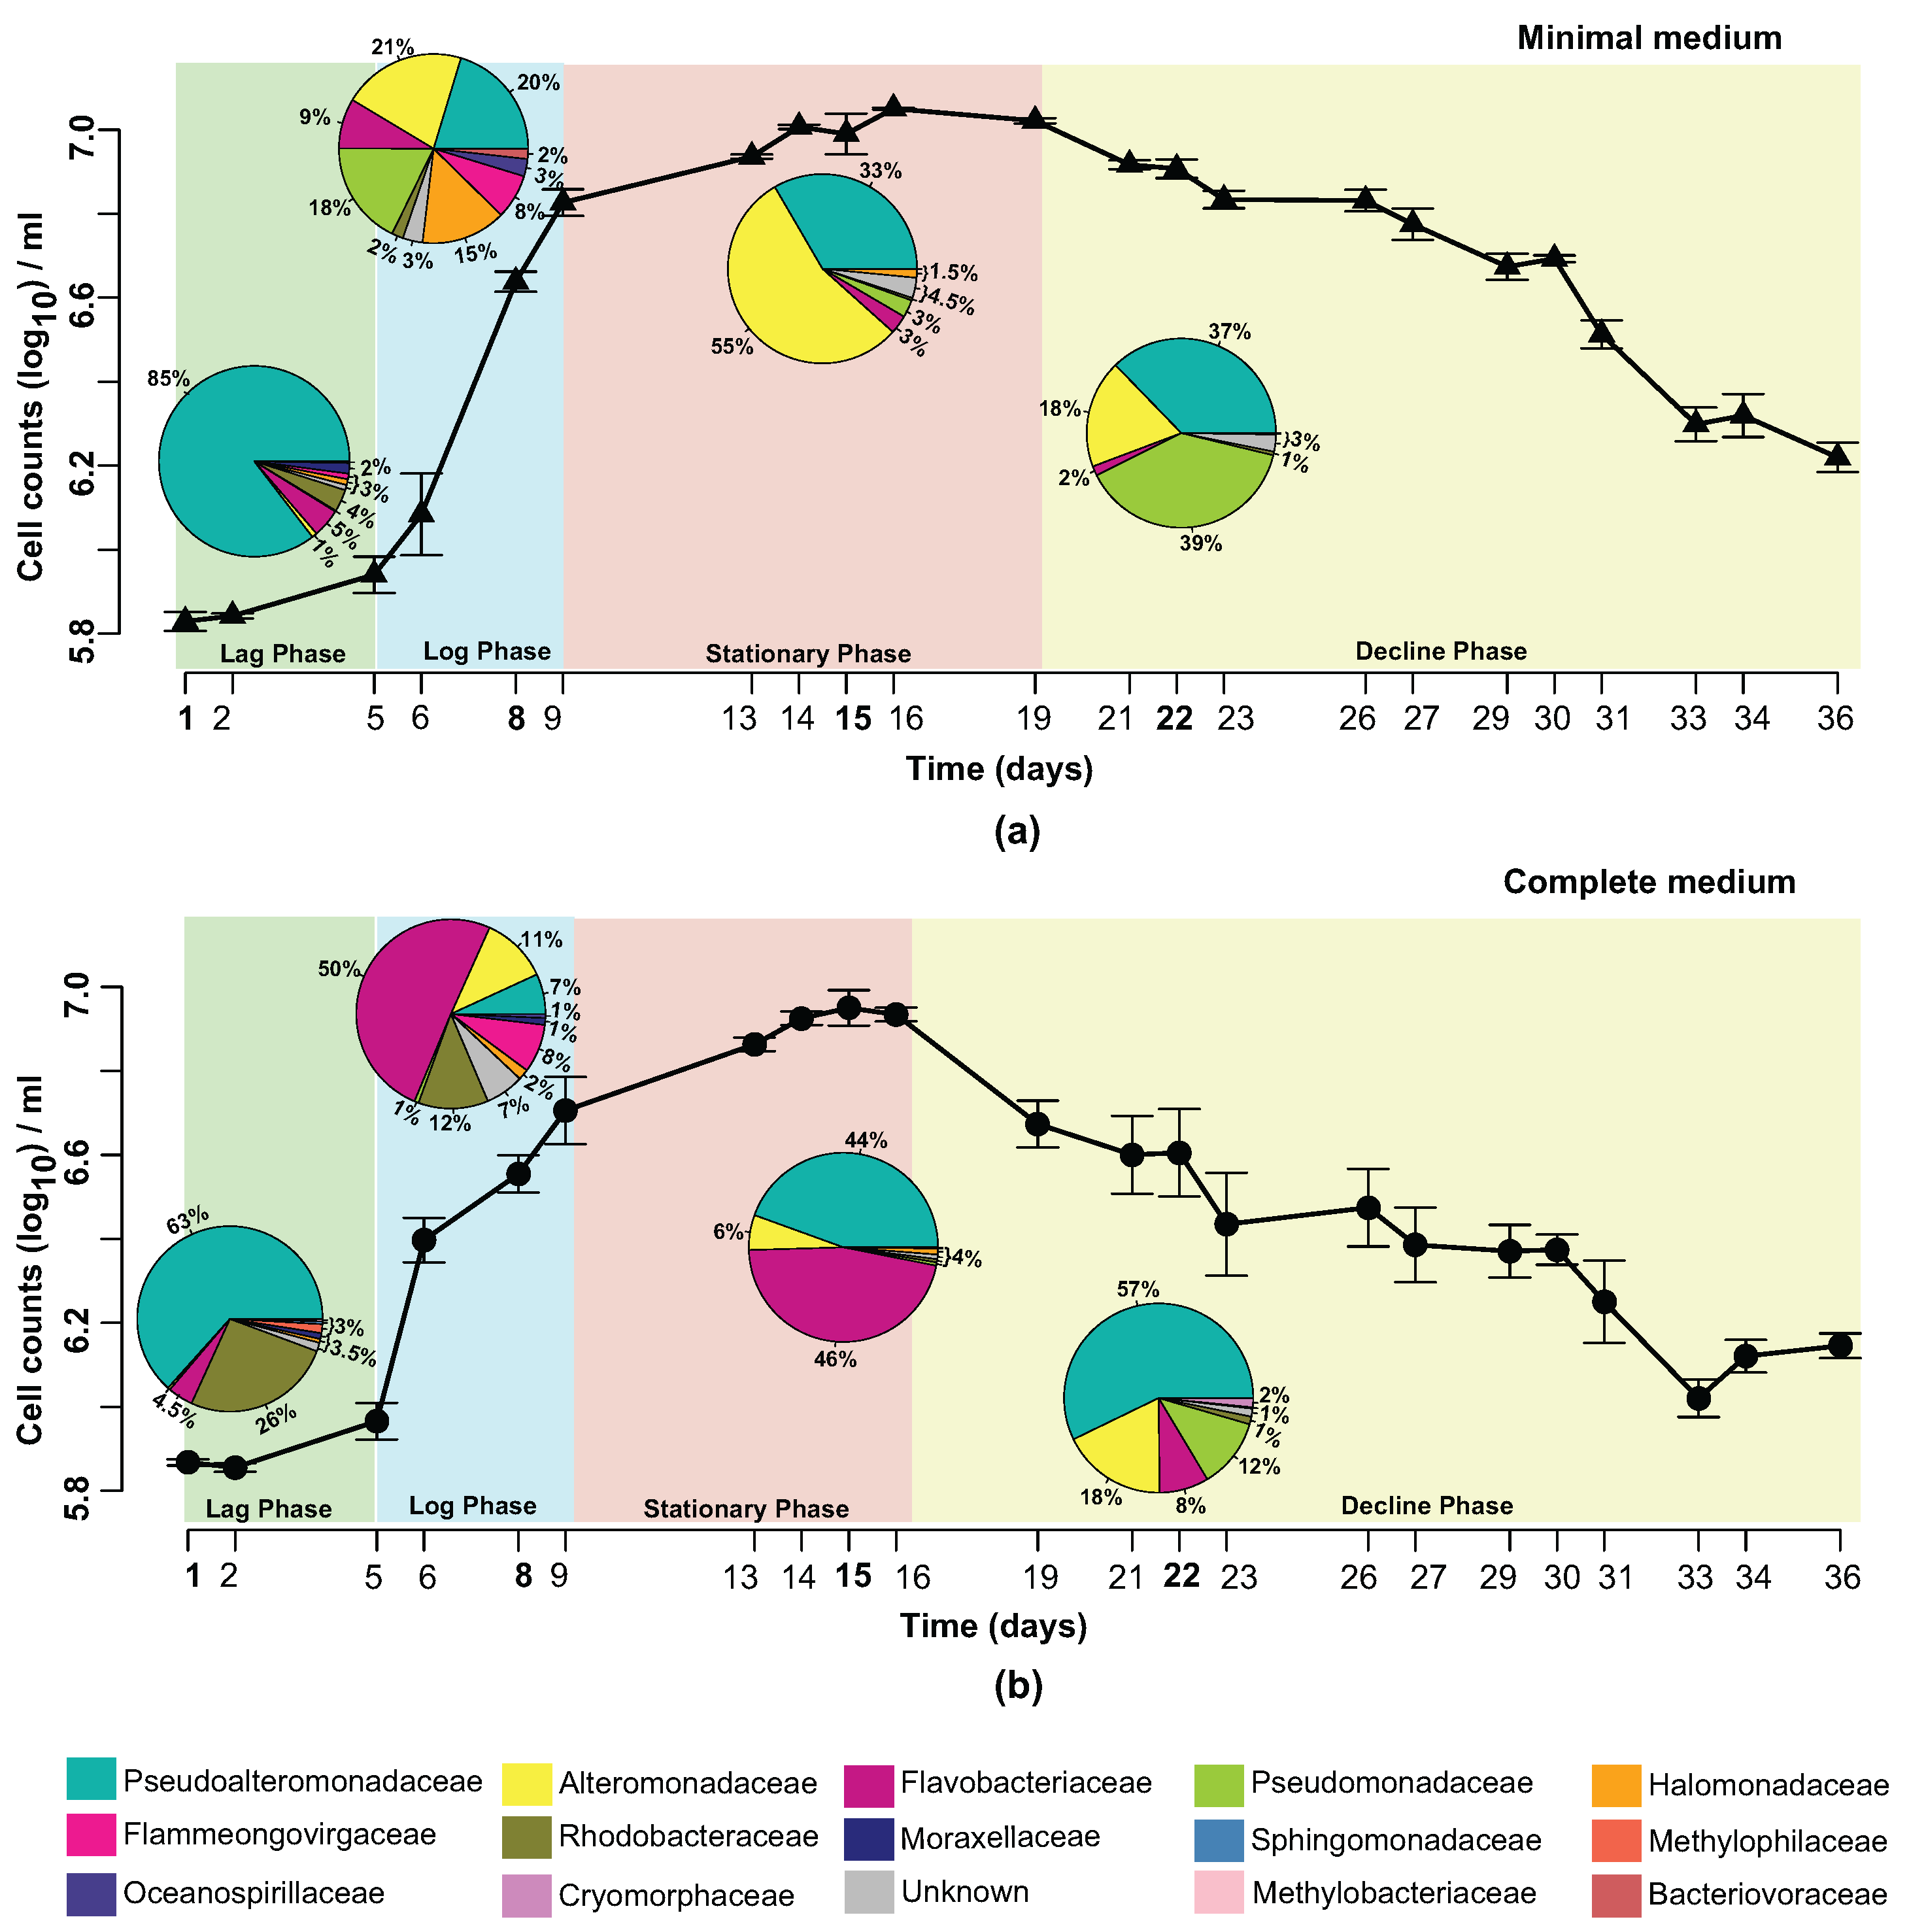
The existence of one dominant family at each investigated time point was a particularly interesting observation. In minimal media (Figure 2a), the lag phase of P. tricornutum growth was dominated by Pseudoalteromonadaceae (85%). However, during the log phase, a wide diversity of bacterial families was observed, with members of the Alteromonadaceae family (21%) beginning to dominate. During the stationary phase, a clear dominance of Alteromonadaceae species (55%) in the community was observed. The decline phase, however, showed the Pseudomonadaceae (39%) as a dominant family, with Pseudoalteromonadaceae species (37%) increasing in abundance again. In complete media (Figure 2b), the lag phase was also dominated by Pseudoalteromonadaceae (63%). During the log phase, 50% of the community was composed of members of the Flavobacteriaceae family, with the other 50% distributed among a number of different families. Flavobacteriaceae (46%) remained high in abundance during the stationary phase, with Pseudoalteromonadaceae species (44%) beginning to increase in abundance again. As for minimal media, Pseudoalteromonadaceae (57%) showed a clear dominance of the community during the decline phase.
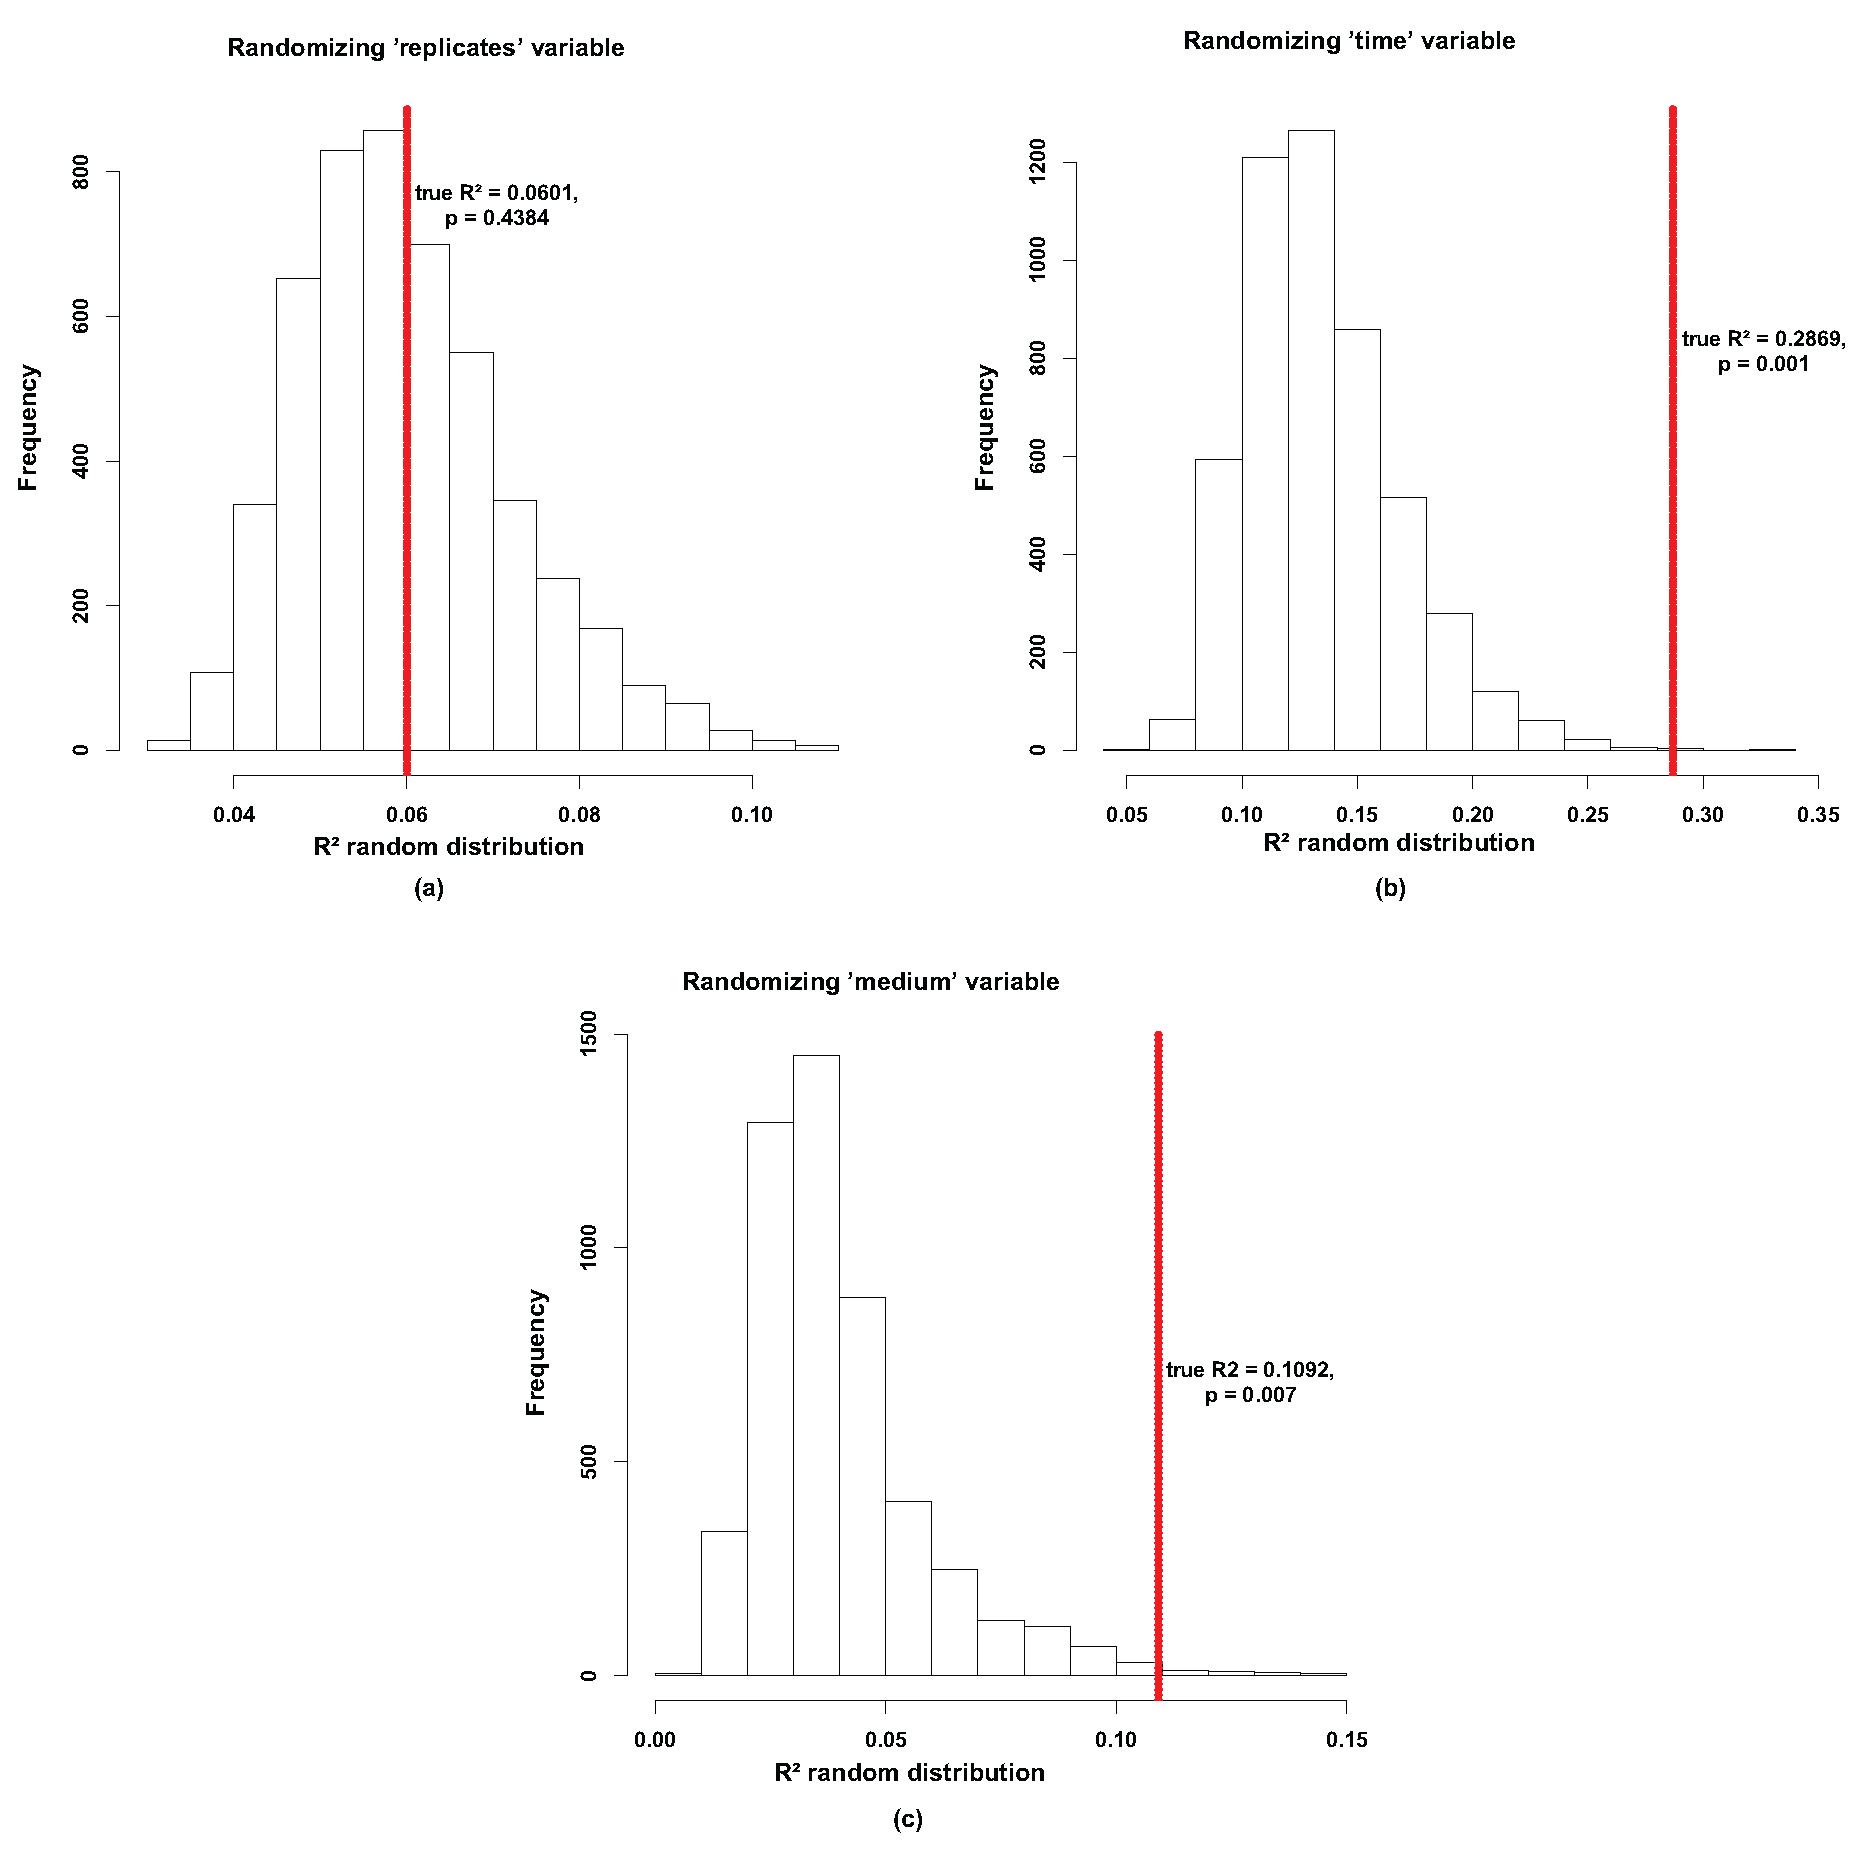
An adapted version of PermanovaG was used to carry out permutational multivariate analysis of variance using multiple distance matrices which were previously calculated based on the generalized UniFrac distance [53]. The significance for the test was assessed by 5000 permutations. The results of the PermanovaG tests support the NMDS ordination, confirming a statistically significant effect in the bacterial community profile at the different sampling points and in the two media conditions whereas no significant effect was found in the experimental replicates (Figure A1).
3.3. Effect of Temporal Evolution and Media Composition on the Bacterial Community Profile
We compared the bacterial community profiles over time and in the different media conditions at the family level to avoid diluting the signal of the less abundant genera. Supplementary Figures S5 and S6 show no dynamical difference within the genera that cannot be observed at the family level. By investigating the bacterial community dynamics at the family level, we also included taxonomical information that is unavailable at the genus level. The families over-represented in all samples were Pseudoalteromonadaceae, Alteromonadaceae, Flavobacteriaceae and Pseudomonadaceae. Figure 2 illustrates the temporal evolution of the bacterial community in both minimal and complete media with a unique composition at each time point. A remarkable feature is that at all investigated time points there exist one or two dominant families.
In complete media, members of the Pseudoalteromonadaceae family were highly abundant when P. tricornutum cell densities were low (63% and 57% on day 1 and day 22, respectively). Flavobacteriaceae species dominated (50%) when the P. tricornutum culture was growing exponentially (day 8). Day 15, when P. tricornutum cell densities were at their highest, showed co-dominance of both Flavobacteriaceae (46%) and Pseudoalteromonadaceae (44%).
In minimal media, members of the Pseudoalteromonadaceae family were highly abundant when P. tricornutum cell densities were low. On day 22 Pseudomonadaceae (39%) and Pseudoalteromonadaceae (37%) were both overrepresented. When the P. tricornutum culture was in its exponential growth phase (day 8), a cluster of Families dominated; namely Alteromonadaceae (21%), Pseudoalteromonadaceae (20%), Pseudomonadaceae (18%), Halomonadaceae (15%) and Flavobacteriaceae (9%). When the cell density of P. tricornutum peaked (day 15), the Alteromonadaceae species took over (55%).
The bacterial communities within the two media conditions on day 1 were more closely related than the communities on days 8 and 15 (see Supplementary Table S2 for generalized UniFrac distances). As the cultures begin to “crash” (day 22), the bacterial communities in the two media conditions increased in similarity again. In general, the main families identified showed a distinct pattern of disappearance and regeneration within the bacterial community. In the complete media, Pseudoalteromonadaceae species started at 63% (day 1), dropped in abundance to 7% (day 8) then recovered to 57% (day 22). Flavobacteriaceae species, in complete media, started at 4.5% (day 1), increased in abundance to 50% (day 8), and then fell back to 8% (day 22). In the minimal media, Alteromonadaceae species had an abundance of only 1% (day 1), peaked at 55% (day 15), and decreased down to 18% (day 22).
3.4. Network of Putative Interactions between Phaeodactylum tricornutum and Identified Bacterial Families
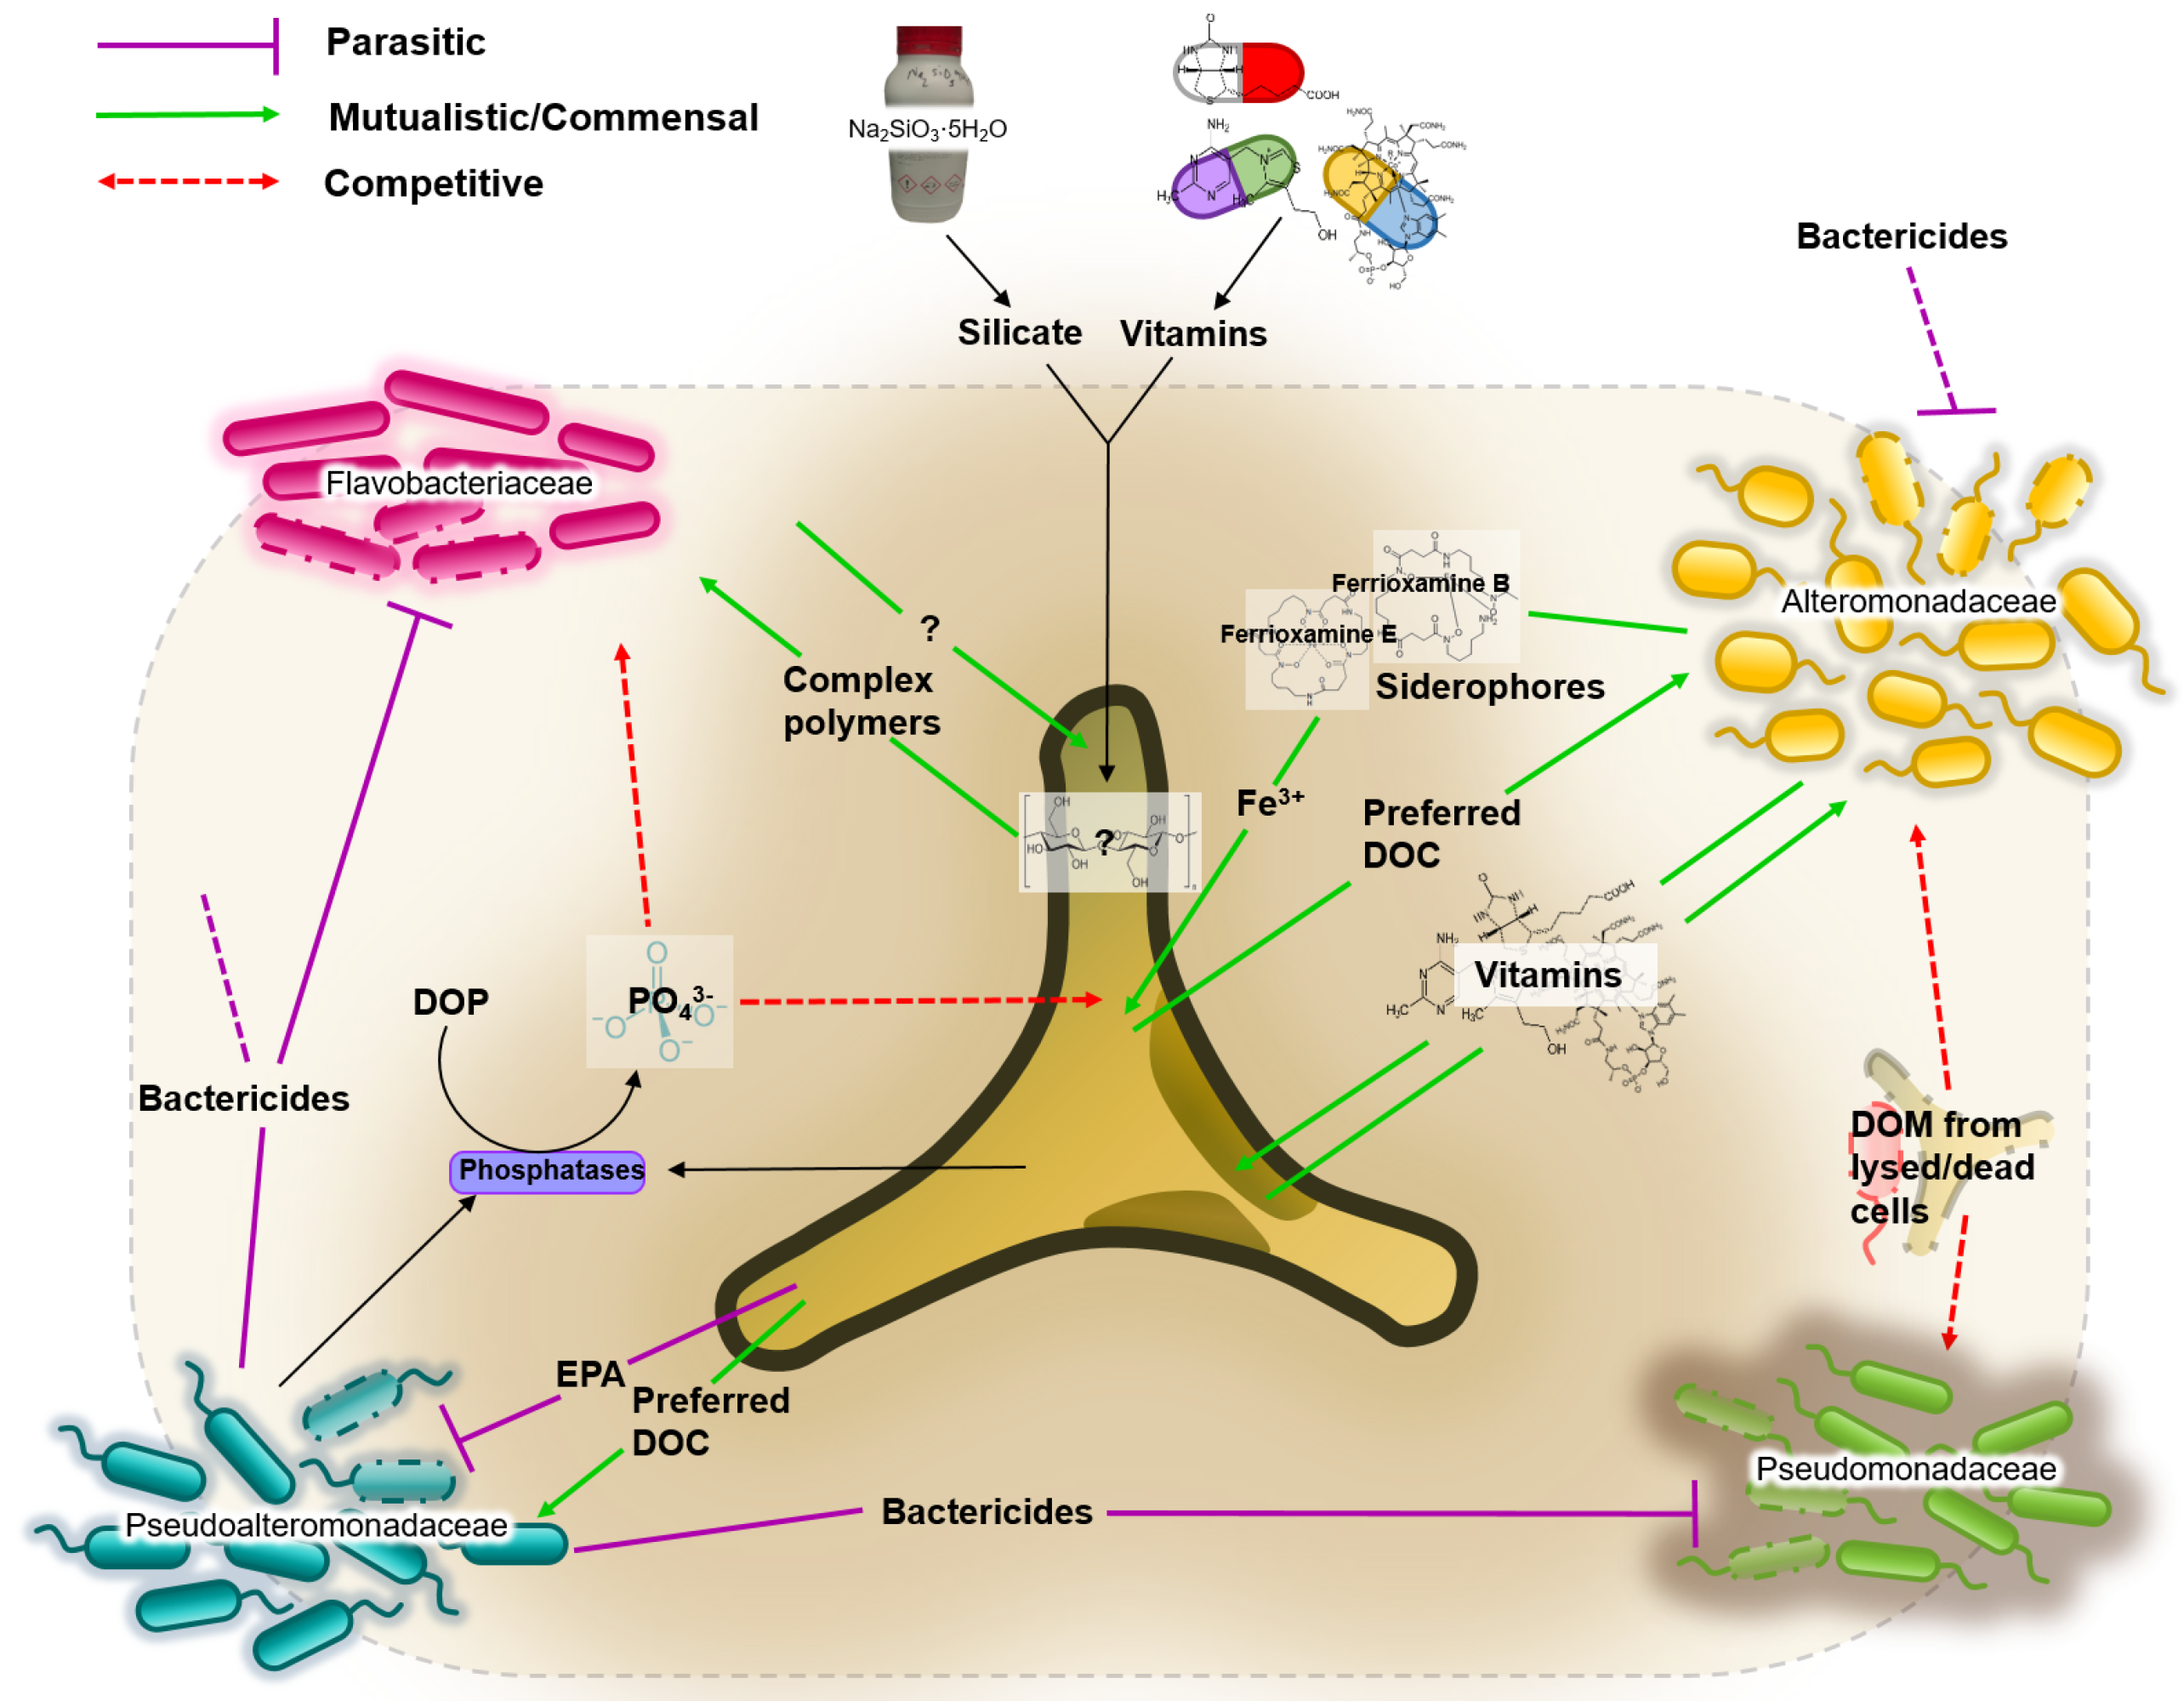
The putative roles of each of the dominant families are illustrated in Figure 3. Based on an extensive literature review, five metabolites were identified as playing a crucial role in the interactions between P. tricornutum and the identified bacterial families. These are: bactericidal metabolites; iron; vitamins; dissolved organic carbons; dissolved organic phosphates.
- Bactericidal metabolites. Several species of the Pseudoalteromonadaceae family have been reported to possess bactericidal effects [54]. This ability to suppress the growth of competing bacteria could explain the dominance of Pseudoalteromonadaceae in almost all cultures irrespective of media composition. P. tricornutum also demonstrates bactericidal properties by excreting fatty acids (such as eicosapentaenoic acid or EPA), nucleotides, peptides, and pigment derivatives [55].
- Iron. Iron acquisition is essential for biological processes such as photosynthesis, respiration and nitrogen fixation. Bacteria produce and excrete siderophores, which scavenge iron. Diatoms are not known to produce siderophores, but genome sequence analyses identified the presence of a gene orthologue of a bacterial ferrichrome binding protein that suggests the possibility of iron (III)-siderophore utilization by P. tricornutum [56,57]. Furthermore, it was shown that P. tricornutum was able to uptake siderophores ferrioxamines B and E [58].
- Vitamins. Prokaryotes are thought to be the main producers of B vitamins [59,60]. Although P. tricornutum does not require cobalamin, thiamine and biotin [61], production of organic compounds such as EPA can be considerably enhanced by the bioavailability of co-factors such as cobalamin [62]. This provides the basis for potential mutualistic interactions. For example, Alteromonadales, dominant in our cultures, are thought to be capable of producing B vitamins [63].
- Dissolved Organic Carbon (DOC). It is estimated that up to 50% of carbon fixed via phytoplankton-mediated photosynthesis is utilized by marine bacteria [64], mainly as DOC compounds, defined as the organic material <m in size [65]. DOC from diatoms originates either from live cells or recently lysed or grazed cells, which determines the type of DOCs available, and therefore are likely to influence the bacterial consortia associated with the diatom [30].
- Dissolved Organic Phosphate (DOP). Both diatoms and bacteria primarily utilize orthophosphate as a source of phosphorus. However, to access phosphate from DOP compounds, both diatoms and bacteria developed mechanisms to release orthophosphate (PO) from DOP. The mechanism is not species-specific, which consequently means the “free” orthophosphates can be acquired by any organism [66].
3.5. Mathematical Model Simulations
Based on the network of putative interactions between diatoms, bacteria, and the environment, we constructed a dynamic mathematical model, based on generalized Verhulst growth-laws [36] extended with Monod-type terms [51] to reflect the dependencies on metabolites (see Materials and Methods and Appendix B.1). Figure 4 presents results of the model simulations after the model parameters were fitted to the data in minimal and complete media conditions, respectively (see Appendix B.1). Experimental data are superimposed. The top panel shows biomasses of the five organisms (data available only for the diatom), the bottom panel shows relative bacteria abundance versus time (individual biomass divided by total bacterial biomass). Because of the qualitative nature of the model, units are arbitrary. The figures show that the model is able to reproduce the main features of the bacterial community dynamics, such as the disappearance and return of Pseudoalteromonadaceae in complete media and the peak of Alteromonadaceae at the end of the exponential growth phase of P. tricornutum in minimal media. Supplementary Figure S7b and S7d show the dynamics of metabolite concentrations, for which no data are available.
Due to the large number of free parameters, the fit was certainly not unique. Supplementary Material 2 presents additional checks we performed on the parameter fitting procedures. The parameter space could be in principle reduced to 43 free parameters, but this did not change the results. It was not possible to find a unique parameter set valid in both minimal and complete media conditions. This is however consistent with the fact that the model was not constructed to capture effects like metabolic re-adjustments, something that would be observed e.g., as a different parameter value for growth rate or metabolite consumption. With the data available, it was not possible to make any quantitative statements about the actual interaction parameters, neither could it be assumed that simulation results are of general validity. Despite these limitations, the model did represent a possible configuration of diatom-bacteria-environment interactions, which was in agreement with the experimentally observed bacterial dynamics.
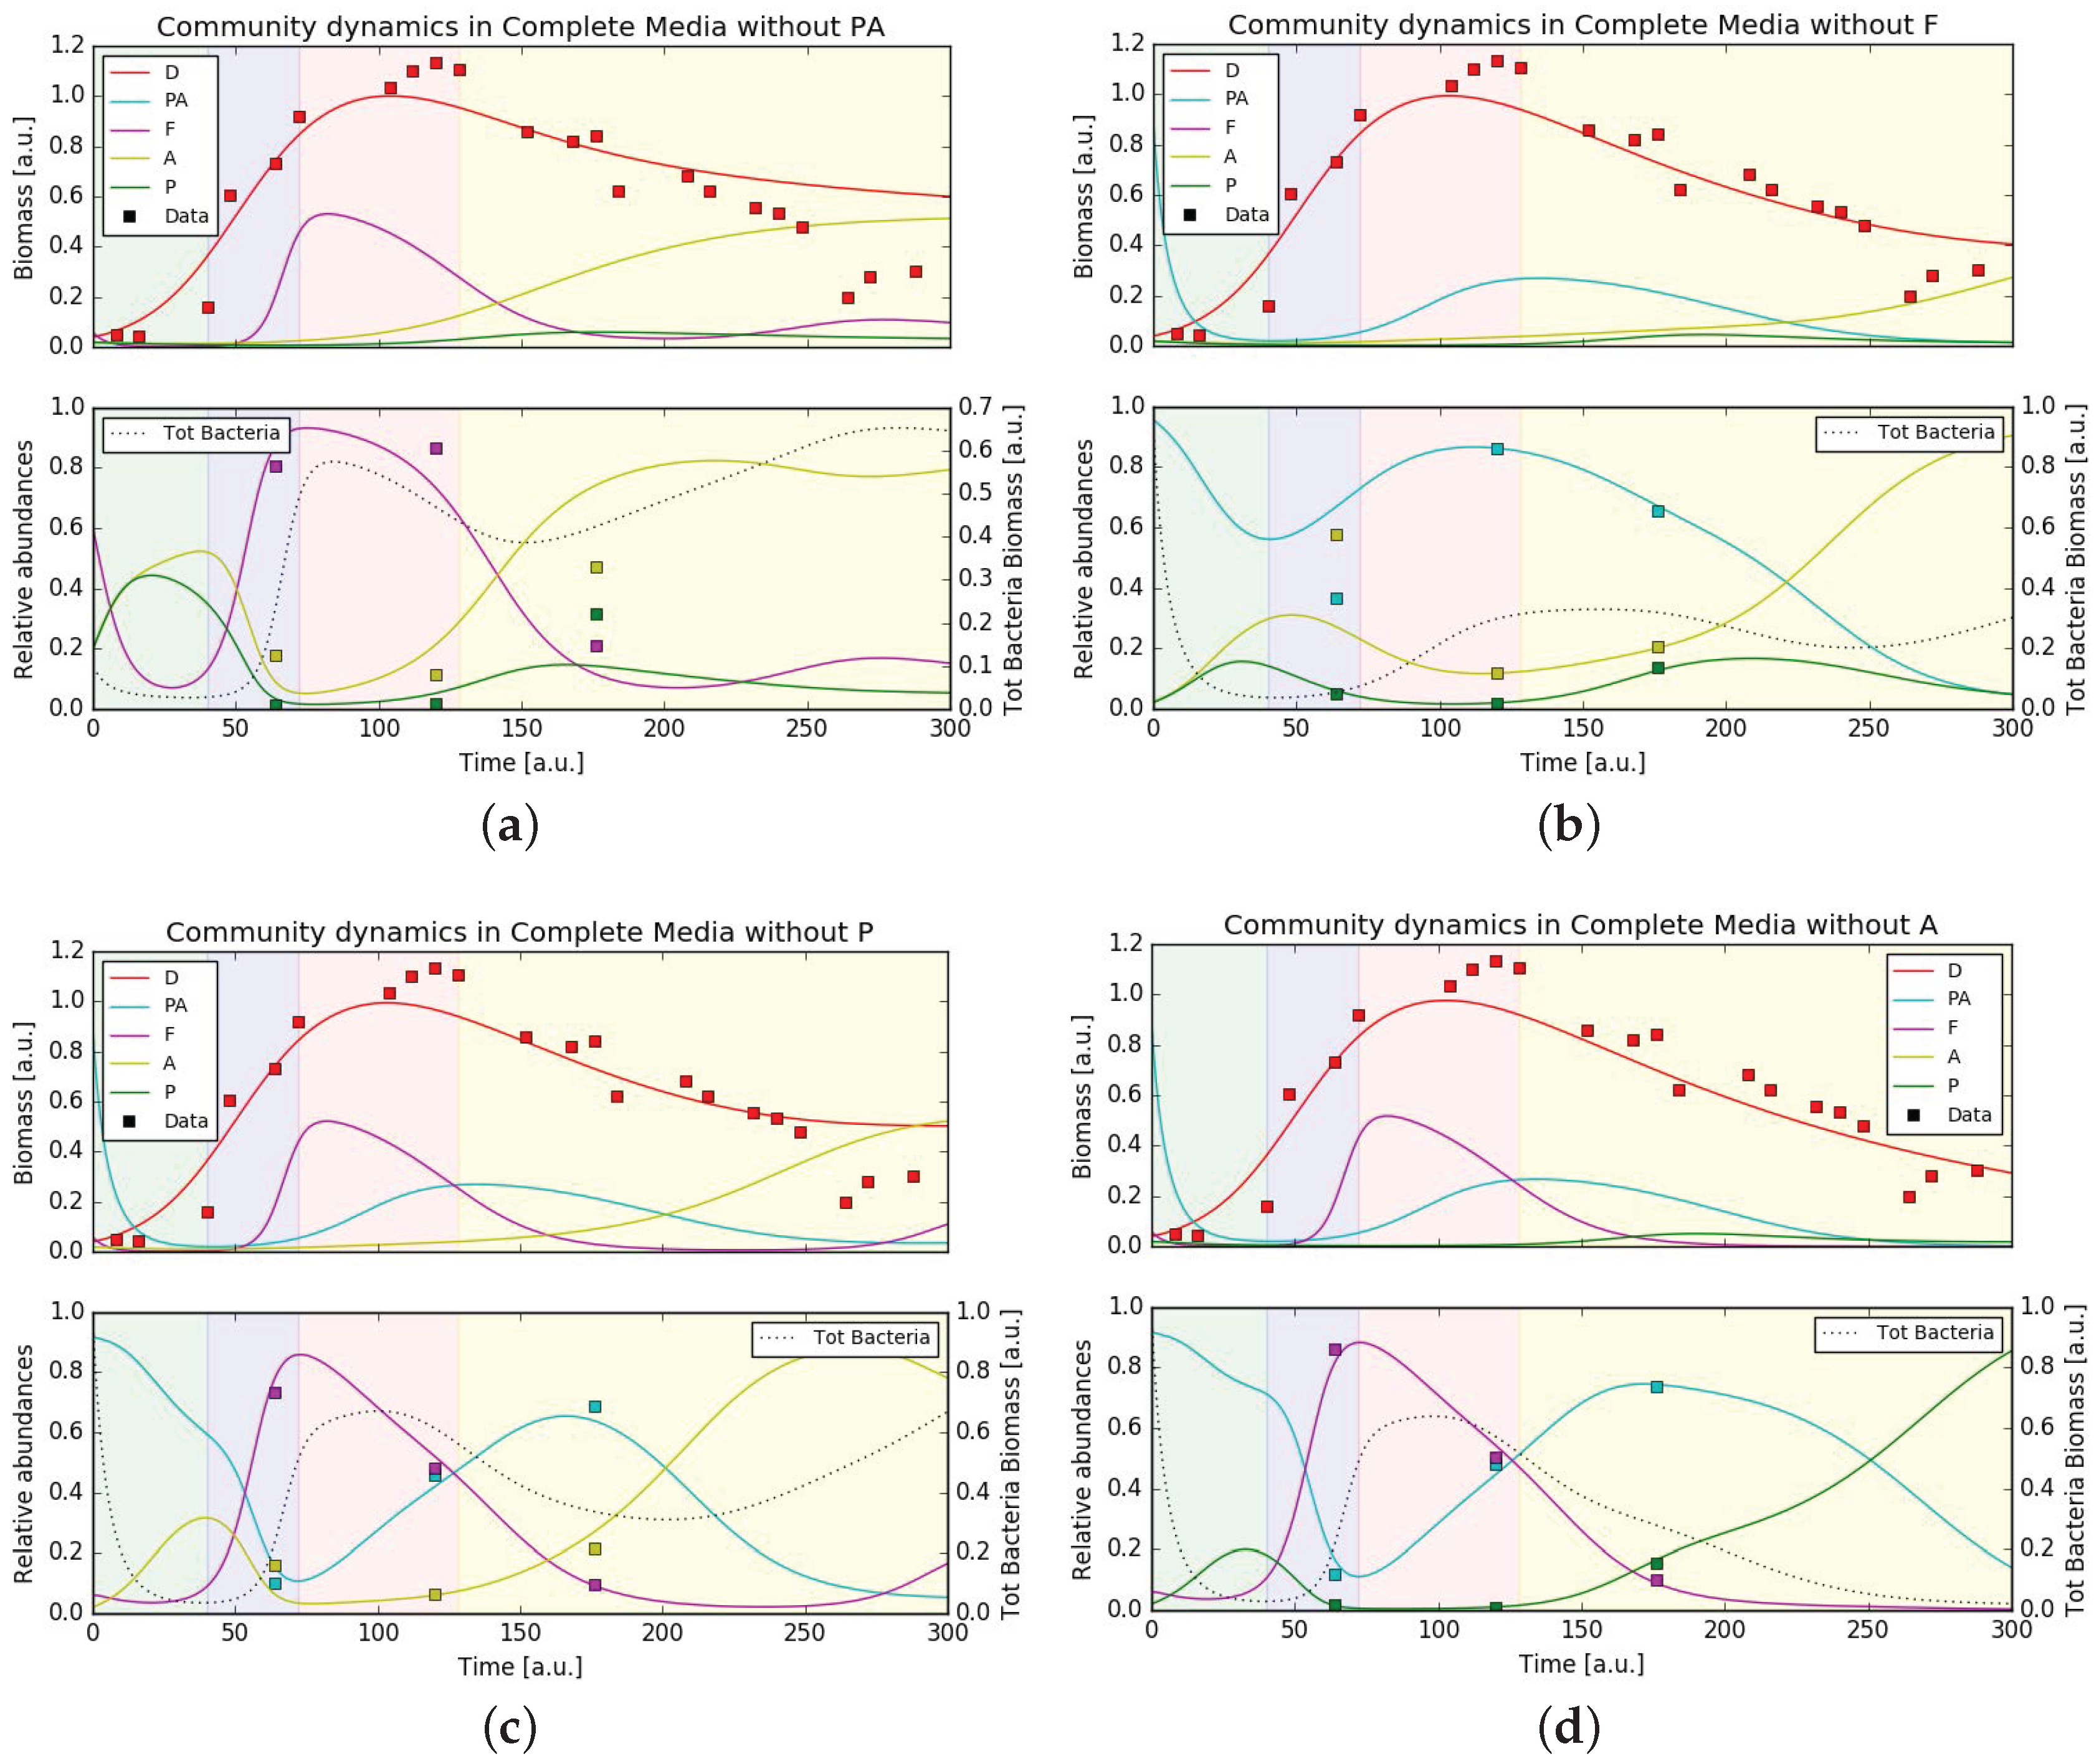
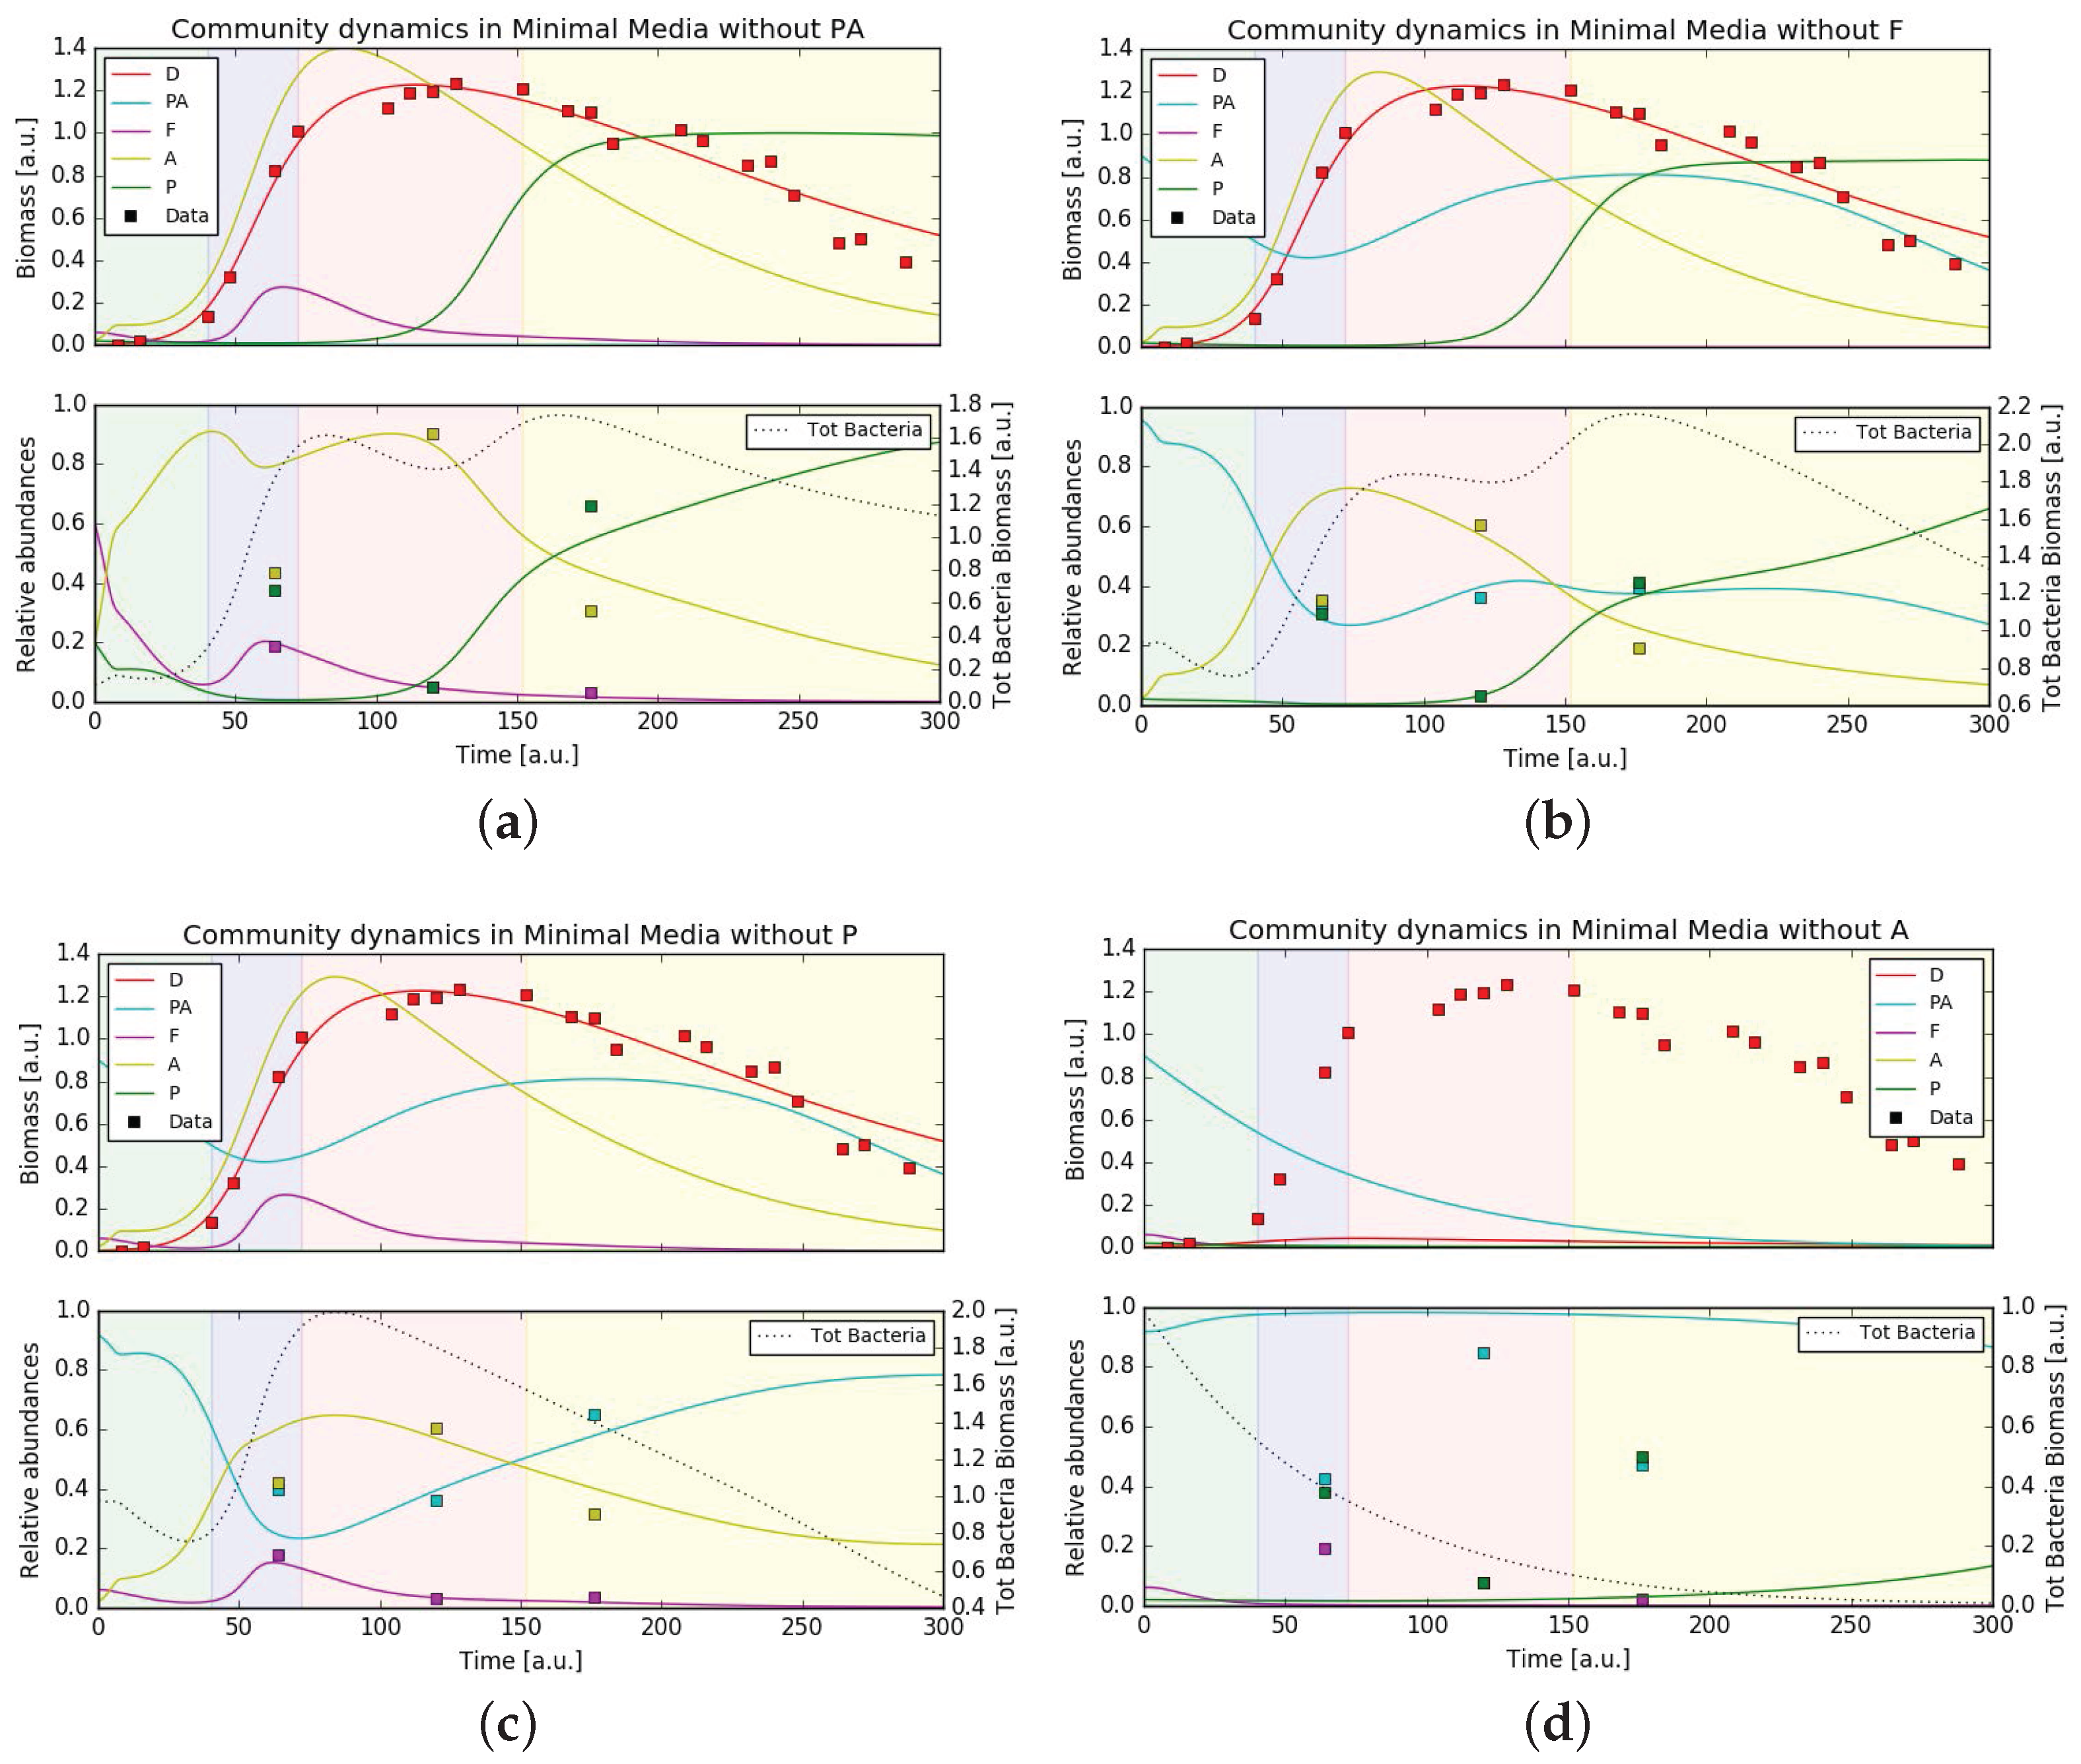
In order to test the stability of the bacterial community and how it supports the growth of P. tricornutum we ran simulations using the same set of parameters (either minimal or complete media conditions) and varied the initial community composition removing one bacteria per simulation. In complete media the simulated growth of P. tricornutum still fit the experimental data, rather independently from the bacterial community (Figure 5). Also under axenic conditions, diatom growth was predicted to be largely unperturbed. This situation was different in minimal media. While under these conditions diatom growth was also unaffected upon removal of the three bacterial families Pseudoalteromonadaceae, Flavobacteriaceae and Pseudomonadaceae, removing Alteromonadaceae from the community resulted in the total absence of P. tricornutum growth (Figure 6). This behavior was expected from the hypothesized central role of Alteromonadaceae in supplying the diatom with micronutrients. Surprisingly, the removal of a single bacteria from the community in both media conditions still gave, in general, a good fit of the (recomputed) relative abundances, except when removing Alteromonadaceae in minimal media (as direct consequence of what stated previously) and when removing Pseudoalteromonadaceae in both media conditions. This hinted to a relevant role of Pseudoalteromonadaceae in regulating the community composition through its predatory strategy of releasing bactericidal substances. Finally, the community composition at the last time point was overall better captured. This suggests that the mathematical model consistently captured the general interactions leading one bacterial family to dominate over the others on the long term.
4. Discussion
In nature, P. tricornutum does not exist as an isolated entity. In fact, it is part of a complex ecosystem whose complete network of interactions with both its environment and other organisms remains poorly understood. Microbial ecosystems are of high interest for a wide range of applications in fields, such as medicine, renewable energy, and agriculture. Within the scope of this project, the complexity of a natural, variable system was reduced by investigating the batch growth of non-axenic laboratory strains of P. tricornutum from a culture collection. The cultivation method we developed was designed to compromise between highly controlled small-scale laboratory conditions and a large-scale industrial set-up. The bacterial community was characterized and the community dynamics investigated in two conditions: minimal and complete media. The data was then complimented with an extensive study of existing, peer-reviewed literature to identify the putative role of the dominant bacterial families associated with P. tricornutum. We then validated the derived network of interactions by developing a mathematical model which could reproduce the observed dynamics. The presented approach, integrating experiments, bioinformatics and mathematical modeling, illustrates a possible way towards the development of a monitoring pipeline for non-axenic microalgae cultures.
4.1. Experimental Observation of the Dynamics of the Bacterial Community Associated to Phaeodactylum tricornutum
The growth dynamics of P. tricornutum in the two media conditions showed an accelerated “culture crash” in the complete media compared to the minimal media, which indicated a more stable culture in the minimal media (Figure 2). This also suggested that non-axenic cultures of P. tricornutum might not require expensive trace metals and vitamins for optimal growth under the conditions provide, an observation crucial to the large-scale industrial cultivation of P. tricornutum as this would drastically decrease the production costs. Simultaneously, the dynamics of the bacterial community revealed that the community in the minimal media increased in complexity over time. The link between ecosystem complexity and stability based on theoretical and experimental data has been debated by ecologists for over half a century [68,69,70,71]. Our observations are in agreement with more recent hypotheses indicating that diversity generally increases the stability of an ecosystem [72].
4.2. Literature-Based Assessment of the Putative Role of Each Bacterial Family
The bioinformatics analysis of bacterial gDNA abundance showed clear dominance of four bacterial families: Pseudoalteromonadaceae, Alteromonadaceae, Flavobacteriaceae and Pseudomonadaceae. These bacteria were over-represented in all samples and their relative abundances showed different temporal dynamics among the two P. tricornutum growth conditions. In order to understand the putative functional role of these bacteria an extensive study of peer-reviewed literature was carried out.
Pseudoalteromonadaceae. Members of Pseudoalteromonadaceae family have been isolated from coastal, open and deep-sea waters, sediments, marine invertebrates, as well as marine fish and algae [73]. The Pseudoalteromonadaceae family has three genera, namely Pseudoalteromonas, Algicola and Psychrosphaera [74]. Several species of Pseudoalteromonadaceae are reported to possess antibiotic properties with bactericidal effects [54]. For example, concentrated supernatant of a marine bacterium Pseudoalteromonas
sp. strain A28 contained various enzymes including proteases, DNAses, cellulases, and amylases, capable of causing the lysis of the diatom Skeletonema costatum [75]. Species of Pseudoalteromonadaceae are also capable of producing cold-adapted enzymes [76,77,78,79,80,81]. Pseudoalteromonadaceae species can produce extracellular polymeric substances allowing them to colonise surfaces, enhancing nutrient uptake whilst limiting diffusion of particular substances across the cell membrane [82]. The ability of Pseudoalteromonadaceae species to suppress the growth of competing bacteria could explain the dominance of Pseudoalteromonadaceae in almost all cultures irrespective of media composition, particularly when P. tricornutum abundance is limited (Figure 2, days 1 and 22). P. tricornutum on the other hand, may protect other bacterial community members from the bacteriolytic ability of Pseudoalteromonadaceae by producing specific antibacterial compounds themselves. Desbois et al. showed that P. tricornutum excreted bacteriolytic fatty acids such as eicosapentaenoic acid (EPA; 20:5n-3), nucleotides, peptides, and pigment derivatives that can eliminate unwanted competition for nutrients such as organic phosphates from certain bacteria [55].
Alteromonadaceae. The Alteromonadaceae family consists of 16 (yet annotated) named genera found predominantly in marine environments [74]. Members of this family were isolated from nutrient-rich environments such as coastal, open, and deep-sea waters, sediments, marine invertebrates and vertebrates, algae, and temperate and Antarctic marine environments [83]. They are able to utilize a vast array of compounds as carbon sources; from glucose to glycerol [74]. Members of this family are known siderophore producers [57,84,85]. Greek for “iron carrier”, siderophores are a group of iron scavengers that act by chelating iron (III) that are produced and excreted by bacteria, and some cyanobacteria, which then reuptake the siderophores with bound iron (III) via outer-membrane transporters that are siderophore-specific [86]. Most bioactive trace metals, including iron, exist at nanomolar to picomolar concentrations in our oceans, approximately one-millionth of the intracellular concentration in diatoms [87,88]. No trace metals, including iron (III), were provided to minimal media cultures. However, natural seawater may contain minute traces of bioactive trace metals. The high abundance of Alteromonadaceae in the minimal media suggests a potential supportive role in sequestering traces of iron (III) that may be present in the sterile natural seawater to the P. tricornutum (Figure 2). This is further supported by the very low level of Alteromonadaceae in the complete media (11% in complete media compared to 55% in minimal media, both on day 15) where the culture has been supplied with 11.7 M of iron (III) chloride hexahydrate.
Flavobacteriaceae. Flavobacteriaceae are members of the Bacteroidetes phylum and include over 120 genera found in soil, sediments and seawater (see [89] for further references). Flavobacteriaceae belong within the Cytophaga-Flavobacterium cluster which has been shown to account for more than 10% of the total bacterial community in coastal and offshore waters [90,91,92]. Members of Flavobacteriaceae can proficiently degrade various biopolymers such as cellulose, chitin and pectin [93,94]. They were shown to be omnipresent during phytoplankton blooms, and their preference for consuming more complex polymers rather than monomers suggests an active role in the processing of organic matter during these blooms [95,96]. Although the exact mechanisms behind them are not perfectly understood, algal blooms are a consequence of exponential growth of phytoplankton [97]. In this respect, the phase of exponential growth of P. tricornutum in complete media, when our results showed highest abundance of Flavobacteriaceae, is the artificial equivalent of an algal bloom of P. tricornutum (Figure 2). In the minimal media, the abundance of Flavobacteriaceae remains very low; at its maximum on day 8 it only accounts for 9% of the total bacterial community. Members of the Flavobacteriaceae family could be more demanding than other bacteria that require lower nutrient levels to thrive.
Pseudomonadaceae. Pseudomonadaceae are an extraordinarily diverse family of bacteria found in almost all habitats on Earth; in soils, freshwater as well as marine environments, as well as plant and animal-associated pathogens [98]. Species from the Pseudomonas genus are the best studied of the Pseudomonadaceae family, whose sheer genetic diversity explains the ability to thrive in such a wide range of environments [99]. Marine isolates from the Pseudomonas genus have been shown to produce a wide range of bioactive compounds, many of which exhibit antibacterial as well as antiviral properties (see [100] for further references). Our results, indeed show an elevated level of Pseudomonadaceae OTUs evident on day 22 of the complete media cultures, and on days 8 and 22 of the minimal media cultures. The increased presence of Pseudomonadaceae when the P. tricornutum culture has “crashed” could be attributed to its ability to produce antibacterial compounds allowing members of this family to begin to thrive in the community through inhibition of its competitors. Given its exceptional genetic diversity, and thus, its metabolic versatility, allows for members of Pseudomonadaceae to be truly saprophytic; providing a hypothetical explanation of its abundance we could measure when the P. tricornutum cultures crash (Figure 2, day 22 in both media conditions).
4.3. Putative Network of Interactions and Validation with a Qualitative Mathematical Model
The literature review work revealed interesting insights into the possible metabolic exchanges going on and allowed to infer interaction links among P. tricornutum and its associated bacterial community. We critically considered which metabolites were most relevant for survival (organic carbons for the bacteria, iron, vitamins and phosphates for the diatom) and which ones could play a role in competition and predation among the microbes (bactericidal metabolites). From these considerations we designed a putative network of interactions that was then translated into a mathematical model. In particular we chose, besides the five microbes’ biomasses, a total of eight metabolites as the variables that directly and specifically influence the interactions among the different organisms. These were: four different possible sources of organic carbons, each preferred by a different bacterial family [30]; two bactericidal substances, one produced by Pseudoalteromonadaceae and affecting all other bacteria [54], the other produced by P. tricornutum and targeting specifically Pseudoalteromonadaceae [55]; vitamins produced by Alteromonadaceae and needed by P. tricornutum [63]; bio-available iron that is chelated by Alteromonadaceae and efficiently absorbed by P. tricornutum [57]. For the scope of the model, we ignored other free iron forms that can be uptaken by all bacteria as well as phosphates that are not species-specific and are present in both minimal and complete media.
Direct metabolic exchanges are known to be central in microbial community interactions [101], but usually population dynamics models like gLV [28] do not include this information. This work, therefore, modified the standard formulation of the Verhulst equation [36] for bacterial growth to include organism-to-organism interactions depending on the production/consumption of metabolites, modeled as Monod-type terms [51]. Nutrients availability can indeed drastically change the “metabolic state” of an organism, inducing a reprogramming of resource allocation to face nutrient scarcity [102]. This was shown at the gene expression level for example for Escherichia coli [103] and Shewanella oneidensis [104] grown in minimal and rich media condition. Micronutrients can as well affect microbial gene expression, as is for example the case with vitamin B, whose presence induces the expression of the cofactor-dependent methionine synthase enzyme METH, while in its absence the cofactor-independent methionine synthase enzyme METE is expressed [105]. An ODE model at the population level cannot, of course, capture mechanisms such as metabolic shifts caused by changes in the environment such as the supplementation of minimal or complete media [25]. Therefore, we did not expect to find a unique set of parameters for the model in the two conditions. However, the parameters fitted to the data of P. tricornutum with four bacterial families still provide good fits in simulations with altered community composition. Even though the parameter values could not directly be interpreted biologically, we could use the simulation results on metabolites dynamics (an information absent in data) to speculate about the reason for the lower cell count of P. tricornutum in complete media with respect to minimal media (Supplementary Material 3). In minimal media, Alteromonadaceae maintained constant iron levels and the fitted values for parameters characterizing P. tricornutum’s sensitivity to micronutrients levels were significantly lower. This would suggest a key role of Alteromonadaceae in supporting P. tricornutum growth combined with the diatom’s adaptation to scarce micronutrients availability.
Considering the limited information that can be extracted from the current experimental data available, the model we proposed is purely qualitative and provides a proof-of-concept that a quantitative model can, in principle, be constructed if dedicated experiments are designed for calibration. The current qualitative model provides therefore a preliminary validation of our putative network of interactions, and serves as motivation for further research bringing the model to a quantitative, predictive level. Indeed, starting with systematic measurements of model parameters in co-cultivation experiments, the simulations can gain predictive power and become a powerful tool towards the goal of synthetic community design and control.
5. Conclusions and Outlook
This study demonstrated that the bacterial community associated with non-axenic laboratory strains of P. tricornutum is not randomly assembled but follows dynamics that can be reproduced. We postulate that a role within the community can be filled by a number of bacterial species capable of carrying out a certain function (guilds) rather by one specific species of bacteria. Which bacteria fill the role is dependent upon the environmental characteristics and the prevailing needs of the community as a whole at any given time. Unfilled niches will be seized by bacteria with the ideal metabolic functionality. The absence of certain micronutrients creates a new niche that can be filled by a certain unique bacterial faction. Further work is necessary to explore the hypotheses postulated and to further develop the qualitative mathematical model to understand the specific community roles and the ecological niches. In the context of fundamental research, one approach would be to carry out systematic time-resolved omics studies, which provide a holistic view of the genes (genomics) and metabolites (metabolomics) in a specific biological sample in a non-targeted and non-biased manner [106], and use them to develop an “expanded gLV” mathematical model where the species specific interaction terms depend on the metabolite concentrations. This would allow to derive a network of interactions independent of a priori hypotheses, and thus represent a significant step forward in understanding community dynamics based on metabolic exchanges. In the context of industrial scale-up, systematic co-culture experiments with culturable members of the bacterial families of interest, chosen based on desired functional roles, could be used to parametrize a mathematical model like the one we presented and develop it into a powerful predictive tool for culture monitoring. For example, samplings assessing the community composition can be used to predict the harvesting point and avoid “culture crash”. The development of novel co-cultivation strategies for scale-up is extremely relevant for pharma- and nutraceutical, as well as animal feed industries. Therefore there will be increasing interest in further research into co-cultivation approaches and in general in the field of synthetic ecology.
Supplementary Materials
The bioinformatics analysis steps are available online at https://github.com/QTB-HHU/16SV6-Sequence-Analysis.git. The mathematical model in python with instructions to run simulations is available online at https://github.com/QTB-HHU/communityODE. The following are available online at www.mdpi.com/2227-9717/5/4/77/s1, Supplementary Material 1 contains Figures S1-S6 and Tables S1-S2, relative to the experimental data analysis. Supplementary Material 2 contains additional checks performed for parameter fitting of the mathematical model (Tables S7-S11). Supplementary Material 3 presents a speculative interpretation of the simulation results (Figures S7-S8 and Table S12).
Acknowledgments
This work was supported by the European Commission Seventh Framework Marie Curie Initial Training Network project ‘AccliPhot’ (grant agreement number PITN-GA-2012-316427) to F.W.M. and A.S.; and the Deutsche Forschungsgemeinschaft, Cluster of Excellence on Plant Sciences CEPLAS (EXC 1028) to O.P., A.S. and O.E. Genomic DNA extraction was carried out at the Aquaculture and Fisheries Development Centre, University College Cork, Ireland (funded by Beaufort Marine Research Award in Fish Population Genetics funded by the Irish Government under the Sea Change Programme). Barcoded 16S-V6-Next Generation Sequencing was carried out by the Genomics and Transcriptomics Laboratory at Heinrich-Heine University, Düsseldorf, Germany.
Author Contributions
F.W.M., O.E. and J.M. conceived and designed the experiments; F.W.M. performed the experiments; O.P. performed the bioinformatics and statistical data analysis; A.S. developed the mathematical model and performed simulations; all authors contributed to the interpretation of the results and wrote the paper.
Conflicts of Interest
The authors declare no conflict of interest. The founding sponsors had no role in the design of the study; in the collection, analyses, or interpretation of data; in the writing of the manuscript, and in the decision to publish the results.
Appendix A. Data Analysis
Figure A1.
Beta diversity. A modified version of PermanovaG was used to carry out permutational multivariate analysis of variance using multiple distance matrices. The distance matrices [24 × 24] were previously calculated based on the generalized UniFrac distance [53], weighted UniFrac and unweighted UniFrac [107] distance. The significance for the test was assessed by 5000 permutations. (a) shows no significant effect between the replicates (p-value of 0.4384). (b) shows a significant effect for the time variable (p-value of 0.001). (c) shows also shows a significant effect for the medium variable (p-value of 0.007).

Appendix B. Mathematical Model Additional Material
The mathematical model is a system of 13 ODEs describing the variation in time of the populations (cell counts) of
- P. tricornutum (D);
- Pseudoalteromonadaceae ();
- Flavobacteriaceae (F);
- Alteromonadaceae (A);
- Pseudomonadaceae (P);
and the production and consumption of the metabolites we consider as mainly contributing to drive the community dynamics:
- the dissolved organic carbons of preference for and A ( and , respectively);
- the complex polymers () consumed by F;
- generic vitamins () and iron () needed by D and produced by A;
- bactericidial molecules ( and , produced by D and by respectively);
- the dissolved organic matter ().
The model has 55 unknown free parameters:
- 5 carrying capacities ;
- 34 maximal rates v;
- 15 Monod-type coefficients K;
- the fraction of -dependent growth of A, .
Appendix B.1. ODEs System
Five ODEs describe the variation in time of the populations of organism O, with and being its growth and death rate:
Eight ODEs describe the variation in time of the metabolites J, with being the maximal production/consumption rate of J by organism O:
and are additional terms for and production respectively (see Appendix B.1.1). is the degradation rate of the bactericidal substances. Organism O growth and death rates depend in general on carrying capacity , maximal rates and on metabolites concentrations J with Monod-type coefficient and eventually maximal rates :
For example in Equation (A14), describing the growth rate of the diatom, the Verhulst growth equation describes a standard logistic growth, while adding the Monod-type coefficients of the form introduce a dependency on the micronutrients Vit and Fe, in practice scaling down the effective growth rate if micronutrients are scarce. In the case of A, where growth is thought to be sustained by two different complementary nutrients, the final growth can be represented as the sum of two terms and (Equations (A21) and (A22)), with the parameter .
Appendix B.1.1. and COP Production
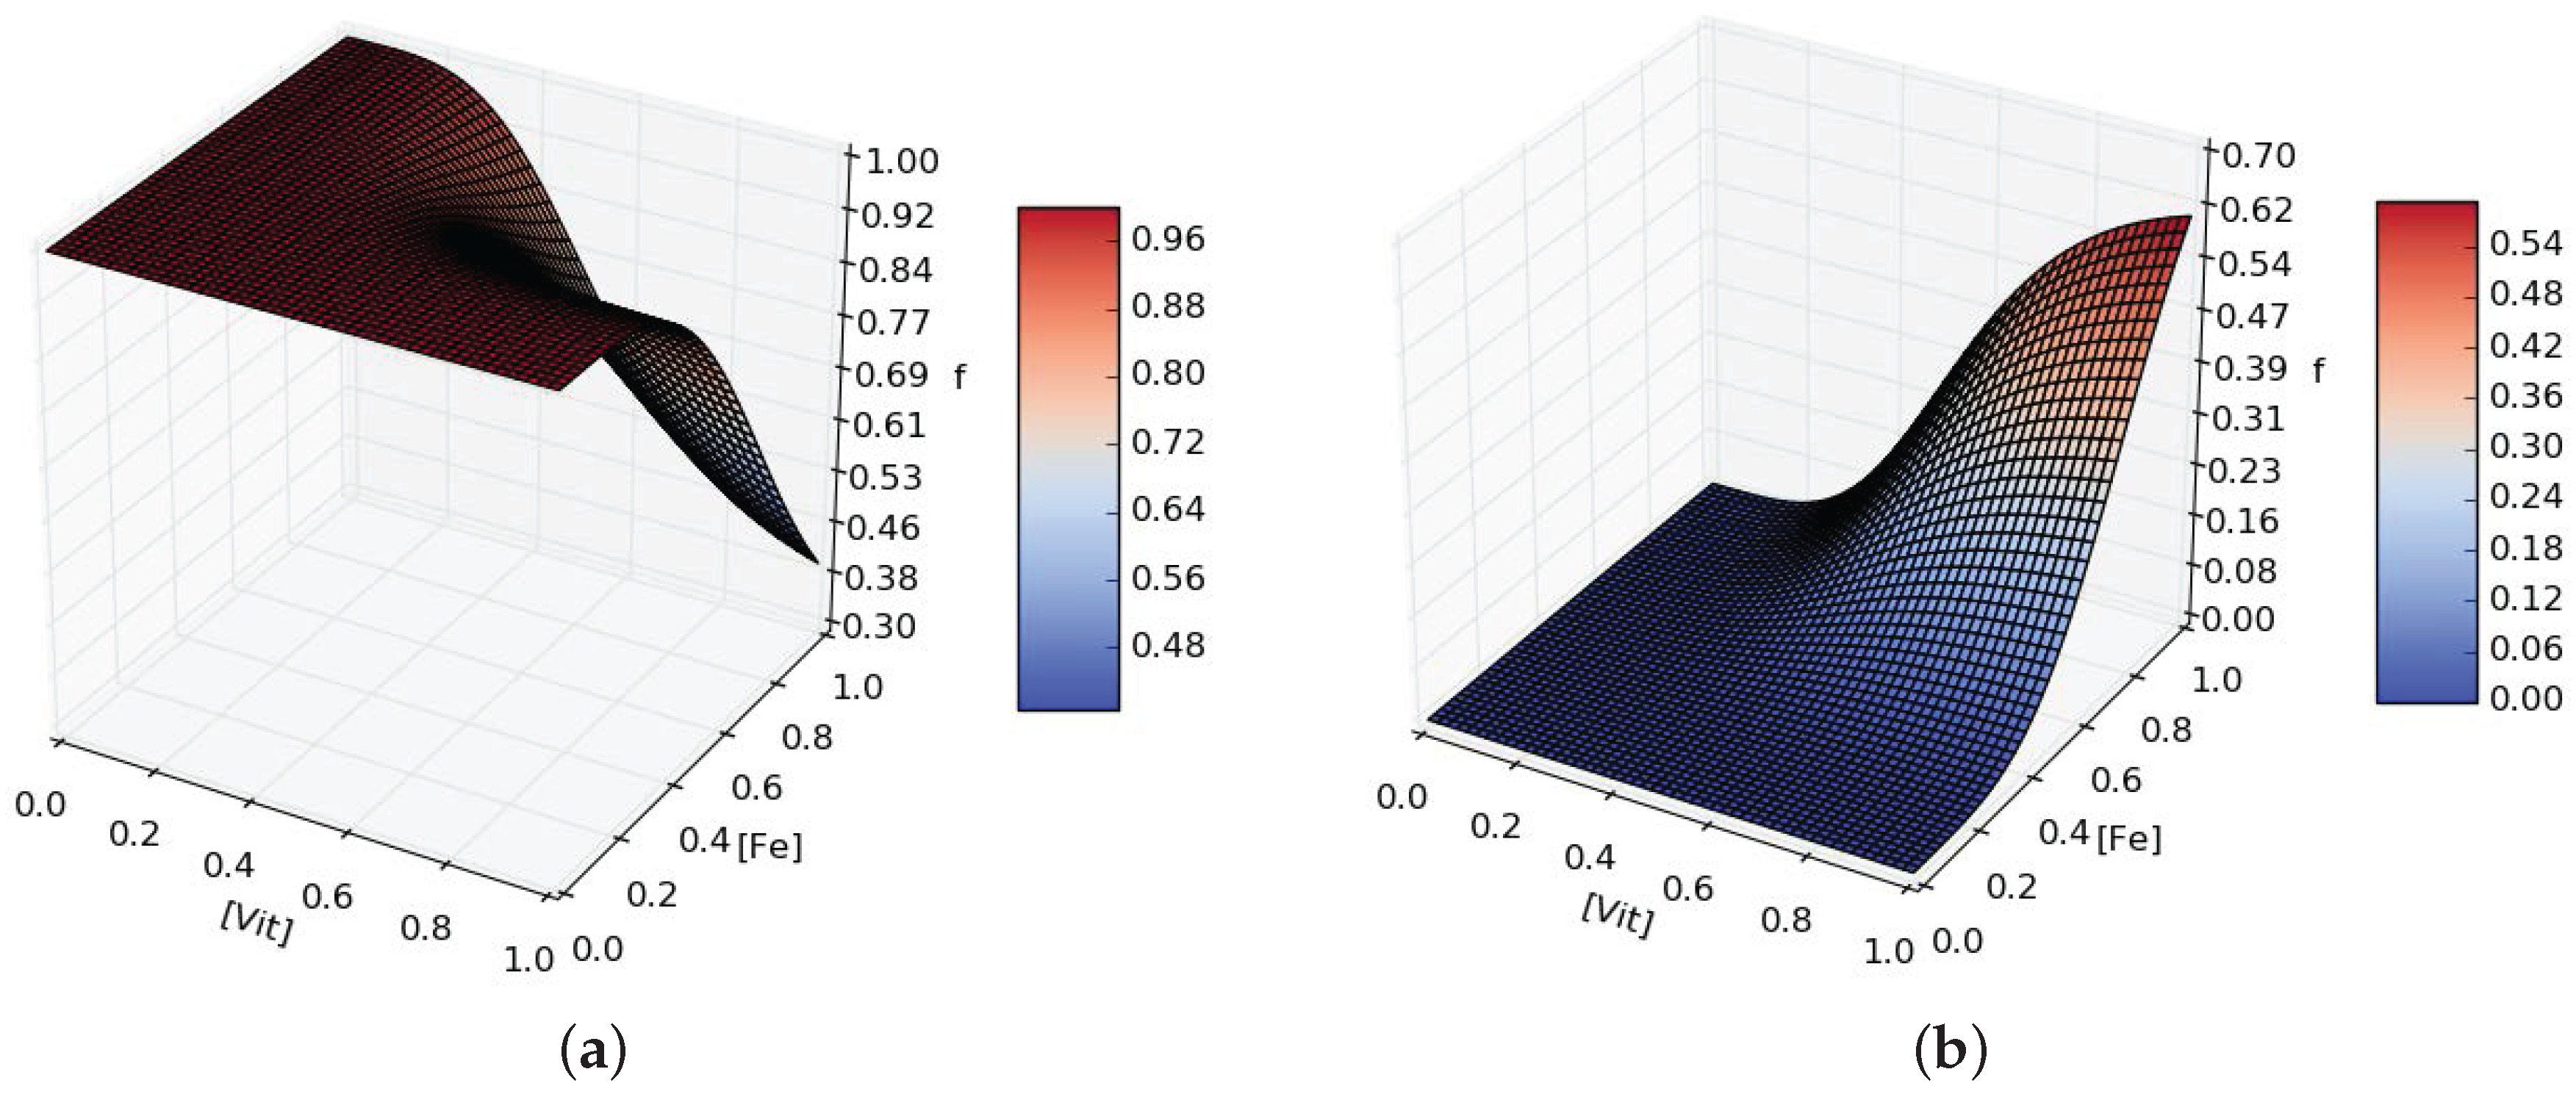
When D is grown in minimal media conditions, the emergence of A is observed over F. From this observation we hypothesise that D can produce extra organic carbons for either A or F depending on the scarcicity of micronutrients to favor the growth of A if more or is needed. We model the production of and (Equations (A9) and (A10)) introducing the functions and defined as:
where is the maximal additional production rate and depends on and with fourth order Hill equations terms parametrised with and (see Figure A2).
Figure A2.
Example for ((a), ) and ((b), ) additional production rates dependent on and availability in the media. Here , .
Figure A2.
Example for ((a), ) and ((b), ) additional production rates dependent on and availability in the media. Here , .
Appendix B.2. Parameter Fitting
The model has 56 parameters, of which 55 are free parameters (see Table A1). Being a qualitative model, we do not aim at interpreting the absolute parameter values in a biological sense.

Table A1.
Total number of parameters for each parameter set. The dependent parameter is in the sub-set of A parameters .
Table A1.
Total number of parameters for each parameter set. The dependent parameter is in the sub-set of A parameters .
| Parameter Sub-Set | Degradation | |||||
|---|---|---|---|---|---|---|
| Sub-set size | 15 | 9 | 14 | 8 | 8 | 2 |
The available data that can be used to fit the model parameters are the diatom biomass growth in two media conditions and four time points with bacteria relative abundances again in two media conditions. We can therefore fit the diatom biomass D evolution and the four relative bacteria i abundances time-course.
We implement as general strategy a genetic algorithm, where an “individual” i is a full set of 56 parameters , a “population” is an ensemble of parameter sets , a population at a certain evolution step is a “generation” and “evolution” goes as:
- (1)
- the first generation is populated by extracting the parameters from random uniform distributions within user-chosen ranges;
- (2)
- for each the ODE system is solved and a fitness score (see Appendix B.2.1) is computed;
- (3)
- the most fit 10% individuals are retained as parents for the next generation;
- (4)
- the remaining individuals have a probability to be also selected as parents;
- (5)
- parents are crossed to obtain enough children to reach the original population size;
- (6)
- crossing means randomly pick a parameter sub-set from one parent or the other;
- (7)
- each children has a probability to randomly mutate one parameter;
- (8)
- the process is repeated from step 2. until generation .
Appendix B.2.1. Fitness Score
Fitness scores are computed in a different way when fitting the diatom growth or the bacteria relative abundances. When fitting to the diatom biomass data we compute the score as a simple euclidean distance:
where the sum over time extends over 22 time points, is the D biomass at time t and is the biomass data at time t. The lower s, the better the fit. This score definition works well to fit the measurements of diatom biomass, but presents a big problem when used with bacteria relative abundances. A relative abundance is a number between 0 and 1, and we observe high variations including bacteria population going from very close to 0 to high abundance. Having only three time points to fit (the first 16S measurement is used as initial point), it can happen that constantly low abundant population are kept by the algorithm. We therefore define for the fit of bacteria relative abundances the following score:
where the sum over time extends over 3 time points and the sum over organisms over the 4 bacterial species, is the relative abundance from the ODEs system solution for organism o at time t and is it the corresponding experimental relative abundance. This score definition allows to penalize the event of population extinction: when r is 0, the exponential term is 0 and the score is 1, while when the exponential term is 1 and the score is 0.
Table A2.
Datasets used to fit diatom growth in minimal and complete media (MM and CM respectively). Time is scaled (1/3 of a day) to fit reasonably the growth phases (lag-log-exp-decay) using parameters . For the same reason cell counts are scaled to bring the lower count close to 0, but not feature-scaled to avoid loosing information on differences among MM and CM conditions. Only average values, and not experimental errors, are taken into account.
| T | 8 | 16 | 40 | 48 | 64 | 72 | 104 | 112 | 120 | 128 | 152 |
| MM | 0.004 | 0.021 | 0.133 | 0.325 | 0.820 | 1.012 | 1.121 | 1.187 | 1.192 | 1.233 | 1.209 |
| CM | 0.050 | 0.044 | 0.162 | 0.605 | 0.733 | 0.919 | 1.037 | 1.099 | 1.134 | 1.108 | 0.859 |
| T | 168 | 176 | 184 | 208 | 216 | 232 | 240 | 248 | 264 | 272 | 288 |
| MM | 1.104 | 1.096 | 0.951 | 1.015 | 0.965 | 0.851 | 0.869 | 0.704 | 0.481 | 0.504 | 0.394 |
| CM | 0.821 | 0.844 | 0.624 | 0.682 | 0.624 | 0.556 | 0.535 | 0.478 | 0.199 | 0.282 | 0.303 |
Table A3.
Relative abundances of the four bacterial families at three intermediate time points (days 8, 15 and 22). The abundances were scaled from the experimental values (where more families were present) to add to unity.
Table A3.
Relative abundances of the four bacterial families at three intermediate time points (days 8, 15 and 22). The abundances were scaled from the experimental values (where more families were present) to add to unity.
| Complete Media | Minimal Media | |||||||
|---|---|---|---|---|---|---|---|---|
| t | PA | F | A | P | PA | F | A | P |
| 64 | 0.101 | 0.724 | 0.159 | 0.014 | 0.294 | 0.132 | 0.308 | 0.264 |
| 120 | 0.453 | 0.474 | 0.061 | 0.010 | 0.351 | 0.031 | 0.585 | 0.031 |
| 176 | 0.600 | 0.084 | 0.189 | 0.126 | 0.385 | 0.020 | 0.187 | 0.406 |
Appendix B.2.2. Results of the Genetic Algorithm
The chosen population size is 200 and the algorithm stops either after non significant increase in fitness or at generation number 50. The algorithm can be run to fit six scenarios:
- D-MM: D Biomass in Minimal Media;
- D-CM: D Biomass in Complete Media;
- B-MM: Bacteria relative abundances in Minimal Media;
- B-CM: Bacteria relative abundances in Complete Media;
- D*B-MM: D Biomass and Bacteria relative abundances in Minimal Media;
- D*B-CM: D Biomass and Bacteria relative abundances in Complete Media;
For D-type fits, the fitness score of Equation (A29) is used. For B-type fits, the fitness score of Equation (A30) is used. For D*B-type fits, the fitness score is the product of the two scores. We will refer to D-fit, B-fit and D*B-fit in the following if media is not to be specified.
Considering the fact that a simple ODE model cannot capture metabolic readjustment, we do not expect to obtain the same parameters for CM and MM conditions. The fitting is therefore performed separately in the two conditions and in the following steps:
- B-fit is run 20 times varying all 55 parameters in ranges
- The parameters from the best B-fits are kept ( and )
- After checking the effect of varying the different parameters sets, different variation ranges are chosen to perform refits
- D*B-CM is run 5 times varying %, %, %
- D*B-MM is run 5 times varying %, and the best parameters are kept ()
- D*B-MM is run again 5 times varying %, %
The last rounds of fitting were run on different sets of parameters considered equally good. The final parameter sets are presented in Table A4.
Table A4.
Final parameter sets used for simulation in CM () and MM (). Also reported are the overall average and standard deviation values from all the last rounds of fitting.
Table A4.
Final parameter sets used for simulation in CM () and MM (). Also reported are the overall average and standard deviation values from all the last rounds of fitting.
| 0.562780 | 0.476829 | 0.235751 | 0.23821 | 0.281329 | 0.257813 | |
| 0.463690 | 0.249183 | 0.152283 | 0.02253 | 0.332969 | 0.365116 | |
| 1.043490 | 0.526842 | 0.339699 | 0.82552 | 0.671145 | 0.475618 | |
| 1.884690 | 1.433304 | 0.495578 | 0.94702 | 1.085873 | 0.889537 | |
| 1.230920 | 1.112280 | 0.351905 | 2.74047 | 1.564099 | 0.668637 | |
| 0.036310 | 0.067159 | 0.085177 | 0.01697 | 0.058289 | 0.113161 | |
| 0.504220 | 0.504324 | 0.149340 | 1.30073 | 0.806015 | 0.315439 | |
| 0.204470 | 0.464587 | 0.226651 | 0.99257 | 0.670187 | 0.250496 | |
| 0.186340 | 0.493623 | 0.298676 | 0.74598 | 0.349684 | 0.246408 | |
| 0.795530 | 0.508826 | 0.229097 | 0.00743 | 0.323377 | 0.248408 | |
| 0.030470 | 0.052871 | 0.094576 | 0.06702 | 0.130514 | 0.176652 | |
| 0.134290 | 0.118939 | 0.028298 | 0.19948 | 0.206115 | 0.091565 | |
| 0.329520 | 0.434683 | 0.340005 | 0.34841 | 1.037434 | 0.510106 | |
| 0.954240 | 0.644251 | 0.317607 | 1.09226 | 1.241136 | 0.618984 | |
| 0.108110 | 0.409152 | 0.213390 | 0.07769 | 0.263422 | 0.330743 | |
| 0.350050 | 0.373353 | 0.117858 | 0.57995 | 0.784058 | 0.412260 | |
| 0.488680 | 0.583597 | 0.358354 | 0.02979 | 0.124157 | 0.134217 | |
| 1.199730 | 1.048777 | 0.343732 | 0.33321 | 0.486298 | 0.256807 | |
| 0.844900 | 0.645544 | 0.226955 | 0.46274 | 0.346839 | 0.088571 | |
| 0.469600 | 0.903463 | 0.501364 | 0.09782 | 0.339058 | 0.356208 | |
| 0.314330 | 0.853140 | 0.557108 | 0.36480 | 0.546552 | 0.330353 | |
| 1.875200 | 1.584920 | 0.515701 | 1.57897 | 1.427444 | 0.420945 | |
| 1.005110 | 1.268507 | 0.463020 | 0.70666 | 0.736754 | 0.370734 | |
| 0.007180 | 0.016960 | 0.051891 | 0.00681 | 0.013765 | 0.049375 | |
| 1.770740 | 0.987437 | 0.490546 | 1.65657 | 1.350378 | 0.421454 | |
| 1.055270 | 0.990547 | 0.415673 | 0.83897 | 1.081959 | 0.591094 | |
| 0.135980 | 0.653181 | 0.351953 | 0.54133 | 0.565364 | 0.231813 | |
| 1.214350 | 0.899207 | 0.360058 | 1.28659 | 1.070999 | 0.478554 | |
| 0.665740 | 0.755699 | 0.241111 | 0.31684 | 0.363974 | 0.099207 | |
| 0.194310 | 0.200395 | 0.069030 | 0.52737 | 0.562459 | 0.149546 | |
| 0.367880 | 0.566566 | 0.416514 | 1.78450 | 0.909564 | 0.404000 | |
| 0.936420 | 0.583317 | 0.263447 | 0.16731 | 0.299761 | 0.198921 | |
| 0.477700 | 0.588674 | 0.234155 | 0.74525 | 0.451922 | 0.315203 | |
| 0.184360 | 0.311845 | 0.105780 | 0.23234 | 1.237169 | 1.012458 | |
| 1.351050 | 1.206888 | 0.384417 | 0.54187 | 1.074951 | 0.758107 | |
| 0.139320 | 0.175972 | 0.045416 | 0.57005 | 0.330531 | 0.127086 | |
| 0.382820 | 0.318181 | 0.144775 | 0.18005 | 0.200895 | 0.150824 | |
| 0.092860 | 0.080066 | 0.074871 | 0.00984 | 0.135875 | 0.283818 | |
| 0.765450 | 0.726578 | 0.223690 | 1.50156 | 0.888556 | 0.545041 | |
| 0.020100 | 0.148399 | 0.132143 | 0.16823 | 0.326145 | 0.294570 | |
| 0.609800 | 0.560853 | 0.171693 | 1.12080 | 0.688621 | 0.413129 | |
| 1.009740 | 1.238831 | 0.430709 | 2.11081 | 1.419892 | 0.958683 | |
| 1.301320 | 1.277678 | 0.407513 | 1.17750 | 2.585117 | 0.869802 | |
| 0.020440 | 0.069033 | 0.167148 | 0.01591 | 0.036821 | 0.150349 | |
| 0.698330 | 0.523151 | 0.203572 | 0.17625 | 0.124345 | 0.136063 | |
| 0.195450 | 0.189091 | 0.103414 | 0.03107 | 0.116528 | 0.203261 | |
| 0.820720 | 0.440066 | 0.249502 | 0.57938 | 0.527859 | 0.284980 | |
| 0.245720 | 0.351941 | 0.221873 | 0.42128 | 0.564689 | 0.489764 | |
| 0.755570 | 0.541606 | 0.297743 | 0.05329 | 0.404319 | 0.414359 | |
| 1.577050 | 1.484135 | 0.474372 | 2.65508 | 1.368551 | 0.892632 | |
| 0.819580 | 0.848959 | 0.264185 | 0.28618 | 0.568550 | 0.438164 | |
| 0.995130 | 1.029216 | 0.323852 | 1.28138 | 1.477045 | 0.533872 | |
| 0.221040 | 0.284309 | 0.181709 | 0.01861 | 0.052638 | 0.102986 | |
| 0.236820 | 0.254966 | 0.144860 | 0.41130 | 0.249994 | 0.182493 | |
| 0.130620 | 0.110548 | 0.125387 | 0.01816 | 0.108930 | 0.154334 | |
| 0.327430 | 0.468045 | 0.287832 | 0.12769 | 0.350329 | 0.210662 |
Appendix B.2.3. Sanity Checks of the Parameter Fits
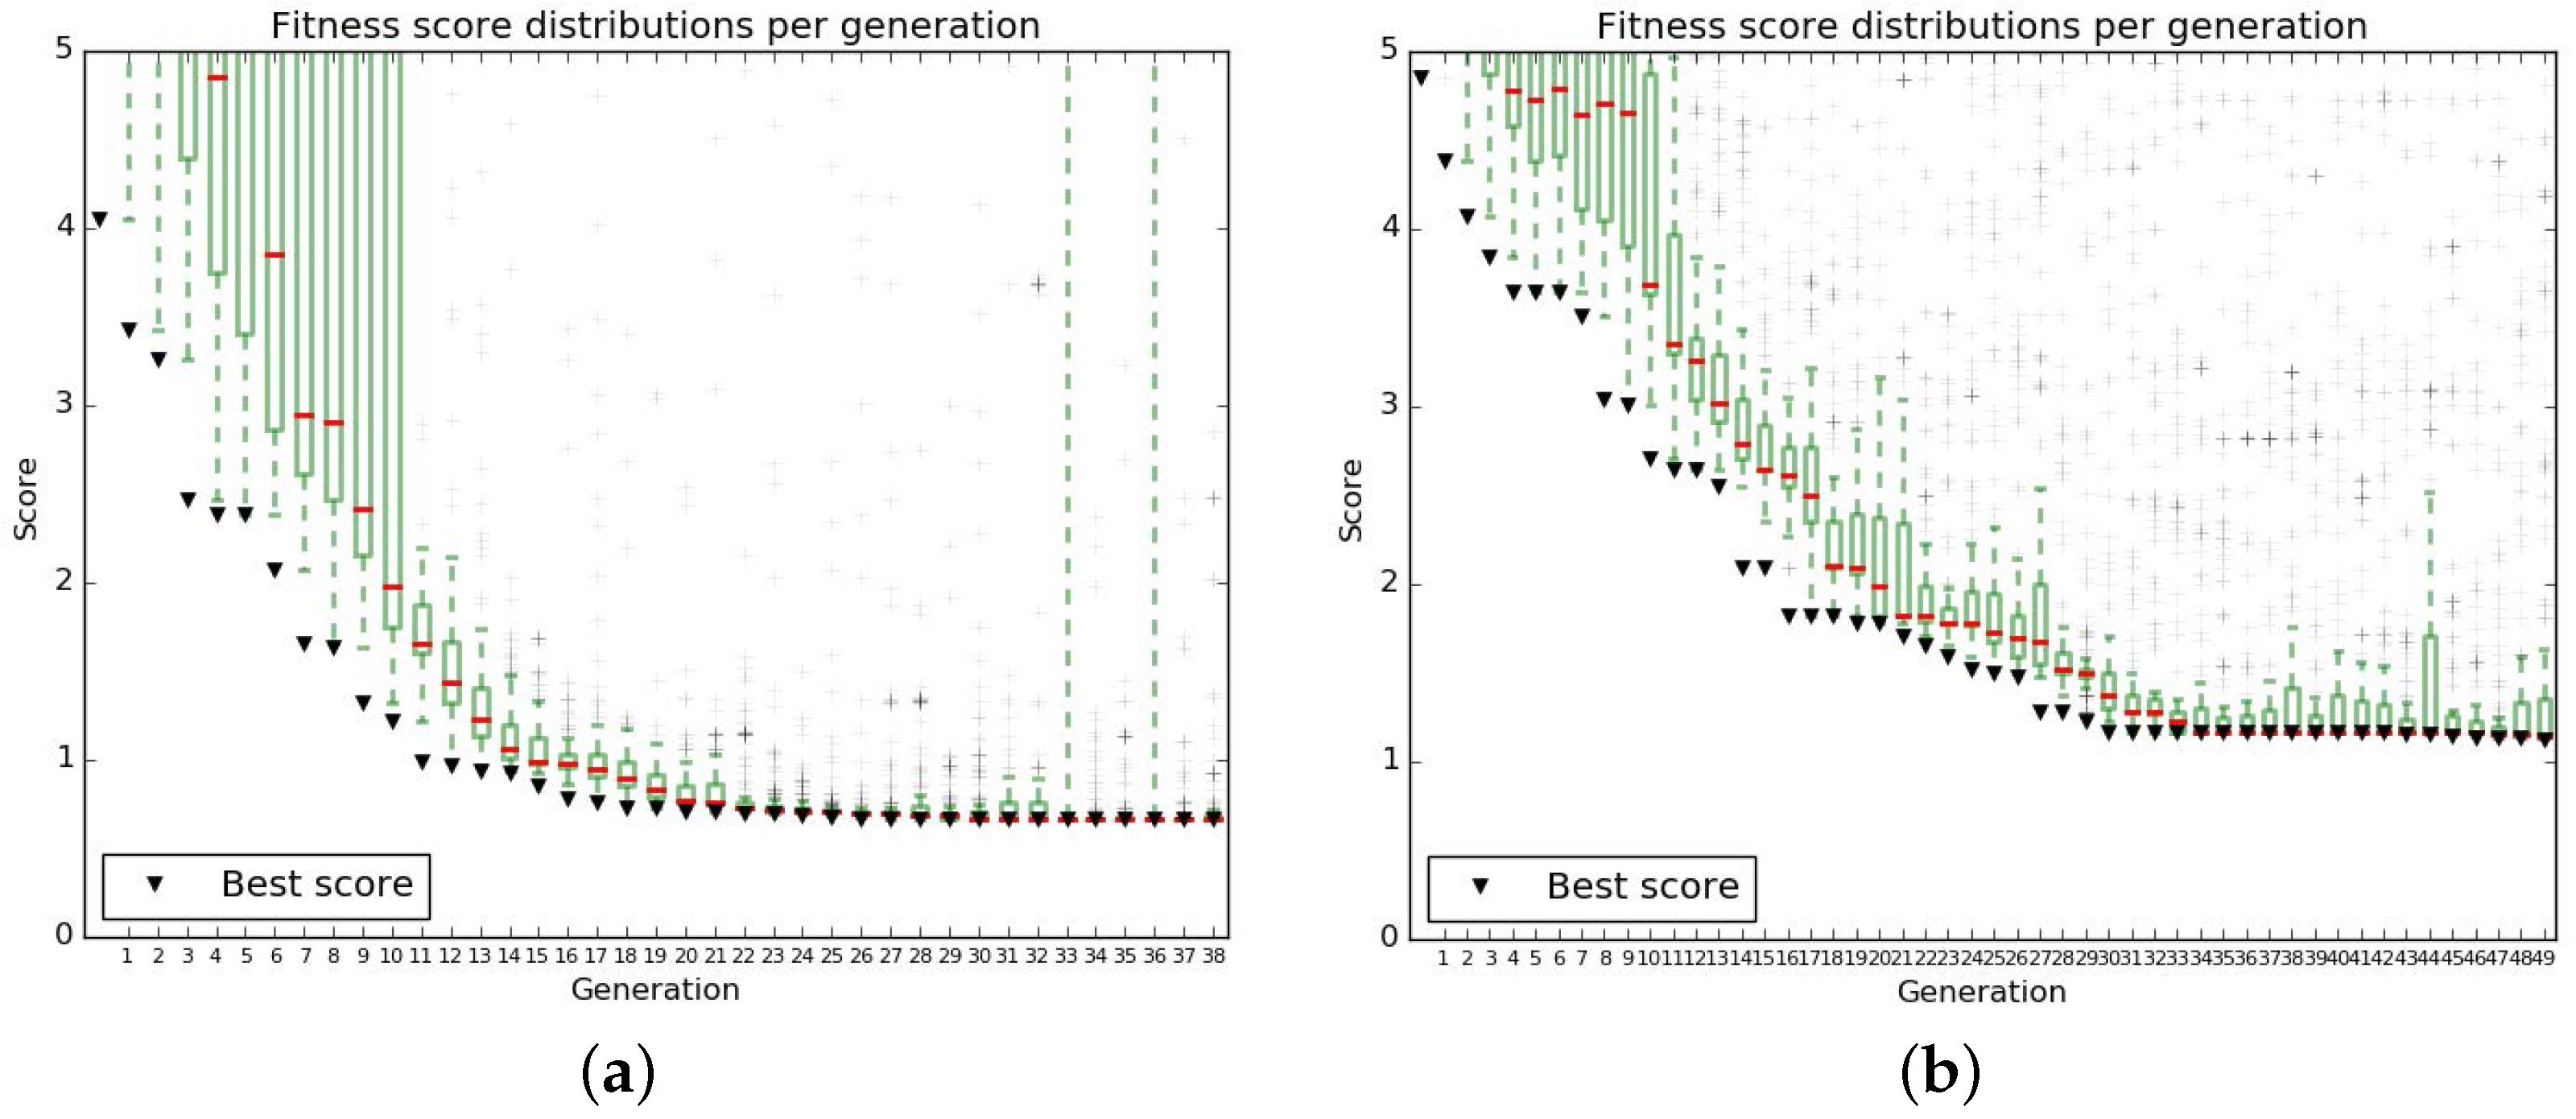
The parameters of the algorithm were chosen to obtain a satisfactory convergence of the fit (Figure A3).
Figure A3.
Distribution of fitness scores in populations over generations for the genetic algorithm runs chosen to perform the last fitting iteration in minimal (a) and complete (b) media conditions.
Figure A3.
Distribution of fitness scores in populations over generations for the genetic algorithm runs chosen to perform the last fitting iteration in minimal (a) and complete (b) media conditions.
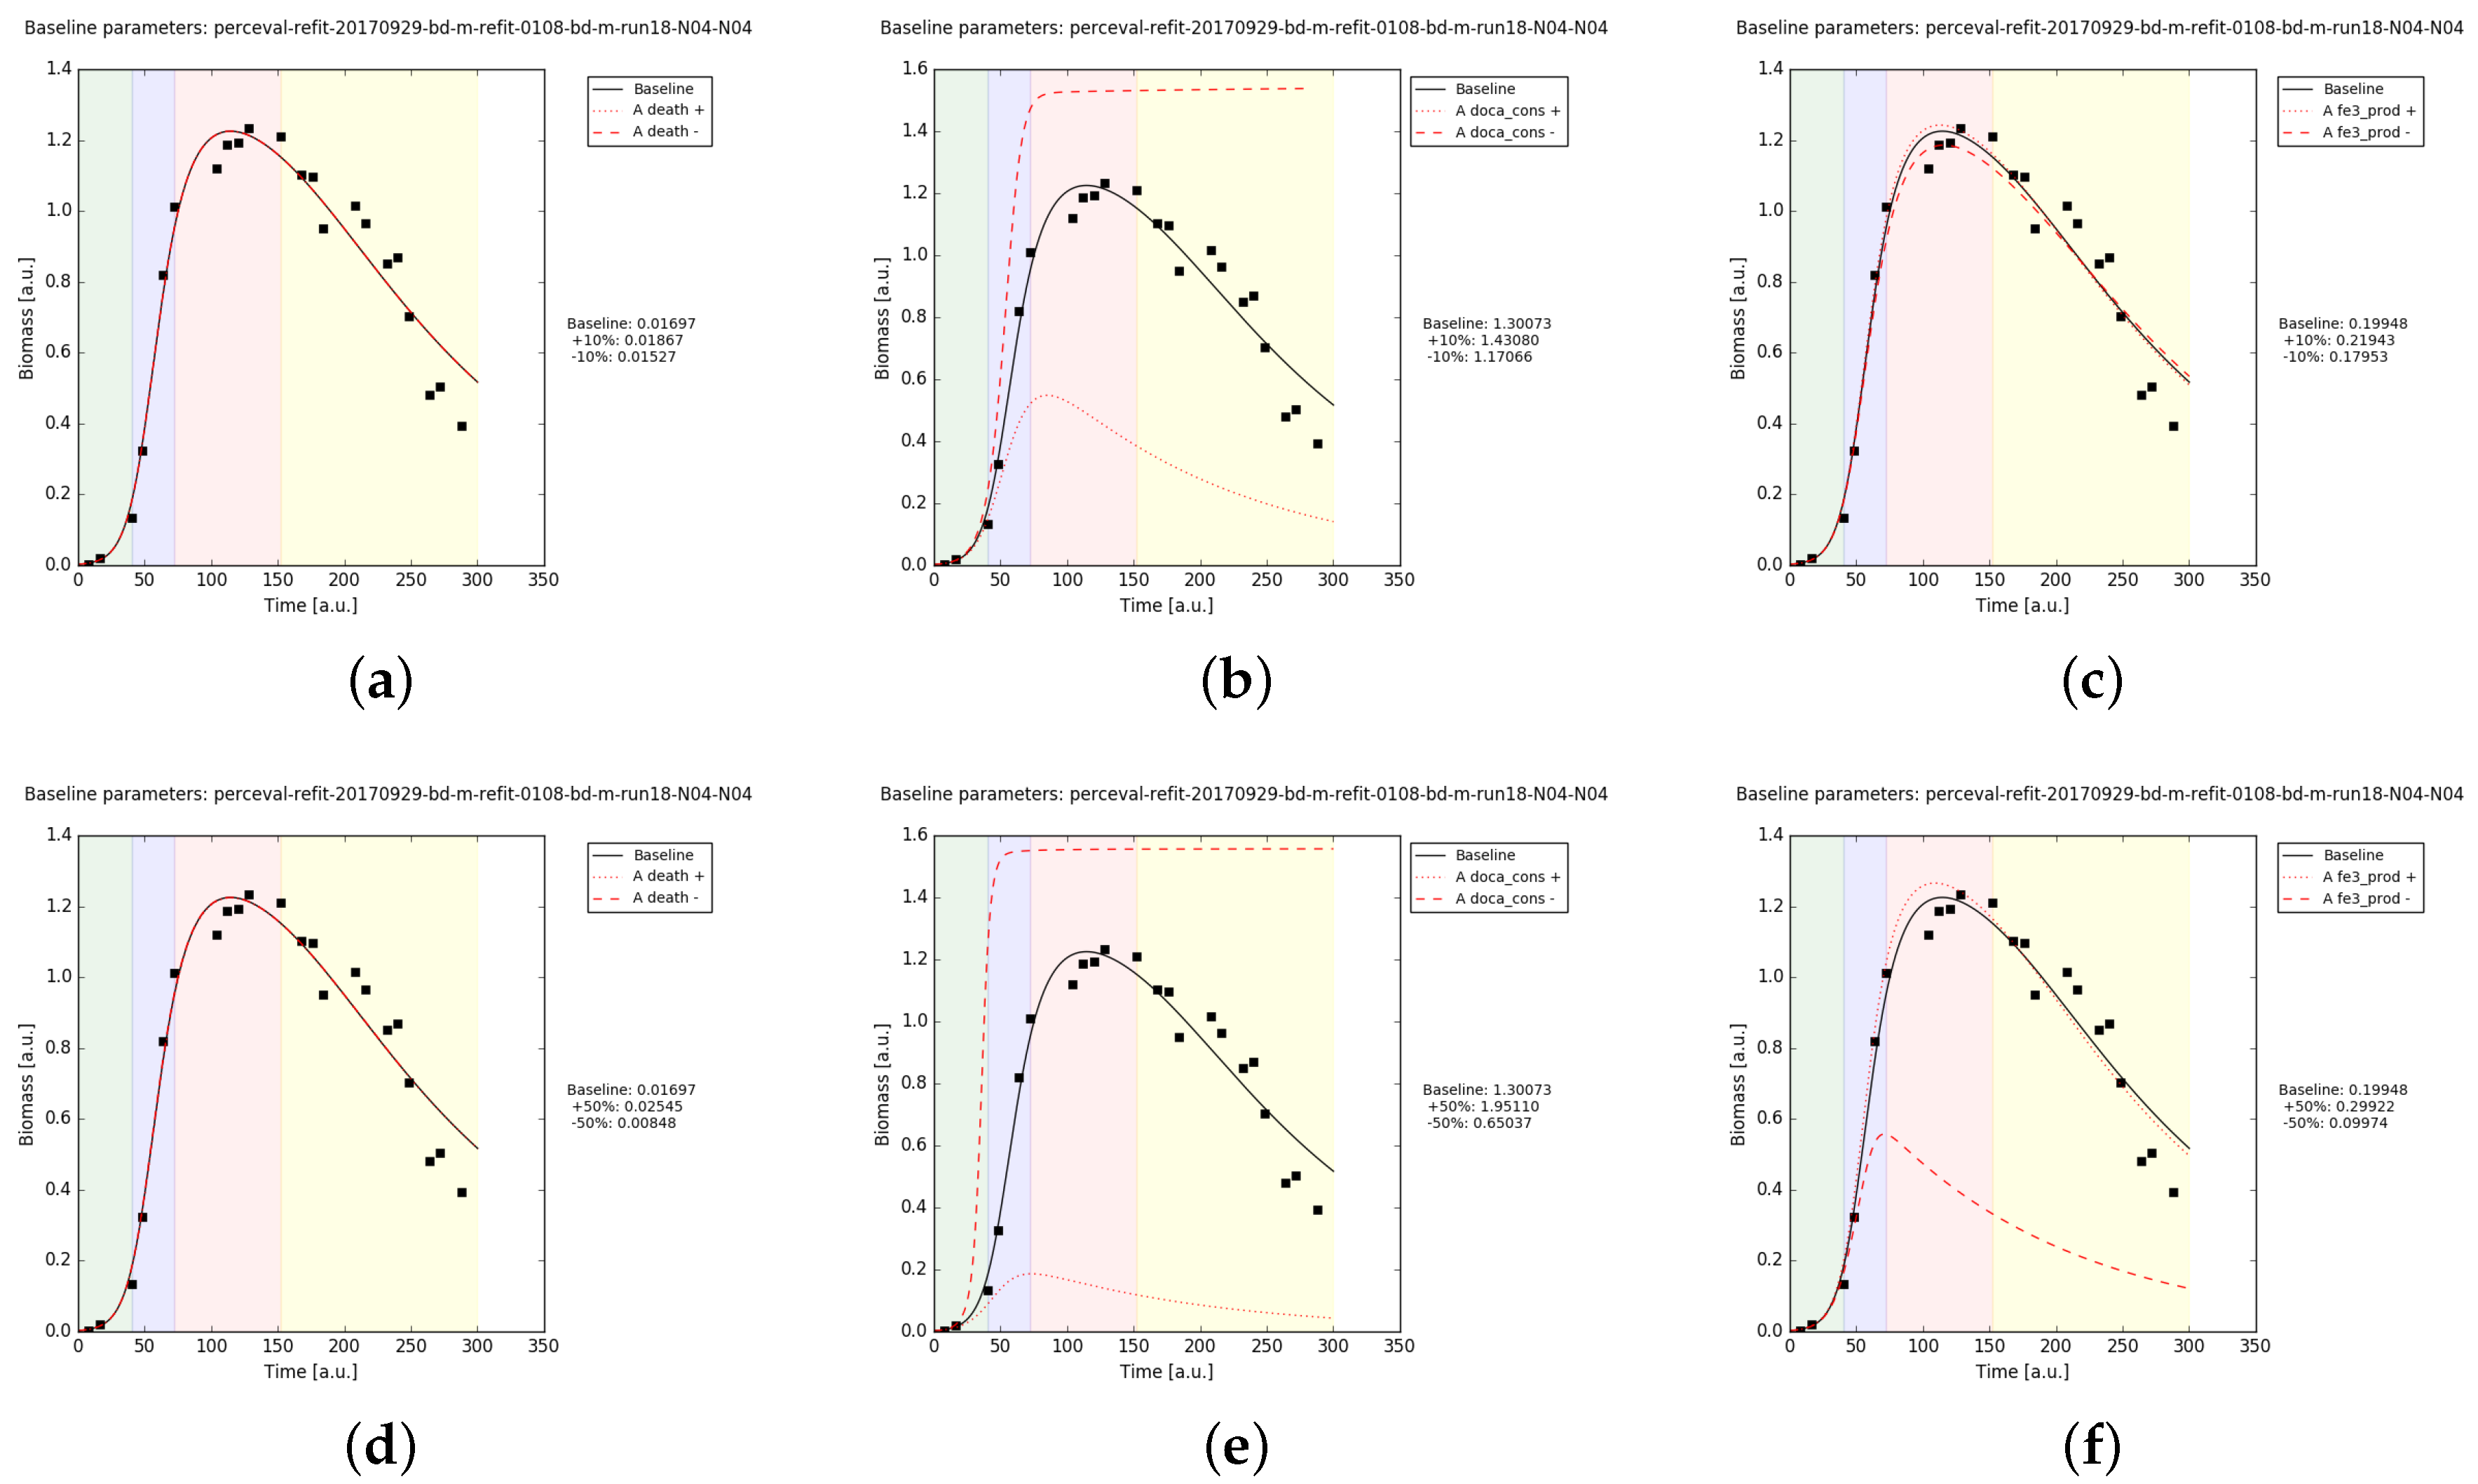
We checked the effect of varying the parameters , and (the only bacterial parameters observed to influence the biomass growth curve in CM) by % and %. The diatom growth is almost insensitive to these variations in CM (Figure A4), while it shows greater effects in MM (Figure A5).
Figure A4.
Diatom growth in CM simulation results. The parameters , and , are varied by % ((a–c) respectively) and by % ((d–f) respectively).
Figure A4.
Diatom growth in CM simulation results. The parameters , and , are varied by % ((a–c) respectively) and by % ((d–f) respectively).

Figure A5.
Diatom growth in MM simulation results. The parameters , and , are varied by % ((a–c) respectively) and by % ((d–f) respectively).
Figure A5.
Diatom growth in MM simulation results. The parameters , and , are varied by % ((a–c) respectively) and by % ((d–f) respectively).
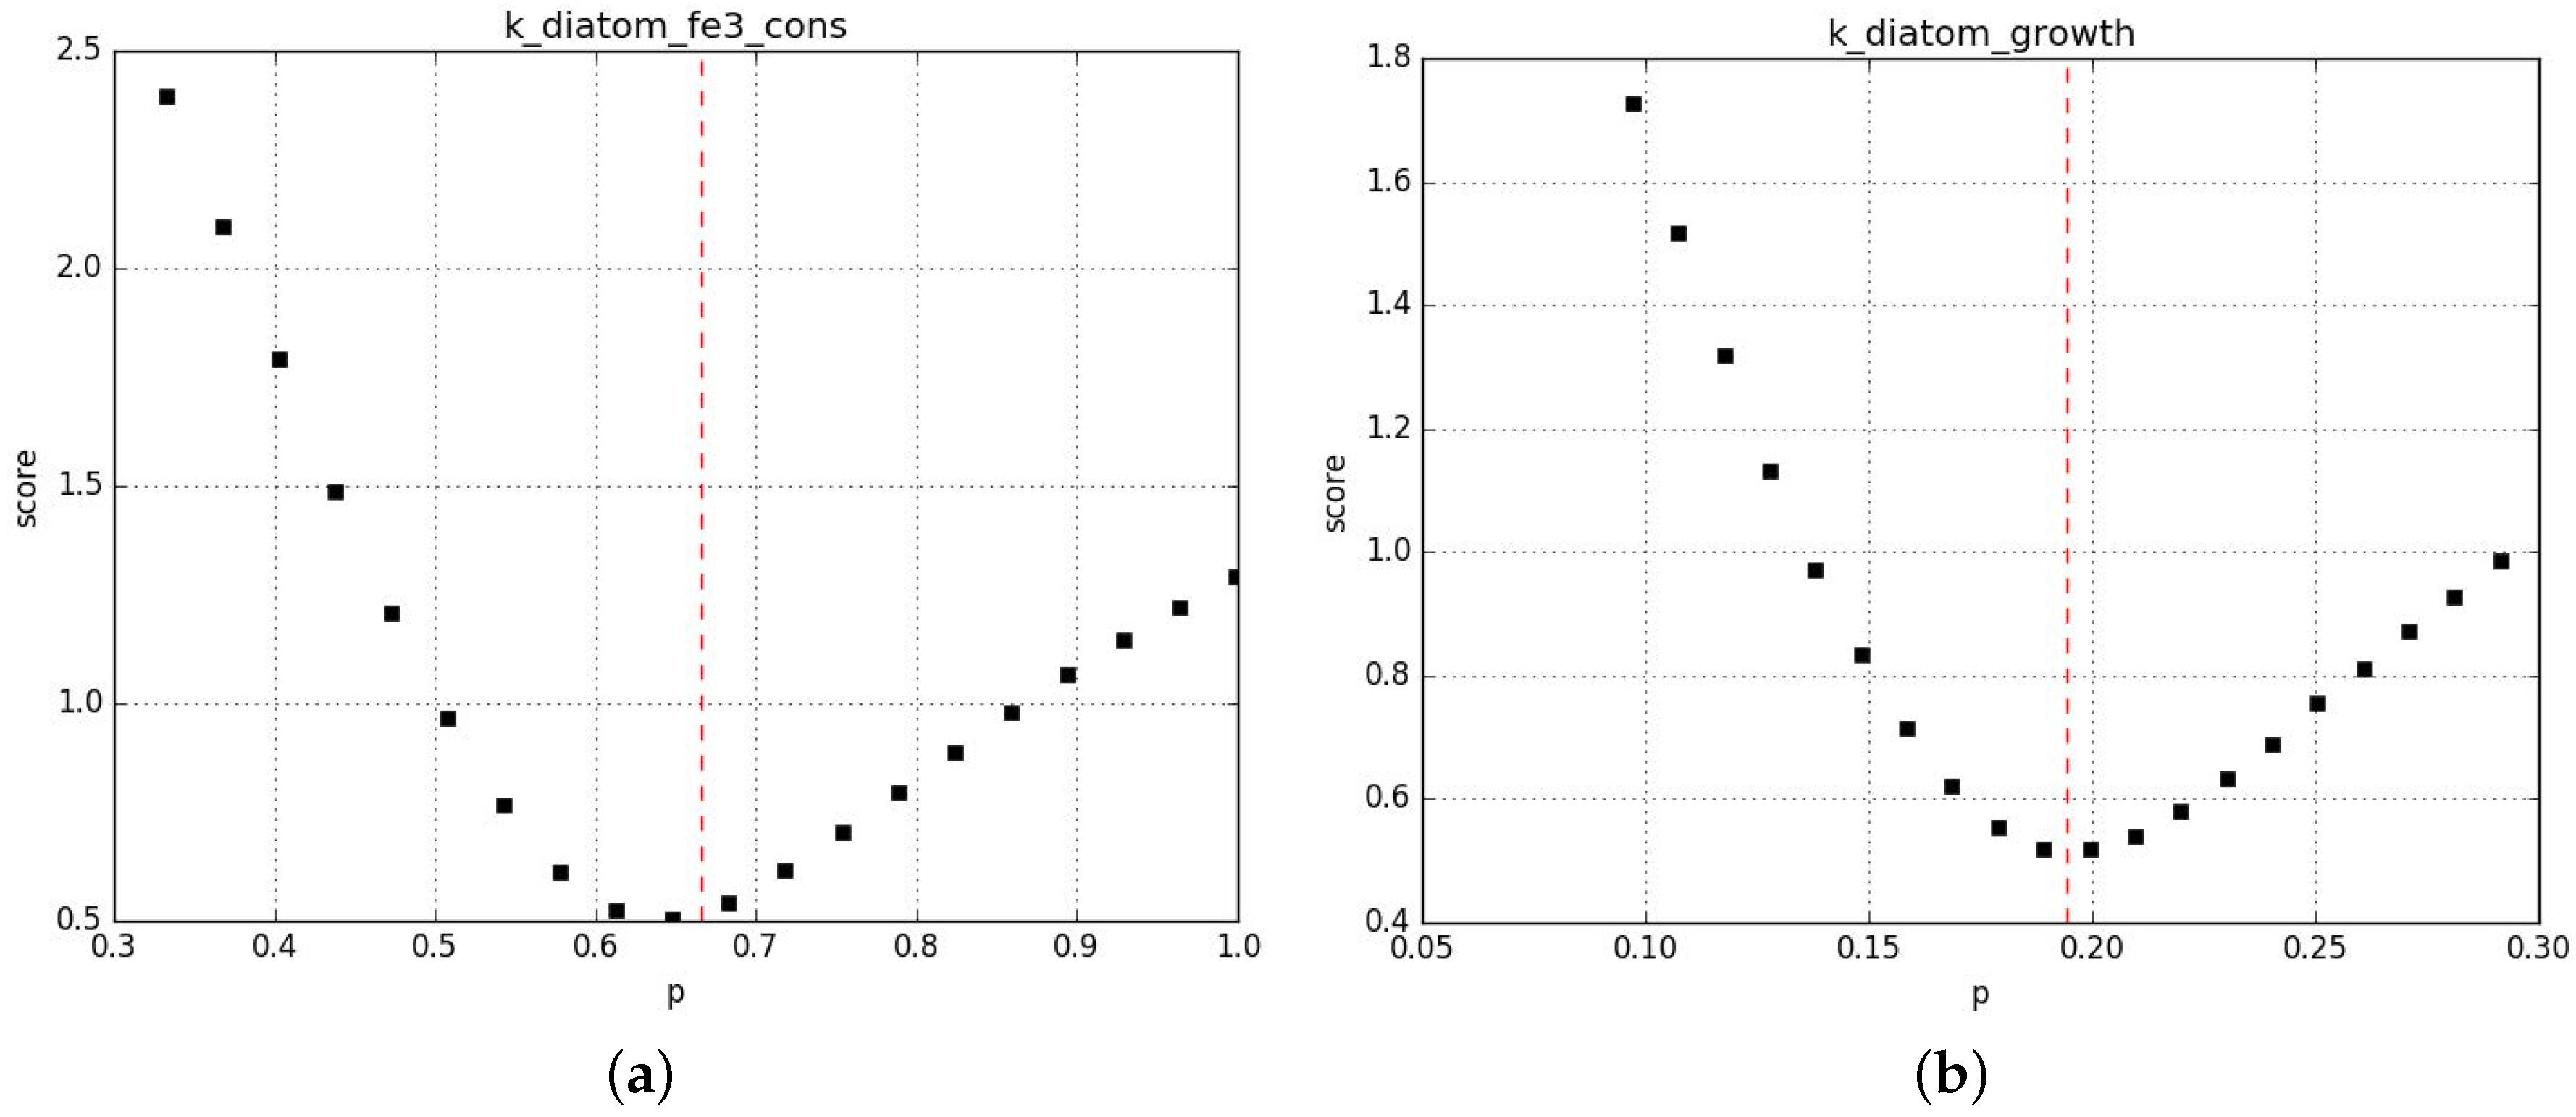
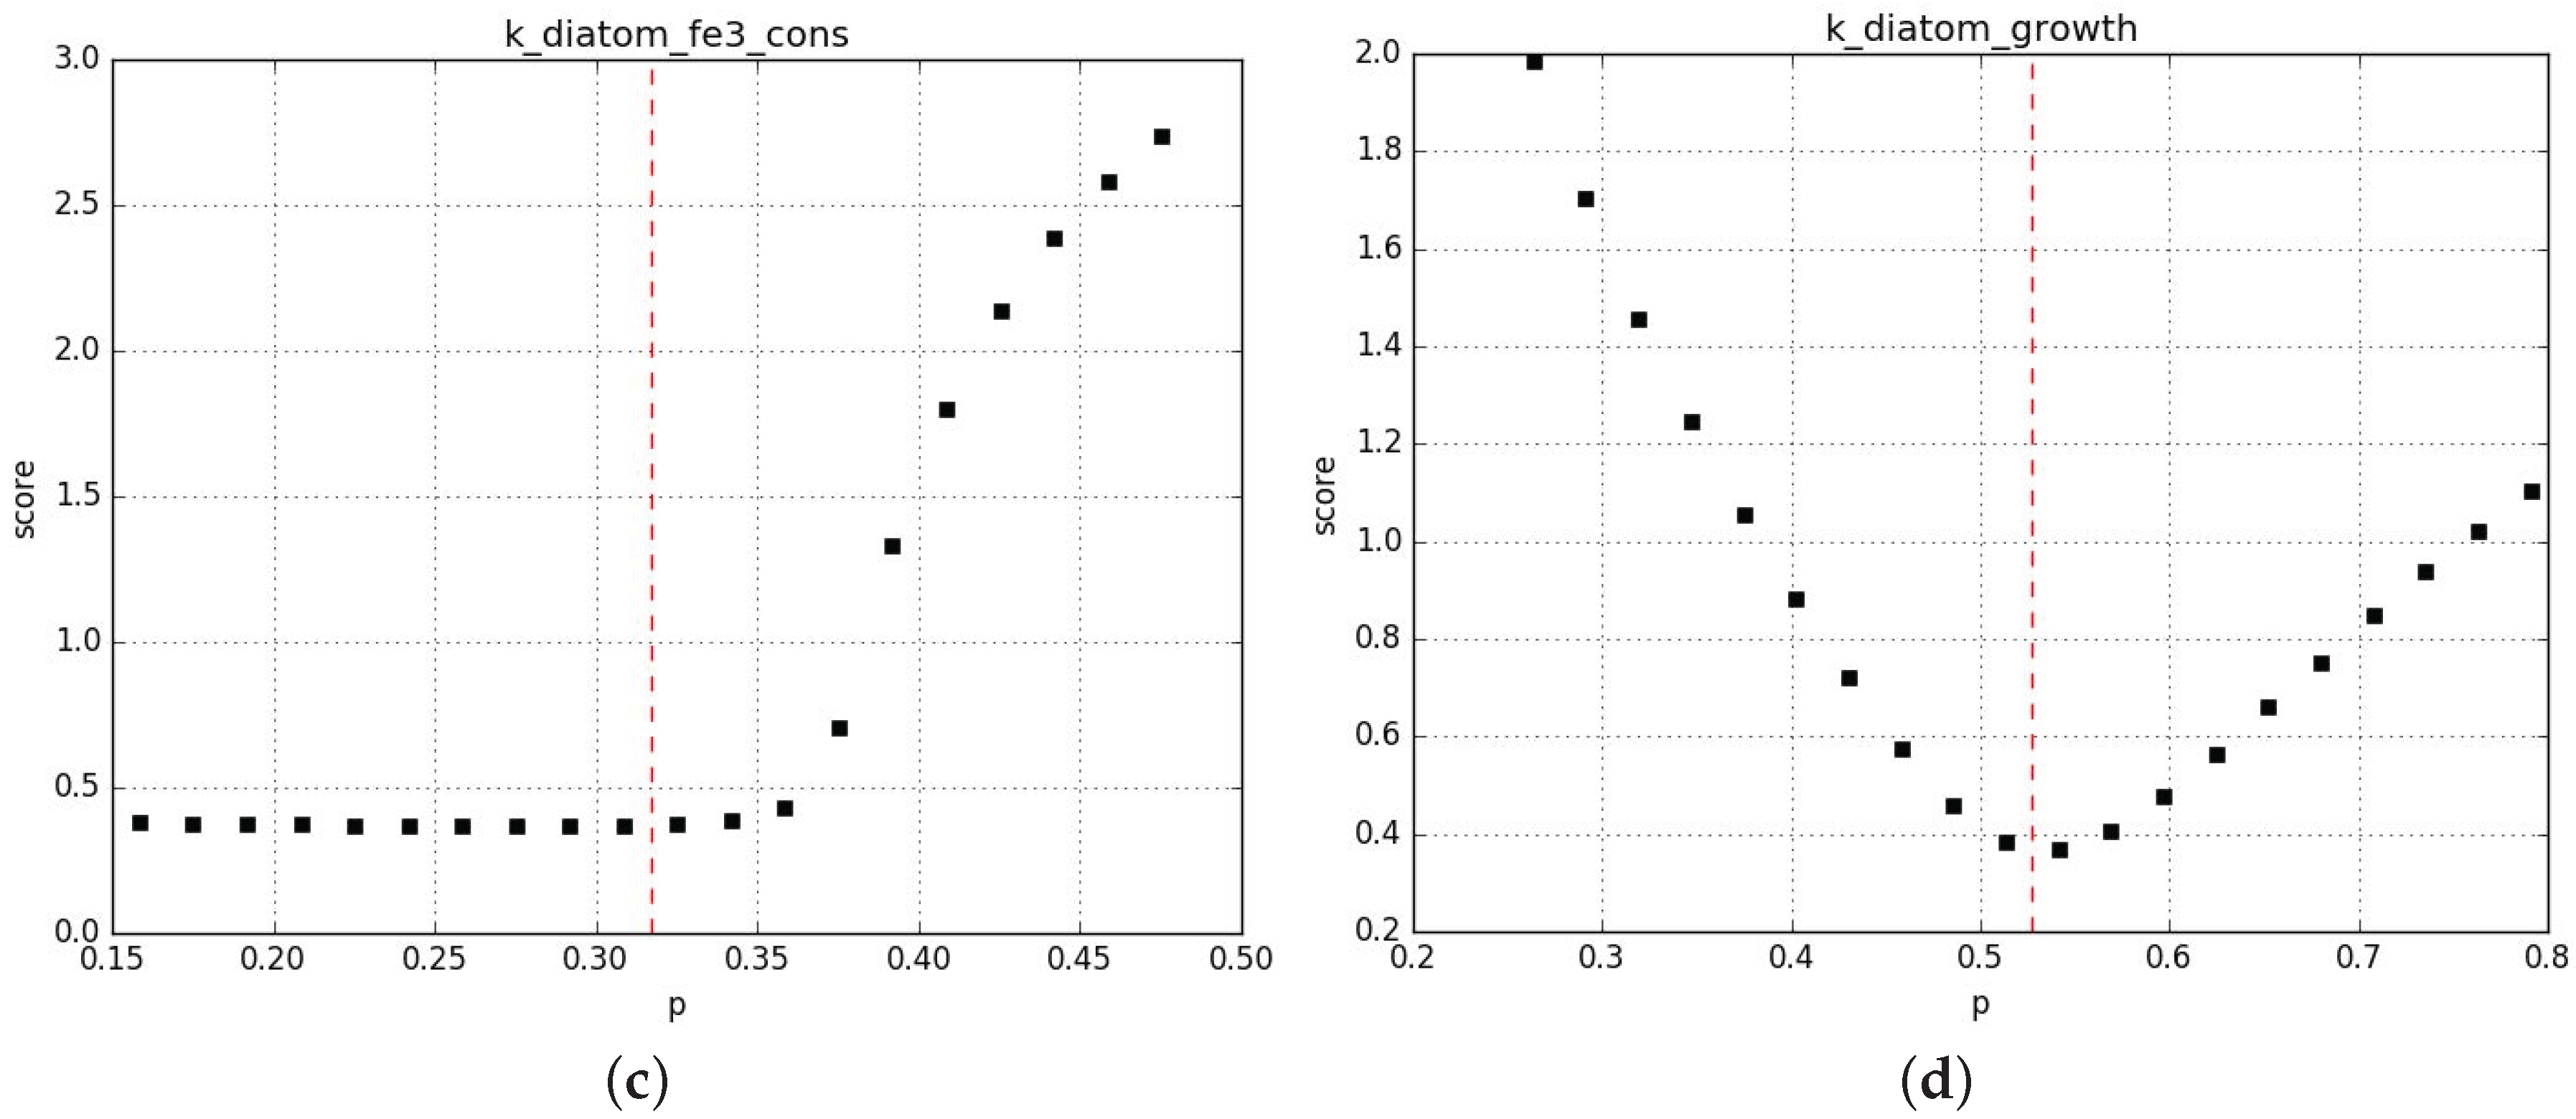
Parameter profiling shows that the algorithm correctly converges towards local minima and that in general those minima are rather stable to perturbation %. Figure A6 shows examples of the most unstable profiles from this first set of fits. Additional information is provided in the Supplementary Material 2.
Figure A6.
Profiling of the parameters in CM (a) and MM (c) and in CM (b) and MM (d).
The red line shows the value chosen by the fit.
Figure A6.
Profiling of the parameters in CM (a) and MM (c) and in CM (b) and MM (d).
The red line shows the value chosen by the fit.
References
- Chisti, Y. Biodiesel from microalgae. Biotechnol. Adv. 2007, 25, 294–306. [Google Scholar] [CrossRef] [PubMed]
- Moejes, F.W.; Moejes, K.B. Algae for Africa: Microalgae as a source of food, feed and fuel in Kenya. Afr. J.Biotechnol. 2017, 16, 288–301. [Google Scholar] [CrossRef]
- Ryther, J.; Goldman, J. Microbes as food in mariculture. Annu. Rev. Microbiol. 1975, 29, 429–443. [Google Scholar] [CrossRef] [PubMed]
- Tredici, M.R.; Biondi, N.; Ponis, E.; Rodolfi, L.; Zittelli, G.C.; Burnell, G.; Allan, G. Advances in microalgal culture for aquaculture feed and other uses. In New Technologies in Aquaculture: Improving Production Efficiency, Quality and Environmental Management; Burnell, G., Allan, G., Eds.; Woodhead Publishing Ltd.: Cambridge, UK, 2009; pp. 610–676. [Google Scholar]
- Rebolloso-Fuentes, M.; Navarro-Pérez, A.; Ramos-Miras, J.; Guil-Guerrero, J. Biomass nutrient profiles of the microalga Phaeodactylum tricornutum. J. Food Biochem. 2001, 25, 57–76. [Google Scholar] [CrossRef]
- Kates, M.; Volcani, B.E. Lipid components of diatoms. Biochim. Biophys. Acta 1966, 116, 264–278. [Google Scholar] [CrossRef]
- Fajardo, A.R.; Cerdán, L.E.; Medina, A.R.; Fernández, F.G.A.; Moreno, P.A.G.; Grima, E.M. Lipid extraction from the microalga Phaeodactylum tricornutum. Eur. J. Lipid Sci. Technol. 2007, 109, 120–126. [Google Scholar] [CrossRef]
- Siron, R.; Giusti, G.; Berland, B. Changes in the fatty acid composition of Phaeodactylum tricornutum and Dunaliella tertiolecta during growth and under phosphorus deficiency. Mar. Ecol. Prog. Ser. 1989, 55, 95–100. [Google Scholar] [CrossRef]
- Yashodhara, B.M.; Umakanth, S.; Pappachan, J.M.; Bhat, S.K.; Kamath, R.; Choo, B.H. Omega-3 fatty acids: A comprehensive review of their role in health and disease. Postgrad. Med. J. 2009, 85, 84–90. [Google Scholar] [CrossRef] [PubMed]
- Francius, G.; Tesson, B.; Dague, E.; Martin-jézéquel, V.; Dufrêne, Y.F. Nanostructure and nanomechanics of live Phaeodactylum tricornutum morphotypes. Environ. Microbiol. 2008, 10, 1344–1356. [Google Scholar] [CrossRef] [PubMed]
- Santaeufemia, S.; Torres, E.; Mera, R.; Abalde, J. Bioremediation of oxytetracycline in seawater by living and dead biomass of the microalga Phaeodactylum tricornutum. J. Hazard. Mater. 2016, 320, 315–325. [Google Scholar] [CrossRef] [PubMed]
- Mata, T.; Martins, A.; Caetano, N. Microalgae for biodiesel production and other applications: A review. Renew. Sustain. Energy Rev. 2010, 14, 217–232. [Google Scholar] [CrossRef]
- Grima, E.; Fernández, F. Photobioreactors: Light regime, mass transfer, and scaleup. J. Biotechnol. 1999, 70, 231–247. [Google Scholar] [CrossRef]
- Parmar, A.; Singh, N.; Pandey, A. Cyanobacteria and microalgae: A positive prospect for biofuels. Bioresour. Technol. 2011, 102, 10163–10172. [Google Scholar] [CrossRef] [PubMed]
- Day, J.G.; Thomas, N.J.; Achilles-Day, U.E.M.; Leakey, R.J.G. Early detection of protozoan grazers in algal biofuel cultures. Bioresour. Technol. 2012, 114, 715–719. [Google Scholar] [CrossRef] [PubMed]
- Wang, H.; Zhang, W.; Chen, L.; Wang, J.; Liu, T. The contamination and control of biological pollutants in mass cultivation of microalgae. Bioresour. Technol. 2013, 128, 745–750. [Google Scholar] [CrossRef] [PubMed]
- Kazamia, E.; Aldridge, D.C.; Smith, A.G. Synthetic ecology—A way forward for sustainable algal biofuel production? J. Biotechnol. 2012, 162, 163–169. [Google Scholar] [CrossRef]
- Gause, G. The Struggle for Existence; The Williams & Wilkins company: Baltimore, MD, USA, 1934; p. 163. [Google Scholar]
- Hardin, G. The competitive exclusion principle. Science 1960, 131, 1292–1297. [Google Scholar] [CrossRef] [PubMed]
- Dykhuizen, D. Santa Rosalia revisited: Why are there so many species of bacteria? Antonie Van Leeuwenhoek 1998, 73, 25–33. [Google Scholar] [CrossRef] [PubMed]
- Hagstrom, G.I.; Levin, S.A. Marine Ecosystems as Complex Adaptive Systems: Emergent Patterns, Critical Transitions, and Public Goods. Ecosystems 2017, 20, 458–476. [Google Scholar] [CrossRef]
- Widder, S.; Allen, R.J.; Pfeiffer, T.; Curtis, T.P.; Wiuf, C.; Sloan, W.T.; Cordero, O.X.; Brown, S.P.; Momeni, B.; Shou, W.; et al. Challenges in microbial ecology: Building predictive understanding of community function and dynamics. ISME J. 2016, 10, 2557–2568. [Google Scholar] [CrossRef] [PubMed]
- Song, H.S.; Cannon, W.; Beliaev, A.; Konopka, A. Mathematical Modeling of Microbial Community Dynamics: A Methodological Review. Processes 2014, 2, 711–752. [Google Scholar] [CrossRef]
- Zomorrodi, A.R.; Segrè, D. Synthetic Ecology of Microbes: Mathematical Models and Applications. J. Mol. Biol. 2015, 428, 837–861. [Google Scholar] [CrossRef] [PubMed]
- Succurro, A.; Moejes, F.W.; Ebenhöh, O. A Diverse Community To Study Communities: Integration of Experiments and Mathematical Models To Study Microbial Consortia. J. Bacteriol. 2017, 199. [Google Scholar] [CrossRef] [PubMed]
- Lotka, A. Elements of Physical Biology; Williams & Wilkins Company: Philadelphia, PA, USA, 1925. [Google Scholar]
- Volterra, V. Fluctuations in the abundance of a species considered mathematically. Nature 1926, 118, 558–560. [Google Scholar] [CrossRef]
- Hofbauer, J.; Hutson, V.; Jansen, W. Coexistence for systems governed by difference equations of Lotka-Volterra type. J. Math. Biol. 1987, 25, 553–570. [Google Scholar] [CrossRef] [PubMed]
- Berry, D.; Widder, S. Deciphering microbial interactions and detecting keystone species with co-occurrence networks. Front. Microbiol. 2014, 5, 219. [Google Scholar] [CrossRef] [PubMed]
- Amin, S.A.; Parker, M.S.; Armbrust, E.V. Interactions between diatoms and bacteria. Microbiol. Mol. Biol. Rev. 2012, 76, 667–684. [Google Scholar] [CrossRef] [PubMed]
- Provasoli, L. Nutrition and ecology of Protozoa and Algae. Annu. Rev. Microbiol. 1958, 12, 279–308. [Google Scholar] [CrossRef] [PubMed]
- Delucca, R.; McCracken, M.D. Observations on interactions between naturally-collected bacteria and several species of algae. Hydrobiologia 1977, 55, 71–75. [Google Scholar] [CrossRef]
- Suminto; Hirayama, K. Application of a growth-promoting bacteria for stable mass culture of three marine microalgae. Hydrobiologia 1997, 358, 223–230. [Google Scholar]
- Bruckner, C.G.; Rehm, C.; Grossart, H.P.; Kroth, P.G. Growth and release of extracellular organic compounds by benthic diatoms depend on interactions with bacteria. Environ. Microbiol. 2011, 13, 1052–1063. [Google Scholar] [CrossRef] [PubMed]
- Amin, S.A.; Hmelo, L.R.; van Tol, H.M.; Durham, B.P.; Carlson, L.T.; Heal, K.R.; Morales, R.L.; Berthiaume, C.T.; Parker, M.S.; Djunaedi, B.; et al. Interaction and signalling between a cosmopolitan phytoplankton and associated bacteria. Nature 2015, 522, 98–101. [Google Scholar] [CrossRef] [PubMed]
- Verhulst, P. Notice sur la loi que la population suit dans son accroissement. Corresp. Math. Phys. l’Obs. Brux. 1838, 10, 113–121. [Google Scholar]
- Gachon, C.M.; Day, J.G.; Campbell, C.N.; Pröschold, T.; Saxon, R.J.; Küpper, F.C. The Culture Collection of Algae and Protozoa (CCAP): A biological resource for protistan genomics. Gene 2007, 406, 51–57. [Google Scholar] [CrossRef] [PubMed]
- Moejes, F.W. Dynamics of the bacterial community associated with Phaeodactylum tricornutum cultures: A novel approach to scaling up microalgal cultures. Ph.D. Thesis, Heinrich Heine University Dusseldorf, Düsseldorf, Germany, 2016. [Google Scholar]
- Guillard, R.; Ryther, J. Studies of marine planktonic diatoms: I. Cyclotella nana Hutedt, and Detonula confervacea (Cleve) Gran. Can. J. Microbiol. 1962, 8, 229–239. [Google Scholar] [CrossRef] [PubMed]
- Guillard, R. Culture of phytoplankton for feeding marine invertebrates. In Culture of Marine Invertebrate Animals; Smith, W.L., Chanley, M.H., Eds.; Plenum Press: New York, NY, USA, 1975; pp. 29–60. [Google Scholar]
- De Gouvion Saint Cyr, D.; Wisniewski, C.; Schrive, L.; Farhi, E.; Rivasseau, C. Feasibility study of microfiltration for algae separation in an innovative nuclear effluents decontamination process. Sep. Purif. Technol. 2014, 125, 126–135. [Google Scholar] [CrossRef]
- Quail, M.; Smith, M.E.; Coupland, P.; Otto, T.D.; Harris, S.R.; Connor, T.R.; Bertoni, A.; Swerdlow, H.P.; Gu, Y. A tale of three next generation sequencing platforms: Comparison of Ion torrent, pacific biosciences and illumina MiSeq sequencers. BMC Genom. 2012, 13, 341. [Google Scholar] [CrossRef] [PubMed]
- Grada, A.; Weinbrecht, K. Next-Generation Sequencing: Methodology and Application. J. Investig. Dermatol. 2013, 133, e11. [Google Scholar] [CrossRef] [PubMed]
- Pylro, V.S.; Roesch, L.F.W.; Morais, D.K.; Clark, I.M.; Hirsch, P.R.; Tótola, M.R. Data analysis for 16S microbial profiling from different benchtop sequencing platforms. J. Microbiol. Methods 2014, 107, 30–37. [Google Scholar] [CrossRef] [PubMed]
- Aronesty, E. ea-utils: Command-Line Tools for Processing Biological Sequencing Data. Durham, NC, USA, 2011. Available online: https://github.com/ExpressionAnalysis/ea-utils (accessed on 30 November 2017).
- Edgar, R.C. Search and clustering orders of magnitude faster than BLAST. Bioinformatics 2010, 26, 2460–2461. [Google Scholar] [CrossRef] [PubMed]
- Edgar, R.C. UPARSE: Highly accurate OTU sequences from microbial amplicon reads. Nat. Methods 2013, 10, 996–998. [Google Scholar] [CrossRef] [PubMed]
- Caporaso, J.G.; Kuczynski, J.; Stombaugh, J.; Bittinger, K.; Bushman, F.D.; Costello, E.K.; Fierer, N.; Peña, A.G.; Goodrich, J.K.; Gordon, J.I.; et al. QIIME allows analysis of high-throughput community sequencing data. Nat. Methods 2010, 7, 335–336. [Google Scholar] [CrossRef] [PubMed]
- Quast, C.; Pruesse, E.; Yilmaz, P.; Gerken, J.; Schweer, T.; Yarza, P.; Peplies, J.; Glockner, F.O. The SILVA ribosomal RNA gene database project: Improved data processing and web-based tools. Nucleic Acids Res. 2013, 41, D590–D596. [Google Scholar] [CrossRef] [PubMed]
- R Development Core Team. R: A Language and Environment for Statistical Computing. R Foundation for Statistical Computing: Vienna, Austria, 2015. Available online: http://www.R-project.org/ (accessed on 30 November 2017).
- Monod, J. The Growth of Bacterial Cultures. Annu. Rev. Microbiol. 1949, 3, 371–394. [Google Scholar] [CrossRef]
- Mitchell, M. An Introduction to Genetic Algorithms; MIT Press: Cambridge, MA, USA, 1996. [Google Scholar]
- Chen, J.; Bittinger, K.; Charlson, E.S.; Hoffmann, C.; Lewis, J.; Wu, G.D.; Collman, R.G.; Bushman, F.D.; Li, H. Associating microbiome composition with environmental covariates using generalized UniFrac distances. Bioinformatics 2012, 28, 2106–2113. [Google Scholar] [CrossRef] [PubMed]
- Bowman, J. Bioactive compound synthetic capacity and ecological significance of marine bacterial genus Pseudoalteromonas. Mar. Drugs 2007, 5, 220–241. [Google Scholar] [CrossRef] [PubMed]
- Desbois, A.P.; Mearns-Spragg, A.; Smith, V.J. A Fatty Acid from the Diatom Phaeodactylum tricornutum is Antibacterial Against Diverse Bacteria Including Multi-resistant Staphylococcus aureus (MRSA). Mar. Biotechnol. 2009, 11, 45–52. [Google Scholar] [CrossRef] [PubMed]
- Soria-Dengg, S.; Reissbrodt, R.; Horstmann, U. Siderophores in marine coastal waters and their relevance for iron uptake by phytoplankton: Experiments with the diatom Phaeodactylum tricornutum. Mar. Ecol. Prog. Ser. 2001, 220, 73–82. [Google Scholar] [CrossRef]
- Amin, S.A.; Green, D.H.; Hart, M.C.; Küpper, F.C.; Sunda, W.G.; Carrano, C.J. Photolysis of iron‚ siderophore chelates promotes bacterial‚ algal mutualism. Proc. Natl. Acad. Sci. USA 2009, 106, 17071–17076. [Google Scholar] [CrossRef] [PubMed] [Green Version]
- Soria-Dengg, S.; Horstmann, U. Ferrioxamines B and E as iron sources for the marine diatom Phaeodactylum tricornutum. Mar. Ecol. Prog. Ser. 1995, 127, 269–277. [Google Scholar] [CrossRef]
- Provasoli, L. Organic regulation of phytoplankton fertility. In The Sea: Ideas and Observations on Progress in the Study of the Seas; Hill, M., Ed.; Wiley-Interscience: New York, NY, USA, 1963; pp. 165–219. [Google Scholar]
- Provasoli, L.; Carlucci, A. Vitamins and growth regulators. In Algal Physiology and Biochemistry, Botanical Monographs, 10; Stewart, W., Ed.; Blackwell Scientific Publications: San Diego, CA, USA, 1974; pp. 741–787. [Google Scholar]
- Croft, M.T.; Warren, M.J.; Smith, A.G. Algae need their vitamins. Eukaryot. Cell 2006, 5, 1175–1183. [Google Scholar] [CrossRef] [PubMed]
- Yongmanitchai, W.; Ward, O.P. Growth of and omega-3 fatty acid production by Phaeodactylum tricornutum under different culture conditions. Appl. Environ. Microbiol. 1991, 57, 419–425. [Google Scholar] [PubMed]
- Sañudo-Wilhelmy, S.A.; Gómez-Consarnau, L.; Suffridge, C.; Webb, E.A. The Role of B Vitamins in Marine Biogeochemistry. Annu. Rev. Mar. Sci. 2014, 6, 339–367. [Google Scholar] [CrossRef] [PubMed]
- Azam, F.; Fenchel, T.; Field, J.; Gray, J.; Meyer-Reil, L.; Thingstad, F. The Ecological Role of Water-Column Microbes in the Sea. Mar. Ecol. Prog. Ser. 1983, 10, 257–263. [Google Scholar] [CrossRef]
- Stocker, R. Marine Microbes See a Sea of Gradients. Science 2012, 338, 628–633. [Google Scholar] [CrossRef] [PubMed]
- Persson, G.; Jansson, M.; Kluwer, C. Phosphate uptake and utilizaton by bacteria and algae. Hydrobiologia 1988, 170, 177–189. [Google Scholar]
- Bell, W.; Mitchell, R. Chemotactic and growth responses of marine bacteria to algal extracellular products. Biol. Bull. 1972, 143, 265–277. [Google Scholar] [CrossRef]
- MacArthur, R. Fluctuations of animal populations and a measure of community stability. Ecology 1955, 36, 533–536. [Google Scholar] [CrossRef]
- Gardner, M.; Ashby, W. Connectance of large dynamic (cybernetic) systems: Critical values for stability. Nature 1970, 228, 784. [Google Scholar] [CrossRef] [PubMed]
- Pimm, S. The complexity and stability of ecosystems. Nature 1984, 307, 321–326. [Google Scholar] [CrossRef]
- Elton, C. The Ecology of Invasions by Animals and Plants; Springer: Dordrecht, The Netherlands, 1958. [Google Scholar]
- McCann, K.S. The diversity-stability debate. Nature 2000, 405, 228–233. [Google Scholar] [CrossRef] [PubMed]
- Ivanova, E.P.; Flavier, S.; Christen, R. Phylogenetic relationships among marine Alteromonas-like proteobacteria: Emended description of the family Alteromonadaceae and proposal of Pseudoalteromonadaceae fam. nov., Colwelliaceae fam. nov., Shewanellaceae fam. nov., Moritellaceae fam. nov., Ferri. Int. J. Syst. Evolut. Microbiol. 2004, 54, 1773–1788. [Google Scholar] [CrossRef] [PubMed]
- Rosenberg, E.; DeLong, E.F.; Lory, S.; Stackebrandt, E.; Thompson, F. The Prokaryotes; Springer: Berlin/Heidelberg, Germany, 2014. [Google Scholar]
- Lee, S.O.; Kato, J.; Takiguchi, N.; Kuroda, A.; Ikeda, T. Involvement of an Extracellular Protease in Algicidal Activity of the Marine Bacterium Pseudoalteromonas sp. Strain A28. Appl. Environ. Microbiol. 2000, 66, 4334–4339. [Google Scholar] [CrossRef] [PubMed]
- Venkateswaran, K.; Dohmoto, N. Pseudoalteromonas peptidolytica sp. nov., a novel marine mussel-thread-degrading bacterium isolated from the Sea of Japan. Int. J. Syst. Evolut. Microbiol. 2000, 50, 565–574. [Google Scholar] [CrossRef] [PubMed]
- Chen, X.; Xie, B.; Lu, J.; He, H.; Zhang, Y. A novel type of subtilase from the psychrotolerant bacterium Pseudoalteromonas sp. SM9913: Catalytic and structural properties of deseasin MCP-01. Microbiology 2007, 153, 2116–2125. [Google Scholar] [CrossRef] [PubMed]
- Khudary, R.A.; Venkatachalam, R.; Katzer, M. A cold-adapted esterase of a novel marine isolate, Pseudoalteromonas arctica: Gene cloning, enzyme purification and characterization. Extremophiles 2010, 14, 273–285. [Google Scholar] [CrossRef] [PubMed]
- Lu, M.; Wang, S.; Fang, Y.; Li, H.; Liu, S.; Liu, H. Cloning, expression, purification, and characterization of cold-adapted α-amylase from Pseudoalteromonas arctica GS230. Protein J. 2010, 29, 591–597. [Google Scholar] [CrossRef] [PubMed]
- Albino, A.; Marco, S.; Maro, A.D. Characterization of a cold-adapted glutathione synthetase from the psychrophile Pseudoalteromonas haloplanktis. Mol. Biosyst. 2012, 8, 2405–2414. [Google Scholar] [CrossRef] [PubMed]
- He, H.; Guo, J.; Chen, X.; Xie, B.; Zhang, X. Structural and functional characterization of mature forms of metalloprotease E495 from Arctic sea-ice bacterium Pseudoalteromonas sp. SM495. PLoS ONE 2012, 7, e35442. [Google Scholar] [CrossRef] [PubMed]
- Holmström, C.; Kjelleberg, S. Marine Pseudoalteromonas species are associated with higher organisms and produce biologically active extracellular agents. FEMS Microbiol. Ecol. 1999, 30, 285–293. [Google Scholar] [CrossRef]
- Ivanova, E.P.; Mikhaĭlov, V.V. A new family of Alteromonadaceae fam. nov., including the marine proteobacteria species Alteromonas, Pseudoalteromonas, Idiomarina i Colwellia. Mikrobiologiia 2001, 70, 15–23. [Google Scholar] [PubMed]
- Reid, R.; Butler, A. Investigation of the mechanism of iron acquisition by the marine bacterium Alteromonas luteoviolaceus: Characterization of siderophore production. Limnol. Oceanogr. 1991, 36, 1783–1792. [Google Scholar] [CrossRef]
- Holt, P.D.; Reid, R.R.; Lewis, B.L.; Luther, G.W.; Butler, A. Iron(III) coordination chemistry of alterobactin A: A siderophore from the marine bacterium Alteromonas luteoviolacea. Inorg. Chem. 2005, 44, 7671–7677. [Google Scholar] [CrossRef] [PubMed]
- Vraspir, J.M.; Butler, A. Chemistry of marine ligands and siderophores. Annu. Rev. Mar. Sci. 2009, 1, 43–63. [Google Scholar] [CrossRef] [PubMed]
- Bruland, K.W.; Donat, J.R.; Hutchins, D.a. Interactive influences of bioactive trace metals on biological production in oceanic waters. Limnol. Oceanogr. 1991, 36, 1555–1577. [Google Scholar] [CrossRef]
- Morel, F.M.M.; Price, N.M. The biogeochemical cycles of trace metals in the oceans. Science 2003, 300, 944–947. [Google Scholar] [CrossRef] [PubMed]
- Yoon, J.; Jo, Y.; Kim, G.J.; Choi, H. Gramella lutea sp. nov., a Novel Species of the Family Flavobacteriaceae Isolated from Marine Sediment. Curr. Microbiol. 2015, 71, 252–258. [Google Scholar] [CrossRef] [PubMed]
- Glöckner, F.O.; Fuchs, B.M.; Amann, R. Bacterioplankton compositions of lakes and oceans: A first comparison based on fluorescence in situ hybridization. Appl. Environ. Microbiol. 1999, 65, 3721–3726. [Google Scholar] [PubMed]
- Abell, G.; Bowman, J. Ecological and biogeographic relationships of class Flavobacteria in the Southern Ocean. FEMS Microbiol. Ecol. 2005, 51, 265–277. [Google Scholar] [CrossRef] [PubMed]
- DeLong, E.F.; Preston, C.M.; Mincer, T.; Rich, V.; Hallam, S.J.; Frigaard, N.U.; Martinez, A.; Sullivan, M.B.; Edwards, R.; Brito, B.R.; et al. Community genomics among stratified microbial assemblages in the ocean’s interior. Science 2006, 311, 496–503. [Google Scholar] [CrossRef] [PubMed]
- Manz, W.; Amann, R.; Ludwig, W.; Vancanneyt, M.; Schleifer, K.H. Application of a suite of 16S rRNA-specific oligonucleotide probes designed to investigate bacteria of the phylum cytophaga-flavobacter-bacteroides in the natural environment. Microbiology 1996, 142, 1097–1106. [Google Scholar] [CrossRef] [PubMed]
- Kirchman, D.L. The ecology of Cytophaga-Flavobacteria in aquatic environments. FEMS Microbiol. Ecol. 2002, 39, 91–100. [Google Scholar] [CrossRef]
- Cottrell, M.T.; Kirchman, D.L. Natural assemblages of marine proteobacteria and members of the Cytophaga-Flavobacter cluster consuming low- and high-molecular-weight dissolved organic matter. Appl. Environ. Microbiol. 2000, 66, 1692–1697. [Google Scholar] [CrossRef] [PubMed]
- Pinhassi, J.; Sala, M.M.; Havskum, H.; Peters, F.; Guadayol, Ò.; Malits, A.; Marrasé, C. Changes in bacterioplankton composition under different phytoplankton regimens. Appl. Environ. Microbiol. 2004, 70, 6753–6766. [Google Scholar] [CrossRef] [PubMed]
- Smayda, T. Harmful algal blooms: Their ecophysiology and general relevance to phytoplankton blooms in the sea. Limnol. Oceanogr. 1997, 42, 1137–1153. [Google Scholar] [CrossRef]
- Starr, M.P.; Stolp, H.; Trüper, H.G.; Balows, A.; Schlegel, H.G. The Prokaryotes; Springer: Berlin/Heidelberg, Germany, 1981. [Google Scholar]
- Anzai, Y.; Kim, H.; Park, J.Y.; Wakabayashi, H.; Oyaizu, H. Phylogenetic affiliation of the pseudomonads based on 16S rRNA sequence. Int. J. Syst. Evolut. Microbiol. 2000, 50, 1563–1589. [Google Scholar] [CrossRef] [PubMed]
- Isnansetyo, A.; Kamei, Y. Bioactive substances produced by marine isolates of Pseudomonas. J. Ind. Microbiol. Biotechnol. 2009, 36, 1239–1248. [Google Scholar] [CrossRef] [PubMed]
- Zelezniak, A.; Andrejev, S.; Ponomarova, O.; Mende, D.R.; Bork, P.; Patil, K.R. Metabolic dependencies drive species co-occurrence in diverse microbial communities. Proc. Natl. Acad. Sci. USA 2015, 112, 6449–6454. [Google Scholar] [CrossRef] [PubMed]
- Ponomarova, O.; Patil, K.R. Metabolic interactions in microbial communities: Untangling the Gordian knot. Curr. Opin. Microbiol. 2015, 27, 37–44. [Google Scholar] [CrossRef] [PubMed]
- Tao, H.; Bausch, C.; Richmond, C.; Blattner, F.R.; Conway, T. Functional genomics: Expression analysis of Escherichia coli growing on minimal and rich media. J. Bacteriol. 1999, 181, 6425–6440. [Google Scholar] [PubMed]
- Beg, Q.K.; Zampieri, M.; Klitgord, N.; Collins, S.B.; Altafini, C.; Serres, M.H.; Segrè, D. Detection of transcriptional triggers in the dynamics of microbial growth: Application to the respiratorily versatile bacterium Shewanella oneidensis. Nucleic Acids Res. 2012, 40, 7132–7149. [Google Scholar] [CrossRef] [PubMed]
- Bertrand, E.M.; Allen, A.E.; Dupont, C.L.; Norden-Krichmar, T.M.; Bai, J.; Valas, R.E.; Saito, M.A. Influence of cobalamin scarcity on diatom molecular physiology and identification of a cobalamin acquisition protein. Proc. Natl. Acad. Sci. USA 2012, 109, E1762–E1771. [Google Scholar] [CrossRef] [PubMed]
- Horgan, R.P.; Kenny, L.C. ‘Omic’ technologies: Genomics, transcriptomics, proteomics and metabolomics. Obstet. Gynaecol. 2011, 13, 189–195. [Google Scholar] [CrossRef]
- Lozupone, C.; Knight, R. UniFrac: A New Phylogenetic Method for Comparing Microbial Communities. Appl. Environ. Microbiol. 2005, 71, 8228–8235. [Google Scholar] [CrossRef] [PubMed]
Figure 1.
(a) Distribution of Operational Taxonomic Unit (OTU) abundance (LOG scaled) within phyla from complete data set. The bins marked with asterisks (*) correspond to 99.97% of all which belong to Proteobacteria, Bacteriodetes, Actinobacteria and Firmicutes. (b) Ordination plot of bacterial community in the two media conditions for all sampling points. Triangles and circles correspond to minimal media and complete media conditions, respectively. Blue represents day 1. Red day 8. Green day 15. Black day 22. The ellipses correspond to the 99% confidence interval to each group centroid.

Figure 2.
Bacterial community profile of P. tricornutum (CCAP 1052/1B) over a 36 day period in culture conditions: (a) minimal media; (b) complete media. The growth curves are partitioned into lag (green), log (blue), stationary (red), and decline (yellow) phases. The abundance (%) of the “Top Ten” bacterial families (corresponding colors described in the key) is depicted in pie charts on days 1, 8, 15 and 22 in both media conditions.

Figure 3.
Network of putative interactions between Phaeodactylum tricornutum and identified bacterial families. The dotted grey line depicts the “phycosphere”; a term coined by Bell and Mitchell in 1972 as an aquatic equivalent of the “rhizosphere”, denoting the region extending outwards from the algal cell in which bacterial growth is stimulated by extracellular products of the alga [67].

Figure 4.
Simulation results (lines) and experimental data (squares) for communities of P. tricornutum (D), Pseudoalteromonadaceae (), Flavobacteriaceae (F), Alteromonadaceae (A) and Pseudomonadaceae (P) in (a) minimal media and (b) complete media conditions. The top panel shows the biomass time course (arbitrary units) for the five organisms and the rescaled data points (squares) for the P. tricornutum. The bottom panel shows the variations in relative abundances of the four bacteria (single bacteria biomass/total bacteria biomass) over time and the three sets of data points from the sequencing analysis (the first data point is used as starting condition at time 0). Also shown in the bottom plot (dotted line, right y-axis) is the total bacterial biomass in arbitrary units.
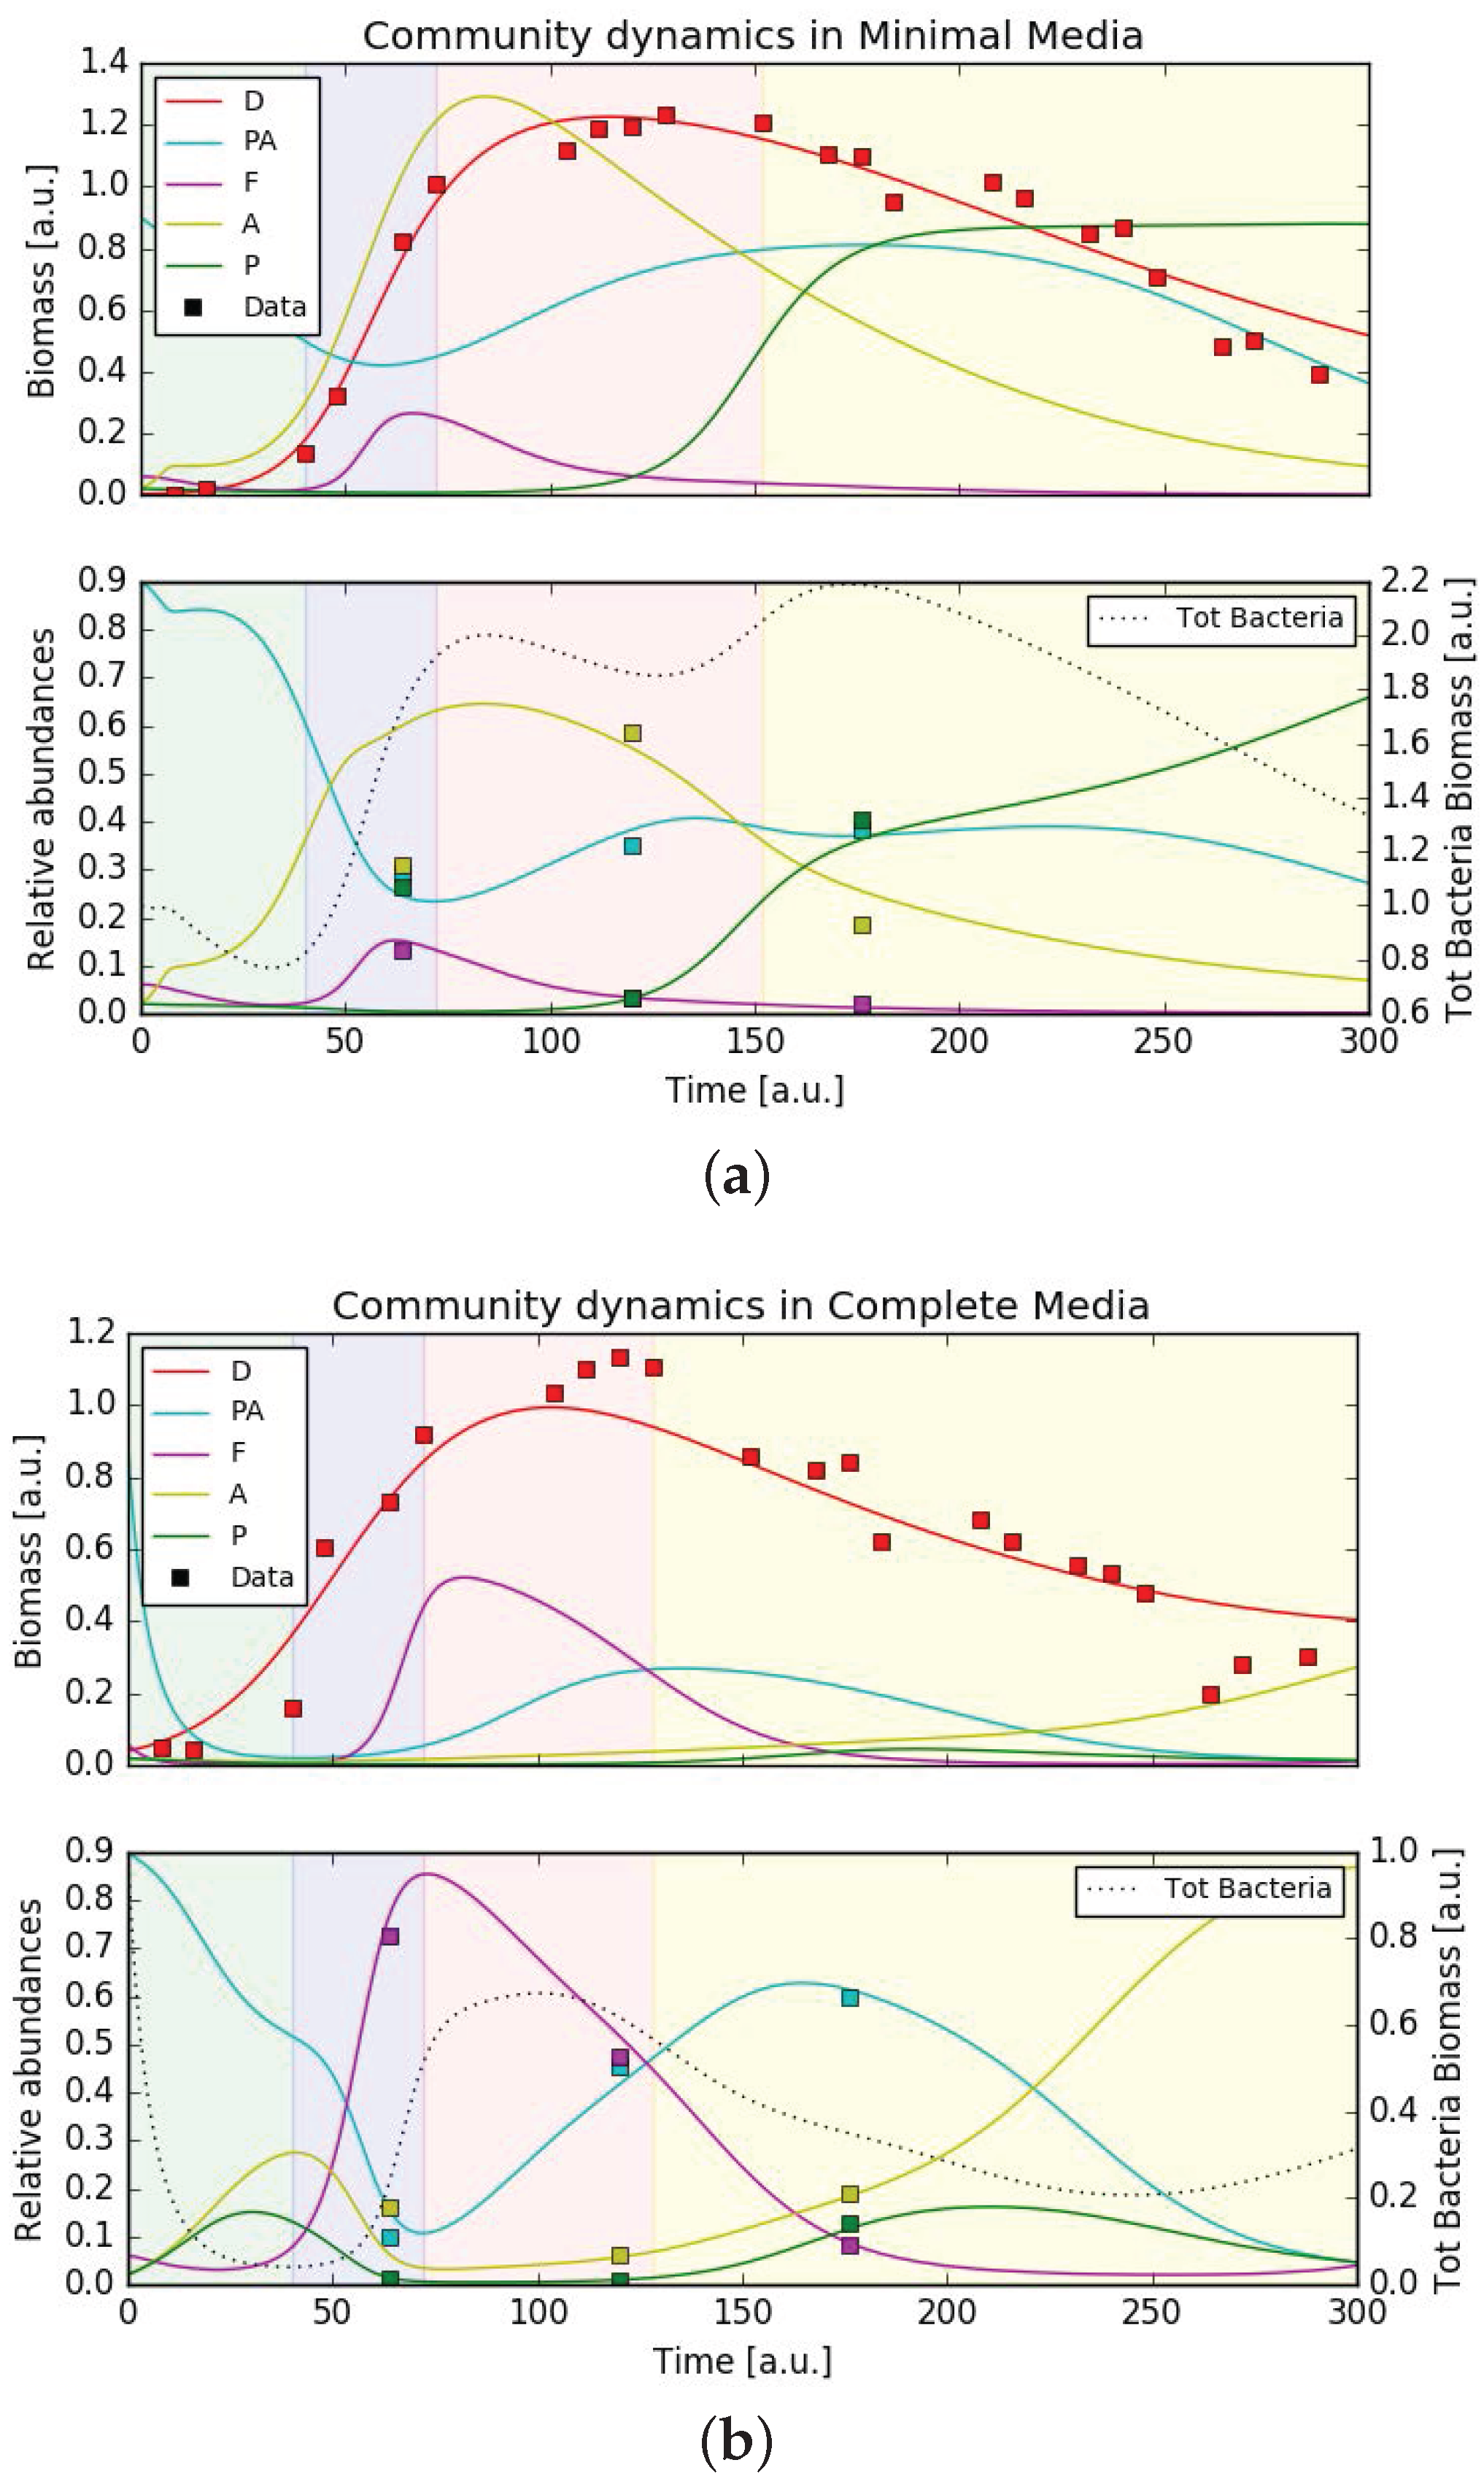
Figure 5.
Reduced community simulation results (lines) and experimental data (squares) for communities of P. tricornutum (D), Pseudoalteromonadaceae (), Flavobacteriaceae (F), Alteromonadaceae (A) and Pseudomonadaceae (P) in complete media conditions. Simulations are run removing from the bacterial community one member: (a) ; (b) F; (c) P; (d) A. The top panel shows the biomass time course (arbitrary units) for the four organisms and the rescaled data points (squares) for the P. tricornutum. The bottom panel shows the variations in relative abundances of the three bacteria (single bacteria biomass/total bacteria biomass) over time and the three sets of data points from the sequencing analysis (the first data point is used as starting condition at time 0). Also shown in the bottom plot (dotted line, right y-axis) is the total bacterial biomass in arbitrary units.

Figure 6.
Reduced community simulation results (lines) and experimental data (squares) for communities of P. tricornutum (D), Pseudoalteromonadaceae (), Flavobacteriaceae (F), Alteromonadaceae (A) and Pseudomonadaceae (P) in minimal media conditions. Simulations are run removing from the bacterial community one member: (a) ; (b) F; (c) P; (d) A. The top panel shows the biomass time course (arbitrary units) for the four organisms and the rescaled data points (squares) for the P. tricornutum. The bottom panel shows the variations in relative abundances of the three bacteria (single bacteria biomass/total bacteria biomass) over time and the three sets of data points from the sequencing analysis (the first data point is used as starting condition at time 0). Also shown in the bottom plot (dotted line, right y-axis) is the total bacterial biomass in arbitrary units.

© 2017 by the authors. Licensee MDPI, Basel, Switzerland. This article is an open access article distributed under the terms and conditions of the Creative Commons Attribution (CC BY) license (http://creativecommons.org/licenses/by/4.0/).
Share and Cite
MDPI and ACS Style
Moejes, F.W.; Succurro, A.; Popa, O.; Maguire, J.; Ebenhöh, O. Dynamics of the Bacterial Community Associated with Phaeodactylum tricornutum Cultures. Processes 2017, 5, 77. https://doi.org/10.3390/pr5040077
AMA Style
Moejes FW, Succurro A, Popa O, Maguire J, Ebenhöh O. Dynamics of the Bacterial Community Associated with Phaeodactylum tricornutum Cultures. Processes. 2017; 5(4):77. https://doi.org/10.3390/pr5040077
Chicago/Turabian StyleMoejes, Fiona Wanjiku, Antonella Succurro, Ovidiu Popa, Julie Maguire, and Oliver Ebenhöh. 2017. "Dynamics of the Bacterial Community Associated with Phaeodactylum tricornutum Cultures" Processes 5, no. 4: 77. https://doi.org/10.3390/pr5040077
Note that from the first issue of 2016, this journal uses article numbers instead of page numbers. See further details here.