1. Introduction
Urban water bodies, in particular urban lakes, provide essential ecosystem services. Many urban lakes retain storm water in order to prevent floods but also to reduce the associated pollutant load [
1,
2]. They are also essential recreational areas and important spots of biodiversity in densely populated regions and their role on the hydrological cycle and on the fate of pollutants in urban watersheds must be better understood [
3].
Most urban lakes are small and shallow. They react rapidly to the external hydrological and meteorological forcing and will be particularly affected by climate change. Conversely, they also impact the local urban weather. As stated in the Millennium Development Goals of the United Nations [
4] and the European Union Water Framework Directive [
5], the worldwide concern increases for the protection and management of urban lakes. Since ecosystem services like drinking water production or recreation can be hindered by contaminants or potentially toxic species, efficient monitoring systems are increasingly required for the management of lake ecosystems and freshwaters in general.
High nutrient loads from anthropic activities boost the production of phytoplankton biomass [
3]. Associated with global warming, that increase the risk of toxic cyanobacteria blooms, causing public sanitary problems [
6,
7]. More specifically, for bathing areas and drinking water resources, standards and guidelines provide cyanobacteria biomass and toxins threshold levels. In the European Union, the bathing water directive 2006-7 EC [
5] requires that cyanobacteria biomass is monitored in order to enable the timely identification of health risks. When a cyanobacterial proliferation occurs, actions, including information to the public, have to be immediately taken. In France, in the bathing areas, a circular by the Ministry of Health recommends regular monitoring with several levels of intervention and information to the public. Prohibition of bathing is recommended when the concentration of the toxin microcystin LR exceeds 25 μg/L. The prohibition of swimming and water sports is recommended in case of cyanobacteria scum or foam. These guidelines are translated into monitoring schemes based on cyanobacteria cell numbers [
8]. As the delay between water sampling and laboratory analysis results can be longer than one week, faster and more efficient field assessment is urgently required, at least as an early warning method.
Monitoring and forecasting the phytoplankton dynamics in various temporal and spatial scales are crucial aspects in aquatic ecosystem management [
9]. Changes occur at various time scales, chemical reactions within seconds, phytoplankton day-night growth cycles, the seasonal population density variations and interannual variability of algae succession. Such dynamics are also driven by other factors such as the mixing of the water column and the light and nutrient availability [
10]. Key research issues currently conducted on urban lakes are related to the following topics: (1) the impact of meteorological variables and climate change on lake functioning and the role of lakes in the local climate; (2) the interactions between ecological functioning, nutrient cycles and the fate of the micropollutants; (3) the control of the pollutant loading from watershed runoff and (4) the role of urban lakes in ecological diversity and continuity [
2,
11].
On all these issues, the scarcity of available data limits the knowledge and the transfer of research outcomes to decision makers. During the last decade, the availability of a wide range of sensors made it possible to collect high-frequency measurements of different variables related to the physical and biogeochemical functioning of the water bodies. Most of these sensors are deployed in marine ecosystems [
12]. Many studies are aimed at developing new types of sensors [
13], and new design of sensor networks [
14]. These studies are aimed at minimizing the energy requirement and their cost [
12,
15]. Nevertheless, a limited number of monitoring systems has been developed for measuring the cyanobacteria specific photosynthetic pigment, phycocyanin, as well as for designing warning systems for preventing public health risks from cyanobacteria blooms. In this context, the aim of this study is to select existing wireless sensors to develop a platform for high-frequency monitoring of
Cyanobacterial biomass in urban water bodies. Combined with real-time data analysis and modelling techniques, it will improve the management of recreational activities in urban lakes.
Therefore, the main objectives of the paper are to (i) present the development of a full-scale experimental site for high-frequency monitoring of cyanobacteria biomass in an urban lake; (ii) describe a data transfer platform in the context of real-time management of harmful blooms; (iii) illustrate some relevant observations of different physical and ecological variables of the lake, and (iv) show how the real-time data can be used for supporting the decision-making by the stakeholders.
2. Materials and Methods
In this section, we first present the study site, followed by the descriptions of the monitoring system, measuring equipment, and real-time data transfer platform.
2.1. Study Site
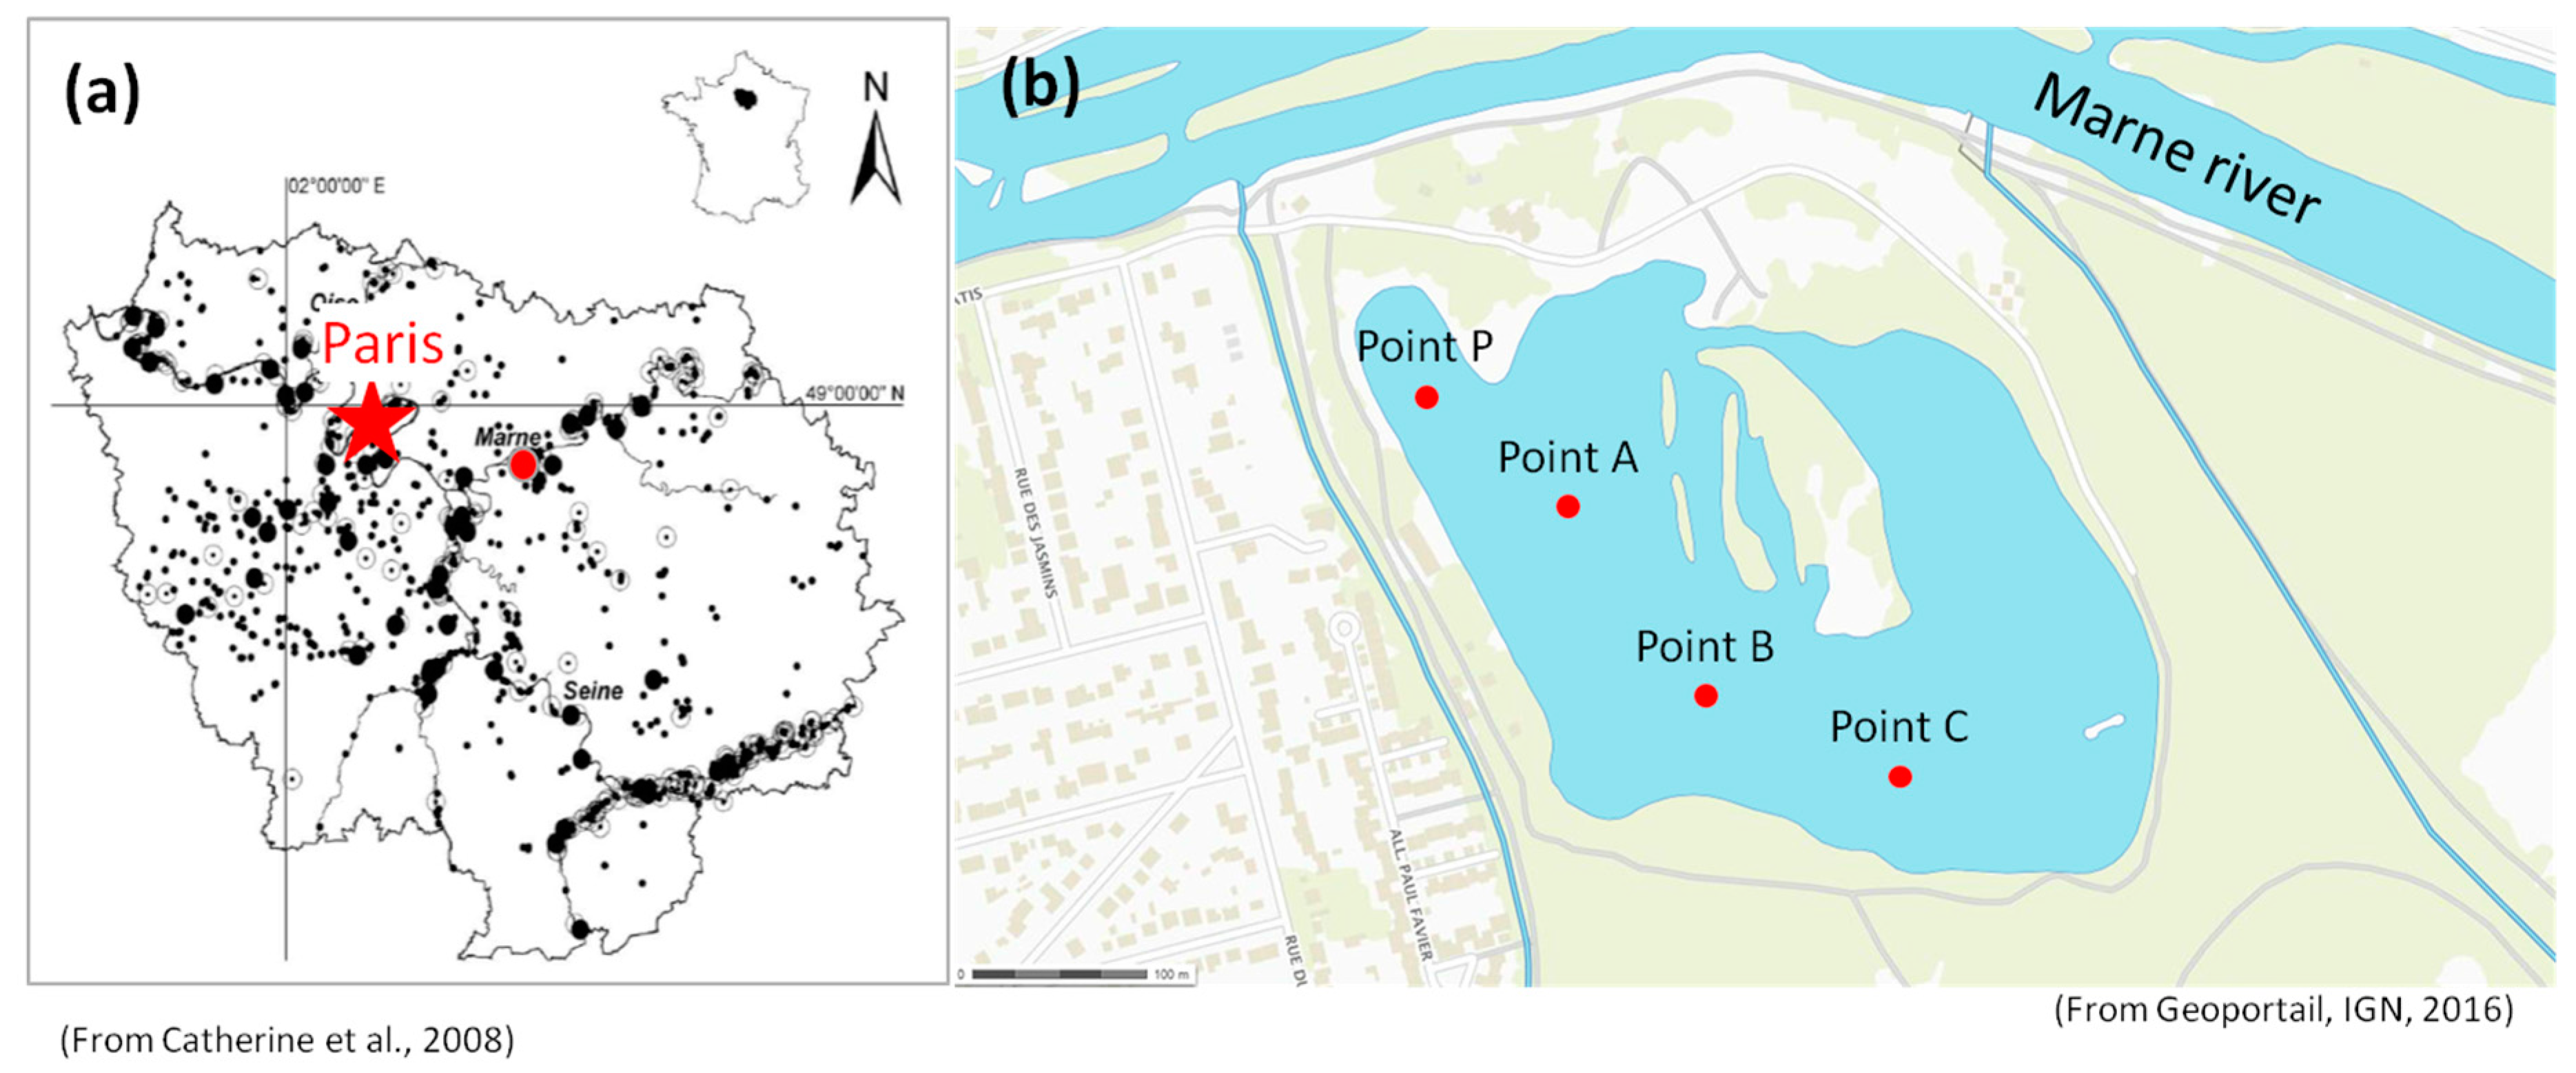
Lake Champs-sur-Marne (48°51′50″ N, 2°35′53″ E) is located in the eastern suburb of Paris (Seine Saint Denis county, France). It is a sand-pit lake fed by alluvial ground water from the nearby Marne River (
Figure 1). The small (10.3 ha) and shallow (mean depth 2.4 m) lake is used as a recreational area with diverse outdoor activities such as bathing, kayaking, sailing, etc. Every summer, this area receives more than 5000 children from the adjacent urban communities.
Nevertheless, because of the repeatedly occurring toxic cyanobacterial blooms, bathing in Lake Champs-sur-Marne has been banned several times, especially during the summer. In order to have a real-time management of the potential health risks, an automatic high-frequency monitoring system has been implemented in the framework of the ANR (French Research Agency) OSS-Cyano project.
2.2. High-Frequency Monitoring System
Since the physical-chemical and the biological conditions of a small aquatic ecosystem can vary rapidly over time, the variations of such variables for a small shallow urban lake cannot be well monitored by traditional low frequency measurement approaches (weekly or monthly). In this study, high frequency measurements (every 5 min) of physical-chemical variables (water temperature, conductivity, pH, dissolved oxygen), chlorophyll-a fluorescence, a proxy of total phytoplankton biomass, and phycocyanin fluorescence, a proxy of cyanobacteria biomass, are performed at four different points (A, B, C and P in
Figure 1).
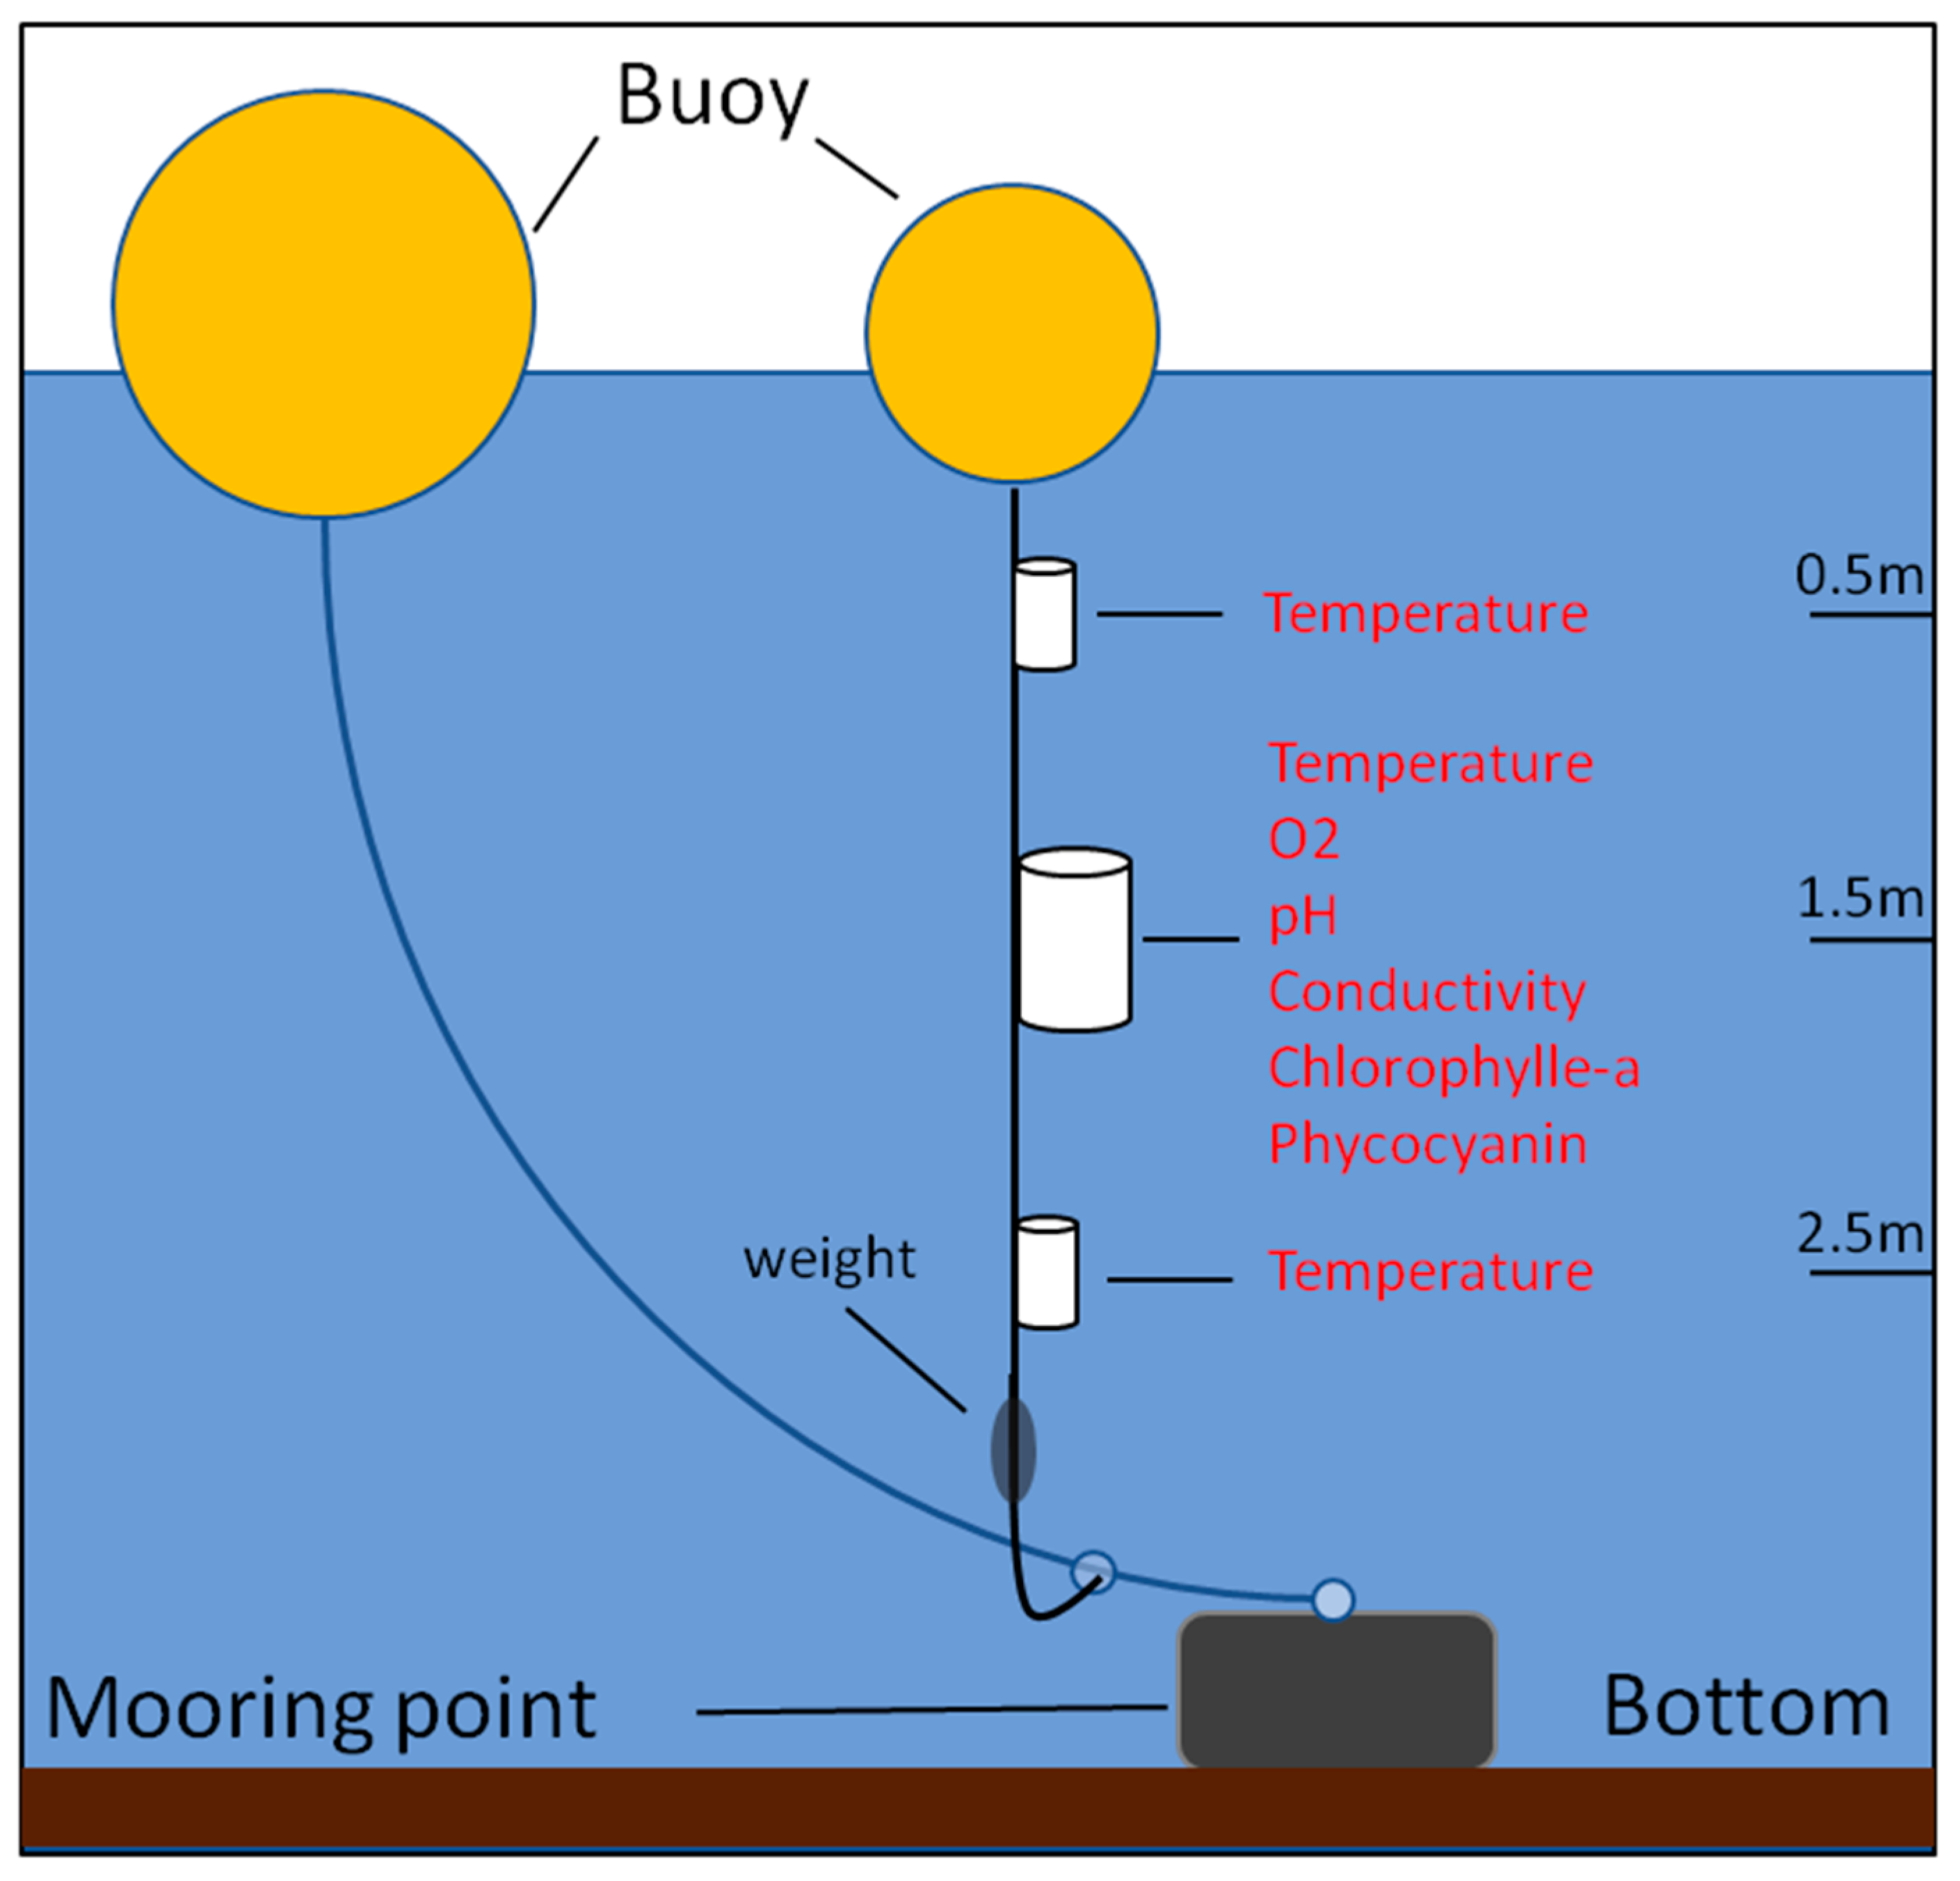
At each point, the continuous monitoring is performed at three depths using a set of different underwater sensors. The set of sensors is attached on a rope, which is fixed to a buoy at the water surface and stretched by a weight on the bottom side. The rope supporting the sensors is then connected to a second rope with a slipknot, allowing the sensors to stay at the same depth, while the slipknot can move according to currents and water level variations. The second rope is moored to the bottom by a heavy weight and fastened to another buoy at the water surface. Two thermal sensors are installed at 0.5 m and 2.5 m depths, whereas a multi-parameter sensor is located at 1.5 m depth for measuring water temperature, pH, conductivity, dissolved oxygen (optode), chlorophyll-a and phycocyanin (fluorescence). The in-situ monitoring design is presented in
Figure 2.
2.3. Measuring Equipments
At each monitoring point, four physical-chemical variables, including temperature, conductivity, pH, dissolved oxygen; and two ecological variables, such as chlorophyll-a and phycocyanin are measured. The characteristics of the measuring equipment are illustrated in
Table 1.
2.3.1. Thermal Sensor
The thermal sensor SP2T10 (nke INSTRUMENT®) is used for measuring the water pressure and temperature at 0.5 m and 2.5 m depths. The measuring range spreads from −5 to 35 °C, with a precision of 0.02 °C, and a resolution of 0.05 °C.
2.3.2. Multi-Parameter Sensors
At 1.5 m depth, water temperature, conductivity, dissolved oxygen concentration (DO), pH and chlorophyll-a fluorescence are measured using the MPx multi-parameter sensor (nke INSTRUMENT
®) at points A, C, P and using the SAMBAT multi-parameter sensor (nke INSTRUMENT
®) at point B. The later also measured phycocyanin fluorescence, aproxy of cyanobacteria concentration. Besides, high-frequency time-series present many pitfalls. The measurements are frequently of uppermost importance when the values of the variables are extreme, for example high concentrations of chlorophyll-a or low concentration of oxygen. Therefore, the sensors are frequently at the limit of their measuring range and a trade-off is required between sensor accuracy and concentration range. In this respect, the sensor types, monitoring points and depths, measuring ranges, sensors’ resolution and measuring precision for each monitored environmental variable are described in
Table 1.
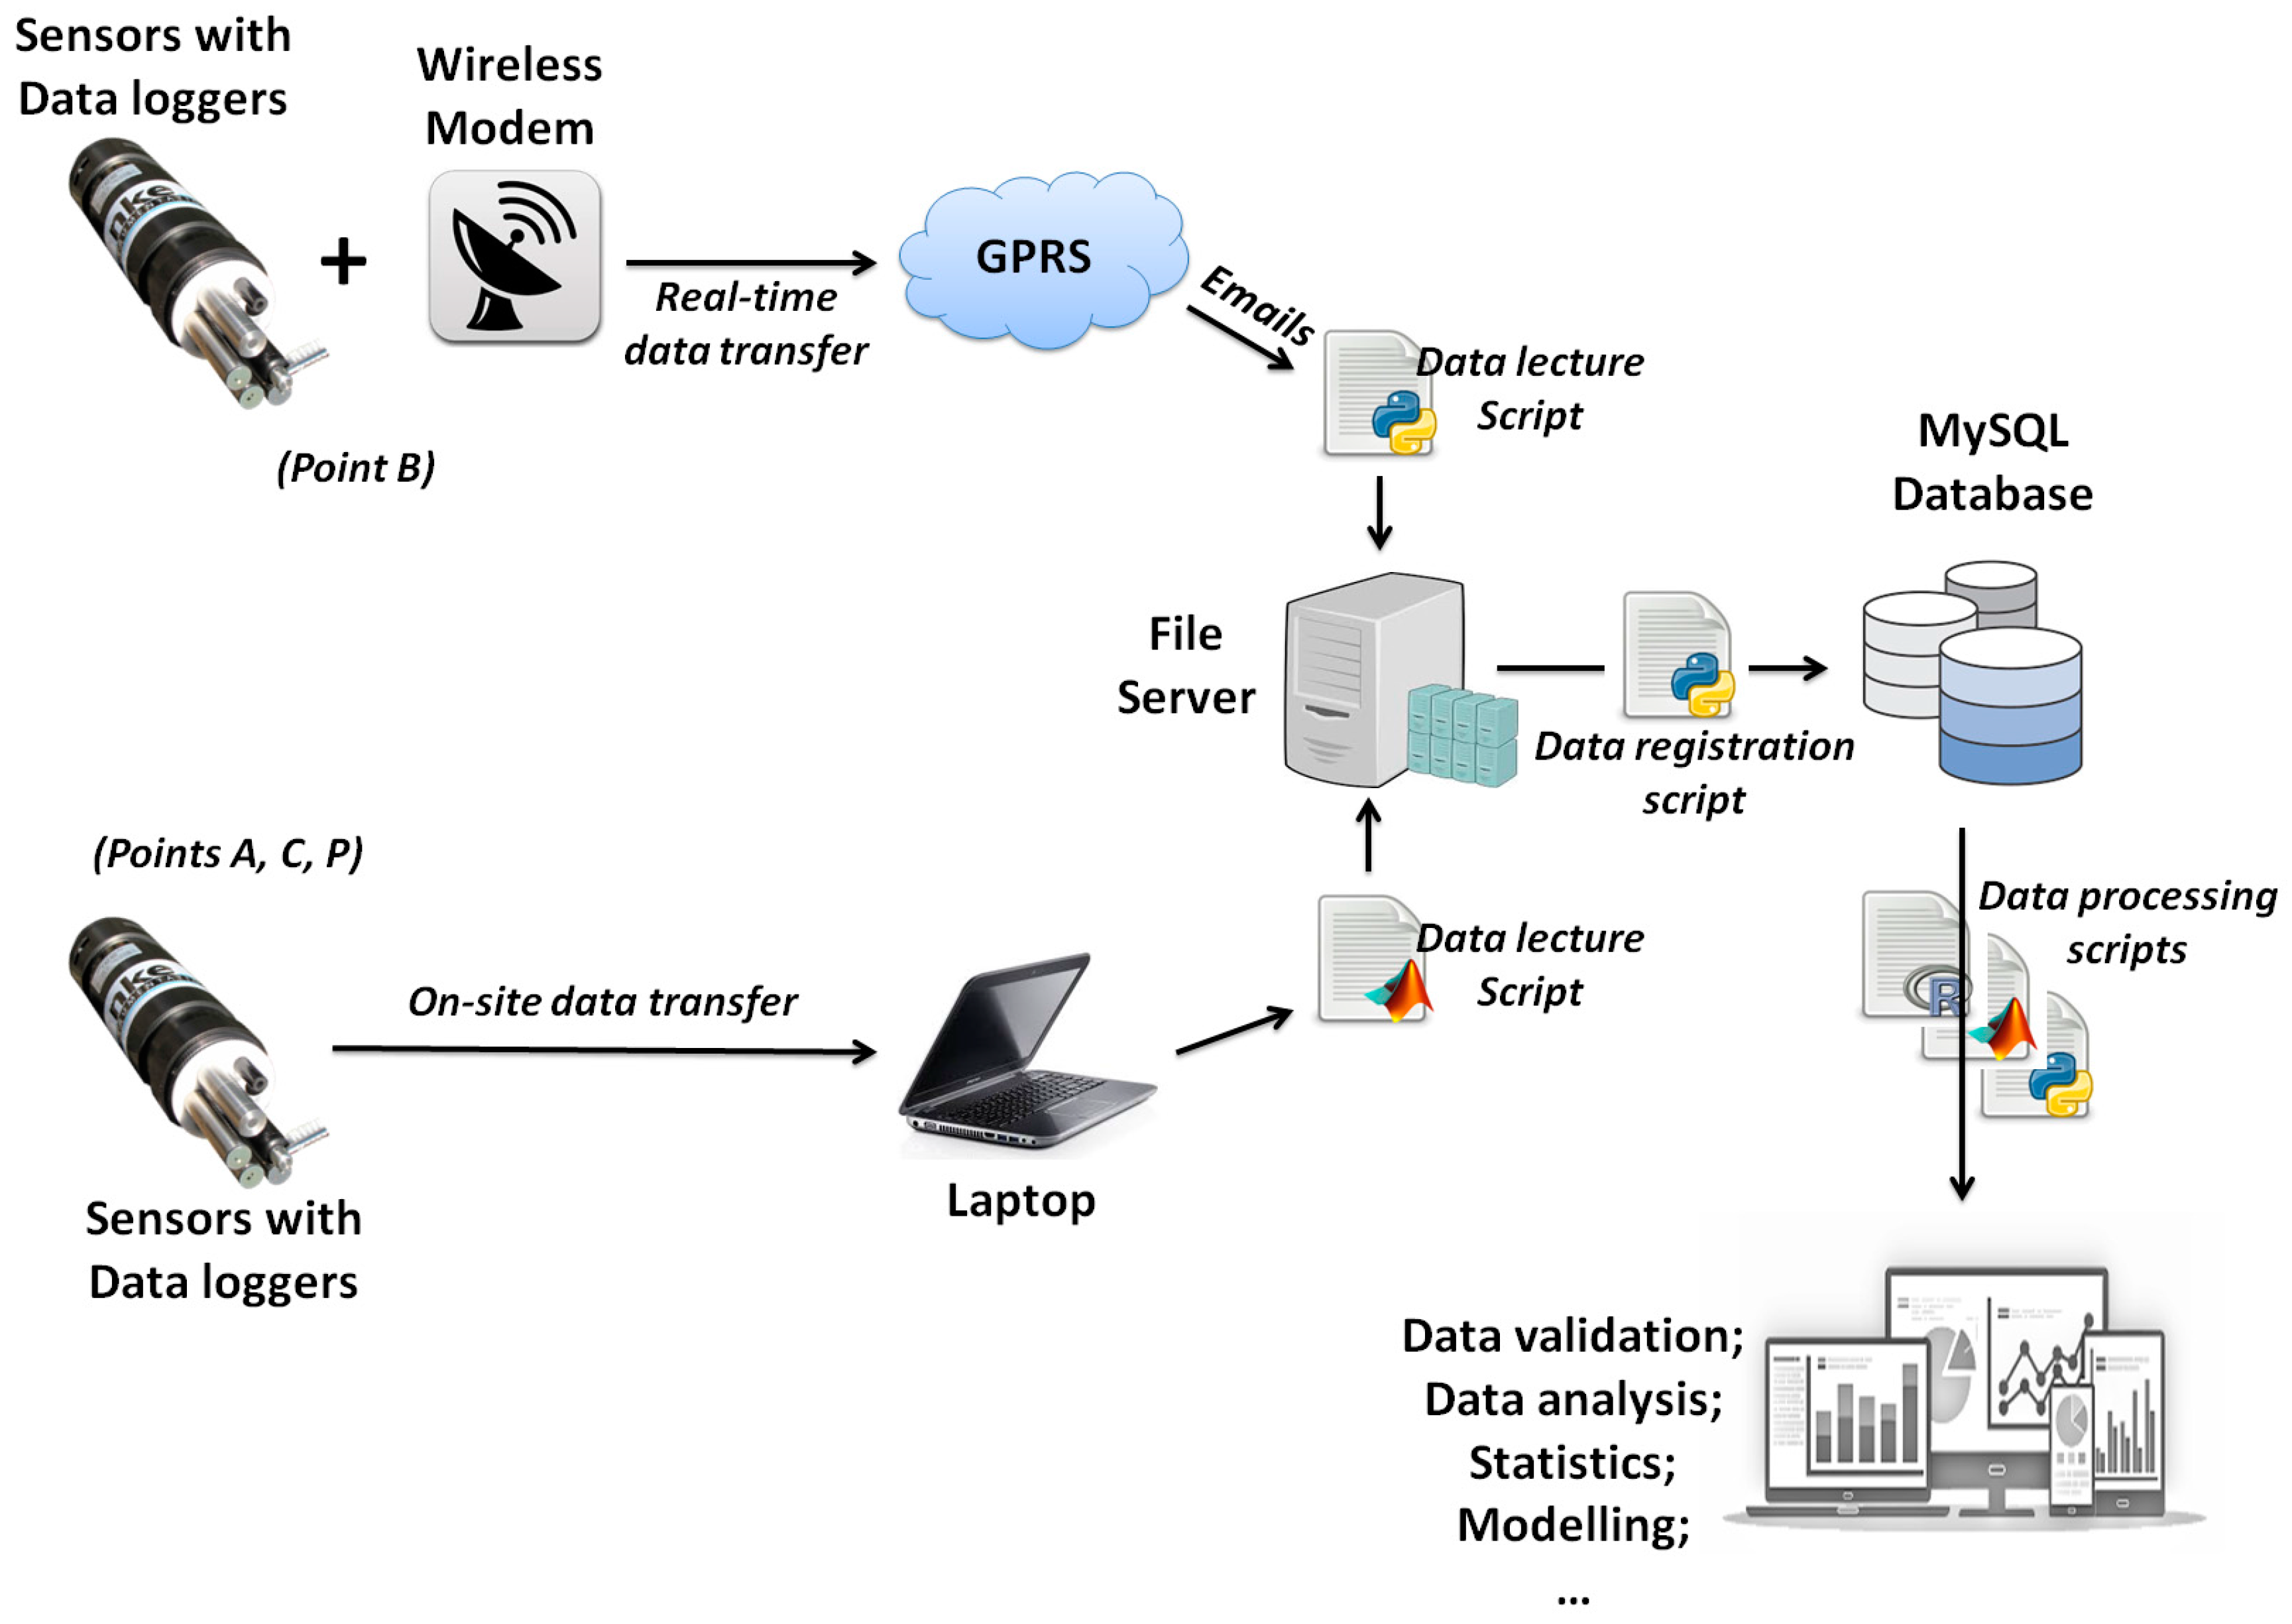
2.4. Real-Time Data Transfer Platform
As presented in the above sections, on-site monitoring is conducted on four different points (A, B, C, P). Measurements are first recorded in on-site data loggers, and then transferred via two different schemes, such as (i) on-site data transfer and (ii) wireless real-time data transfer.
The measurements at points A, C and P (see
Figure 1) are collected by researchers or technicians each month (on-site data transfer). Parameter setting and reading of a multiparameter probe are carried out via radio communication, using a radio data pencil connected to a PC-type computer via USB link. The radio has a frequency of 868.3 MHz with the transmission power of 5 mW. The radio data pencil uses the radio address of the data logger (unique address set by at the nke factory) to communicate with an automaton according to the MODBUS
® protocol. After the on-site data collection, a copy of this data can be sent to the local file server by using a Matlab data reading script.
As for the point B (see
Figure 1) of the lake, the measured data are transferred via a wireless modem and the GPRS (General Packet Radio Service) internet (M2M subscription of 5 Mo/month). The software WINMEMO II designed by nke-instrumentation
® is used for configuring the sensor and data logger. Received data can be automatically registered in our local server (Real-time data transfer). Since the real-time data are transmitted as emails, a Python script records the data with a predefined time schedule. Information recorded in the local server are then registered in a MySQL database by executing a Python script.
Monitored data stored in the MySQL database are now in a standardized format, which can be used for further data analysis with different data processing scripts. Validation of the continuous measurements of different physical-chemical and biological variables is a prerequisite for successful and reliable data analysis. Considering the device maintenance schedules, we firstly identify the reliable observation periods, the outliers of the measurements are then eliminated by different statistical approaches. Using these high-frequency measurements, different machine-learning approaches can be applied to recognize correlations between different environmental variables. These data can be also used for the calibration and validation of 1D and 3D lake models, in order to improve the understanding of ecological processes, as well as to develop management tools for urban lakes. The schemes of the data transfer platform are illustrated in
Figure 3.
3. Results
Taking the measurements at point B as an example, time-series of water temperature, conductivity, pH, dissolved oxygen, chlorophyll-a and phycocyanin concentrations during a period of three months (8 August–31 October 2016) are presented in this section.
3.1. Thermal Stratification Periods
Thermal stratification of the water column is one of the driving processes of phytoplankton growths in lakes. Therefore, the thermal regime of the lake during the studied period should be first assessed.
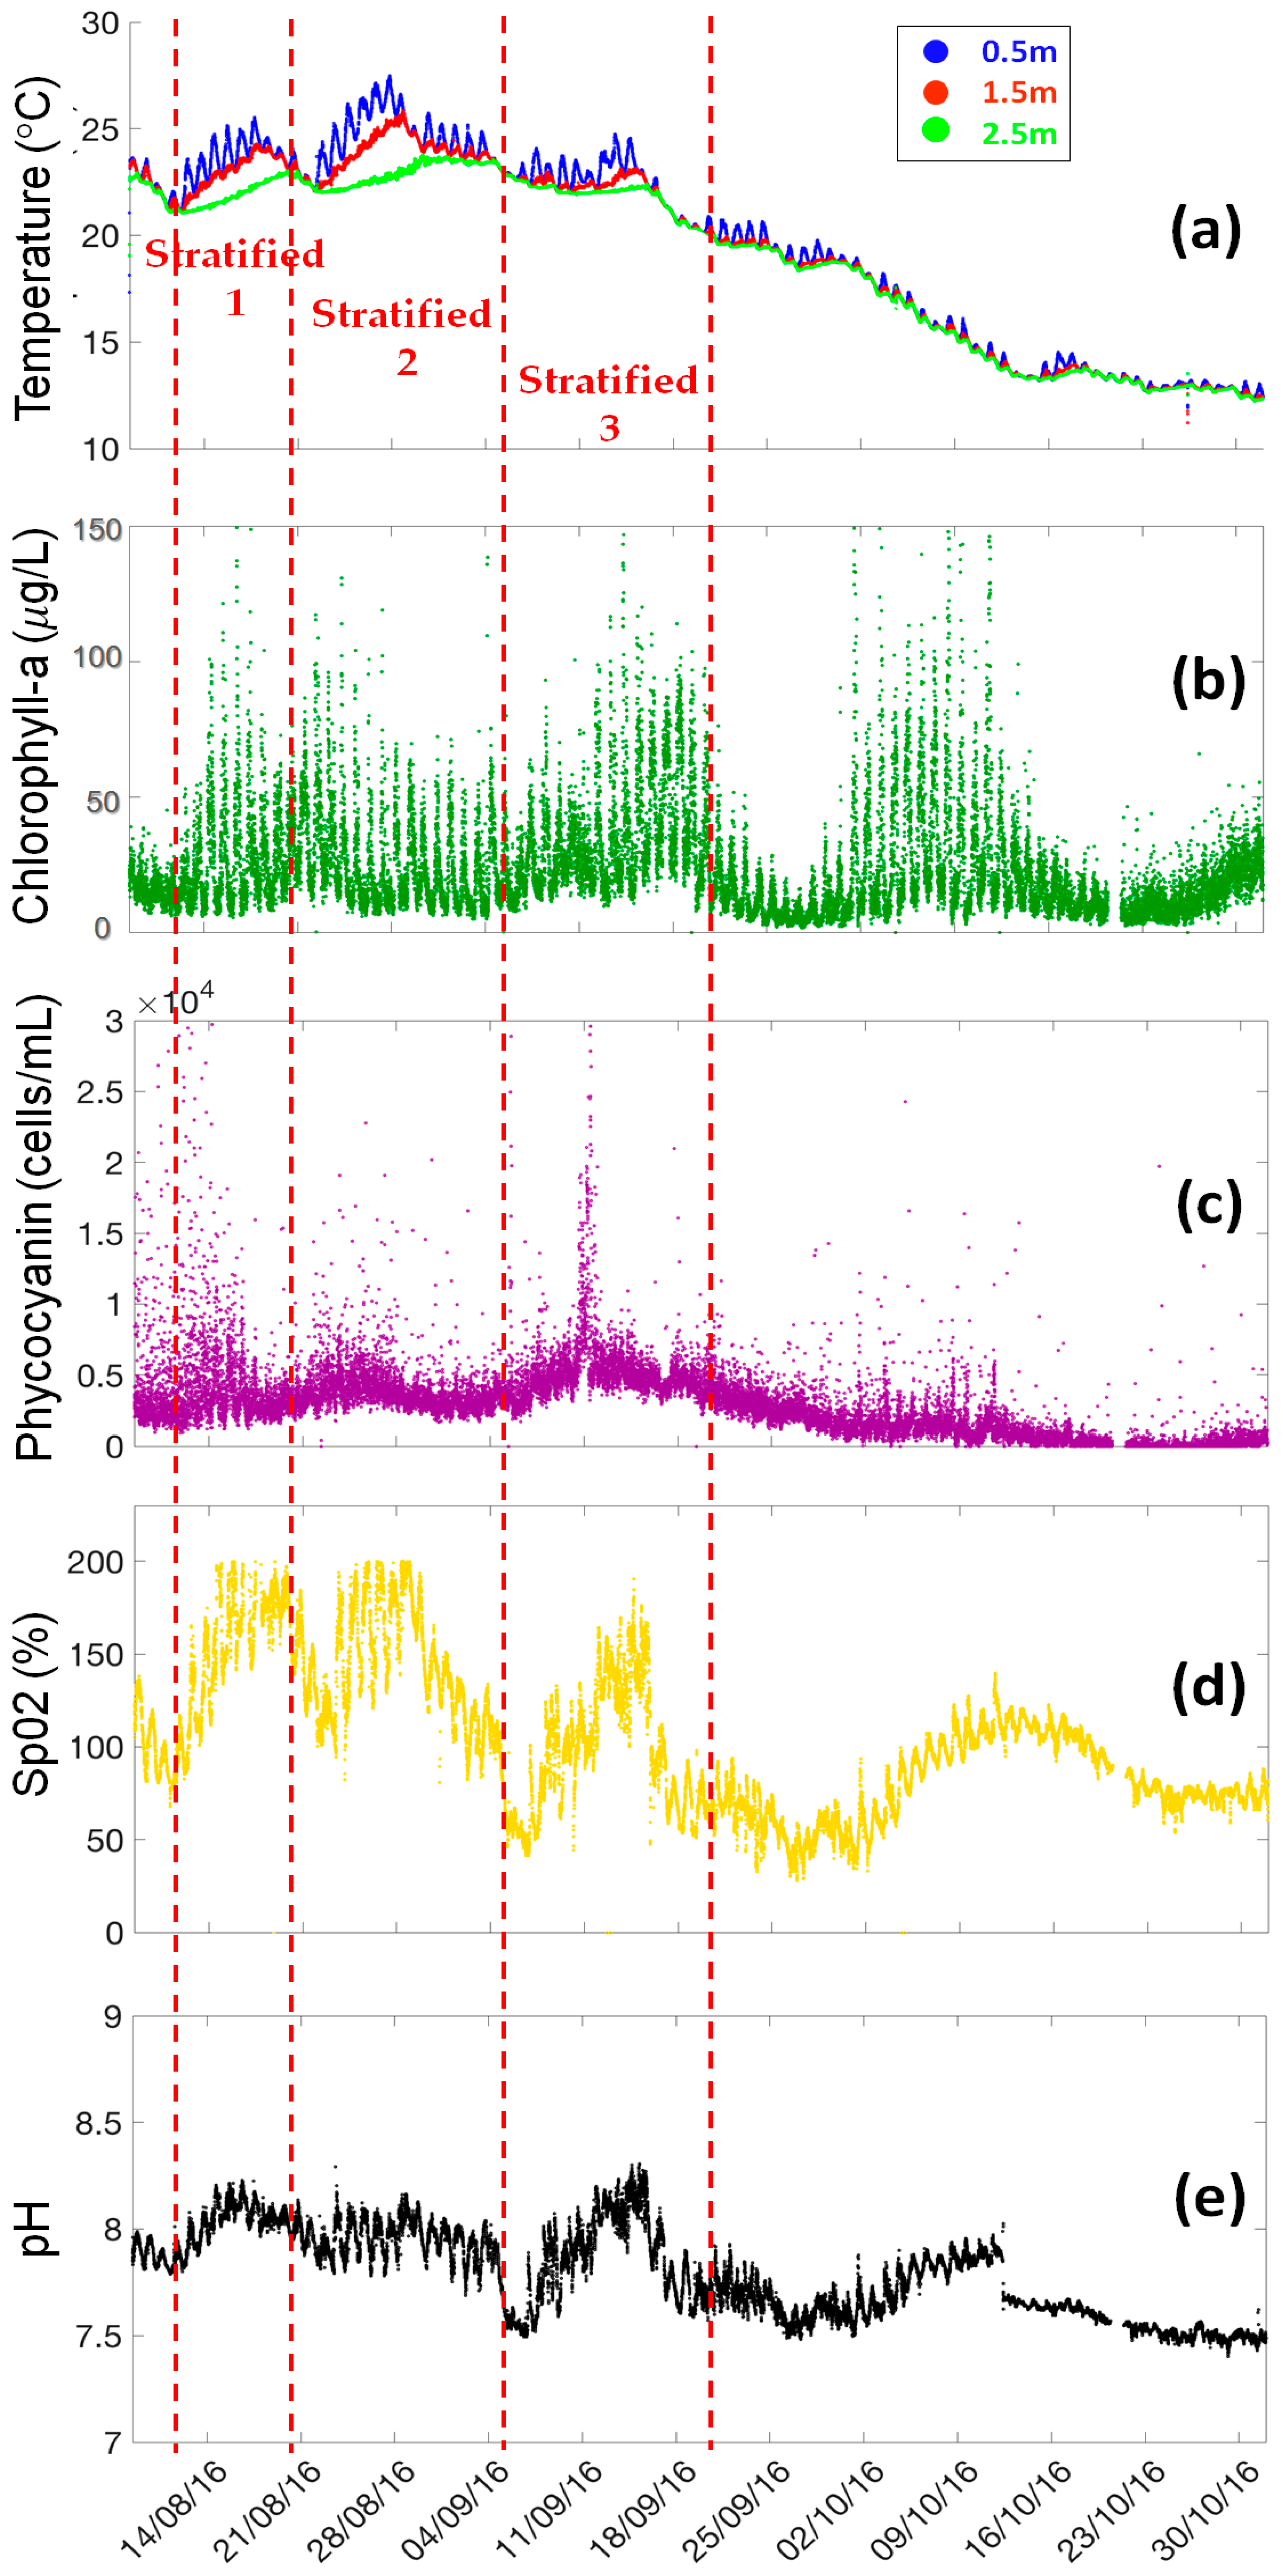
Variations of water temperature at three different depths (0.5 m, 1.5 m and 2.5 m) are shown in
Figure 4a. In general, the water temperature ranges from 21.2 °C to 27.4 °C during 8th August and mid-September, then progressively decreases from 21.2 °C to 12.2 °C until the end of October. The lake is completely stratified during 3 periods from mid-August to mid-September, (12–20 August 2016; 22 August–4 September 2016; 5–17 September 2016), interrupted by three short mixing episodes (21–22 August 2016, 4–6 September 2016 and 16–18 September 2016). The difference between the surface and bottom water temperature reaches 4.8 °C at the end of August.
During the rest of the presented period, a daily stratification cycle can be observed. The sub-surface water temperature (0.5 m depth) begins to increase at about 6:00 a.m., achieving the daily maximum at around 16:00 p.m., and then decreases. Around 23:00, the water temperature at the sub-surface water and at 1.5 m and 2.5 m depths are the same.
3.2. Time-Series of Chlorophyll-a, Phycocyanin, Dissolved Oxygen and pH
The concentration of chlorophyll-a varies from 5 µg/L to 150 µg/L (
Figure 4b). The daily cycle of chlorophyll-a can be clearly observed, where the chlorophyll-a concentrations begins to increase at around 3:00 a.m., reaches a peak at approximately 7:00 a.m. and then decreases until 21:00 p.m. Since the chlorophyll-a fluorescence can used as a proxy of phytoplankton biomass, four periods of high phytoplankton concentration can be identified based on the maximum fluorescence observations (13–19 August 2016, 20–28 August 2016, 11–20 September 2016, 30 September–14 October 2016). Among them, three periods correspond with the water stratification episodes. On the contrary, the last phytoplankton peak (29 September–19 October 2016) appeared during a cooling mixing episode, when the water temperature decreased from 20 °C to 12 °C.
The dynamics of phycocyanin (PC) is shown in
Figure 4c, the concentration of PC varies from 0 to 3 × 10
4 cells/mL (0–100 µg PC/L). Phycocyanin fluorescence is considered as a proxy of cyanobacteria biomass. The results show three periods of cyanobacteria blooms, such as 8–15 August 2016, 18 August–1 September 2016, and 1 September–9 October 2016. Excepting these bloom periods, the phycocyanin concentration remains low, close to the detection level of the sensor (600 cells/mL). Comparing the concentration peaks of chlorophyll-a and phycocyanin, it can be noticed that the periods of cyanobacteria blooms correspond with the phytoplankton development during the lake stratification periods (8 August–29 September 2016). However, during the cooling mixed period (29 September–19 October 2016), the high concentration of chlorophyll-a is mainly caused by the other phytoplankton species, such as diatoms.
The dissolved oxygen shows four over-saturation periods (SpO2 > 100%) (
Figure 4d), including the 11–22 August 2016, 22 August–4 September 2016, 4–17 September 2016, and 8–19 October 2016.
pH dynamics is presented in
Figure 4e pH ranges from 7.5 to 8.3. Daily cycle of pH can also be observed. Moreover, periodic variations of pH correspond with the variations of dissolved oxygen. Besides, a sharp descent of pH from 7.86 to 7.67 is recorded on 12 October 2016 following a field maintenance campaign. pH sensors should be checked and validated.
3.3. Which Variable Can be Used as an Indicator of Phytoplankton and Cyanobacteria Blooms?
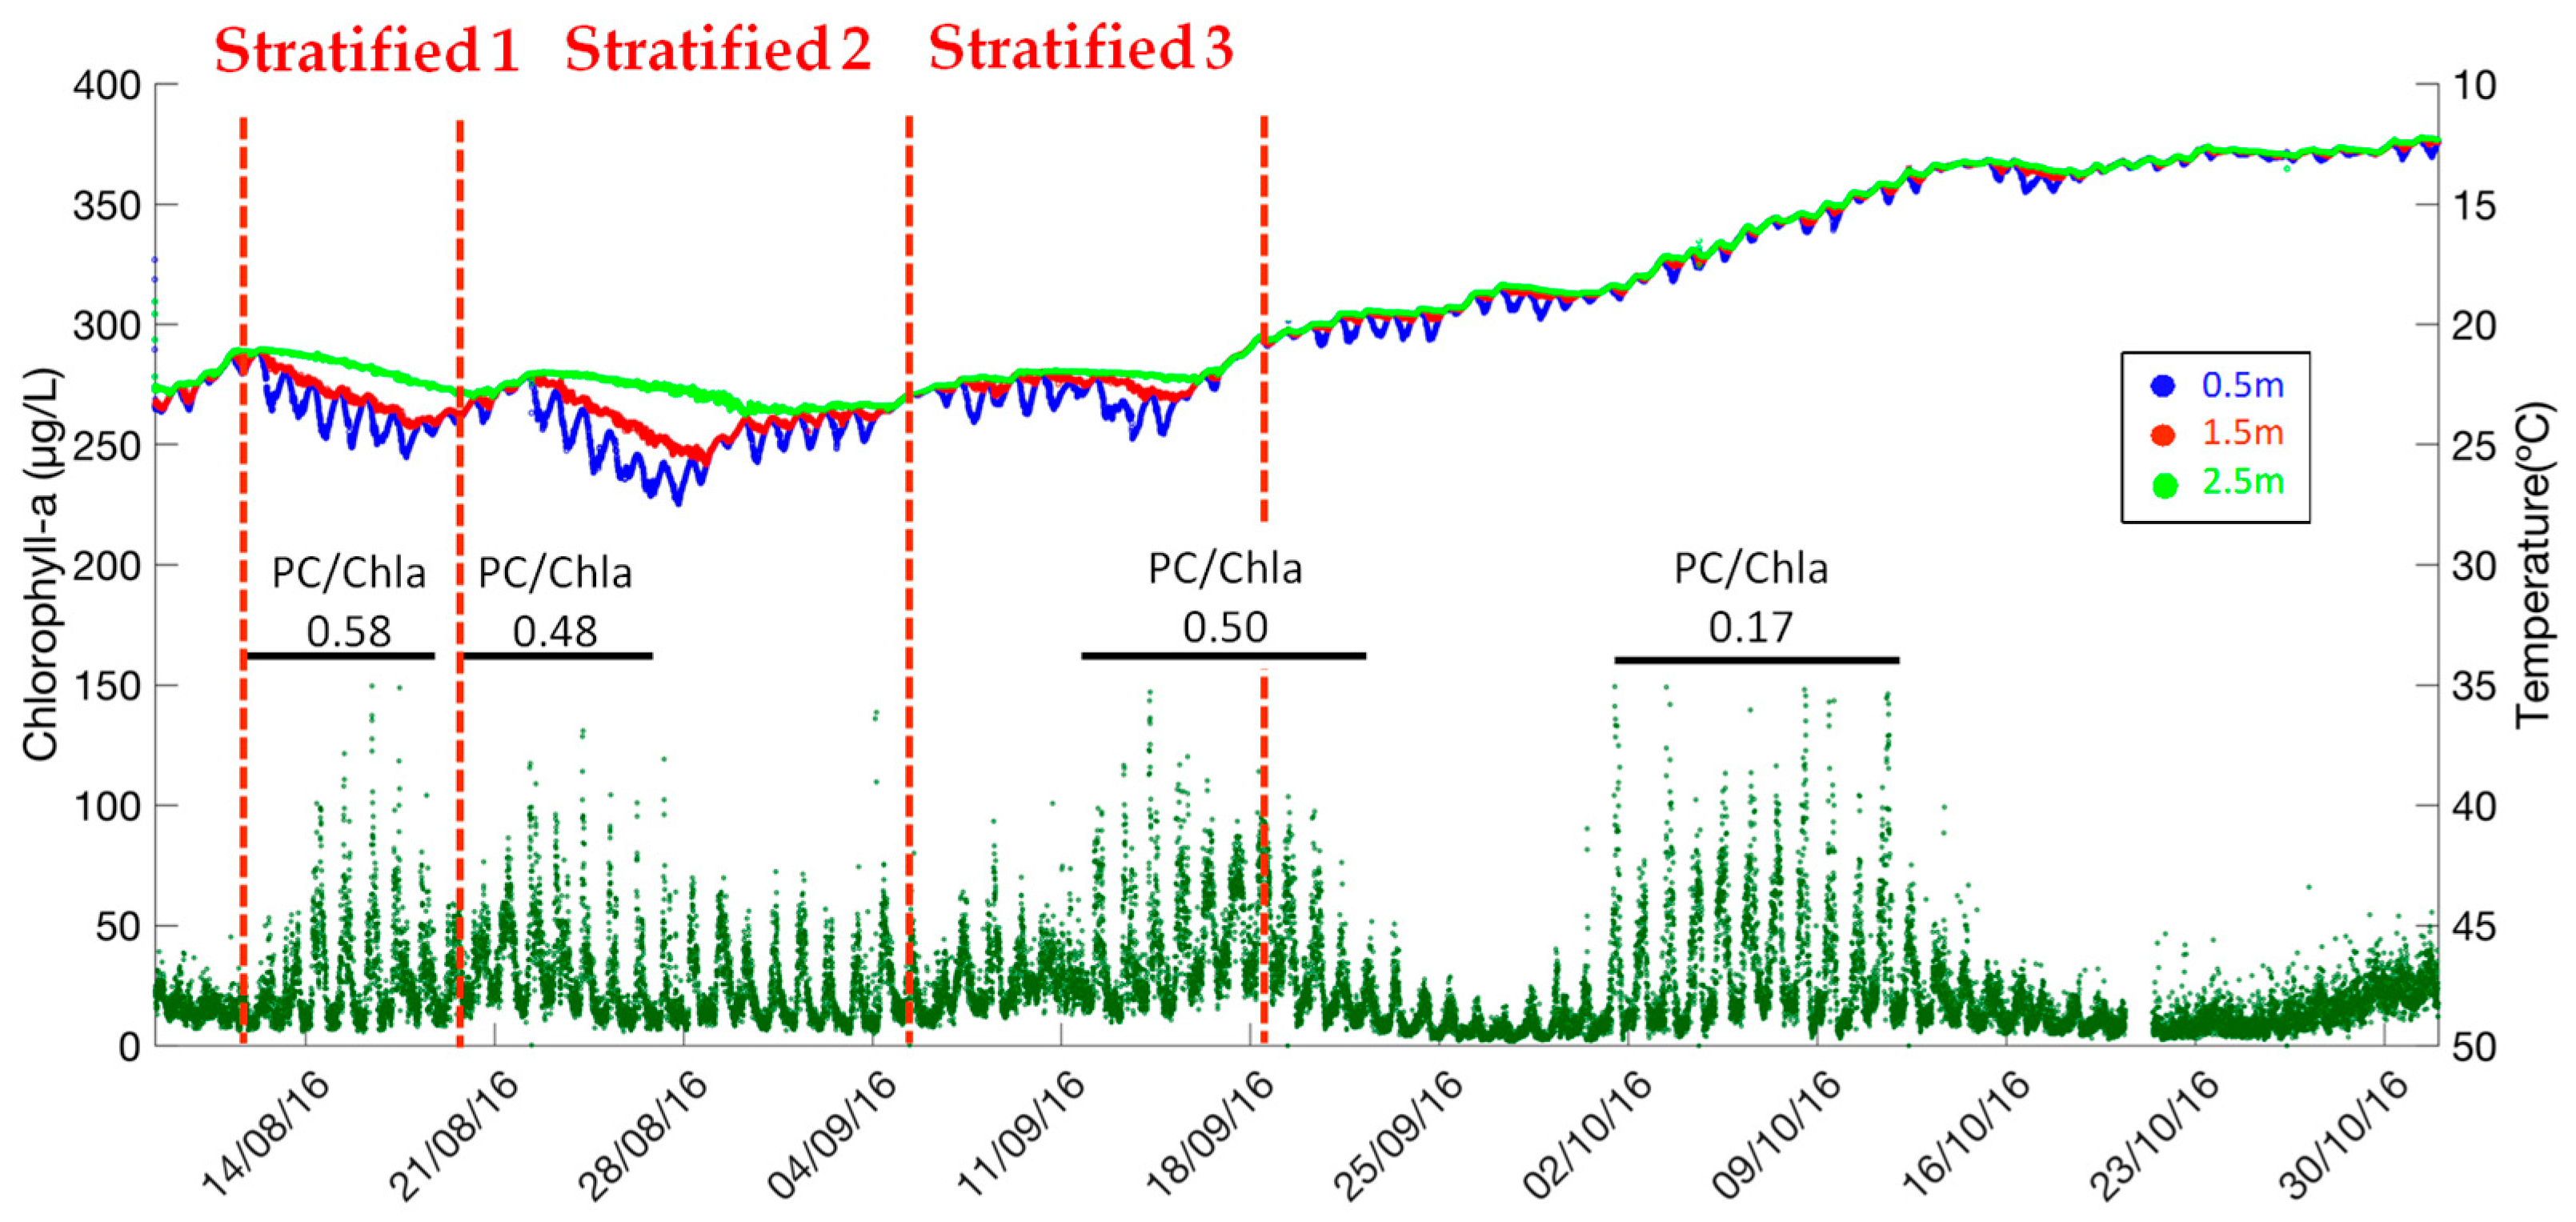
Thermal regime of the lake such as stratification and mixing patterns play an important role in phytoplankton development. A warm water temperature usually exceeding 20 °C and a stratified water column can favor phytoplankton blooms [
6,
7]. In this context, the water temperature and chlorophyll-a dynamics are compared in
Figure 5. Considering the four periods of high phytoplankton concentrations as presented in the above sections, three periods fit the favorable thermal conditions (11–19 August 2016, 19–29 August 2016, 5–26 September 2016), while the period of 29 September–19 October 2016 corresponded with a cooling mixing episode, when the water temperature decreased from 20 °C to 12 °C. This result indicates that the phytoplankton growth is not only driven by water temperature and by thermal stratification. Other environmental factors such as light and nutrient availability [
11] can also trigger phytoplankton blooms. Future studies should be aimed at better disentangling these environmental factors. Phytoplankton photosynthesis uptakes dissolved carbon dioxide (CO
2) and produces dissolved oxygen, causing the increase of pH values and dissolved oxygen concentration. The dissolved oxygen and chlorophyll-a dynamics are compared in
Figure 6. The variation of dissolved oxygen corresponds with the phytoplankton growth cycles. However, the dissolved oxygen (DO) measured during the phytoplankton peak observed during the cooling mixing period (29 September–19 October 2016) is significantly lower than DO concentrations measured during the previous phytoplankton peak periods. These findings would hardly be observed with traditional monitoring approaches (weekly, monthly sampling).
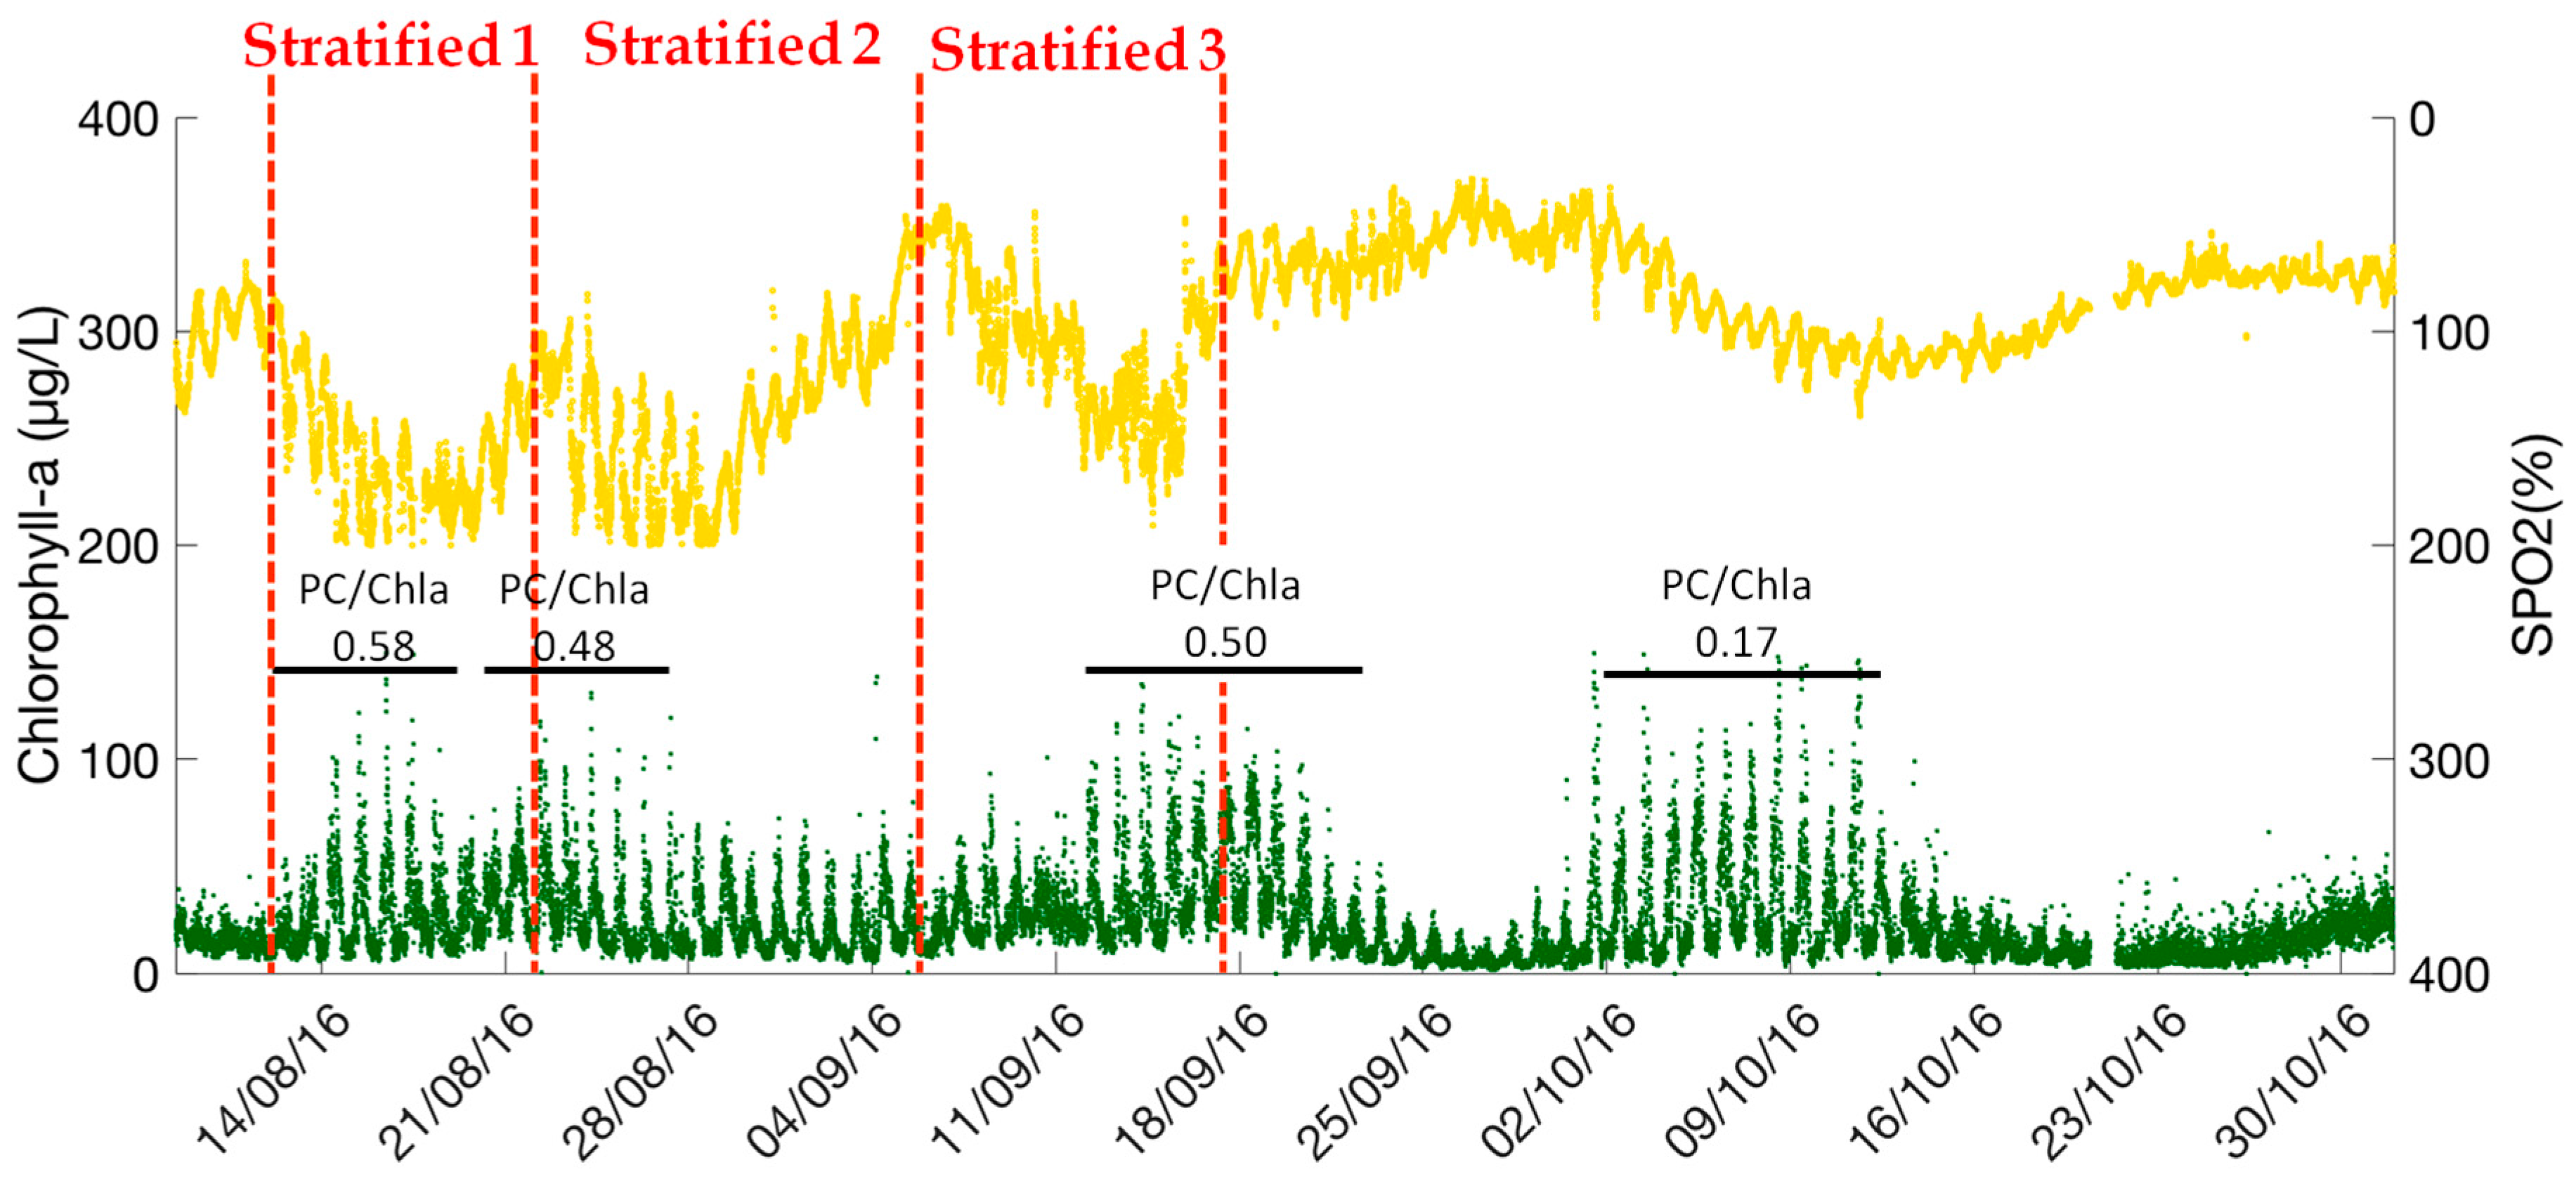
Chlorophyll-a fluorescence is used as a proxy of phytoplankton biomass, while phycocyanin fluorescence is described as a proxy of
Cyanobacterial biomass in freshwaters [
16]. The average ratio of phycocyanin to chlorophyll-a (µg chl-a/L/µg PC/L) is calculated for each phytoplankton bloom period (11–19 August 2016, 19–29 August 2016, 10–24 September 2016 and 29 September–17 October 2016) (
Figure 5 and
Figure 6). Similar values of PC/Chl-a ratio can be identified (0.58, 0.48, 0.50) for the phytoplankton blooms during warm periods when the water temperature was higher than 20 °C, (11–19 August 2016, 19–29 August 2016, 10–24 September 2016). On the contrary, this ratio is quite lower (0.17) for the phytoplankton bloom during the cooling mixing period (29 September–19 October 2016). A shift of the phytoplankton assemblage has probably occurred. Accordingly, the physical-chemical variables such as water temperature, dissolved oxygen, and pH alone cannot be considered as reliable indicators for the cyanobacteria blooms.
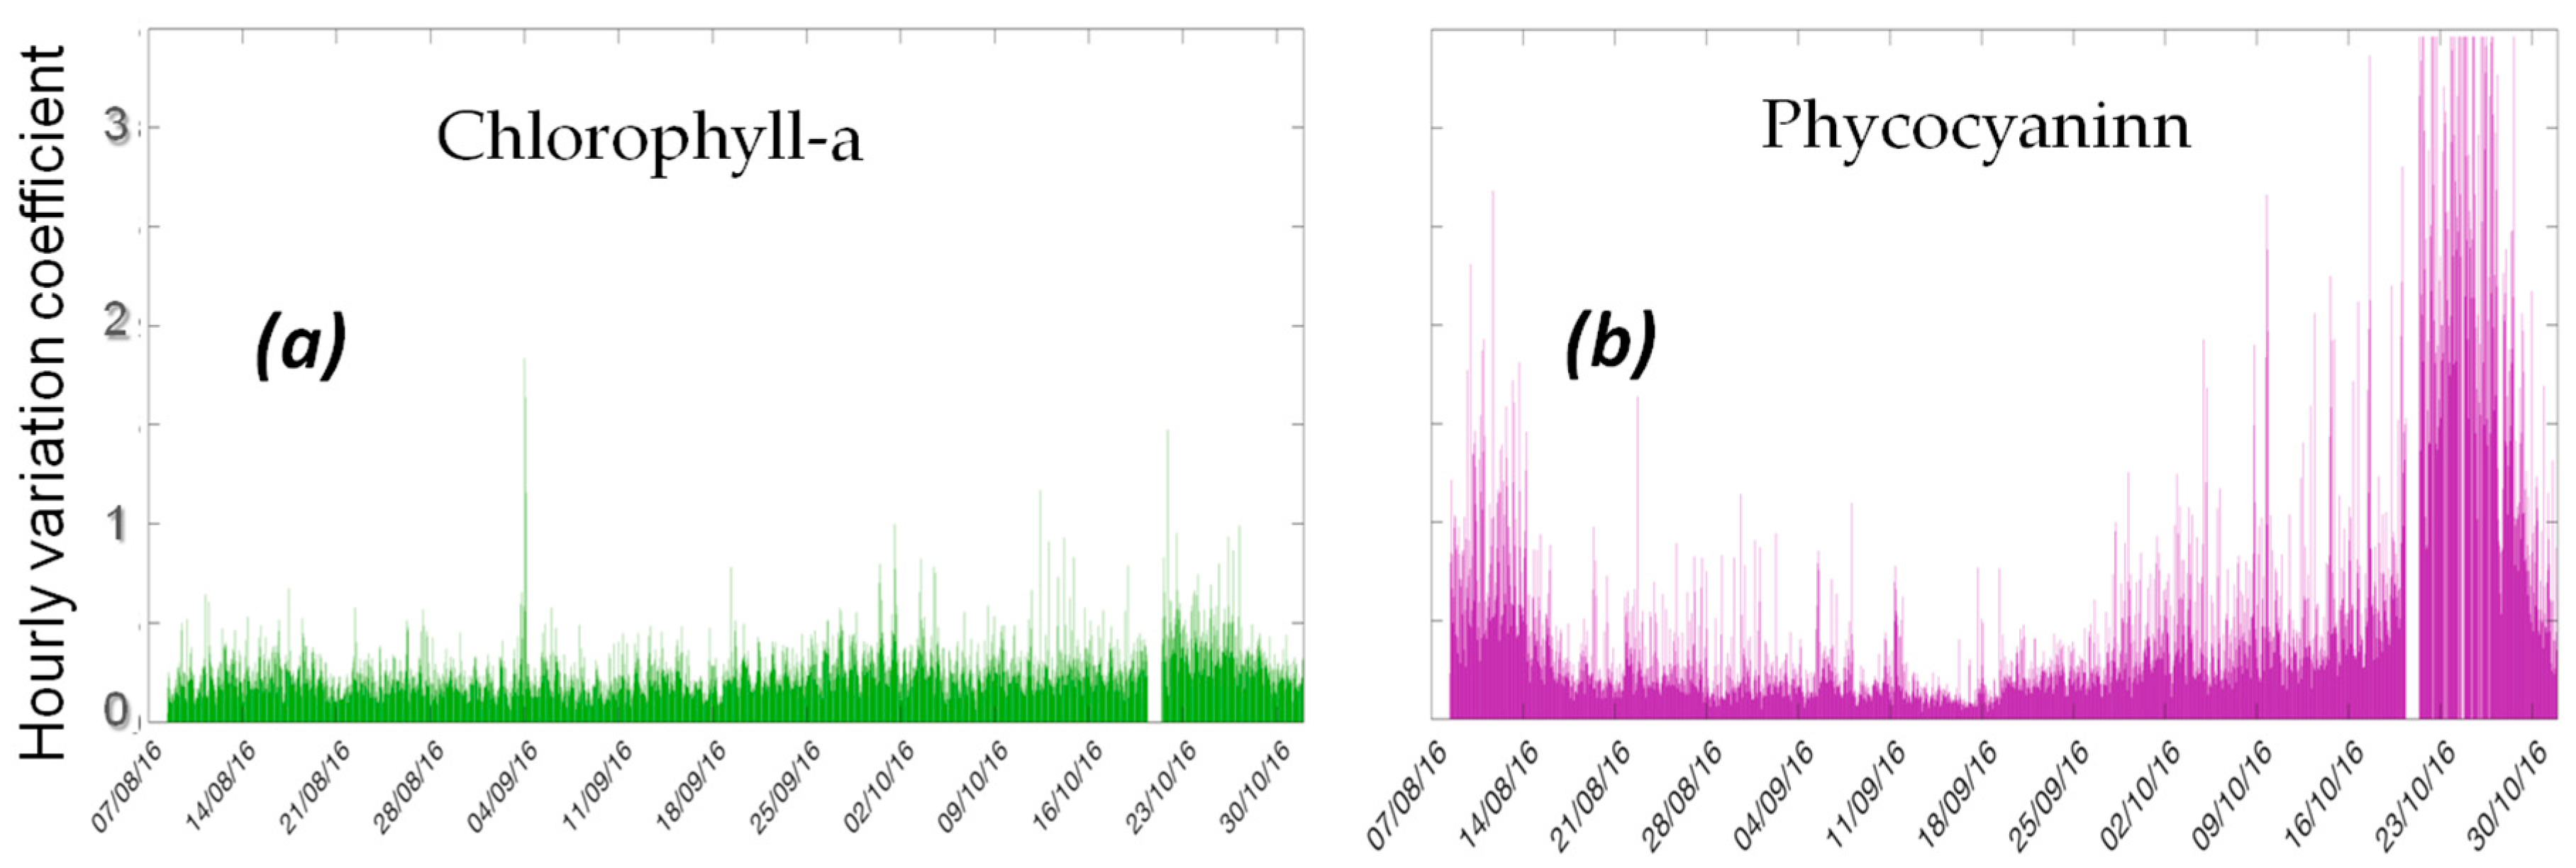
3.4. Hourly Variation Coefficients of Chlorophyll-a and Phycocyanin
Our high-frequency monitoring platform was set-up to collect data each 5 min. In order to check the feasibility of a high-frequency monitoring station, less energy-consuming, more suitable to operational management, the hourly variation coefficients (HVC) of the measured values of chlorophyll-a and phycocyanin are calculated. The HVC is the ratio of the standard deviation to the average of the measured values over 1 h. The HVC variations of chlorophyll-a and phycocyanin are shown in the
Figure 7.
As shown in
Figure 7, the HVC of chlorophyll-a varies between 20% to 40% for most of the observations. The HVC of phycocyanin are much higher, with several periods over 100%. This result indicates that the chlorophyll-a can be measured at longer time intervals (e.g., 10 min, 15 min), for saving energy. However, high-frequency measurements of phycocyanin are required to obtain reliable data of this parameter.
4. Discussion
4.1. Future Outlooks of the High-Frequency Monitoring System
These promising measuring results demonstrate the potential of such a high-frequency monitoring system for real-time management of water quality in lakes. As a general outlook, three key emerging issues can be identified for future studies: (1) real-time and short-term data validation; (2) environmental and biological data exploration; and (3) real-time modelling and early warning system for cyanobacteria blooms.
Since using invalid or false data can lead to wrong and biased results or interpretations, continuous measurement results must be systematically inspected and validated [
17]. The invalid measurements can be mainly identified as (i) biases due to probe calibration; and (ii) sensor deviations linked with occasional local environmental conditions [
18]. The former errors can be reduced by rigorously following the device configuration protocols in the laboratory before in-situ measurements; while the false measured values due to specific in-situ conditions are more complex. In this study, as a consequence of (i) sensor maintenance campaigns; (ii) biofouling on optical sensors, and (iii) irregular colonial morphology of cyanobacteria, raw data of observations, especially for the concentration of Chlorophyll-a, are difficult to be validated by empirical approaches. Development of the real-time and short term data validation methods, such as winsoring filter for outlier detection and removal [
19], Fast Fourier Transform test for correcting false periodicity in time series [
20], automated data quality assessment for dealing with faulty on-line sensors [
21] etc. should be the next step.
With the presented monitoring system, an exhaustive database containing high-frequency and long-term time series data of various physical-chemical and biological variables of a small urban lake (Lake Champs-sur-Marne) can be achieved. This type of data has been little discussed in the existing literature; however, it would be valuable to apply statistical techniques for data explorations, in order to improve understanding of the temporal-spatial processes of the hydro-biological dynamics in small shallow urban lakes. For instance, correlation analysis and regression analysis can be used for illustrating the nature and magnitude of the relationship among various physical-chemical variables [
22]; one-way analysis of variance (ANOVA) is meaningful for evaluating significant differences among the monitoring sites for all measured variables; multivariate statistics including cluster analysis (CA) and principal component analysis (PCA) could explore groups and sets of variables with similar properties, thus potentially allowing us to find the structures or patterns in the presence of chaotic or confusing data [
23,
24].
Benefitting from the measurements at each 5 min and the real-time data transfer platform, numerical models can be setup for real-time simulations, developing early warning system for cyanobacteria blooms. Two types of modelling approaches are widely used for simulating cyanobacteria dynamics in lakes, such as statistical models and determinist models. The statistical models generally refer to different machine learning (ML) algorithms, for example, genetic algorithms (GA), artificial neural networks (ANN), support vector machines (SVM), etc. [
25,
26]. The general principle of ML method is try to identify an interpretable pattern of a set of ecological variables, based on a large amount of measured data, aiming to predict the cyanobacteria or chlorophyll-a dynamics. Whereas, the determinist model describes physical-biological processes for representing hydrodynamics (ex. water flow, thermal cycle) and ecological processes (ex. algae growth, sedimentation, mineralization, etc.) in lakes [
27,
28]. The statistical models are relatively more accessible and more rapid for operational short-term applications. However, the determinist models could help us to improve the understanding of physical-biological mechanisms of lakes, as well as to evaluate the effects of different management strategies with scenario simulations. Using these high-frequency monitoring data, configuration and calibration of different modelling approaches is a promising perspective for developing real-time warning systems for cyanobacteria blooms in lakes. Furthermore, the monitoring and modelling results can be published on site-webs and smartphone applications, in order to communicate with the public.
4.2. Applying the High-Frequency Monitoring System for Public Health Risk Management
Cyanotoxins are produced by the actively growing cyanobacterial cells. Both intracellular and dissolved toxins are harmful for public health. There have been repeated descriptions of adverse health consequences for swimmers exposed to cyanobacterial blooms. Even minor contact with cyanobacteria in bathing water can lead to skin irritation and increased likelihood of gastrointestinal symptoms. Individual sensitivity to cyanobacteria in bathing waters varies greatly, because there can be both allergic reactions and direct responses to toxins [
29].
The current monitoring protocol is based on cell numbering under the microscope, the computation of the biovolume of toxin-producing cyanobacteria species for a first threshold value (
Cyanobacterial biomass 2000 cells per mL or 0.2 mm
3/L biovolume or 1 µg/L chlorophyll-a), and the lab analysis of toxins with a second threshold value (
Cyanobacterial biomass 100,000 cells per ml or 10 mm
3/L biovolume or 50 µg/L chlorophyll-a, with the presence of toxins confirmed by chemical or bioassay techniques) [
30]. The results are known after a few days, while lake managers would like to have a direct estimate of the proliferation risk of potentially toxic cyanobacteria. With the high-frequency monitoring system, a threshold on the phycocyanin concentration adequate for the toxin-producing species already encountered on the bathing spot could indicate the risk of the presence of toxins at high concentrations and the need for further lab analyses. While the phycocyanin concentration remains below this threshold, the risk would be low and there would be no need to ban bathing.
5. Conclusions
This paper presented an automatic monitoring system including a full-scale experimental site and a data transfer platform for high-frequency monitoring (every 5 min) in a small and shallow urban lake. Four physical-chemical variables, such as temperature at three different water depths (0.5 m, 1.5 m, 2.5 m), conductivity, pH, dissolved oxygen; and two biological variables such as the concentration of chlorophyll-a and phycocyanin are measured at four monitoring points.
The high-frequency monitoring data illustrated hourly, daily and seasonally variations of different environmental and ecological variables that would be not observed with the traditional monitoring approach. According to the measurements, stratification patterns can be clearly observed during several consecutive days in the water column of this small shallow urban lake. It can be noticed that the phytoplankton high concentration corresponds with dissolved oxygen cycles. However, the thermal regime, stratification and mixing, cannot totally explain the pattern evolution of the physical-chemical and ecological variables, especially of phytoplankton biomass. The variations of phycocyanin to chlorophyll-a ratio, indicate that cyanobacteria are one of the dominant species of phytoplankton blooms during the lake stratification periods (8 August–29 September 2016). During the cooling mixing period (29 September–19 October 2016), the high concentration of chlorophyll-a is mainly caused by the other phytoplankton species, such as diatoms. Considering the hourly variation coefficients of the measured chlorophyll-a, it can be assumed that the chlorophyll-a can be measured at longer time intervals (e.g., 10 min, 15 min), for saving energy. However, for phycocyanin, high-frequency measurements are required to obtain reliable data.
These promising results would allow to deploy the automatic monitoring system for real-time management of water bodies and lakes. Future studies will mainly focus on: (i) development of the real-time data validation methods; (ii) exploration of the measured data with statistical methods for improving the understanding of hydro-biological processes; and (iii) the real-time modelling of cyanobacteria dynamics with machine-learning and determinist models. This paper ends with the discussion on the application of the high-frequency monitoring system for public health risk management.
Acknowledgments
This research work was financed by ANR Oss-Cyano project (ANR-13-ECOT-0001). The authors would like to thank the financial supports of the French National Research Agency. The environmental observatories OSU EFLUVE and SOERE OLA had also contributed to the financial supports for equipment maintenance. The authors also thank Arthur Scriban and Honorine Roche, students of AgroParisTech, for their valuable work during their internship. We also acknowledge the Département de Seine-Saint-Denis (CD93) and the Base de loisirs du lac de Champs-sur-Marne for their logistical support in the field campaigns.
Author Contributions
Brigitte Vinçon-Leite, Philippe Dubois, Denis Plec and Viet Tran-Khac designed the experiments; Viet Tran-Khac, Yi Hong, Denis Plec, Philippe Dubois and Mohamed Saad performed the experiments; Yi Hong conceived the paper; Yi Hong, Viet Tran-Khac and Brigitte Vinçon-Leite performed the data analysis and wrote the paper; Brigitte Vinçon-Leite and Bruno Lemaire revised the paper.
Conflicts of Interest
The authors declare no conflict of interest.
References
- Goel, P.K. Water Pollution: Causes, Effects and Control; New Age International: New Delhi, India, 2006; ISBN 9788122418392. [Google Scholar]
- Dallas, H.; Day, J. The Effect of Water Quality Variables on Aquatic Ecosystems: A Review; Water Research Commission: Pretoria, South Africa, 2004. [Google Scholar]
- Carpenter, S.R.; Caraco, N.F.; Correll, D.L.; Howarth, R.W.; Sharpley, A.N.; Smith, V.H. Nonpoint Pollution of Surface Waters with Phosphorus and Nitrogen. Ecol. Appl. 1998, 8, 559–568. [Google Scholar] [CrossRef]
- United Nations. The Millennium Development Goals Report 2015. Available online: http://www.un.org/millenniumgoals/reports.shtml (accessed on 19 February 2017).
- European Parliament and Council. Directive 2000/60/EC Establishing a Framework for Community Action in the Field of Water Policy; Official Journal of the European Communities: Brussels, Belgium, 2000; Volume L327, pp. 1–73. [Google Scholar]
- Kanoshina, I.; Lips, U.; Leppänen, J.-M. The influence of weather conditions (temperature and wind) on cyanobacterial bloom development in the Gulf of Finland (Baltic Sea). Harmful Algae 2003, 2, 29–41. [Google Scholar] [CrossRef]
- Robarts, R.D.; Zohary, T. Temperature effects on photosynthetic capacity, respiration, and growth rates of bloom-forming cyanobacteria. N. Z. J. Mar. Freshw. Res. 1987, 21, 391–399. [Google Scholar] [CrossRef]
- Agence Francais de Securite Sanitaire des Aliments (Afssa). Évaluation des Risques Liés à la Présence de Cyanobactéries et Leurs Toxines Dans les Eaux Destinées à L’alimentation, à la Baignade et Autres Activités Récréatives (France: Agence Française de Sécurité Sanitaire des Aliments; Agence Francais de Securite Sanitaire des Aliments: Maisons-Alfort, France, 2006; p. 236. [Google Scholar]
- Arle, J.; Mohaupt, V.; Kirst, I. Monitoring of Surface Waters in Germany under the Water Framework Directive—A Review of Approaches, Methods and Results. Water 2016, 8, 217. [Google Scholar] [CrossRef]
- Bertani, I.; Steger, C.E.; Obenour, D.R.; Fahnenstiel, G.L.; Bridgeman, T.B.; Johengen, T.H.; Sayers, M.J.; Shuchman, R.A.; Scavia, D. Tracking cyanobacteria blooms: Do different monitoring approaches tell the same story? Sci. Total Environ. 2017, 575, 294–308. [Google Scholar] [CrossRef] [PubMed]
- Sivonen, K.; Niemelä, S.I.; Niemi, R.M.; Lepistö, L.; Luoma, T.H.; Räsänen, L.A. Toxic cyanobacteria (blue-green algae) in Finnish fresh and coastal waters. Hydrobiologia 1990, 190, 267–275. [Google Scholar] [CrossRef]
- Sendra, S.; Parra, L.; Lloret, J.; Jiménez, J.M. Oceanographic Multisensor Buoy Based on Low Cost Sensors for Posidonia Meadows Monitoring in Mediterranean Sea. Available online: https://www.hindawi.com/journals/js/2015/920168/ (accessed on 12 January 2018).
- Parra, L.; Sendra, S.; Lloret, J.; Rodrigues, J.J.P.C. Low cost wireless sensor network for salinity monitoring in mangrove forests. In Proceedings of the 2014 IEEE SENSORS, Valencia, Spain, 2–5 November 2014; pp. 126–129. [Google Scholar]
- Rasin, Z.; Abdullah, M.R. Water Quality Monitoring System Using Zigbee Based Wireless Sensor Network. Int. J. Eng. Technol. 2009, 9, 24–28. [Google Scholar]
- O’Flynn, B.; Martinez-Catala, R.; Harte, S.; O’Mathuna, C.; Cleary, J.; Slater, C.; Regan, F.; Diamond, D.; Murphy, H. SmartCoast: A Wireless Sensor Network for Water Quality Monitoring. In Proceedings of the 32nd IEEE Conference on Local Computer Networks (LCN 2007), Dublin, Ireland, 15–18 October 2007; pp. 815–816. [Google Scholar]
- Foy, R.H. The phycocyanin to chlorophyll α ratio and other cell components as indicators of nutrient limitation in two planktonic cyanobacteria subjected to low-light exposures. J. Plankton Res. 1993, 15, 1263–1276. [Google Scholar] [CrossRef]
- Câmara, M.; Soares, R.; Feital, T.; Anzai, T.; Diehl, F.; Thompson, P.; Pinto, J. Numerical Aspects of Data Reconciliation in Industrial Applications. Processes 2017, 5, 56. [Google Scholar] [CrossRef]
- Bertrand-Krajewski, J.-L.; Laplace, D.; Joannis, C.; Chebbo, G. Mesures en Hydrologie Urbaine et Assainissement; Technique et Documentation; Lavoisier: Paris, France, 2000; ISBN 2-7430-0380-4. [Google Scholar]
- Huber, P.J. Robust Statistics; Wiley Series in Probability and Mathematical Statistics; Wiley: New York, NY, USA, 1981; ISBN 0471418056. [Google Scholar]
- Kosarev, E.L.; Pantos, E. Optimal smoothing of “noisy” data by fast Fourier transform. J. Phys. E 1983, 16, 537. [Google Scholar] [CrossRef]
- Alferes, J.; Vanrolleghem, P.A. Efficient automated quality assessment: Dealing with faulty on-line water quality sensors. AI Commun. 2016, 29, 701–709. [Google Scholar] [CrossRef]
- Ndong, M.; Bird, D.; Nguyen-Quang, T.; de Boutray, M.-L.; Zamyadi, A.; Vinçon-Leite, B.; Lemaire, B.J.; Prévost, M.; Dorner, S. Estimating the risk of cyanobacterial occurrence using an index integrating meteorological factors: Application to drinking water production. Water Res. 2014, 56, 98–108. [Google Scholar] [CrossRef] [PubMed]
- Iscen, C.F.; Emiroglu, Ö.; Ilhan, S.; Arslan, N.; Yilmaz, V.; Ahiska, S. Application of multivariate statistical techniques in the assessment of surface water quality in Uluabat Lake, Turkey. Environ. Monit. Assess. 2008, 144, 269–276. [Google Scholar] [CrossRef] [PubMed]
- Chau, K.; Muttil, N. Data mining and multivariate statistical analysis for ecological system in coastal waters. J. Hydroinform. 2007, 9, 305. [Google Scholar] [CrossRef]
- Crisci, C.; Ghattas, B.; Perera, G. A review of supervised machine learning algorithms and their applications to ecological data. Ecol. Model. 2012, 240, 113–122. [Google Scholar] [CrossRef]
- Recknagel, F. Applications of machine learning to ecological modelling. Ecol. Model. 2001, 146, 303–310. [Google Scholar] [CrossRef]
- Soulignac, F.; Vinçon-Leite, B.; Lemaire, B.J.; Scarati Martins, J.R.; Bonhomme, C.; Dubois, P.; Mezemate, Y.; Tchiguirinskaia, I.; Schertzer, D.; Tassin, B. Performance Assessment of a 3D Hydrodynamic Model Using High Temporal Resolution Measurements in a Shallow Urban Lake. Environ. Model. Assess. 2017, 22, 309–322. [Google Scholar] [CrossRef]
- Kerimoglu, O.; Jacquet, S.; Vinçon-Leite, B.; Lemaire, B.J.; Rimet, F.; Soulignac, F.; Trévisan, D.; Anneville, O. Modelling the plankton groups of the deep, peri-alpine Lake Bourget. Ecol. Model. 2017, 359, 415–433. [Google Scholar] [CrossRef]
- Pilotto, L.S.; Douglas, R.M.; Burch, M.D.; Cameron, S.; Beers, M.; Rouch, G.J.; Robinson, P.; Kirk, M.; Cowie, C.T.; Hardiman, S.; et al. Health effects of exposure to cyanobacteria (blue-green algae) during recreational water-related activities. Aust. N. Z. J. Public Health 1997, 21, 562–566. [Google Scholar] [CrossRef] [PubMed]
- Chorus, I.; Bartram, J. Toxic Cyanobacteria in Water: A Guide to Their Public Health Consequences, Monitoring and Management; World Health Organization: Geneva, Switzerland, 1999. [Google Scholar]
© 2018 by the authors. Licensee MDPI, Basel, Switzerland. This article is an open access article distributed under the terms and conditions of the Creative Commons Attribution (CC BY) license (http://creativecommons.org/licenses/by/4.0/).


