A Throughput Management System for Semiconductor Wafer Fabrication Facilities: Design, Systems and Implementation


1
Department of Systems Engineering and Operations Research, George Mason University, Fairfax, VA 22030, USA
2
GiantSoft, Hsinchu 300, Taiwan
*
Author to whom correspondence should be addressed.
Processes 2018, 6(2), 16; https://doi.org/10.3390/pr6020016
Submission received: 16 December 2017
/
Revised: 2 February 2018
/
Accepted: 9 February 2018
/
Published: 11 February 2018
(This article belongs to the Collection Process Data Analytics)
Abstract
:Equipment throughput is one of the most critical parameters for production planning and scheduling, which is often derived by optimization techniques to achieve business goals. However, in semiconductor manufacturing, up-to-date and reliable equipment throughput is not easy to estimate and maintain because of the high complexity and extreme amount of data in the production systems. This article concerns the development and implementation of a throughput management system tailored for a semiconductor wafer fabrication plant (Fab). A brief overview of the semiconductor manufacturing and an introduction of the case Fab are presented first. Then, we focus on the system architecture and some concepts of crucial modules. This study also describes the project timescales and difficulties and discusses both tangible and intangible benefits from this project.
1. Introduction
Equipment throughput (ETH), the basis of capacity management, is absolutely necessary information for practitioners in manufacturing because its timeliness and reliability significantly affect the performance of production systems. For example, as a key parameter for production planning and scheduling, inaccurate or out-of-date ETH usually leads to suspect results, which may hurt the commitment-to-customer or expected profit. In addition, for capital-intensive industries such as semiconductor manufacturing, any capacity loss from ineffective ETH management may cause a hugely rising production cost. Therefore, a systematic and reliable solution for ETH management is a prerequisite to the success of advanced semiconductor wafer fabrication plants (Fabs). Unfortunately, estimating and maintaining reliable ETH is not an easy task for large complex manufacturing systems such as Fabs.
The manufacturing process of semiconductor chips often involves hundreds of processing steps being executed layer by layer onto a bare wafer. The whole process is composed of a few repeating unit processes: thin film, photolithography, chemical mechanical planarization, diffusion, ion implantation and etching. This nature of semiconductor manufacturing leads to long cycle times and affects the changes of wafer size not only due to enhancing the throughput, but also reducing production cost per chip, thereby using the same number of process steps to produce more chips. Highly automated and integrated processing tools (IPT) in advanced manufacturing systems such as Fabs are adopted to answer the need for such a complicated manufacturing requirement. However, this kind of complex production system also brings new challenges to practitioners.
Work measurement has been widely used as a method for establishing the time for qualified labor to complete a particular operational task at a satisfactory level of performance [1]. For fully-automatic IPT equipment, this kind of method is applied for estimating and determining the ETH. The results of work measurement are the foundation for manufacturing industries in order to establish the capacity model and to develop further production planning and scheduling [2]. Due to the increasing complexity of production equipment in Fab, the difficulty is increasing. In modern Fabs, connecting several process modules around a central handler, IPT is capable of processing multiple wafers from the same lot simultaneously. This kind of equipment has been common for decades because of its lower floor-space requirement, lower capital cost, shorter cycle time, higher yield, better process control and less operator handling [3,4,5,6]. Logically, many IPT equipment units can be seen as a job-shop production line or even a small factory. Therefore, modeling and performance analysis for IPT has never been easy and is always a research focus in semiconductor manufacturing, for example [7,8,9,10,11].
In semiconductor manufacturing, measurement of overall equipment effectiveness (OEE) [12,13] is absolutely a manufacturing best practice [14]. Since OEE has been recognized as a standard efficiency index for measuring production equipment beginning in the late 1980s, many studies attempted to propose a better performance index to further represent the overall equipment efficiency or not just at the equipment level; for example, overall input equipment efficiency (OIE) for measuring the resource usage efficiency of a machine and total equipment efficiency (TEE) for measuring the usage efficiency of a machine [15], overall throughput effectiveness (OTE) for measuring factory-level performance [16], overall tool group efficiency (OGE) for measuring the equipment performance at the tool group level [17] and overall wafer effectiveness (OWE) for measuring wafer productivity [18]. In any case, ETH is not only a key input for OEE calculation, but also for the calculation of the others.
Wafer per hour (WPH) is the most common performance index for measuring the ETH among worldwide Fabs. In general, there are two kinds of WPH: actual WPH and peak WPH; the former is the real performance of ETH, and the latter is the theoretical extreme performance of ETH. The actual WPH is often obtained by direct measurement, which means treating the equipment as a black box and then recording how many wafers have completed the process during a period of estimation. Obviously, repeated sampling is necessary due to the existing random noise in processing. This method often relies on a massive workforce to maintain its reliability; even in a highly automated Fab with an advanced manufacturing execution system, it can still be time consuming because of complex data screening and pre-treatment.
As for the peak WPH, parameterized models are formulated for estimation. A set of mathematical formulas represents different types of equipment; each formula consists of a few parameters, e.g., time for cleaning the chamber or breaking the vacuum, and any ECN (engineering change notice) may trigger the update of the value of these parameters [19]. Because some mandatory activities happen during wafer processing and reduce peak WPH as well, the impact cannot be reflected by an adjusted plan uptime. Therefore, a revised peak WPH, plan WPH, is relaxed by a tolerance derived from these activities for reasonable results of production planning such as resource requirements planning, rough-cut capacity planning and capacity requirements planning. However, the tolerance determination is not a straightforward task [20], and the calculation of actual WPH cannot completely avoid including unscheduled events behind the data. Thus, there is often a gap between the plan WPH and the actual WPH. Either way, continuously tracing these indices and analyzing their trends can always provide the fuel to keep rolling the wheel of the plan-do-check-act (PDCA) cycle [21] for Fab performance enhancement.
In order to monitor all kinds of WPH in a sustainable manner, there is a need to develop a WPH management system that could automatically and periodically estimate and calculate all kinds of WPH for equipment units in the Fab. Because of the high complexity of production equipment and the large number of equipment units, performance monitoring for production equipment in Fabs is a challenge and also has been an attractive research topic for years [22,23,24,25,26,27]. In addition, wafer lots in modern Fabs become much heavier; the automated material handling system (AMHS) has been the main stream on the shop floor for a long time. Due to the advanced intelligent lot scheduling and dispatching built around AMHS to control and execute the complex handling operations precisely, there are many manufacturing execution-related systems (MES) for supporting an automatic Fab. However, the system integration and data synchronization become another challenge for developing a WPH management system. Undoubtedly, a systematic mechanism for monitoring WPH is a key to raise the capacity management from the machine level to the whole Fab level. In summary, based on this foundation, more applications, for example like a generic visualization of wafer process flow for troubleshooting [28] or a predictive analysis for abnormality prevention [29], could be developed to improve the performance of production systems further.
In this paper, a WPH management system that includes four modules to give effective support for capacity management is introduced and discussed. This system is capable of estimating and monitoring equipment WPH by a recipe in a sustainable manner; additionally, some supporting tools are included to further assist performance improvement and troubleshooting. The main advantages of the proposed solution are: (1) a generic framework for almost every Fab; (2) high flexibility of WPH calculation and estimation; and (3) data-driven decision support tools for abnormality review and troubleshooting. An industry project for implementing the proposed system is also introduced, and results with performance comparison are demonstrated to show the benefits to the capacity management.
This article not only introduces the contents of the system architecture and related methods, but also discusses some implementation details such as challenges, considerations, data requirements and project control. In the rest of the paper, preliminary information on semiconductor manufacturing and the case Fab are introduced. Then, the idea of the proposed solution is discussed in more detail. Next, the implementation of this industry project is introduced, and the performance comparison between the existing system and the proposed system is also presented. Finally, I conclude this study with some perspectives. Please note that although I must keep the company’s name confidential, the information for apprehending the concept of the proposed system and the key points of implementation is covered.
2. Preliminary Information on Semiconductor Manufacturing
In this section, a brief review of semiconductor manufacturing, which focuses on equipment capacity-related topics, is provided to help readers obtain more details about the proposed WPH management system. Furthermore, an overview of the case Fab is described.
2.1. Semiconductor Manufacturing
A semiconductor chip is an electric circuit with many components such as transistors and wiring. Although the surface of chips looks smooth, they are physically constructed by three-dimensional structures and usually include many layers of complex circuitry [30]. The semiconductor manufacturing process occurs in a cleanroom in which temperature, barometric pressure and humidity are controlled to avoid contamination [31]. A typical manufacturing process often involves hundreds of processing steps being executed layer by layer onto a bare wafer, which may contain hundreds of chips (also called dies). The whole process is composed of a few repeating unit processes: thin film, photolithography, chemical mechanical planarization, diffusion, ion implantation and etching. Figure 1 is a general process flow for most semiconductor manufacturing to illustrate the interrelationship between these unit processes. Generally, film formation, e.g., thin film or diffusion, is often followed by ion implantation or photolithography; etching typically comes after photolithography for pattern formation and is usually followed by the next film formation; chemical mechanical planarization is used to flatten the wafer surface by polishing first to perform a reliable patterning, usually between film formation and photolithography. For this reason, wafers need to revisit many workstations in Fabs several times; thus, this kind of process flow is called a reentrant flow, which introduces a considerable degree of complexity into the production control of Fabs.
Since the semiconductor manufacturers always aim at putting more and more transistors into small-sized dies, the number of process steps increases correspondingly. Modern production tools tend to be more clustered and integrated to eliminate the number of process steps and to reduce the amount of work-in-process transfer [32]. These integrated processing tools (IPT), integrating multiple processing units, internal buffers and wafer handling robots, have the economic advantages of lower floor-space requirement, lower capital cost, higher yield and less operator handling. In addition, because process chambers are attachable and robots are programmable for specific routing within the tools, the process flexibility makes IPT mainstream for semiconductor manufacturing, which usually has a rapid technological change. Figure 2 shows example schematics of IPT, which combines several process chambers into a single equipment unit. IPT is usually equipped with multiple load ports, which allows automated loading/unloading and front opening unified pod (FOUP) identification. FOUP is a standard for 300-mm Fabs for which it provides clean and secure wafer transport and optimum automation integration. After an FOUP is shipped at a load port of the tool, the loading robot picks wafers from FOUP and passes it to the mainframe robot via a load lock, which is a buffer space for controlling the pressure level of the mainframe as a requirement. Finally, mainframe robots place the wafer in the process chamber for specific processing. IPT could have multiple process chambers with the same capability in order to enhance the throughput such as the example in Figure 2a. Furthermore, IPT can be equipped with chambers having different functions such as the example in Figure 2b; Process Chamber 1–5 are responsible for deposition of different materials, e.g., titanium (Ti) and titanium nitride (TiN), and the other supporting chambers are for degassing, pre-cleaning and cooling. Hence, each IPT can be considered a small production system, which is just like a multi-purpose production line. Estimating the WPH for a single process chamber is straightforward, but for the whole equipment unit, it is a relatively complex issue. See [33] for more details on IPT.
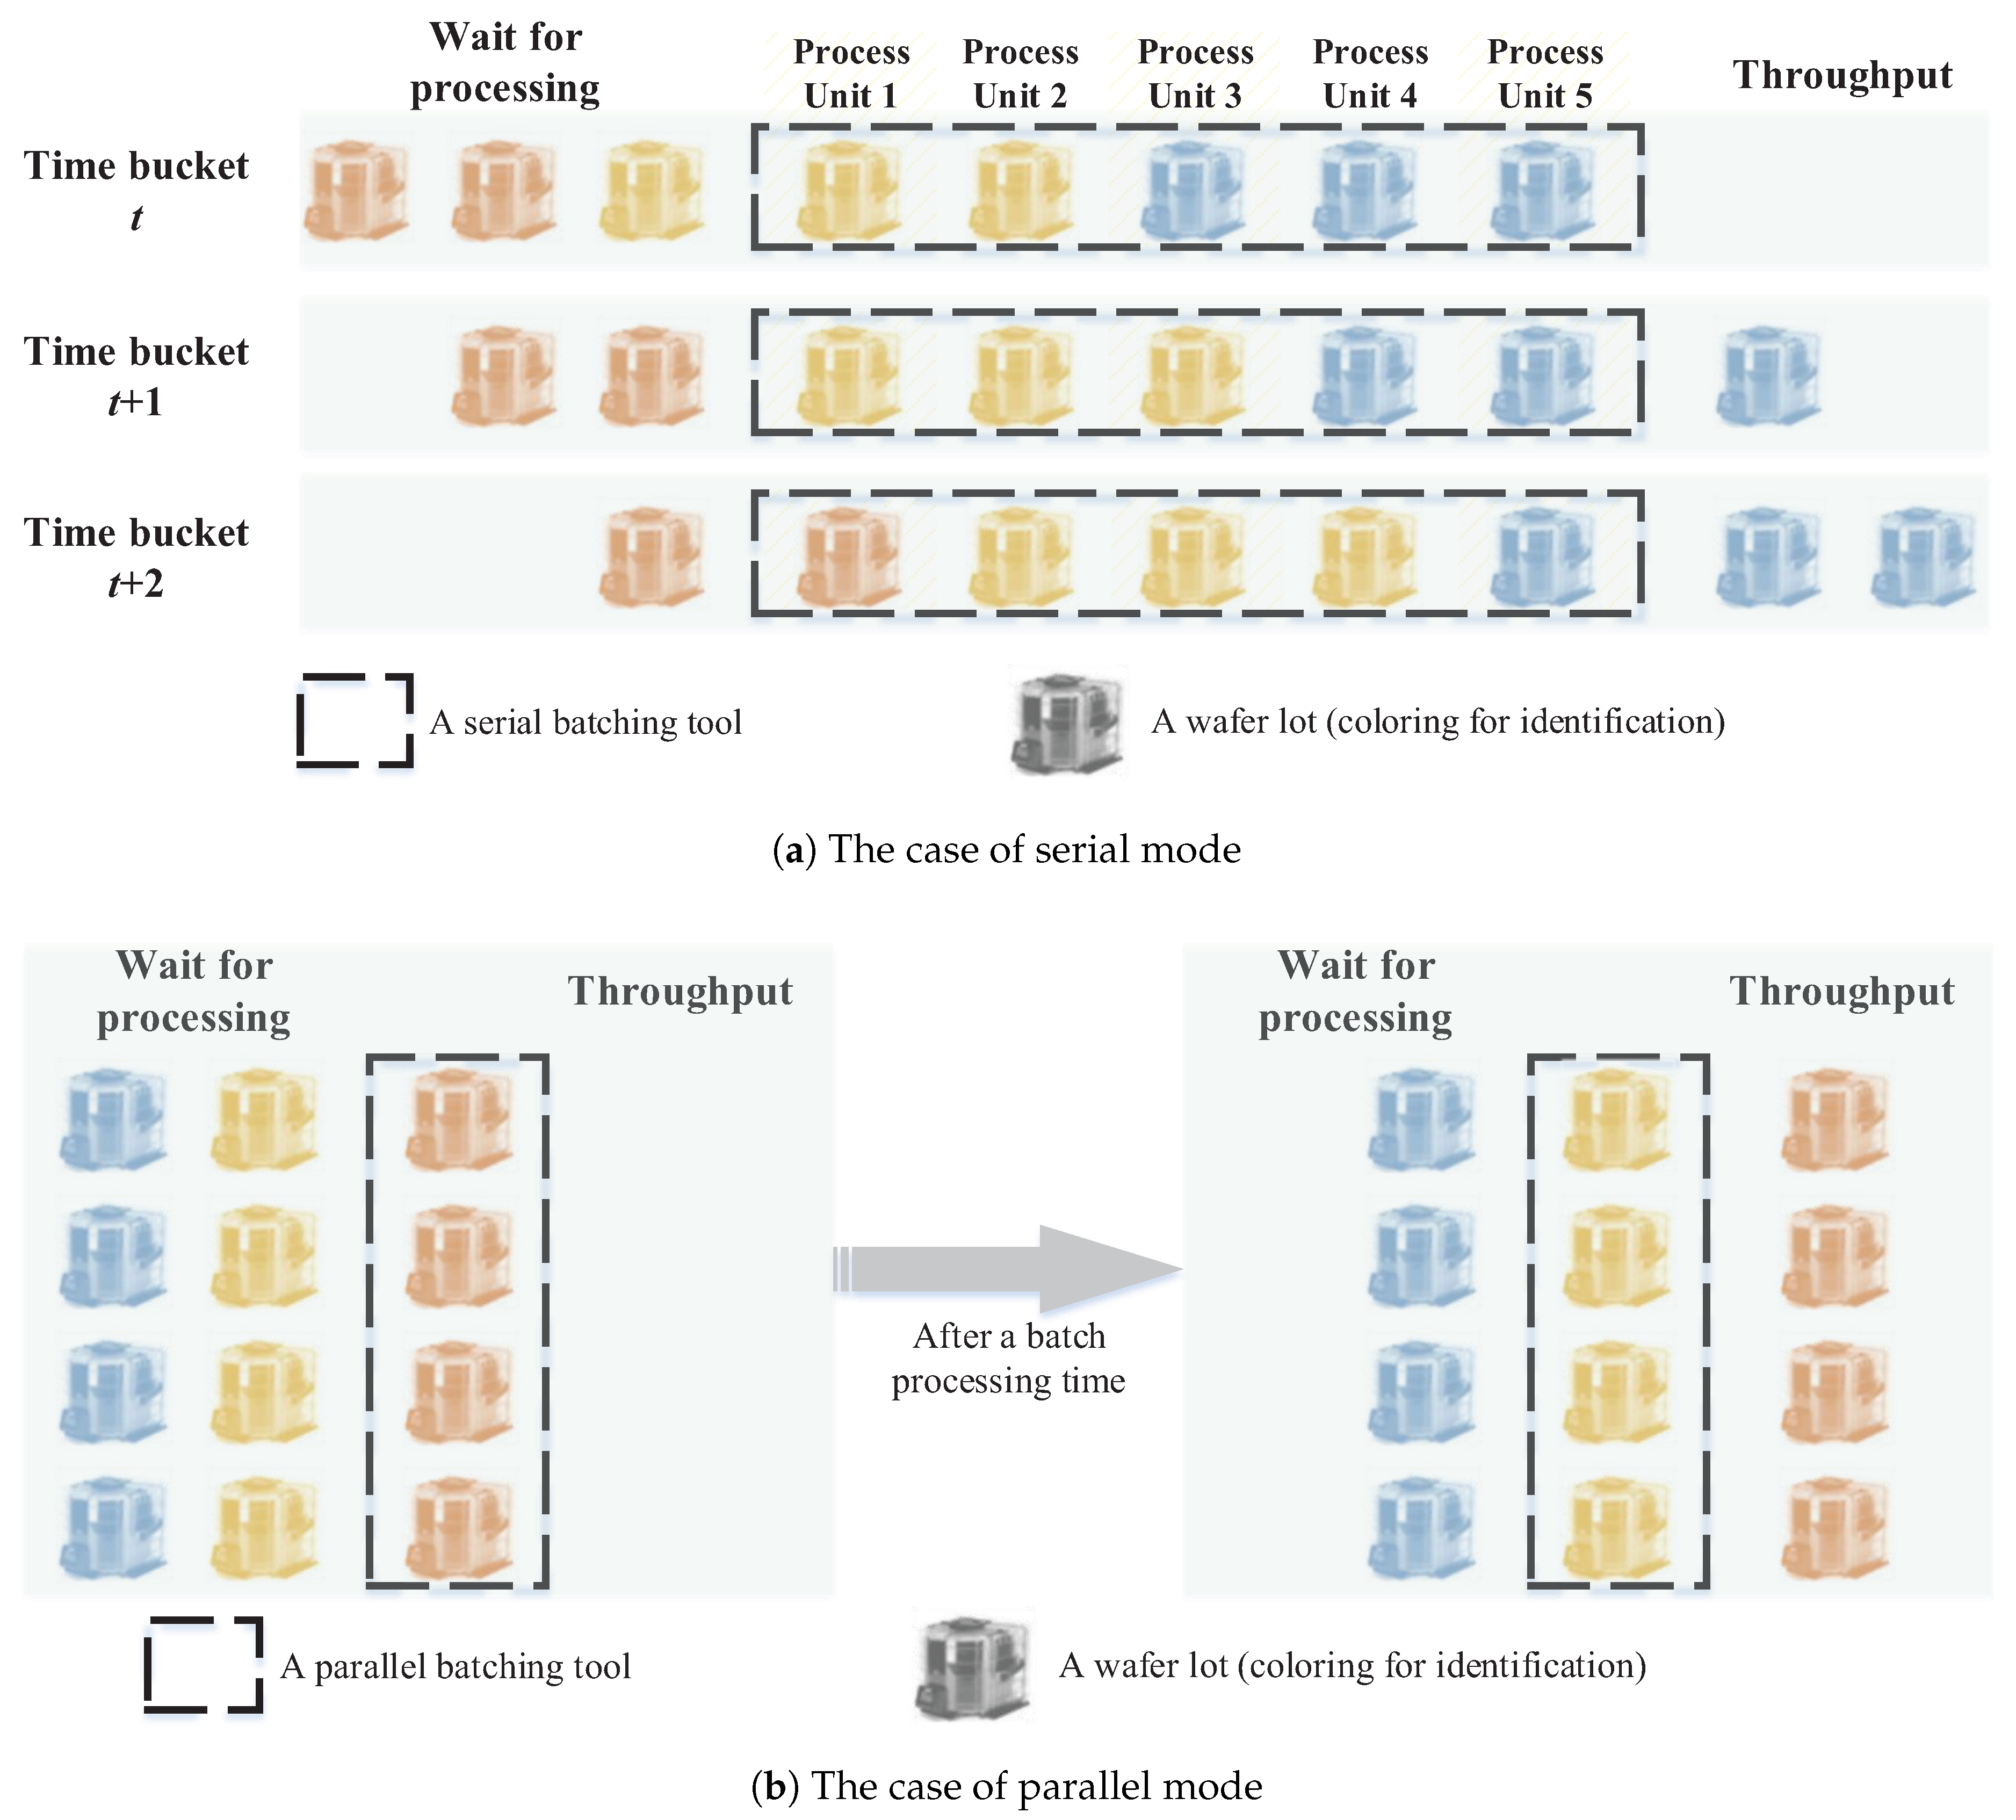
Batch processing, i.e., equipment that can process more than one job at a time, is another characteristic of the Fab equipment, and both serial and parallel modes are very prevalent in practice. The parallel mode allows processing multiple jobs simultaneously as a batch within the machine capacity, while the serial mode is related to jobs in the same batch being processed one after another serially [34]. Figure 3 is an illustration to give a better understanding of the batch processing and the comparison between two different modes. I use a dashed block to represent an equipment unit and color each wafer lot for identification to show the lots’ flow over time. Regarding serial mode, the tool is capable of processing multiple wafer lots at the same time, but each of these lots completes its process serially. As for the parallel mode, all wafer lots in the same batch begin and finish the process simultaneously. Though the wafer size is getting bigger, the importance of batch processing tools is increasing due to the significant throughput gain compared to single-wafer processing tools.
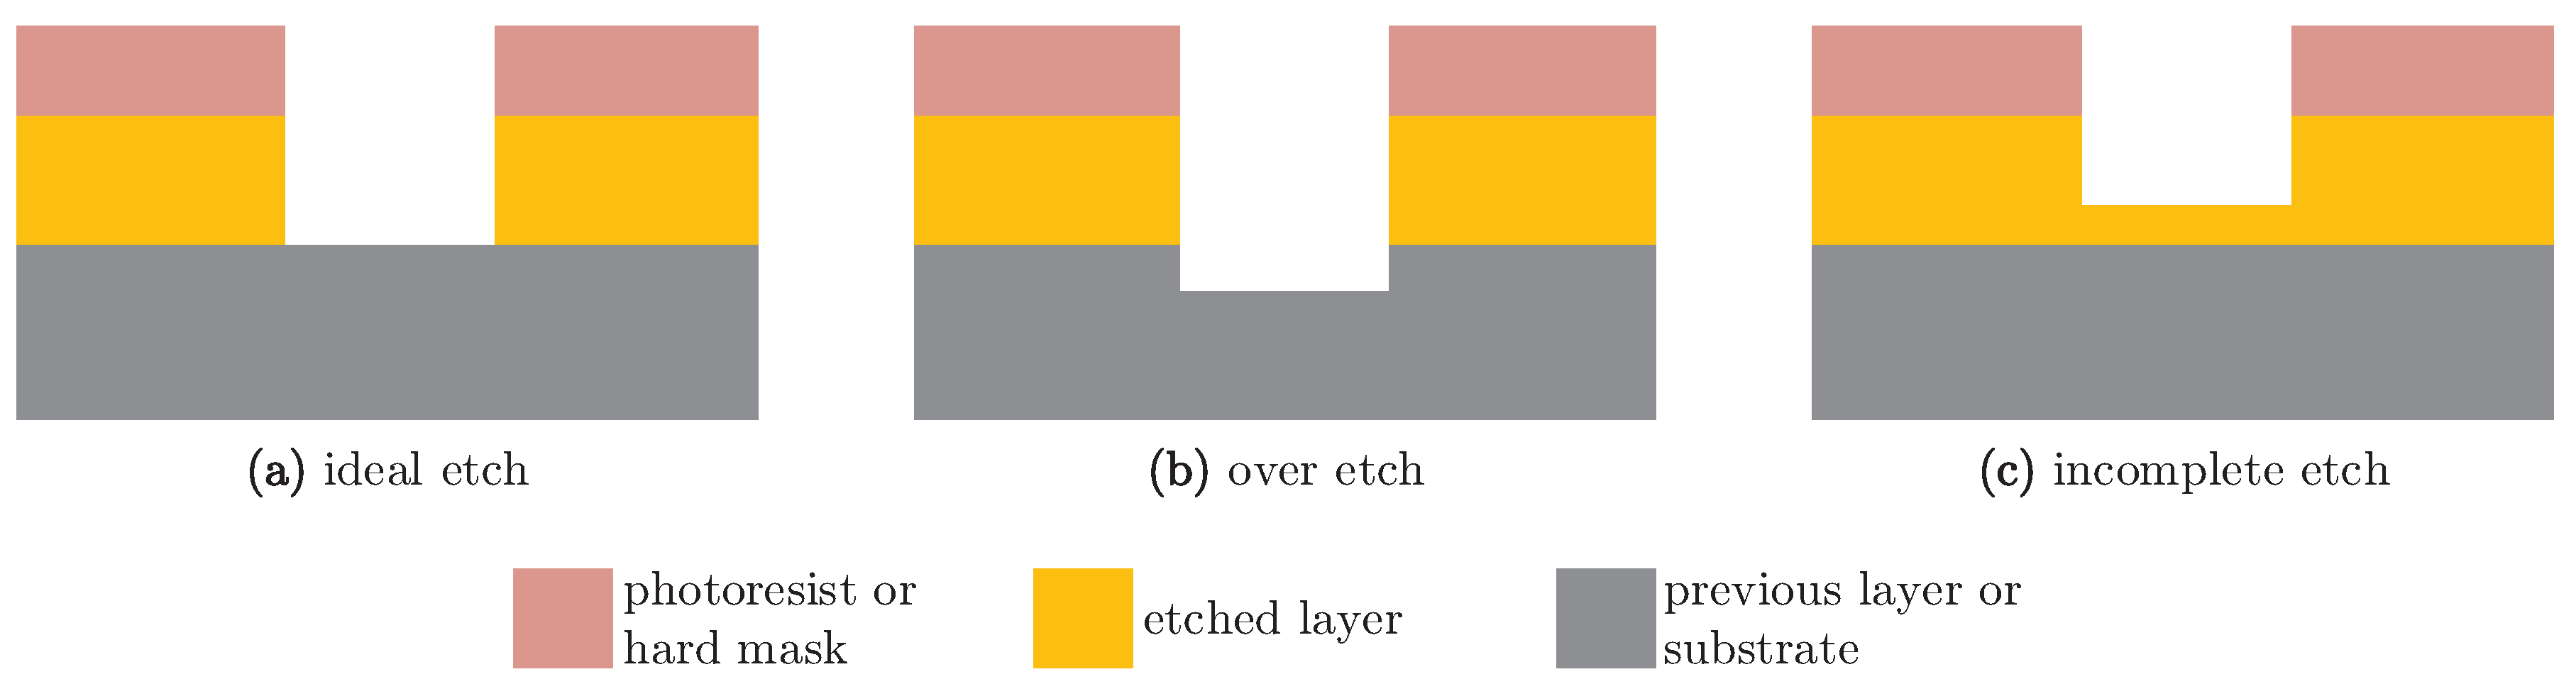
A modern Fab enables producing multiple product types with different process technologies, and each product has its processing flow, which contains hundreds of steps with specific constraints; thousands of equipment units are shared production resources for this multi-product manufacturing. WPH estimation and calculation for all process steps involves a tremendous amount of work, including data collection, data pre-treatment and computation. Moreover, the frequency of WPH estimation and calculation is a greater challenge. Since the stochastic processing time is the nature of most process steps in semiconductor manufacturing, periodic update and review are necessary for capacity management. Endpoint processing is one of the main reasons that even the raw processing time for a process chamber is not a fixed number. This kind of process relies on the endpoint detection as a stop criterion to end the process. For example, Figure 4 illustrates different completion levels of the plasma etching process. The photoresist on the top protects particular areas, and thus, unmasked etched layer will be removed to form a trench structure. Ideally, the etching process will only remove the etched layer completely in the unmasked regions, and none of any previous layers will be removed. However, especially for those wafers having passed through some processes, the surface profile of wafers cannot be perfectly flat, and neither over-etch nor incomplete etch are rare in Fabs. For more details and related studies of endpoint processing in plasma etching, please see [35,36,37].
Because any two wafers from a work-in-process batch usually have different wafer conditions physically from the microscopic view, they may have inconsistent processing time at the same chamber for the same process. This is a reason, but not the only one, that the wafer processing time is a random variable and WPHs are need to be traced in a sustainable manner. More information about the randomness of semiconductor manufacturing can be found in [30,38,39,40]. To sum up, although the difficulty of WPH calculation and its extremely huge amount of work are tough tasks for Fabs, the necessity for equipment efficiency evaluation and monitoring is indubitable.
2.2. Capacity Management
2.2.1. Equipment Capacity
The useful capacity of an equipment unit per day is the wafer per hour (WPH) multiplied by available hours in one day. Figure 5 illustrates the capacity improvement in both ways. The WPH improvement can be achieved by shortening the raw process time and/or speeding up the mechanical movement inside of equipment units. In order to do so, the basis is to investigate how wafers spend their time in an equipment unit from loading to unloading; this is composed of numerous steps operated by various components such as robots, reactors or gas feeders. Furthermore, benchmarking between identical machines, equipment units of the same equipment type, is a typical way to find out the root cause of subtle differences by comparing the detailed timing date of wafer movement during the process. Generally, engineers identify the slower steps in those equipment units with lower performance and then scrutinize them to improve the speed of these steps to match the ones from other, identical machines. However, by dissecting the timing data, it is possible that one equipment unit performs better in speed in certain steps, but the other units have better performance in the other steps. Therefore, systematic monitoring of the internal operations of equipment units will help capacity management.
2.2.2. WPH Improvement
Figure 6 illustrates the three primary goals in WPH improvement:
- Peak WPH enhancement
- Variance reduction
- Outliers elimination
The peak WPH enhancement is the ultimate one, which aims at driving the whole distribution toward a better level of throughput; it often counts on new recipes or hardware retrofits. Variance reduction is to shorten the gap between peak WPH and the others, and the root causes of an equipment unit with a high variance of WPH could be very complicated. In general, this is highly related to the frequency of preventive maintenance for equipment; WPH may gradually decrease over time because some processing features will decline when the uptime of chemicals, parts or components becomes longer. Finally, any outlier can probably represent an unknown factor behind the processing, and thus, outlier elimination is the most critical for equipment in a mass production Fab.
2.3. Overview of the Case Fab
The case Fab is an advanced 300-mm semiconductor wafer fabrication plant with full automation material transportation capability and high integration of information systems. The process technologies are mainly on CMOS (complementary metal oxide semiconductor) logic integrated circuits and image sensors. Since the Fab is ramping up its capacity, a strategy planning for capacity expansion by optimization techniques is applied. The results of planning are used to build the equipment move-in scheduling, which is expected to fulfill the capacity expansion plan while dynamically minimizing the capital expenditure during the ramp-up. In the meantime, being capable of addressing multi-objective problems, a mid-term capacity allocation planning is employed to determine the best product mix under a limited capacity. A robust mechanism for WPH calculation could power up these capacity planning systems and enhance the reliability of their results. Furthermore, any WPH improvement can also bring the potential for operations management.
In Fabs, the foundation of WPH management is work measurement for production equipment. Just like most of semiconductor manufacturers in the world, the case Fab also highly relies on engineers to perform this kind of study continuously. They usually collect data from both shop floors and manufacturing-related databases; spreadsheets with macro programs may be the most common tool to calculate and estimated WPH because of its high flexibility. However, this kind of solution is questionable to move forward to the next generation, and a systematic solution is expected. Before the implementation of the new system, the Department of Industrial Engineering usually spends over 70% of their work hours on related jobs of WPH management, such as work measurement, determination or revision of the WPH estimator, data pre-treatment, spreadsheet model maintenance and summary reports. Moreover, the workload of this department becomes more onerous while considering the capacity ramp-up trend in the future. Therefore, these strong and urgent requirements triggered the industry project to develop a WPH management system.
3. WPH Management System
In this section, I present a WPH management system that is designed to maintain and further improve the effectiveness and efficiency of operations management by careful capacity management. This system includes four primary modules: filter, calculator, monitor and analytics. Filter ensures the data used for calculating WPH are qualified and noiseless; calculator, the core of this system, periodically computes WPH by the process recipe for all equipment units in the Fab; monitor is a platform for equipment performance monitoring and the detection of process malfunctions; finally analytics is capable of classifying abnormal recipes into several categories and provides various visual tools for reviewing corresponding historical processing logs. It prevents capacity loss and further ensures the quality of capacity management. Prior to introducing these modules individually, I would like to introduce the system architecture not only for readers who are interested in system design, but also for better understanding of the interrelationship between these modules.
3.1. Systems Architecture
WPH calculation is the basis of the WPH management system and requires an incredibly huge number of processing logs and data. As a control center of modern manufacturing systems, the manufacturing execution system (MES) plays a critical role in shop floor control, and its master database (MDB) is capable of fulfilling the basic data request from WPH calculation. Figure 7 illustrates the systems architecture to indicate the relationship between primary modules in WPH management system and related CIM (computer-integrated manufacturing) systems. MES coordinates and cooperates with many supporting systems; RTD (real-time dispatcher) determines the next step for each lot while completing a process step; AM (activity manager) is for managing and controlling resources and equipment; EAP (equipment automation program) controls the processing of equipment to avoid misoperations due to operator error and collects processing data from equipment; RCM (recipe control management) allows a central repository and verification for process recipes to achieve systematic management; APC (advance process control) collects product measurements and recipe set points to enhance overall product yields.
Any access to MDB is strictly watched to retain the execution efficiency at a high level; also, because of the connection with all equipment units, the cybersecurity in the Fab network makes MDB access even more rigorous. Therefore, since WPH calculation does not request the entire data of MDB, only partial datasets from MDB are replicated to a database dump in the office network periodically. The data required for WPH calculation are detailed processing logs, which record wafer track-in and track-out times of all traceable internal units (e.g., buffer chamber) for every process equipment unit.
3.2. Filter
Based on a few prescribed filtering rules, the raw data from MDB are reviewed by the filter before performing WPH calculation in order to screen incomplete and unrepresentative data. These rules are implemented by PL/SQL as stored procedures and are capable of assigning to address the entire dataset or only for those datasets corresponding to a particular equipment type, unit or recipe. Users can adjust the priority for each activated rule to determine which rule will execute prior to another.
Figure 8 is the screen capture from the prototype of the proposed system, and this is an example to demonstrate the user interface for rules management. Each rule corresponds to a stored procedure. Users can change their sequence in the block “Running Filter Job” by drag-and-drop to adjust their priorities. In addition, users can drag a filter rule from the block “Stopped Filter Job” and drop it to the block “Running Filter Job” to activate this rule and vice versa.
3.3. Calculator
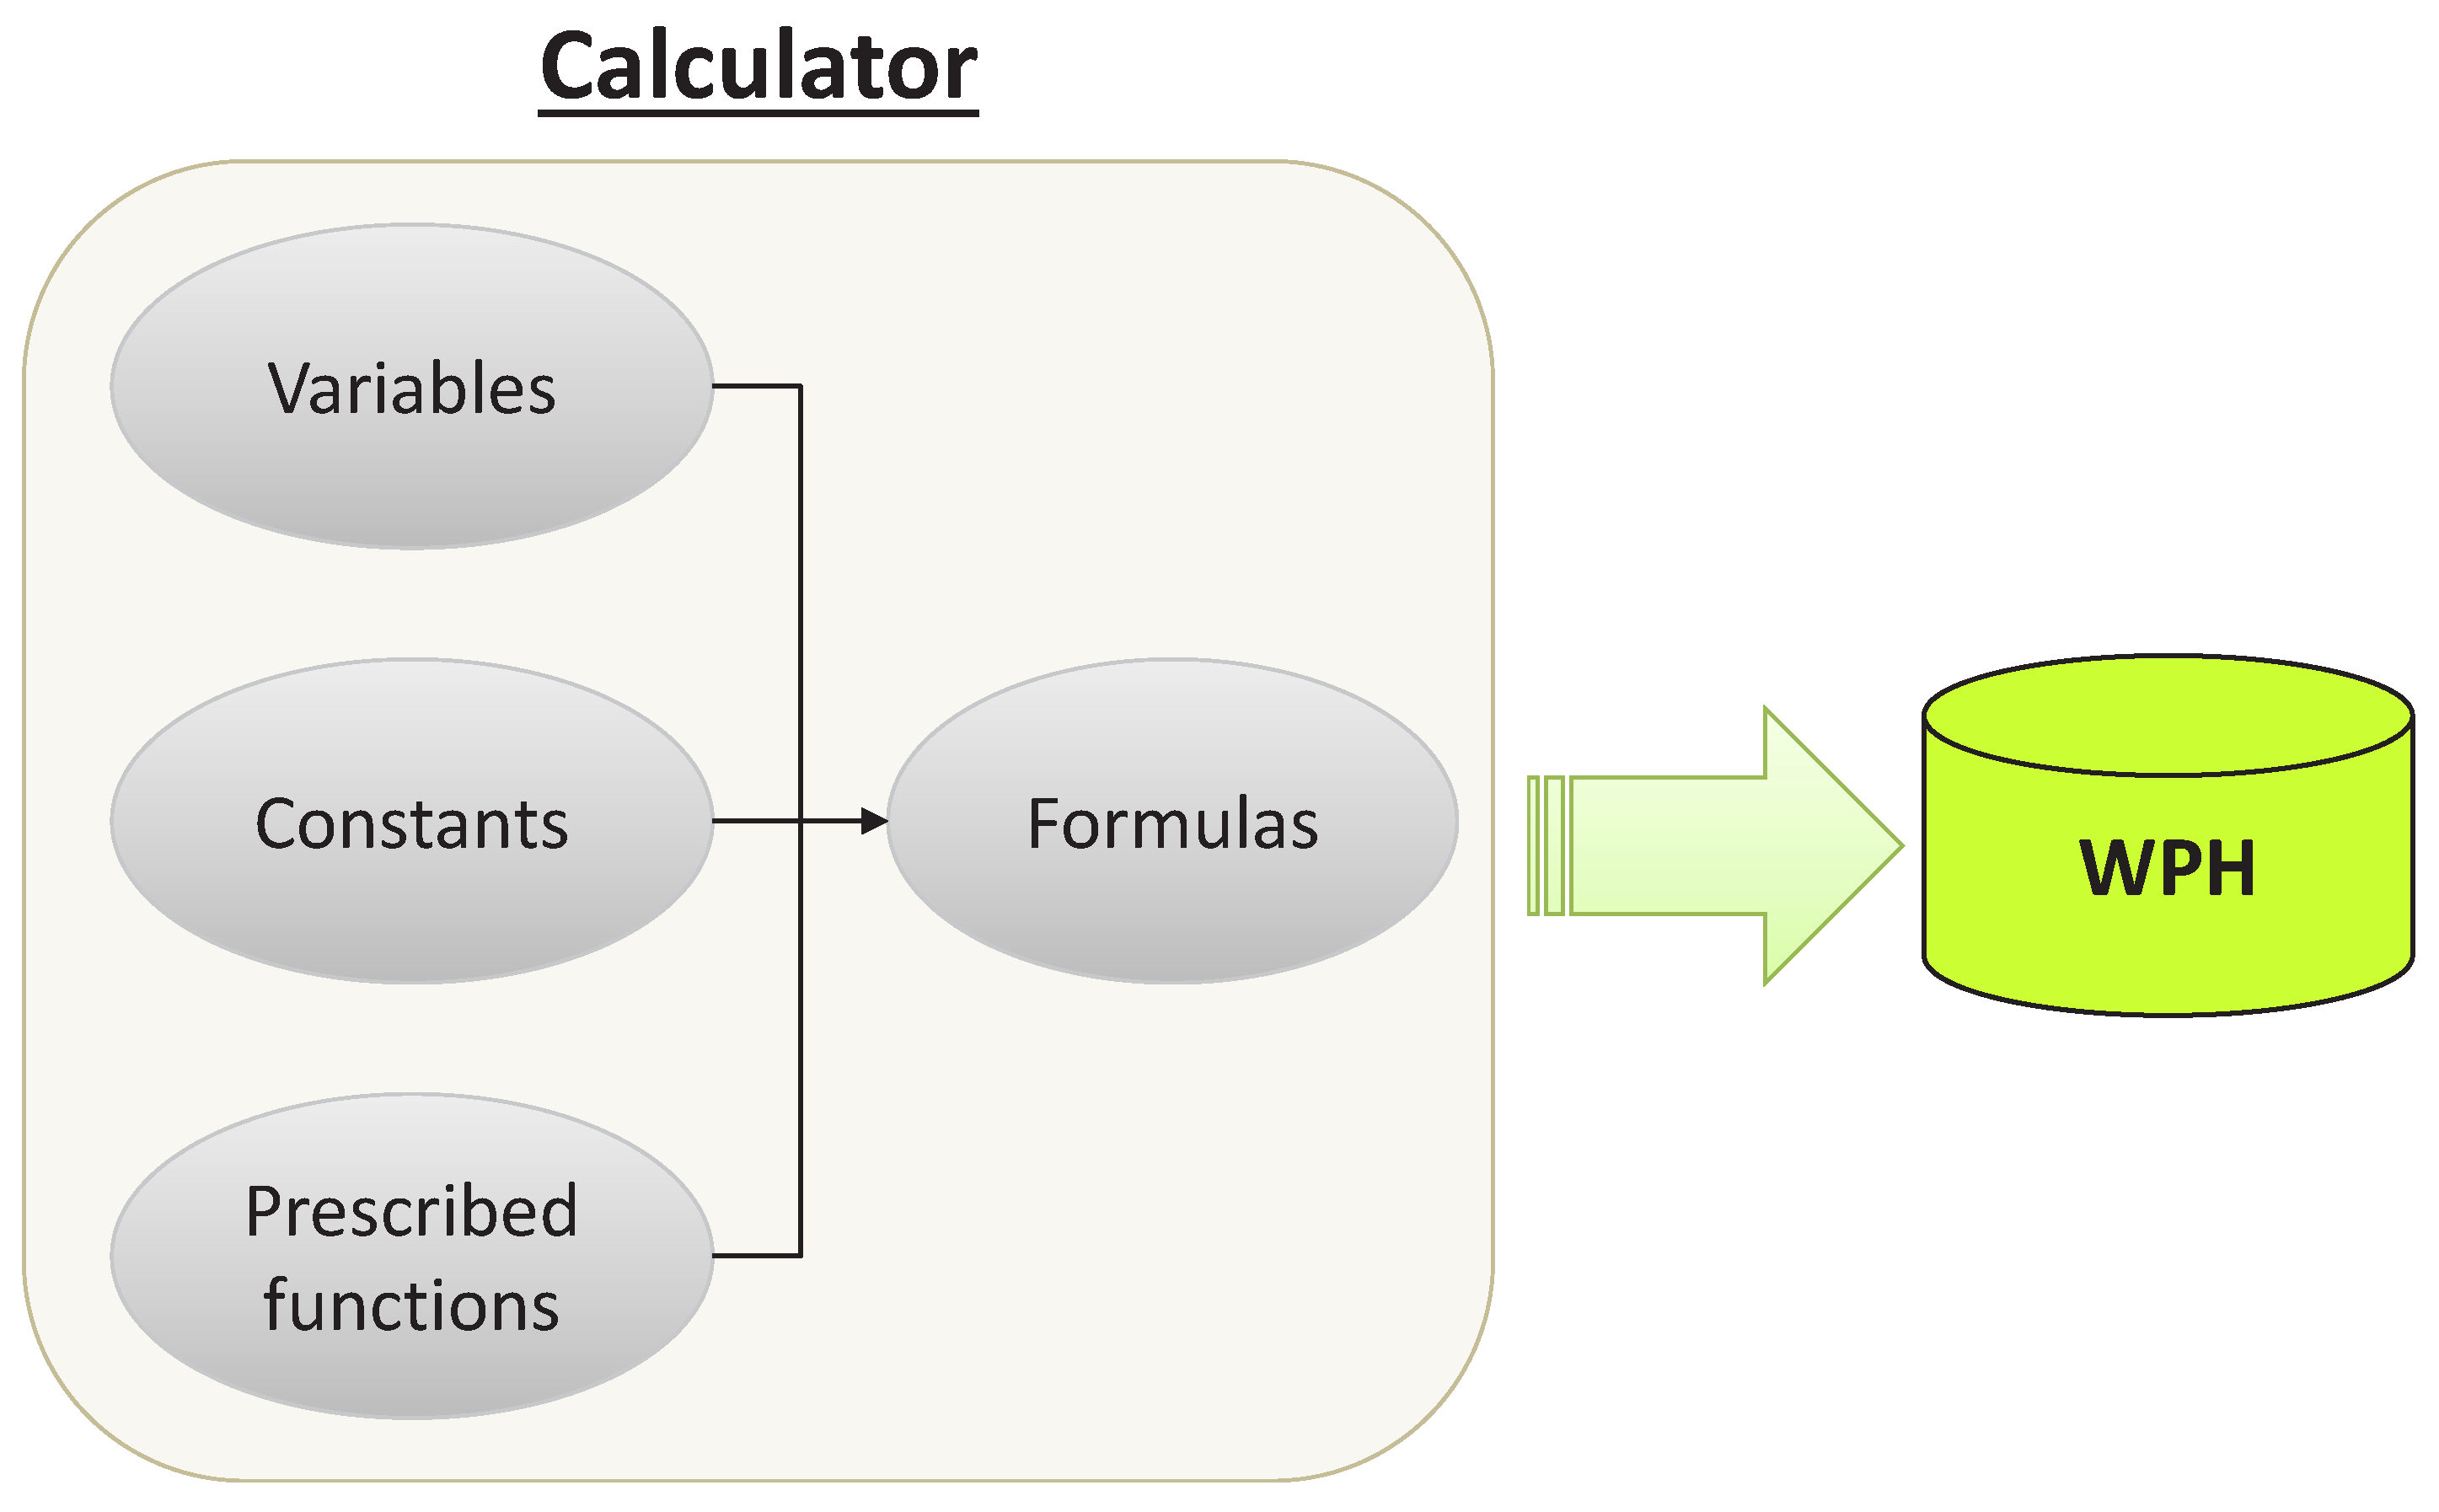
As the core module of this WPH management system, the calculator computes WPH for each recipe weekly. The computation is based on WPH formulas, maintained by users, with collected information from filtered processing data and users. The system allows users to define dedicated formulas of symbolic expressions with a number of prescribed functions and to maintain these formulas by string editing. Each formula is designed for a particular equipment type, which consists of three parts: prescribed functions, constants and variables. Figure 9 demonstrates the basic structure of the calculator module.
Constants are predefined by users, for example batch size, in order to keep the flexibility of formulas. A prescribed function is a predefined procedure to perform a particular mathematical, statistical or logical operation; the system allows a set of essential functions as prescribed functions such as average() for computing the average value and min() for returning the smallest value. Variables are values gathered from processing data such as process start time on a particular process unit in a machine. The computing results are stored in the WPH database, which is accessible by a query interface for users. For a better understanding of the WPH calculation, an example of WPH computing for a photolithography machine is given, and notations for this example are first listed as follows.
| Constants: | |
| batch size (how many wafers in a batch) | |
| maximum number of lots for continued run | |
| maximum lot size (how many wafers in a lot) | |
| Variables: | |
| process start time | |
| process end time | |
| average lot size (how many wafers in a lot on average) | |
| number of parallel units in the process unit group i | |
| average number of wafers passing through the process unit group i | |
| average time for a wafer to stay in the process unit group i | |
| Prescribed functions: | |
| it returns the largest value among input values | |
The formula for peak WPH is defined as:
where takt time, , is:
The formula for plan WPH is defined as:
where slack time, , is:
Takt time was commonly deployed for the planning of the operators’ work content in manufacturing [41]. For semiconductor production equipment units, the most general definition of takt time is the desired time between two sequential lots of a machine output, just like the pace of its processing. Takt time is applied to calculate peak WPH directly, and extra information is required for calculating plan WPH due to the characteristics of integrated processing tools and equipment for batch processing that should be considered.
The estimation of takt time can vary for different equipment types, and it may change while corresponding recipes are revised. In practice, these formulas are derived by practitioners empirically according to their experience and the results of work measurement. Therefore, that is why the system must allow users to define and modify dedicated formulas of symbolic expressions; such flexible functionality is not only for users’ operational convenience, but also a necessary requirement for a rapidly-changing production system.
3.4. Monitor
Since the calculator continuously generates WPH and stores in the WPH database over time, the monitor is capable of monitoring WPH. The monitor module is powered by control charts, which are based on the statistical process control (SPC) to monitor equipment WPH by recipes in order to enhance manufacturing productivity and reliable results of capacity planning. Control charts are very popular in industries, and Montgomery [42] pointed out at least five reasons for this:
- Proven techniques for improving productivity.
- Effectiveness in defect prevention.
- Preventing unnecessary process adjustment.
- Providing diagnostic information.
- Providing information about process capability.
I followed the SPC principles and concepts in Hopp and Spearman [34] to determine the required information of creating control charts, such as the upper limit (UCL)and lower limit (LCL), in order to examine the mean performance of equipment WPH by recipes. Denote as the average actual WPH of recipe r in time bucket p; the required information of a throughput control chart for average WPH of recipe r is listed as follows:
Regarding parameter for control limits, three-sigma away from the centerline is usually found in the literature, but also, corresponding managerial targets are often applied for their determination. Figure 10 is an example of a throughput control chart for average WPH. Control charts enable the observations of trends by recipes just like a kind of pattern recognition for identifying the reason for nonrandom behaviors. Therefore, tests for special-cause variation are conducted by checking a few rules in order to determine if further investigation is necessary for a particular recipe. In the monitor module, these rules are created due to the suggestion in the book by Montgomery [42] with the domain knowledge from practitioners. Table 1 just collects the most basic testing rules because few stricter rules may only apply to recipes for bottleneck tools; Zone 1 is the zone from the centerline to one-sigma above or below the centerline; Zone 2 is the zone from one-sigma to two-sigma above or below the centerline; Zone 3 is the zone from two-sigma to three-sigma above or below the centerline.
For those cases that do not pass any of the above tests, further root cause analysis and identification are required. Therefore, the monitor module is a useful screening tool in which the capacity of analytical tools, e.g., engineering data analysis system, can be reserved for investigating these highly-ranked abnormalities in equipment productivity. In the next section, analytical tools in the analytics module are introduced.
3.5. Analytics
The analytics module is capable of classifying abnormal data into several categories and provides various visual tools for reviewing corresponding historical processing logs. Since the proposed system can record the recipe WPH continuously, applying a data mining technique on its time series data can unearth more information to benefit the capacity management. In addition, each equipment unit may have multiple recipes; hence, conducting data mining on the equipment level becomes a problem with high dimensionality.
To effectively classify abnormal data, a novel symbolic representation of time series called symbolic aggregate approximation (SAX) is adopted. SAX is a transformation technique that is capable of data discretization with a two-step procedure: (1) convert the continuous data into the piecewise aggregate approximation representation; and (2) map the above results into a discrete string representation. The primary advantages of SAX are: (1) allowing dimensionality/numerosity reduction; (2) requiring less storage space; and (3) availing itself of the wealth of algorithms in data mining. For more detail on SAX, please refer to [43,44]. After that, a classifier derived by a K-nearest neighbor method [45], one of the most fundamental and simple classification methods, is applied to classify abnormal recipes; the distance measure selected for this classifier is Euclidean distance.
Since the abnormal classifier will periodically recommend a few high risk recipes for further manual review, four different tools are provided to confirm the abnormality and assist practitioners in finding the root causes. These tools systematically carry out the traditional time-motion study for equipment in Fabs and shorten the time for data collection. In addition, data visualization also increases the job efficiency and efficacy. A brief description of these tools is provided as follows.
3.5.1. What-If Analysis
This tool is developed to answer this kind of question: “what is the impact of a recipe WPH changing the result of the whole capacity planning?” Therefore, this tool not only indicates the potential of the WPH improvement for a recipe, but also estimates the capacity loss from an abnormality in WPH.
3.5.2. Timeline Motion Chart
This chart has two different viewpoints: wafer based and lot based. The former one is developed to show how wafers get processed in passing through process units in a machine. Different positions and lengths of bar pictures are put on a time axis to illustrate the wafers’ arrival time at process units and their corresponding staying duration. Different colors are also applied to identify process units. The latter one is more simple so that it only illustrates when a wafer lot arrived at a machine and how long it stayed.
3.5.3. Gantt Chart
Comparing with the time motion chart, the Gantt chart focuses more on how each process unit is occupied when handling wafers in a row.
4. Industry Project for Implementing the WPH Management System
4.1. Working Procedure
The timescale of this industry project was about two years. Although I focus on the systems design and development in most this article, a brief review of the whole progress of this project is worth giving. Figure 11 is the working procedure of this WPH project, which consists of six stages: preliminary analysis, requirements definition, systems design, systems development, system deployment and acceptance and training.
First, a preliminary analysis is necessary to find out the objectives of the case Fab by interviewing employees after investigating the operations. Alternative solutions may be discussed, and eventually, the concept proposal with the feasibility study is generated. Second, the requirements definition ensures that the project scope is defined. Based on the previous concept proposal, the in-depth functions are analyzed. The system analysis is also conducted for further cost-benefit analysis and budget estimation. After that, an initial timetable for the follow-on jobs is created.
The third stage, systems design, is to break up the intent functions and features into details; whether invisible parts like operational logic design or visible parts like user interface design. Once the overall designs are ready, the project goes to the stage of systems development. In the beginning, various tasks are allocated to a few developers for program coding; then, a series verification is conducted to confirm the consistency between the designs and functional programs; final, a system verification is employed after functions’ integration. If there is nothing wrong at this stage, it is time to leave the development environment and move on to the next stage.
The fifth stage begins with the system installation and then integrates this system with the current information technology environment. Next, system validation is mandatory to ensure the actual system performance, and the stability testing is also crucial to confirm that the proposed system is a sustainable solution. In the last stage, the acceptance criteria are reviewed, and related documents, e.g., database specifications and operational guidebooks, are created and transferred to customers. The whole project will end by completing the user training. In the following sections, the selected details of this project are discussed.
4.2. System Deployment
System deployment is entirely different from just software installation; it is the converting process that phases out the previous related operations and switches to the developed system. In general, the period of parallel running is necessary for evaluating the stability of the developed system in practice. That is, the case company still counts on their existing practices for WPH management while the developed system has been put into operation. Once the system validation and stability testing are passed, users will depend solely on the new system.
Although this kind of dual-system mechanism ensures a reliable environment for system validation, it is very costly to run for an extended period. Next, a few suggestions are provided to avoid an overly long period of parallel running.
4.2.1. Effective System Verification
In the stage of systems development, the system verification is applied to check the consistency between the designs and functional programs. However, in practice, some errors are found during the system deployment, and this will increase the difficulty of system validation. The system validation will be asked to start over if any of these errors is found during the system deployment. Indeed, if more than one error is found sequentially, the repeated validation process is absolutely a time killer for the project. An effective system verification, in sum, is required before starting the system’s deployment.
4.2.2. Preparation of Job Arrangement
During the period of parallel running, the workload of practitioners is expected to be increased, and thus, the feasibility study in the stage of preliminary analysis will take this issue into account. Then, the budget estimation at the stage of requirements definition will also consider this increasing workload in the future. However, because of the long cycle time of a large-scale system development project, the original job arrangement plan and schedule may be out-of-date. Therefore, a continuous update to the job arrangement is the key to prevent the available time of experienced employees from becoming the bottleneck of the system deployment.
4.2.3. Data Validation and Exception Handling
Since the data requirements of the WPH management system are fulfilled by existing CIM-related systems such as MES, the output data formats of these systems are considered to determine the input data specification in the stage of the system’s design. Unfortunately, during the system validation, many nonsense errors are found because receiving an undefined data format leads to meaningless, ridiculous or misleading computing results; sometimes, this situation can also happen when the system has gone live.
In order to avoid that this kind of mistake delays the project, firstly, the input data specification should be based on the database specification of those CIM-related systems, rather than only on the observation of the output data sample; if any of those systems lacks the database specification to ensure its output data format will match the input data specification of the developed WPH management system, extra efforts for fixing this problem are required. Secondly, even though input/output data validation between those CIM systems and the proposed system has been carried out, the ability of the exception handling is better when attached to the WPH management system. The fundamental principle is that practitioners would rather perform troubleshooting after receiving the system notifications than obtaining misleading data and reports.
4.3. System Maintenance
For a product with a level of wafer start at 10,000 pieces monthly, assume its product cycle time is 60 days for the overall 700 processing steps. There are over seven million new records written into the WPH database after the processing of the filter. Therefore, in order to retain a satisfactory operational efficiency for the proposed WPH management system, a suitable data scrubbing and backup schedule are necessary.
4.4. System Impact, Efficiency and Performance
In semiconductor wafer Fabs, maintaining the dataset of WPH at the recipe level is very time consuming, but necessary. In order to perform better capacity management, up-to-date and accurate throughput estimation, WPH is critical for all kinds of capacity planning and scheduling. This project implements the proposed WPH management system, which effectively and efficiently relieves the workforce of the experienced employees and places it on the troubleshooting and WPH enhancement with the help of the monitor and analytics modules.
Since the system’s deployment adopts parallel running for system validation, the author also has the chance to evaluate the performance of the proposed system by comparing with the old one. In order to do so, a conceptual capacity allocation model is introduced for the performance comparison, and the indices, parameters and decision variables, which are used in the optimization model, are introduced first:
| Indices: | |
| product | |
| process step of product i | |
| machine | |
| time bucket | |
| Parameters: | |
| demand of product i in bucket b | |
| minimum fulfillment of product i in bucket b | |
| available capacity of machine r in bucket b (express in time) | |
| unit processing time of machine r serving step s of product i | |
| unit selling price of product i in bucket b | |
| unit cost of product i in bucket b | |
| Decision variables: | |
| allocated quantity of product i in bucket b | |
| plan production quantity of product i at step s using machine r in bucket b | |
Now, the capacity allocation problem can be formulated as follows:
The objective function (1) to be maximized is the sum of the allocated production quantity over the planning horizon. Ideally, the available capacity of each machine should be transformed into corresponding plan production quantity. The capacity restriction for each machine among phases is formulated by constraints (2). Constraint (3) ensures the planned profit is positive. Constraints (4) and (5) limit the allocation quantity to be between the minimum requirement and demand. Constraint (6) forces the result of job assignment to be equal to the allocation quantity.
The goal of this capacity allocation model is to maximize the total allocation quantity with limited capacity while satisfying the minimum requirement from customers’ demand.
Based on the planning result, the overall utilization of each machine group f can be computed as follows:
where . Generally, machines belonging to the same machine group have the same process functionality. In addition, when the definition of the unit processing time, , is how many hours are required for processing a piece of wafer, its reciprocal would be the WPH, i.e., . Obviously, WPH estimated by the old system and the new system may lead to different planning results; the correlation coefficient between the planned overall utilization of the machine group and the actual one is selected as the performance measure for the performance comparison.
During the period of parallel running, the product demand and the minimum fulfillment are fixed. Two different periods are selected for performance evaluation, and the corresponding warm-up period is applied to each of them to eliminate the impacts from different wafer start controls. Figure 12 illustrates the period of parallel running and the purposes of each time slot. On the one hand, the WPH estimated for capacity allocation planning is provided by the old system in Time Slot 2, and the Pearson correlation coefficient, r, between planned utilization and actual utilization is 0.6548. On the other hand, when this planning adopted the WPH provided by the new system, the corresponding r is 0.9587. The value of r representing the degree of linear correlation is between ; 0 is no linear correlation, and 1 and −1 are total positive linear correlation and negative linear correlation, respectively. Significantly, the inaccurate WPH provided by the old system leads to an unfortunate planning result, and the new one can better improve the performance of capacity allocation planning.
Regarding production quantity, although both natural randomness in the wafer Fab and the capability limit of the static capacity planning model could produce an estimate with errors because it is almost impossible to account for all information, the comparison between planning results and observed results can still provide insightful information on the performance of the proposed solution. In order to evaluate the difference between the planning results, i.e., plan production quantity, and observed results, i.e., actual production quantity, the mean squared error (MSE) of production quantity is adopted. Please note that since each planning result is a predicted value here, it is named as , and represents the observed result collected from historical data. The MSE of production quantity is computed as:
and MSE of the old system and new system are 4614.96 and 2834.88, respectively. The new system performs much better to shorten the gap between planning and observed results. In addition, the author would like to mention the planning result of allocated quantity here. The sum of allocated quantity during Time Slot 4 is 4% greater than the one during Time Slot 2 on average. This shows that the new system has the potential to benefit the case wafer through increasing the quantity of wafer-out.
5. Conclusions
This article introduces the proposed WPH management system for semiconductor wafer Fabs, which is capable of estimating and monitoring equipment WPH by recipes in a sustainable manner. Advanced data analytics with supporting tools further benefits the WPH enhancement and capacity management. The system architecture and design are very generic for almost every Fab; the filtering rules are adjustable by the needs of the production systems; the calculation logics can be edited while any modification of equipment software and hardware is made. An industry project is also introduced and discussed. Providing better accuracy of WPH calculation and estimation, the implemented system eliminates related routine jobs of experienced employees in the case Fab and turns this reserved workforce into more valuable analytical work, such as troubleshooting and WPH enhancement. Therefore, it helps to unearth more problems for throughput stabilization and further capacity improvement. In addition, this kind of PDCA cycle can in a sustainable manner enhance the reliability of all sorts of capacity planning, such as resource requirements planning, rough-cut capacity planning and capacity requirements planning. With this solid base of reliable WPH data, the performance of simulation-based methodologies can be further improved because the system characteristics and features can be captured even better by the simulation model. In sum, this system would be the cornerstone of capacity and operations management to keep contributing to the business goals of the case company.
Acknowledgments
This research is supported by GiantSoft, Taiwan.
Author Contributions
Tsung-Ju Hsieh designed the proposed systems and analyzed the experimental data; Liam Y. Hsieh coordinated this study and wrote the paper.
Conflicts of Interest
The authors declare no conflict of interest.
References
- Groover, M. Work Systems and the Methods, Measurement, and Management of Work; Pearson Prentice Hall: Upper Saddle River, NJ, USA, 2007. [Google Scholar]
- Krajewski, L.J.; Ritzman, L.P.; Malhotra, M.K. Operations Management; Addison-Wesley: Singapore, 1999. [Google Scholar]
- Newboe, B. Cluster tools: A process solution. Semicond. Int. 1990, 13, 82–88. [Google Scholar]
- Burggraaf, P. Coping with the high cost of wafer fabs. Semicond. Int. 1995, 18, 45–54. [Google Scholar]
- Singer, P. The driving forces in cluster tool development. Semicond. Int. 1995, 18, 113–118. [Google Scholar]
- Wu, N.Q.; Zhou, M.; Chu, F.; Mammar, S. Modeling, Analysis, Scheduling, and Control of Cluster Tools in Semiconductor Fabrication. Contemp. Issues Syst. Sci. Eng. 2015, 289–315. [Google Scholar] [CrossRef]
- Wood, S.C. Simple performance models for integrated processing tools. IEEE Trans. Semicond. Manuf. 1996, 9, 320–328. [Google Scholar] [CrossRef]
- Kim, J.H.; Lee, T.E.; Lee, H.Y.; Park, D.B. Scheduling analysis of time-constrained dual-armed cluster tools. IEEE Trans. Semicond. Manuf. 2003, 16, 521–534. [Google Scholar] [CrossRef]
- Zuberek, W.M. Cluster tools with chamber revisiting-modeling and analysis using timed Petri nets. IEEE Trans. Semicond. Manuf. 2004, 17, 333–344. [Google Scholar] [CrossRef]
- Morrison, J.R.; Martin, D.P. Performance evaluation of photolithography cluster tools. OR Spectr. 2007, 29, 375–389. [Google Scholar] [CrossRef]
- Yang, K.T.; Huang, E.; Ke, L.; Shen, T. Throughput evaluation model for the linear platform in semiconductor manufacturing. In Proceedings of the 27th Annual IEEE SEMI Advanced Semiconductor Manufacturing Conference (ASMC), Saratoga Springs, NY, USA, 16–19 May 2016; pp. 435–439. [Google Scholar]
- Semiconductor Equipment and Materials International (SEMI). E10 Specification for Definition and Measurement of Equipment Reliability, Availability, and Maintainability (RAM); Semiconductor Equipment and Materials International: San Jose, CA, USA, 2009. [Google Scholar]
- Semiconductor Equipment and Materials International (SEMI). E79 Standard for Definition and Measurement of Equipment Productivity; Semiconductor Equipment and Materials International: San Jose, CA, USA, 2006. [Google Scholar]
- De Ron, A.J.; Rooda, J.E. Equipment effectiveness: OEE revisited. IEEE Trans. Semicond. Manuf. 2005, 18, 190–196. [Google Scholar] [CrossRef]
- Sheu, D.D. Overall input efficiency and total equipment efficiency. IEEE Trans. Semicond. Manuf. 2006, 19, 496–501. [Google Scholar] [CrossRef]
- Muthiah, K.; Huang, S. Overall throughput effectiveness (OTE) metric for factory-level performance monitoring and bottleneck detection. Int. J. Prod. Res. 2007, 45, 4753–4769. [Google Scholar] [CrossRef]
- Chien, C.F.; Chen, H.K.; Wu, J.Z.; Hu, C.H. Constructing the OGE for promoting tool group productivity in semiconductor manufacturing. Int. J. Prod. Res. 2007, 45, 509–524. [Google Scholar] [CrossRef]
- Chien, C.F.; Hsu, C.Y.; Chang, K.H. Overall wafer effectiveness (OWE): A novel industry standard for semiconductor ecosystem as a whole. Comput. Ind. Eng. 2013, 65, 117–127. [Google Scholar] [CrossRef]
- Alblas, A.; Wortmann, J. Managing large engineering changes: The case of a high-tech microlithography equipment manufacturer. Int. J. Oper. Prod. Manag. 2012, 32, 1252–1280. [Google Scholar] [CrossRef]
- Wu, K.; Zhao, N.; Lee, C. Queue time approximations for a cluster tool with job cascading. IEEE Trans. Autom. Sci. Eng. 2016, 13, 1200–1206. [Google Scholar] [CrossRef]
- Deming, W.E. Out of the Crisis; Massachusetts Institute of Technology, Center for Advanced Engineering Study: Cambridge, MA, USA, 1986; Volume 510. [Google Scholar]
- Lange, J.; Schmidt, K.; Borner, R.; Rose, O. Automated generation and parameterization of throughput models for semiconductor tools. In Proceedings of the IEEE Winter Simulation Conference WSC 2008, Miami, FL, USA, 7–10 December 2008; pp. 2335–2340. [Google Scholar]
- Chen, W.T.; Lin, P.C.; Wu, T.W. A Scanner Throughput Monitoring System (STMS) for continuously improving litho-cluster productivity. In Proceedings of the 2008 IEEE International Symposium on Semiconductor Manufacturing (ISSM), Tokyo, Japan, 27–29 October 2008; pp. 155–158. [Google Scholar]
- Kohn, R.; Werner, S. Automated semiconductor equipment modeling and model parameter estimation using MES data. In Proceedings of the IEEE/SEMI Advanced Semiconductor Manufacturing Conference (ASMC), San Francisco, CA, USA, 11–13 July 2010; pp. 11–16. [Google Scholar]
- Kohn, R.; Rose, O. Automated generation of analytical process time models for cluster tools in semiconductor manufacturing. In Proceedings of the Winter Simulation Conference, Phoenix, AZ, USA, 11–14 December 2011; pp. 1808–1820. [Google Scholar]
- Kalir, A.A.; Nahum, Y.; Sharon, A. Hidden Equipment Productivity Opportunities in Semiconductor Fabrication Operations. IEEE Trans. Semicond. Manuf. 2013, 26, 448–453. [Google Scholar] [CrossRef]
- Yu, H.C.; Lin, K.Y.; Chien, C.F. Hierarchical indices to detect equipment condition changes with high dimensional data for semiconductor manufacturing. J. Intell. Manuf. 2014, 25, 933–943. [Google Scholar] [CrossRef]
- Lange, J.; Klemmt, A.; Weigert, G. Generic visualization of technological process flows. In Proceedings of the IEEE 32nd International Spring Seminar on Electronics Technology, Brno, Czech Republic, 13–17 May 2009; pp. 1–5. [Google Scholar]
- Jauhri, A.; McDanel, B.; Connor, C. Outlier detection for large scale manufacturing processes. In Proceedings of the 2015 IEEE International Conference on Big Data (Big Data), Santa Clara, CA, USA, 29 October–1 November 2015; pp. 2771–2774. [Google Scholar]
- May, G.; Sze, S. Fundamentals of Semiconductor Fabrication; Wiley: Hoboken, NJ, USA, 2003. [Google Scholar]
- Whyte, W. Cleanroom Design; Wiley Online Library: Hoboken, NJ, USA, 1999. [Google Scholar]
- Bodner, D.A.; Reveliotis, S.A.; Billings, R.L. Flexible semiconductor manufacturing. In Wiley Encyclopedia of Electrical and Electronics Engineering; Wiley Online Library: Hoboken, NJ, USA, 1999. [Google Scholar]
- Mattox, D. Handbook of Physical Vapor Deposition (PVD) Processing; Elsevier Science: Amsterdam, The Netherlands, 2010. [Google Scholar]
- Hopp, W.; Spearman, M. Factory Physics: Third Edition; Waveland Press: Long Grove, IL, USA, 2011. [Google Scholar]
- Goodlin, B. Multivariate Endpoint Detection of Plasma Etching Processes; Massachusetts Institute of Technology, Department of Chemical Engineering: Cambridge, MA, USA, 2002. [Google Scholar]
- Van Roosmalen, A.; Baggerman, J.; Brader, S. Dry Etching for VLSI; Updates in Applied Physics and Electrical Technology; Springer: Berlin, Germany, 2013. [Google Scholar]
- Posseme, N. Plasma Etching Processes for Interconnect Realization in VLSI; Elsevier Science: Amsterdam, The Netherlands, 2015. [Google Scholar]
- Diebold, A. Handbook of Silicon Semiconductor Metrology; CRC Press: Boca Raton, FL, USA, 2001. [Google Scholar]
- May, G.S.; Spanos, C.J. Fundamentals of Semiconductor Manufacturing and Process Control; John Wiley & Sons: Hoboken, NJ, USA, 2006. [Google Scholar]
- Nishi, Y.; Doering, R. Handbook of Semiconductor Manufacturing Technology, 2nd ed.; CRC Press: Boca Raton, FL, USA, 2007. [Google Scholar]
- Monden, Y. Toyota Production System: An Integrated Approach to Just-in-Time; CRC Press: Boca Raton, FL, USA, 2011. [Google Scholar]
- Montgomery, D.C. Introduction to Statistical Quality Control; John Wiley & Sons: New York, NY, USA, 2009. [Google Scholar]
- Lin, J.; Keogh, E.; Lonardi, S.; Chiu, B. A symbolic representation of time series, with implications for streaming algorithms. In Proceedings of the 8th ACM SIGMOD Workshop on Research Issues in Data Mining and Knowledge Discovery, San Diego, CA, USA, 13 June 2003; pp. 2–11. [Google Scholar]
- Lin, J.; Keogh, E.; Wei, L.; Lonardi, S. Experiencing SAX: A novel symbolic representation of time series. Data Min. Knowl. Discov. 2007, 15, 107–144. [Google Scholar] [CrossRef]
- Larose, D.T. K-nearest neighbor algorithm. In Discovering Knowledge in Data: An Introduction to Data Mining; John Wiley & Sons: New York, NY, USA, 2005; pp. 90–106. [Google Scholar]
Figure 1.
Abstract process flow of typical semiconductor manufacturing.
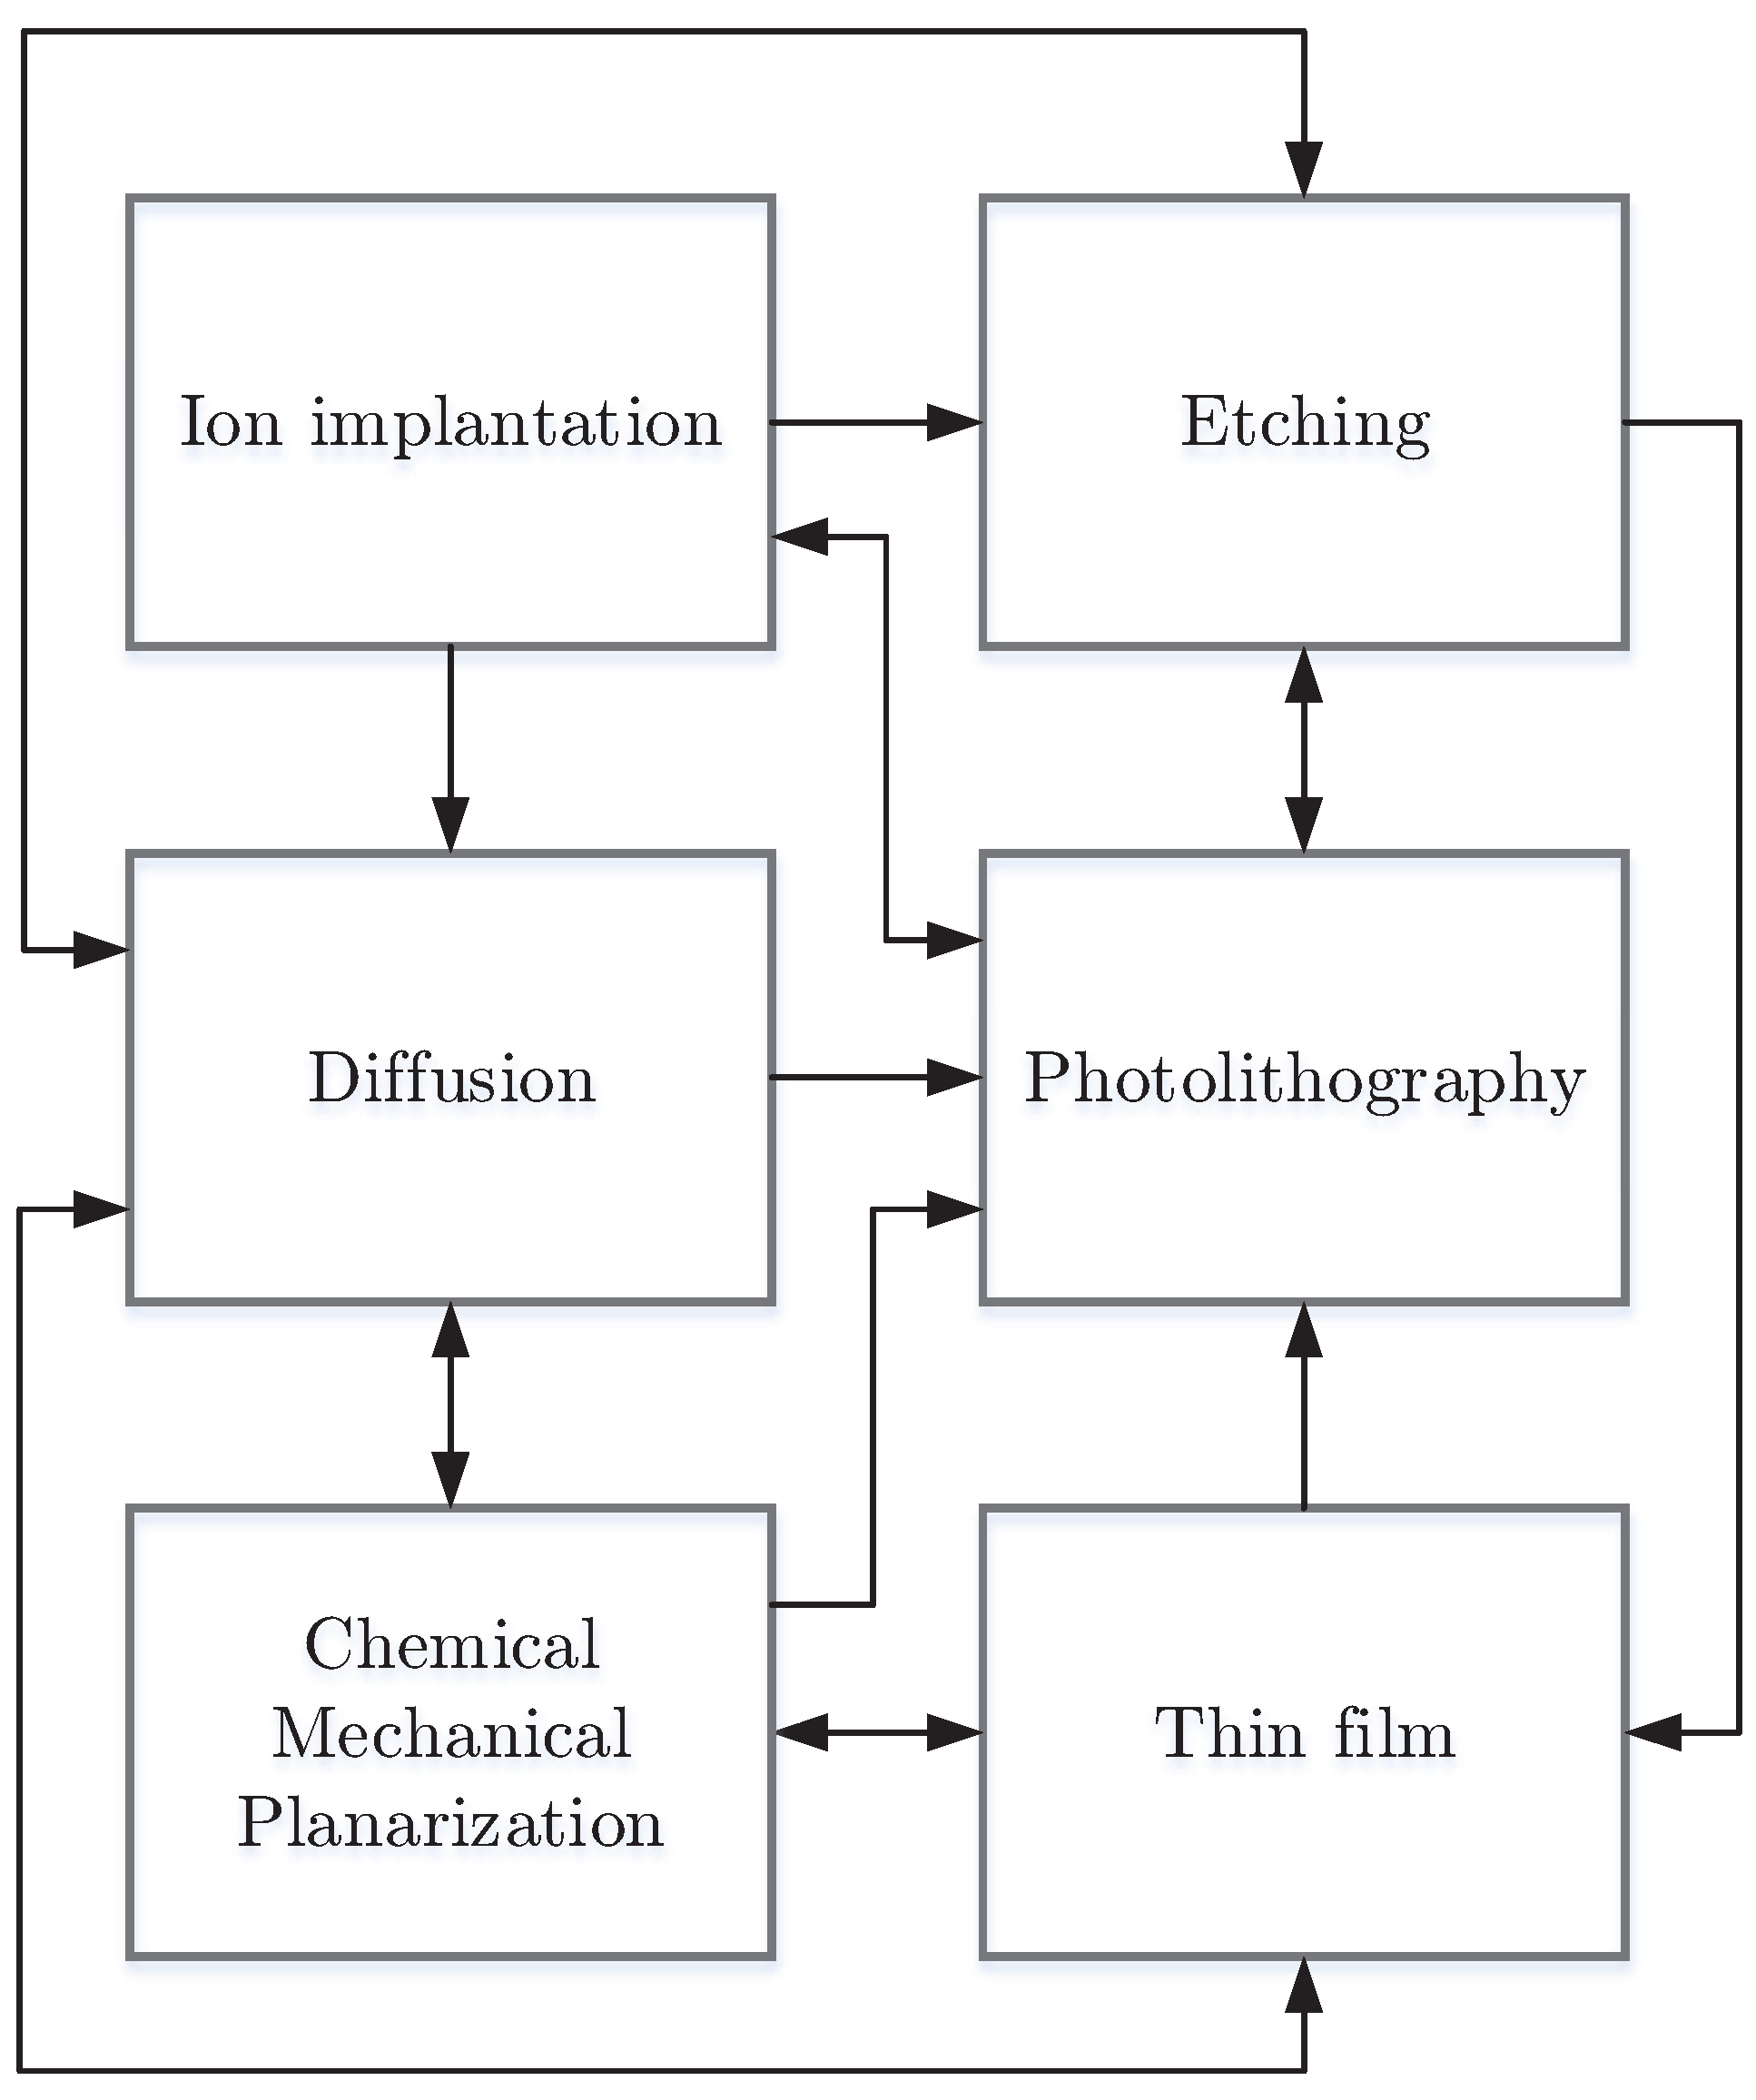
Figure 2.
Example schematics of integrated processing tools.
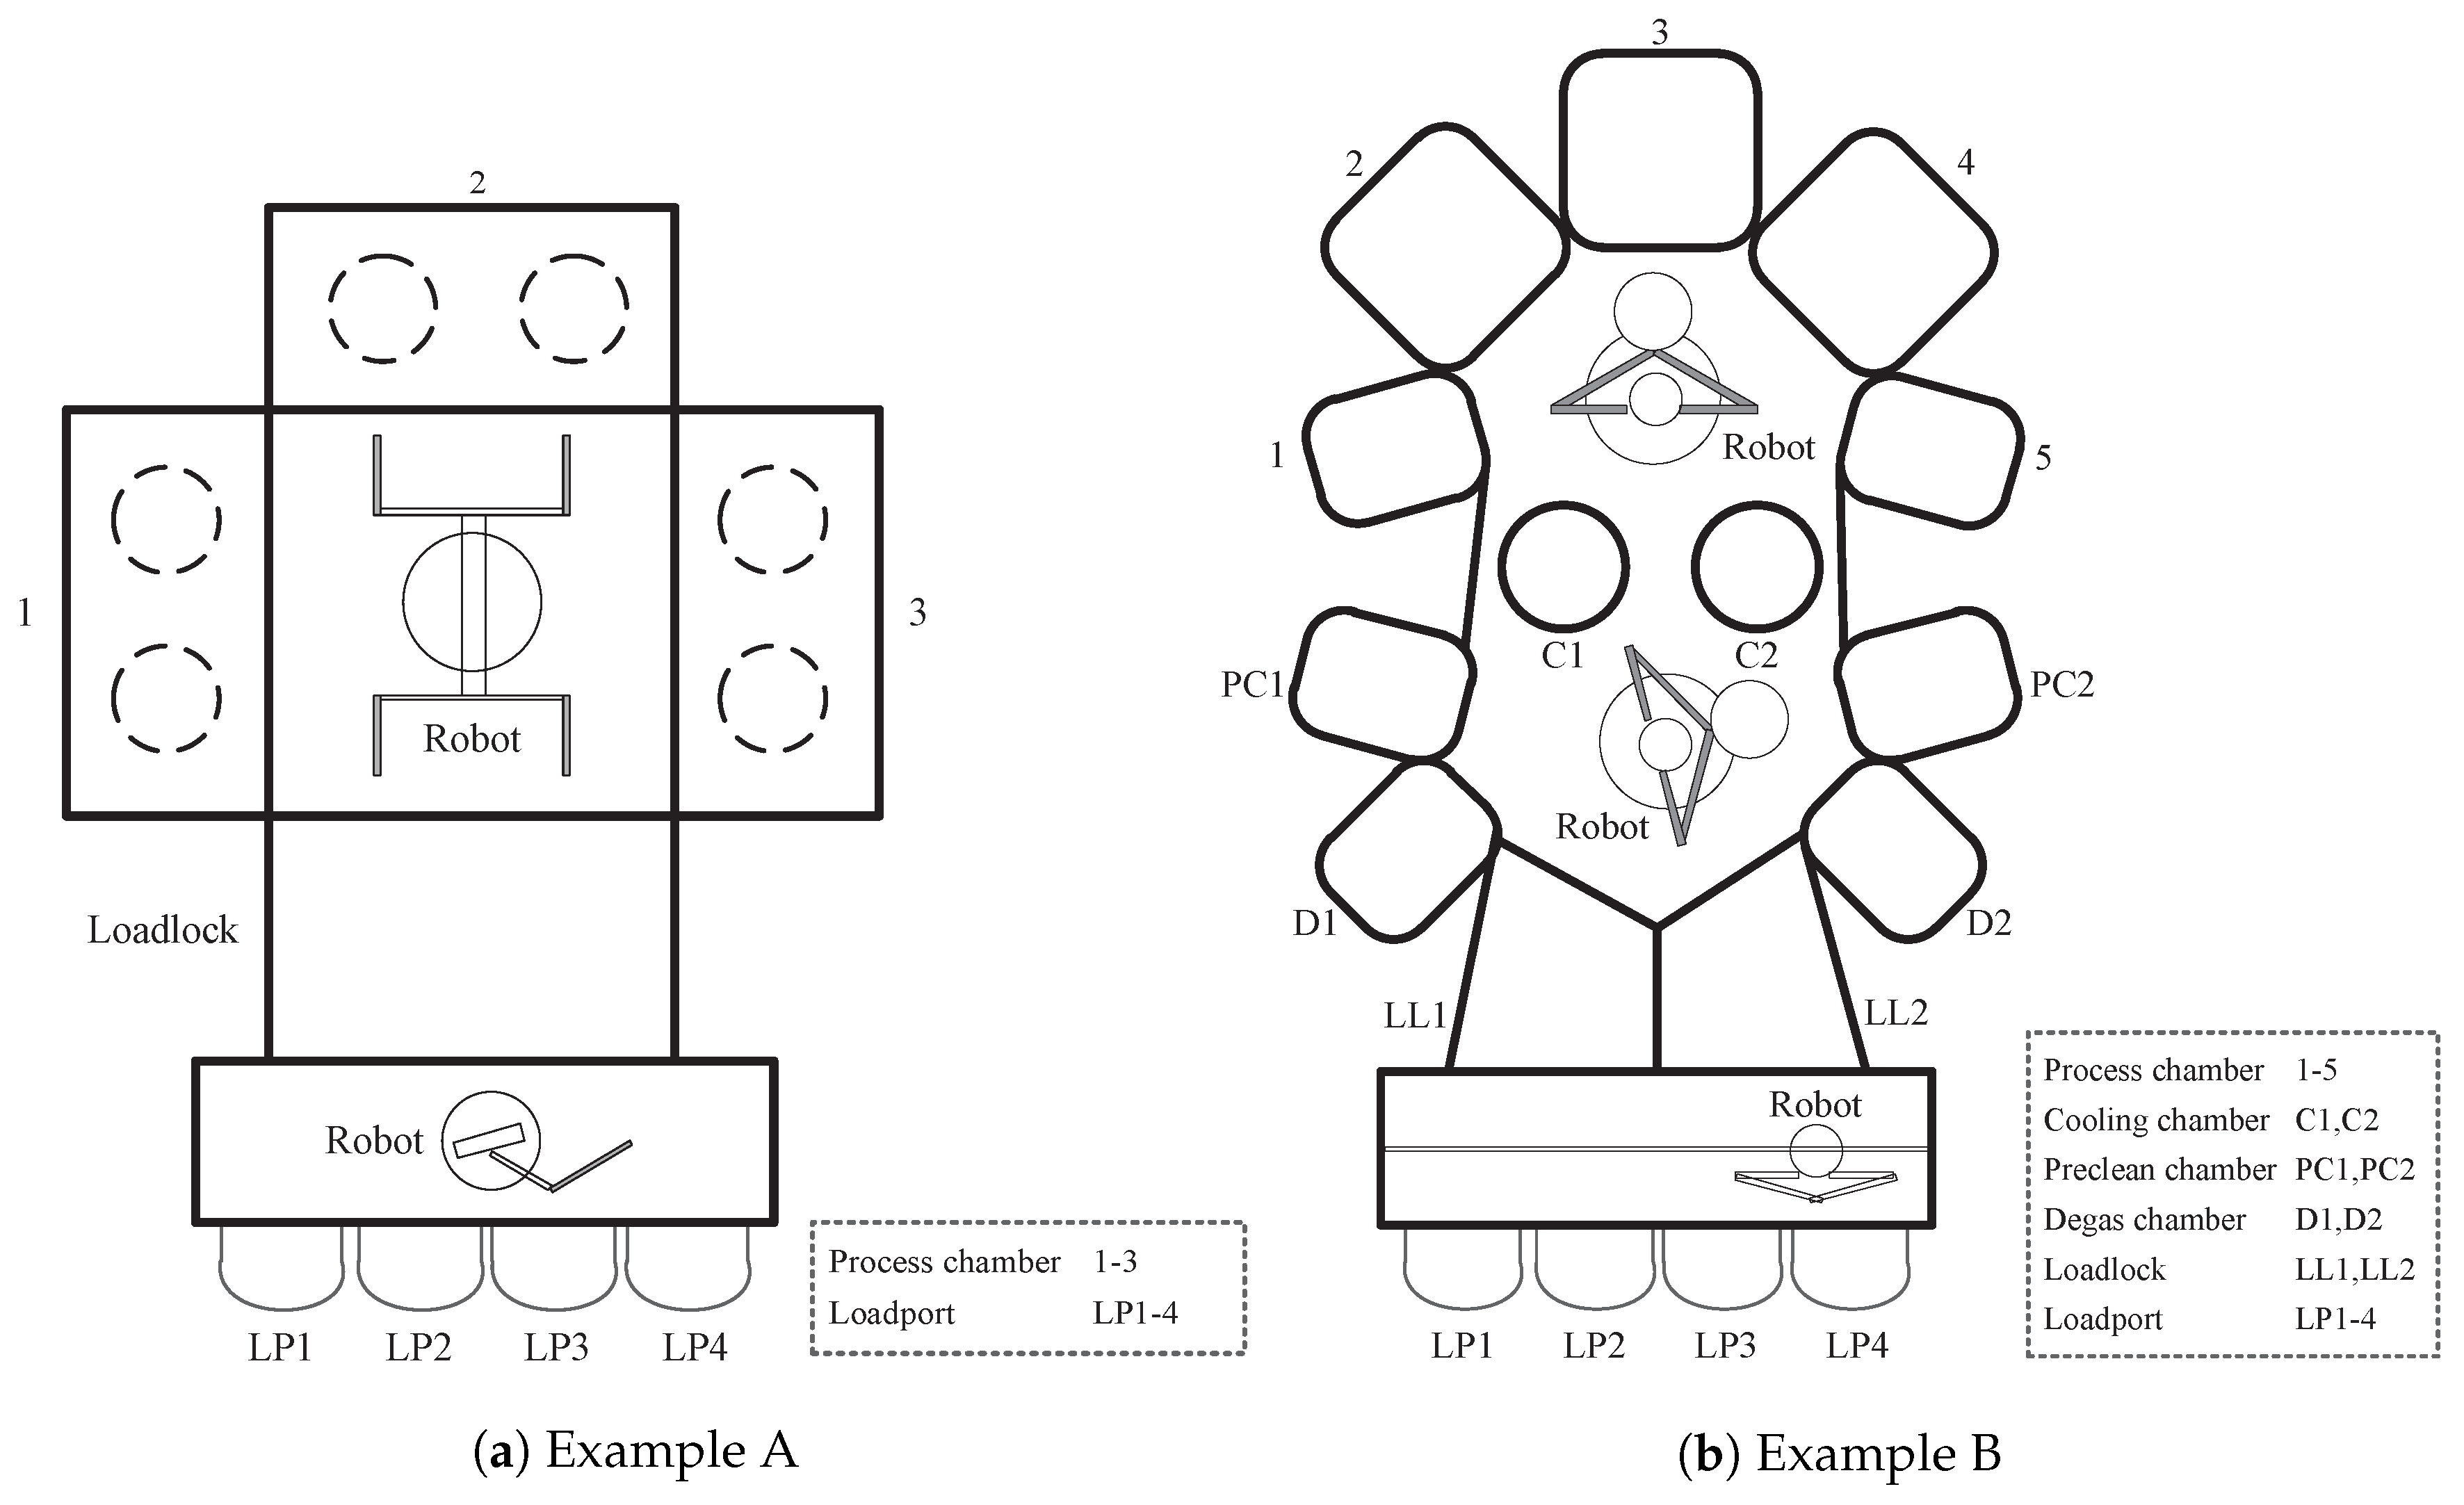
Figure 3.
An illustration of batch processing between serial and parallel modes.

Figure 4.
Completion levels of the plasma etching process.

Figure 5.
Illustration of capacity improvement. WPH, wafer per hour.
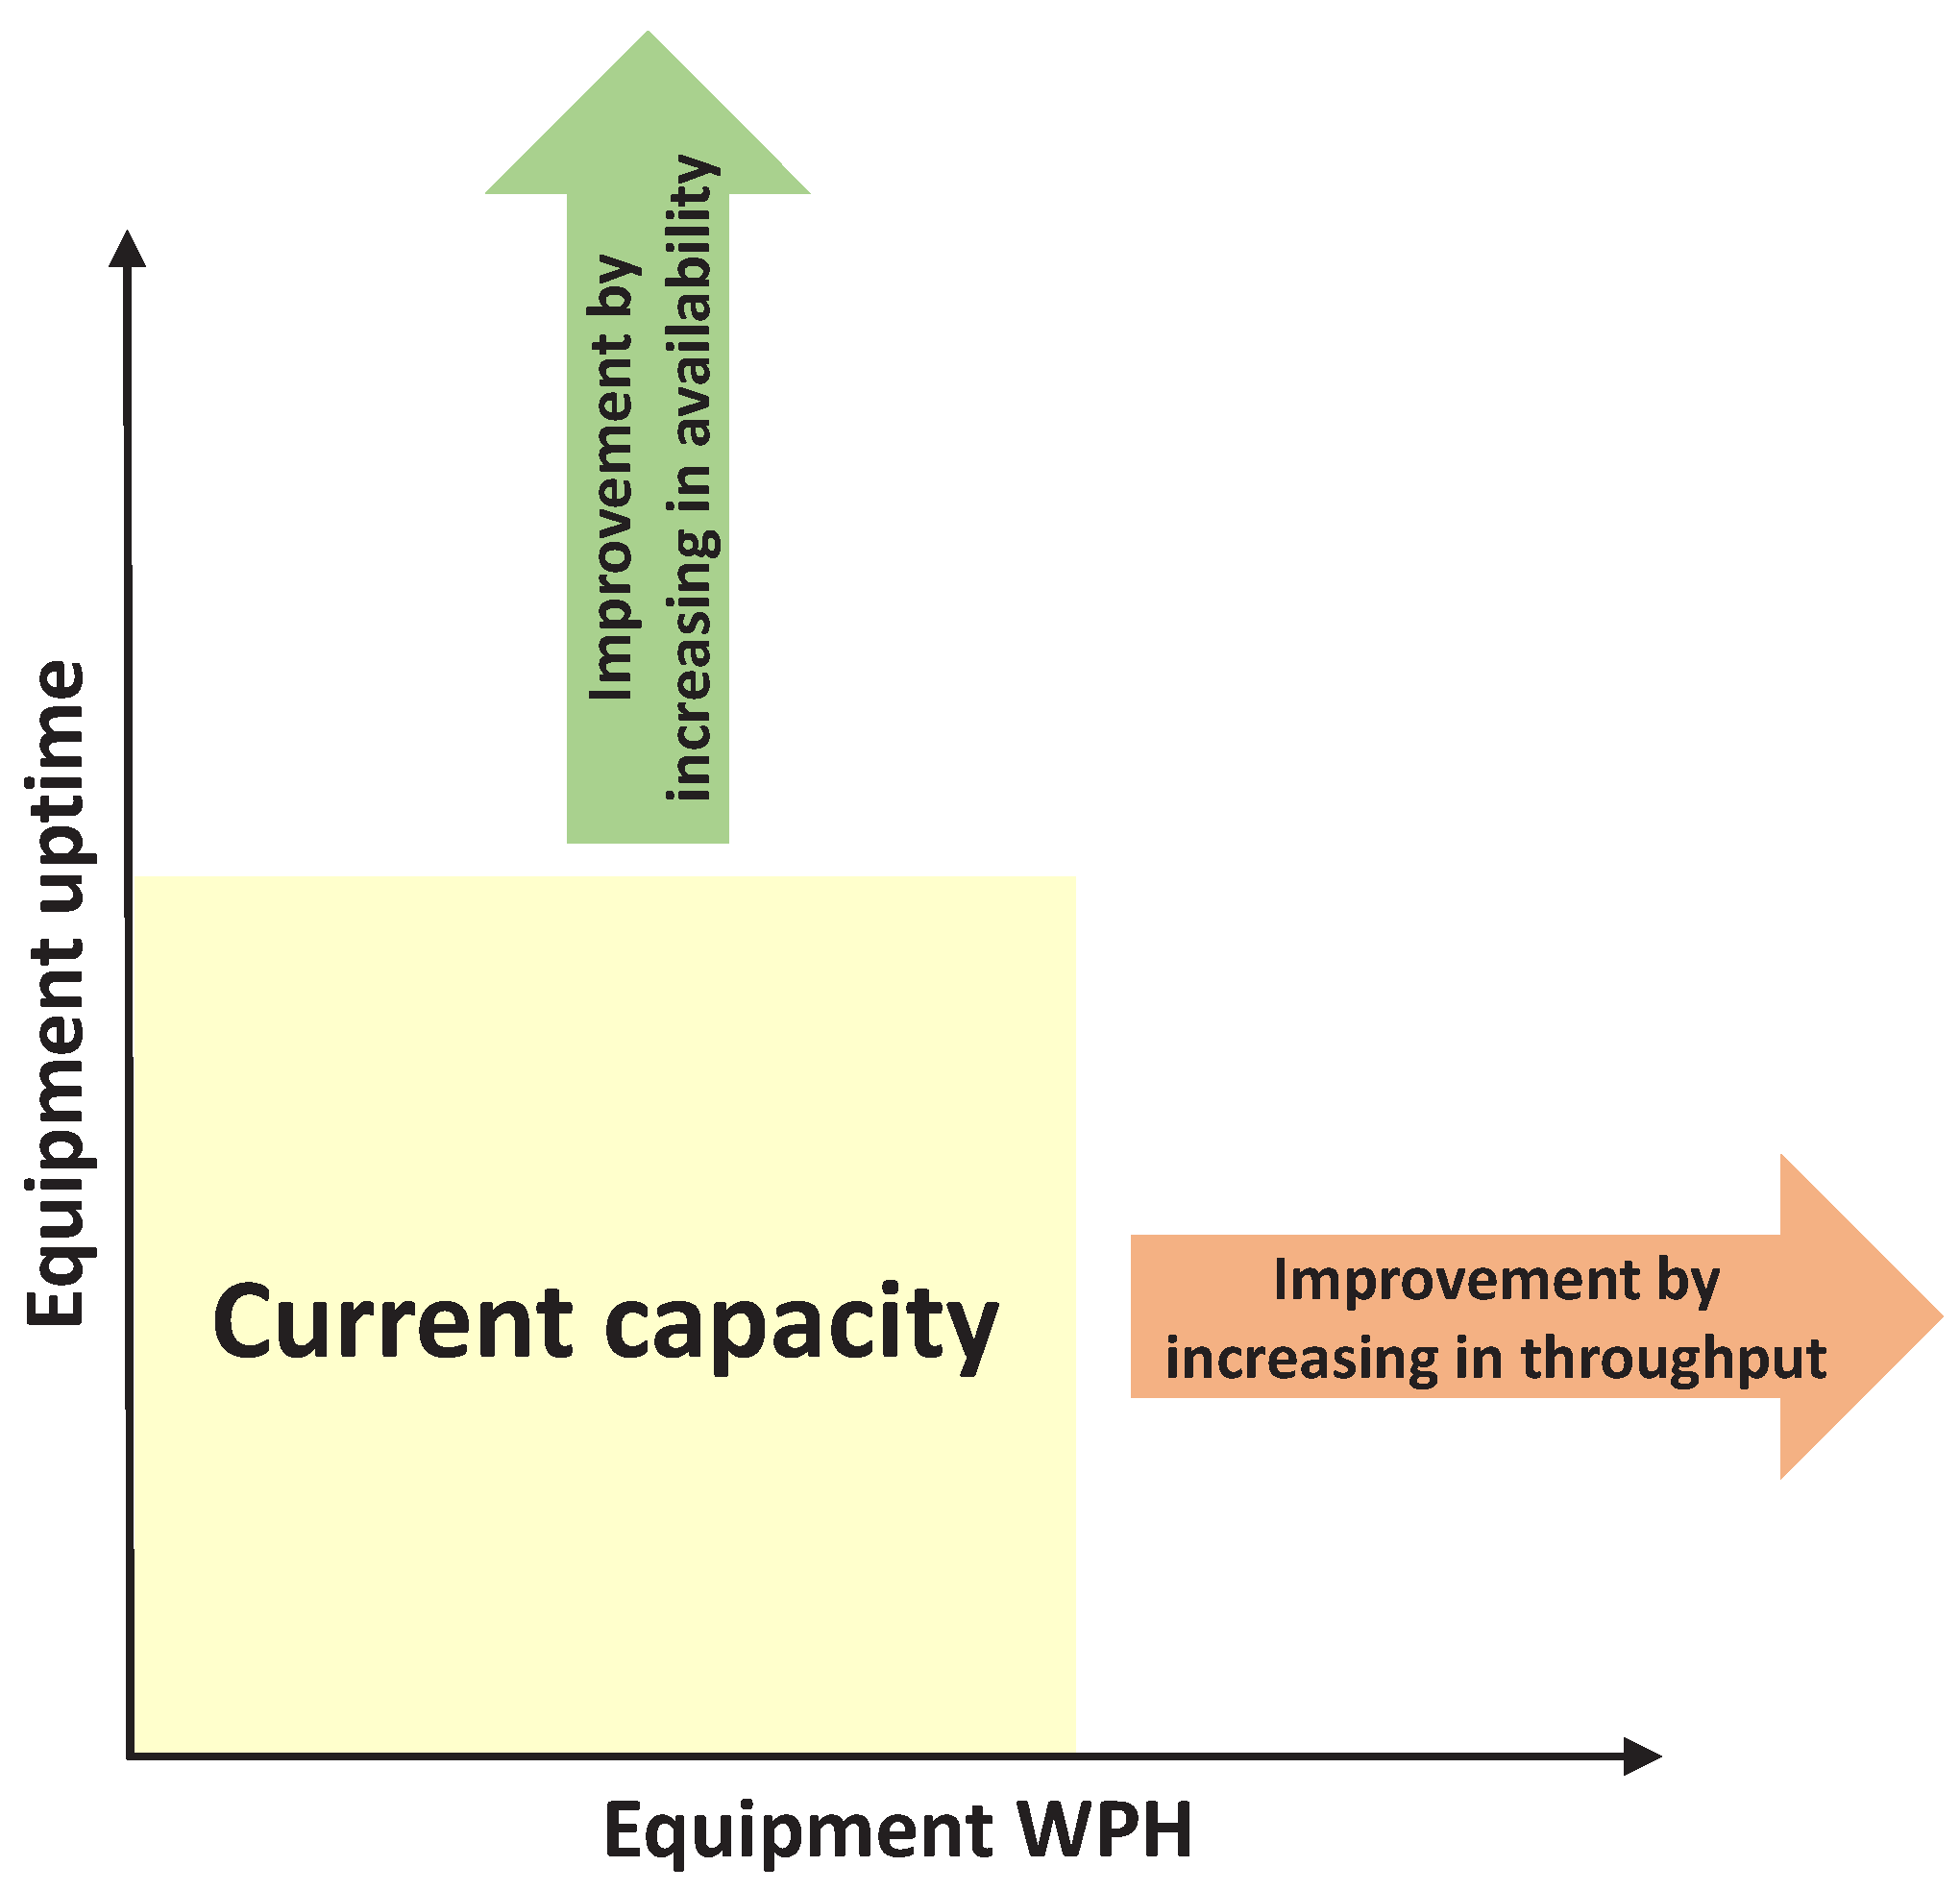
Figure 6.
Primary goals of WPH improvement for critical equipment units.
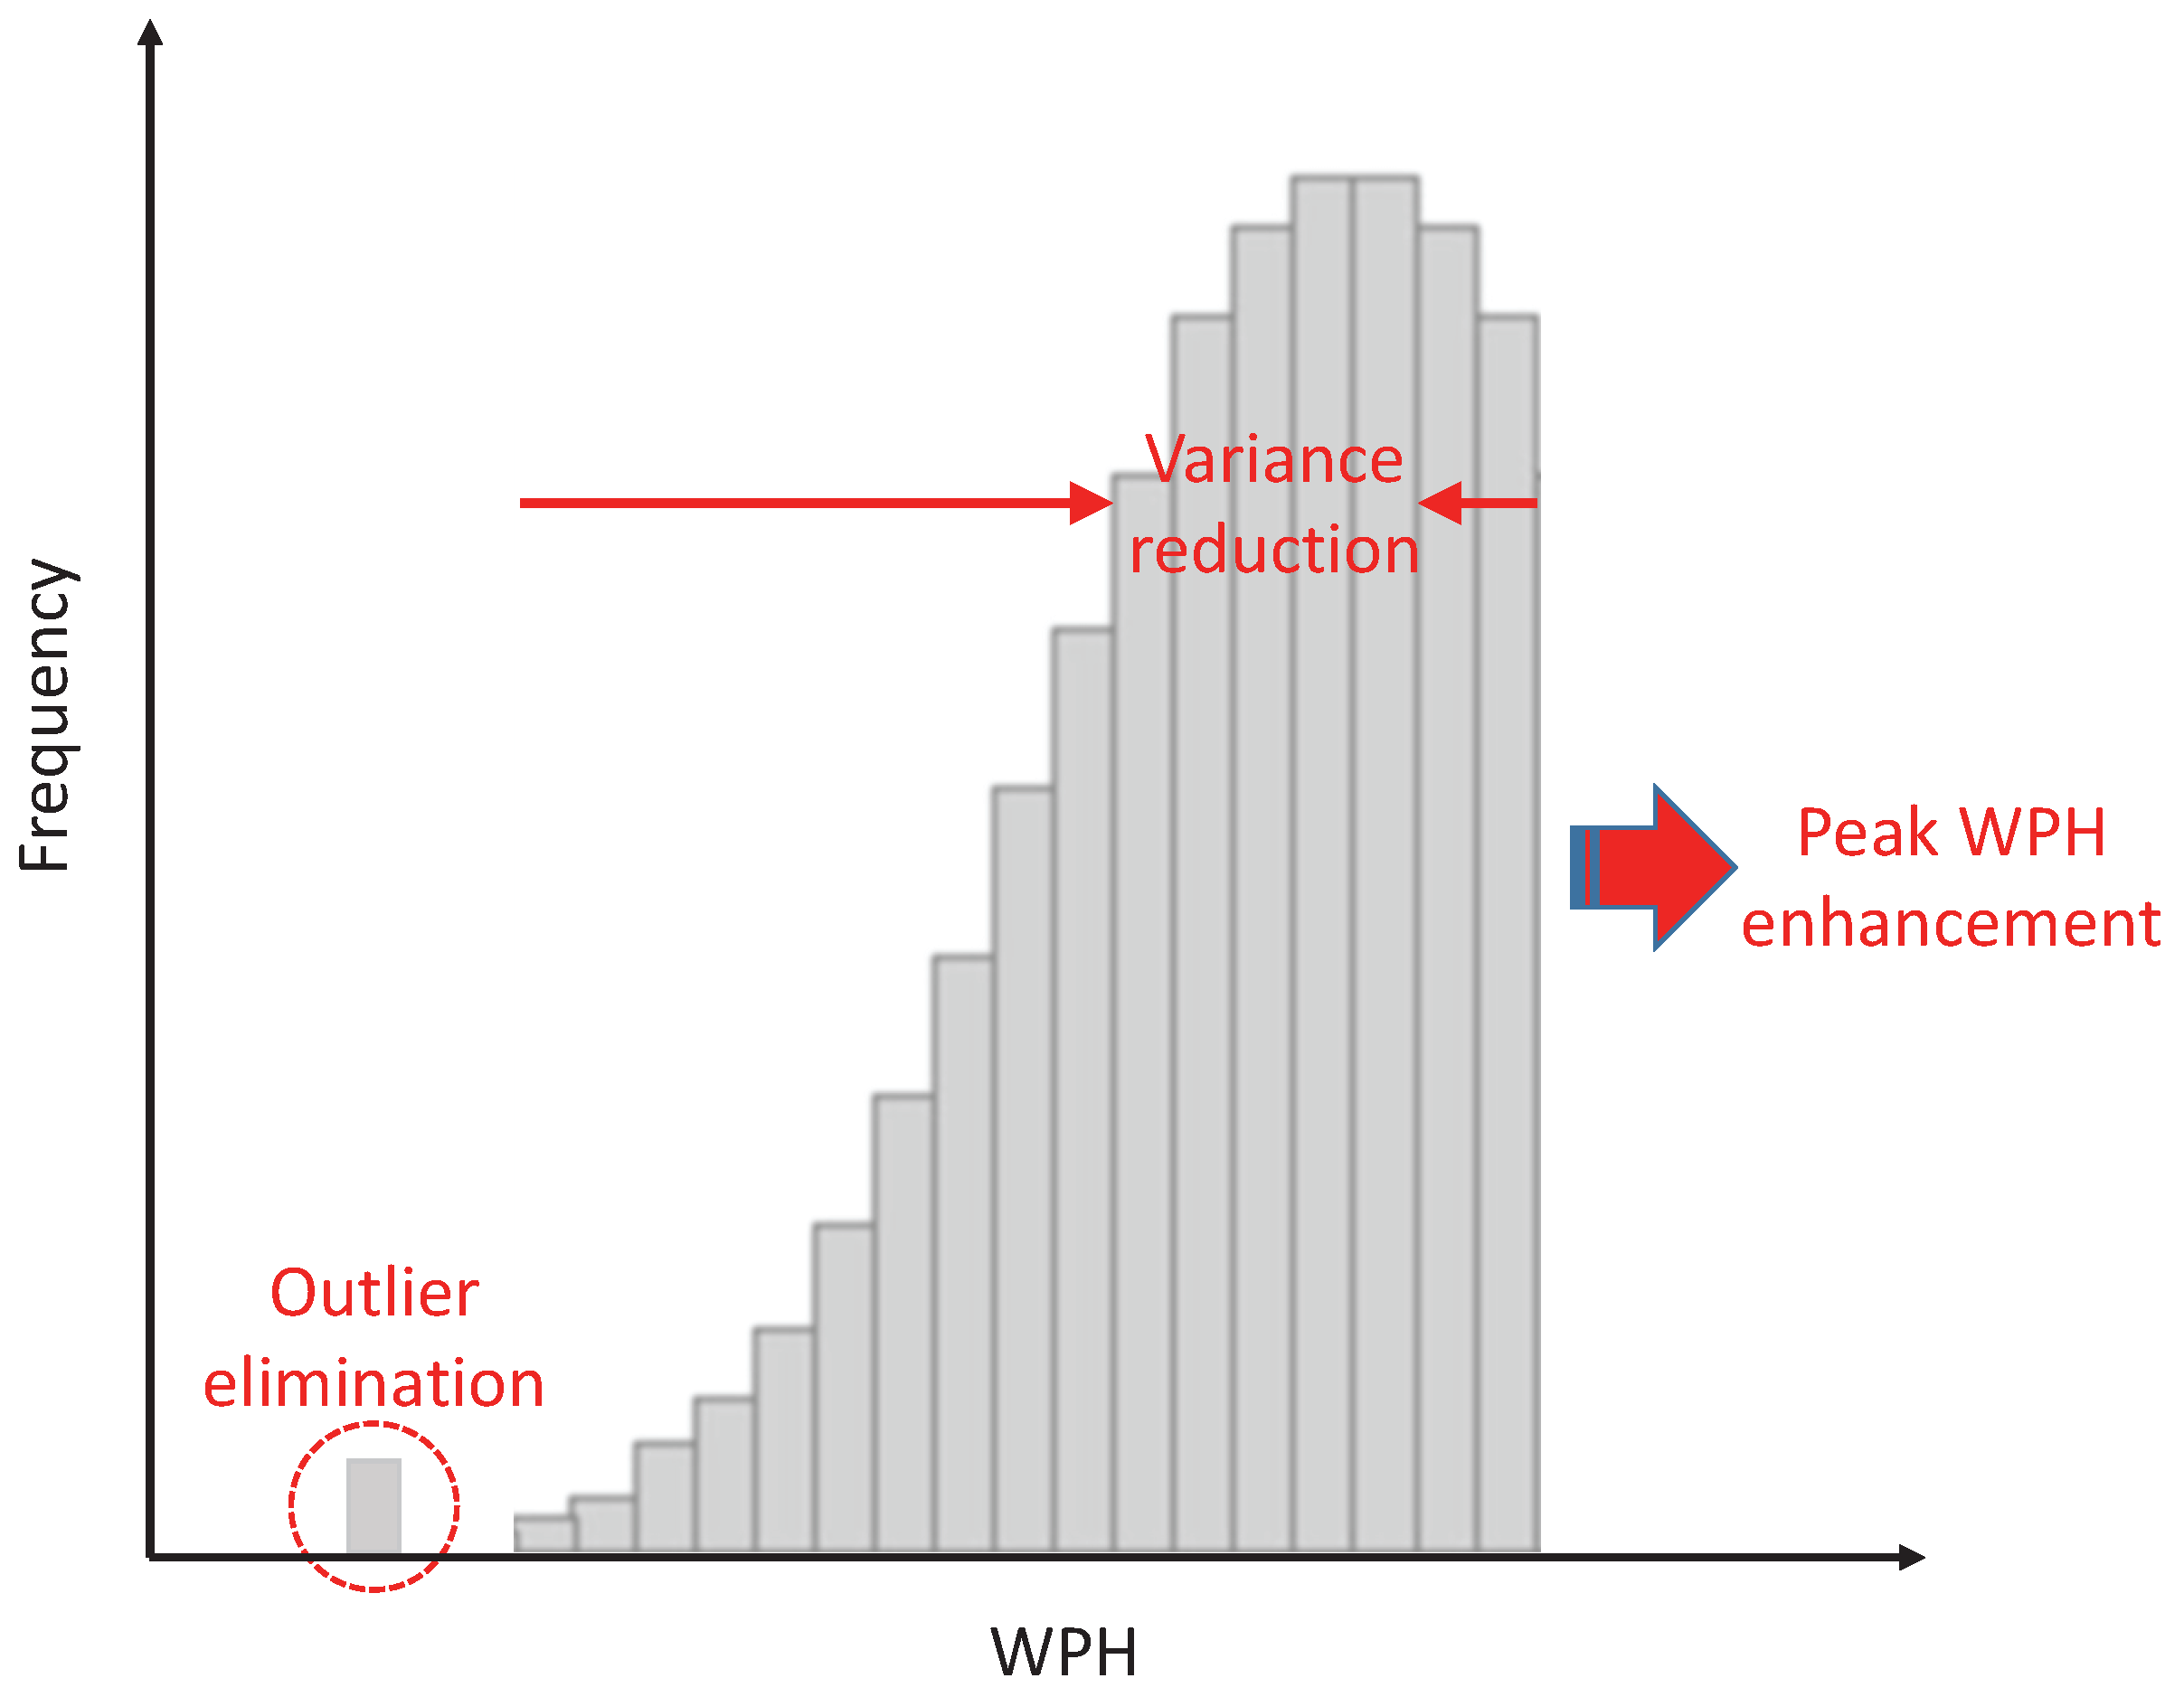
Figure 7.
Systems architecture. CIM, computer-integrated manufacturing; RTD, real-time dispatcher; AM, activity manager; RCM, recipe control management; EAP, equipment automation program; MDB, master database; APC, advance process control.
Figure 7.
Systems architecture. CIM, computer-integrated manufacturing; RTD, real-time dispatcher; AM, activity manager; RCM, recipe control management; EAP, equipment automation program; MDB, master database; APC, advance process control.
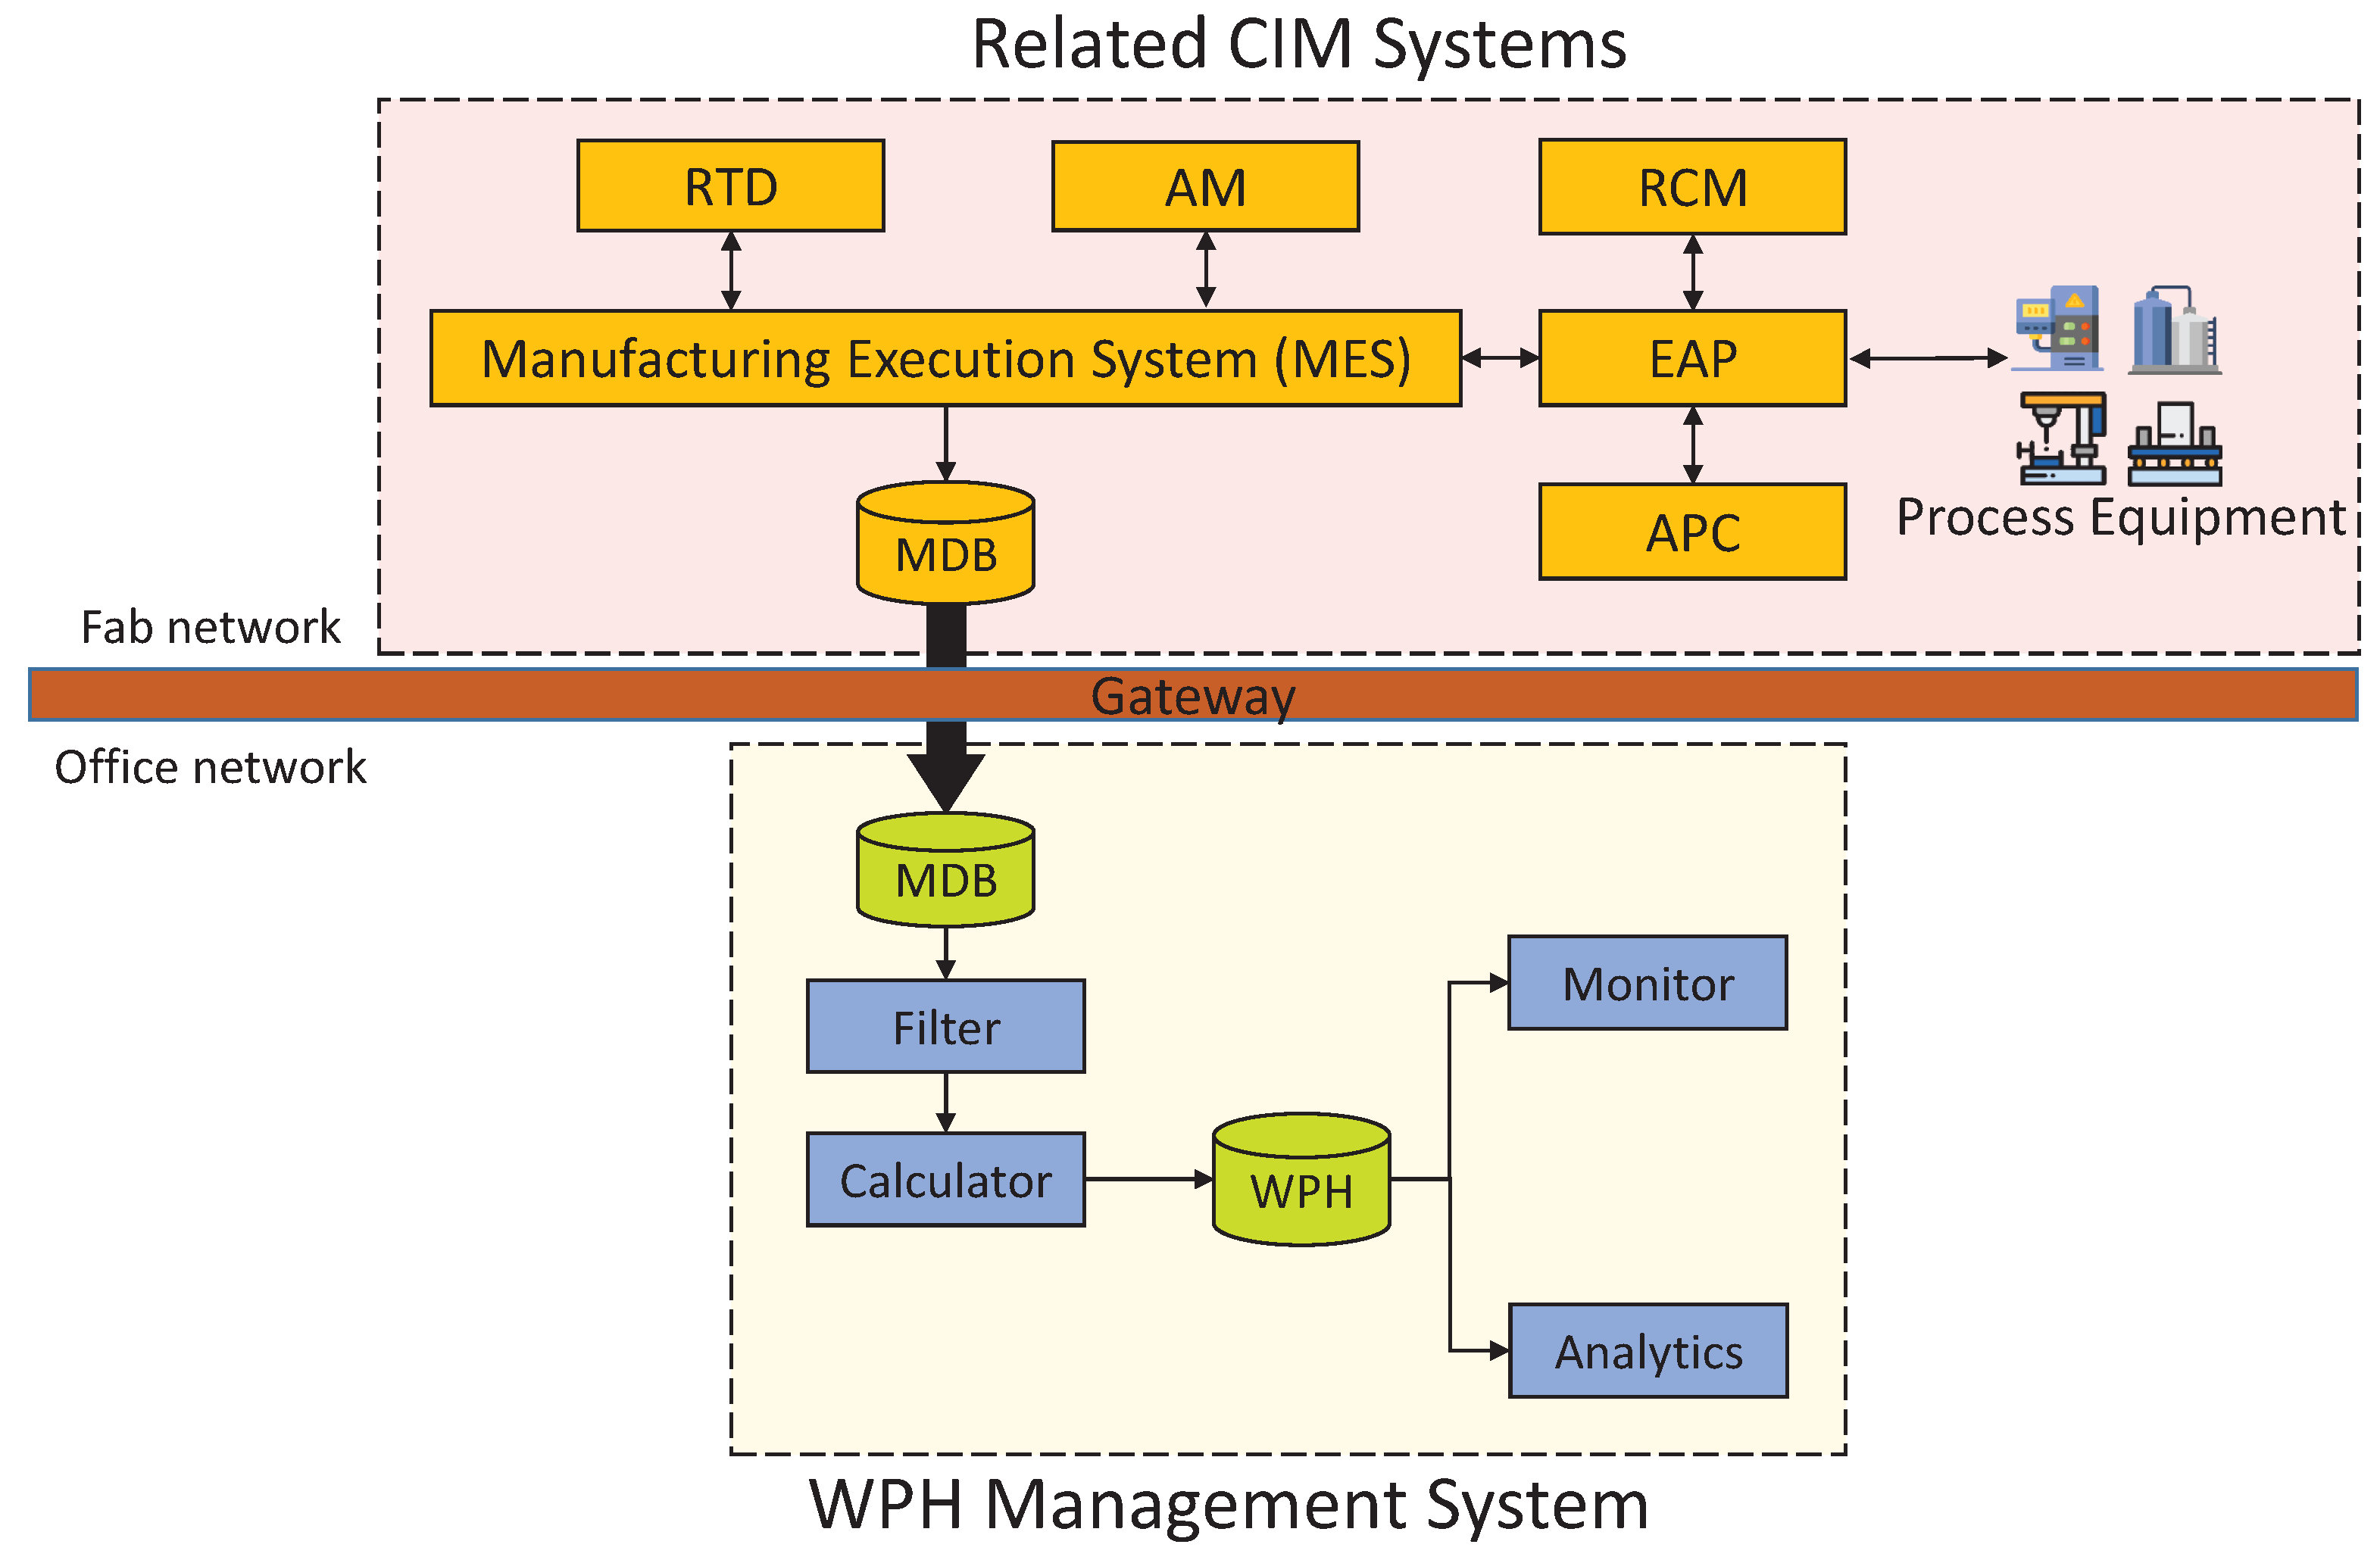
Figure 8.
Example of the user interface for rules’ management.
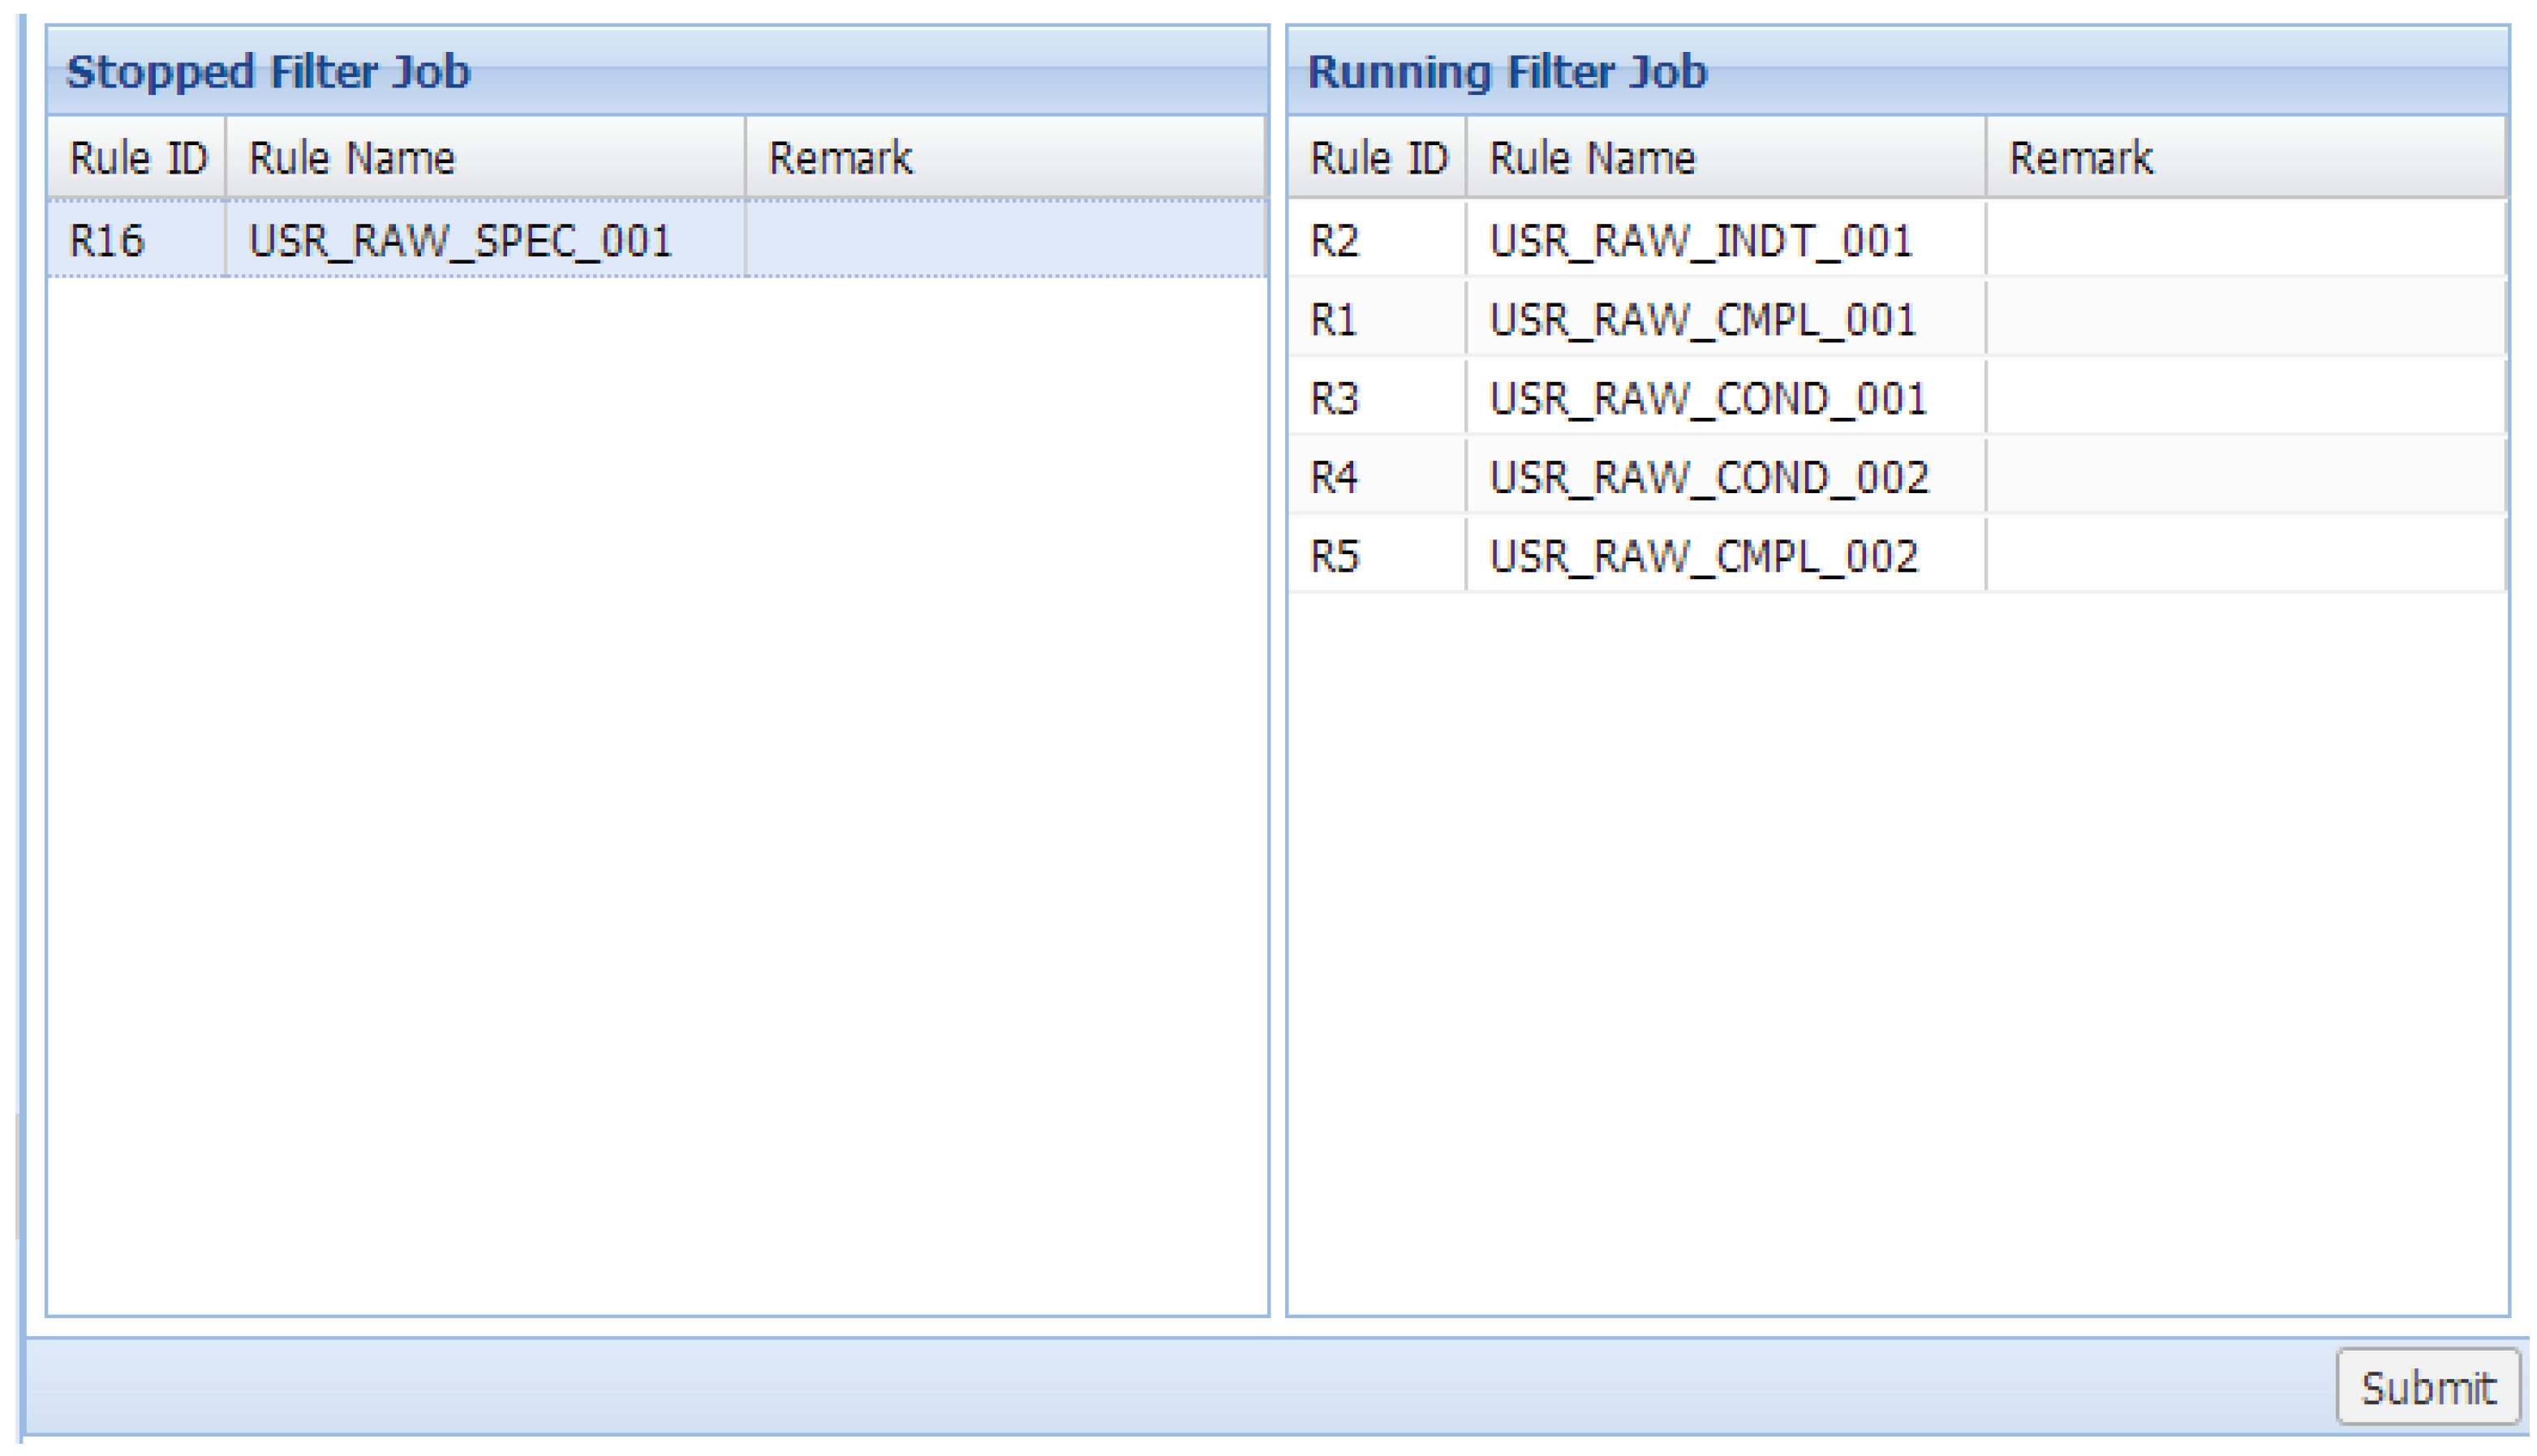
Figure 9.
The basic structure of the calculator module.

Figure 10.
Throughput control chart for average WPH.
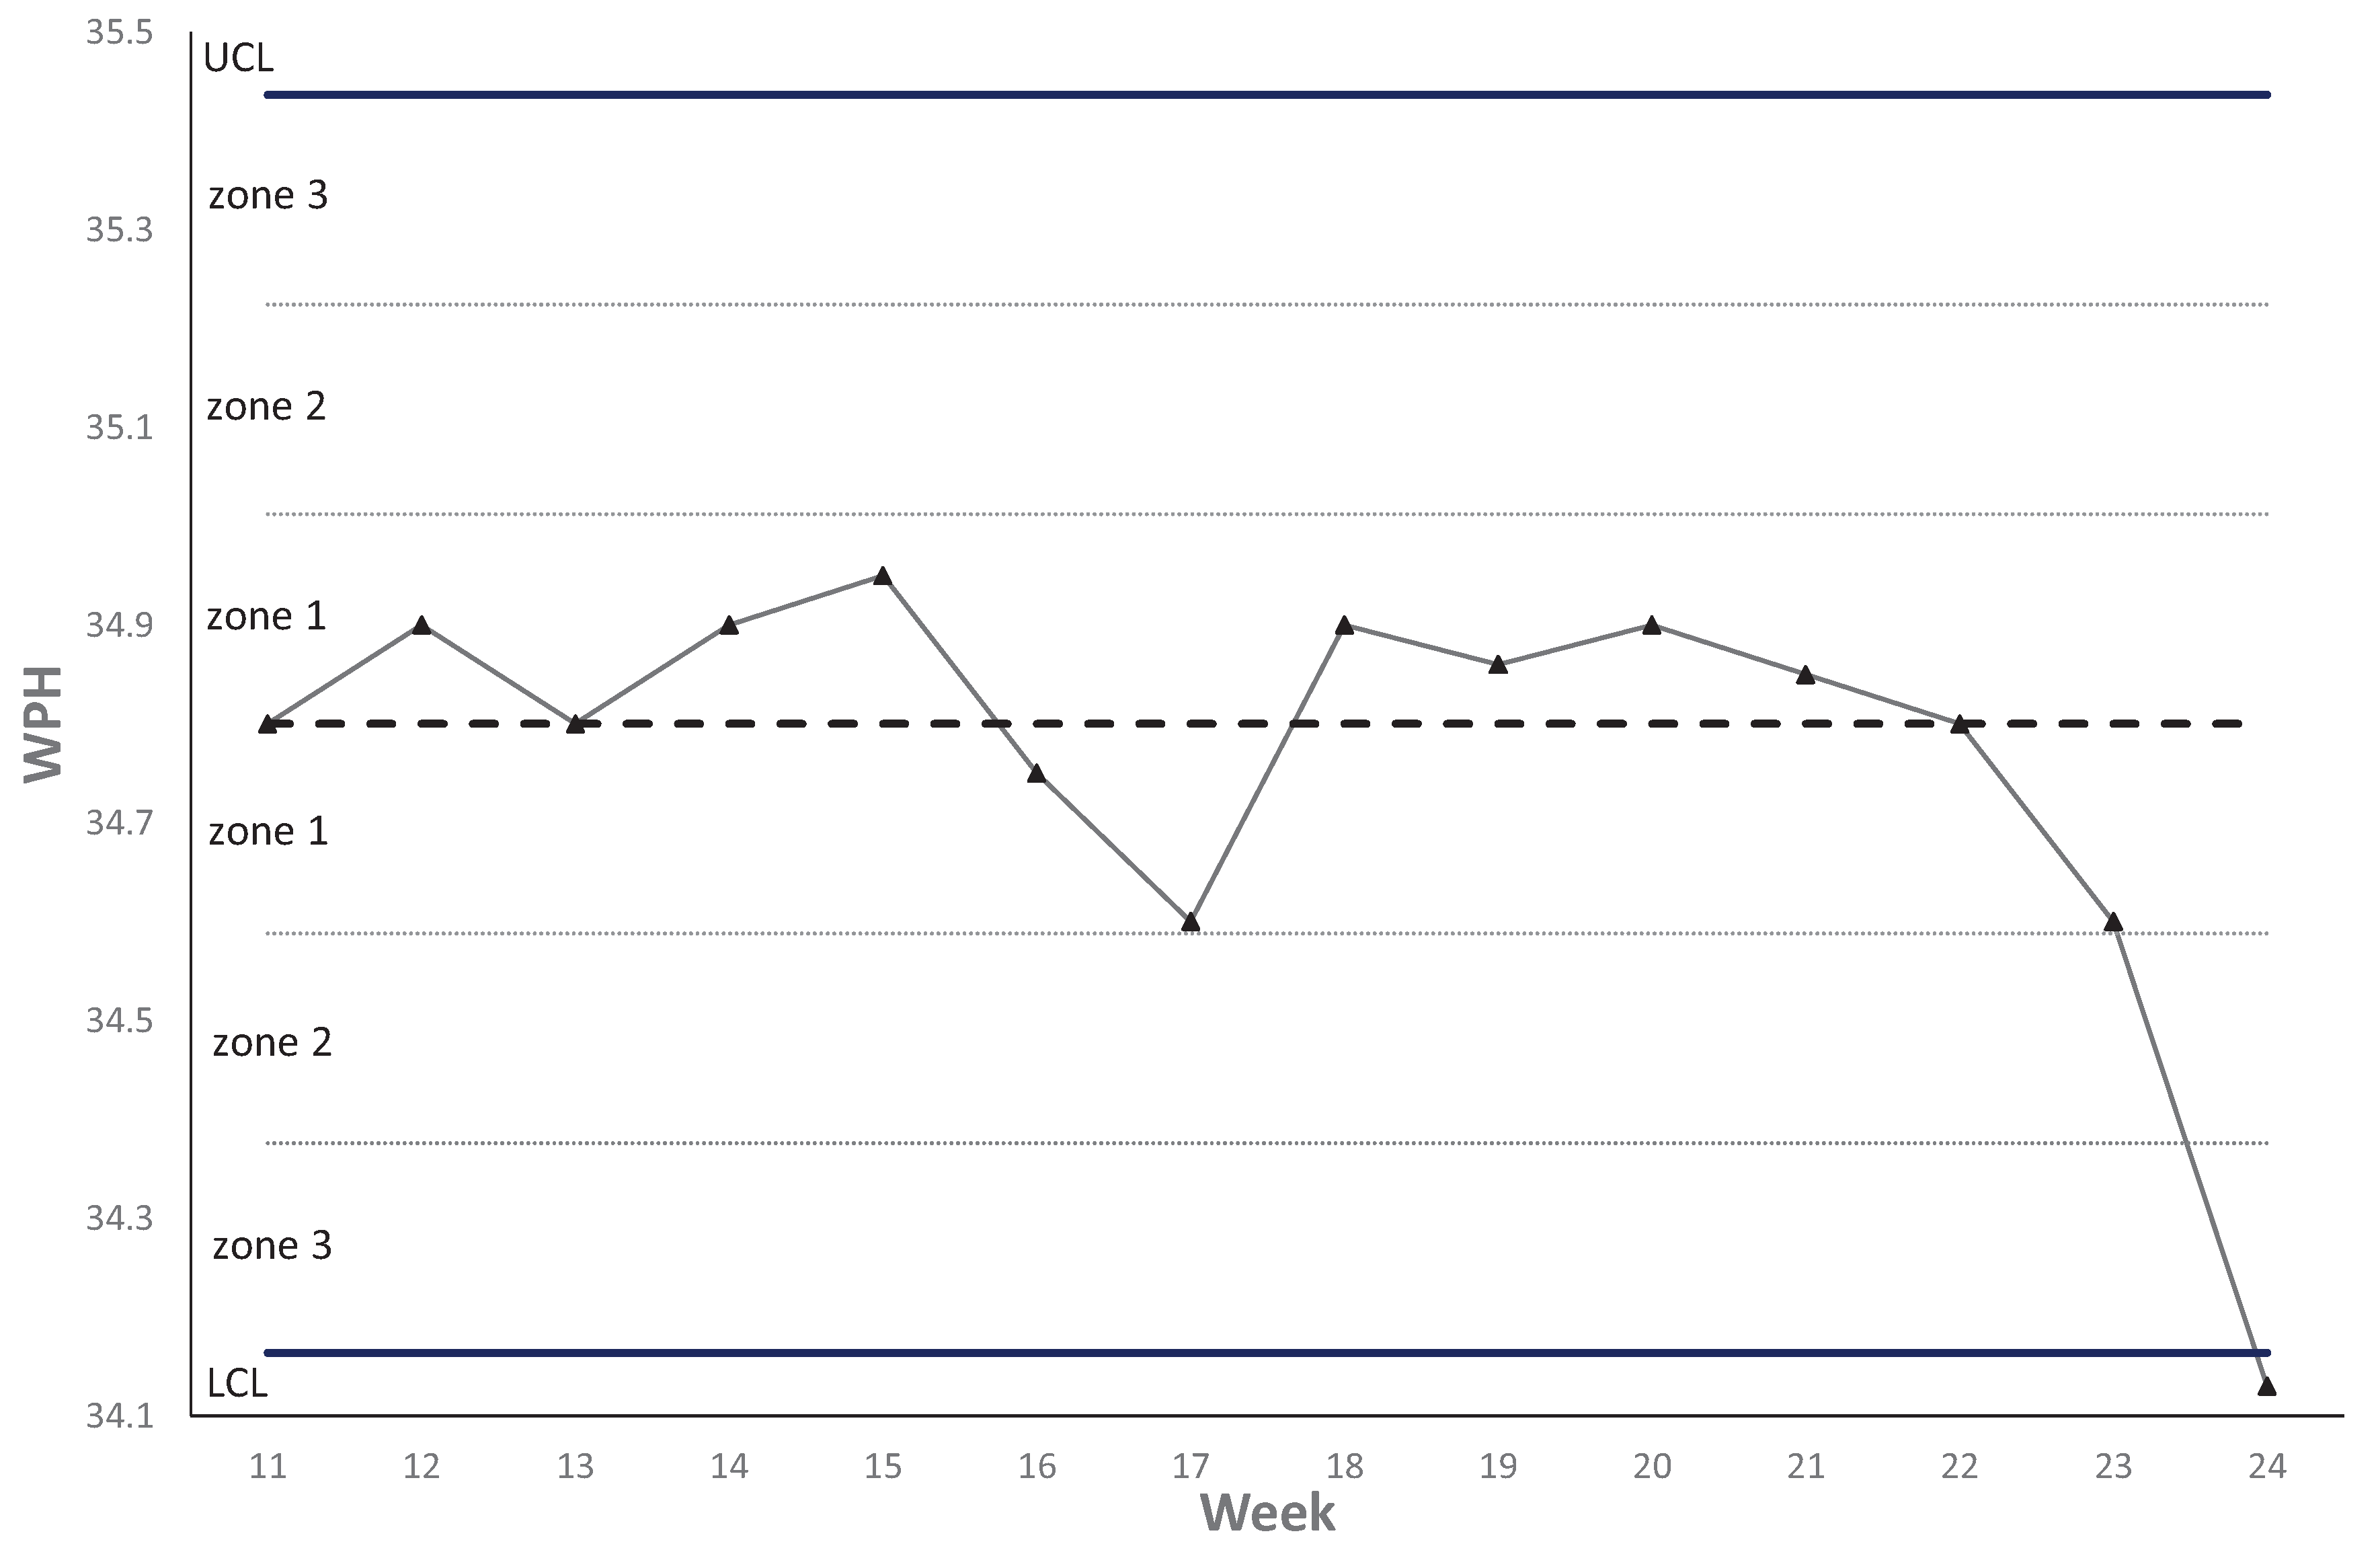
Figure 11.
The working procedure of this WPH project.
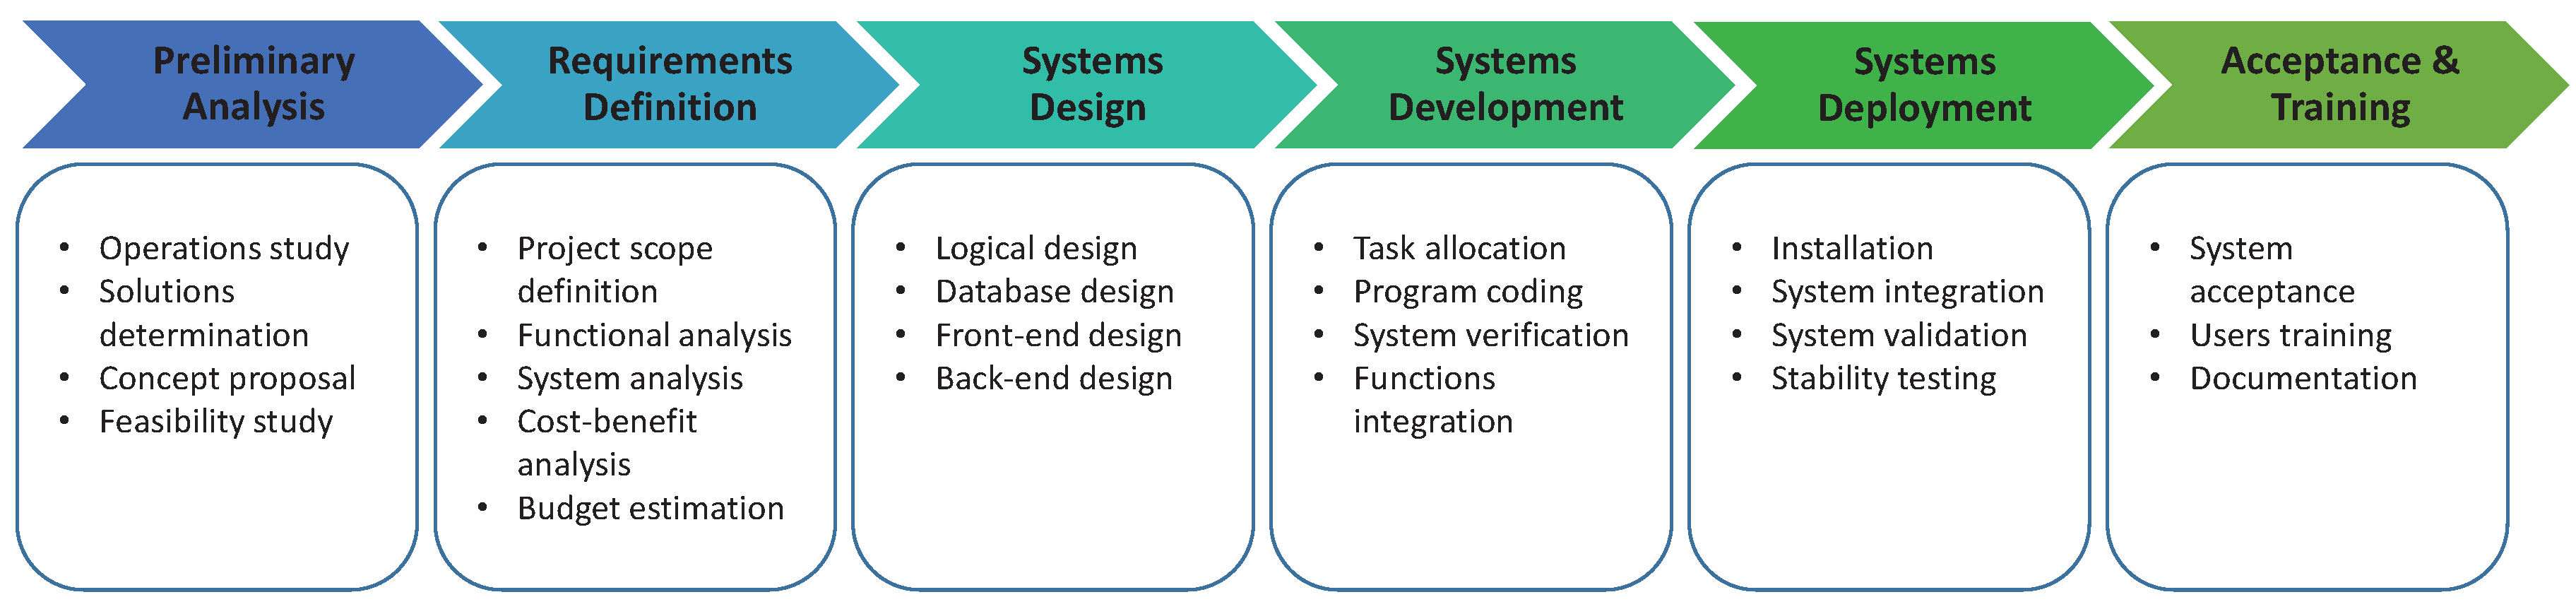
Figure 12.
Performance comparison within the period of parallel running.


Table 1.
Basic tests for identifying special-cause variation or potential capacity-loss.
| Test | Rule | Description |
|---|---|---|
| 1 | Any point is outside both UCL and LCL | A large shift |
| 2 | two out of three points in a row in Zone 3 | A large shift |
| 3 | Three out of four points in a row in Zone 2 | A small constant shift |
| 4 | Three points are consecutive on the same side of the centerline | A small constant shift |
| 5 | Six points in a row alternating up and down | Non-random systematic variation |
| 6 | Three points in a row steadily increasing or decreasing | A trend up or down |
| 7 | Seven points are consecutively within Zone 1 | Stratification |
© 2018 by the authors. Licensee MDPI, Basel, Switzerland. This article is an open access article distributed under the terms and conditions of the Creative Commons Attribution (CC BY) license (http://creativecommons.org/licenses/by/4.0/).
Share and Cite
MDPI and ACS Style
Hsieh, L.Y.; Hsieh, T.-J. A Throughput Management System for Semiconductor Wafer Fabrication Facilities: Design, Systems and Implementation. Processes 2018, 6, 16. https://doi.org/10.3390/pr6020016
AMA Style
Hsieh LY, Hsieh T-J. A Throughput Management System for Semiconductor Wafer Fabrication Facilities: Design, Systems and Implementation. Processes. 2018; 6(2):16. https://doi.org/10.3390/pr6020016
Chicago/Turabian StyleHsieh, Liam Y., and Tsung-Ju Hsieh. 2018. "A Throughput Management System for Semiconductor Wafer Fabrication Facilities: Design, Systems and Implementation" Processes 6, no. 2: 16. https://doi.org/10.3390/pr6020016
Note that from the first issue of 2016, this journal uses article numbers instead of page numbers. See further details here.