Article

The Effect of Joint Dip Angle on the Mechanical Behavior of Infilled Jointed Rock Masses under Uniaxial and Biaxial Compressions

1
State Key Laboratory for Geomechanics and Deep Underground Engineering, China University of Mining and Technology, Xuzhou 221116, China
2
Graduate School of Engineering, Nagasaki University, Nagasaki 852-8521, Japan
*
Author to whom correspondence should be addressed.
Processes 2018, 6(5), 49; https://doi.org/10.3390/pr6050049
Submission received: 4 April 2018 / Revised: 28 April 2018 / Accepted: 28 April 2018 / Published: 3 May 2018

Abstract

:
Due to the complex formation process of a rock mass, a large number of fissures, joints, faults, other defects exist and the defects commonly contain infilled materials. The jointed rock masses are in a complex geological environment, in which the geometric distribution and the boundary condition can greatly affect the mechanical behavior of the infilled jointed rock mass. In this study, the infilled jointed rock mass specimens with different dip angles are prepared using similar materials, and the uniaxial and biaxial compression tests on the specimens are conducted. The effect of the joint dip angle on the mechanical behavior of the infilled jointed rock mass under uniaxial and biaxial compressions is investigated. The results show that the uniaxial compressive strength shows a W-shaped variation, and the biaxial compressive strength shows a V-shaped variation with an increase in the dip angle. Most of the cracks appear in pairs around the joint and occur symmetrically in a bilateral distribution, and the existence of the infilled joints induces a nonlinear mechanical behavior in the specimen. In addition, the specimens exhibit three failure modes under uniaxial compression: splitting failure, step-path failure and planar failure. The specimens present two failure modes under biaxial compression: splitting failure and planar failure.

1. Introduction

The stress on the surrounding rock can be redistributed due to the excavations in the deep underground. Disasters such as collapse and large deformation may occur during the stress redistribution [1,2,3], in which the original joints propagate and coalesce [4,5]. The joints are filled with organic materials and/or gauges of rocks, which can significantly influence the mechanical behavior of the rocks. Therefore, it is of great significance to study the mechanical behavior of the infilled jointed rock masses.
A large number of investigations have been devoted to the mechanical behavior of jointed rock masses. Brace et al. first conducted the uniaxial and biaxial compression tests on brittle rock specimens containing a single crack [6]. The results show that the newly generated crack deviates from the original crack orientation by approximately 70°. Later, Hoek et al. found that there exists a critical orientation of the inclined crack under compression, in which the pressure required for crack propagation is at its minimum [7]. Then, scholars developed a number of rock models containing single joints [8,9], two joints [10,11] and three joints [12,13], to study the initiation, the propagation and the coalescence of joints. The mechanical properties of jointed rock masses under different loading conditions were also studied, such as uniaxial compression [8], biaxial compression [14], triaxial compression [15] and direct shear test [16]. With respect to infilled jointed rock masses, Zhang B et al. studied the effect of filling on the mechanical properties of jointed rock masses under uniaxial compression [17]. They concluded that compared with the specimens that had no fillings in the crack, although the peak strength of jointed rock specimens that had filled cracks slightly increased, their post-peak plasticity was enhanced significantly.
For the nonpersistent joints, Prudencio et al. carried out a series of biaxial tests on rock samples, and they proposed three basic failure modes, including failure through a planar surface, stepped failure and failure by rotation of new blocks [18]. Goldstein et al. studied the effect of a scale on the strength of jointed rock masses by conducting uniaxial compression tests, and concluded that the strength of a fissured rock massif is unequal in different directions and is determined by the predominant orientation of the joint system or the contact surfaces between layers [19]. Chen et al. systematically studied the effects of joint orientation and joint persistence on the cracking process in jointed rock masses by uniaxial compression tests, and they concluded that the cracking process and failure mode were more strongly affected by joint orientation than joint persistence, especially when the joint dip angle was larger than 45° [20]. Bahaaddini et al. investigated the influence of geometric parameters of joints on the rock mass failure mechanism, the unconfined compressive strength, and the deformation modulus using the discrete element method [21]. They found that the failure mode was principally determined by the step angle and the joint orientation with respect to the applied principal stress direction. The mechanical behavior of a typical jointed rock mass having non-persistent joints located adjacent to an underground excavation was investigated through numerical simulation by applying appropriate three-dimensional boundary conditions using the PFC3D software package [22]. Asadizadeh et al. conducted a number of direct shear tests on non-persistent jointed rocks and studied the effects of bridge length, bridge angle, joint roughness, and normal stress on the shear strength and the cracking process. The results revealed that the normal stress and the bridge angle had the maximum and minimum effects on shear strength, respectively [23]. Wu et al. investigated the shear rheology in sandstone with non-persistent joints, and the results indicated that long-term shear strength is influenced by the long-term internal friction angle and the cohesion, and a decreased cohesion is a key factor for changes in the long-term shear strength under a constant load [24]. Sarfarazi et al. studied the effect of joint separation on the shear behavior of planar non-persistent joints under a high normal load using PFC2D, and the discrete element simulations demonstrated that the failure pattern was mostly influenced by joint separation, while the shear strength was linked to the failure pattern and the failure mechanism [25].
Most of the current studies are devoted to the mechanical behavior of jointed rock masses with unfilled cracks under uniaxial compression. However, the filled cracks and non-persistent joints commonly exist in underground rock masses, and the jointed rock masses are in a complex geological environment, in which the rock mass is subjected to biaxial and/or triaxial compressions [26]. In this study, uniaxial and biaxial compression tests for infilled jointed rock masses are carried out. The evolutions of stress–strain behavior, the uniaxial and biaxial compressive stresses, and the elasticity modulus of the specimen with different joint dip angles have been estimated. Finally, we examine the effect of joint dip angle on the failure mode with the aid of acoustic emission and a high-resolution camera.

2. Experiments

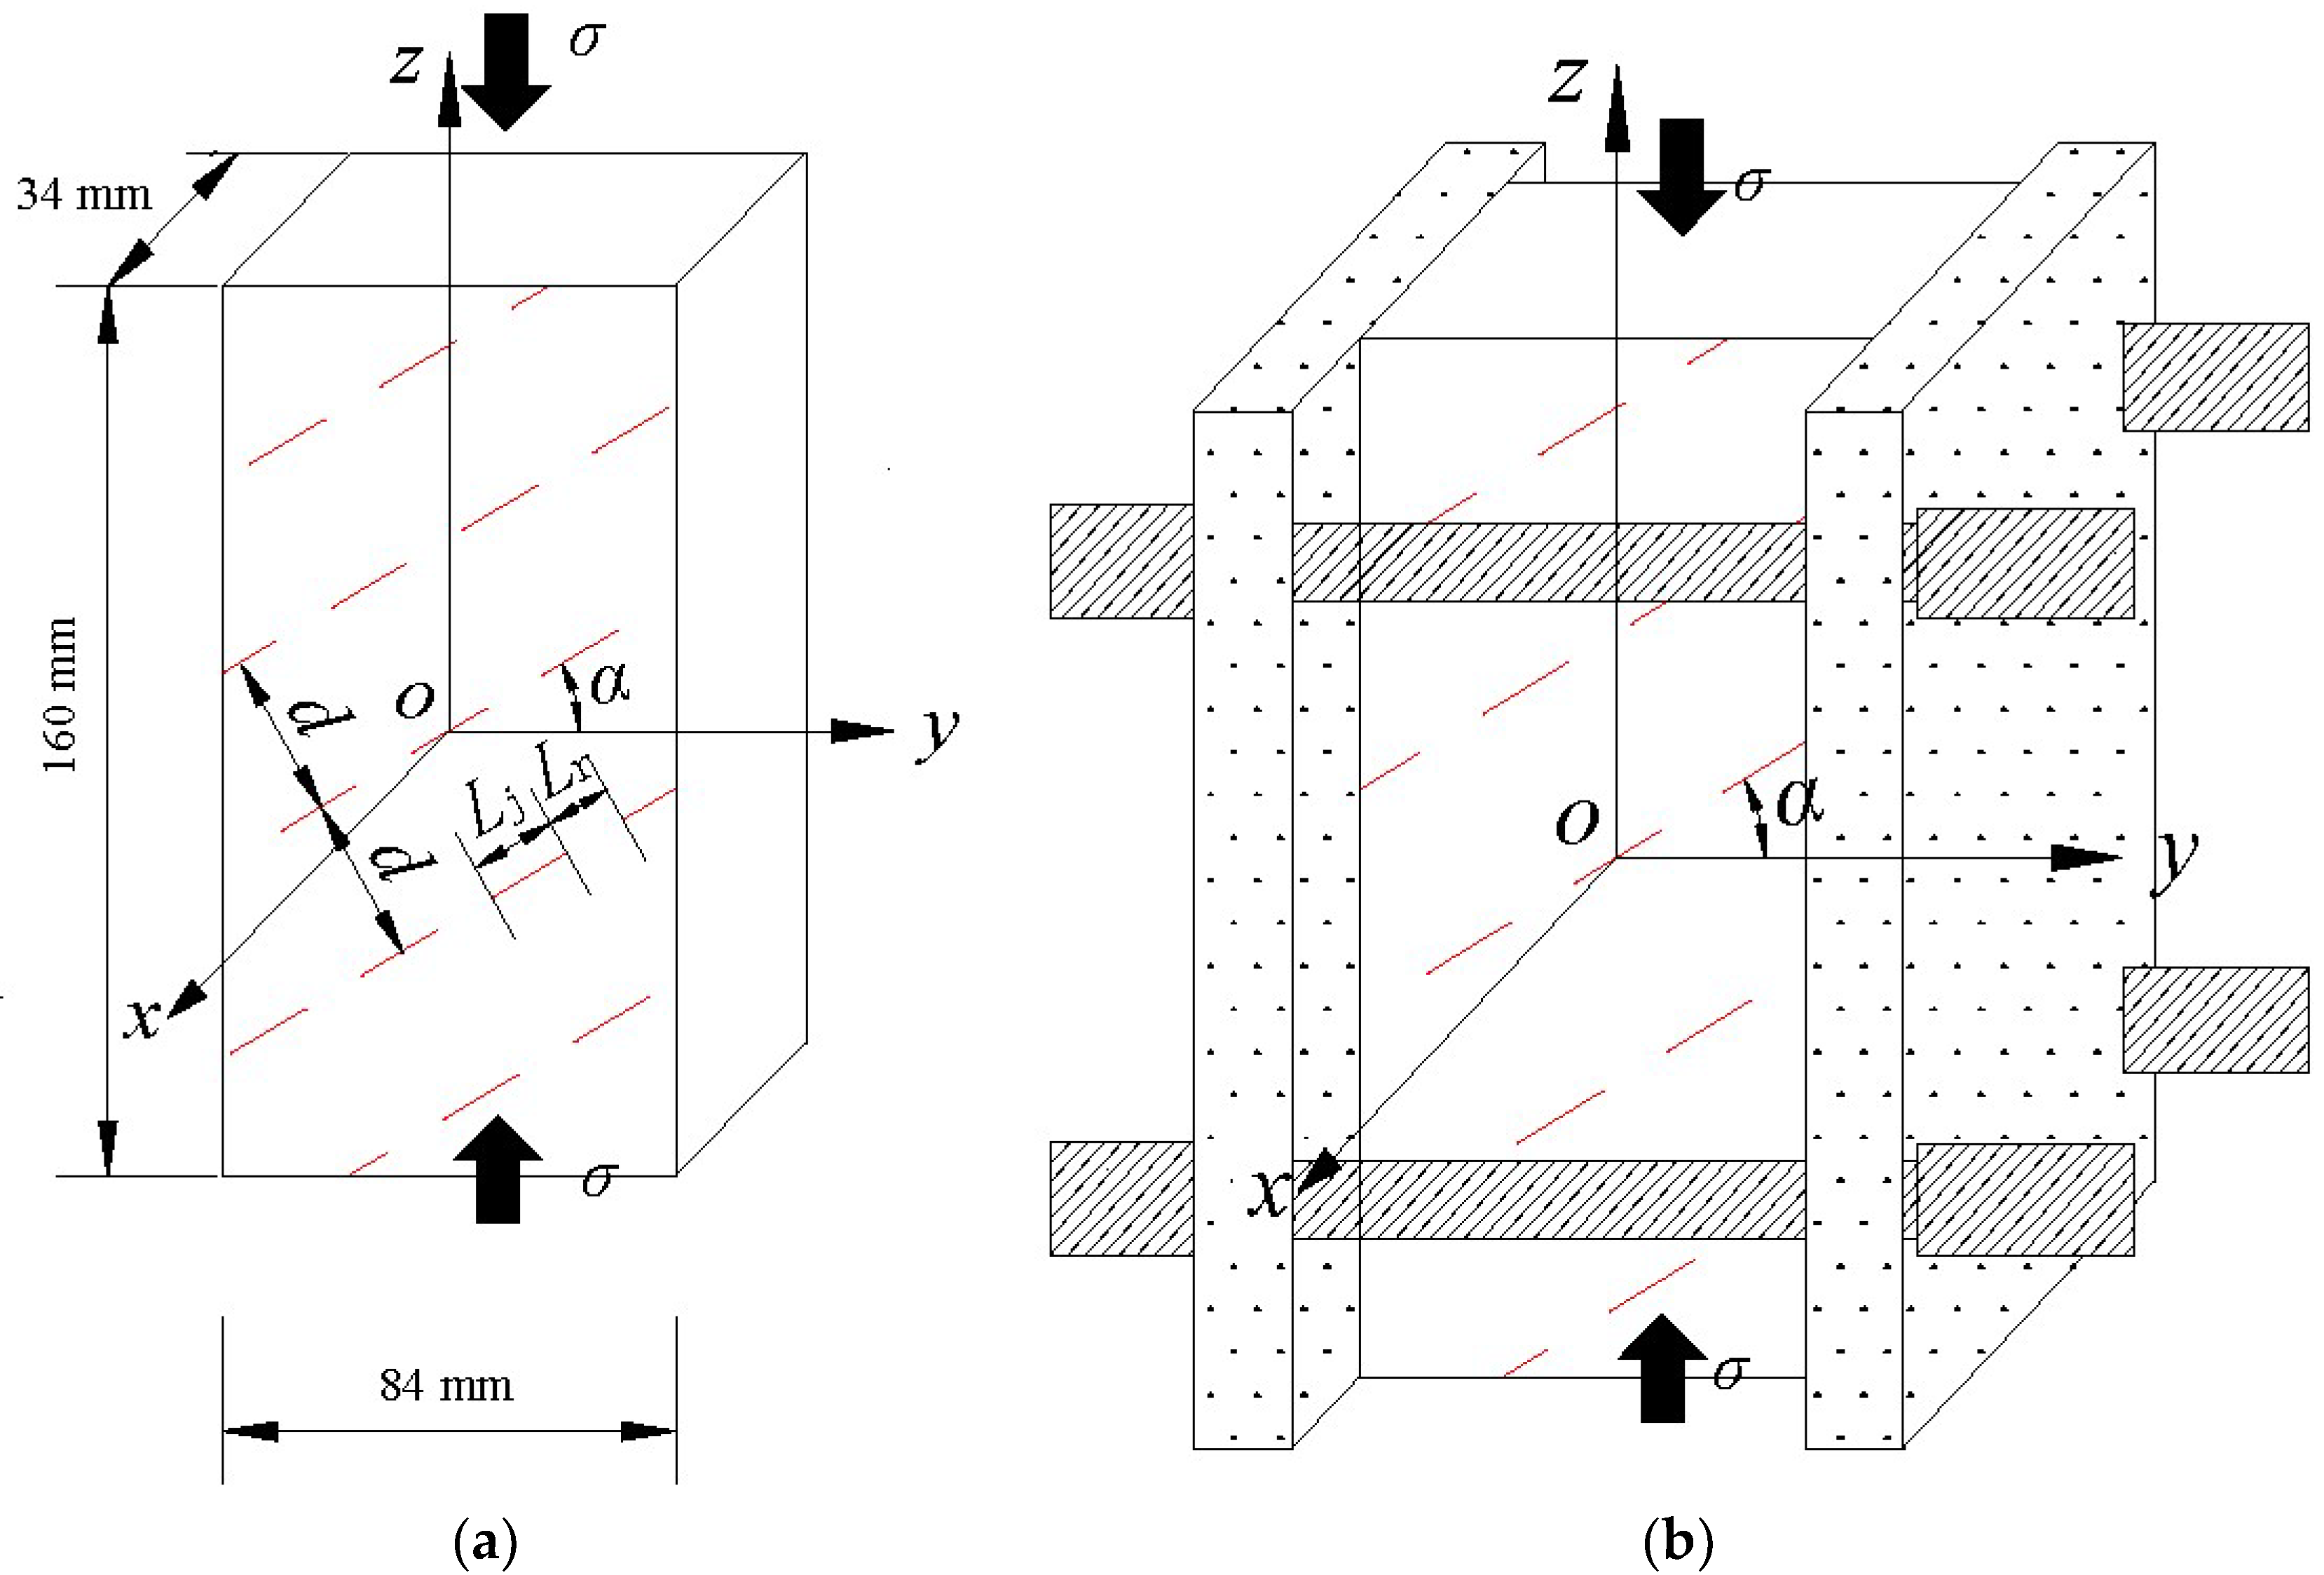
2.1. Specimen Morphology

The specimen was processed into a cuboid with a length of 160 mm, a width of 84 mm and a thickness of 34 mm, in which the prefabricated joints penetrated the thickness of the specimen. Figure 1 describes the schematic view of the specimen. Here, α represents the joint dip angle, Lj represents the length of joint, Lr represents the length of the rock bridge, d represents the spacing selected for the non-persistent joint, and the specific parameters of the specimen are shown in Table 1. The resin sheet was used as infilled material. The experiment aimed at discussing the effect of the joint dip angle on the mechanical behavior of the infilled jointed rock mass; therefore, seven dip angle levels of 0°, 15°, 30°, 45°, 60°, 75° and 90° were respectively designed, and three specimens were prepared for each level. The intact specimens were prepared as the reference samples.

2.2. Specimen Preparation

Firstly, the mode was processed according to the layout of the joints. Then, the specimens were cast in the mold after mixing similar materials, which were obtained by mixing water and cement in the proportion of 0.6. The cement was made from the Mianzhu Baichuan specimen cement Ltd. (Mianzhu, China), which was coded as 42.5. The resin sheet that was made by the Sichuan Shengjili Industrial Co. Ltd (Chengdu, China). with a thickness of 0.3 mm was inserted into the groove of the mold box in advance and solidified with the cement to simulate the infilled joints. Then, the specimens were maintained at a constant temperature and placed in a humid box for 28 days after the specimens were demoulding. The temperature was 25 °C and the relative humidity was 95%.

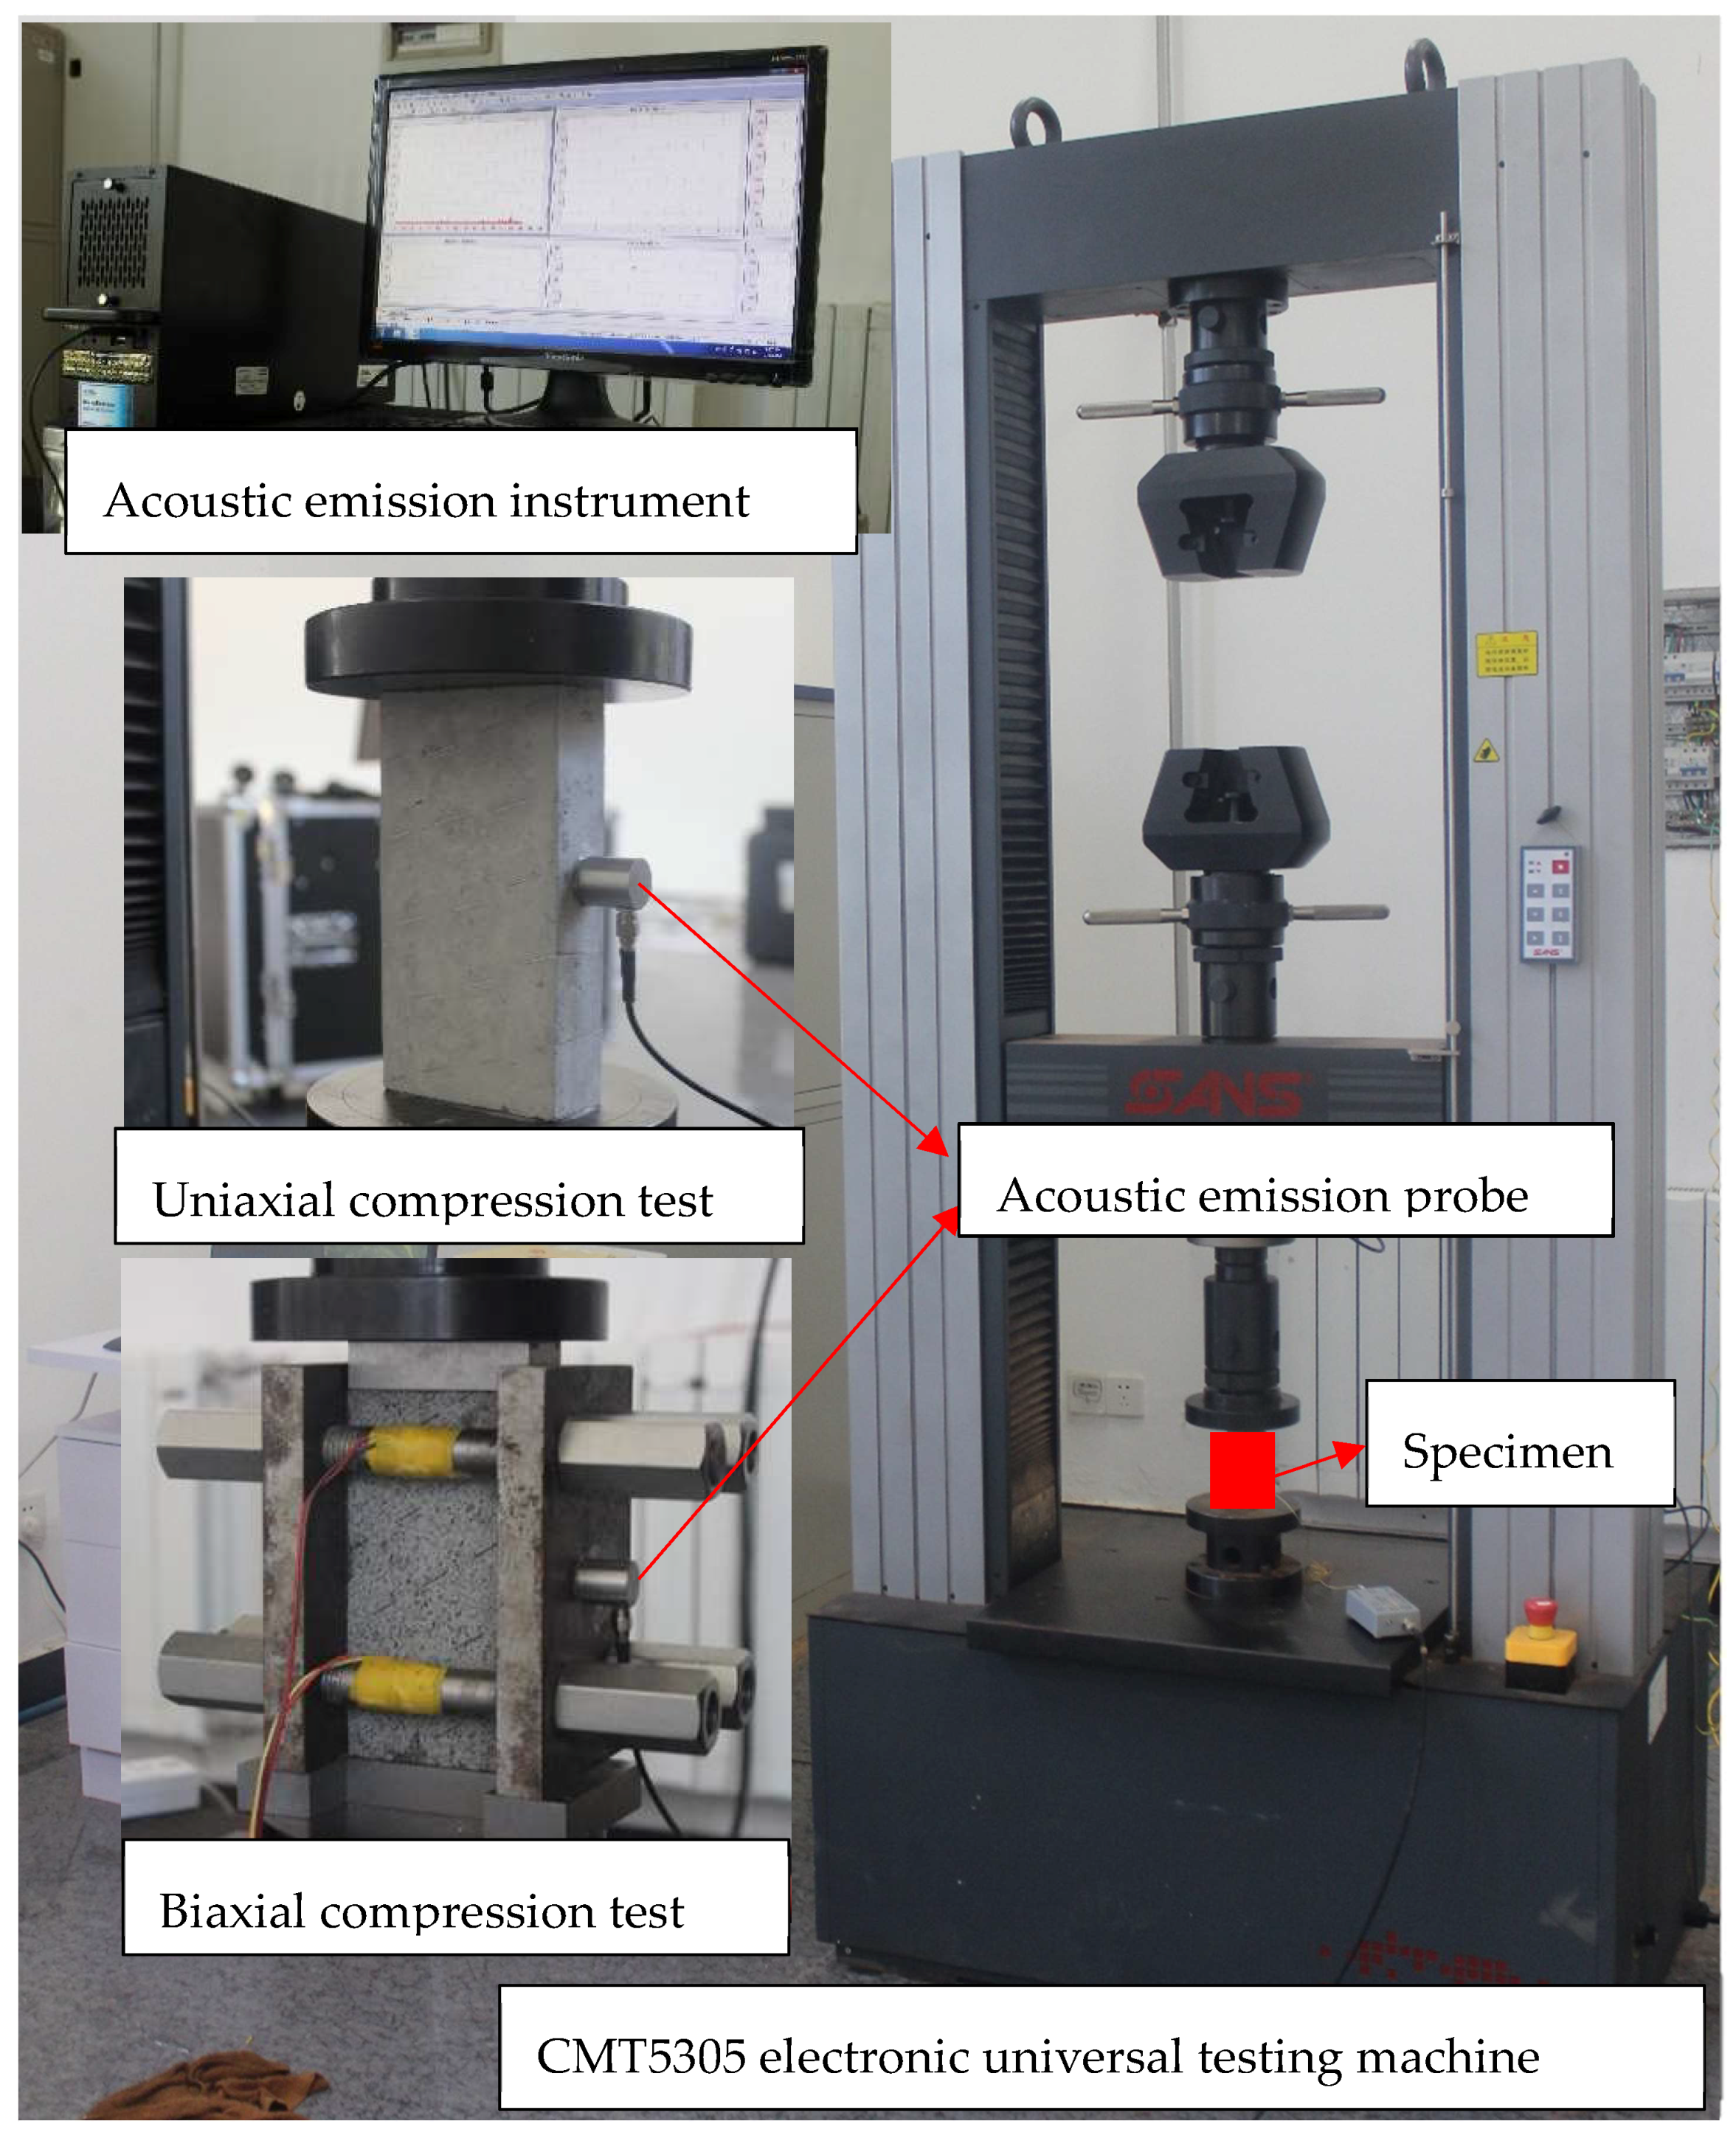
2.3. Experimental Unit

The compression tests of the specimens were carried out on the CMT5305 electronic universal testing machine with a loading rate of 3 × 10⁻³ mm per second [27], as shown in Figure 2. However, the uniaxial compression tests were carried out directly on the machine, while the biaxial compression tests were carried out on the machine under the action of lateral restraint. The acoustic emission (AE) signal was collected during the experiment by an AE instrument coded as Express-8, which was made from the PAC Company (New York, NY, USA). In addition, a high-resolution camera (2560 × 1440) was used to capture the images during the whole process of the experiment.

3. Results and Analysis

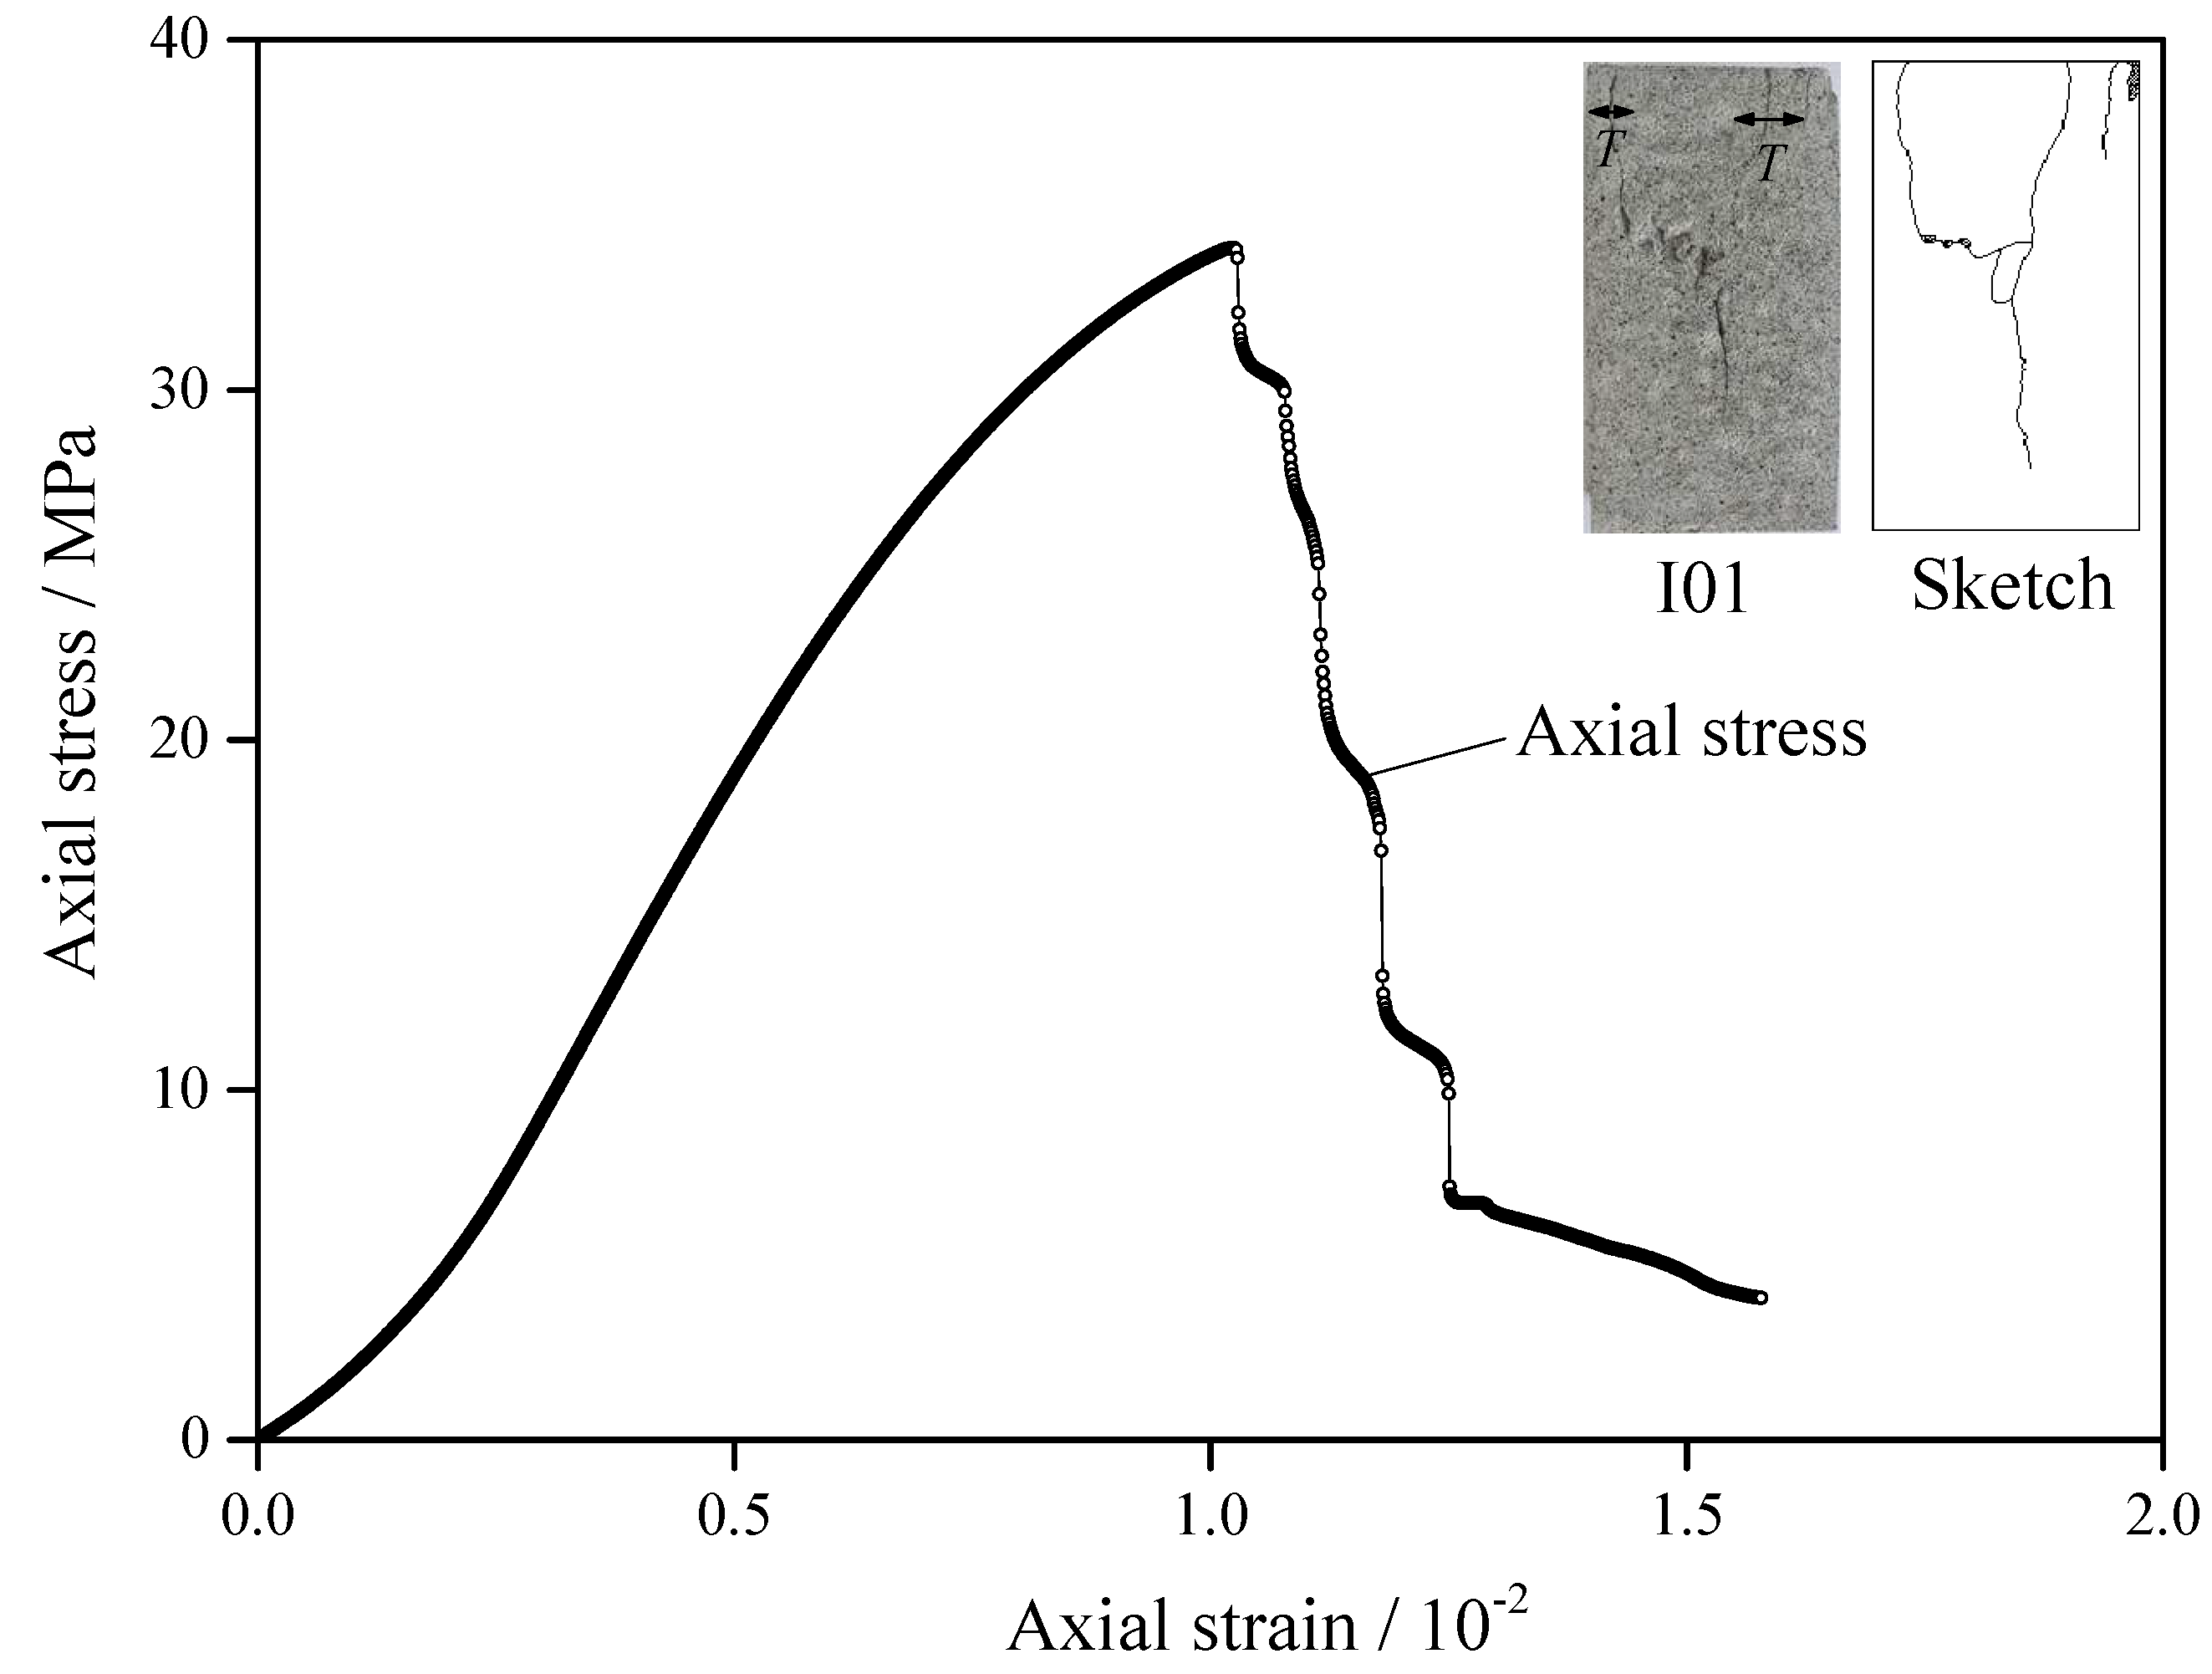
3.1. Mechanical Properties of Intact Specimen under Uniaxial Compression

The failure mode and the axial stress–strain curve of an intact specimen (No. I01) under uniaxial compression are shown in Figure 3, and the sketch was displayed after the failure stage. The mechanical parameters of both the intact specimens and the fractured specimens under uniaxial and biaxial compressions are shown in Table 1. For both uniaxial and biaxial compression tests, formula (1) was used to calculate the strengths.
R c = P c A
Here, R c represents the strengths, P c represents the maximum axial stress, and A represents the cross-sectional area of the specimen. The uniaxial compressive strength of intact specimens numbered I01 and I02 are 34.05 MPa and 33.60 MPa, respectively, and the standard deviation is 6.65 × 10⁻³. The elasticity modulus of intact specimens numbered I01 and I02 are 4.86 GPa and 4.83 GPa, respectively, and the standard deviation is 3.10 × 10⁻³. The homogeneity of the intact specimens is obvious due to the small values of standard deviations of both the uniaxial compressive strength and the elasticity modulus. Figure 3 describes how splitting failure occurs in the specimen under uniaxial compression. Several fractures are produced along the stress loading direction. In addition, during the loading, flake exfoliation appears on the surface of the specimen, which indicates that the specimen constructed of similar materials in our study presents obvious brittle characteristics.

3.2. Effect of α under Uniaxial Compression

(1)
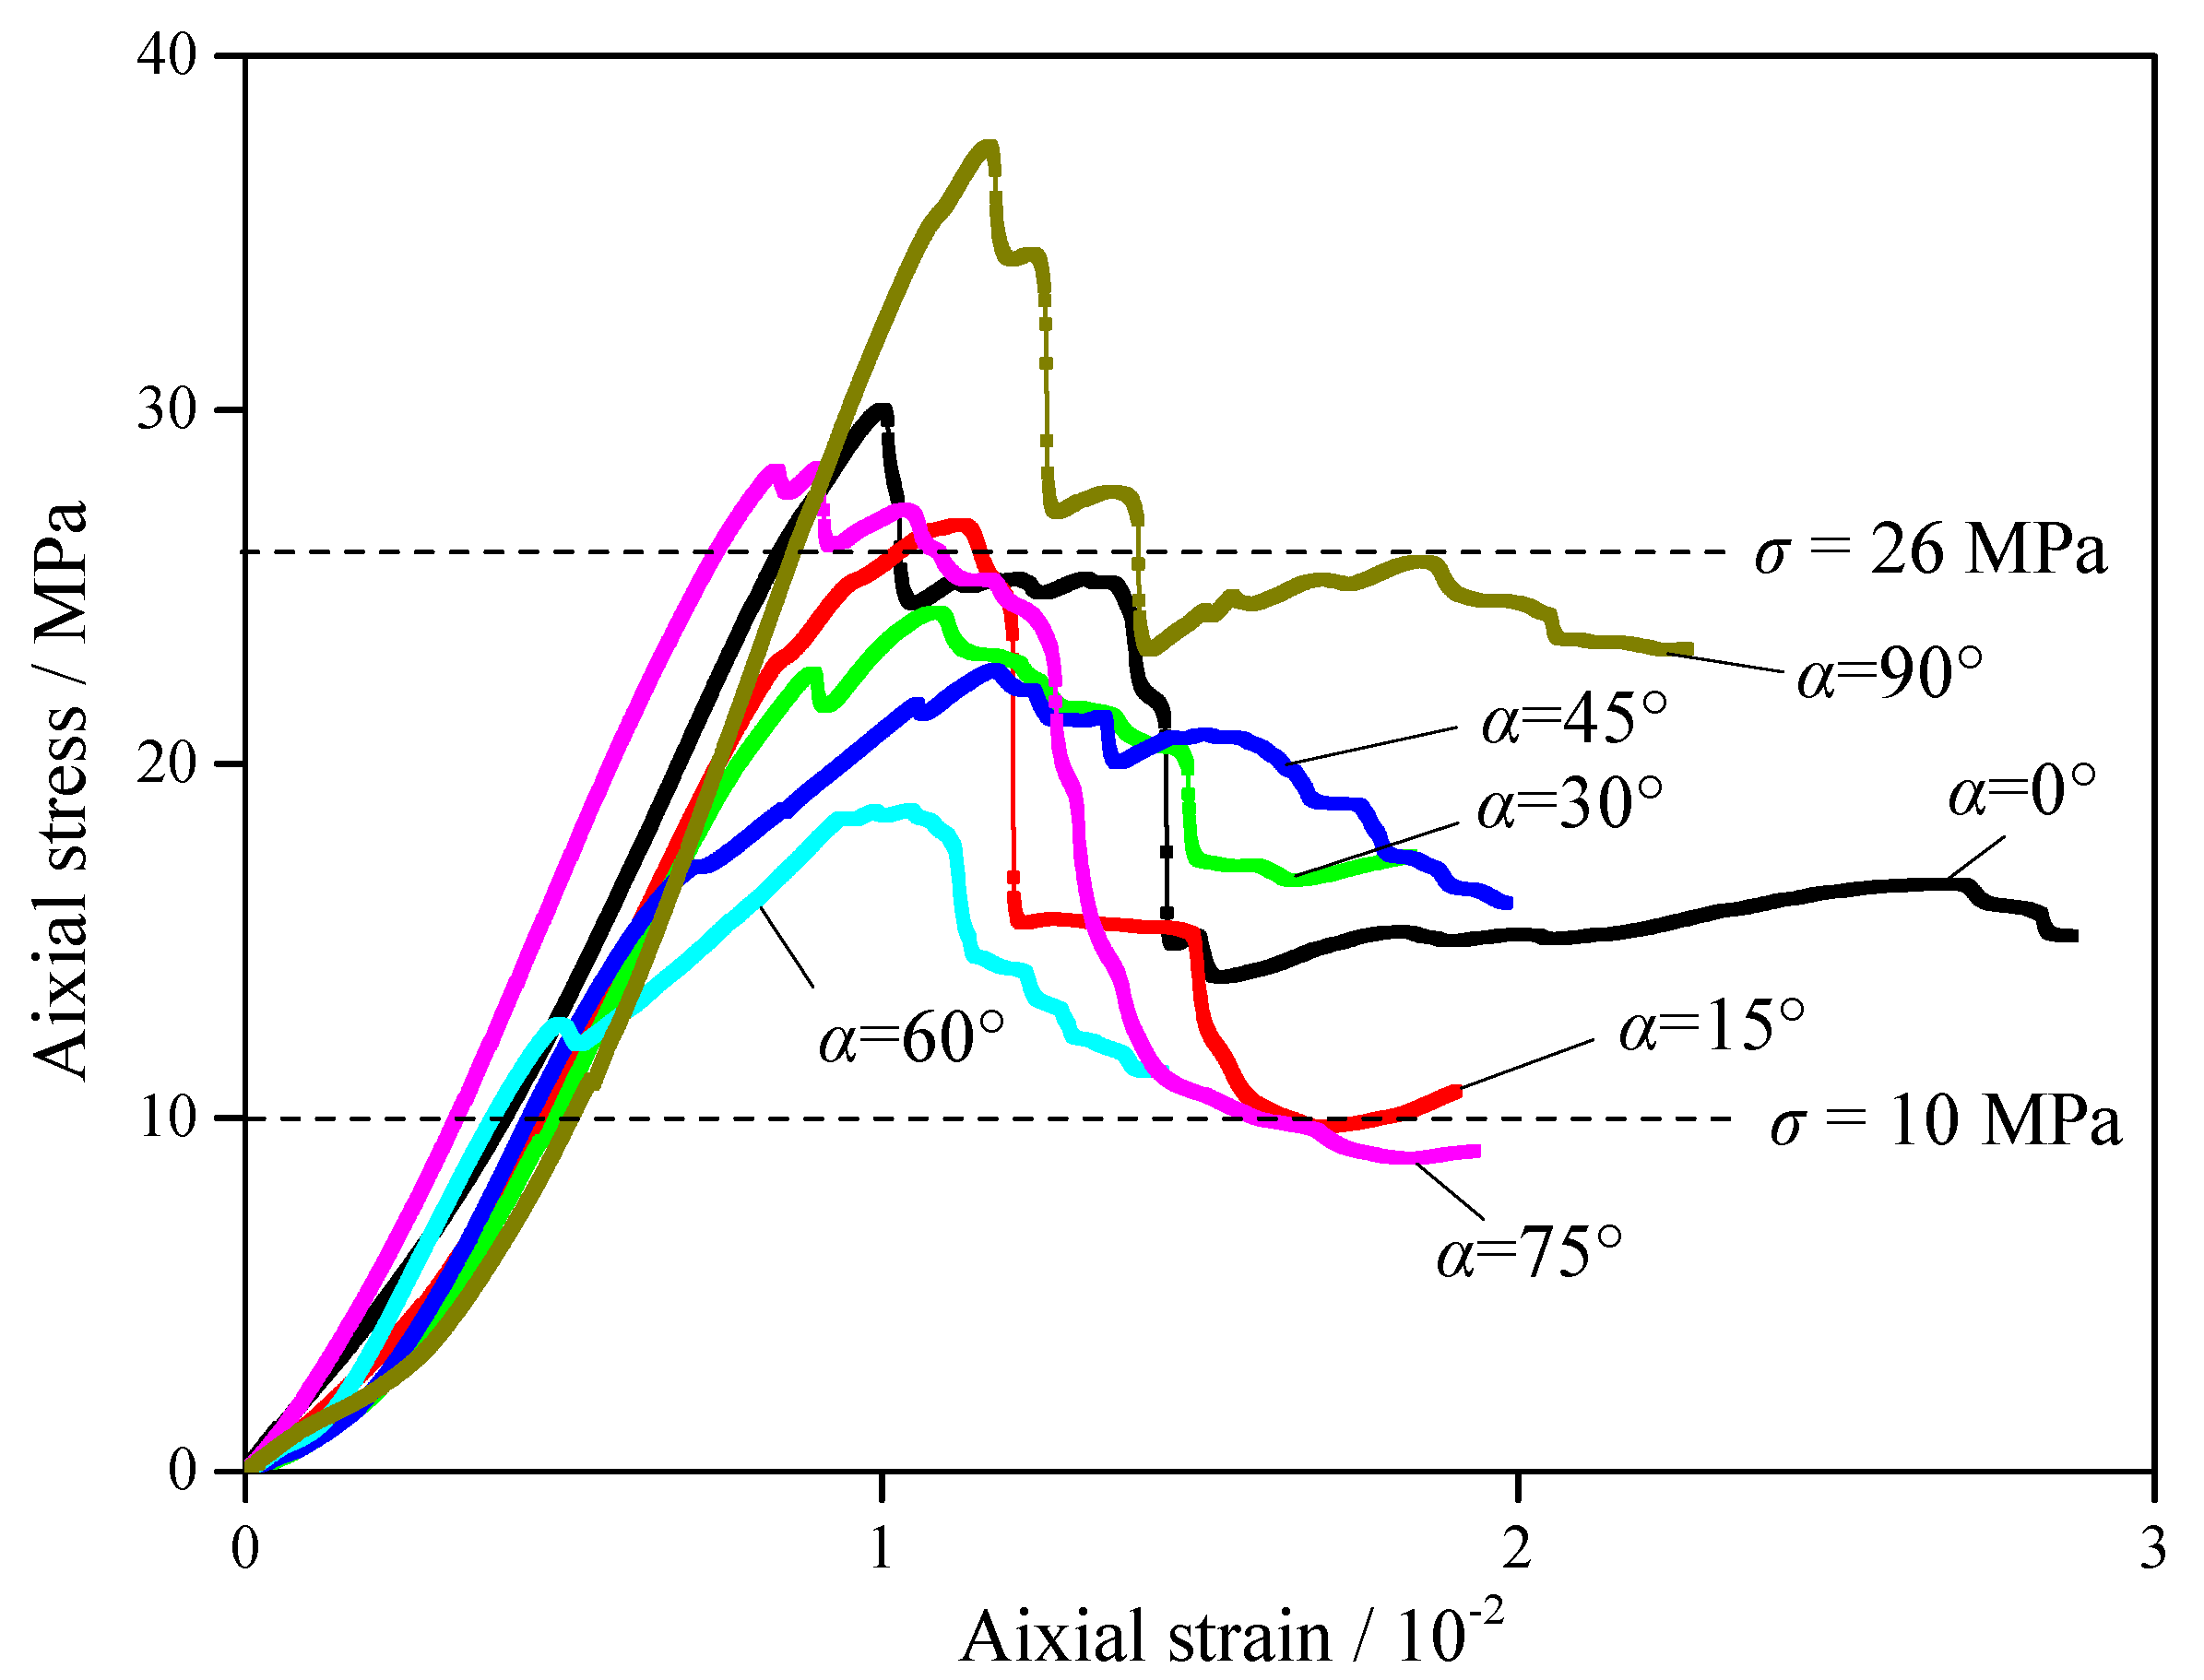
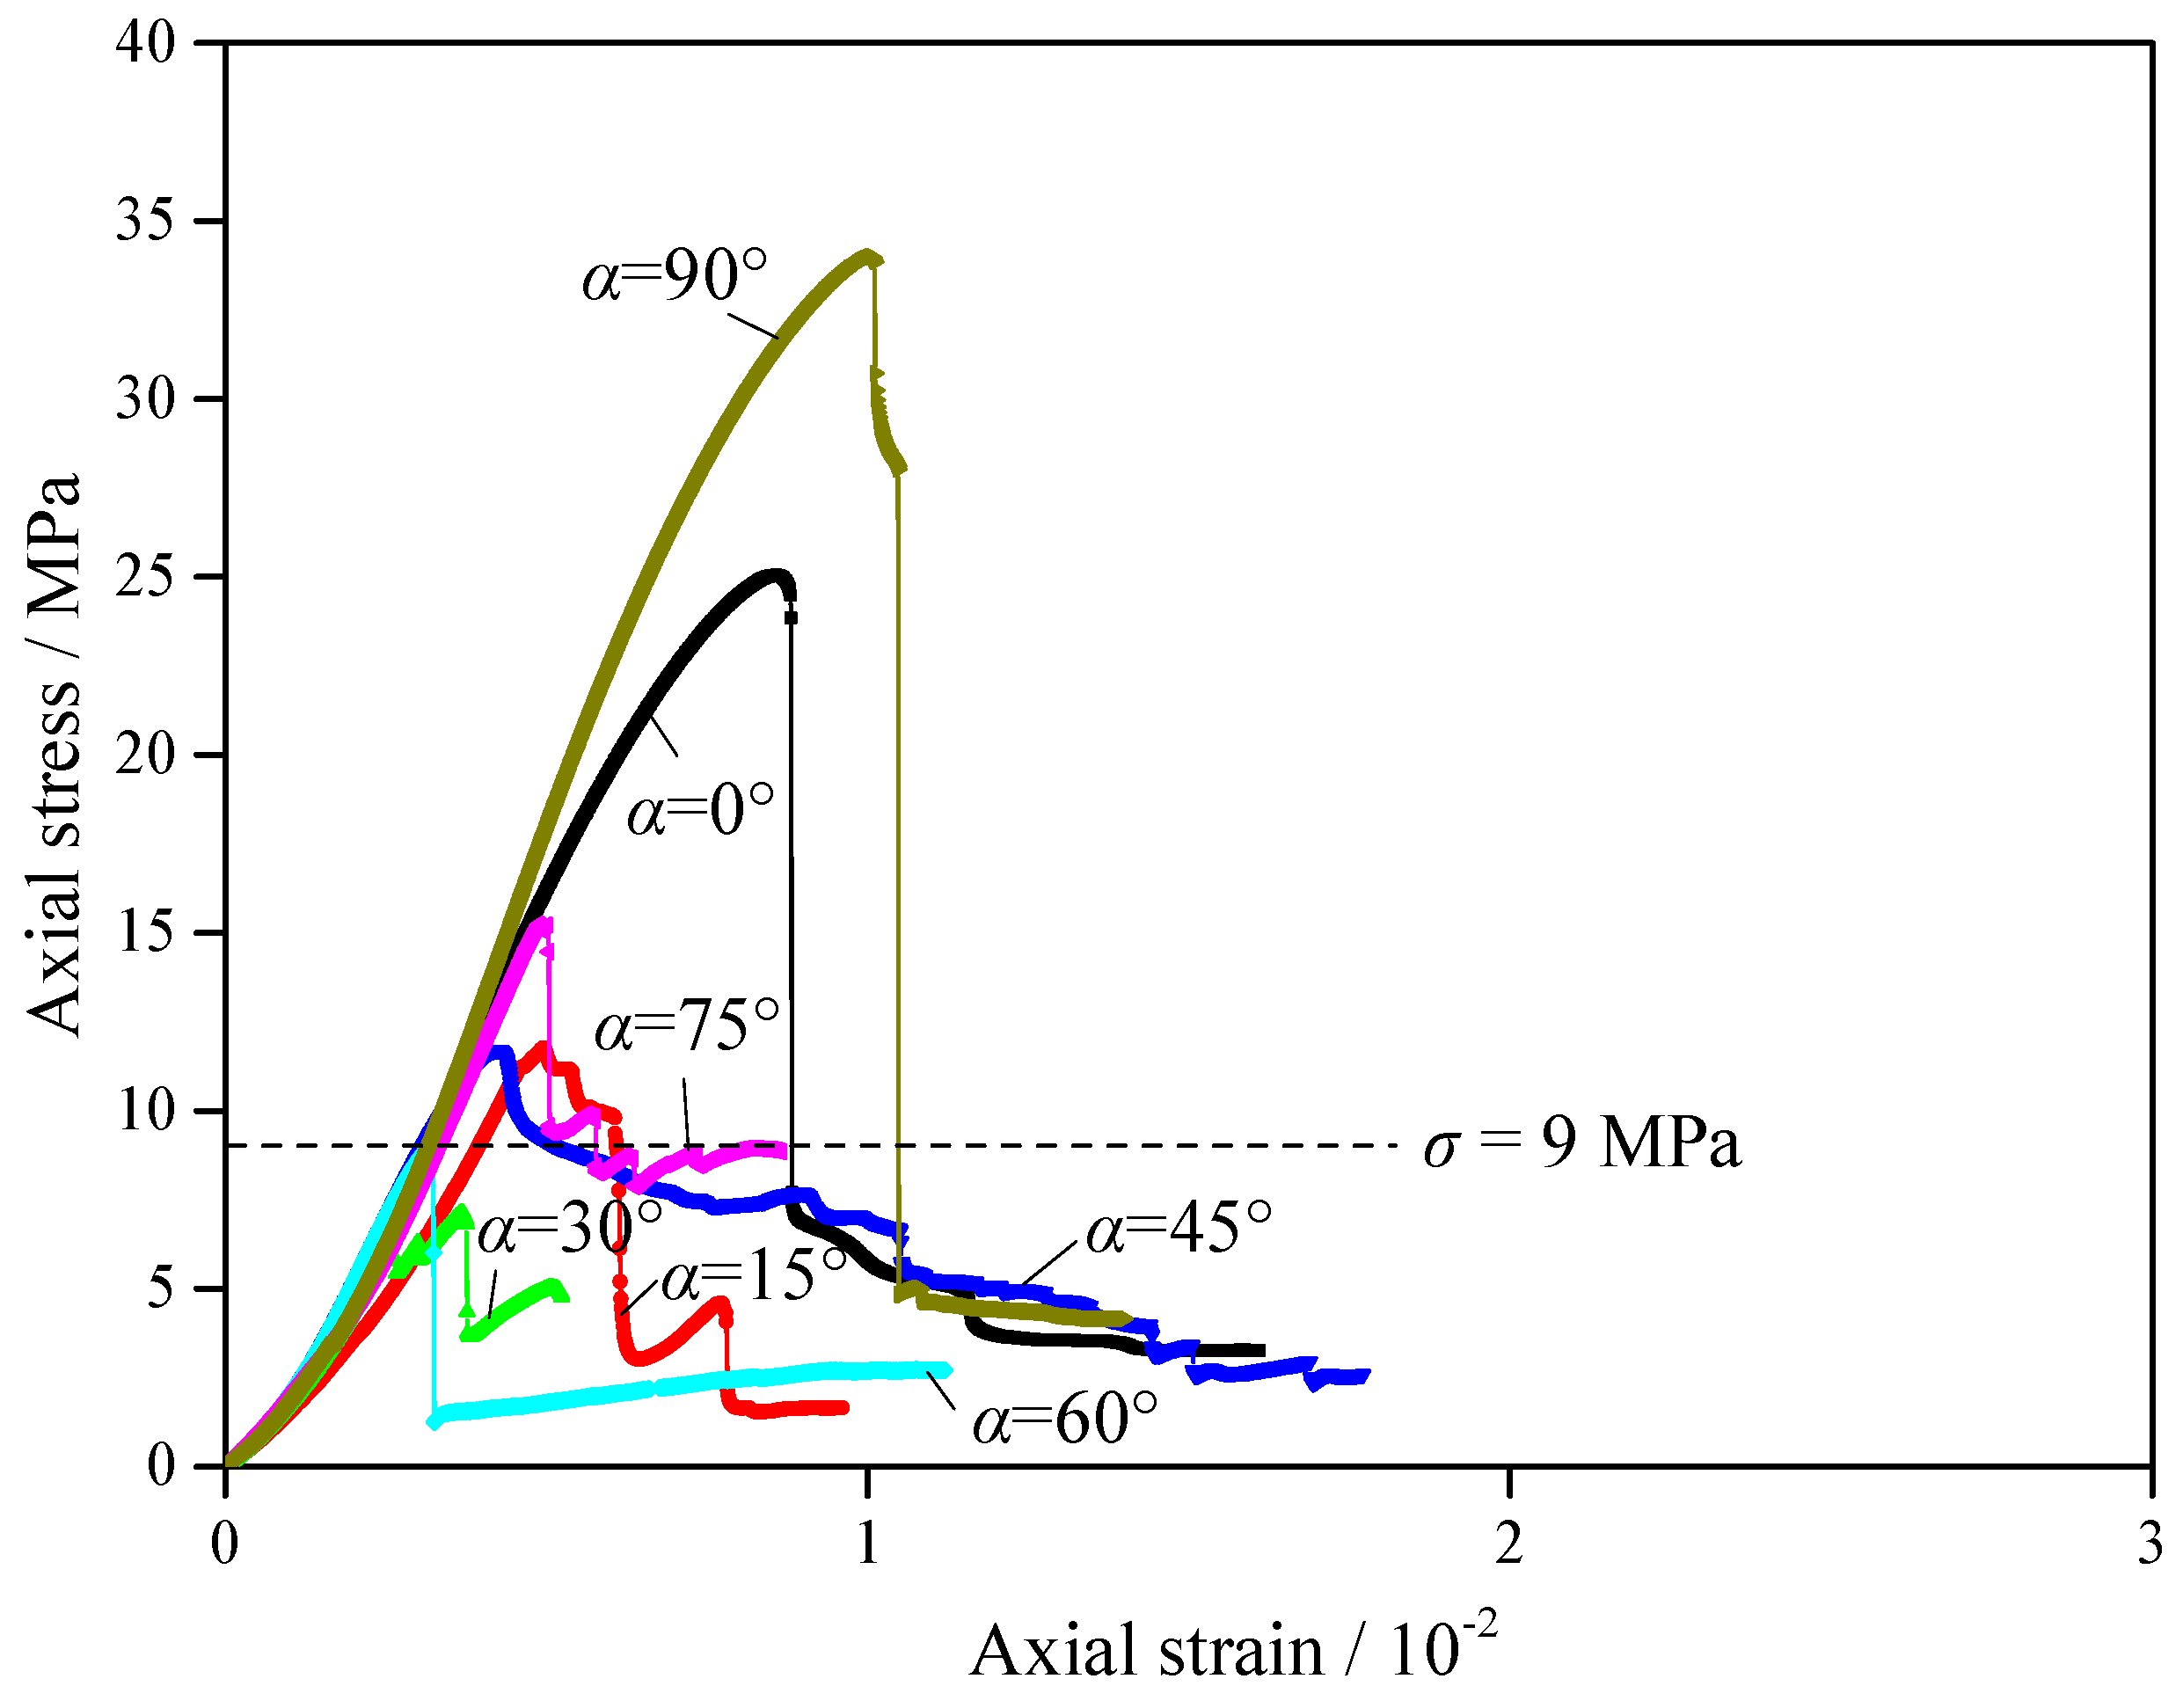
Figure 4 shows the axial stress–strain curves of specimens with different α under uniaxial compression. When α = 0°–90°, the axial stress–strain curve appears to undergo multiple drops in the pre-peak and post-peak stage, which indicates that the specimens maintain a clearly brittle characteristic. In addition, the residual strengths of the specimens under uniaxial compression are less than 9 MPa.
(2)
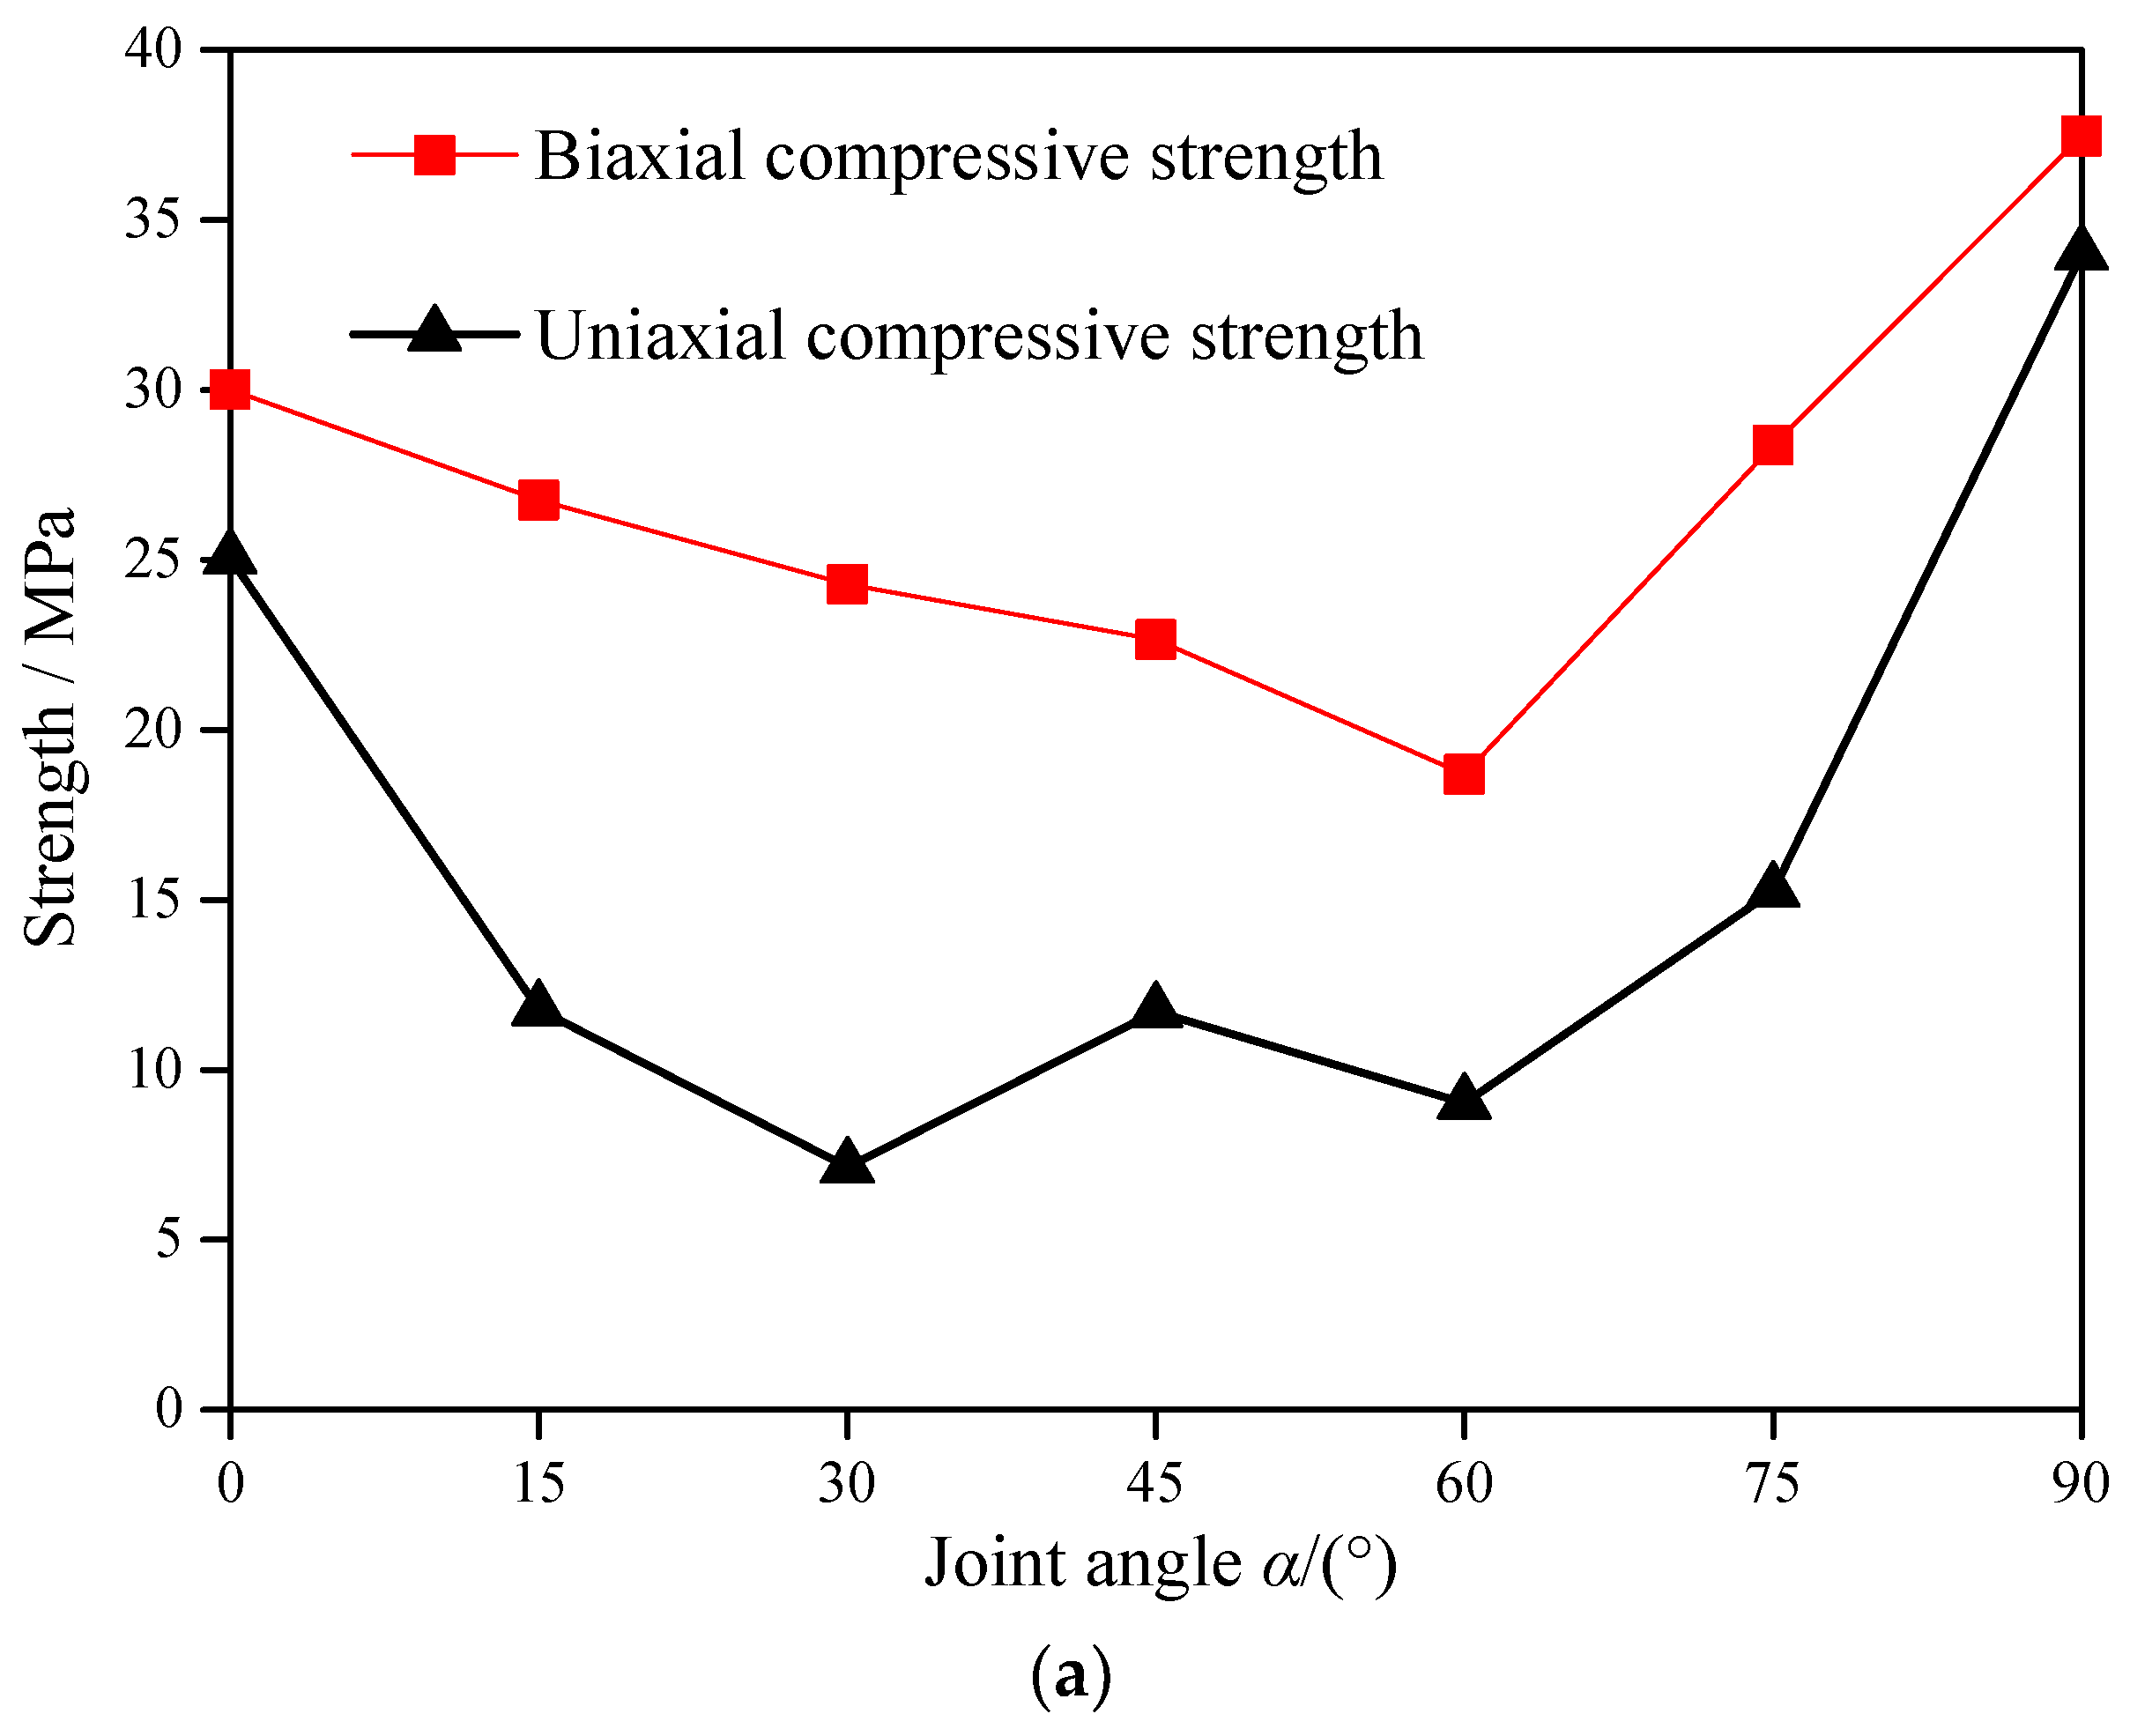
Figure 5a depicts the relationship between uniaxial/biaxial compressive strength and α. The uniaxial compressive strength shows a W-shaped change with an increase in α, which is consistent with that reported by Chen et al. (2013). As α increases from 0° to 30°, the uniaxial compressive strength decreases from 25.04 MPa to 7.14 MPa, which is a reduction of 71.5%. As α increases from 30° to 60°, the uniaxial compressive strength fluctuates within a small range. When α continuously increases from 60° to 90°, the uniaxial compressive strength increases from 9.01 MPa to 33.99 MPa, which is an increase of 277%. When α = 90°, the uniaxial compressive strength is 35.7% higher than that of α = 0°. Therefore, when the direction of the fractures is perpendicular to the loading direction (α = 90°), the bearing capacity of the specimen is at its largest, followed by that parallel to the loading direction (α = 0°). However, the uniaxial compressive strength of the specimens has a minimum value when α = 30°, which is slightly lower than that for α = 60°.
(3)
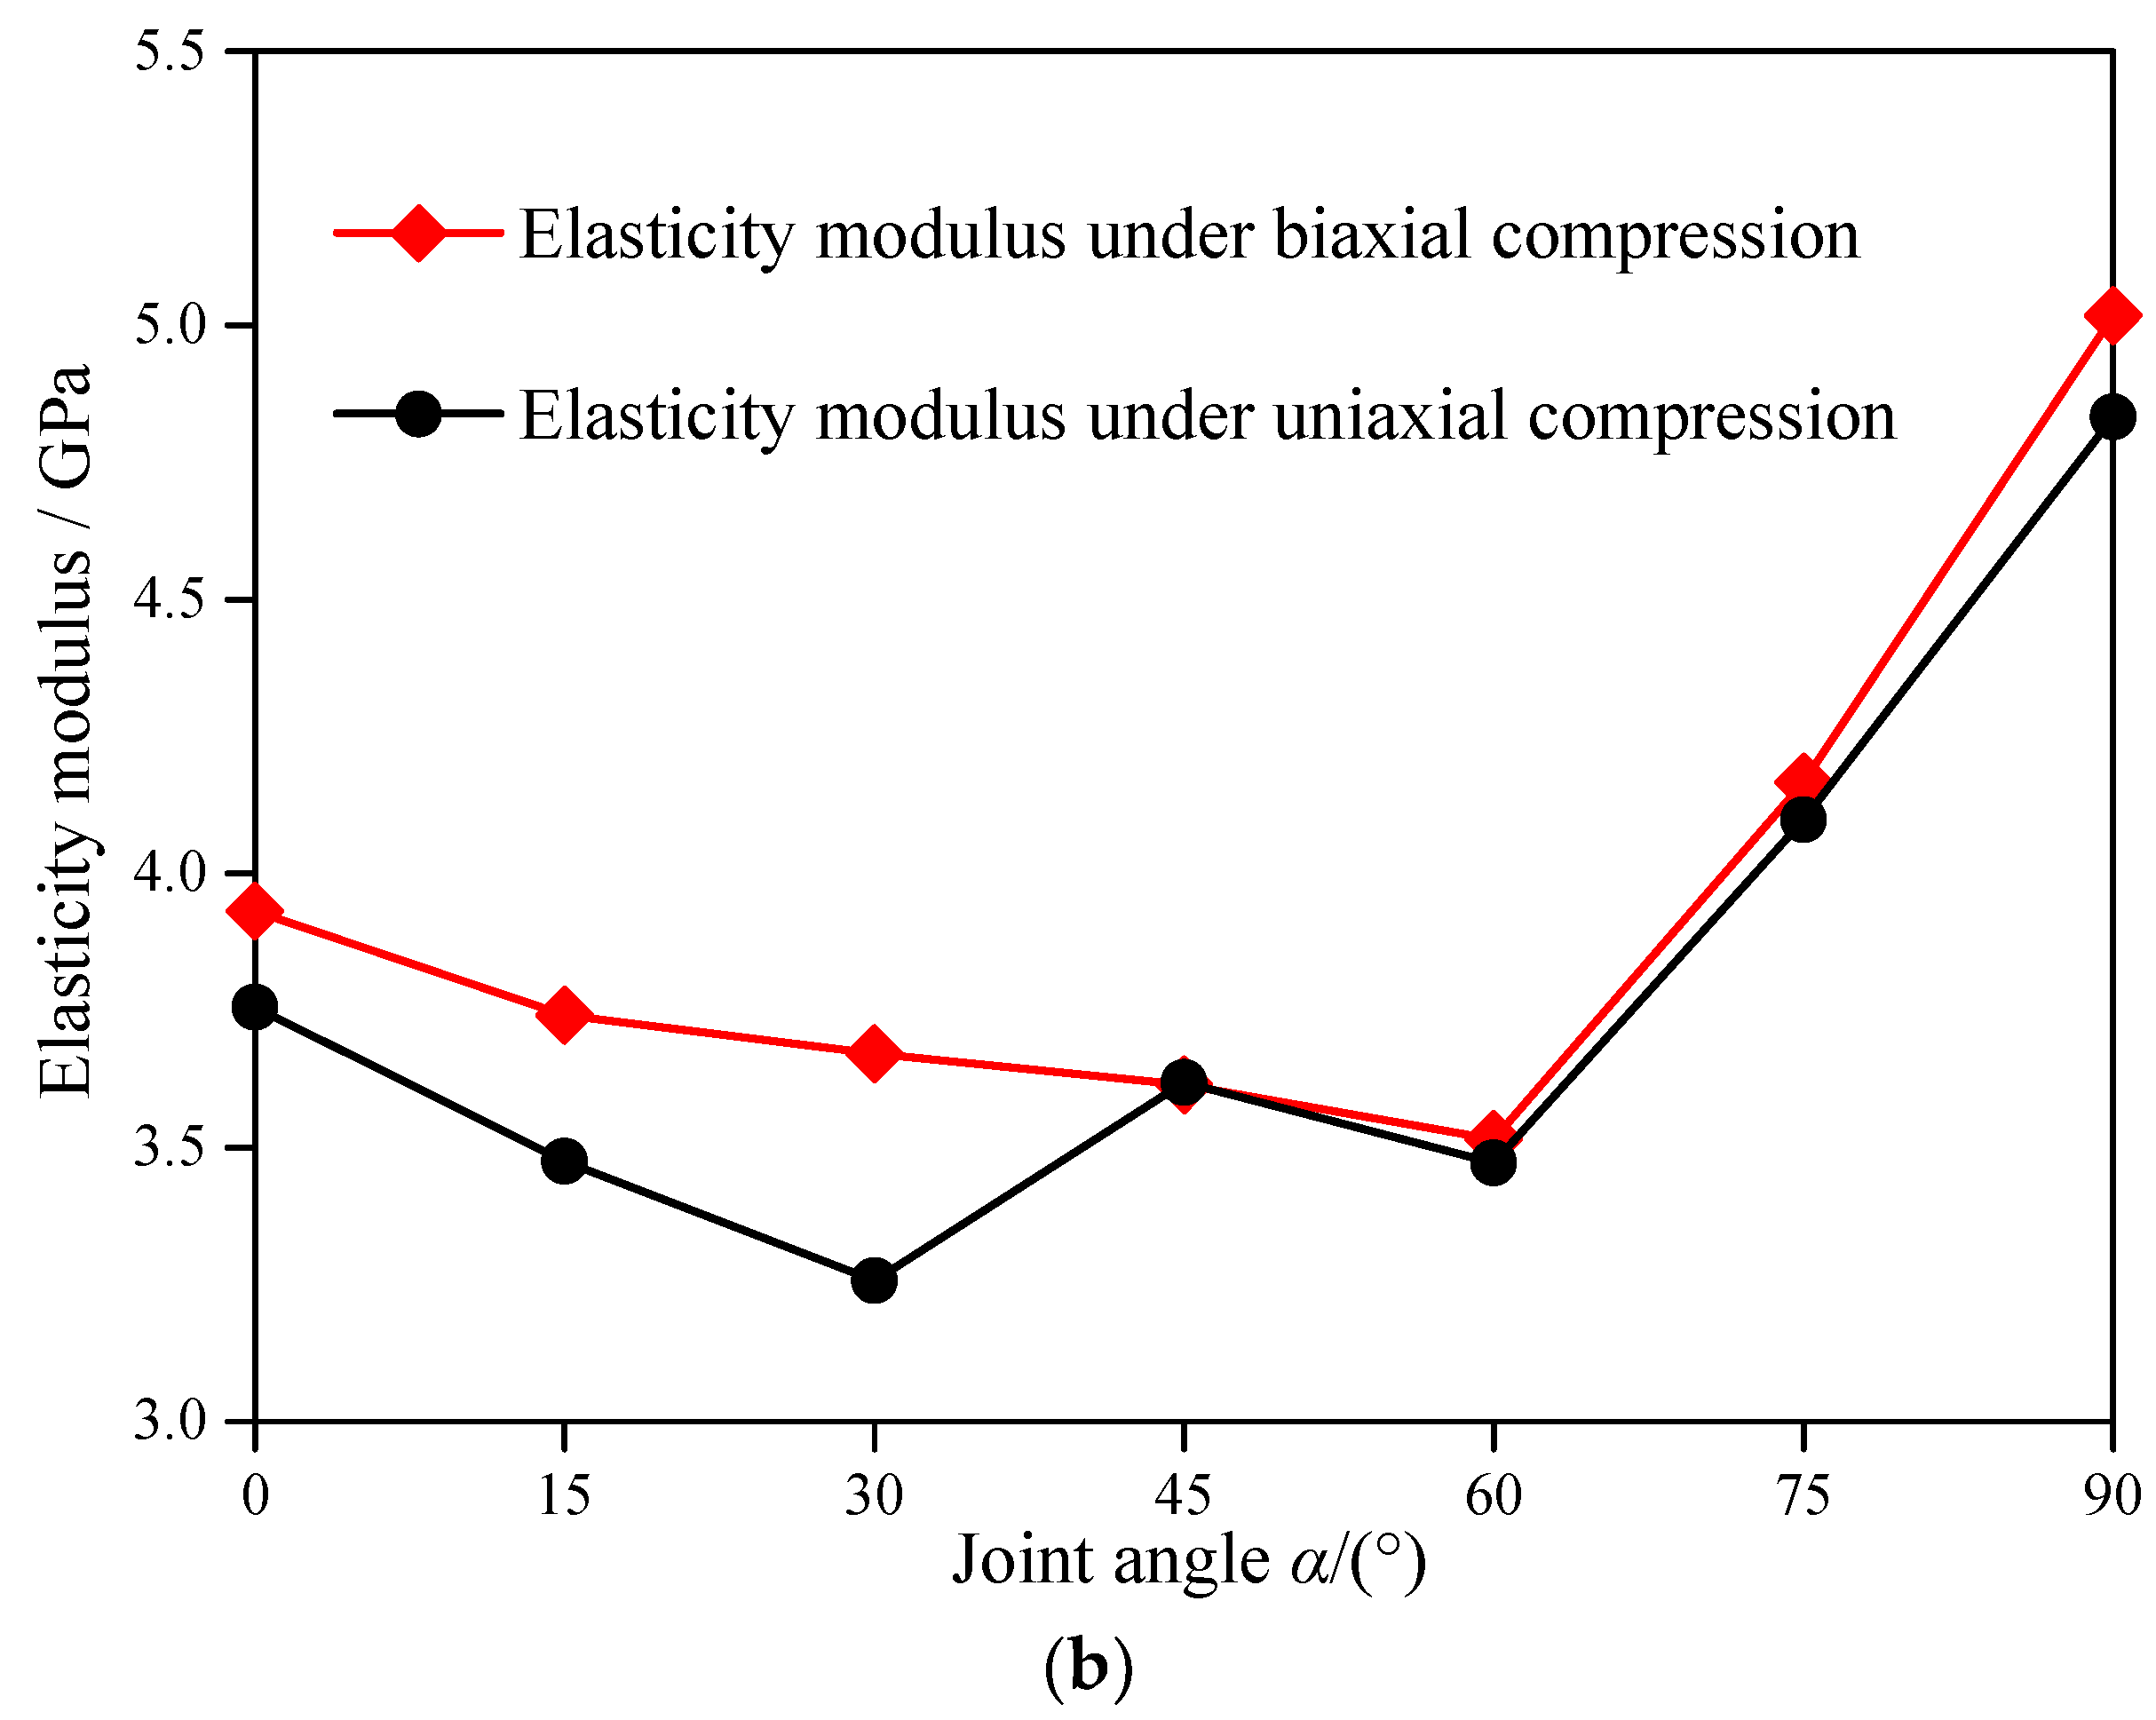
Figure 5b presents the relationship between the elasticity modulus and α. For uniaxial compression tests, the elasticity modulus shows a W-shaped variation with an increase in α, which is similar to that in Figure 5a. As α increases from 0° to 30°, the elasticity modulus decreases from 3.76 GPa to 3.26 GPa, which is a reduction of 13.3%. As α increases from 30° to 60°, the elasticity modulus fluctuates within a small range. When α continuously increases from 60° to 90°, the elasticity modulus increases from 3.47 GPa to 4.83 GPa, which is an increase of 39.2%. When α = 30°, the elasticity modulus of the specimen reaches its minimum value, which is 67.3% of the average value of the maximum elastic modulus of the intact specimen. When α = 90°, the elasticity modulus of the specimen reaches its maximum value, which is 99.7% of the average value of the maximum elastic modulus of the intact specimen.

3.3. Effect of α under Biaxial Compression

(1)
Figure 6 displays the axial stress–strain curves of specimens with different α under biaxial compression. In contrast to uniaxial compression, all the axial stress–strain curves show multiple peaks under biaxial compression. The residual strengths of the specimens under biaxial compression are between 10–26 MPa, which are obviously greater than that of uniaxial compression. The plastic deformation ability of the post-peak stage under biaxial compression is improved when the joint orientation and the loading direction have a certain angle (α = 0°–90°).
(2)
Figure 5a depicts the relationship between the strength and the α of specimens. For biaxial compressions, the biaxial compressive strength shows a V-shaped change with an increase in α. When α = 60°, the biaxial compressive strength of the specimen reaches a minimum value of 18.69 MPa, while the biaxial compressive strength of the specimen reaches a maximum value of 37.46 MPa when α = 90°. When α is fixed, the biaxial compressive strength of the specimen is much greater than that of uniaxial compressive strength, as shown in Table 2. When α is 0° and 90°, the biaxial compressive strength of the specimen is increased by 19.82% and 10.21% compared with uniaxial compressive strength, respectively. For α = 15°–75°, the biaxial compressive strength of the specimen increases by more than 85.96% compared with uniaxial compressive strength; for example, when α = 15°, the biaxial compressive strength is increased by 127.19% compared with uniaxial compressive strength.
(3)
Figure 5b exhibits the relationship between the elasticity modulus and α of the specimen. For biaxial compressions, the elasticity modulus under biaxial compression shows a V-shaped change with an increase in α. As α increases from 0° to 60°, the elasticity modulus under biaxial compression decreases from 3.93 GPa to 3.51 GPa, which is a reduction of 10.69%. When α increases from 60° to 90°, the elasticity modulus under biaxial compression increases from 3.51 GPa to 5.02 GPa, which is an increase of 43.02%. Since α is a constant, the elasticity modulus of the specimen under biaxial compression has an increase of approximately 12.58% with respect to that of uniaxial compression, as shown in Table 2.

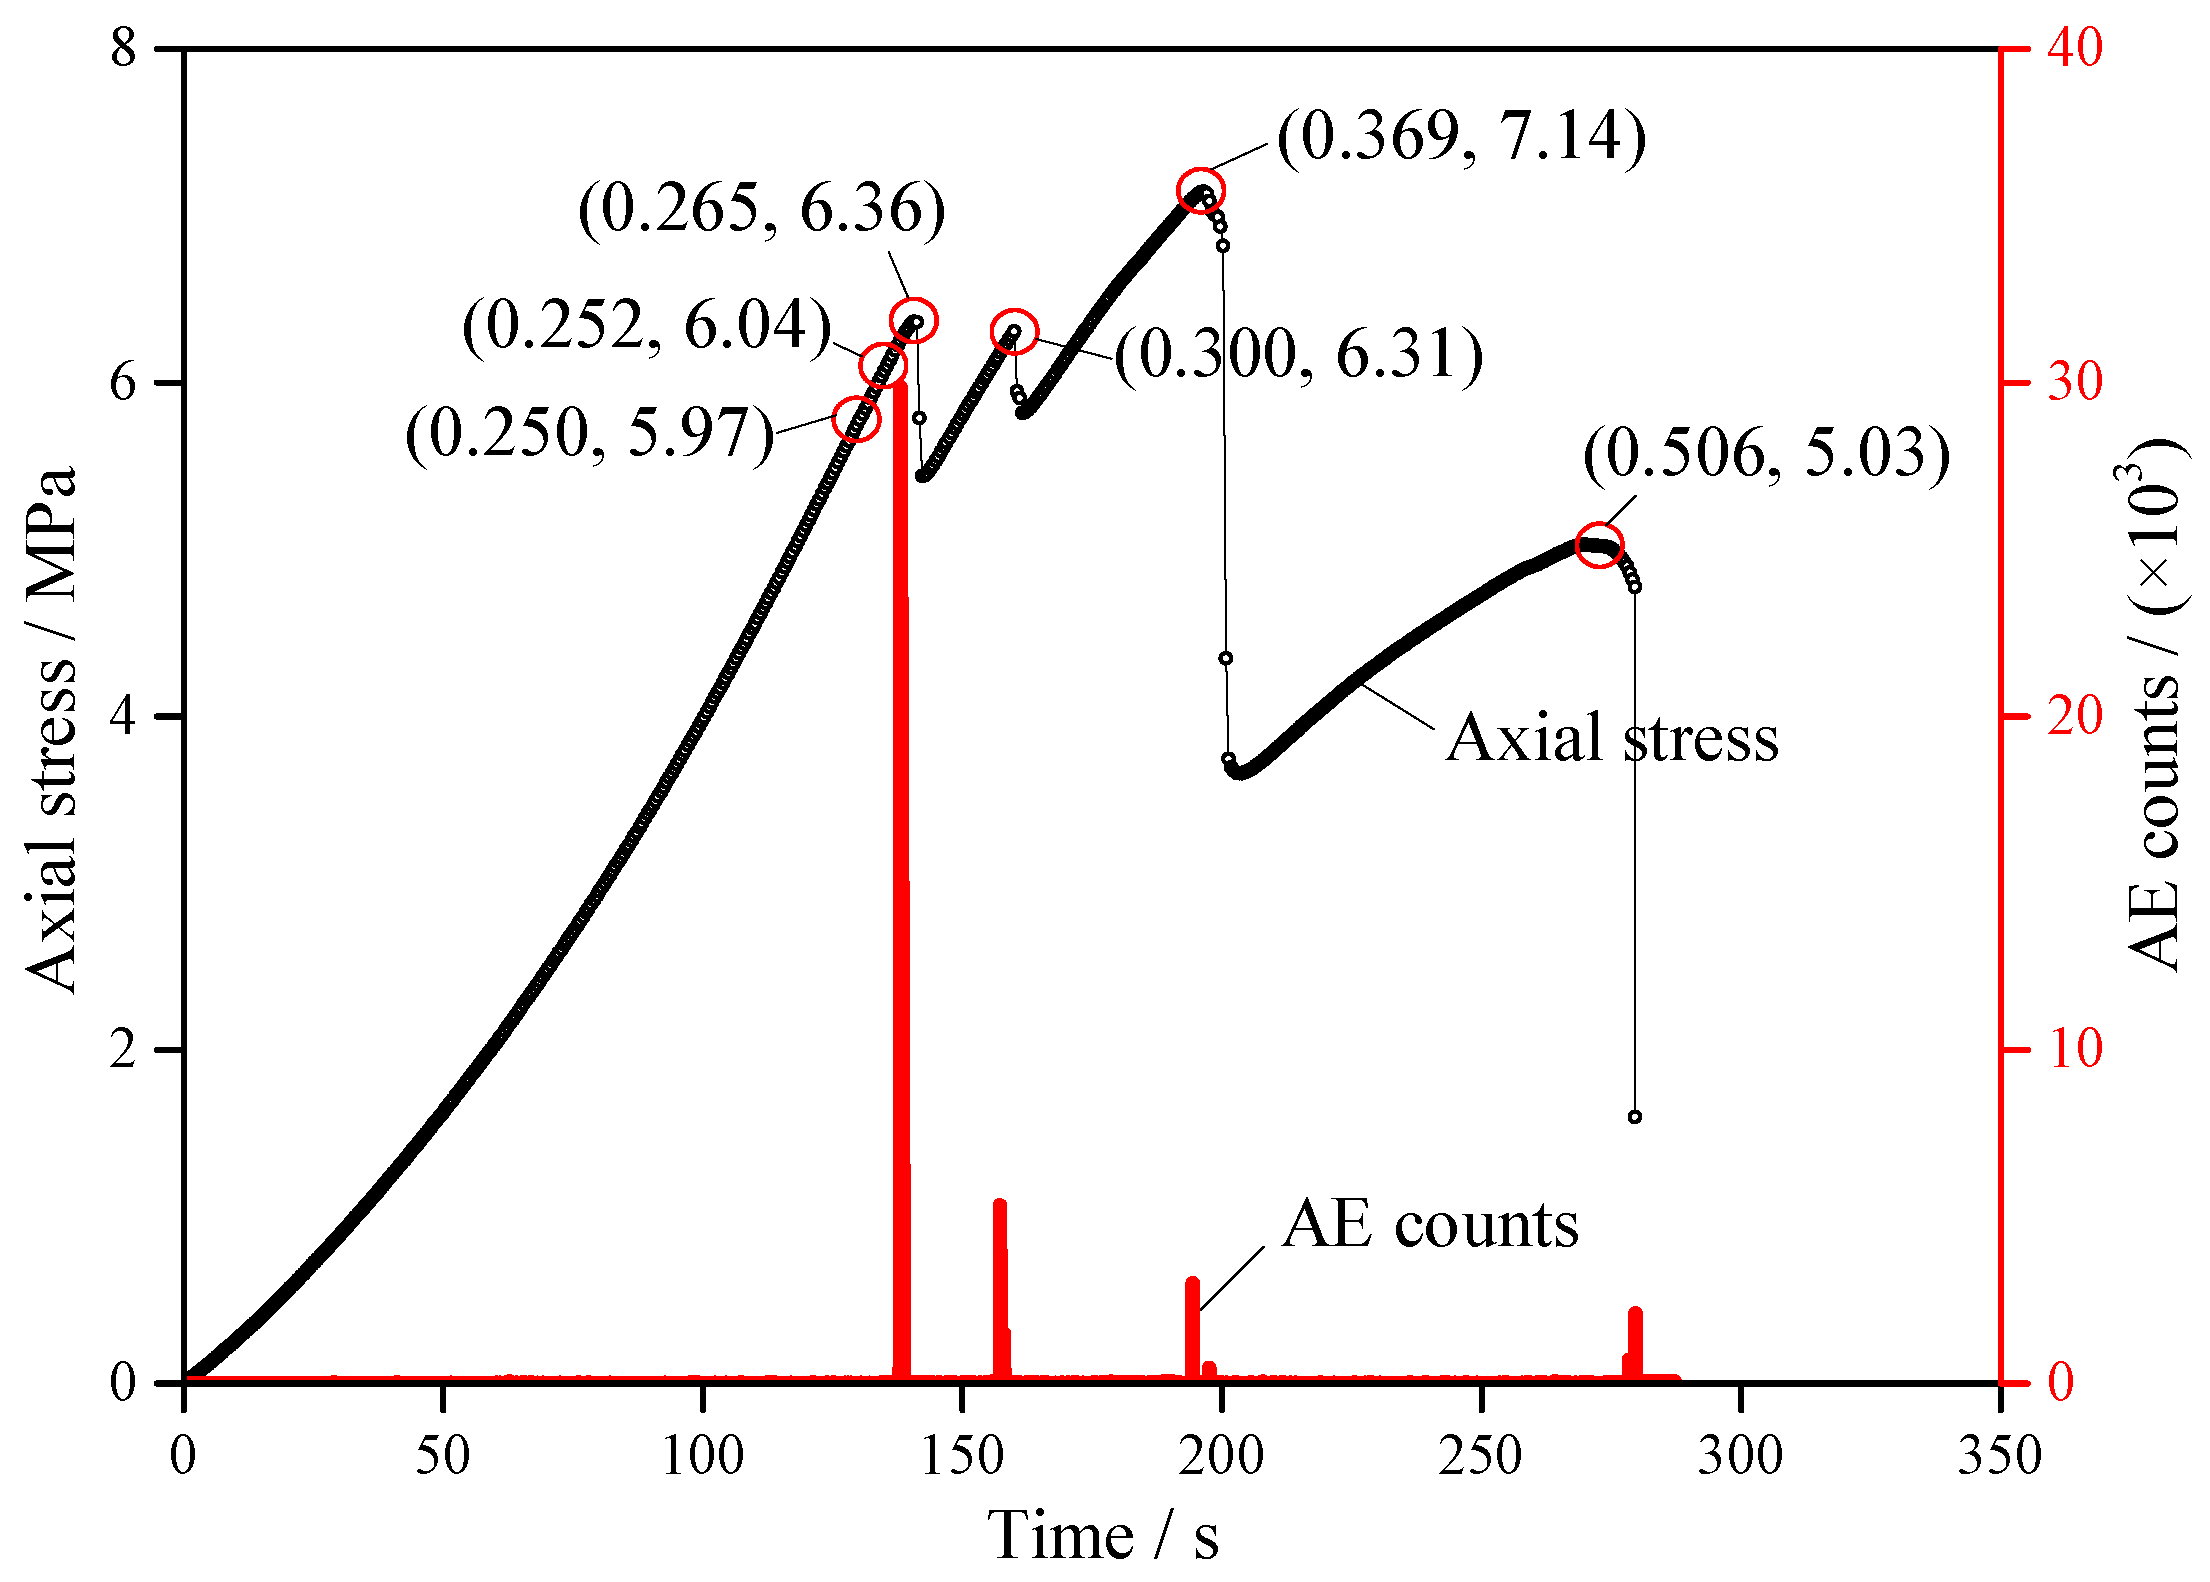
3.4. Analysis of Crack Propagation and AE Response Characteristics

Figure 7a–f display the fracture evolution of specimen U03 (α = 30°), and Figure 7g–l describe a sketch map of Figure 7a–f. Figure 8 depicts the corresponding AE response characteristics. The ε1 and σ in the form of (ε1, σ) in Figure 7 and Figure 8 represent the axial strain and stress corresponding to a point on the axial stress–strain curve. The axial strain is 1000 times of the actual value, which does not have a dimension, and the unit of axial stress is MPa.
In Figure 8, the AE counts were almost zero when increasing ε1 from 0 to 0.25. This mainly included the compaction and the elastic deformation stage of the specimen. The original crack in the specimen was closed and a part of the elastic deformation was produced. There were no new cracks generated; therefore, there were few AE counts. The triggering threshold set for this AE test was 100 mV.
When ε1 = 0.250, which corresponded to an axial stress of 5.97 MPa, the specimen produced a crack (1# crack) at the tip of the prefabricated filled joint because the rock near the tip of the joint reached the tensile strength of the similar material. When ε1 = 0.252, which corresponded to an axial stress of 6.04 MPa, the 1# crack was extended and connected to the joint tip of the upper layer. Meanwhile, the specimen produced the 2# crack. During this period, the bearing capacity of the specimen was not affected, and the specimen maintained a good integrity. When ε1 = 0.265, which corresponds to an axial stress of 6.36 MPa, the apertures of both 1# and 2# cracks increase, and the specimen produces 3–6# cracks, which leads to a drop in stress on the stress–time curve. The AE counts increased and reached their peak at this moment. When ε1 = 0.300, which corresponds to an axial stress of 6.31 MPa, the apertures of the 1–6# cracks continued to increase, and the specimen produced 7–13# cracks, which led to another drop in stress on the stress–time curve. At this point, the central column of the specimen had not been damaged; therefore, the specimen still maintained a good bearing structure. The axial stress of the specimen rose again with the continuous increase in the deformation. When ε1 = 0.369, which corresponds to an axial stress of 7.14 MPa, the axial stress of the specimen reached its peak value. The apertures of the 1–13# cracks increased obviously and the specimen produced 14–15# cracks, which led to the third drop in stress that decreased from 7.14 MPa to 3.74 MPa at a rate of 47.62%. The 9–11# cracks were connected to each other on the left side of the specimen, forming the broken zone I. The structure of the specimen was destroyed to some extent; however, it still had bearing capacity. The axial stress of the specimen increased slowly as the axial strain increased from 0.369 to 0.506. When ε1 = 0.506, which corresponded to an axial stress of 5.03 MPa, 1–15# cracks continued to expand and the specimen produced 16–18# cracks, the 1–2# and 5–6# cracks were connected to each other on the right side of the specimen, forming the broken zone II. Finally, the axial stress quickly fell to 1.60 MPa with the failure of the specimen.
By analyzing the crack evolution of specimen U03 (α = 30°), we found that most of the cracks appeared in pairs around the joint and occurred symmetrically in a bilateral distribution. The existence of the infilled joint induced a nonlinear mechanical behavior in the specimen.

3.5. Error Analysis and Supplemented the Highlights and Limitations of This Study

In addition to the intact specimens, no error analysis was made for the other tests as only one specimen was used for each working condition. We will complete 3–5 sets of experiments for each dip angle and conduct an error analysis in future works. Moreover, the uniaxial and biaxial compression tests of the infilled joint rock masses were conducted in our paper, and we found that the dip angle of the infilled joint greatly affected the mechanical behavior and deformation characteristics of the specimen. However, more than seven angles should be used to accurately analyze the minimal strength of the infilled joint specimen in future works, and we also need more samples to classify the failure modes carefully. In addition, the distribution characteristics of infilled joints in rock masses are also affected by other factors, such as the joint spacing, the joint width and the joint connectivity. Therefore, more tests will be carried out in the future.

4. Evolution of Failure Mode

4.1. Effect of α

The final failure modes of the specimens with different α under uniaxial compression are shown in Figure 9. For the convenience of reading and understanding, we define the plane where the central joint is located as the main plane, and the planes on both sides of the major plane are defined as minor planes. When α = 0°, the final failure mode of the specimen was a splitting failure of type 1, in which the specimen split along the width direction. A main crack was produced along the direction of stress loading, and the expansion and penetration of the main crack led to the failure of the specimen (Figure 9a). When α = 15°–30°, the failure modes of the specimens were step-path failures. The step-path failure mainly includes the following three characteristics: (1) cracks at the tip of the infilled joint; (2) cracks appear in pairs, in which cracks are produced at both ends of the infilled joint; (3) connected cracks, in which the crack at the left end of the upper layer is connected with the crack at the right end of the next layer, and finally a crack in the vertical direction is formed (Figure 9b,c). The expansion and penetration of the step-path cracks led to the failure of the specimen. For α = 45°, the failure mode of the specimen was reflected by the combination of the step-path failure and the planar failure (Figure 9d), among which the planar failure was the dominant factor. Planar failure occurred in the main plane, and a pair of step-path cracks were produced on both sides of the main plane. When α = 60°–90°, the final failure mode of the specimens was a planar failure. When α = 60°, planar failure occurred in the main plane (Figure 9e); when α = 75°, planar failure occurred in the main plane and the two minor planes (Figure 9f); when α = 90°, planar failure occurred in the two minor planes (Figure 9g). The main plane did not break when α = 90°, which confirmed that the uniaxial compressive strength for α = 90° was higher than that with other values of α.

4.2. Effect of Biaxial Compression

Figure 10 displays the final failure modes of the specimens with different α under biaxial compression. The left figure of each pair is the side view of the specimen, and the right figure of each pair is the front view of the specimen. Under biaxial compression, the specimens exhibited two failure modes: (a) splitting failure of type 2, in which the specimen splits along the thickness direction, and (b) planar failure. When α = 60°, the final failure mode of the specimen was planar failure, and the planar failure occurred in the main plane (Figure 10e). The biaxial compressive strength of the specimen reached a minimum value of 18.69 MPa, which confirmed that the structure of the specimen was the most unstable of all the specimens. However, the failure mode of the specimen was splitting failure of type 2 when α = 0°–45° and 75°–90° (Figure 10a–d,f–g). The tensile cracks are marked in the red dotted circles. The crack growth on the surface of the specimen was effectively suppressed under biaxial compression, and the final failure mode of the specimen was more uniform than that of uniaxial compression. Therefore, the strength of the specimens had been improved.

5. Conclusions

In this study, the uniaxial and biaxial compression tests of the infilled joint rock masses were conducted. The mechanical behavior of infilled jointed rock masses was investigated. The influence of the orientation of the infilled joint on the mechanical properties and the failure modes were also studied by means of a series of models with various dip angles. In addition, the results obtained in our study were compared with the results of similar laboratory tests in the literature.
(1)
The uniaxial compressive strength shows a W-shaped change with an increase in the dip angle, and the uniaxial compressive strength of the specimens reached its minimal values at α = 30° and α = 60°.
(2)
The biaxial compressive strength shows a V-shaped change with an increase in the dip angle. When α = 60°, the biaxial compressive strength of the specimen reached a minimum value of 18.69 MPa, while when α = 90°, the biaxial compressive strength of the specimen reached a maximum value of 37.46 MPa. When the direction of the fractures was perpendicular to the loading direction (α = 90°), the bearing capacity of the specimen was the largest, followed by that parallel to the loading direction (α = 0°).
(3)
Under uniaxial compression, the specimens exhibited three failure modes: splitting failure of type 1 (the specimen split along the width direction), step-path failure, and planar failure. Under biaxial compression, the specimens exhibited two failure modes: splitting failure of type 2 (the specimen split along the thickness direction) and planar failure.

Author Contributions

G.H., H.J., Y.J. and H.S. conceived and designed the experiments; G.H. and J.W. performed the experiments; G.H. and R.L. analyzed the data; H.S. and J.W. contributed analysis tools; G.H. and R.L. wrote the paper.

Acknowledgments

This study is financed by the National Natural Science Foundation of China (Grant Nos. 51734009, 51709260, 51704279), and the Natural Science Foundation of Jiangsu Province, China (No. BK20170276).

Conflicts of Interest

The authors declare no conflict of interest.

References

  1. Jing, H.; Yang, S.; Zhang, M.; Xu, G.; Chen, K. An experimental study on anchorage strength and deformation behavior of large-scale jointed rock mass. Tunn. Undergr. Space Technol. 2014, 43, 184–197. [Google Scholar] [CrossRef]
  2. Huang, Z.; Broch, E.; Lu, M. Cavern roof stability-mechanism of arching and stabilization by rockbolting. Tunn. Undergr. Space Technol. 2002, 17, 249–261. [Google Scholar] [CrossRef]
  3. Zhang, Q.; Zhang, C.; Jiang, B.; Li, N.; Wang, Y. Elastoplastic coupling solution of circular openings in strain-softening rock mass considering pressure-dependent effect. Int. J. Geomech. 2018, 18, 04017132. [Google Scholar] [CrossRef]
  4. Liu, R.; Li, B.; Jiang, Y.; Yu, L. A numerical approach for assessing effects of shear on equivalent permeability and nonlinear flow characteristics of 2-D fracture networks. Adv. Water Resour. 2018, 111, 289–300. [Google Scholar] [CrossRef]
  5. Yang, X.; Kulatilake, P.; Chen, X.; Jing, H.; Yang, S. Particle flow modeling of rock blocks with nonpersistent open joints under uniaxial compression. Int. J. Geomech. 2016, 16, 04016020. [Google Scholar] [CrossRef]
  6. Brace, W.; Byerlee, J. Recent experimental studies of brittle fracture of rocks. In Proceedings of the 8th US Symposium on Rock Mechanics, Minneapolis, MN, USA, 15–17 September 1966; American Rock Mechanics Association: Alexandria, VA, USA, 1966. [Google Scholar]
  7. Hoek, E.; Bieniawski, Z. Brittle fraeture propagation in rock under compression. Int. J. Fract. 1984, 26, 276–294. [Google Scholar] [CrossRef]
  8. Yang, S.; Jing, H. Strength failure and crack coalescence behavior of brittle sandstone samples containing a single fissure under uniaxial compression. Int. J. Fract. 2011, 168, 227–250. [Google Scholar] [CrossRef]
  9. Zhang, X.; Wong, L. Cracking processes in rock-like material containing a single flaw under uniaxial compression: A numerical study based on parallel bonded-particle model approach. Rock Mech. Rock Eng. 2012, 45, 711–737. [Google Scholar] [CrossRef]
  10. Wong, L.; Einstein, H. Crack coalescence in molded gypsum and Carrara marble: Part 1. Macroscopic observations and interpretation. Rock Mech. Rock Eng. 2009, 42, 475–511. [Google Scholar] [CrossRef]
  11. Yang, S.; Huang, Y.; Jing, H.; Liu, X. Discrete element modeling on fracture coalescence behavior of red sandstone containing two unparallel fissures under uniaxial compression. Eng. Geol. 2014, 178, 28–48. [Google Scholar] [CrossRef]
  12. Tang, C.; Lin, P.; Wong, R.; Chau, K. Analysis of crack coalescence in rock-like materials containing three flaws—Part II: Numerical approach. Int. J. Rock Mech. Min. Sci. 2001, 38, 925–939. [Google Scholar] [CrossRef]
  13. Yang, S.; Yang, D.; Jing, H.; Li, Y.; Wang, S. An experimental study of the fracture coalescence behaviour of brittle sandstone specimens containing three fissures. Rock Mech. Rock Eng. 2012, 45, 563–582. [Google Scholar] [CrossRef]
  14. Bobet, A.; Einstein, H. Fracture coalescence in rock-type materials under uniaxial and biaxial compression. Int. J. Rock Mech. Min. Sci. 1998, 35, 863–888. [Google Scholar] [CrossRef]
  15. Tiwari, R.; Rao, K. Post failure behavior of a rock mass under the influence of triaxial and true triaxial confinement. Eng. Geol. 2006, 84, 112–129. [Google Scholar] [CrossRef]
  16. Gehle, C.; Kutter, H. Breakage and shear behaviour of intermittent rock joints. Int. J. Rock Mech. Min. Sci. 2003, 40, 687–700. [Google Scholar] [CrossRef]
  17. Zhang, B.; Li, S.; Zhang, D.; Li, M.; Shao, D. Uniaxial compression mechanical property test, fracture and damage analysis of similar material of jointed rock mass with filled cracks. Rock Soil Mech. 2012, 33, 1647–1652. [Google Scholar]
  18. Prudencio, M.; Van Sint Jan, M. Strength and failure modes of rock mass models with non-persistent joints. Int. J. Rock Mech. Min. Sci. 2007, 44, 890–902. [Google Scholar] [CrossRef]
  19. Goldstein, M.; Goosev, B.; Pvrogovsky, N.; Tulinov, R.; Turovskaya, A. Investigation of mechanical properties of cracked rock. In Proceedings of the 1st International Congress on Rock Mechanics, Lisbon, Portugal, 25 September–1 October 1966; pp. 521–524. [Google Scholar]
  20. Chen, X.; Liao, Z.; Peng, X. Cracking process of rock mass models under uniaxial compression. J. Cent. South Univ. 2013, 20, 1661–1678. [Google Scholar] [CrossRef]
  21. Bahaaddini, M.; Sharrock, G.; Hebblewhite, B. Numerical investigation of the effect of joint geometrical parameters on the mechanical properties of a non-persistent jointed rock mass under uniaxial compression. Comput. Geotech. 2013, 49, 206–225. [Google Scholar] [CrossRef]
  22. Yang, X.; Kulatilake, P.; Jing, H.; Yang, S. Numerical simulation of a jointed rock block mechanical behavior adjacent to an underground excavation and comparison with physical model test results. Tunn. Undergr. Space Technol. 2015, 50, 129–142. [Google Scholar] [CrossRef]
  23. Asadizadeh, M.; Moosavi, M.; Hossaini, M.; Masoumi, H. Shear Strength and Cracking Process of Non-persistent Jointed Rocks: An Extensive Experimental Investigation. Rock Mech. Rock Eng. 2018, 51, 415–428. [Google Scholar] [CrossRef]
  24. Wu, L.; Li, B.; Huang, R.; Sun, P. Experimental study and modeling of shear rheology in sandstone with non-persistent joints. Eng. Geol. 2017, 222, 201–211. [Google Scholar] [CrossRef]
  25. Sarfarazi, V.; Haeri, H.; Shemirani, A.; Zhu, Z. Shear Behavior of Non-Persistent Joint under High Normal Load. Strength Mater. 2017, 49, 320–334. [Google Scholar] [CrossRef]
  26. Lajtai, E.; Carter, B.; Duncan, E. En echelon crack-arrays in potash salt rock. Rock Mech. Rock Eng. 1994, 27, 89–111. [Google Scholar] [CrossRef]
  27. Su, H.; Jing, H.; Du, M.; Wang, C. Experimental investigation on tensile strength and its loading rate effect of sandstone after high temperature treatment. Arabian J. Geosci. 2016, 9, 1–11. [Google Scholar] [CrossRef]
Figure 1. Schematic view of a joined rock sample. (a) uniaxial compression; (b) biaxial compression.
Processes 06 00049 g001
Figure 2. CMT5305 electronic universal testing system.
Processes 06 00049 g002
Figure 3. Axial stress–strain curve of the intact specimen under uniaxial compression.
Processes 06 00049 g003
Figure 4. Axial stress–strain curves of specimens with different dip angles under uniaxial compression.
Processes 06 00049 g004
Figure 5. Mechanical parameters of specimens with different dip angles under uniaxial and biaxial compressions. (a) Strength comparison under uniaxial and biaxial compressions; (b) Elasticity modulus comparison under uniaxial and biaxial compressions.
Processes 06 00049 g005aProcesses 06 00049 g005b
Figure 6. Axial stress–strain curves of specimens with different dip angles under biaxial compression.
Processes 06 00049 g006
Figure 7. Fracture evolution of intermittent jointed rock masses under uniaxial compression (Specimen U03, α = 30°). (a) 0.250, 5.97; (b) 0.252, 6.04; (c) 0.265, 6.36; (d) 0.300, 6.31; (e) 0.369, 7.14; (f) 0.506, 5.03; (g) 0.250, 5.97; (h) 0.252, 6.04; (i) 0.265, 6.36; (j) 0.300, 6.31; (k) 0.369, 7.14; (l) 0.506, 5.03.
Processes 06 00049 g007
Figure 8. Acoustic emission (AE) response characteristics of the specimen under uniaxial compression (α = 30°).
Processes 06 00049 g008
Figure 9. Failure modes of specimens with different dip angles under uniaxial compression. (a) α = 0°; (b) α = 15°; (c) α = 30°; (d) α = 45°; (e) α = 60°; (f) α = 75°; (g) α = 90°.
Processes 06 00049 g009
Figure 10. Failure modes of specimens with different dip angles under biaxial compression. (a) α = 0°; (b) α = 15°; (c) α = 30°; (d) α = 45°; (e) α = 60°; (f) α = 75°; (g) α = 90°.
Processes 06 00049 g010
Table 1. Mechanical parameters of specimens.
Numberα (°)Lj (mm)Lr (mm)d (mm)σc (MPa)E (GPa)Remarks
I01----34.054.86Intact specimens
I02----33.604.83
U01016123025.043.76Uniaxial compression test
U021516123011.783.47
U03301612307.143.26
U044516123011.713.62
U05601612309.013.47
U067516123015.264.10
U079016123033.994.83
B01016123030.013.93Biaxial compression test
B021516123026.753.74
B033016123024.283.67
B044516123022.653.61
B056016123018.693.51
B067516123028.374.17
B079016123037.465.02
Table 2. Comparison of mechanical parameters of specimens under uniaxial and biaxial compression.
Dip Angleσc (Uniaxial, MPa)σc (Biaxial, MPa)Improved (%)E (Uniaxial, GPa)E (Biaxial, GPa)Improved (%)
025.0430.0119.823.763.934.52
1511.7826.75127.193.473.747.78
307.1424.28239.863.263.6712.58
4511.7122.6593.423.623.61−0.28
609.0118.69107.193.473.511.15
7515.2628.3785.964.104.171.71
9033.9937.4610.214.835.023.93

