A Cost-Effective Redundant Digital Excitation Control System and Test Bed Experiment for Safe Power Supply for Process Industry 4.0


1
Department of Electrical and Computer Engineering, University of Seoul, Seoul 02504, Korea
2
Department of Software, Catholic University of Pusan, Geumjeong-gu, 57 Oryundae-ro, Busan 46241, Korea
*
Author to whom correspondence should be addressed.
Processes 2018, 6(7), 85; https://doi.org/10.3390/pr6070085
Submission received: 13 June 2018
/
Revised: 22 June 2018
/
Accepted: 27 June 2018
/
Published: 3 July 2018
(This article belongs to the Special Issue Process Industry 4.0: Application Research to Small and Medium-Sized Enterprises (SMEs))
Abstract
:Recently, the energy demand and supply situation in the Republic of Korea (ROK) has been largely affected by the fluctuations in the energy markets around the world. Such a situation has provided a basis for requiring improvements to power plant facilities. The automatic generator voltage control systems in large-scale power plants are adopting a rapid-response static excitation method to improve the transient stability. A domestic commercially developed large-scale triple-redundant excitation system is currently operated by the 1000 MW-class nuclear power plant and its efficiency has been verified at the same site. However, such a system is too costly for smaller power plants so that a reliable and low-cost redundant digital excitation control system was developed and introduced in this study to resolve the cost problem. The system has improved its stability and reliability at the same time through double (redundant) configuration. Additionally, the system’s performance was put to the test by conducting a series of control function tests after applying it to the gas turbine used in a thermal power station. This study includes the development of system hardware, simulations as well as on-site experiments and each element was validated as a result. Also, the study discusses and validates the method used for replacing the protective relays at the Kanudi power plant operating in Papua New Guinea. The replacement of 27 and 81 protective relays at the existing power plant was carried out as they did not function properly. New relays were installed after removing the power supply in the existing panel. The individual power output sections of new relays were connected in parallel with the existing properly functioning relays, as previous protective relays had only allowed monitoring without outputting the contents. Thus, the new protective system was designed to enable both existing and new relays to carry out the detection function. It was validated that the replacement was successful. The new system with the new relays is performing properly by protecting its power generator and preventing further accidents.
1. Introduction
The 4th Industrial Revolution has been a widely discussed issue in the last few years and the subjects pertaining to current electric power supply systems are foundational to it. An undisruptive power supply is essential for motors functioning at nuclear, thermal, and wind power stations as well as motors in manufacturing factories. If the power is disrupted, an excitation system will kick in to prevent power failure before accident or damage can occur. The excitation system is part of the emergency diesel generator and produces adequate voltage and supplies the currents to the individual equipment regularly and evenly. Currently, digital excitation systems are being developed and installed in factories or power stations.
Meanwhile, the emergency diesel generator is a core facility for supplying power to cooling pumps/fans critical in cooling reactors at power stations including nuclear power plants. It automatically kicks in as soon as the reactor stops. The excitation system assumes the role of controlling the currents comprehensively to allow the emergency diesel generator to operate properly while maintaining a stable voltage.
Because of the tight requirements for the power plants, all the systems have to be highly reliable. The excitation systems are critical not only to the power plants but also to the smart factories in the 4th Industrial Revolution. An excitation system is one that steadily maintains or controls the output terminal voltage by supplying a DC current to the field winding. Since the existing systems cannot be maintained/repaired with the US-made controllers, a domestic controller was needed.
The excitation system commences its operation automatically when the reactor stops to restore the power within the power station. It also restores the voltage of the emergency diesel generator to its original state when it suddenly drops. Ultimately, an excitation system is the key piece of equipment which ensures that the emergency diesel generator, cooling facility, and reactor itself will function properly in emergency situations [1,2,3].
On the threshold of the 4th Industrial Revolution, the major electronic or communication companies in the Republic of Korea (ROK) are focusing their business on IoT technology. Especially, the smart home and the smart grid are giving them every chance to develop, test, and implement their cutting-edge technologies, introducing all sorts of related hardware on the market. Based on this situation, several electronics, communication, and power companies are showing an interest in constructing an IoT-oriented power plant and pursuing technological feasibility [4,5].
Due to many changes in global energy markets, the domestic energy supply and demand situation is also fluctuating. Although a domestic large-scale triple-redundant excitation control system is being operated commercially at the 1000 MW-class nuclear power plant, it is not easy to use it for smaller power plants because of its high price [6,7]. Foreign manufacturers like GE (Boston, MA, USA), ALSTOM (Saint-Ouen, France), ABB (Zurich, Switzerland), BASLER (Ahrensburg, Germany), and TOSHIBA (Tokyo, Japan) are leading the market for such systems, but they all use their own technologies and are reluctant to reveal the hardware and software necessary for maintenance, causing the operation costs to become even higher [8,9].
Also, the study discusses and validates the method used for replacing the protective relays at the Kanudi power plant operating in Papua New Guinea.
The existing protection relay is an analog relay and the new one is a multifunctional grid monitoring relay which primarily detects the changes in the grid frequency as well as a low voltage.
On the other hand, most of the existing analog excitation control systems manufactured in the 70 s and 80 s are aging rapidly and becoming obsolete. Also, necessary parts are now hard to find and costly. Another major problem is that domestic engineers cannot deal with the serious problems in those old foreign-made systems so that the power company has to bring technicians from abroad to fix the problem. This incurs additional expenses and delays in resuming power generation. Thus, we have developed a reliable and low-cost redundant digital excitation system to solve such problems.
2. Related Work
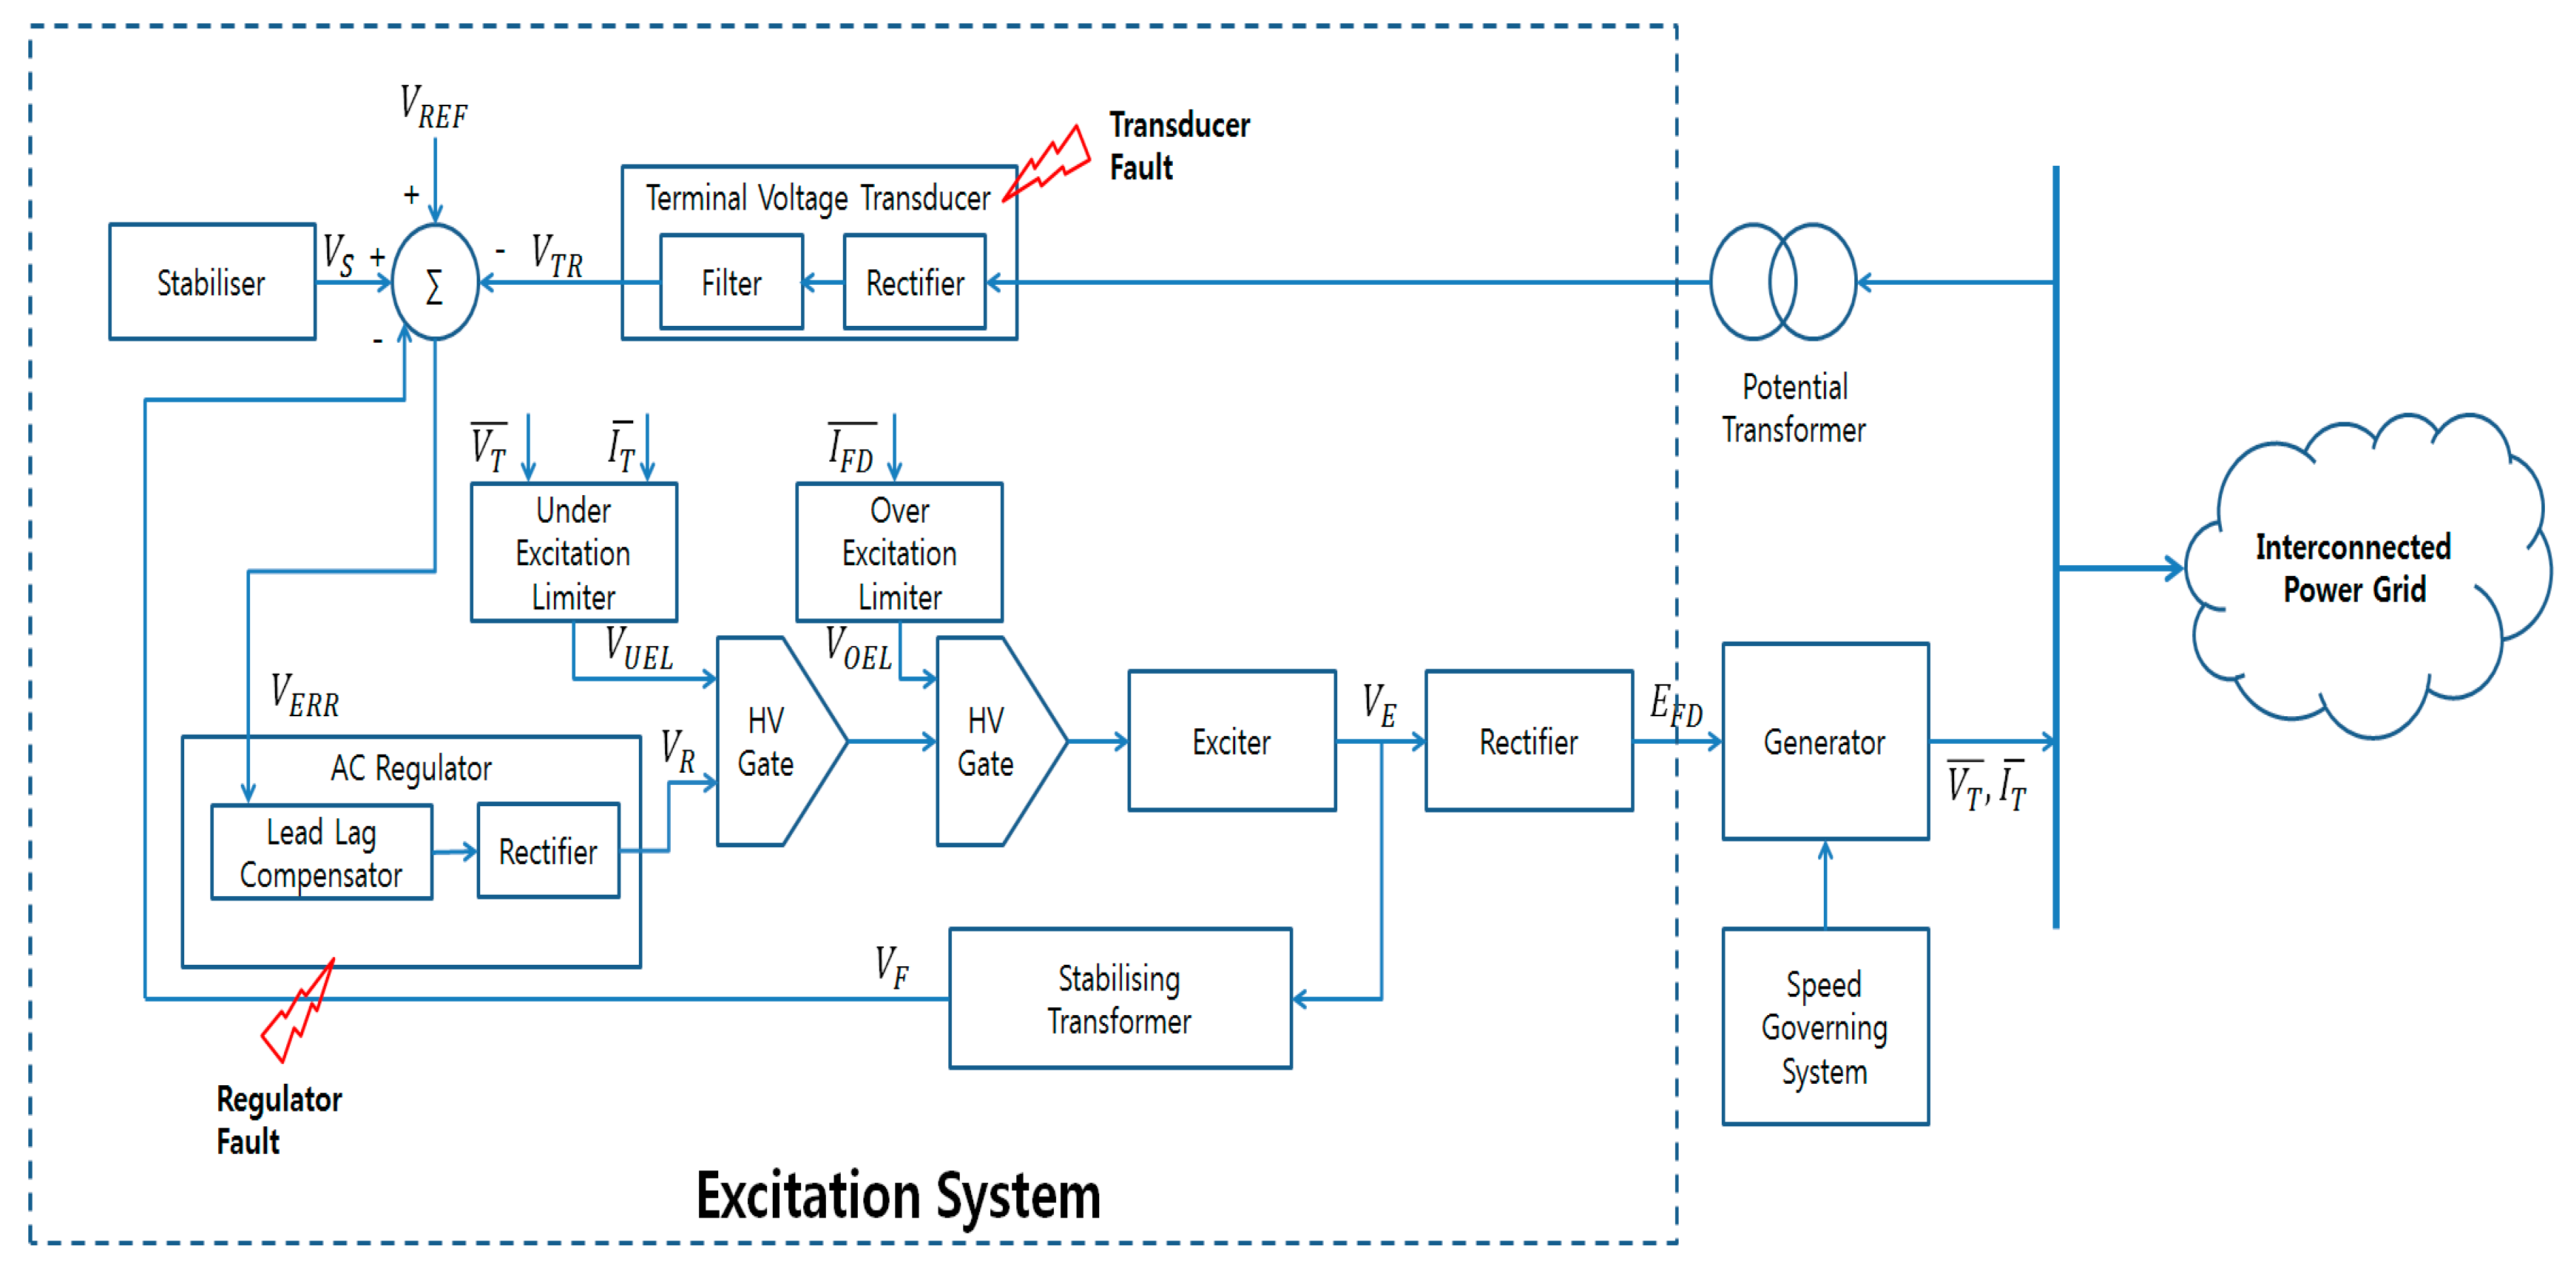
Automatic Voltage Generator (AVR) controls the level of terminal voltage of an alternator within a certain limit to cope with the changes in the system load [10]. The current power grids have a series of interlinked synchronous generators and generate loads while transmitting electricity in their networks. The Excitation Control System (ECS) plays a vital role during the operation of these generators and its functional diagram is shown in Figure 1 [11] where it the primary function of the ECS is controlling the terminal voltage. A few such reports were associated with the generator stators or rotors [12,13,14]. Also, The defects in power system components have been a serious problem in modern power systems and many system errors caused by such defects were continuously reported in the last few decades [15,16,17,18,19].
Accordingly, the research on the ECS fault detection methods is being carried out actively as the previous research results [20,21,22,23,24,25,26,27] were drawn from the simple excitation system models. For instance, in the research result of [25], a static load was used as the load generated in the power system whereas a 3-phase full-wave rectifier was supposed to be the exciter. In this research, neither generator nor exciter dynamics were considered when evaluating the performance. Yet, this and other similar research works have actually contributed to establishing some efficient methods for ECS operation but a more elaborate research should be conducted to find a better solution that will be useful in the actual large-scale networks. A transducer defect detection and mitigation method adaptable to ECS was proposed in [26] where an IEEE ST2A model was introduced but the model did not have any over/under-excitation (Block 4 & 5, Figure 1) limiters which would play an essential role in the steady and safe operation of synchronous generators. The Authors’ proposal of an excitation fault diagnosis and mitigation approach based on a Mamdani fuzzy inference is proposed in [27] but the parametric uncertainties have not been considered in the excitation system model.
Additionally, the model’s operation under the external influences/disturbances (i.e., transmission line defect, load variation, etc.) has not been considered. Commonly, the ECS generators create the problems in the power systems due to the problems associated with the transducer and the regulator. The former (Block 1, Figure 1) detects the terminal voltage and then rectify/filter it to a quantity VR (DC) following the level of the terminal voltage [11]. The open/short circuit faults due to the problem in the rectifier diodes or thyristors do not allow the transducer output VR to remain proportional to the terminal voltage but instead, its level will drop even to the zero level.
Meanwhile, the function of the regulator (Block 3, Figure 1) is amplifying the input signal to the level adequate for control but if the amplifier fails to operate, the regulator VR will be reduced even to the zero level. As such, both transducer and regulator faults have to be detected early as the former (latter) can cause over (under) excitation. Also, over (under) excitation could result in a large and instantaneous electrical surge (sag) leading to dangerous fluctuations in both current and voltage levels and finally affecting connected generators altogether. Also, such fluctuations could exceed the allowable generator voltage limits [28]. While a persistent transducer failure would also cause a system overheating because of high current, a persistent regulator failure may cause a leakage flux on the armature end causing overheating [29].
Many system stability research works deal with the IEEE standard excitation system model described in [30]. The research works include comparative analysis [31,32,33,34,35], power plant start-up simulation [36], and power system model estimation and verification [37,38,39]. Various types of excitation systems were developed within the framework suggested by the Excitation System Subcommittee of the Energy Development and Power Generation Committee (IEEE PES). There were four types of such a model in 1968 [40], and now there are 19 models of updated Std. 421.5. The others are introduced in [41]. The standard models are highly useful for the system engineers when they prepare for the data exchange and system operation studies. Also, they can be useful for the designers of simulation tools in developing efficient software. The 19 different types of models are designed based on three types of exciters such as Type DC (direct current commutator exciter, Type AC (alternator-supplied rectifier exciter), and Type ST (static exciter), depending on the variability of each type of exciter. The development of three universal models for the excitation control elements is being proposed in this study.
The elements are individually associated with the direct current commutator exciters, alternator-supplied excitation systems with non-controlled rectifiers, and static and alternator-supplied excitation systems with controlled rectifiers. A common structure of an excitation system is shown in Figure 1, which is based on the general functional block diagram published in Std. 421.5 [30]. This structure was constructed with 3 primary elements described below.
- -
- Summation point: the point where a control error occurs due to the voltage reference value VREF and the terminal voltage transducer output VC. The additional signal from power system stabilizer (PSS) output VS could be transmitted.
- -
- Automatic voltage regulator (AVR): This has either a proportional character with lead-lag compensation (transient gain reduction) or employs a proportional integral and derivative (PID) control. The latter is digital and often used in European countries [42].
- -
- The output VA of AVR: This feeds a field voltage or a field current in the manner described as an inner loop (Figure 1) that forms a dependency between AVR output VAandexciter output voltage EFD and current IFD linear, also compensating the changes in the supply voltage. Murdoch et al. suggested that FVR is rarely used for most of the potential source exciters [43]. Here, the regulator output VREG is equivalent to VA [44].
2.1. Generator Excitation Control System
The basic function of the excitation control system for the synchronous generators is to maintain the generator’s terminal voltage at a constant level or control it by supplying a direct current to the field coil. Although a synchronous generator can be regarded as a kind of generator model that takes kinetic energy and field current as input and generator frequency and voltage as output, it is also a model that can be influenced by the characteristic of load feedback. An excitation system is divided into a controller that assumes the function of output voltage control and a phase control rectifier that supplies a direct current after receiving the control signals from the controller [45,46]. The voltage controller part consists of a terminal voltage out regulator and a proportional plus integral regulator and should be able to protect the excitation system and generator by displaying the best performance within the limit of the generator’s capacity. The phase control rectifier supplies a direct current to the generator field system by converting an alternating current into a direct current in the excitation transformer. The excitation system should also be able to maintain a stable generator-output terminal voltage by automatically controlling field current in accordance with the changes in terminal voltage and reactive/active power of the synchronous machine within the range of continuous operation that can be performed by the synchronous generator [47,48].
2.2. Direct Current Excitation System
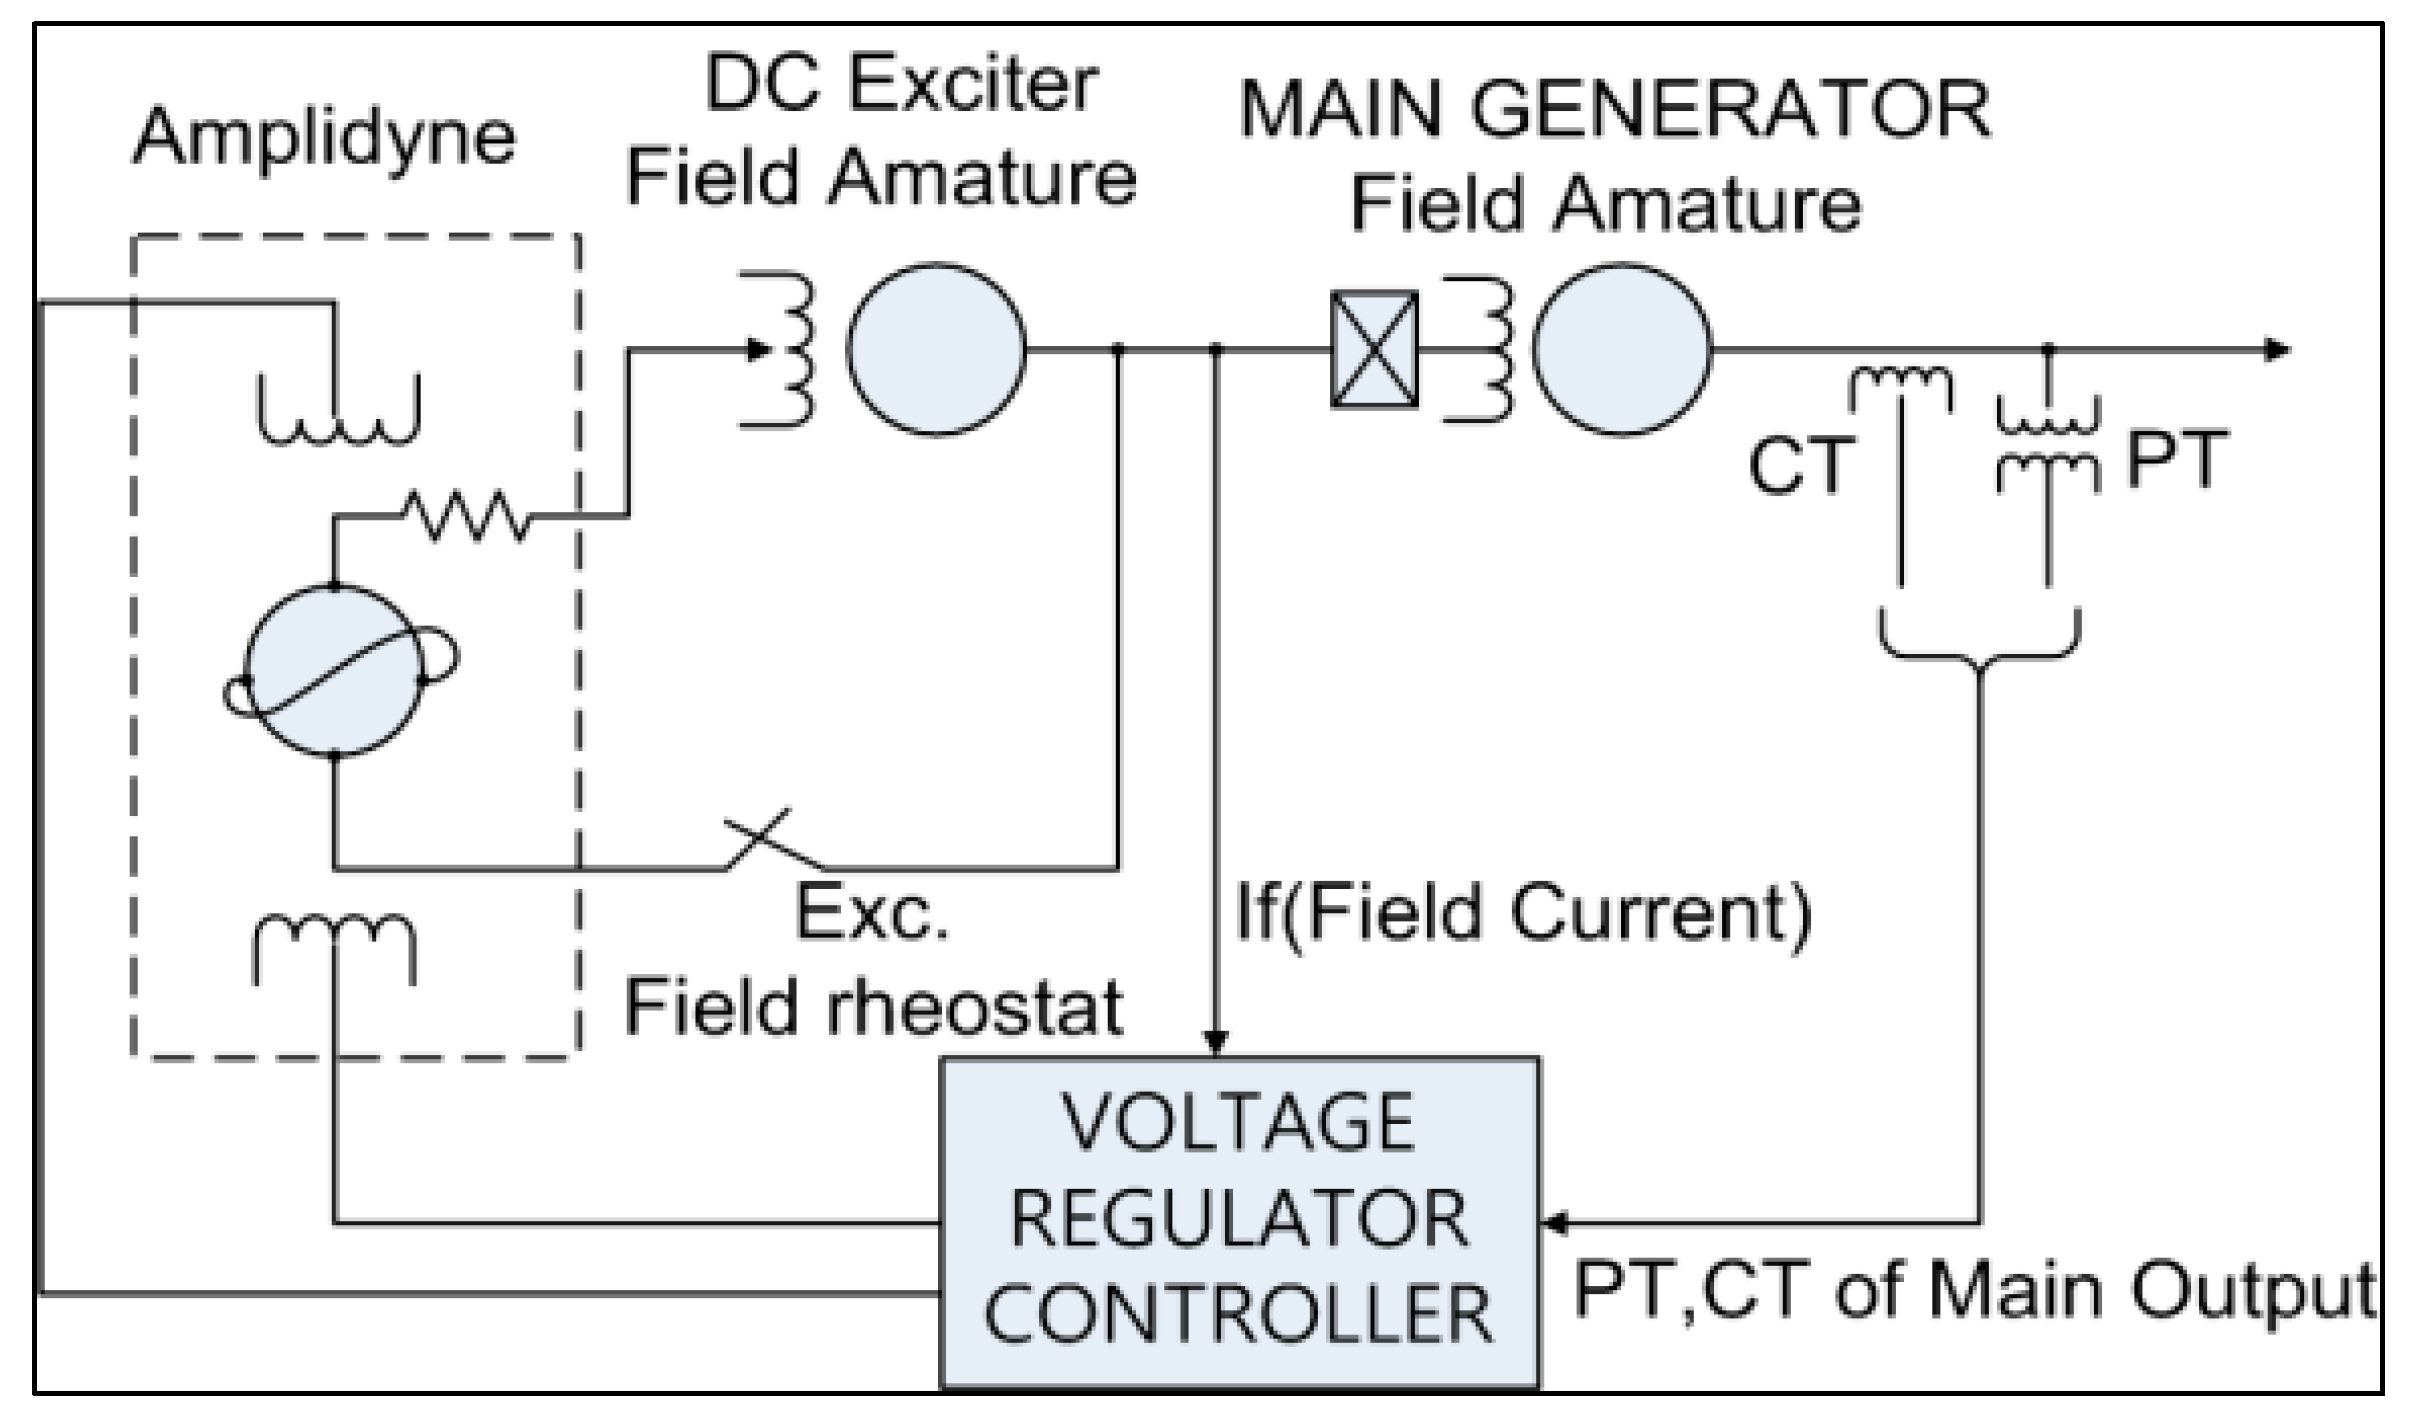
Currently, the direct excitation systems are hardly used for power systems as they are being replaced by rotary (alternating current) or static excitation systems. The direct excitation system uses the excitation power supply as its direct current generator and supplies necessary current to the synchronous generator through a slip ring [49,50,51,52]. Figure 2 shows generator output voltage control method for direct current excitation system.
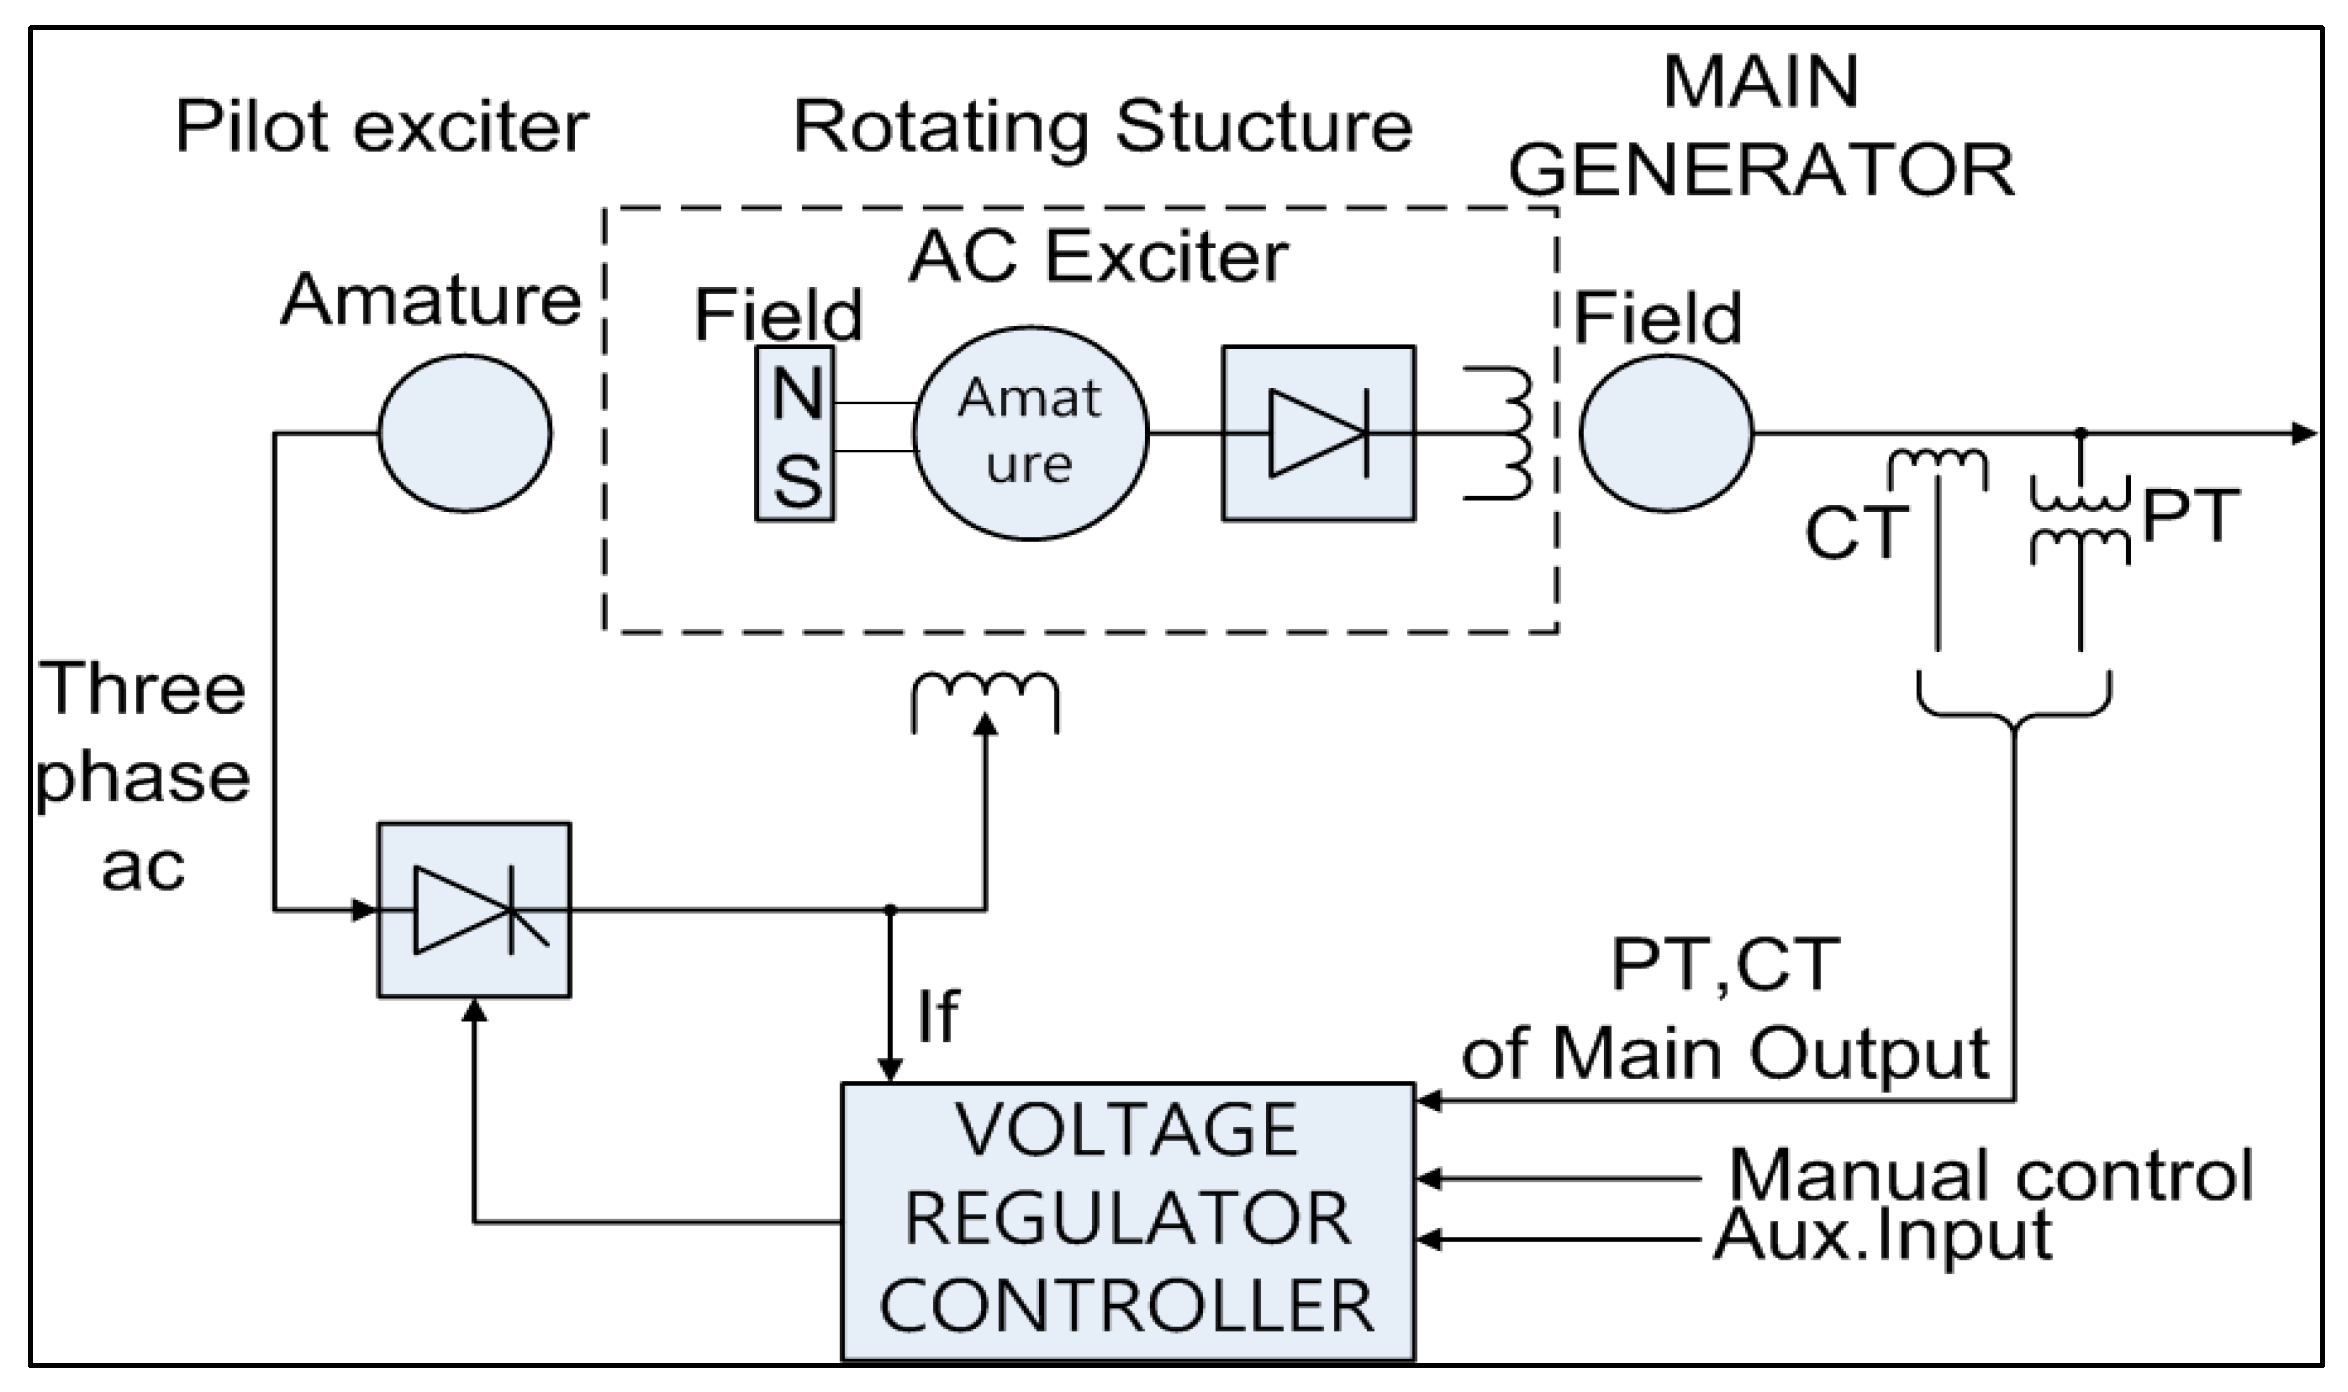
The alternating current rotary excitation system uses an AC generator as the power source. In general, in such an excitation system, an exciter is connected to the turbine generator shaft and the output of the exciter passes through the phase control rectifier to generate the excitation current necessary for the generator field system [53,54,55]. Figure 3 shows generator output voltage control method for alternating current rotary excitation system.
2.3. Static Excitation System
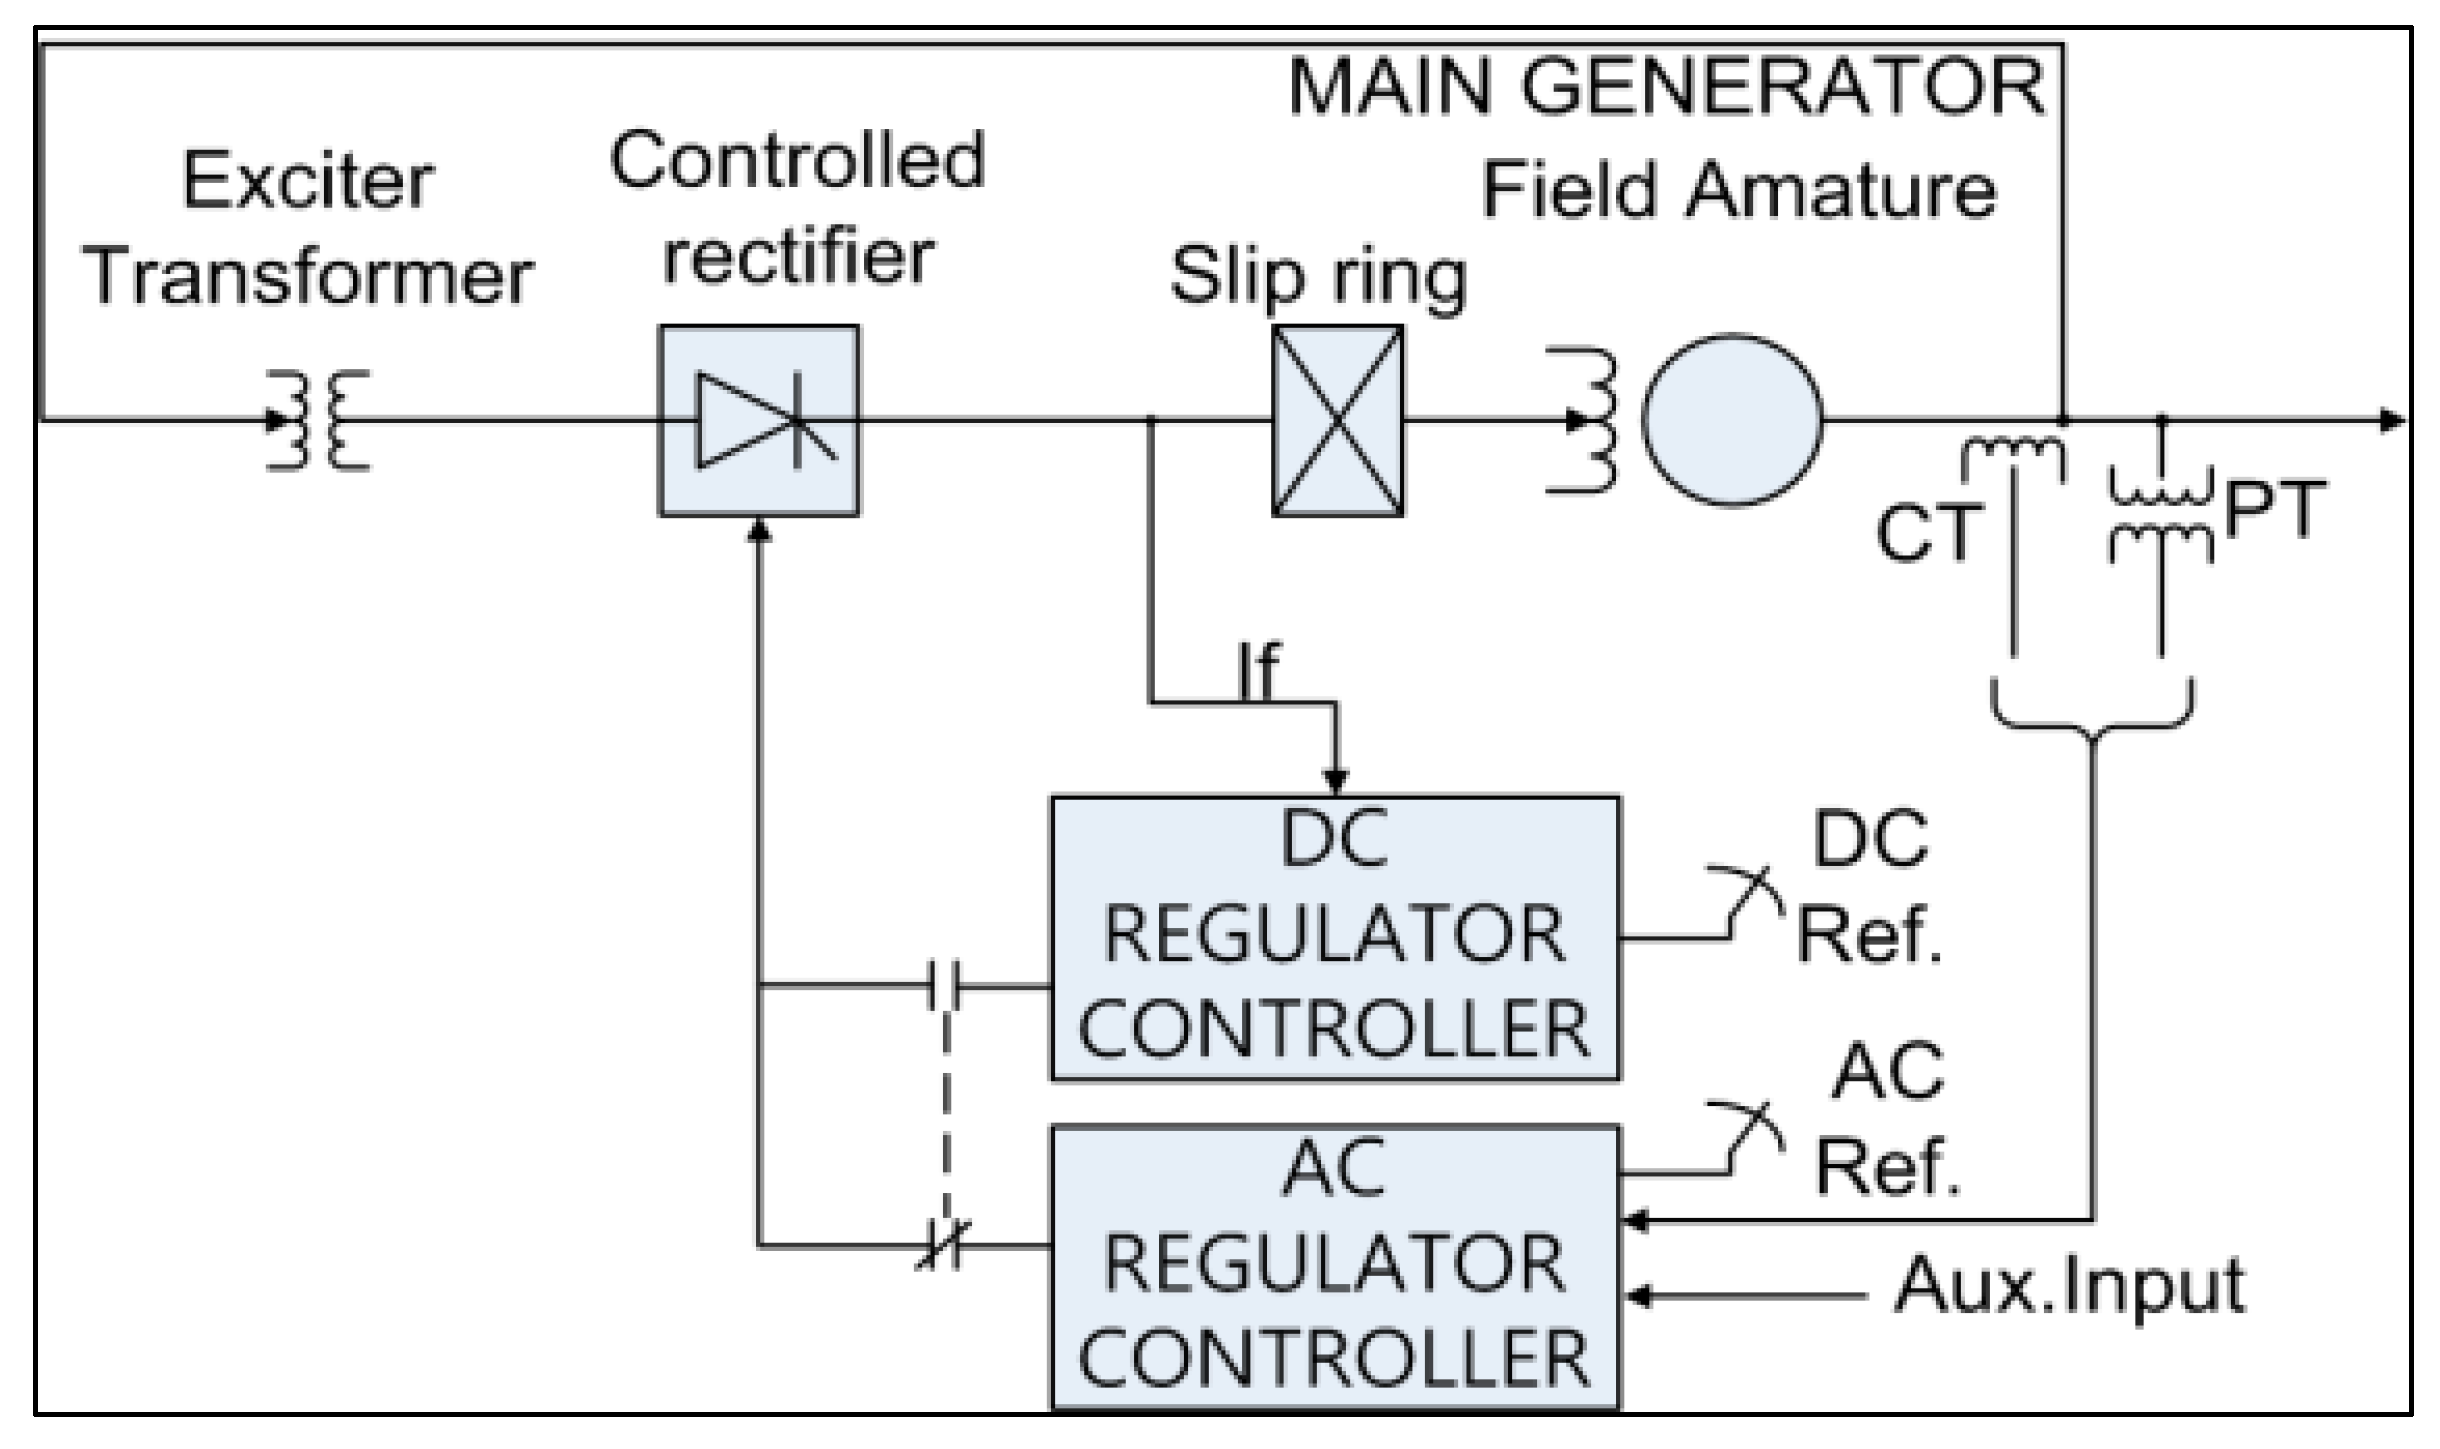
The static excitation system supplies the current necessary for the field system through an excitation transformer and has a relatively simple structure compared to the alternating current excitation system [54]. Since this system is easy to install, it is used widely. Also, as it uses the power source of the generator output node as its power source, the range of operation control is limited and if there is a failure at the output node the power source will be lost, which can be considered as a negative factor [55,56,57]. Figure 4 shows generator output voltage control method for static excitation system.
3. Cost-Effective Redundant Digital Excitation Control System
3.1. Digital Excitation Control System Algorithm
The global power demand in recent years is continuously and rapidly increasing following the unexpected weather patterns and increased use of IT/ICT systems. Synchronous machines are used for power turbines, generators, transformers, and converters used at various types of power stations [58,59]. Figure 5 describes the architecture of the excitation system.
The operation of a digital excitation system is largely divided into four parts: Initialization, Control, Protection, and Communication.
The initialization can be achieved by calculating the levels of effective voltage and current, frequency, active power, and reactive power by sampling the signal data of the generator voltage and current along with the field voltage and current at 1800 Hz.
The control being largely divided into automatic control and manual control, the automatic control’s function is to control the automatic voltage regulator and the under-excitation limiter at 180 Hz whereas the manual control is used to apply a 360 Hz control loop to the field current regulator (FCR) and over-excitation limiter (OEL). The control function is suspended by the lockout relay (86) if the relay trips due to an overvoltage, abnormal frequency, or other unexpected causes.
The current condition of the system can be checked conveniently using a Human-Machine Interface (HMI) that facilitates real-time monitoring.
3.2. Simulation of Digital Excitation Control System
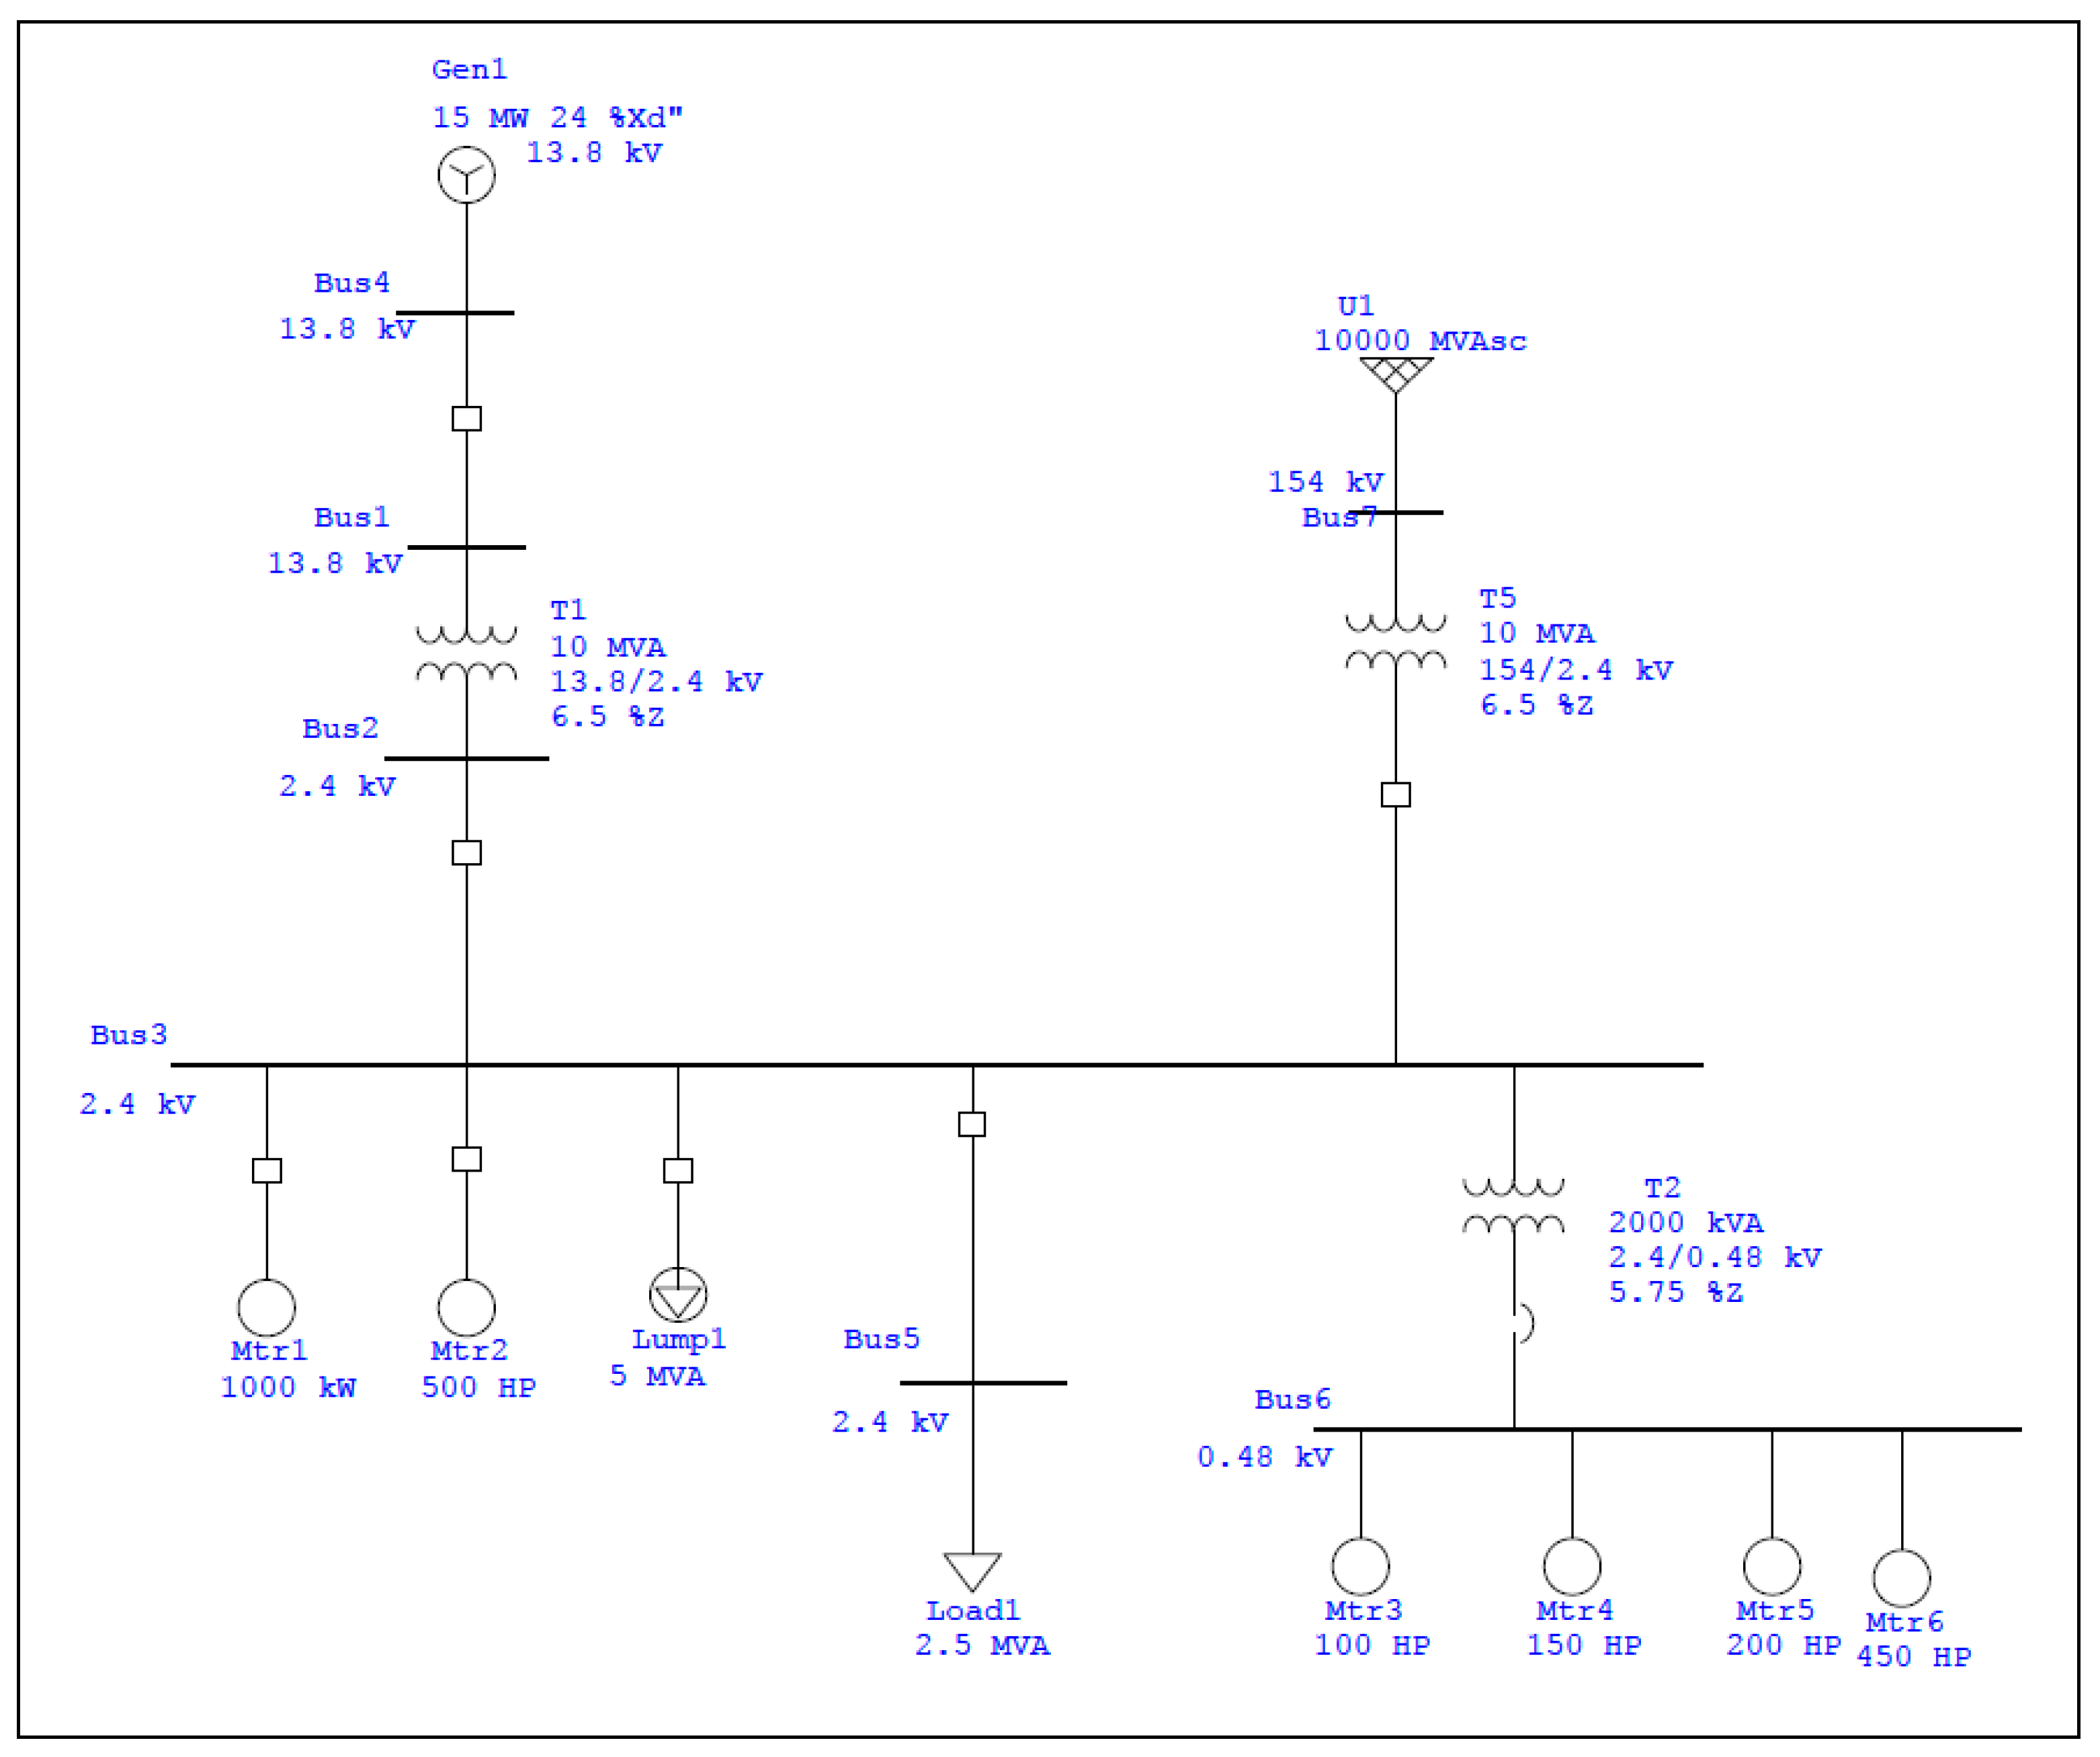
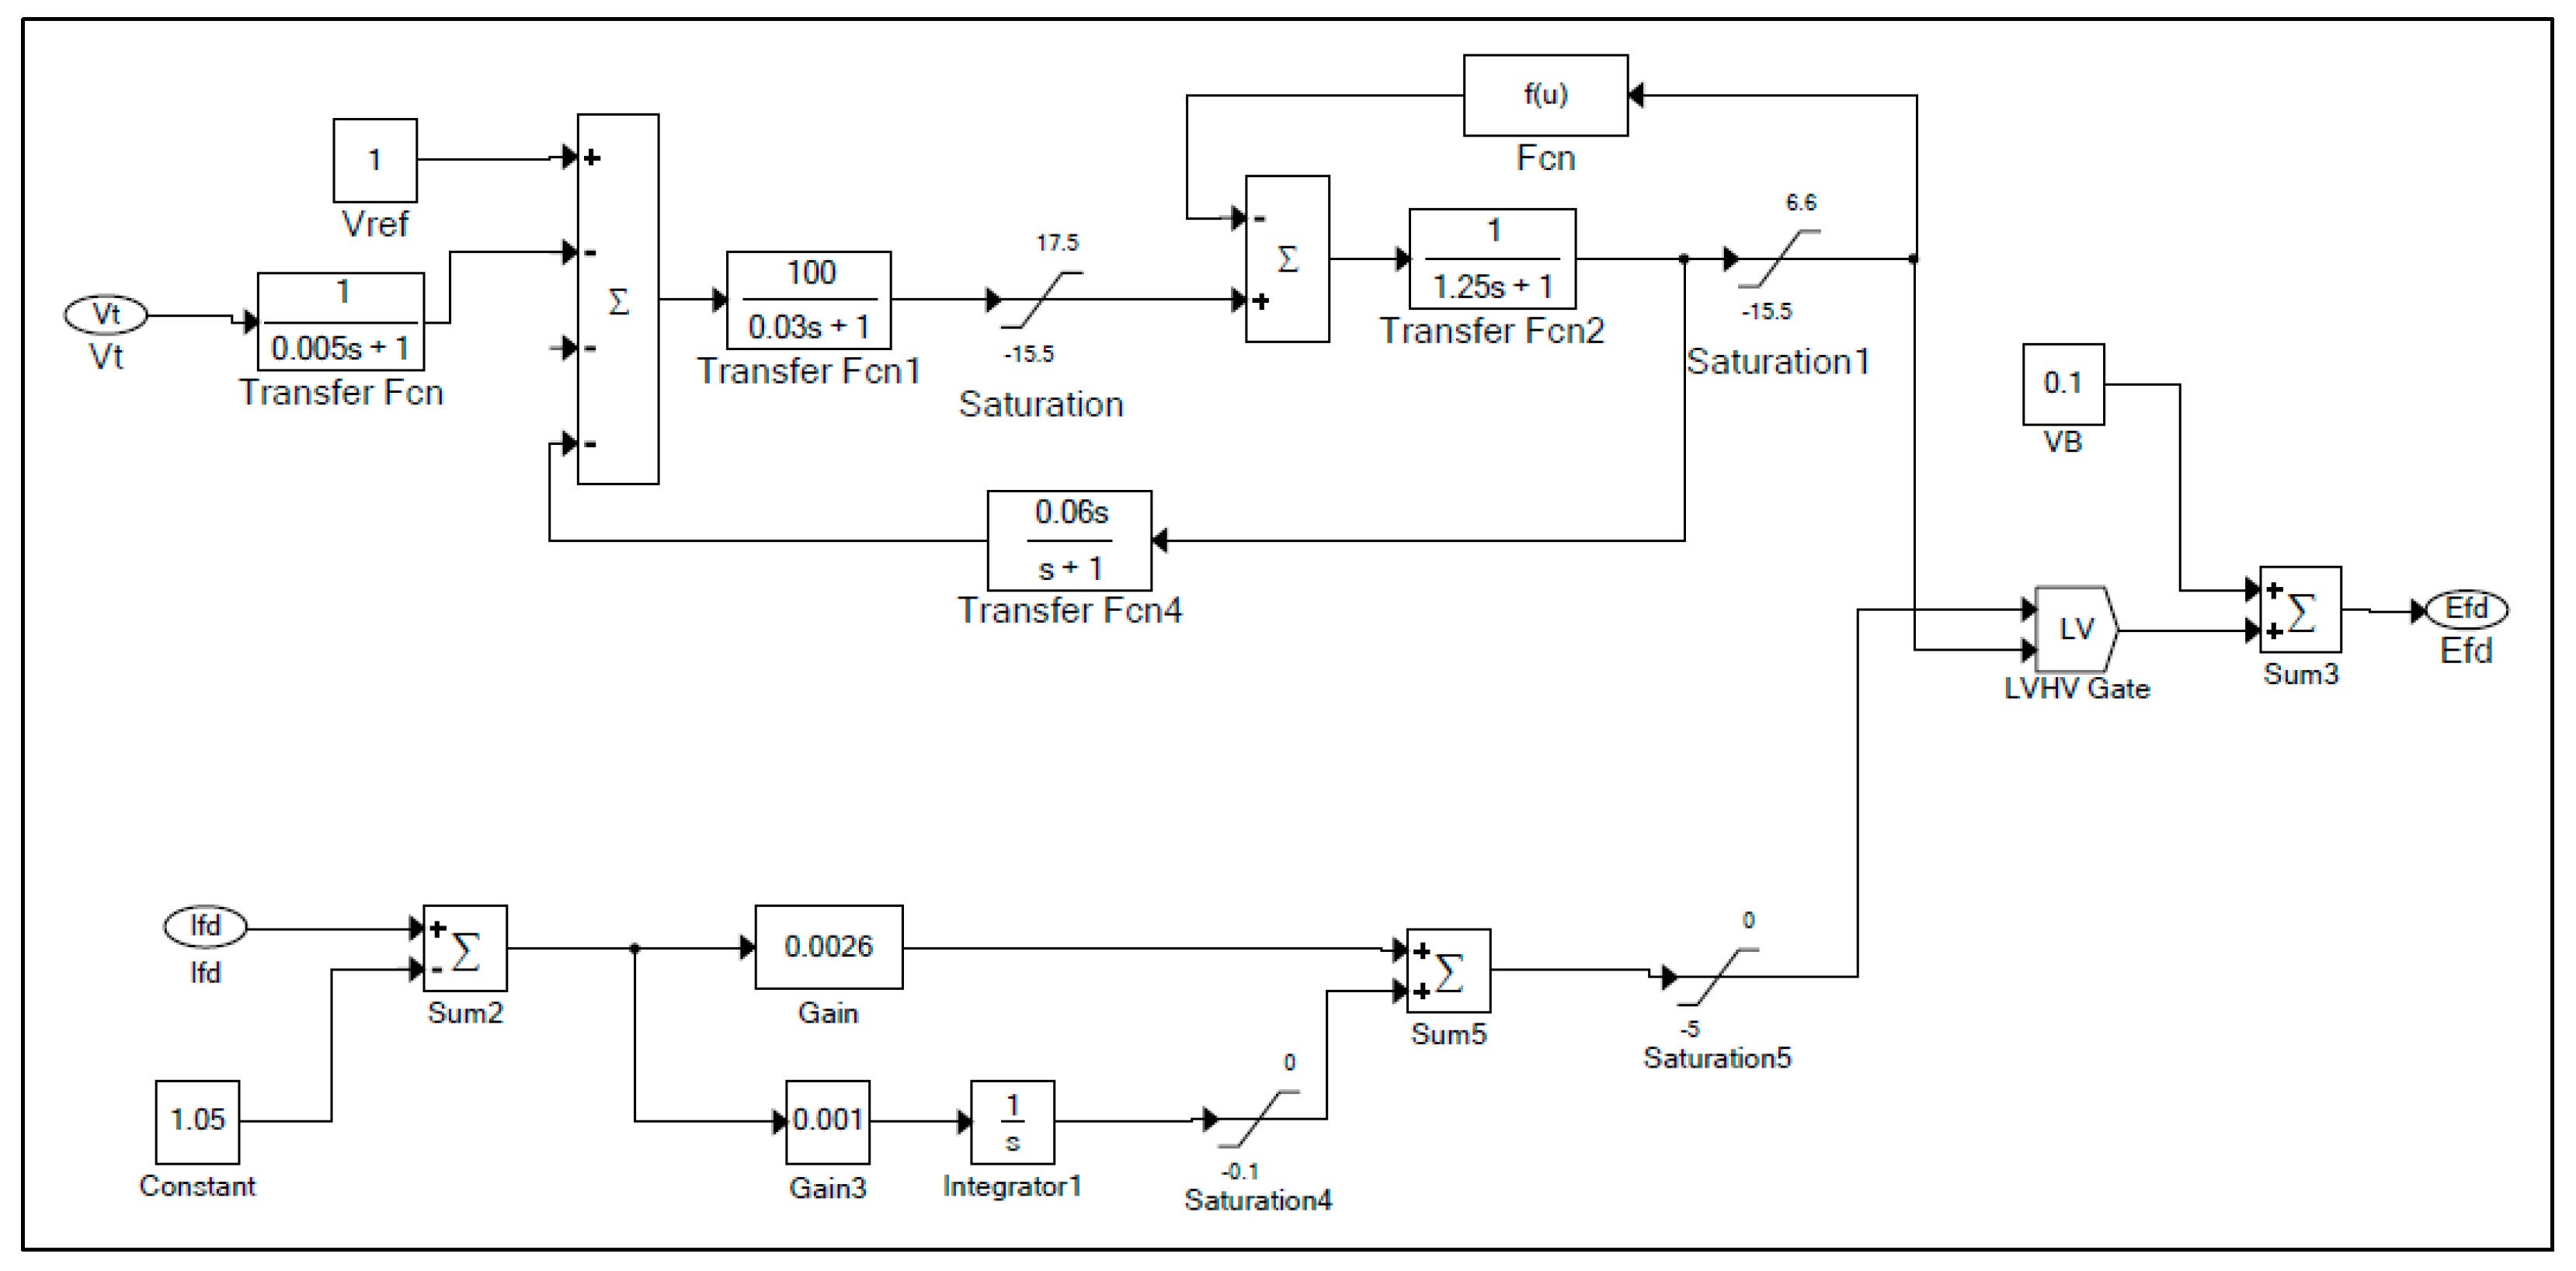
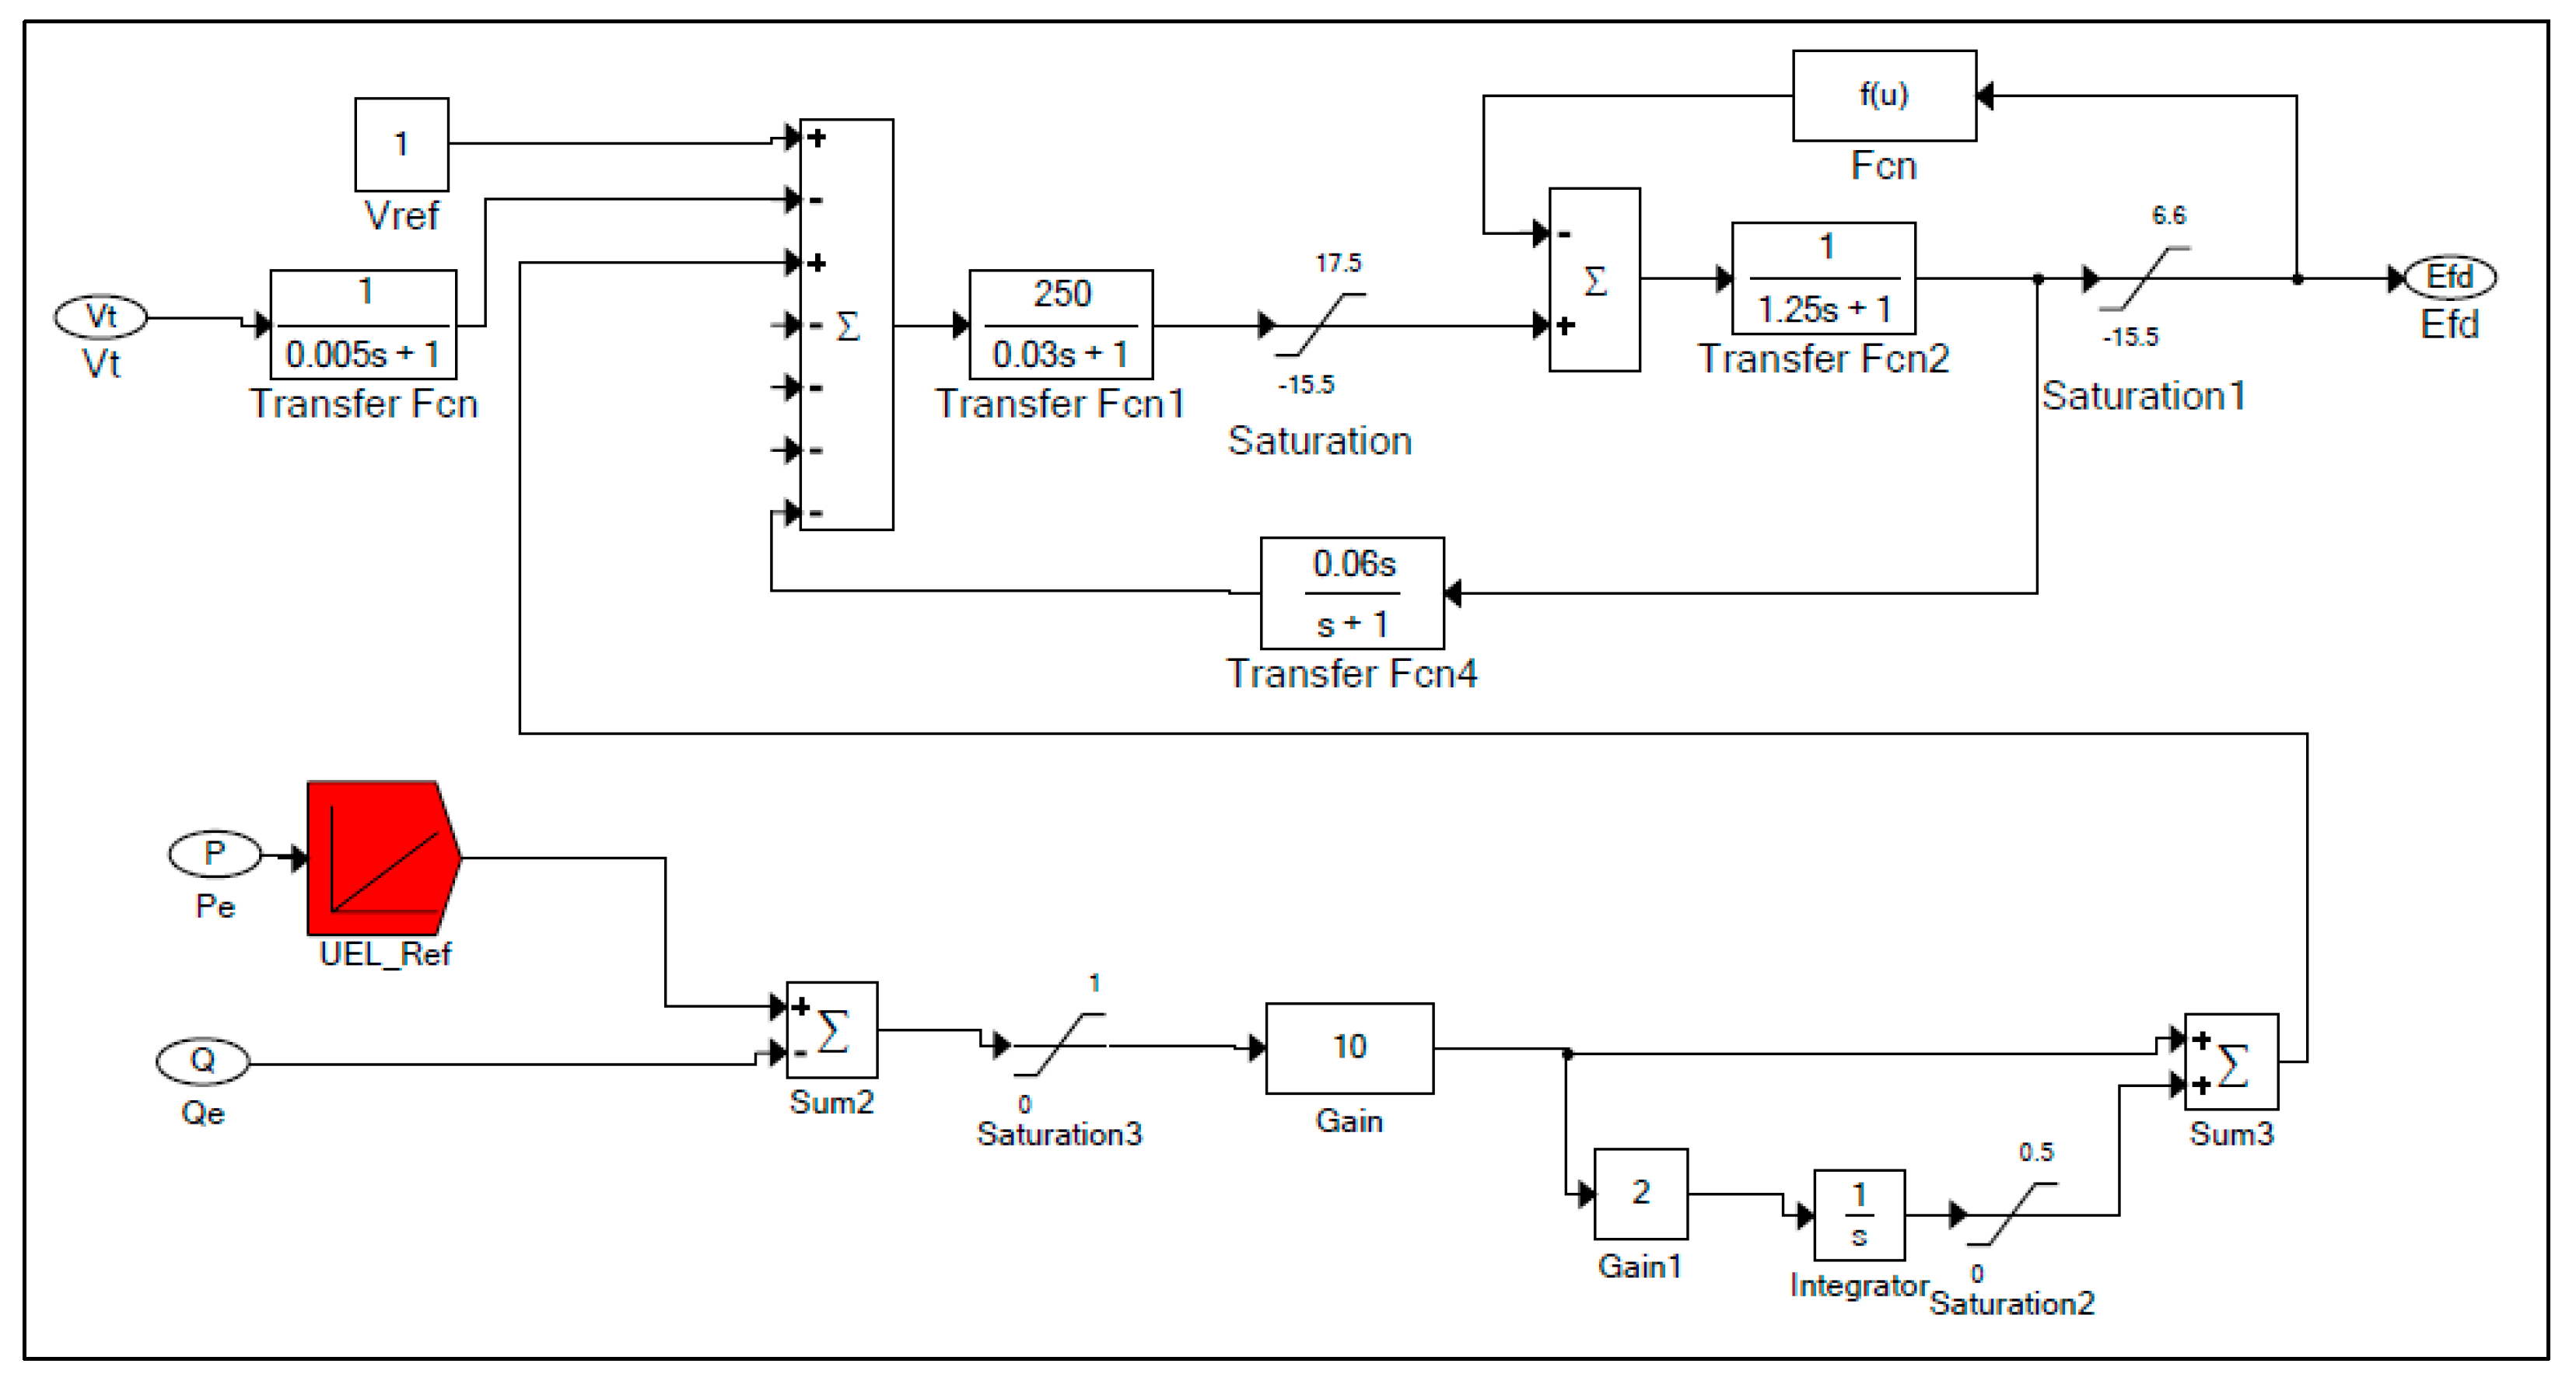
Figure 7 is a system’s test circuit and the performance characteristics of the redundant excitation system were checked using the ETAP (Electrical Transient Analyzer Program) for simulations. For the simulations, the system’s test circuit was created on condition that the electric power will be supplied to the on-site power system with Korea Electric Power Corporation’s (KEPCO) power system and generators. Figure 8 shows the OEL (Over Excitation Limit) modeling used for the digital excitation system. The OEL was designed to have a short-time field current overload function as specified in ANSI Standard C 50.13. This function is to prevent the overheating of the field circuit.
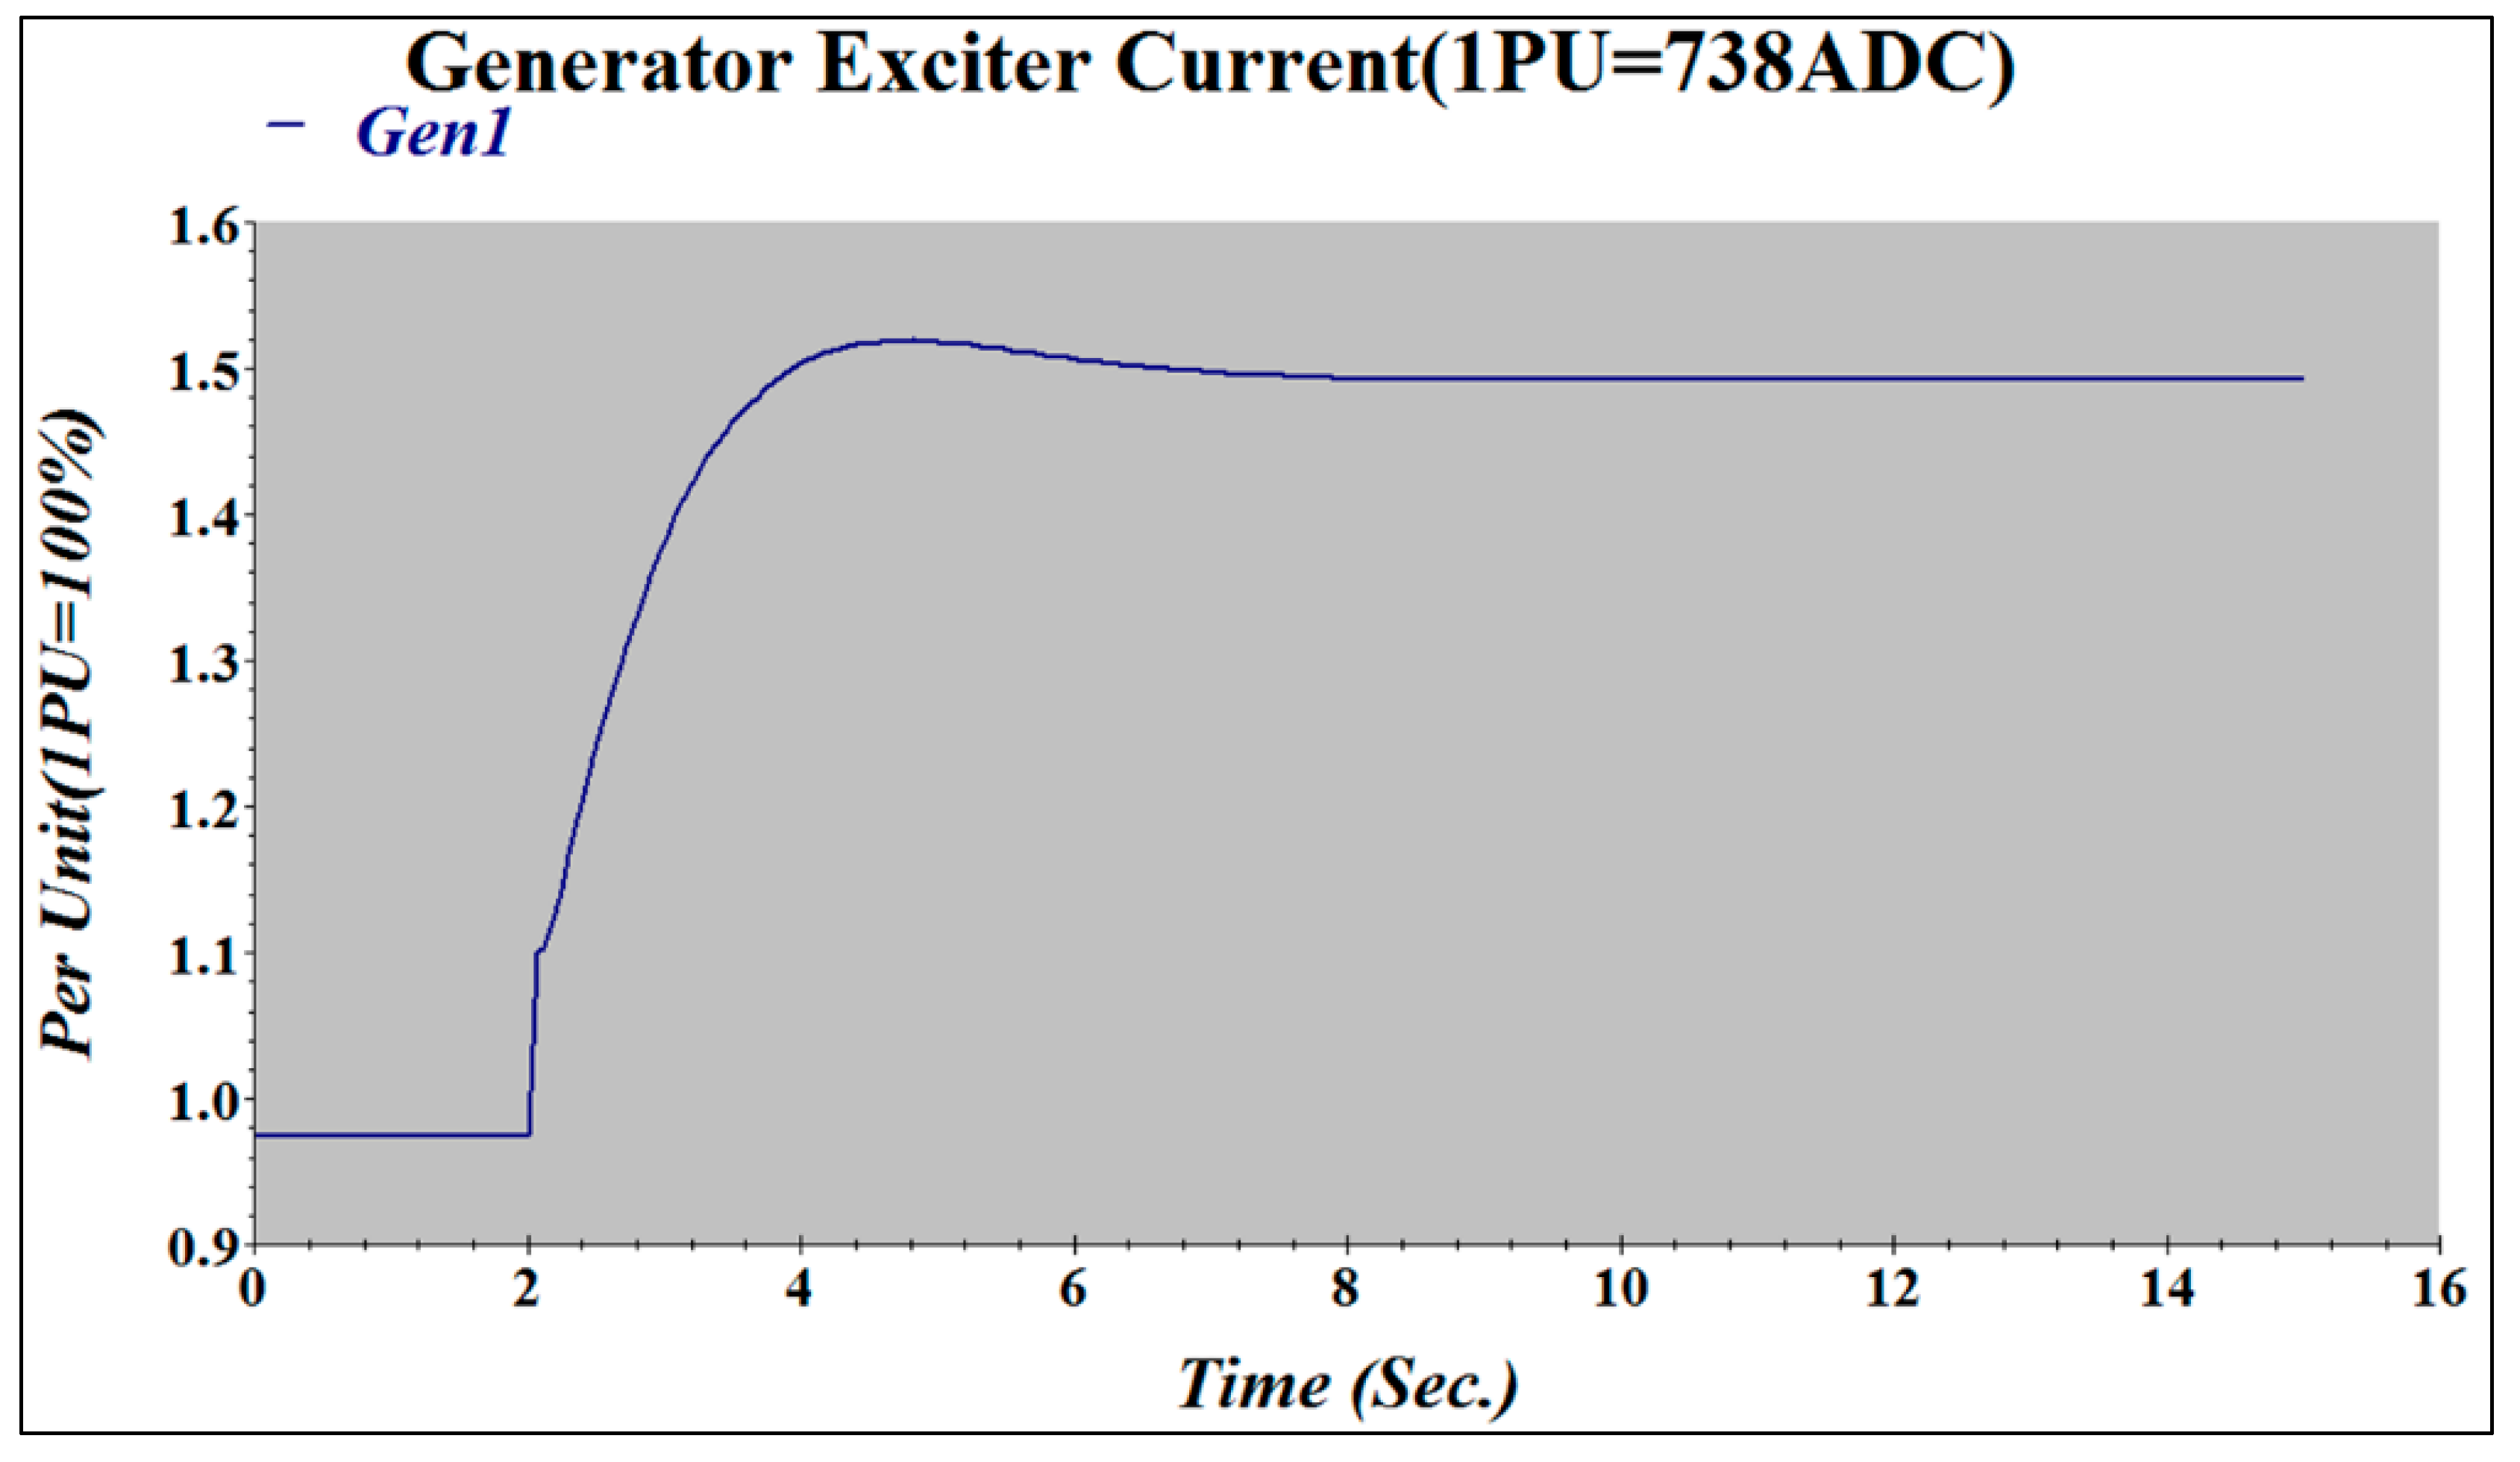
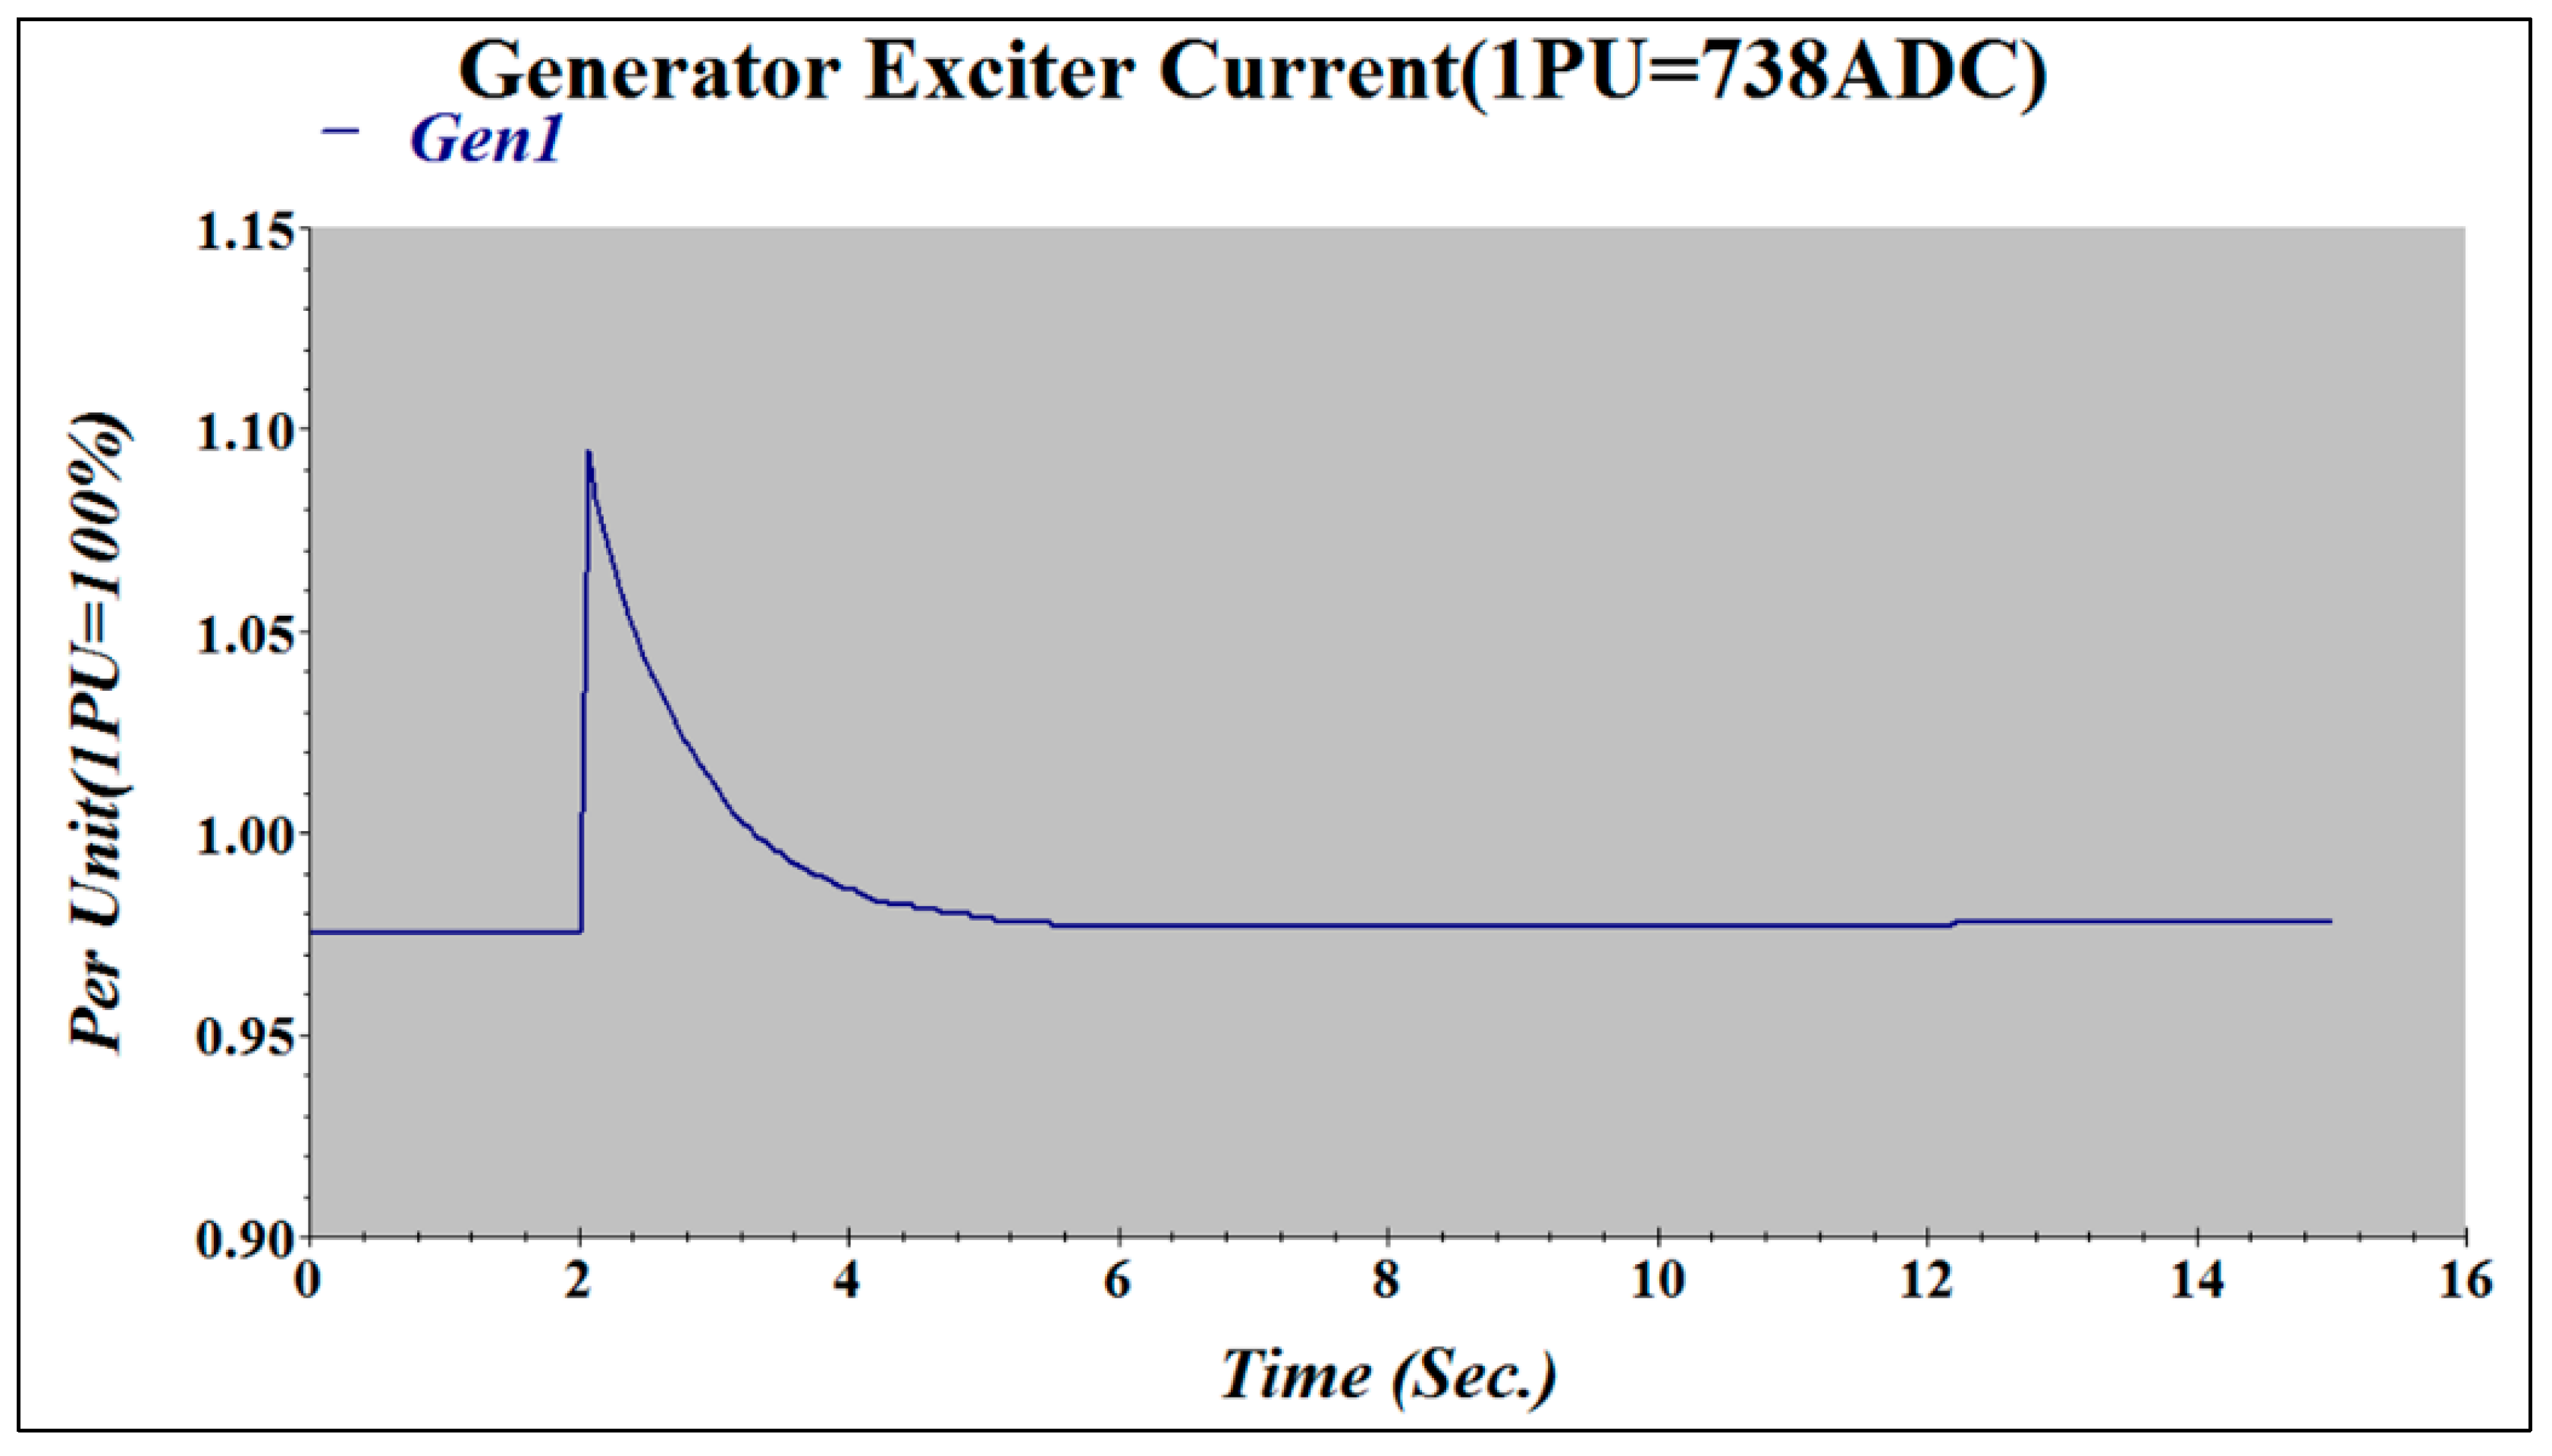
Figure 9 shows the simulation result when the OEL function was not used. For the experiment, the performance characteristics of OEL were tested by changing the system voltage by −10% through the ETAP program. The same experiment was conducted but with OEL this time. Figure 10 shows the current with OEL at −10% Impact in Grind.
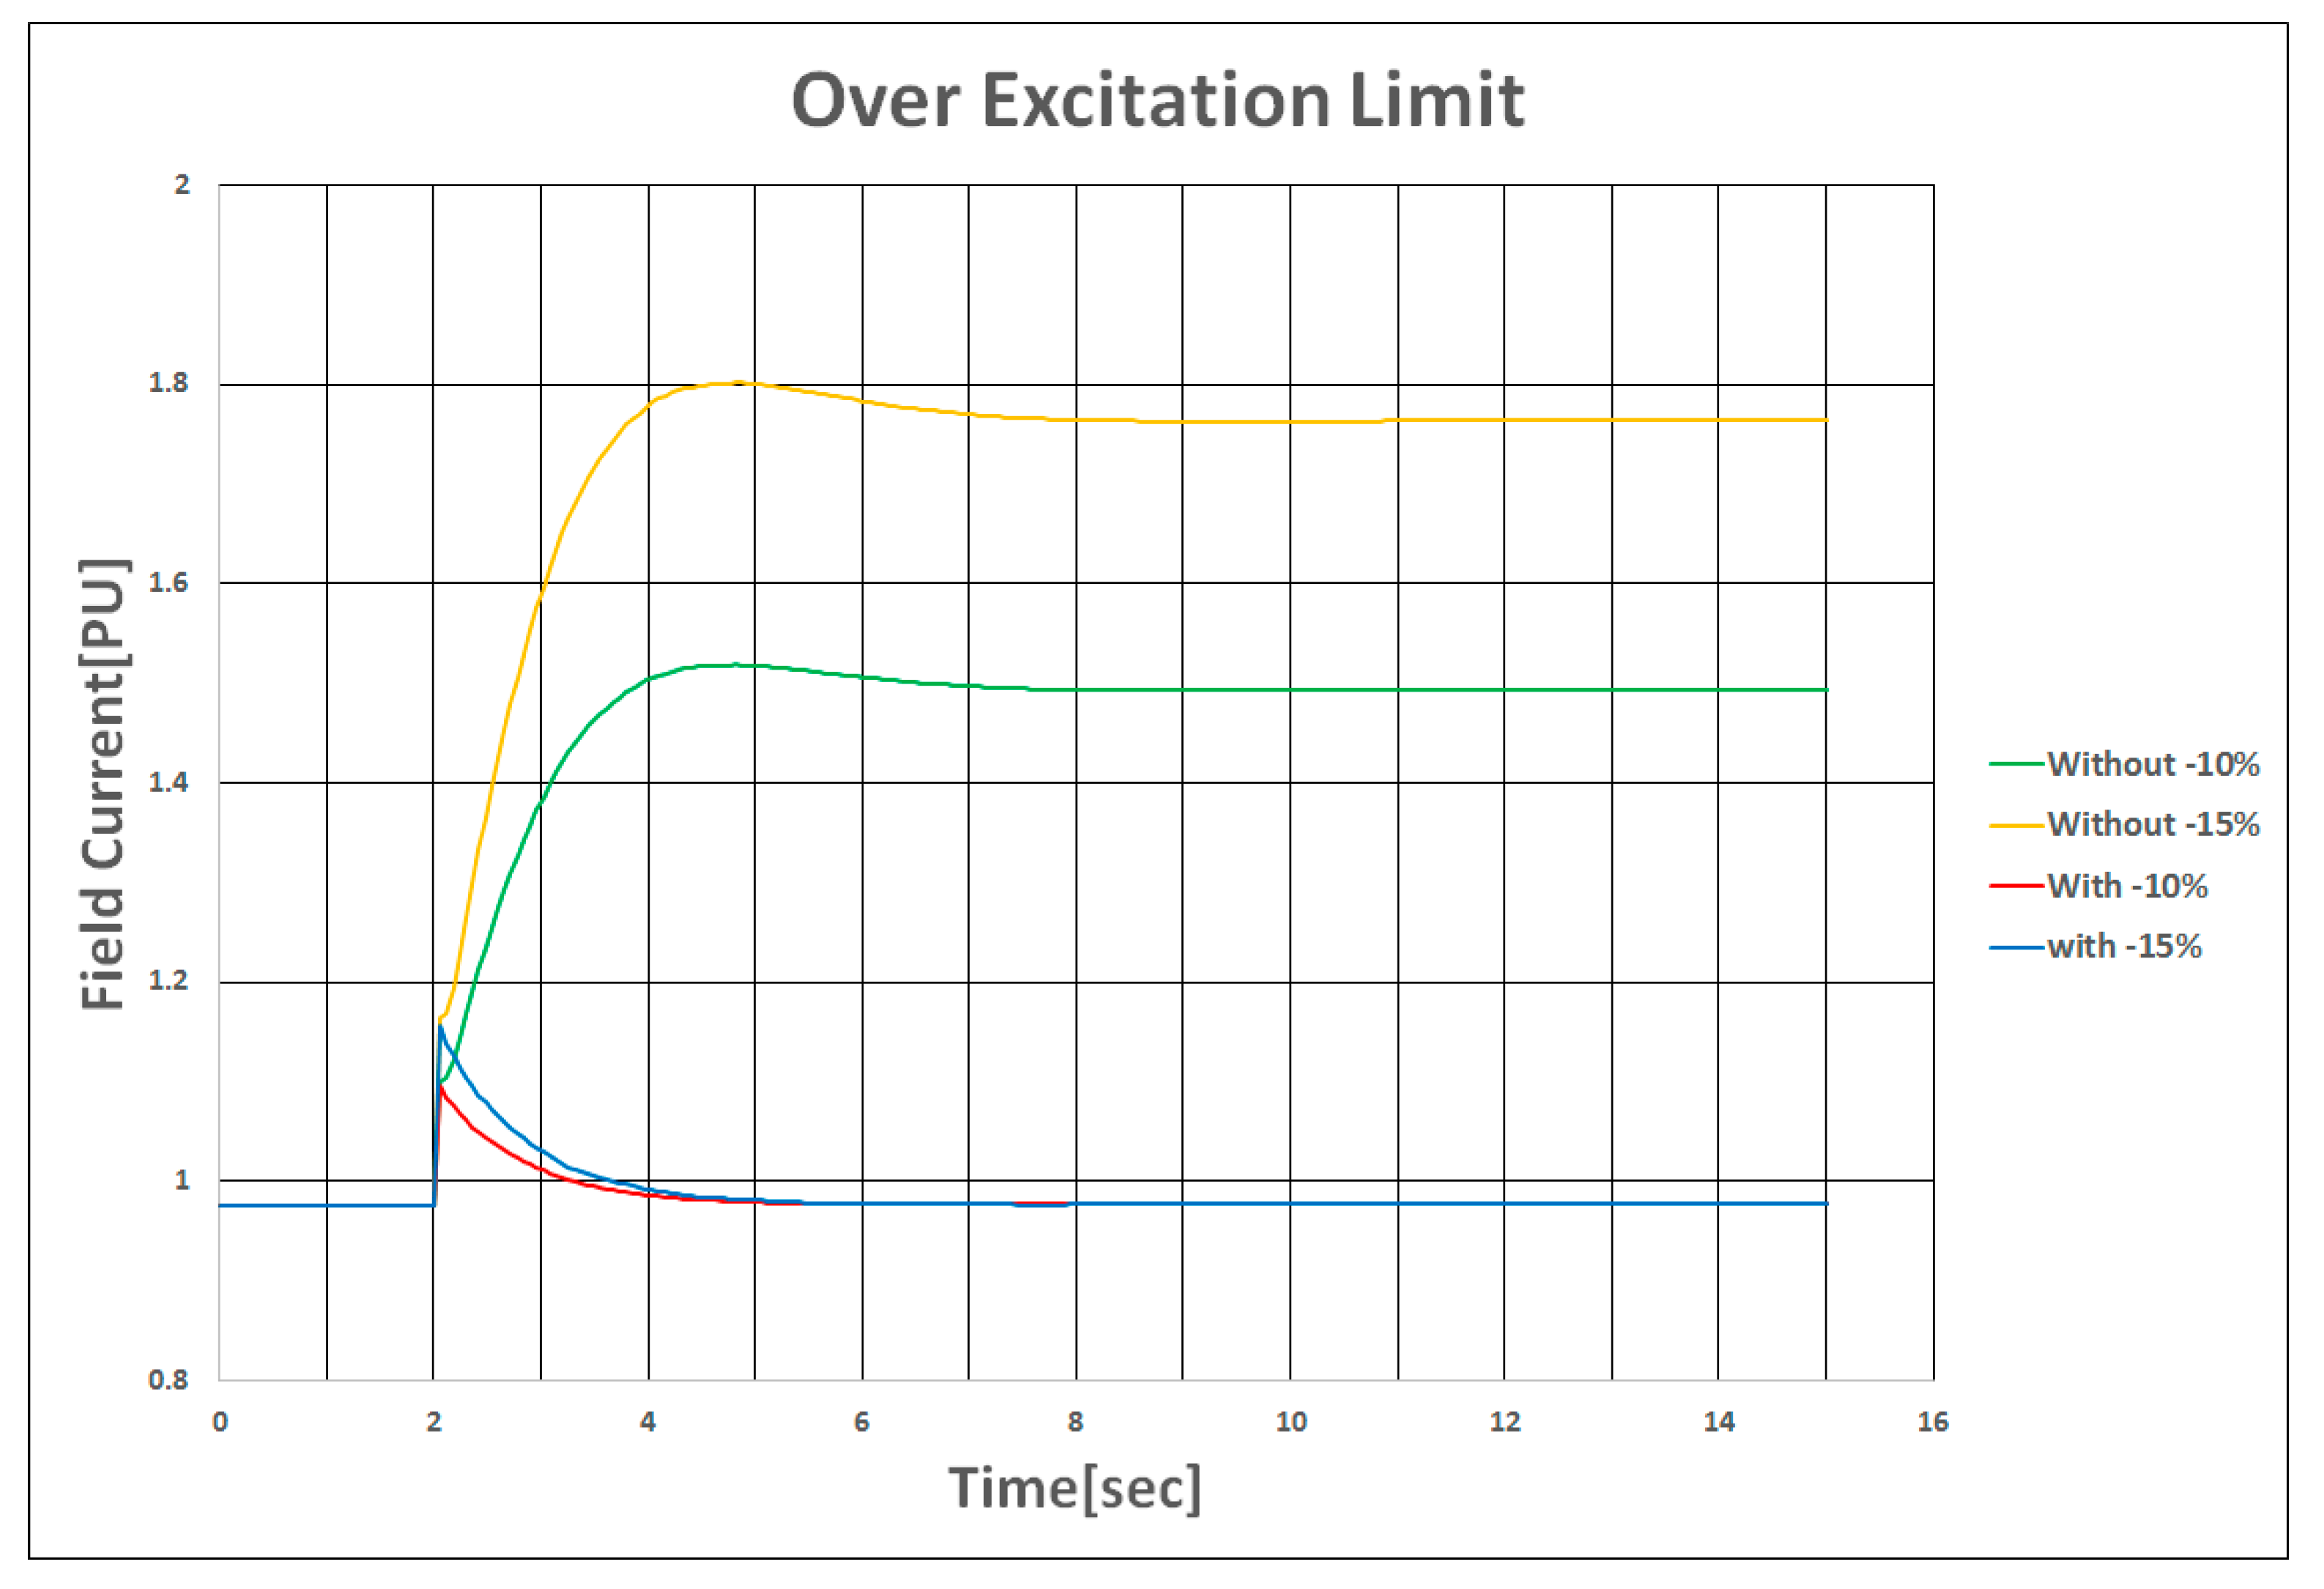
For the experiment, the performance characteristics of OEL were tested by changing the system voltage by −10% through the ETAP simulation program. The same experiment was conducted but with OEL this time. The result is shown in Figure 11. The results (i.e., performance characteristics) from the above two experiments were compared. The current equivalent to 1.58 per unit (pu) was increased in the model without the OEL function but the latter experiment showed that the current value had increased momentarily but the system returned to a steady state after 2.5 s.
Figure 12 describes the UEL (Under Excitation Limit) modeling used for the digital excitation system. It was designed to have the characteristic of a limiter on a P-Q plane and set an UEL curve based on the user’s entry point. The design prevents a partial overheating of a stator core caused by a concentration of magnetic flux at the stator end when the generator is taking a leading phase operation. Also, on the generator capacity curve, the design sets the limit to be common with a tolerable range of leading phase operation considering system stability.
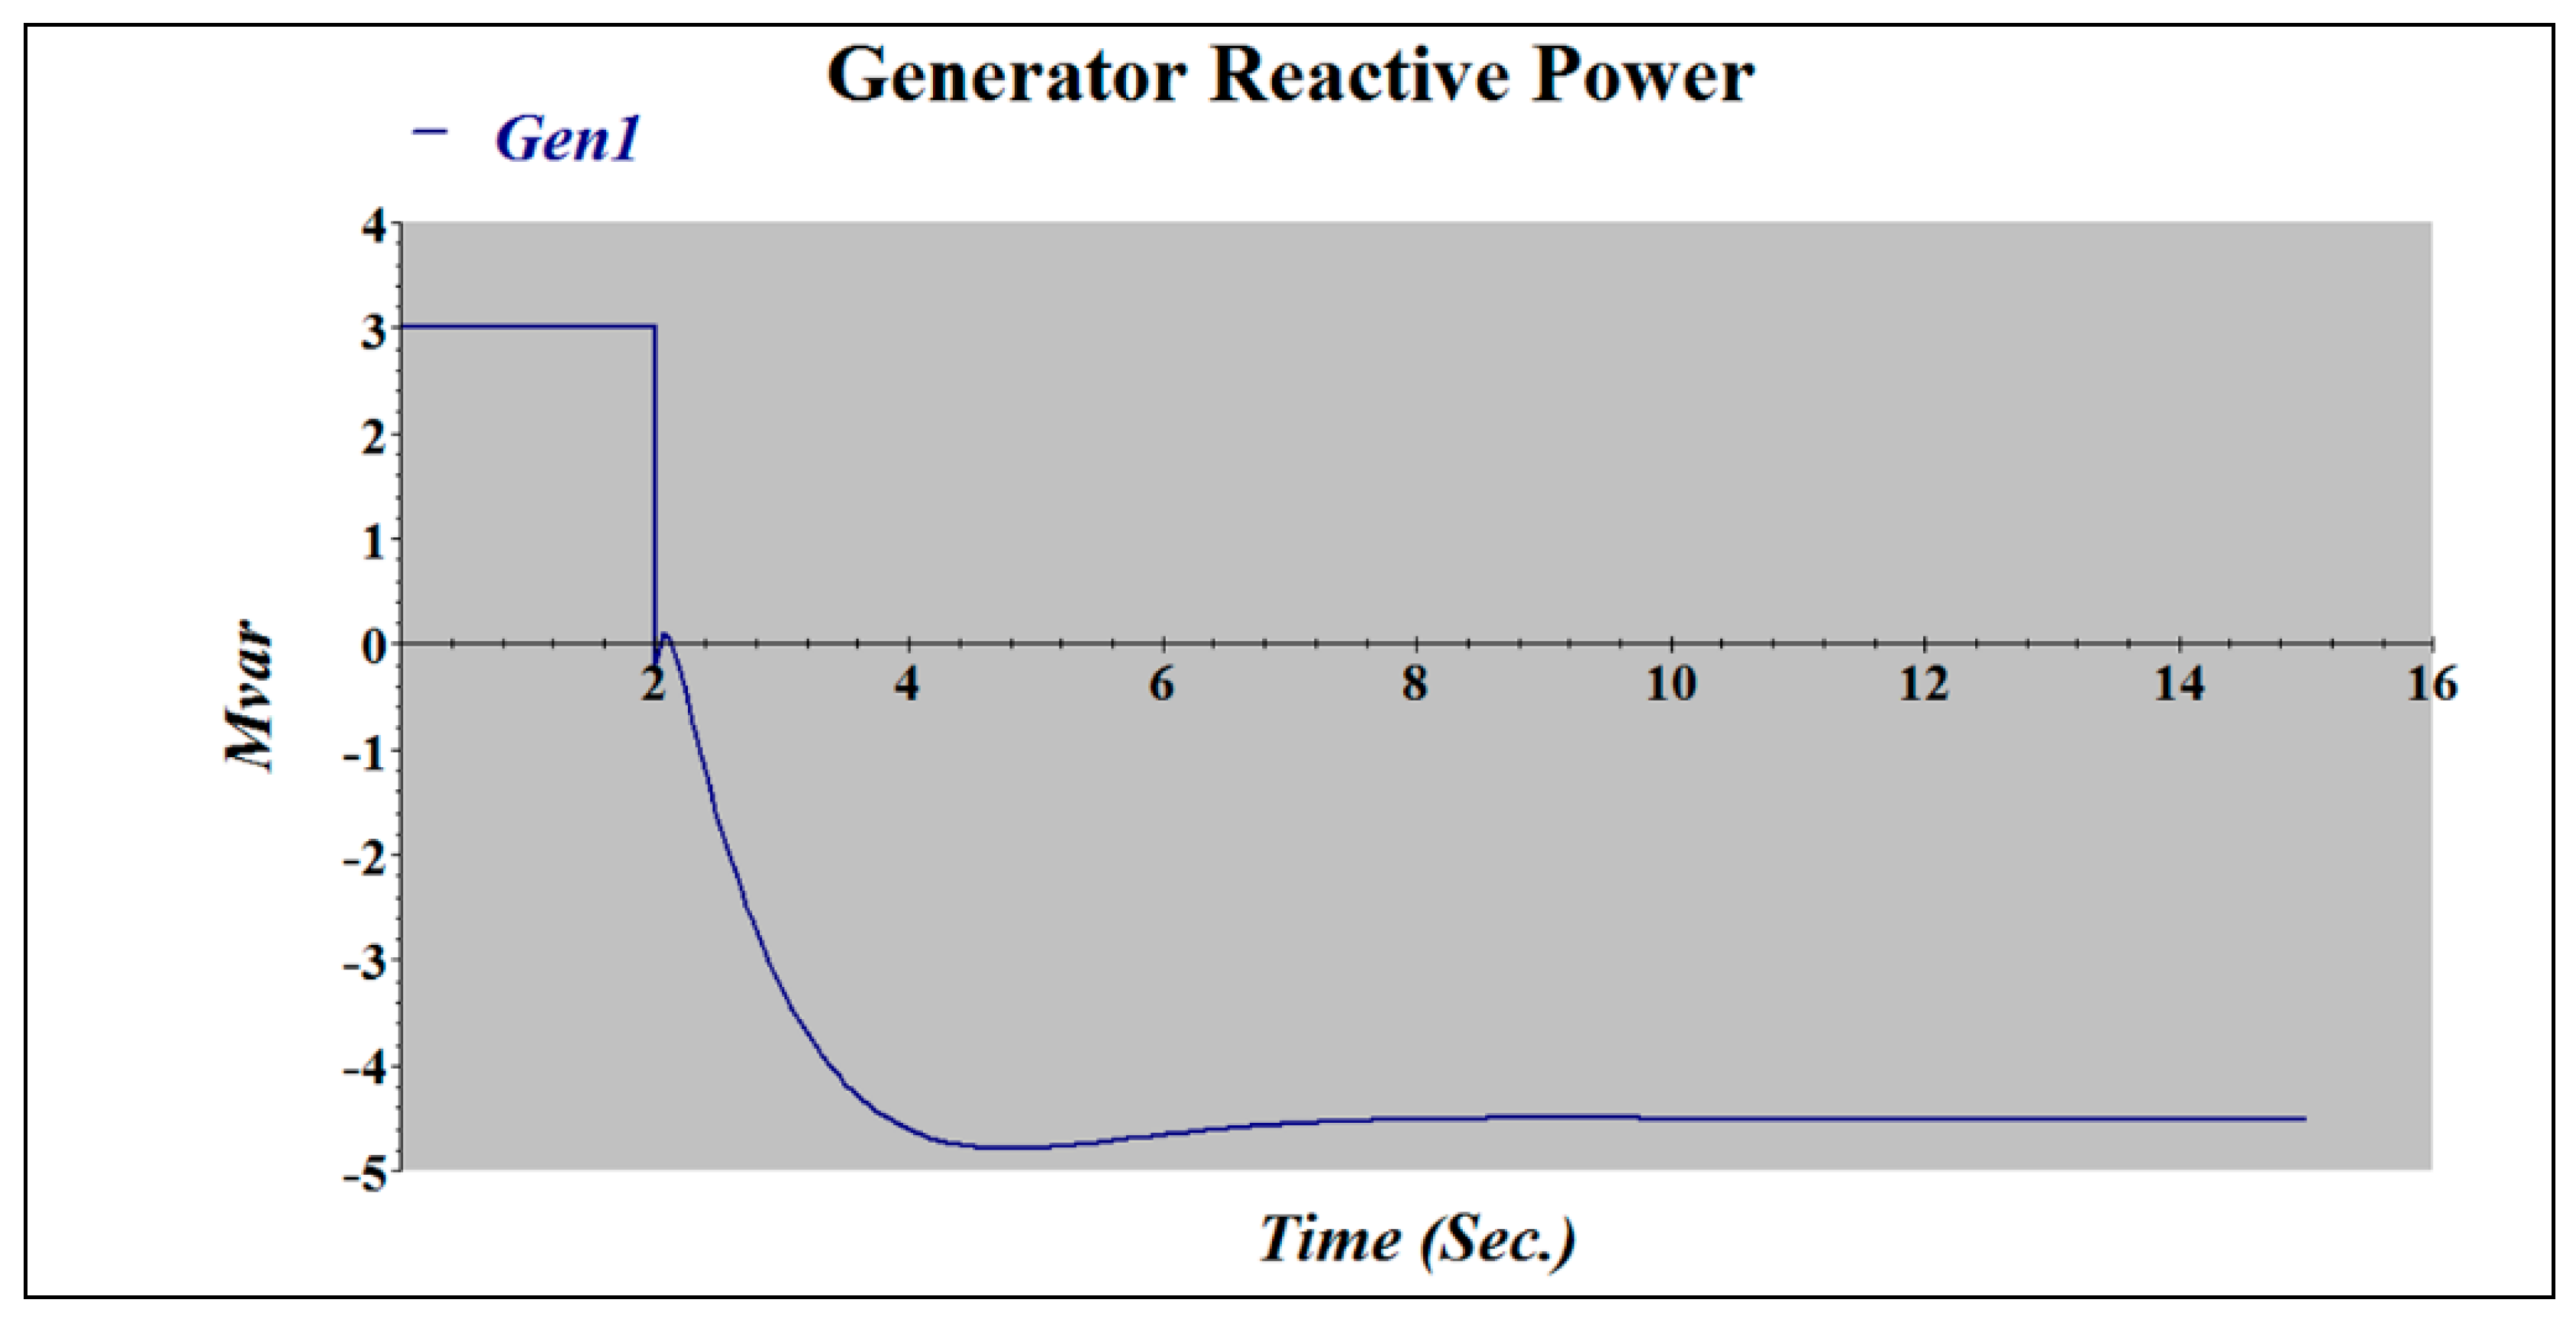
As in Figure 13, a simulation was conducted without using the UEL function. For the simulation, the performance characteristics of UEL were tested by changing the system voltage by −10% through the ETAP program.
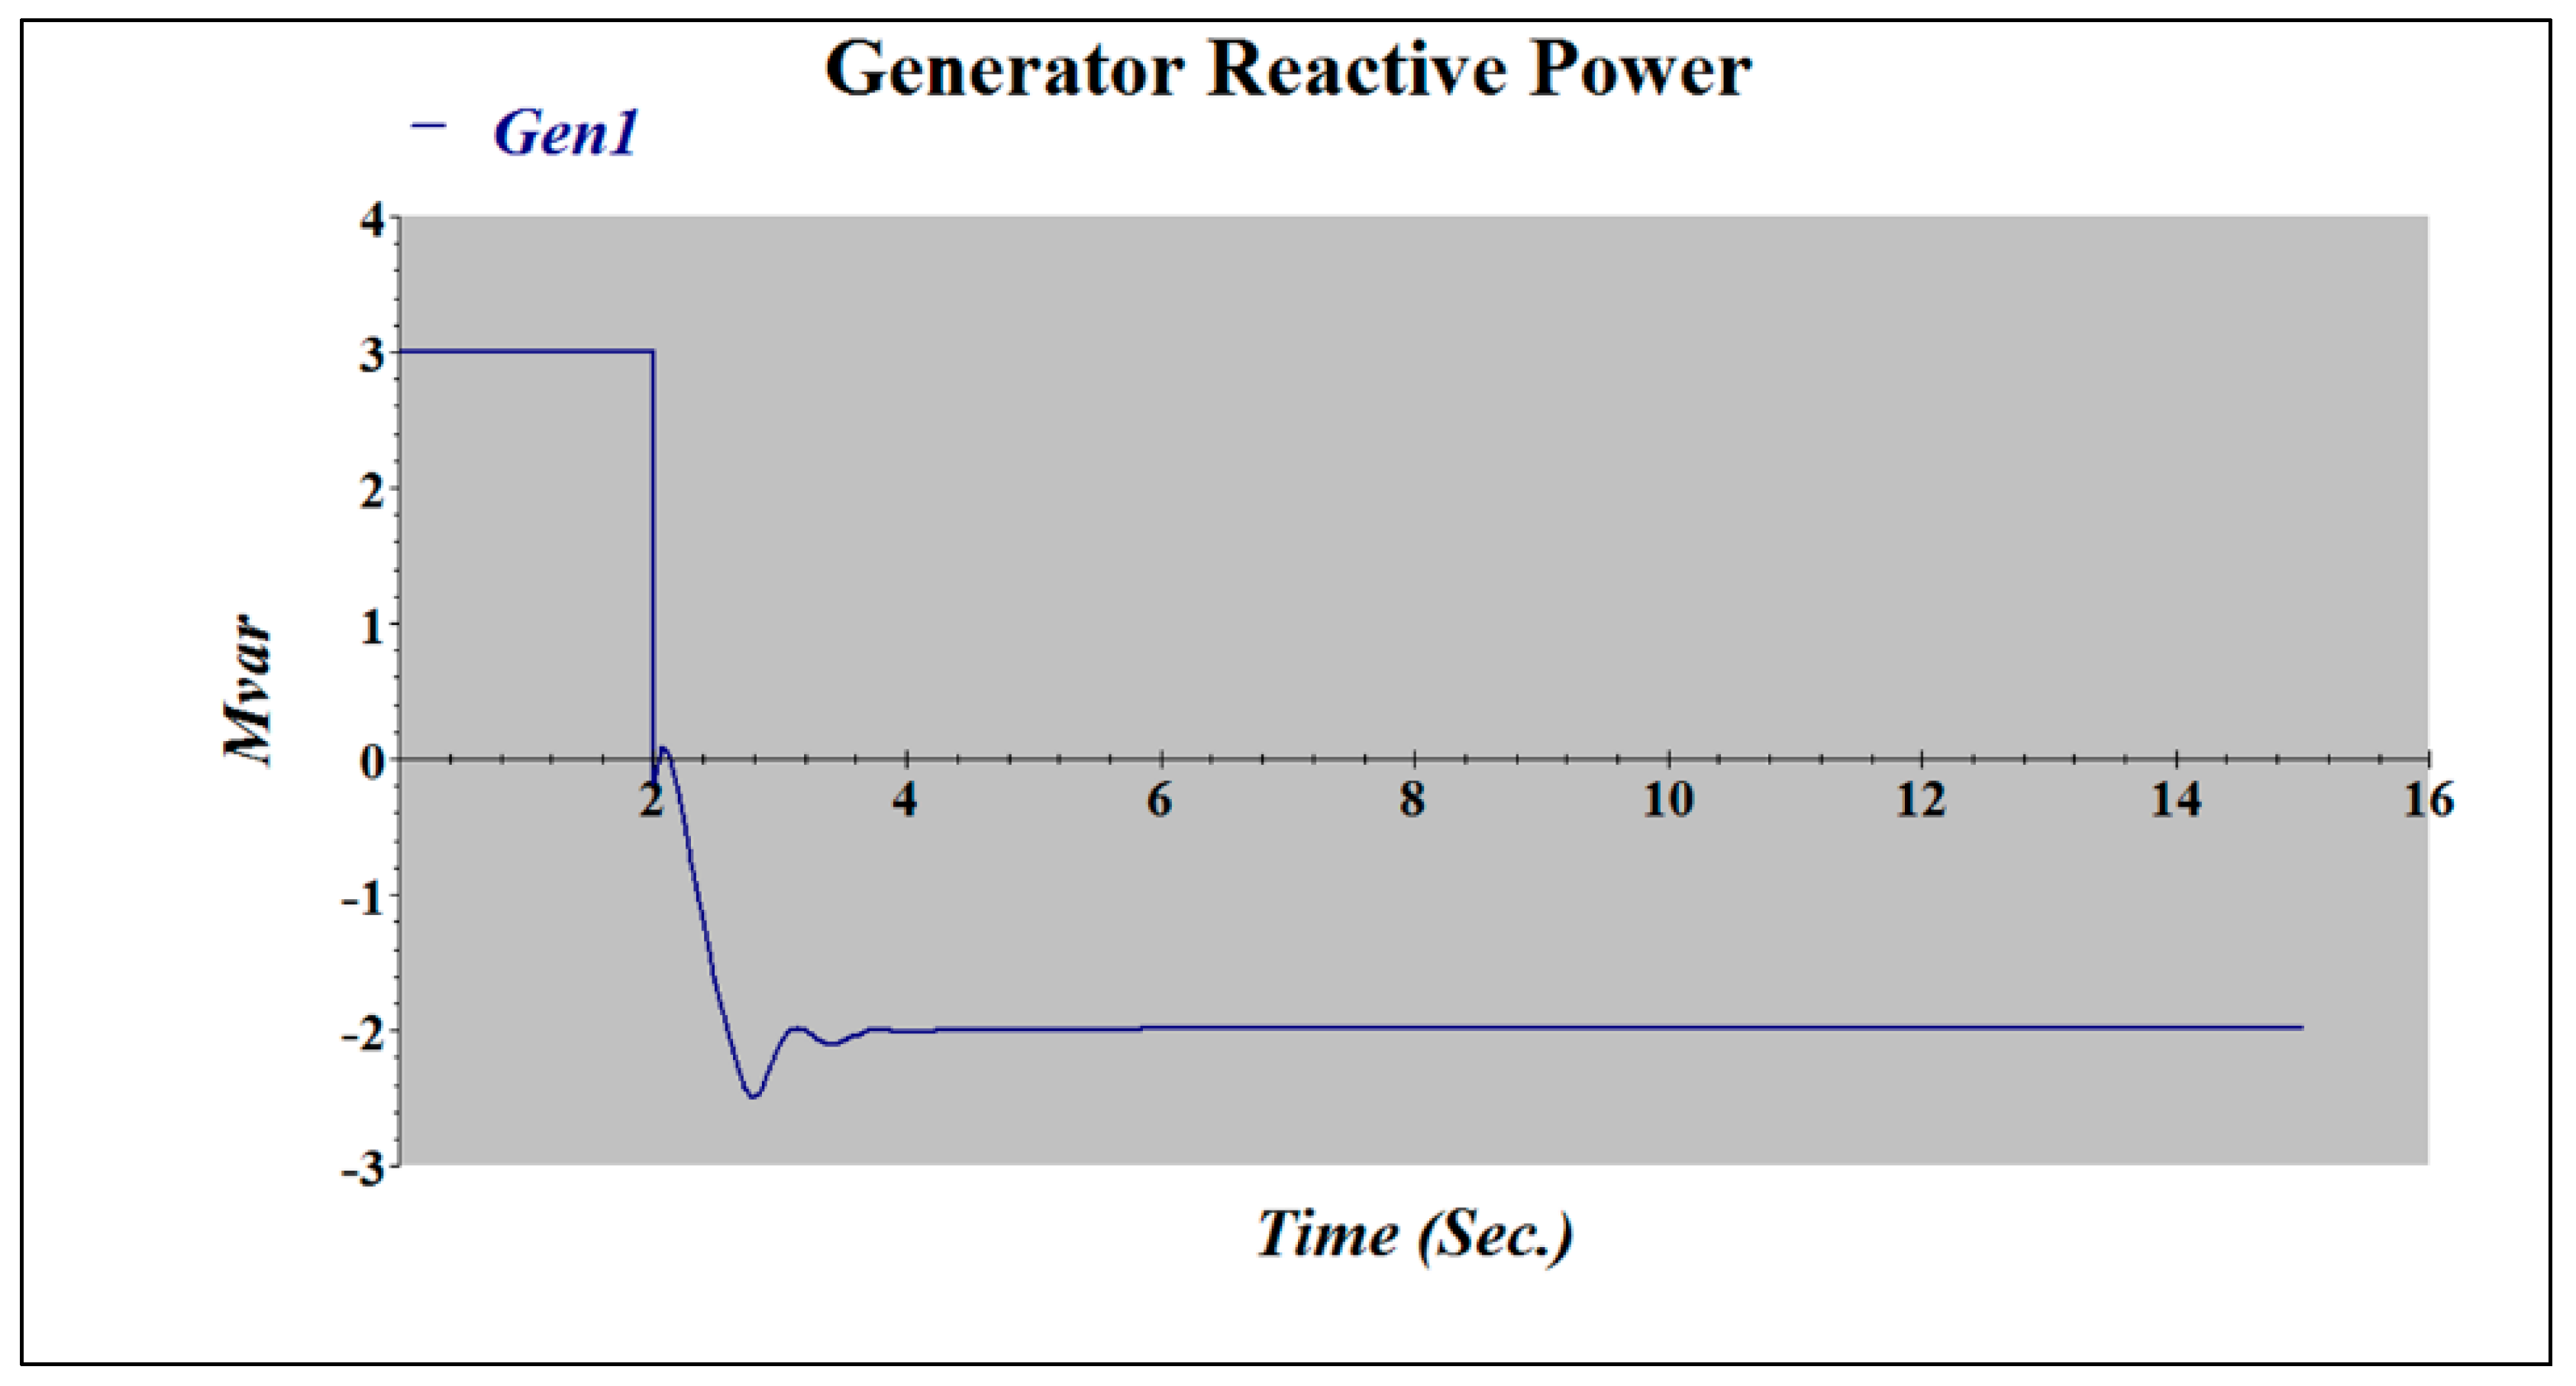
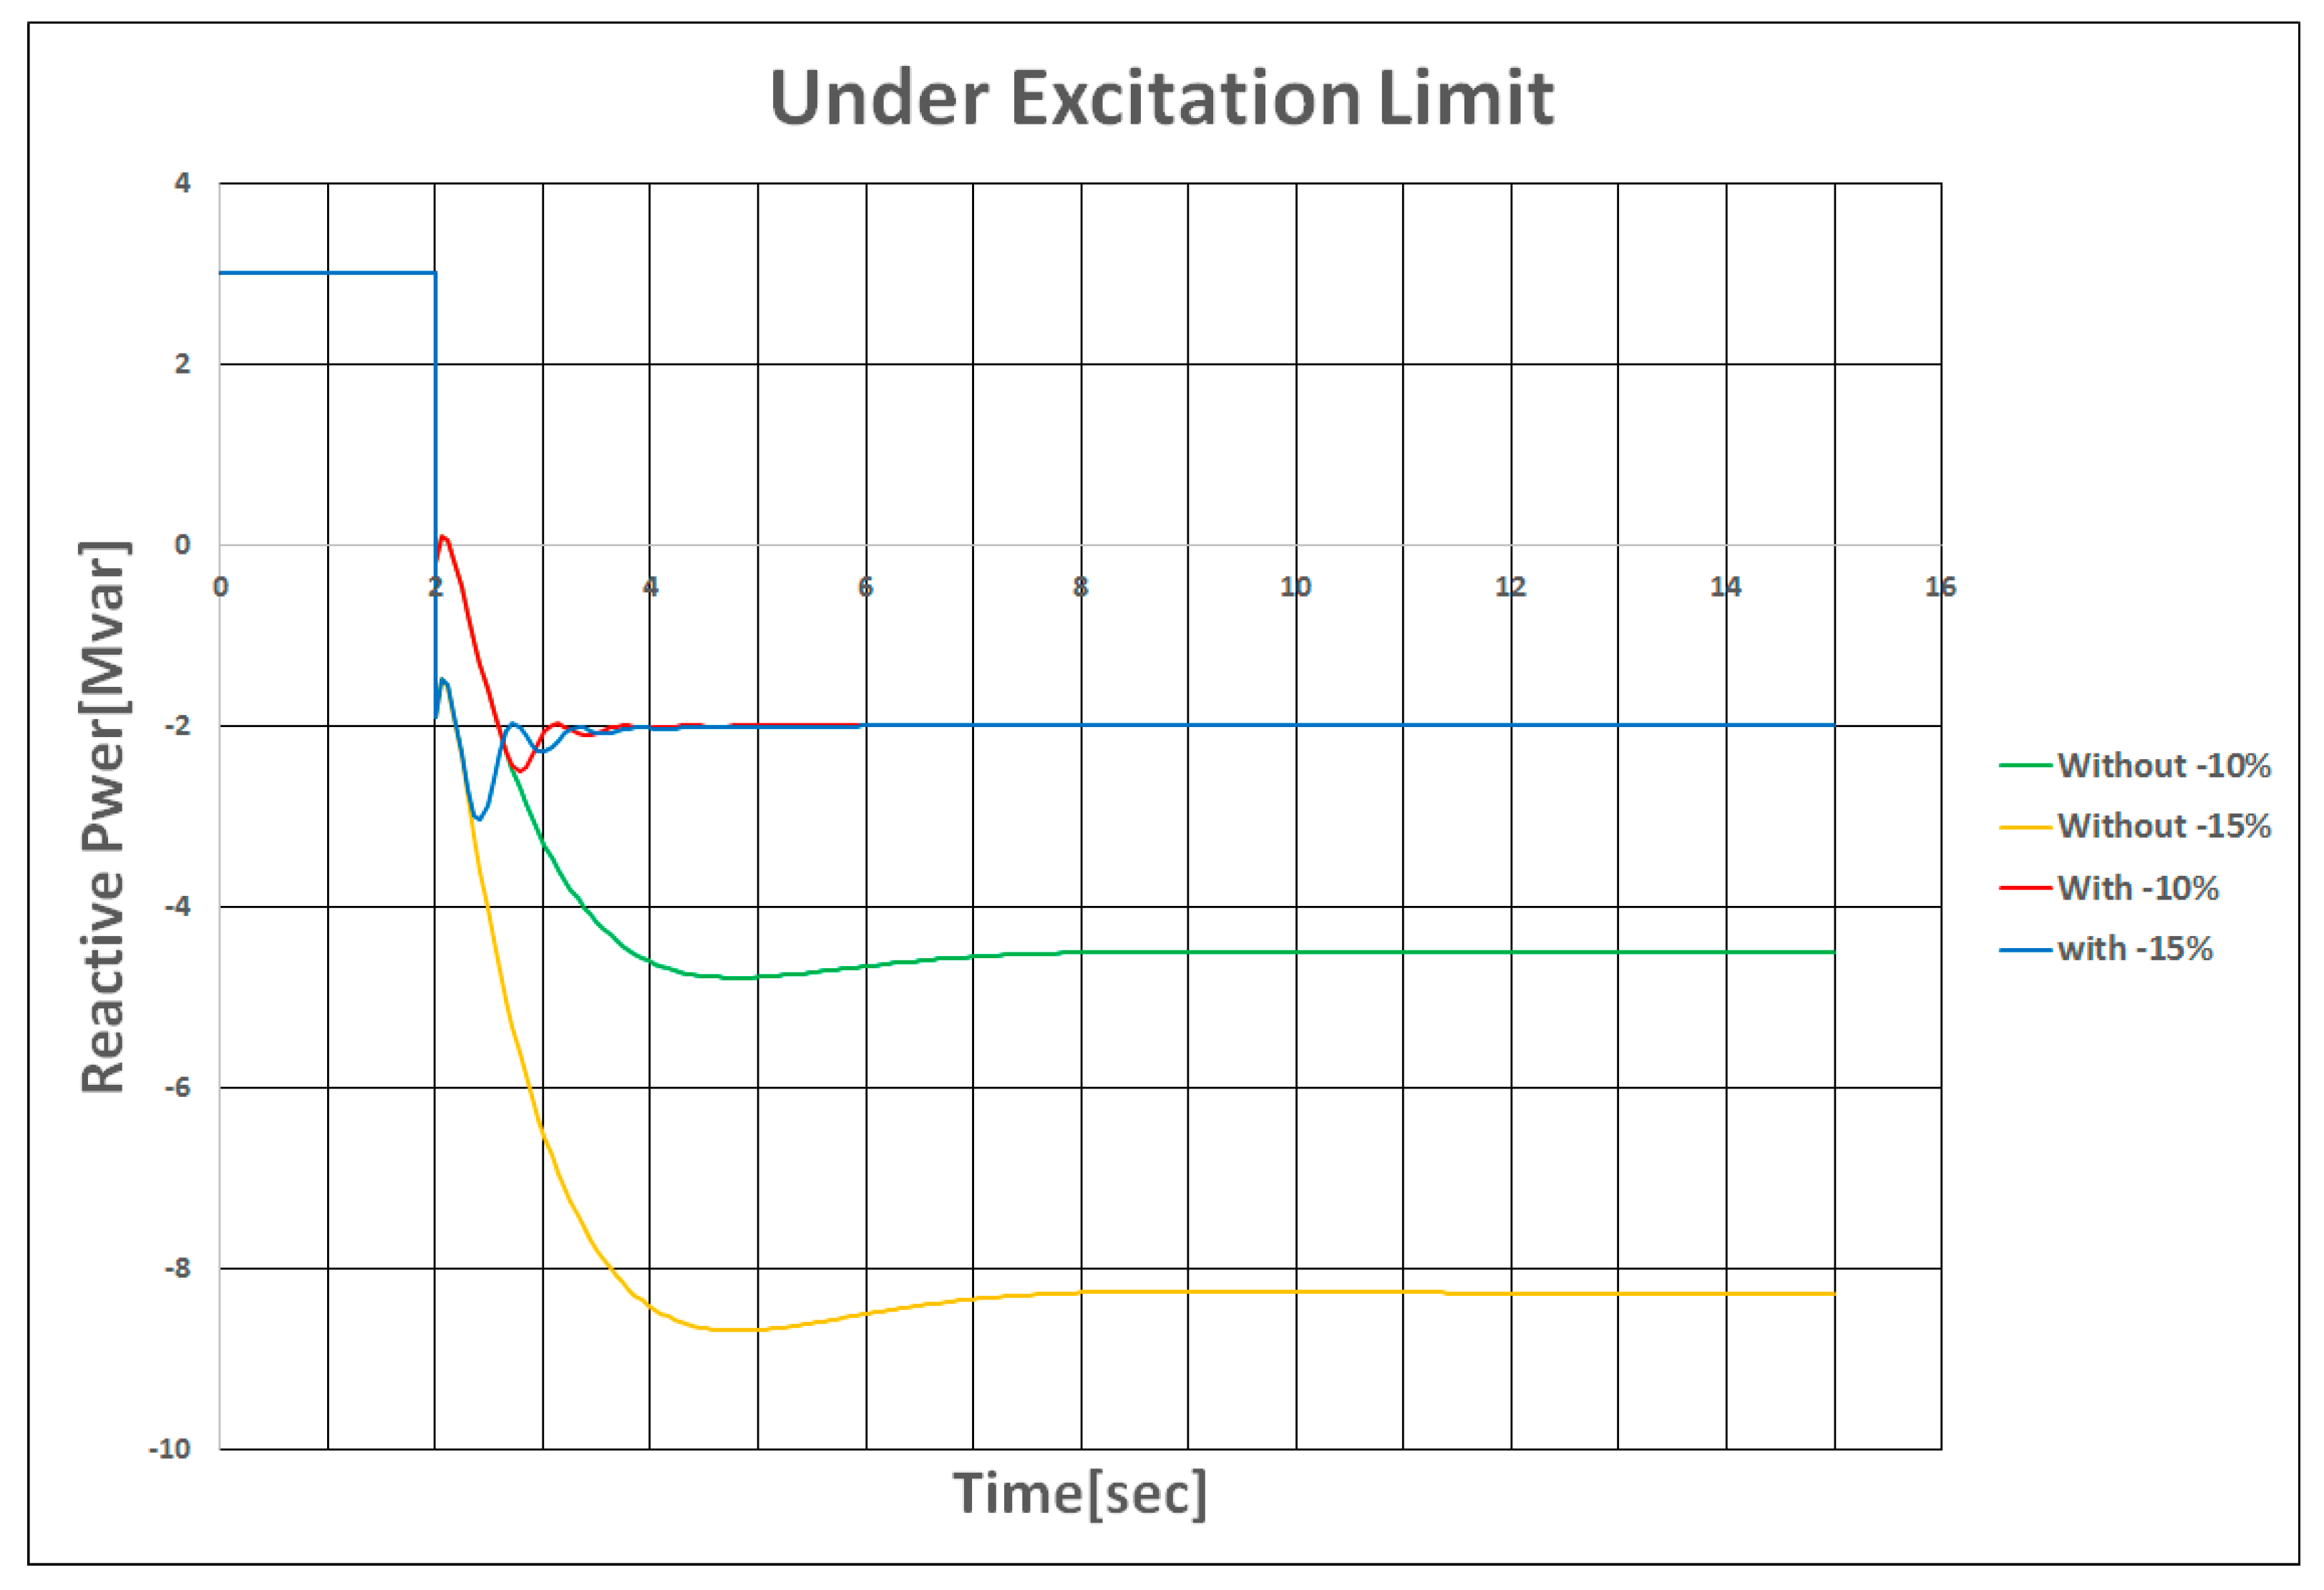
The same simulation was conducted but with UEL this time. The result is shown in Figure 14. Also, Figure 15 shows the graphic comparison of the results obtained from the above two simulations. In the model where UEL was not used, the leading reactive power three times greater than the normal reactive power was generated but in the model with UEL, it surged momentarily but returned to a normal state after 1.0 s.
4. Field Test of Cost-Effective Redundant Digital Excitation Control System
The newly developed system was tested at the gas turbine facility in a thermal power plant. The test items consisted of six items and the details will be disclosed in this paper. Table 1 shows the specifications of a gas turbine at a thermal power plant.
- (1)
- Test for establishment of initial voltage
- (2)
- Test for establishment of initial current
- (3)
- Step response test
- (4)
- Under-excitation limit test
- (5)
- Over-flux (V/Hz)
- (6)
- Over-excitation protection
4.1. Establishment of Initial Voltage
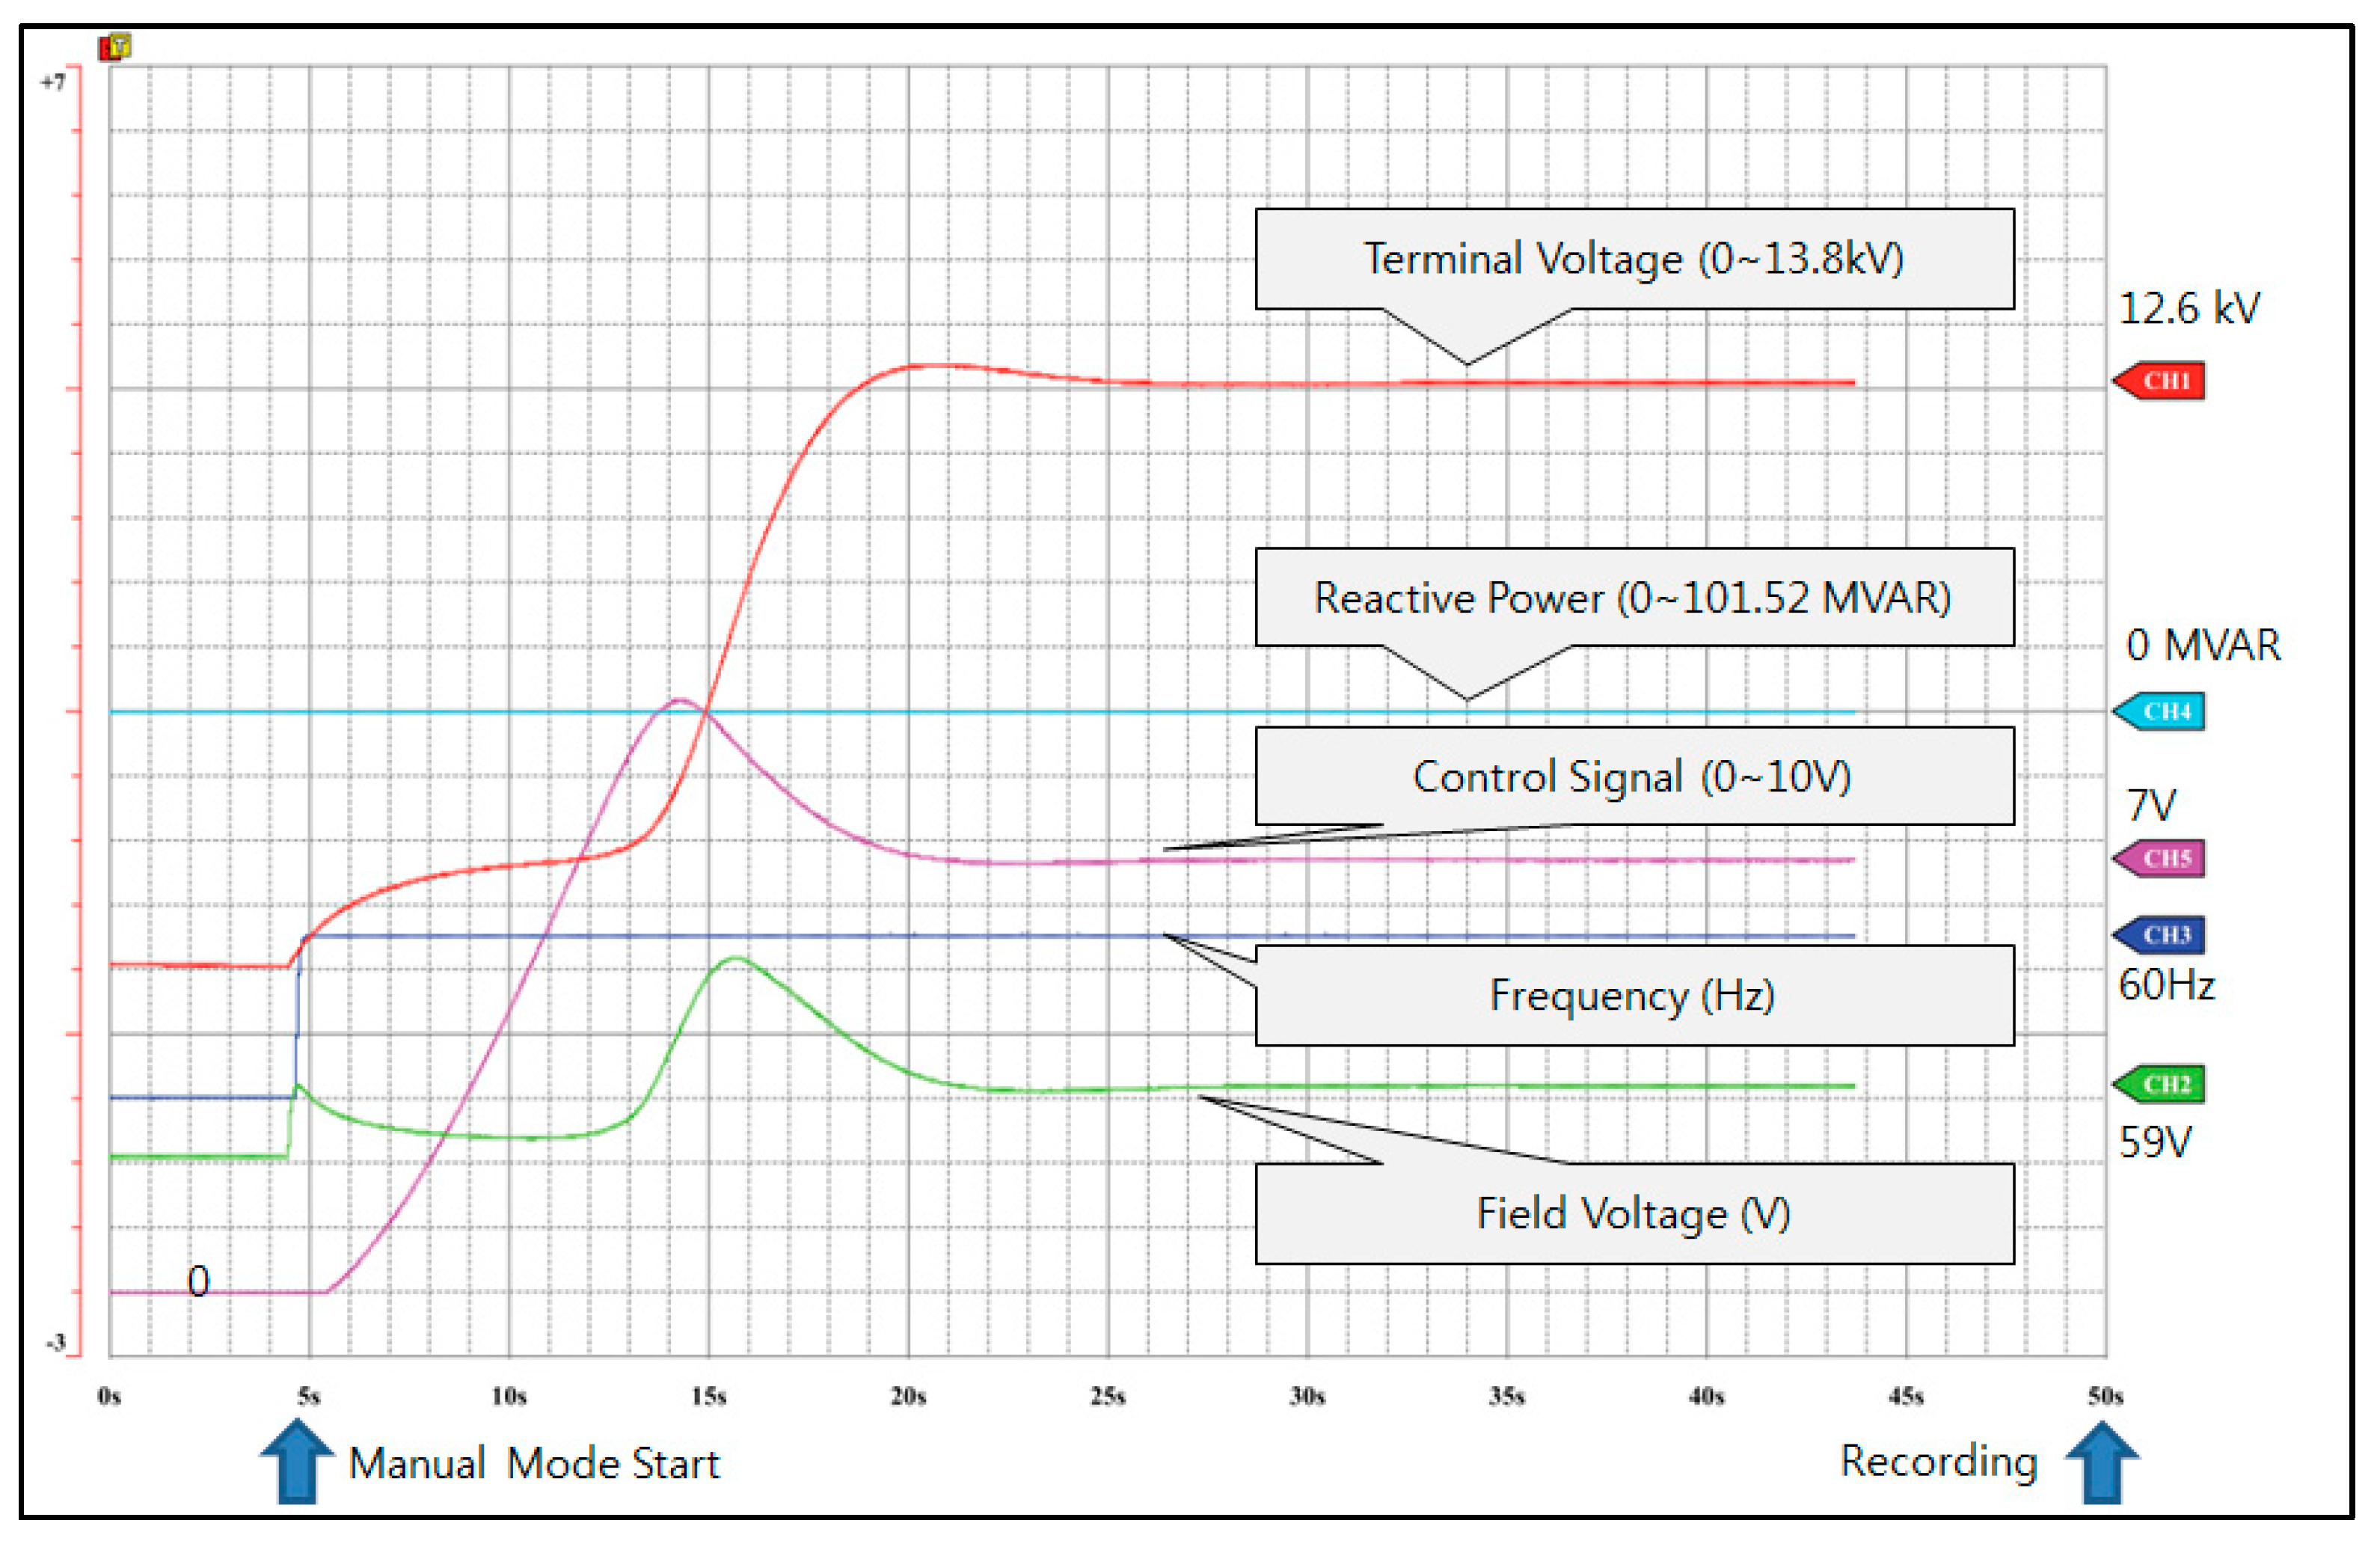
At the state where the generator has not been synchronized into the power system (i.e., No-Load), an initial waveform was measured prior to initial maneuvering to study the changing trend of terminal voltages in Auto Mode of the excitation control system. As a result, it was confirmed that the system started to maneuver from “Soft Start (Generator Voltage)” by automatically deploying a field breaker when the speed of the gas turbine exceeds 95% of rated speed. The operation data to be instructed by the controller (i.e., generator voltage, frequency, filed coil voltage and current) were checked for their normality in advance. That is, it was possible to confirm that the generator voltage was established at 1.00 PU (rated voltage ratio). Figure 16 below shows the initial Build-up waveform of generator terminal voltage at this point. As the initial build-up of the digital redundant controller initiates a soft start, there won’t be any overshooting of terminal voltage so that the mechanical stress should be low. Also, Table 2 shows the specification of a gas turbine at the thermal power plant.
4.2. Test for Initial Current Establishment
In the Manual (FCR) Mode of the excitation control system, an initial waveform was measured to study the changing trend of terminal voltages. Similar to above experiment, a field breaker will be deployed when the speed of the gas turbine exceeds 95% of rated speed. The result showed that the generator started as a soft start and the field coil current ratio was 0.282 PU. Figure 17 shows the initial waveform of terminal voltage in manual mode. Also, Table 3 shows the specification of a gas turbine at the thermal power plant.
4.3. Step-Response Test
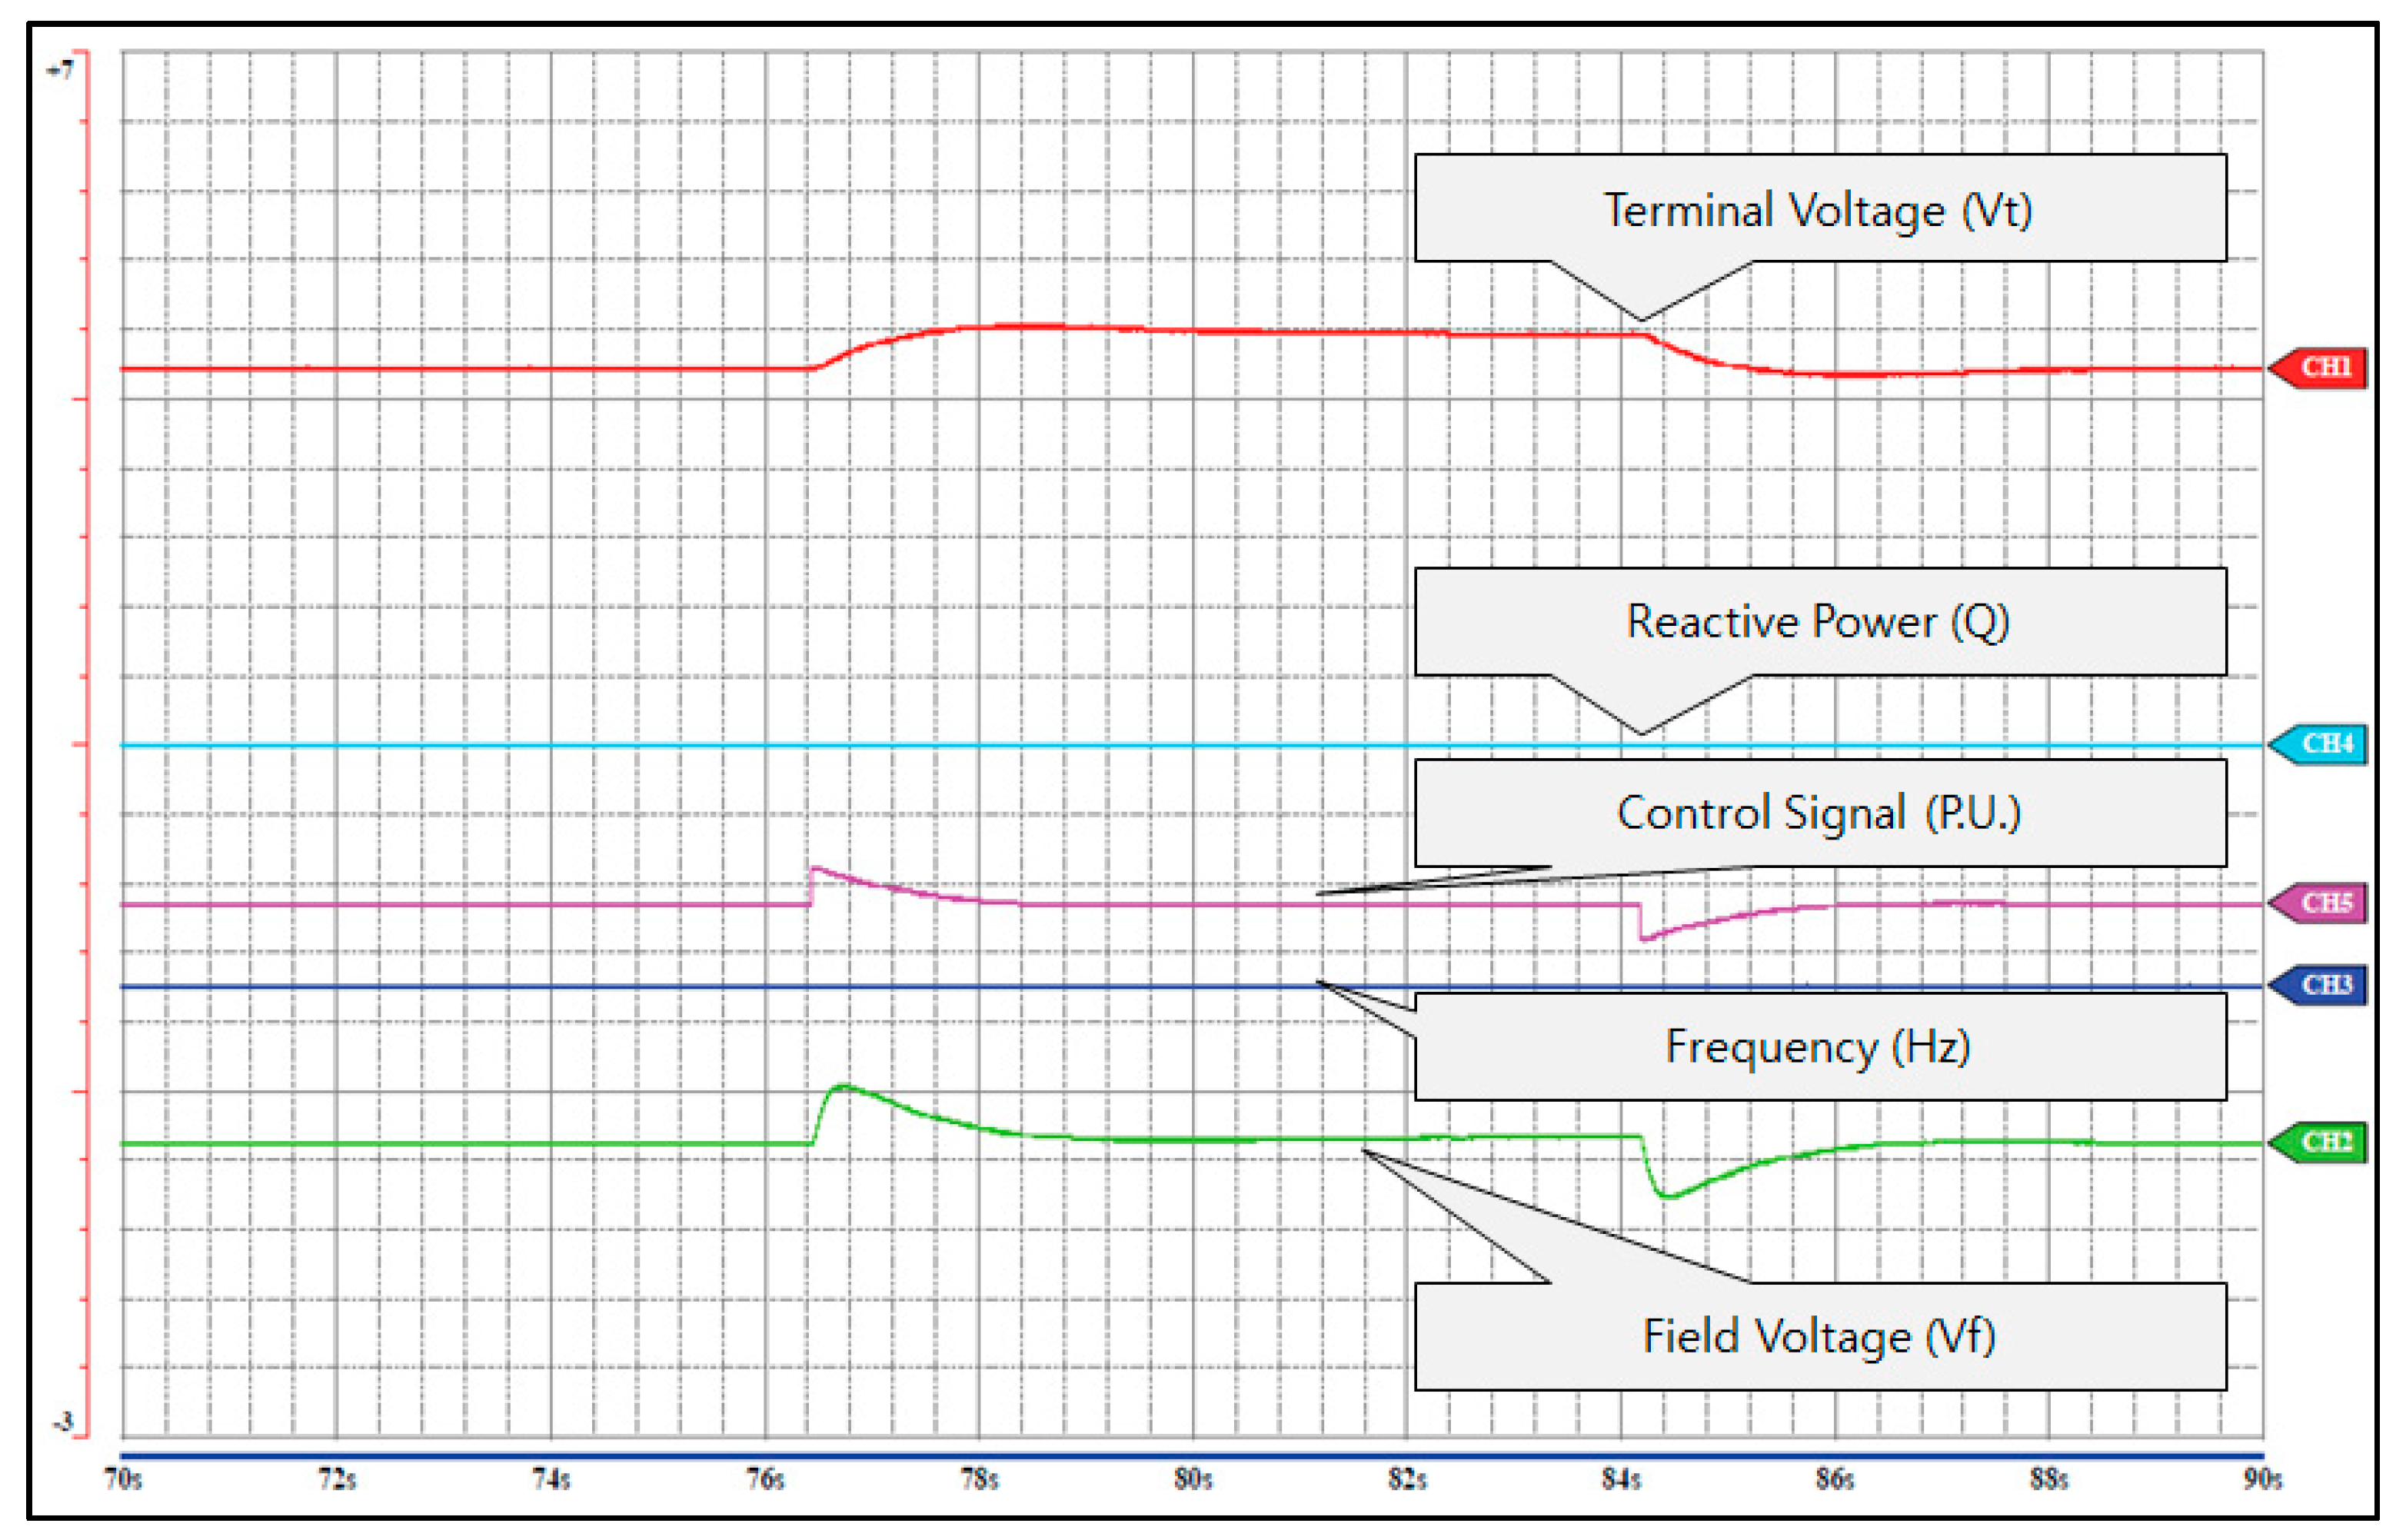
When the generator voltage has become the same as the rated voltage, the trends in generator voltage, frequency, field coil and current against the input step-up signal were observed. This is to test the response characteristics of the AVR system. First, a step-up was carried out at 0.03PU (3%) to see the response result. The 3% step-up signal is equivalent to 0.03 of AVR STEP_SIG (HMI). The next step-ups were conducted continuously at 0.05PU (5%) and 0.07PU (7%) and responses were checked. Figure 18 shows the waveform resulting from the 5% step-response test in auto mode.
After performing step-response tests, the field breaker was opened to secure reliability of the switching function of the back-up controller and after confirming the AVR mode, the generator field breaker was re-deployed to check whether the generator voltage initiates a soft start and its voltage rises to 1.0 PU. The results were satisfactory.
4.4. Under-Excitation Limit Test
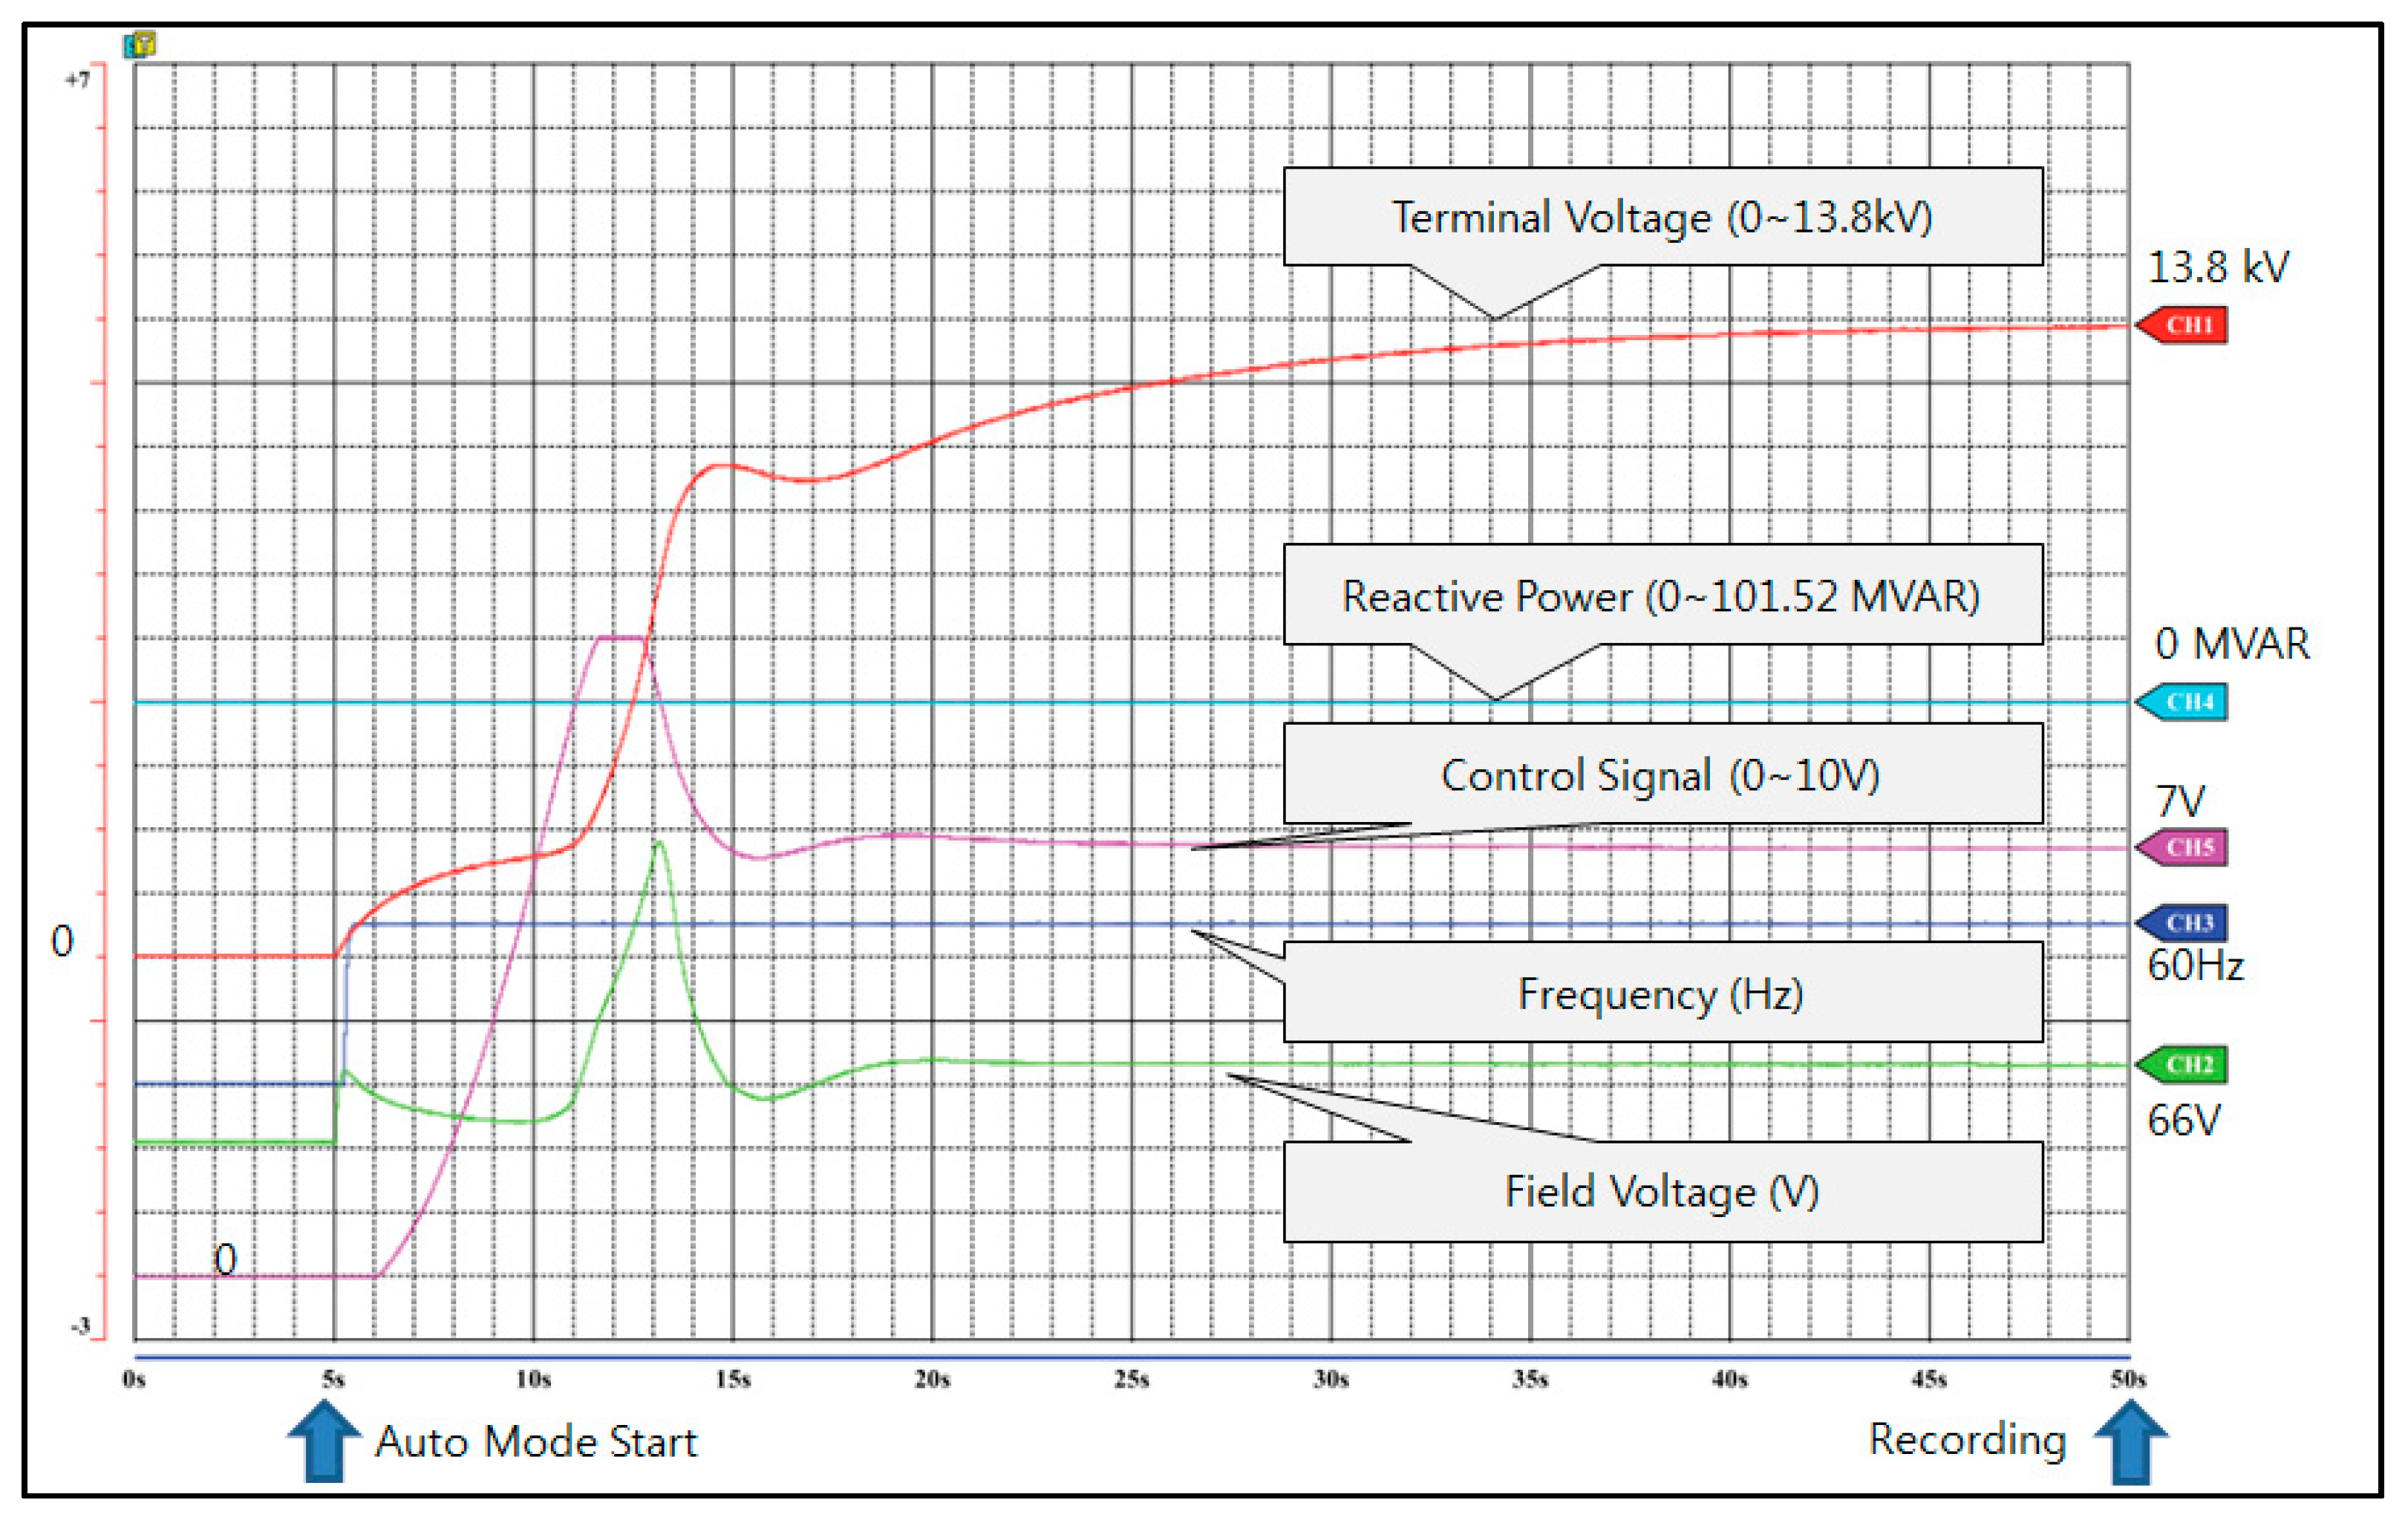
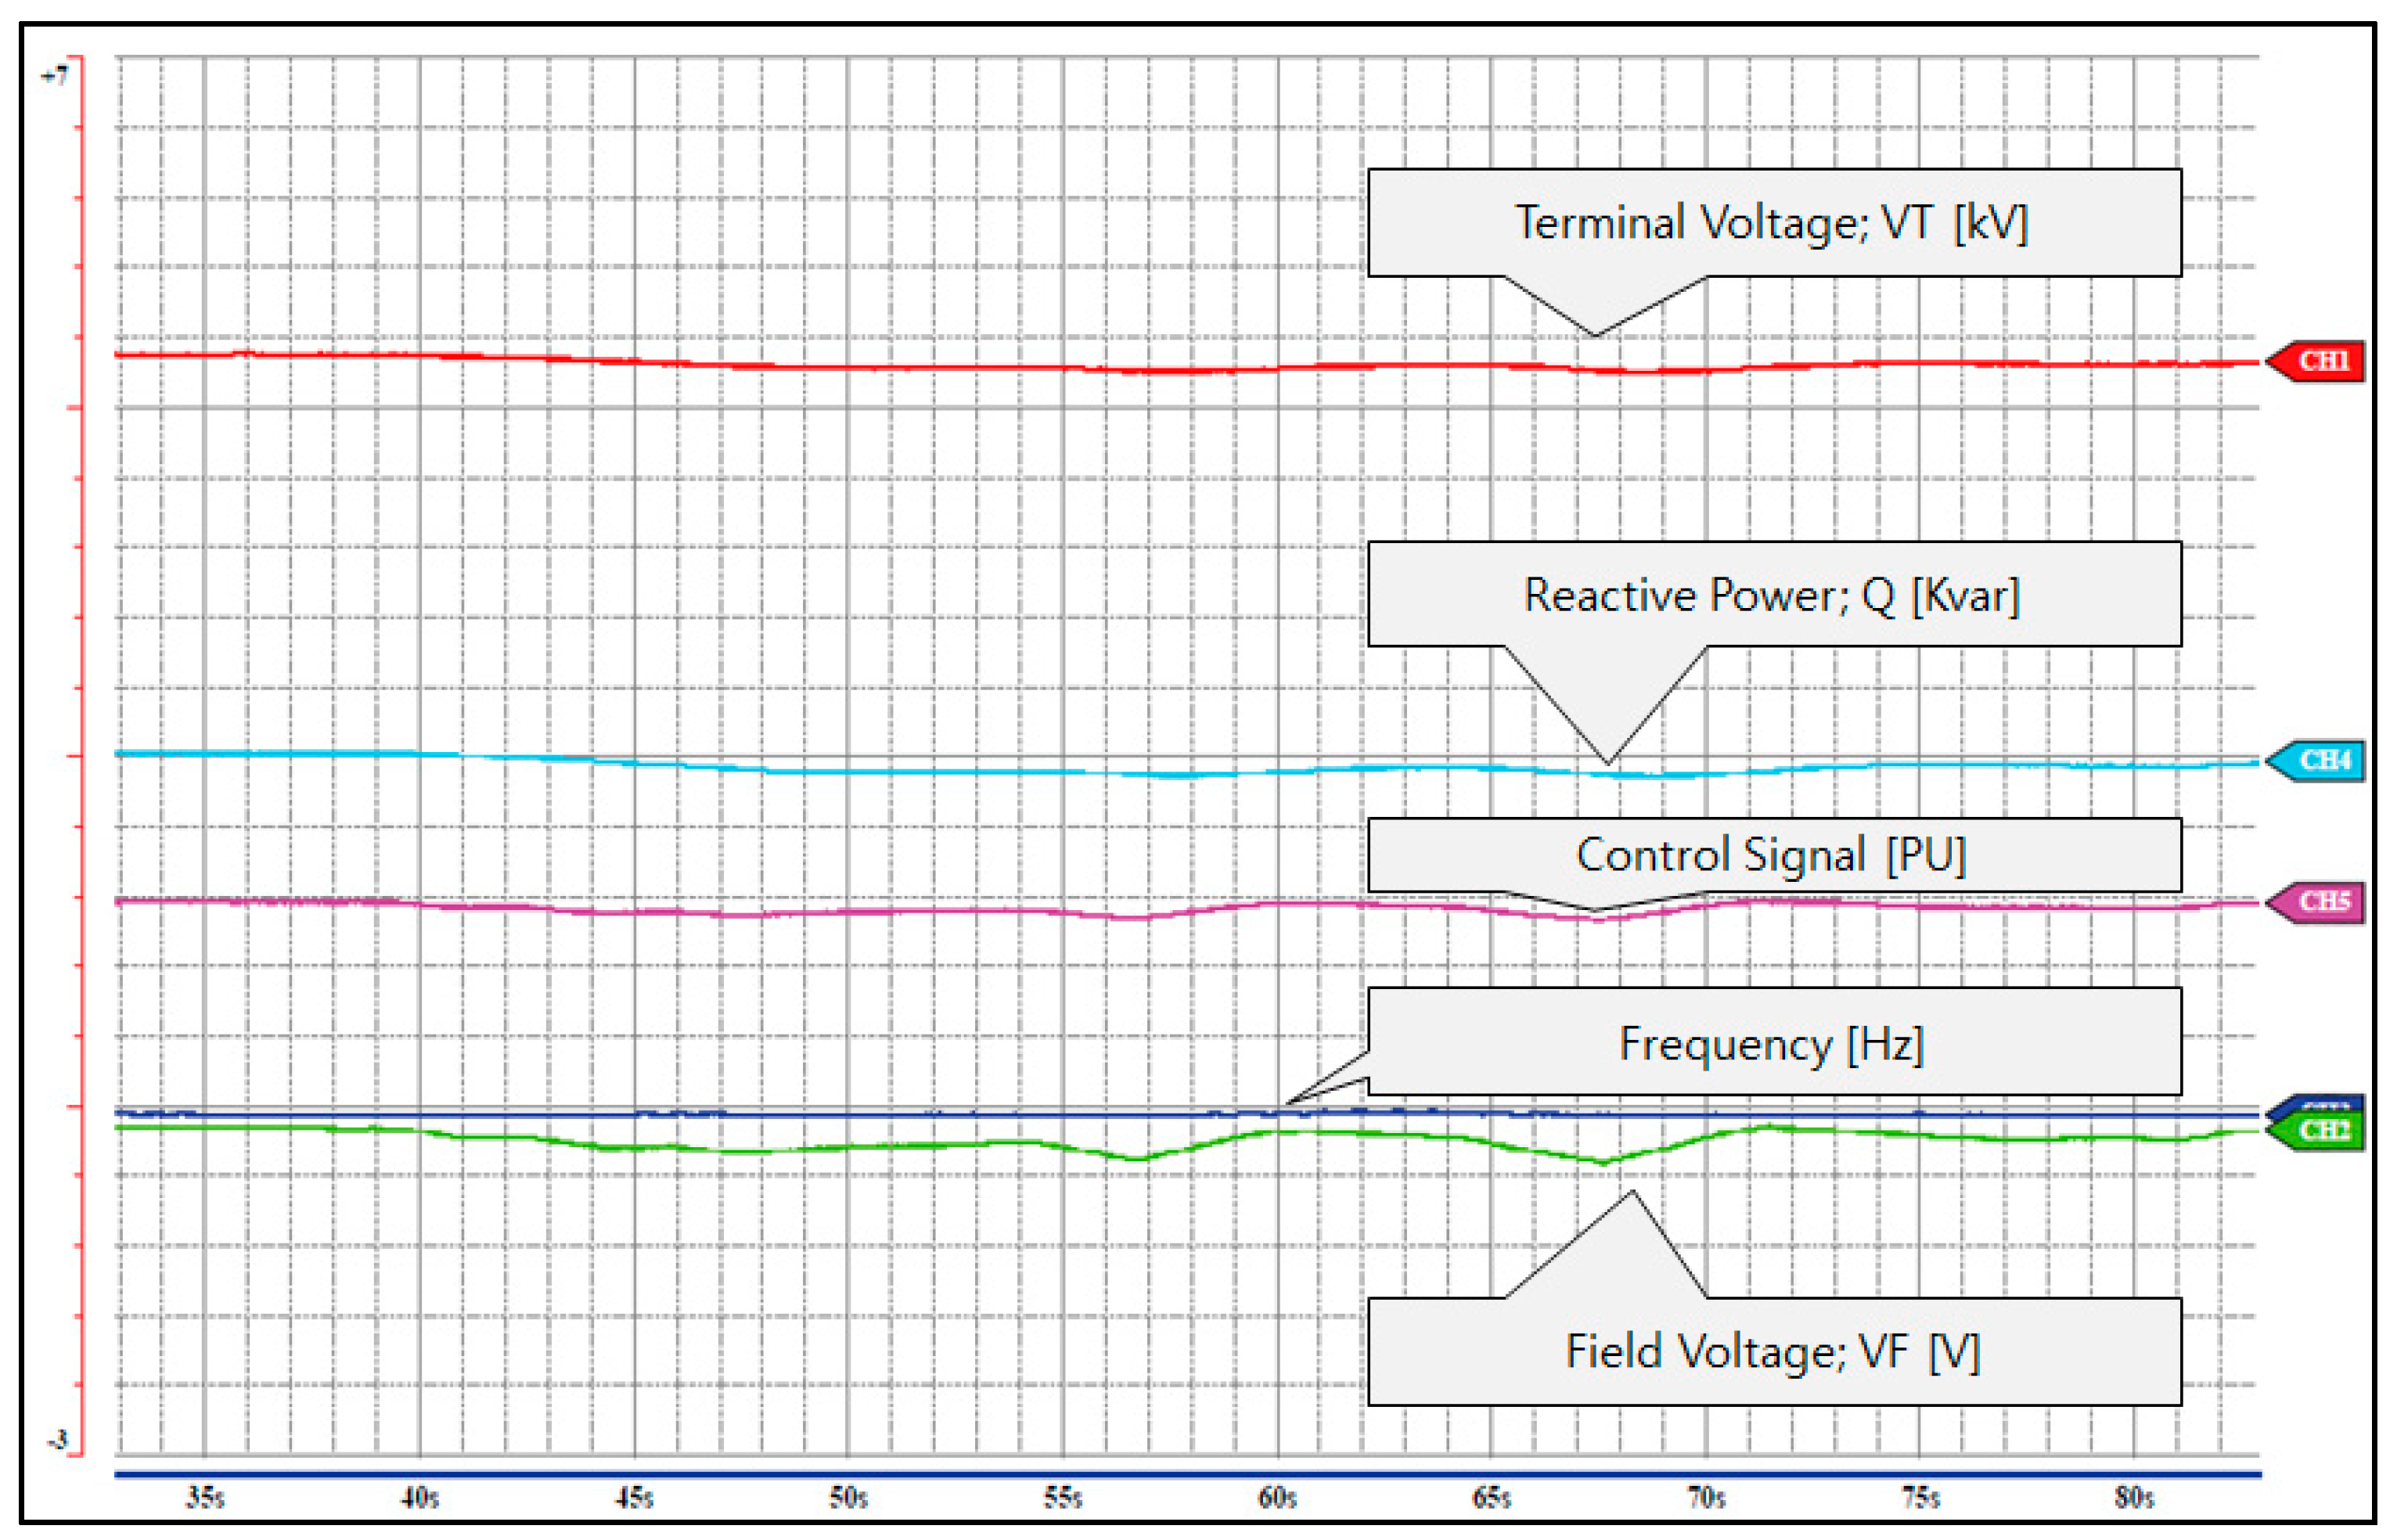
The problem of overheating of the armature core end and the low generator stationariness occurs when the generator operates in a insufficient excitation area on a generator capacity curve. Figure 19 shows the waveform resulting from the under-excitation limit test.
4.5. Over-Flux (V/Hz) Test
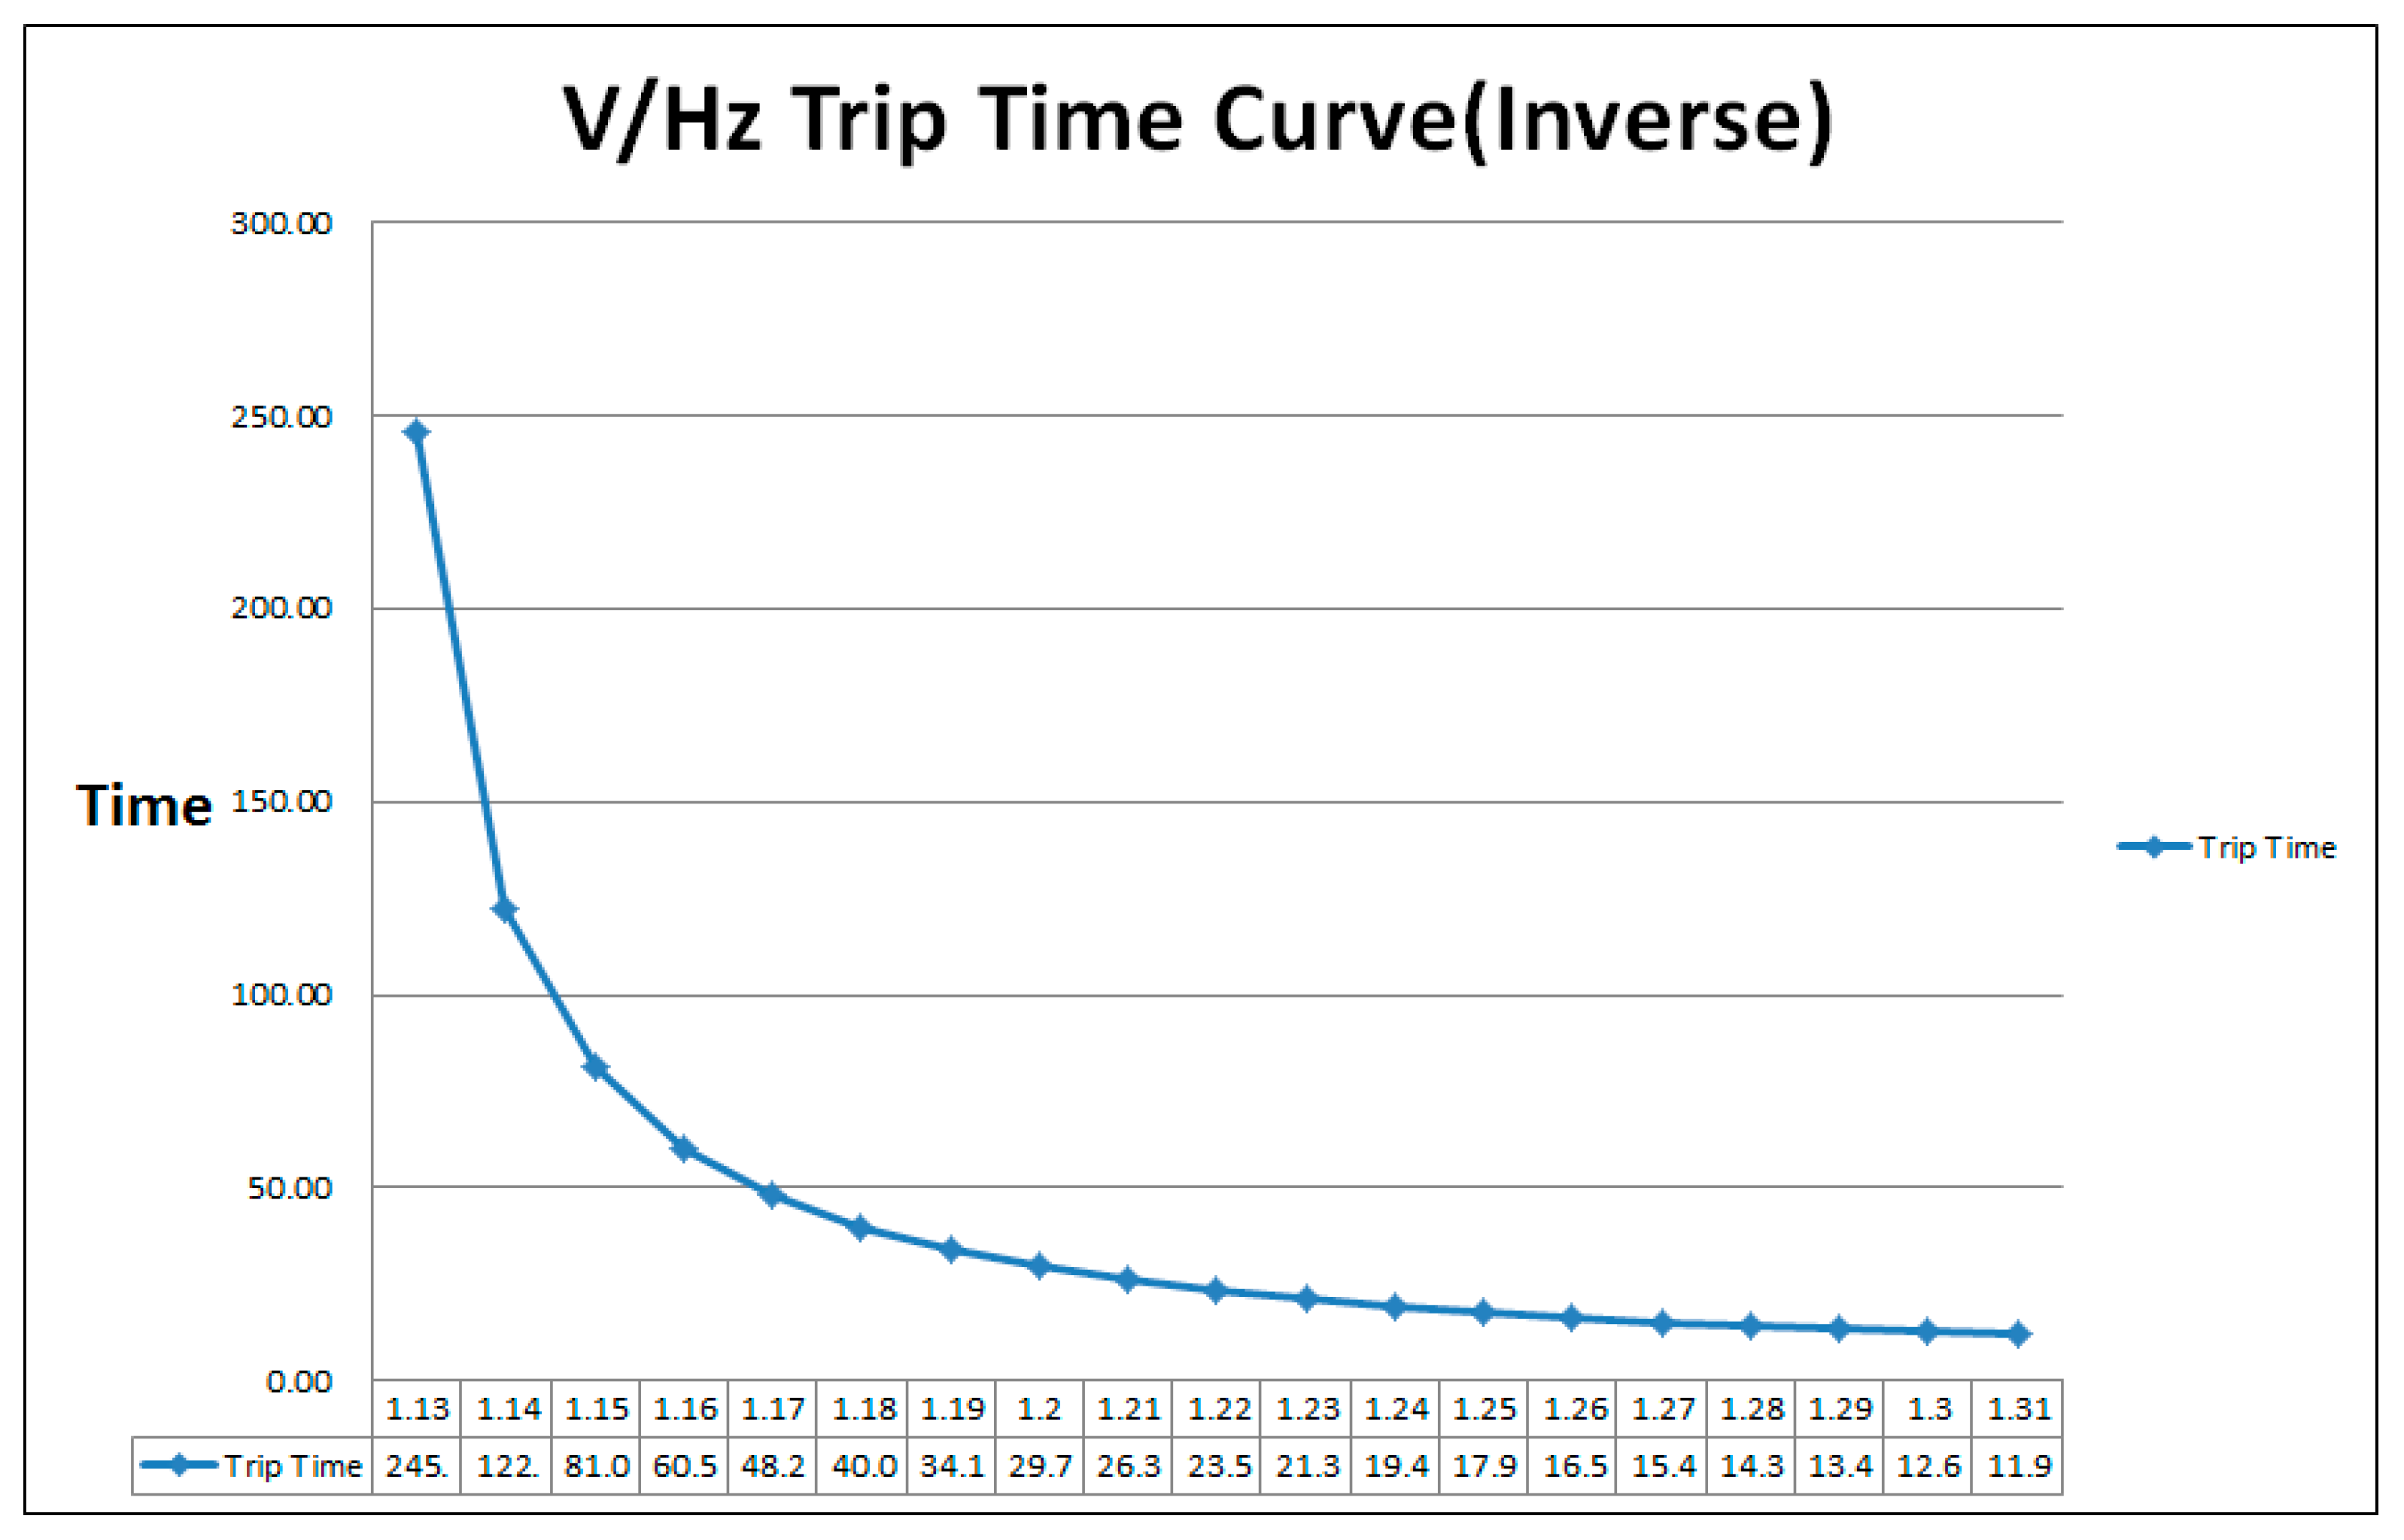
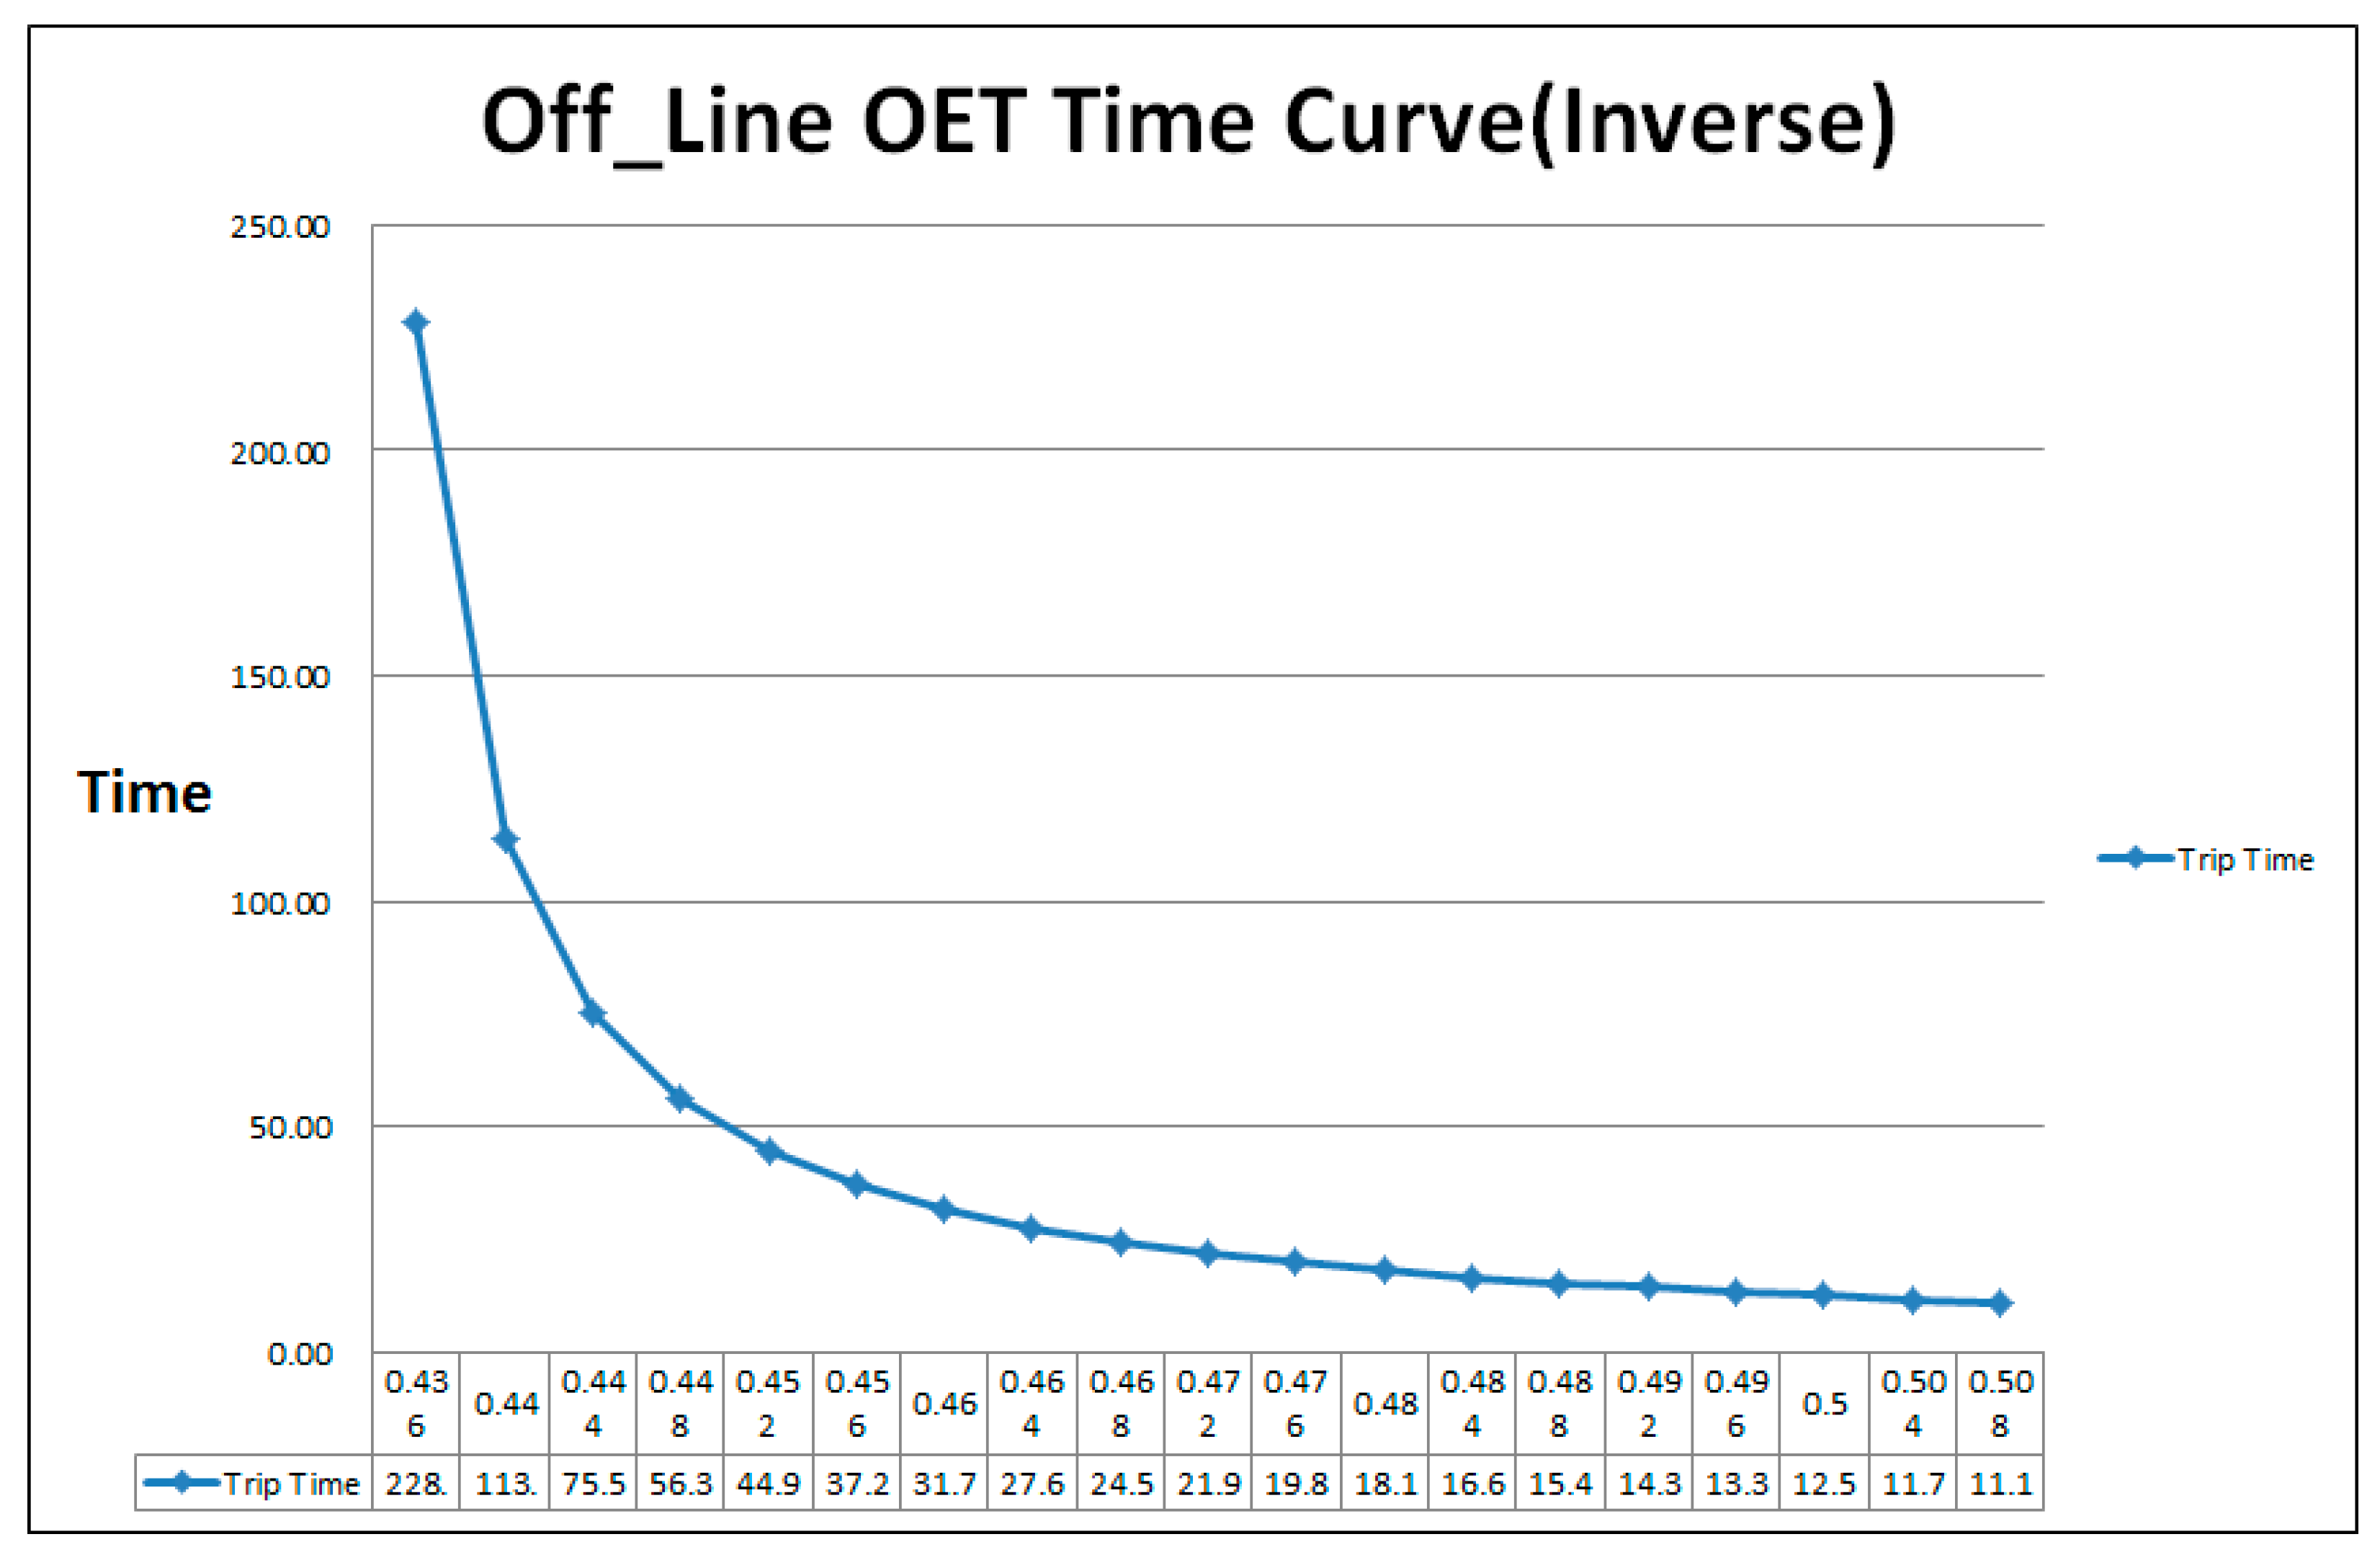
Over-flux protection is also referred to as Voltage-Frequency Ratio (V/Hz Ratio) and is an element of a protection relay to monitor the flux of a transformer connected to the generator and its bus. For the equipment associated with electric power, it is essential to prevent over-magnetic flux being added to the core. If the flux becomes over-flux, leakage will be increase. Additionally, an eddy current will flow at the internal unstacked area. It is necessary to have a function that monitors the volume of internal magnetic flux. Although this function is included in the protection equipment, such a protection relay only has a single protection function like alarm or operation shutdown so that there is no active control function responding to the amount of magnetic flux. Table 4 shows V/Hz set values. Also, Figure 20 shows V/Hz trip time curve.
Thus, there is a control function in the excitation system for performing an active control prior to sounding an alarm or stopping the operation.
4.6. Over-Excitation Protection Test
The over-excitation protection function is implemented with the protection relays that operate individually under the off-line and on-line situations. The main purpose of this function is to protect the generator(s) from over-excitation and its protection characteristics have been designed according to the values specified in the ANSI C50.13 Rotor winding short-time thermal requirements. Table 5 shows set values for over-excitation.
Figure 21 shows the response time of an excitation system according to field coil currents. Set values were tested for their validity.
5. Cost-Effective Redundant Digital Excitation Control System and Test Bed Experiment at Kanudi Power Plant in Papua New Guinea
5.1. Test Bed Replacing Protective Relay at Kanudi Power Plant and Validation
As power systems in this era require a high standard of stability and reliability, this research focuses on the issues pertaining to the replacement of the protective relays at Kanudi Power Plant in Papua New Guinea and the effectiveness of its performance. 27 relays of No. 1 power generator unit failed to function properly due to system disturbance and this incident led to continuous failures in the connecting sections of the power system such that the replacement of relays was inevitable.
The voltage protection systems in most modern power plants are designed to operate normally even when the operating voltage drops to 95% of the standard voltage to prevent the power generator from overheating due to an instantaneous or unexpected voltage drop.
Even though the frequency protection function immediately starts its operation if a low-frequency state operation of power generator has been detected, some negative effects on the power turbine could be expected if the situation is not contained quickly. When the power generator ceases to operate because of some power facility or line failure, the quality of electric power becomes unstable due to the inadequate frequency level and such incidents affect the entire power system seriously, sometimes causing a total power plant failure.
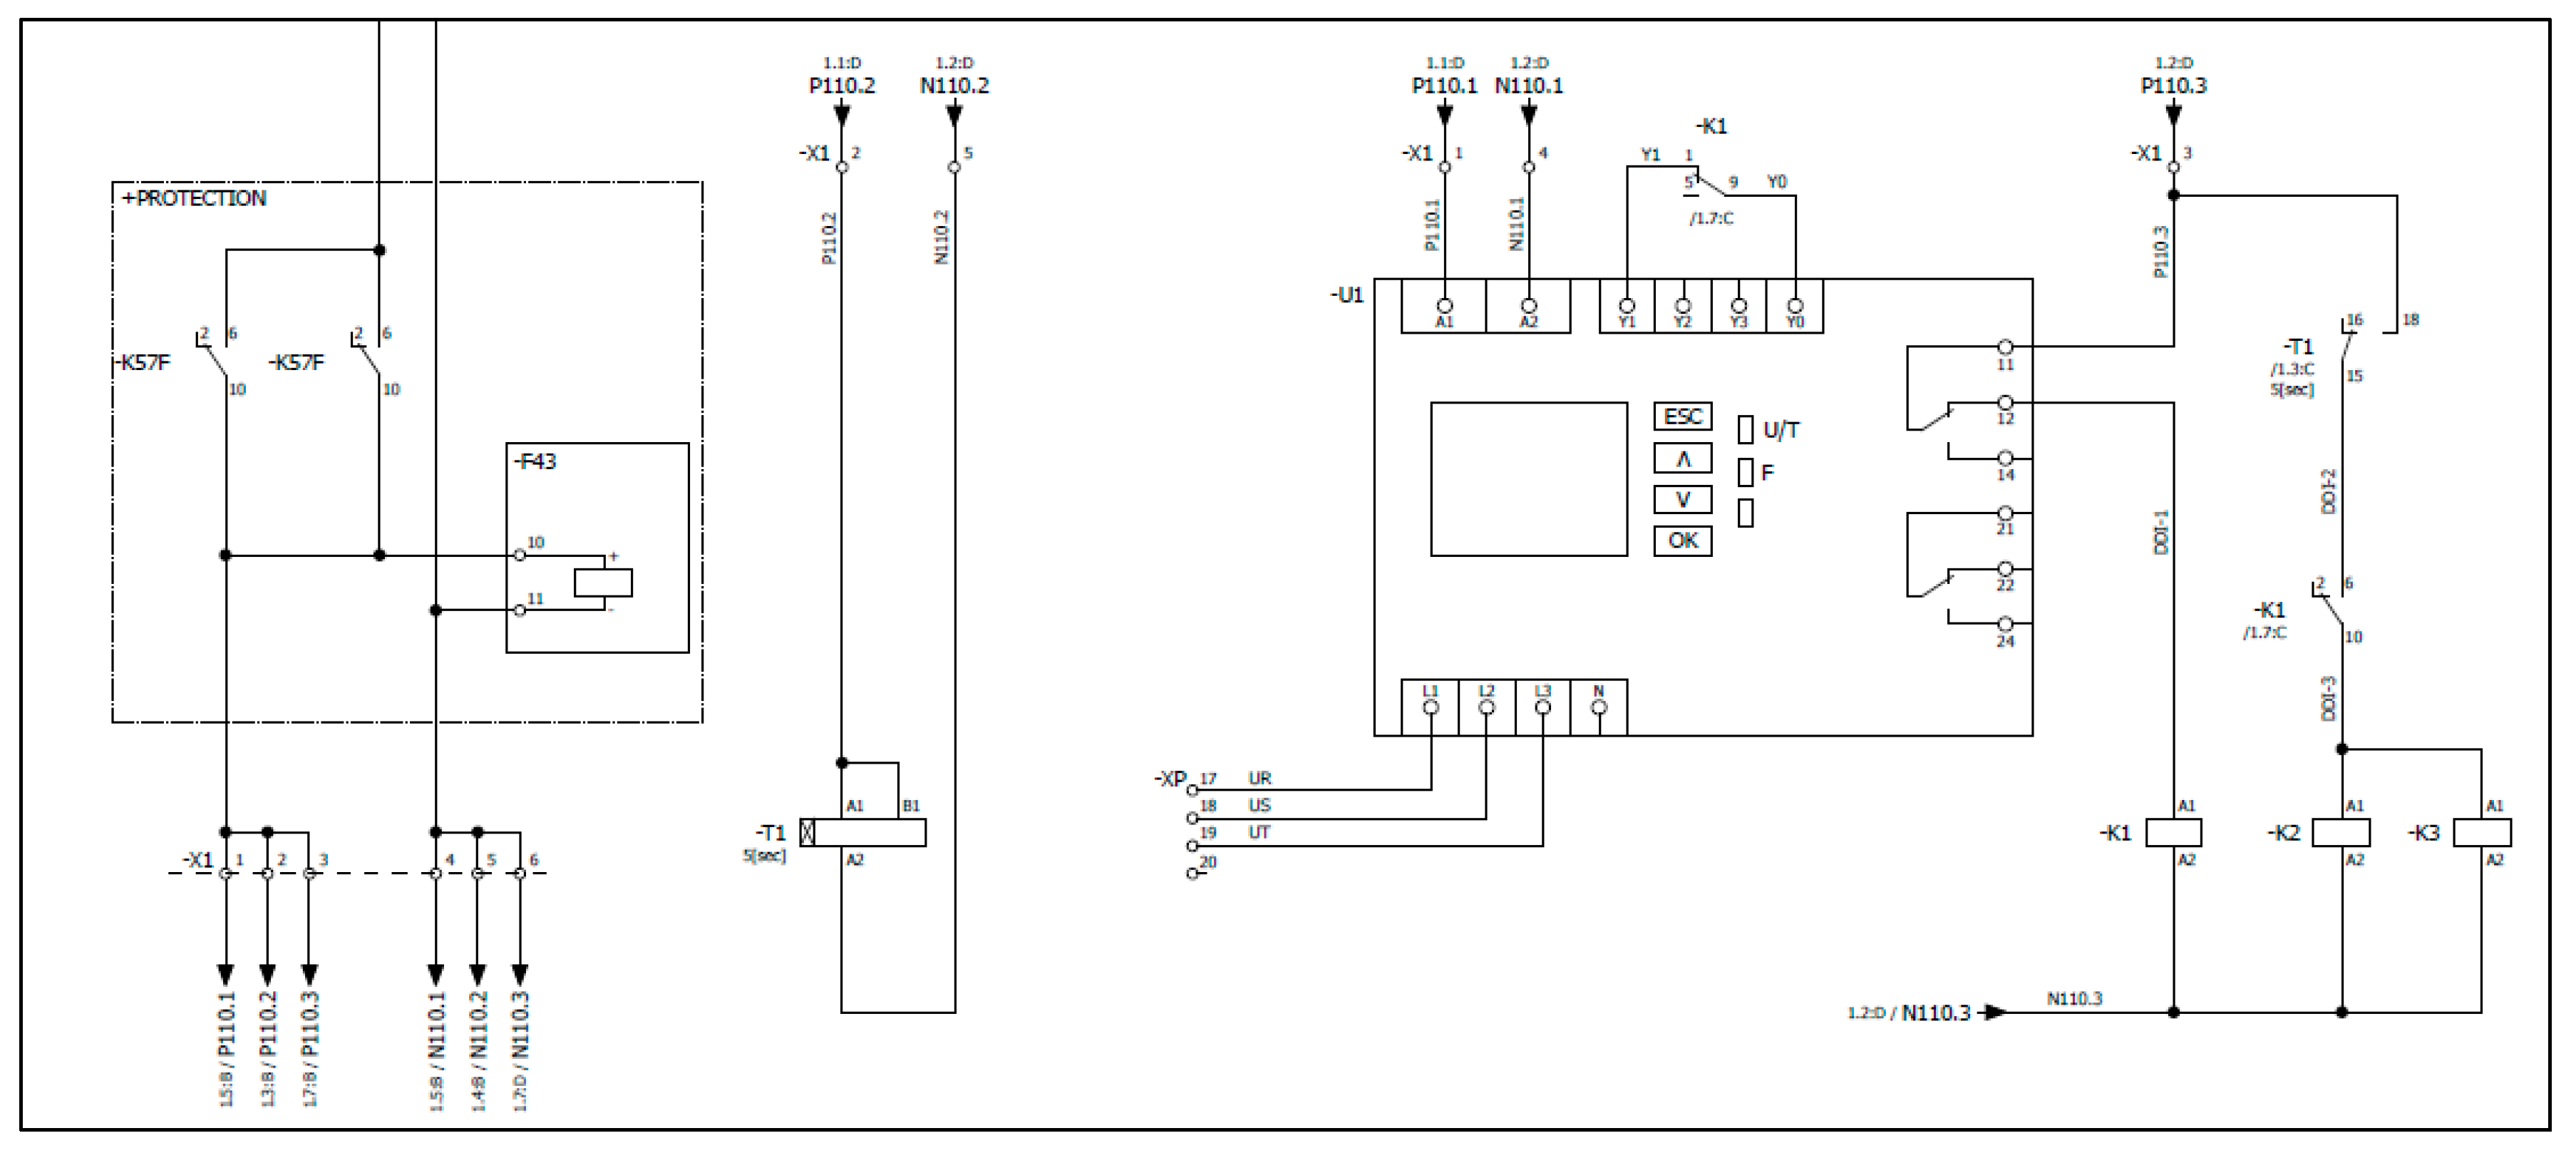
The power relay circuit installed at this power plant is shown in Figure 22 and the relay works based on the signals transmitted from the contact breaker. The generator voltage is detected by the breaker and it is compared with both under-voltage and under-frequency limits set in advance. Should one or both exceed the tolerance level, the KS relay will immediately commence its operation to cease the operation to prevent further damage.
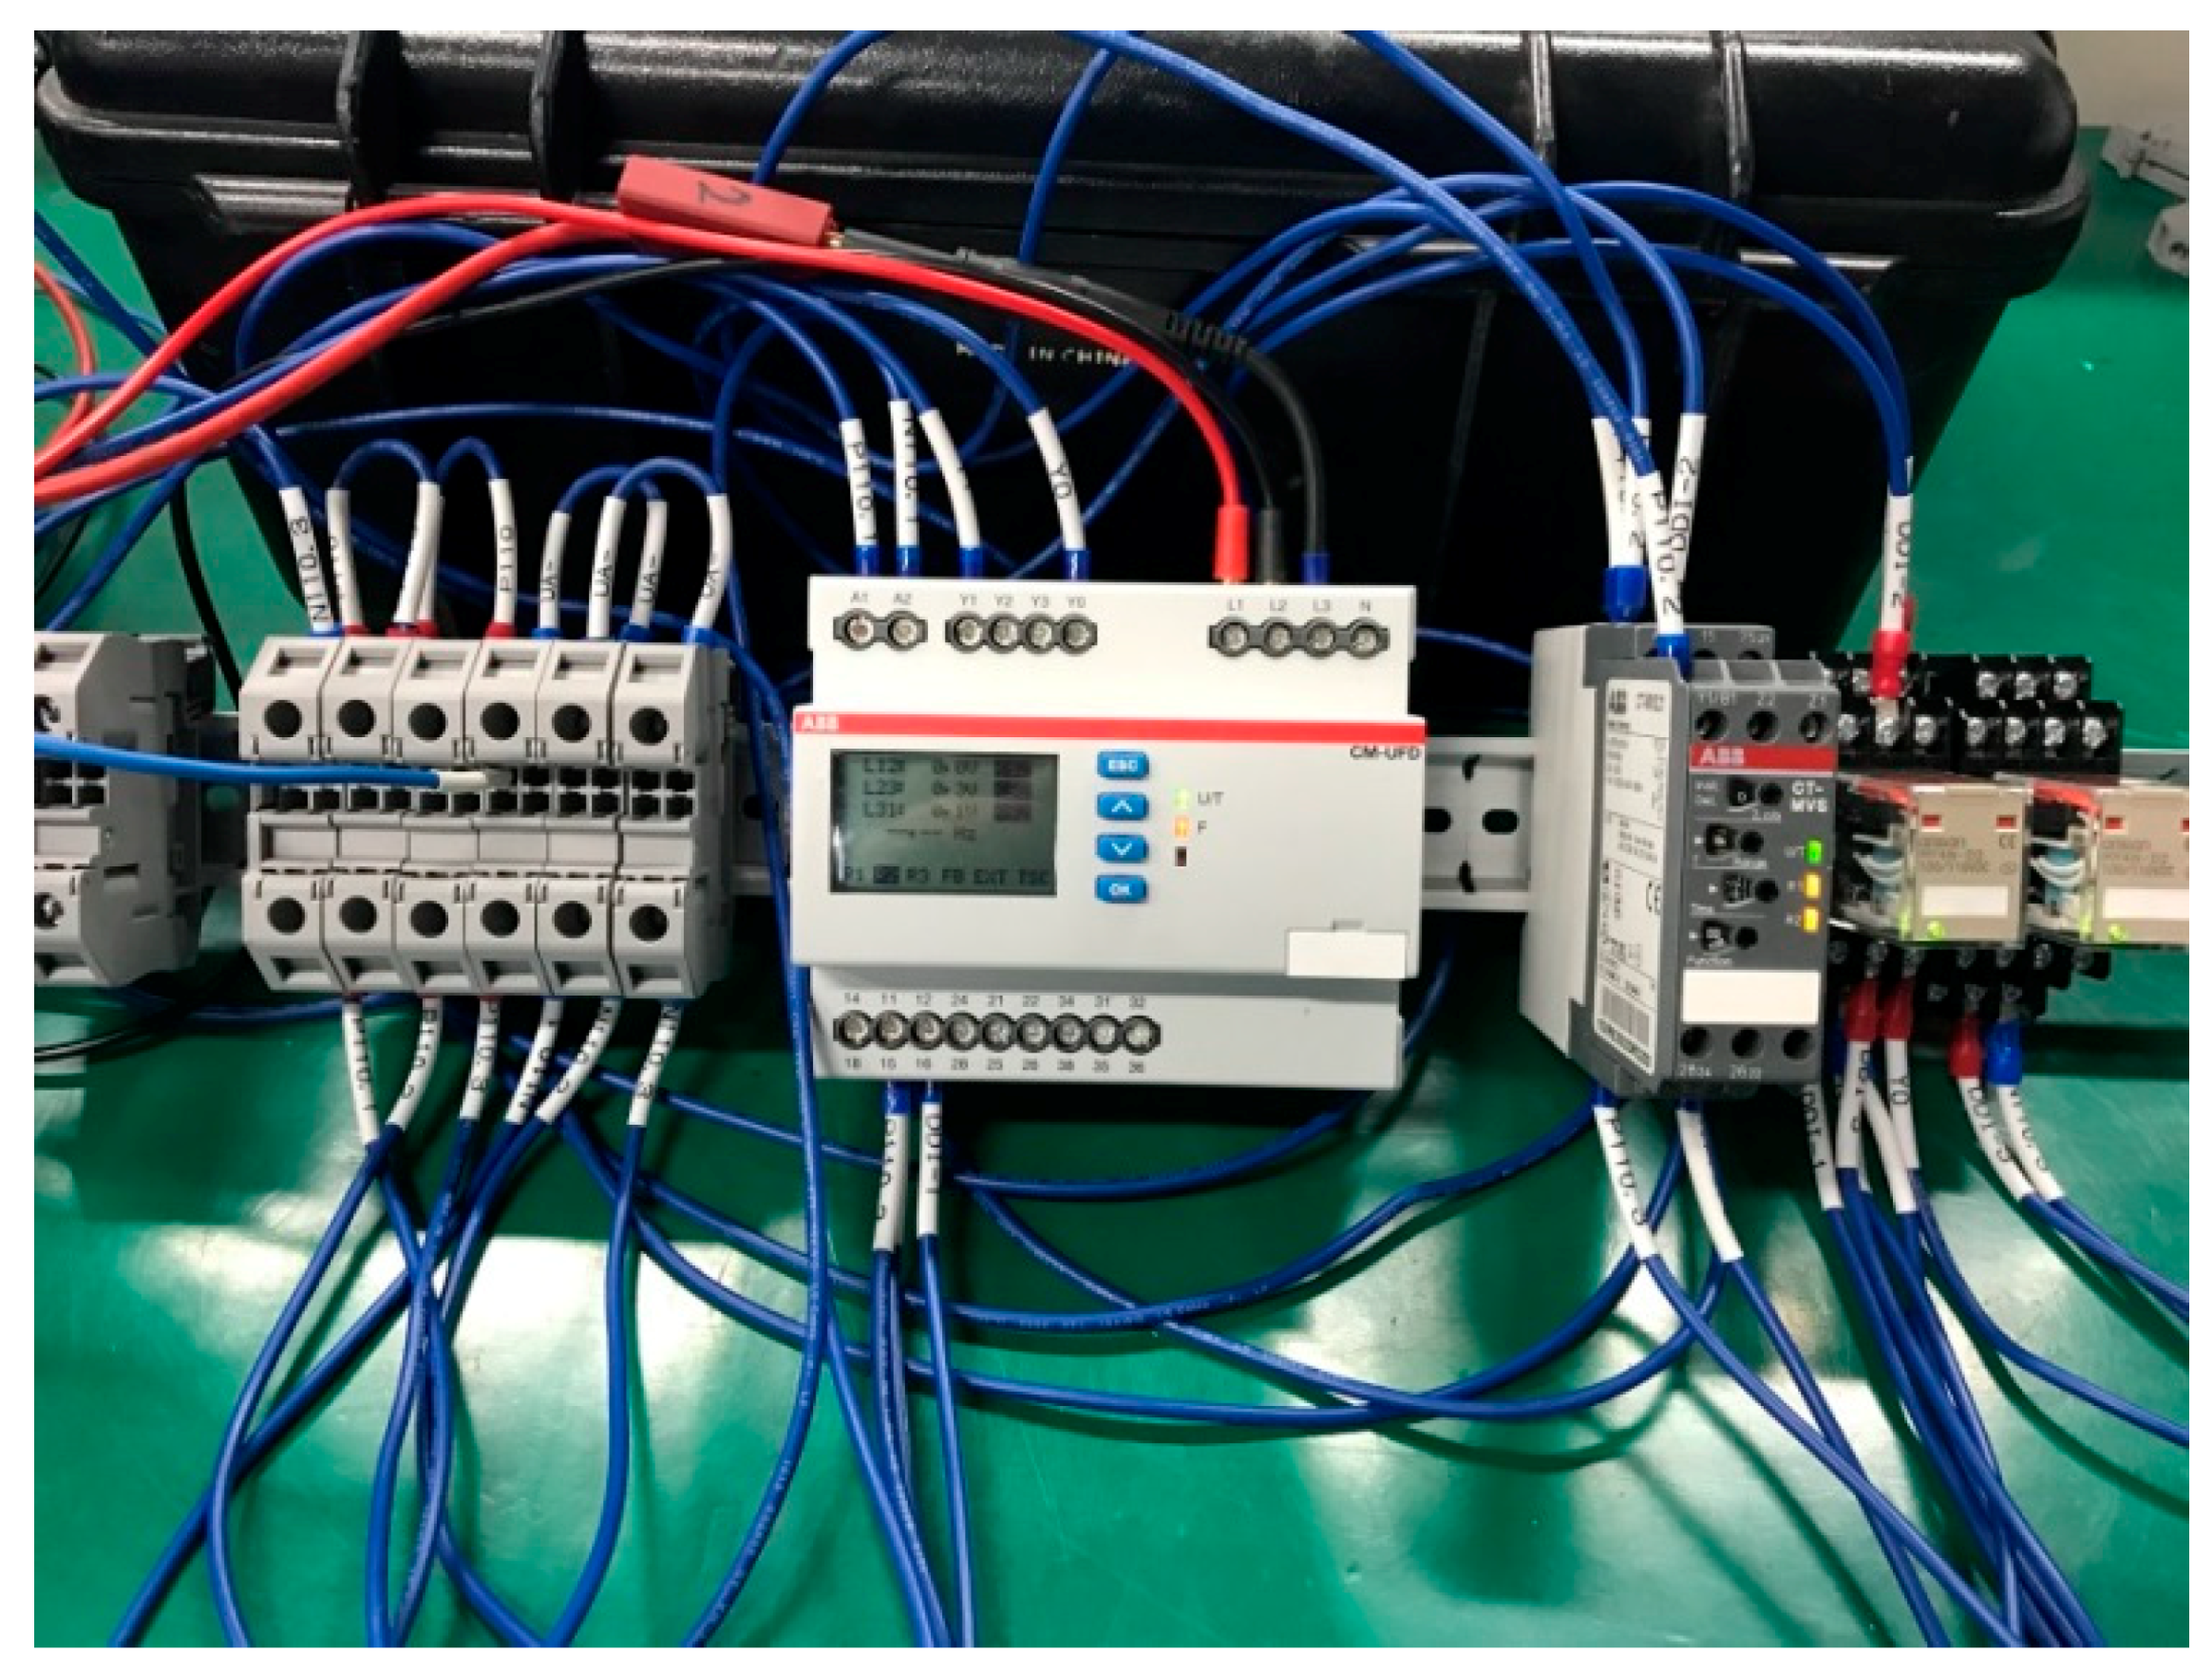
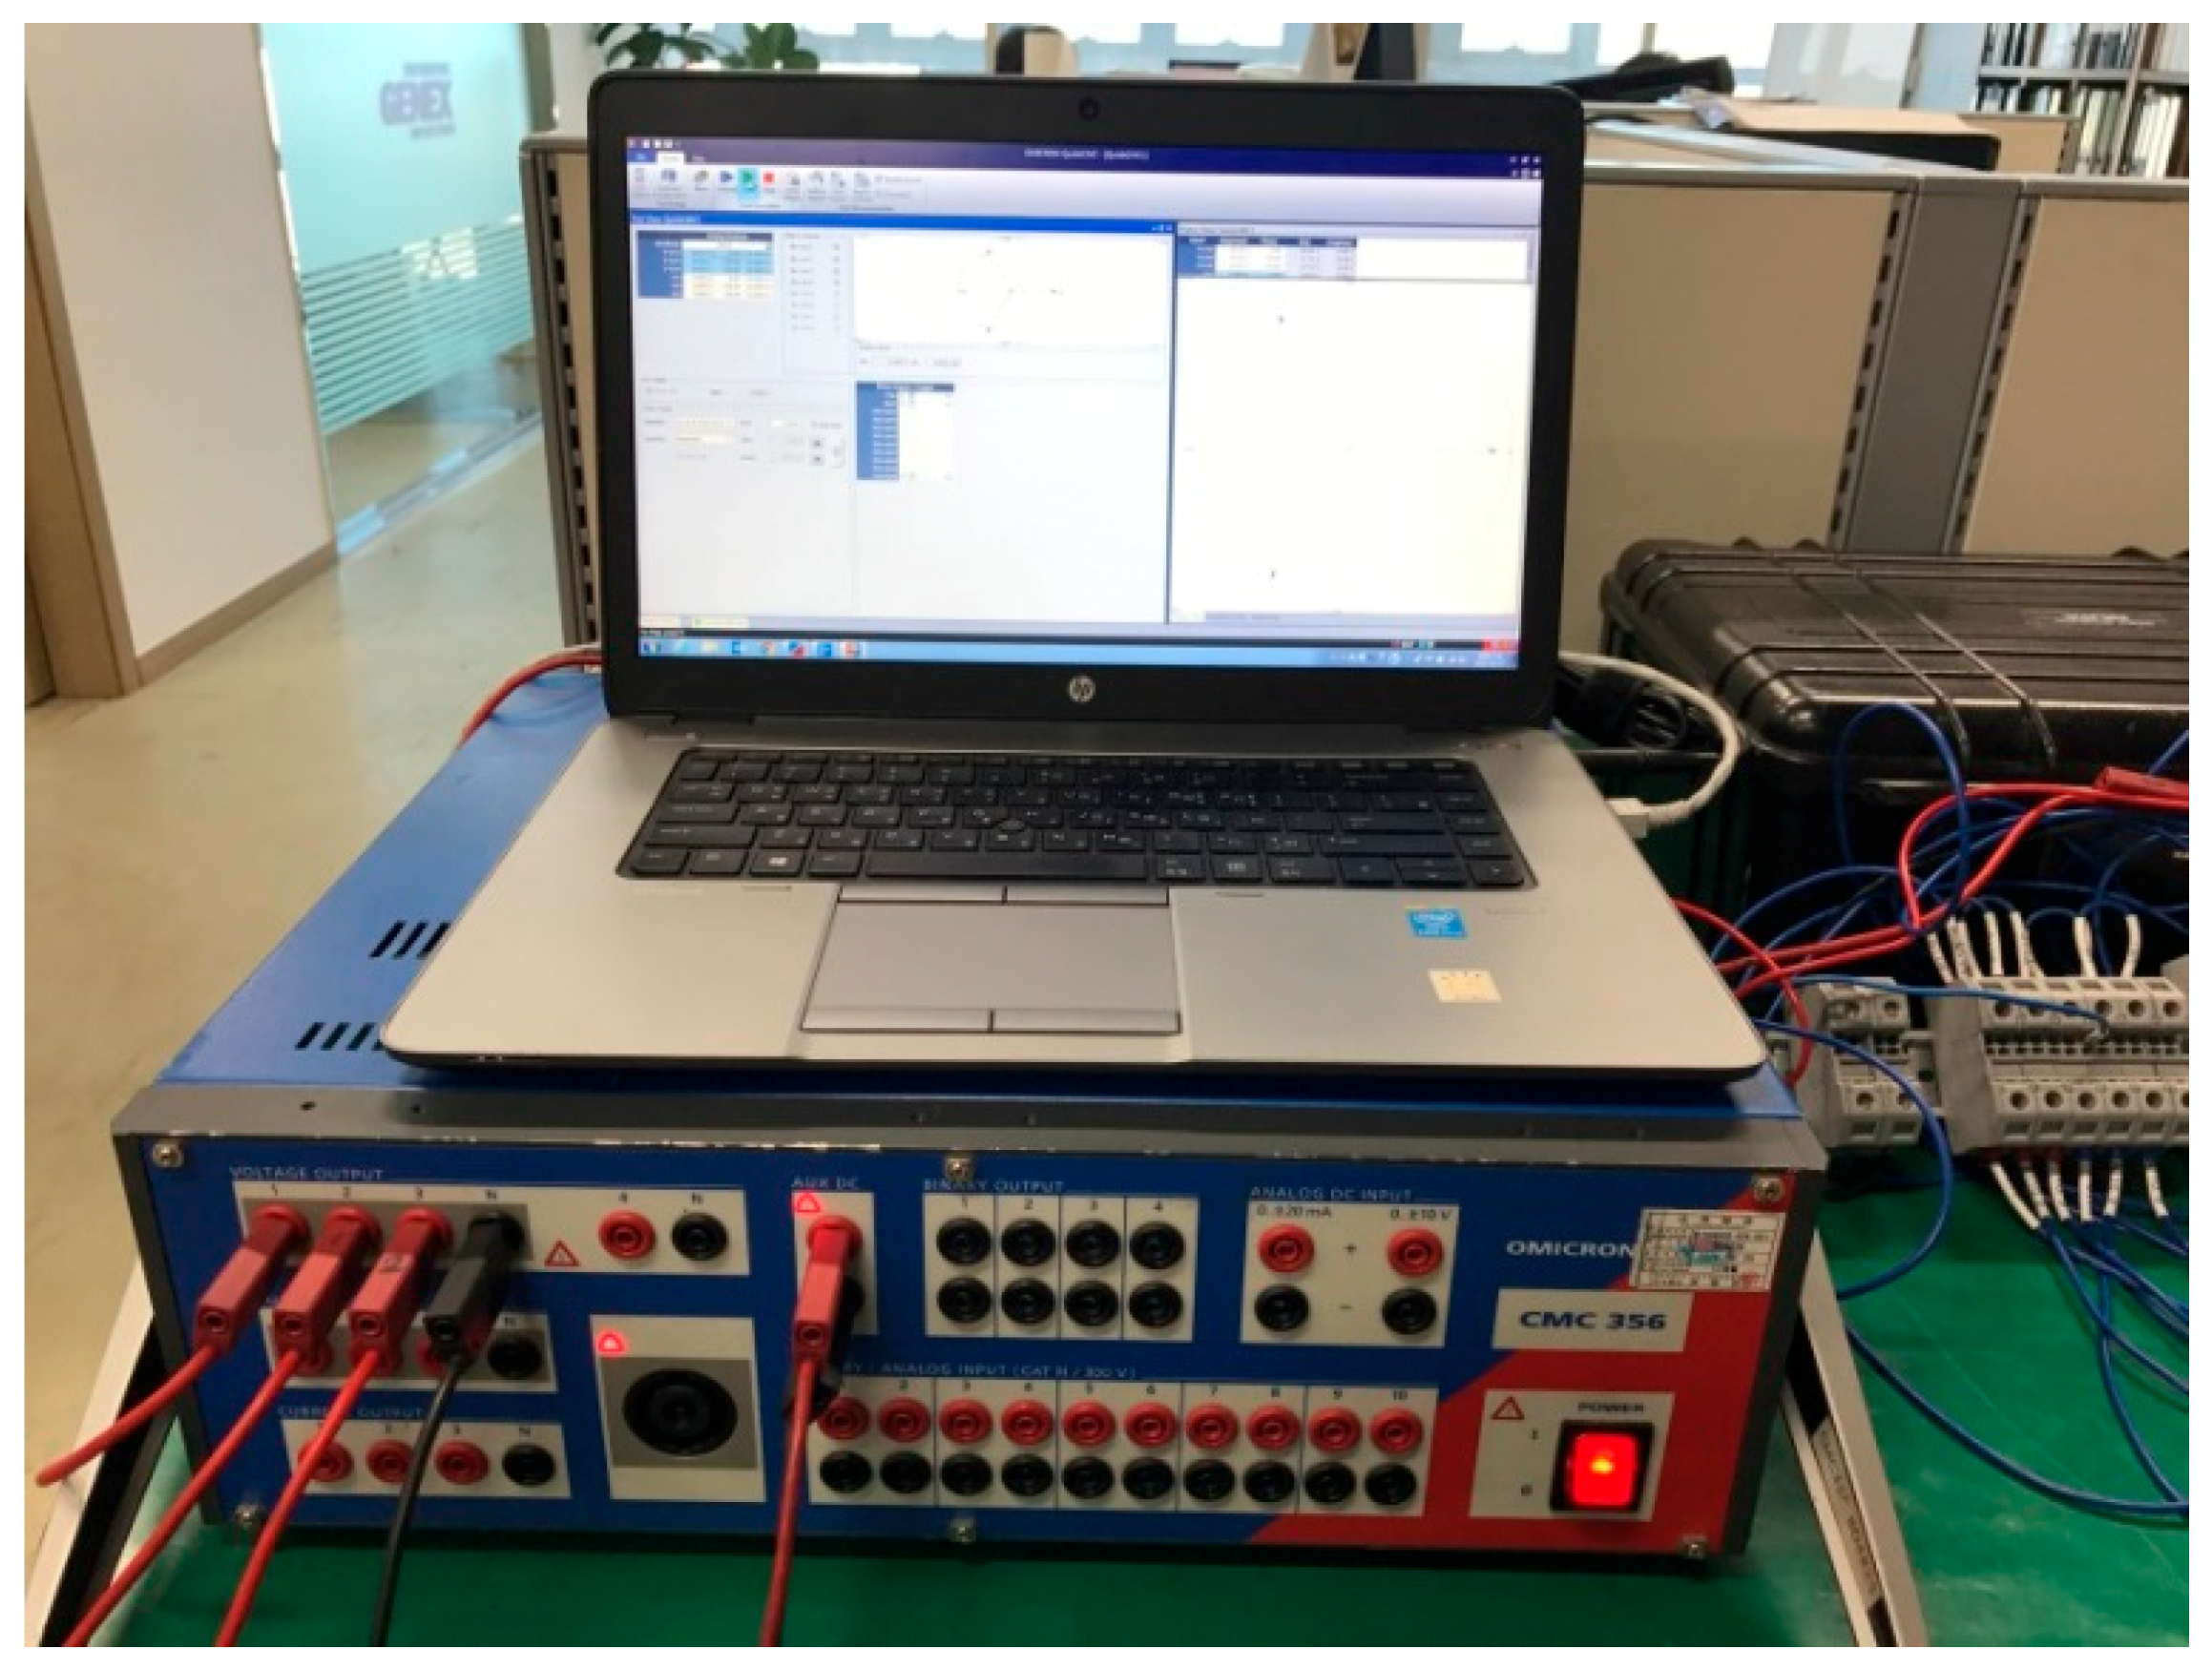
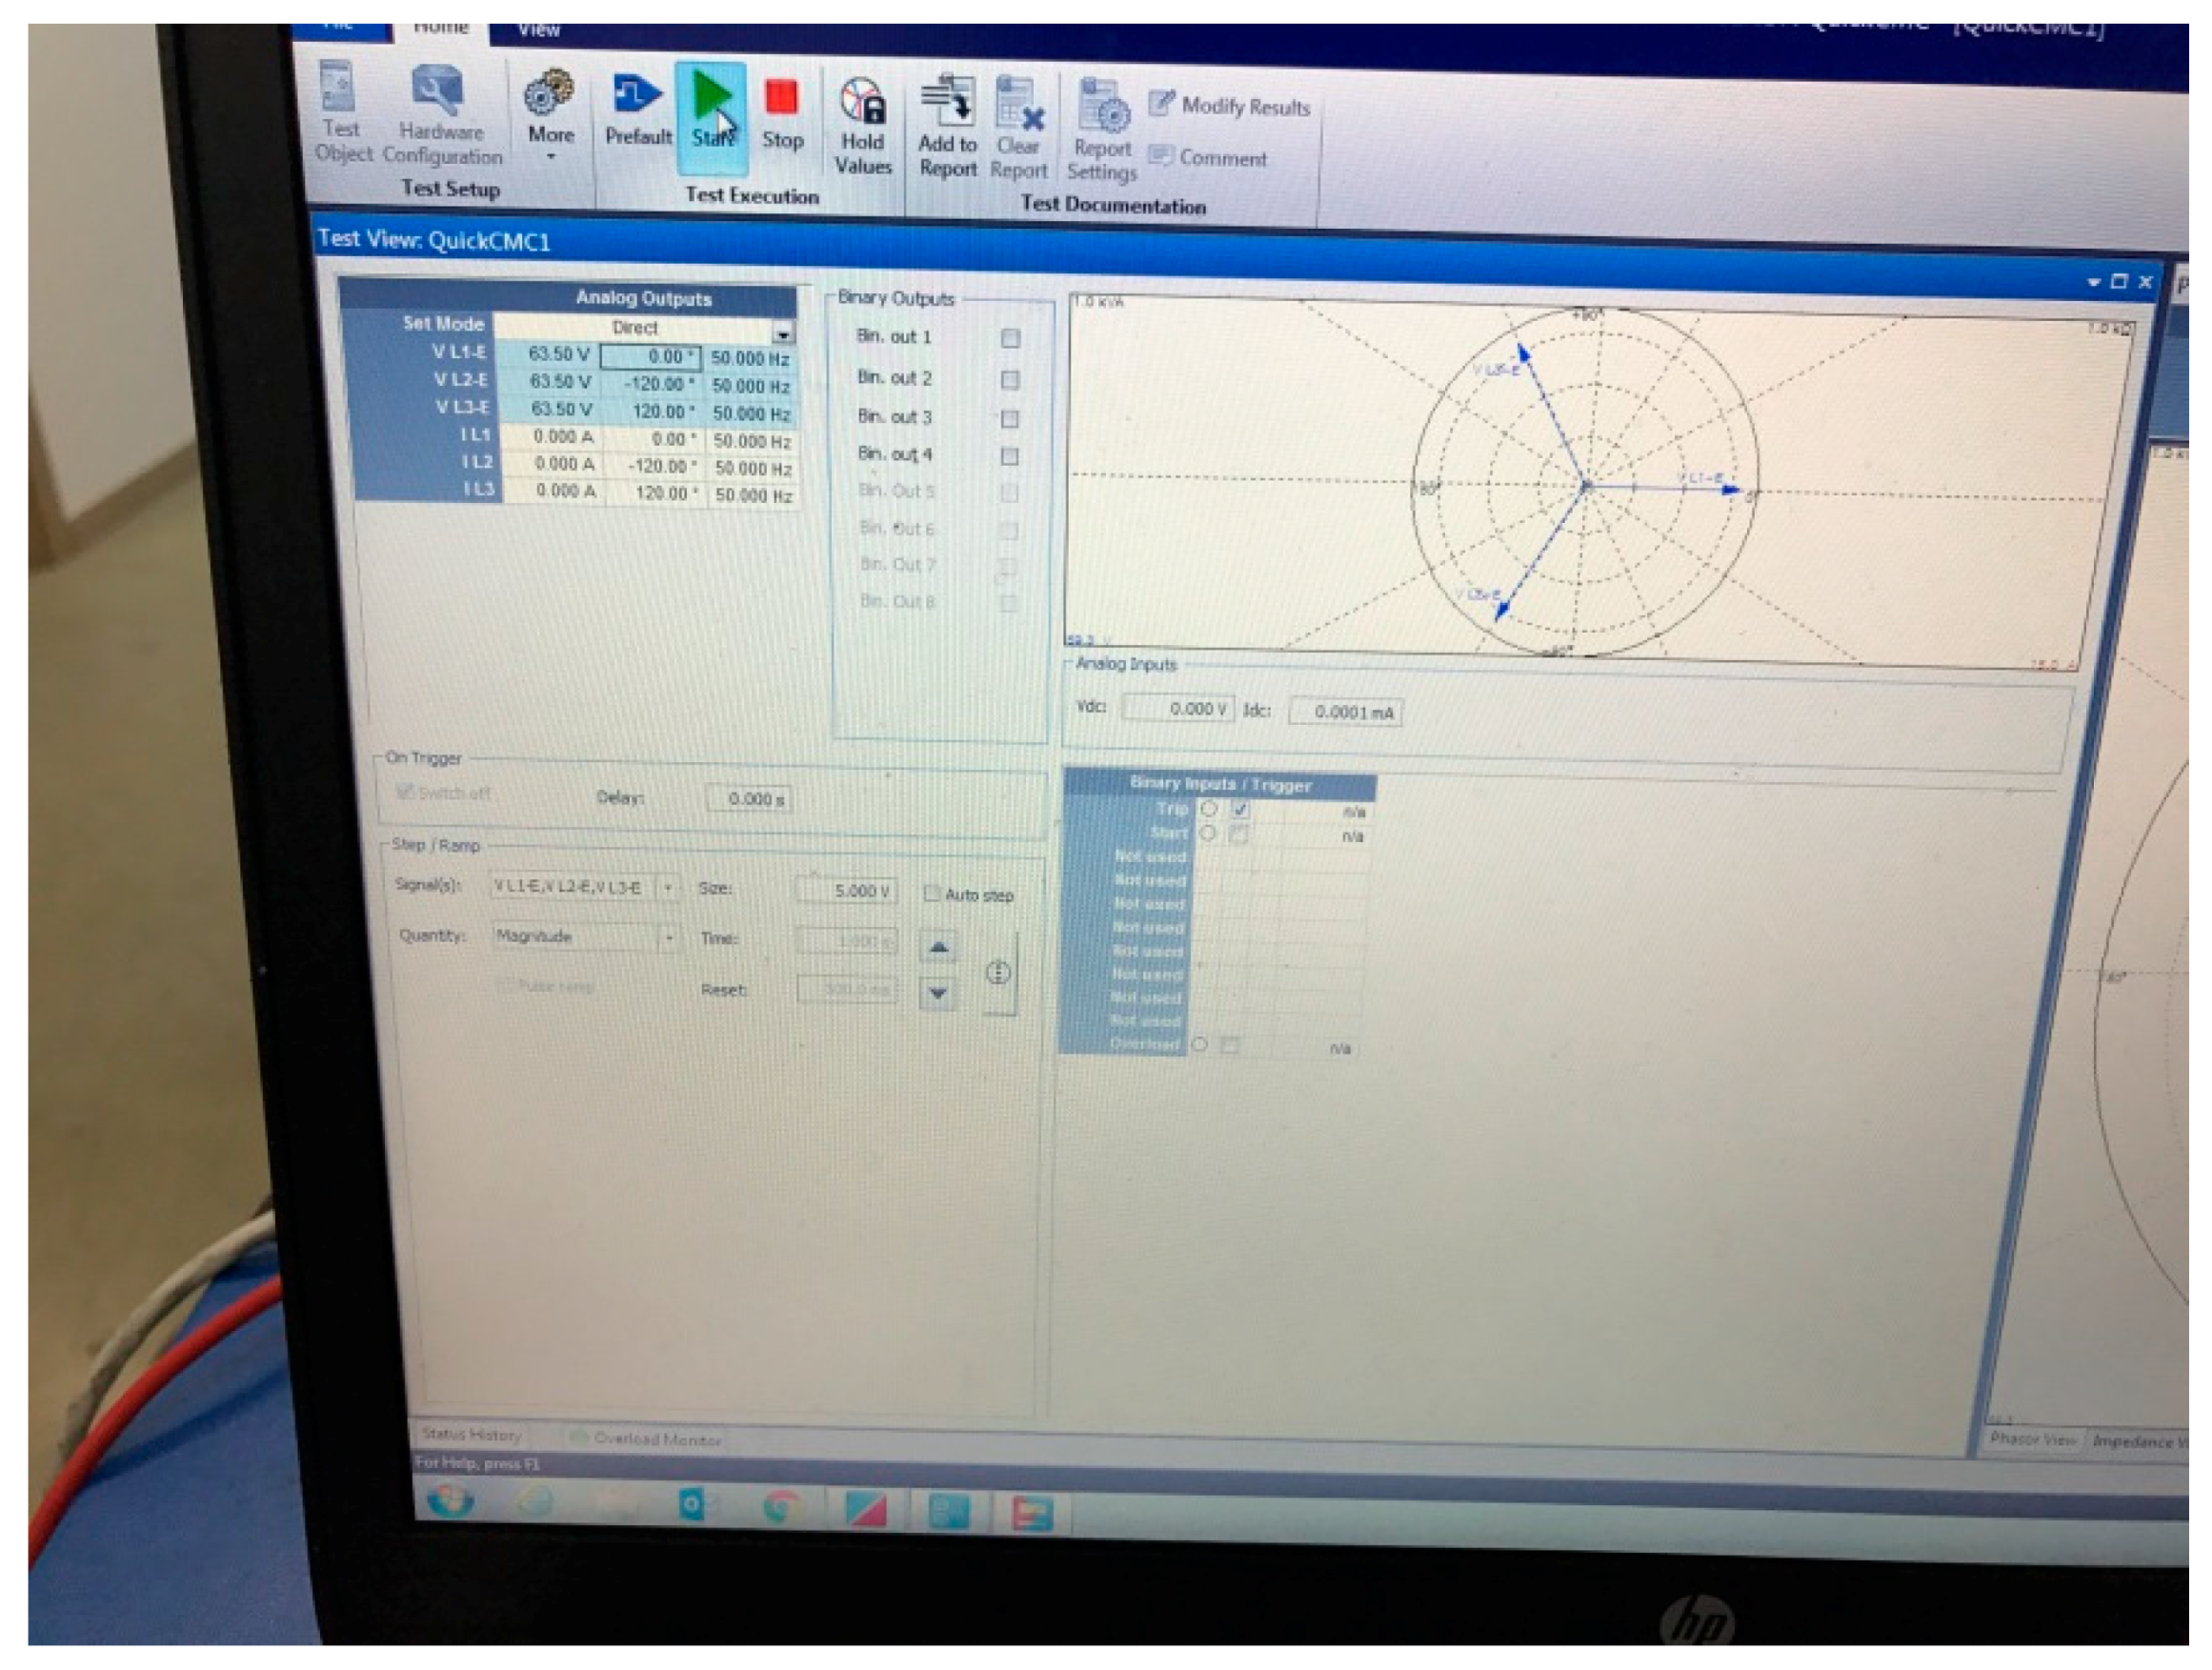
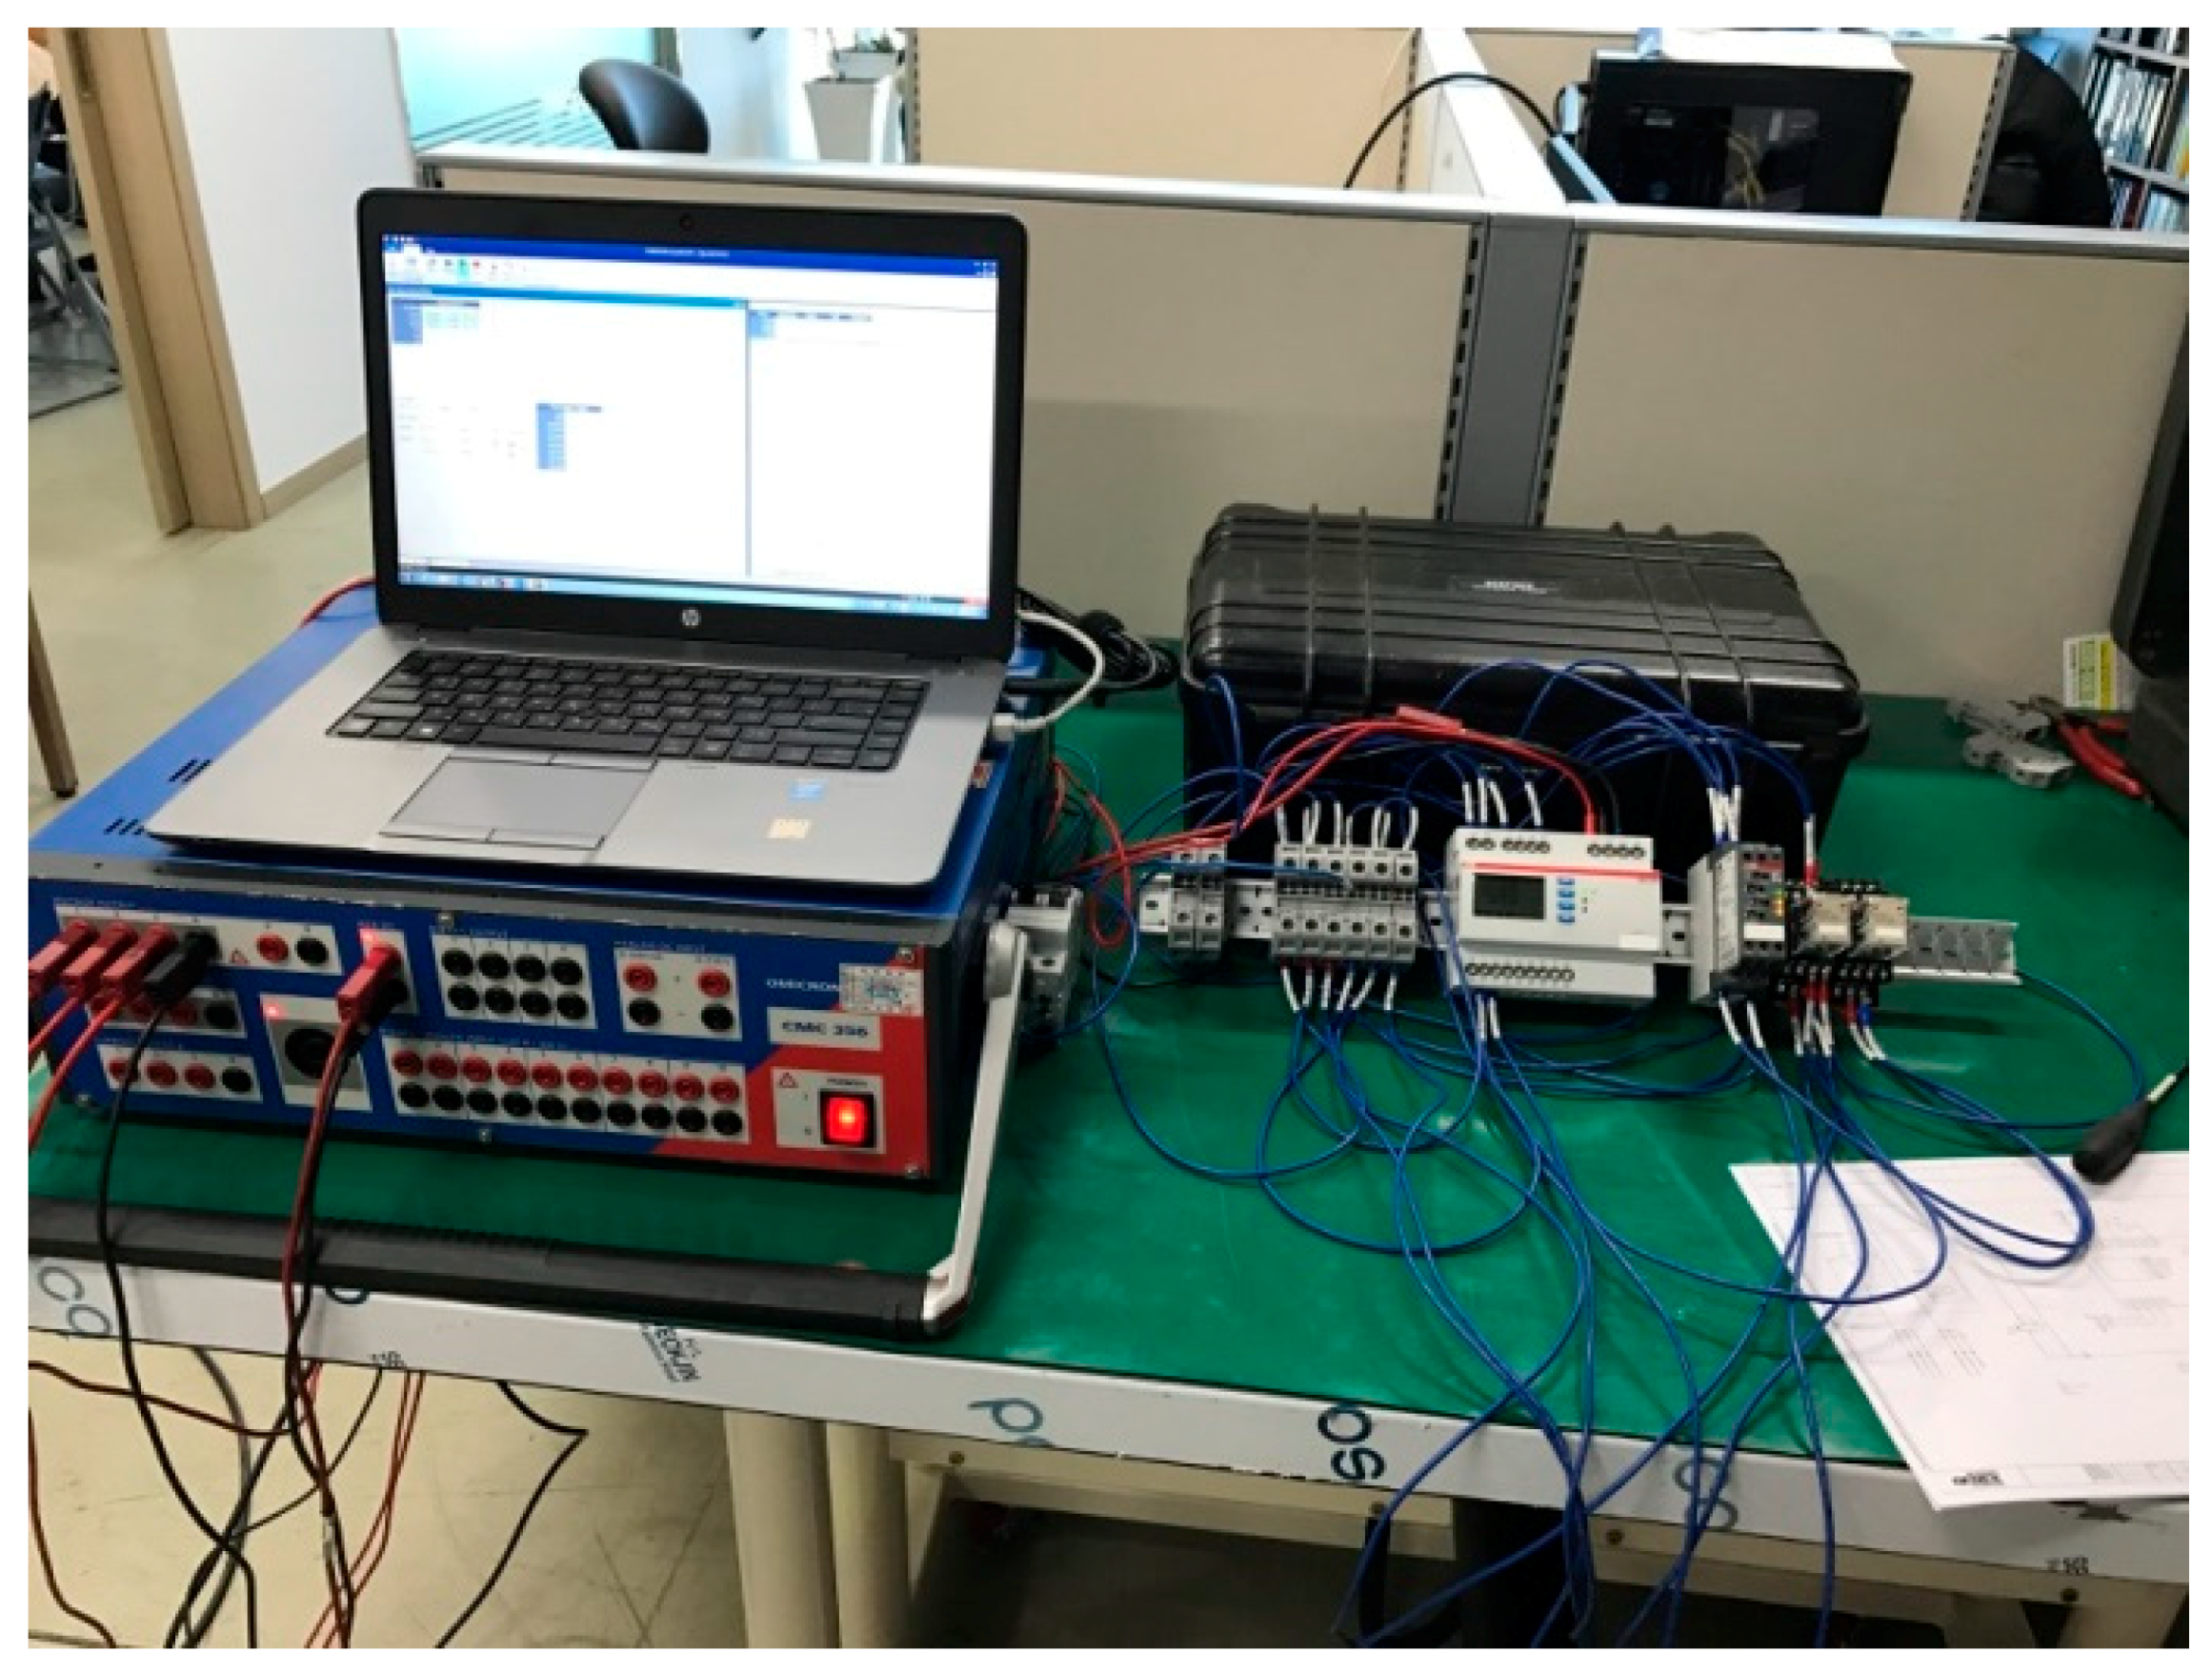
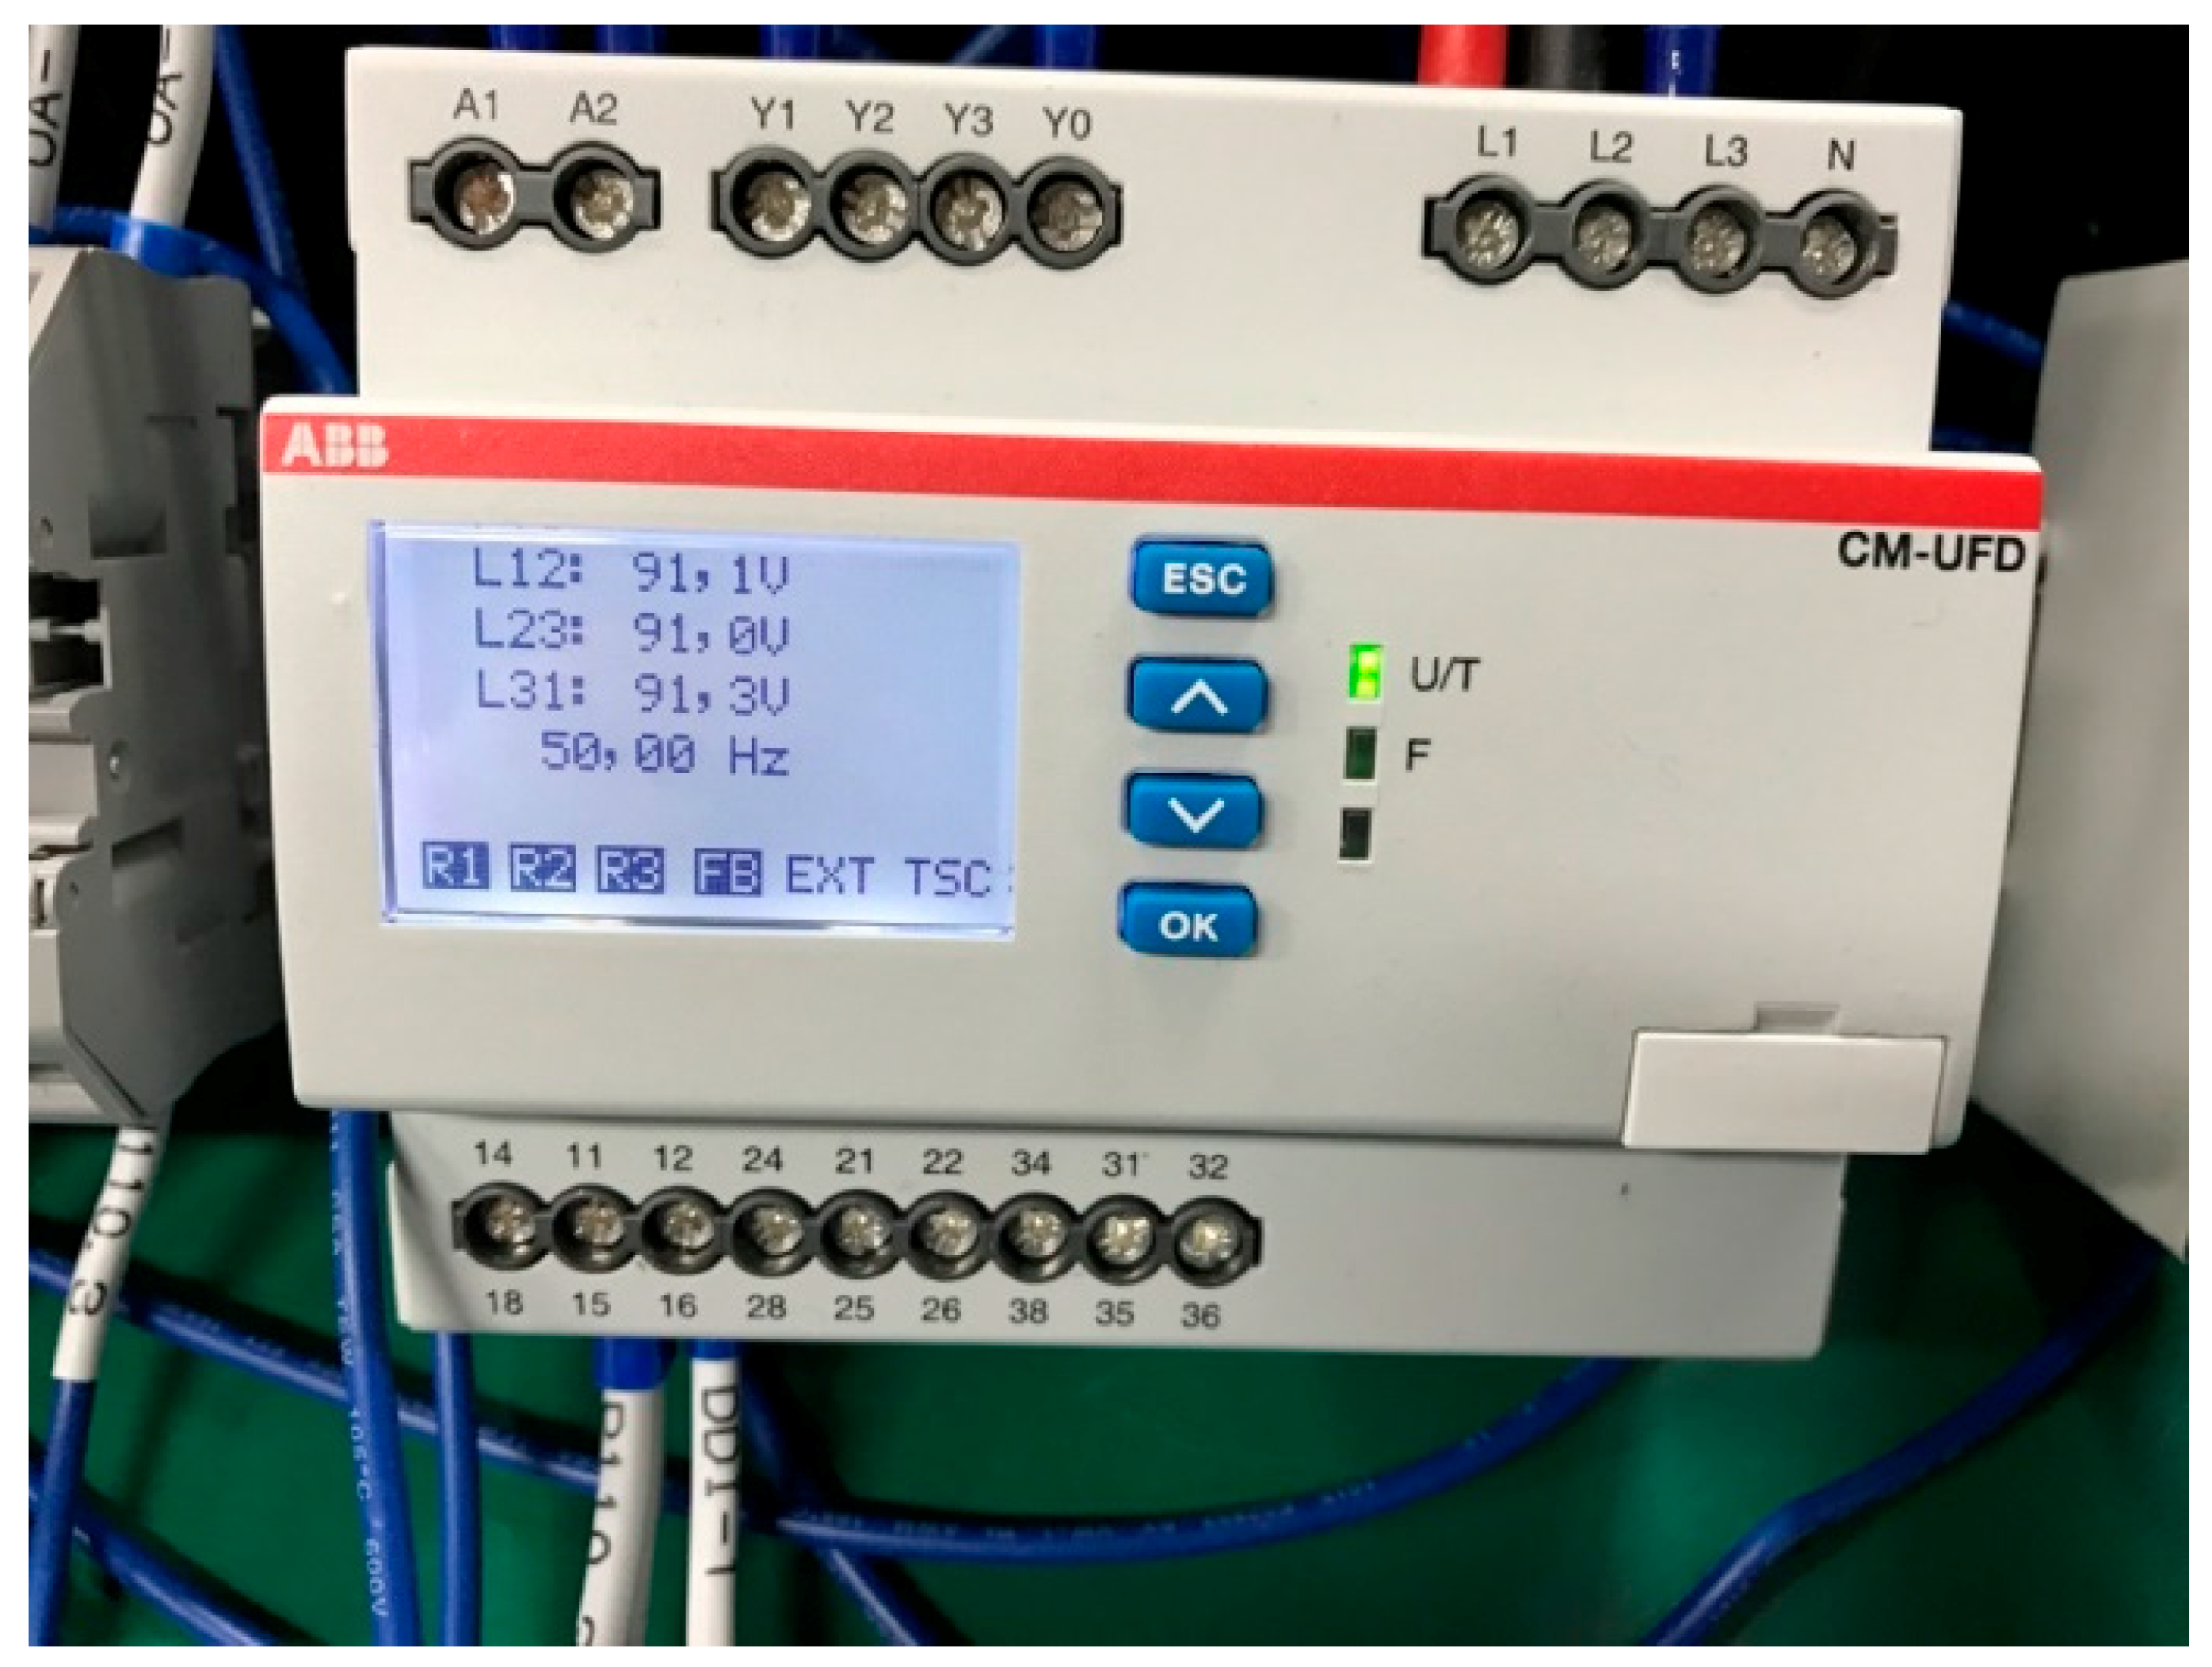
A testing jig is used to check the performance relays prior to their application on the actual system. The equipment that simulates a particular voltage or frequency is installed in this jig to confirm that the relays work without any problems. The levels of the voltage and the frequency are equivalent to the ones that will be generated in the actual power system. In the pictures below, Figure 23 shows the testing jig assembly and the testing equipment is shown in Figure 24, followed by Figure 25 where the voltage and the frequency inputs are described. Also, the specification of the diesel combustion power station in Papua New Guinea is shown in Table 6.
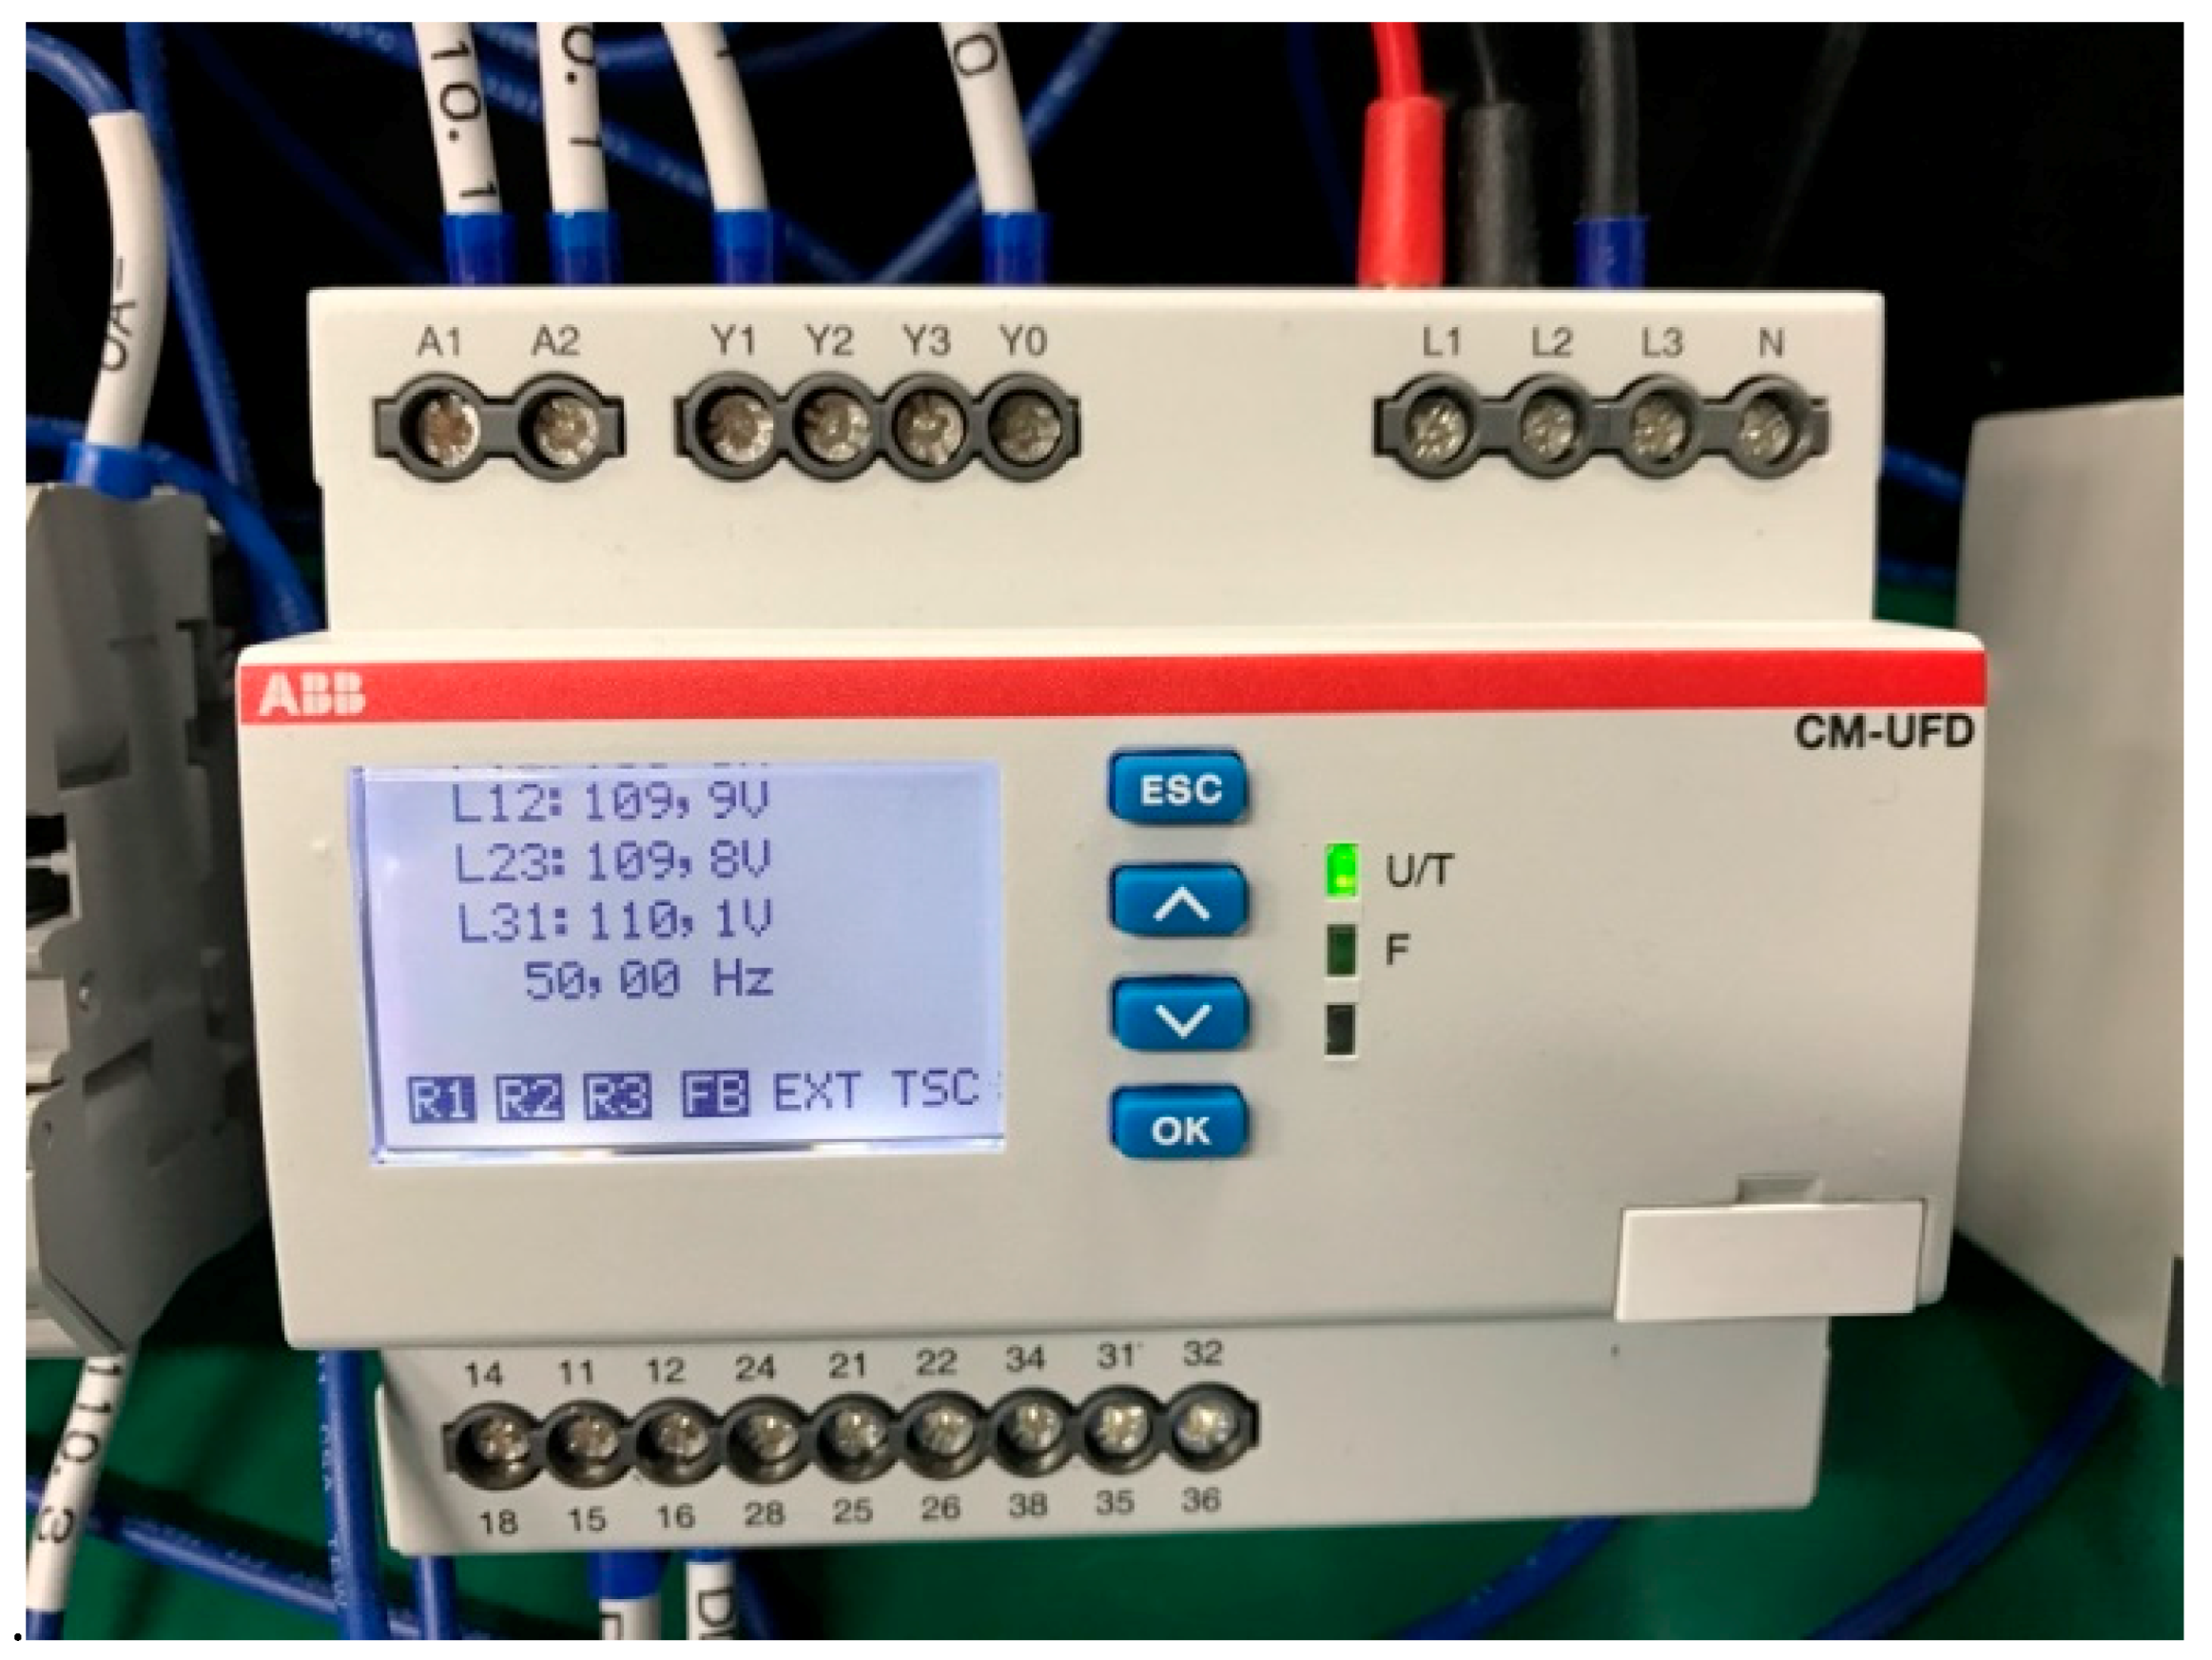
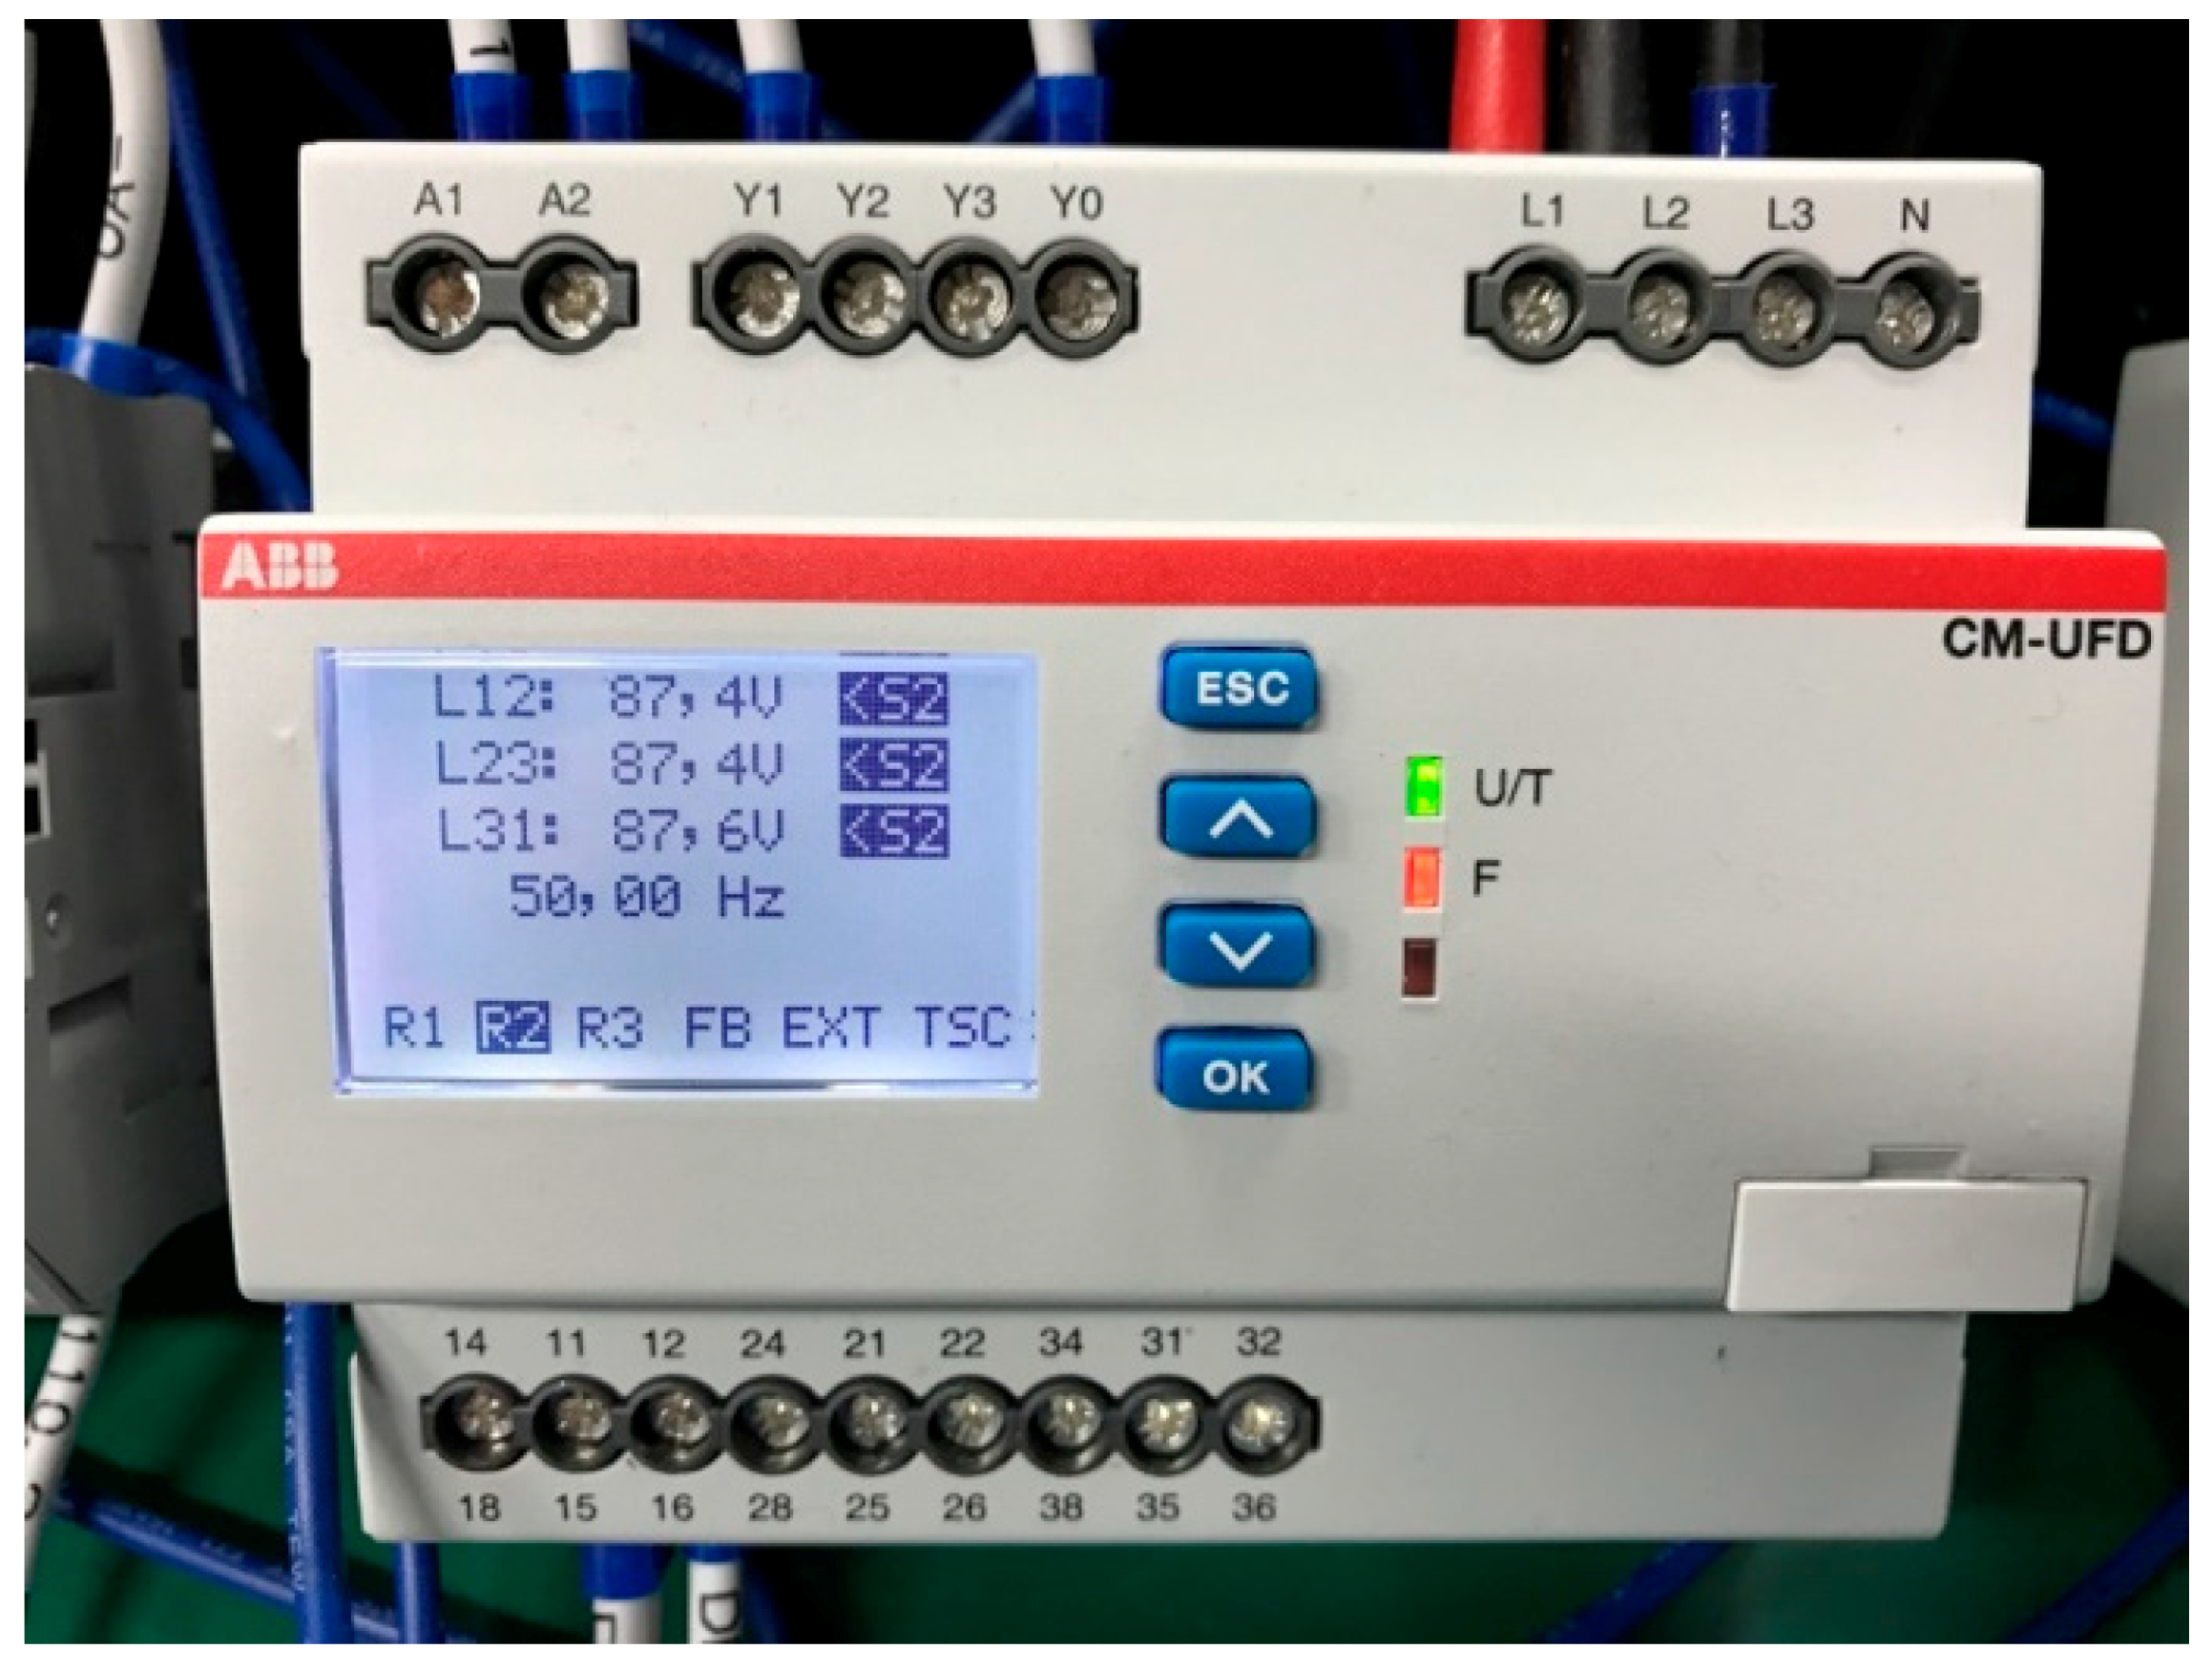
Meanwhile, Figure 26 shows the relay testing process and Figure 27 displays the operation status with the relay being tested. The settings for the relay were 87.4 Vac with 2 s delay. A voltage and a frequency should be entered in the way described in Figure 25 to achieve voltage reduction and measurement. The test result showed that the F-LED was lit as expected (Figure 28).
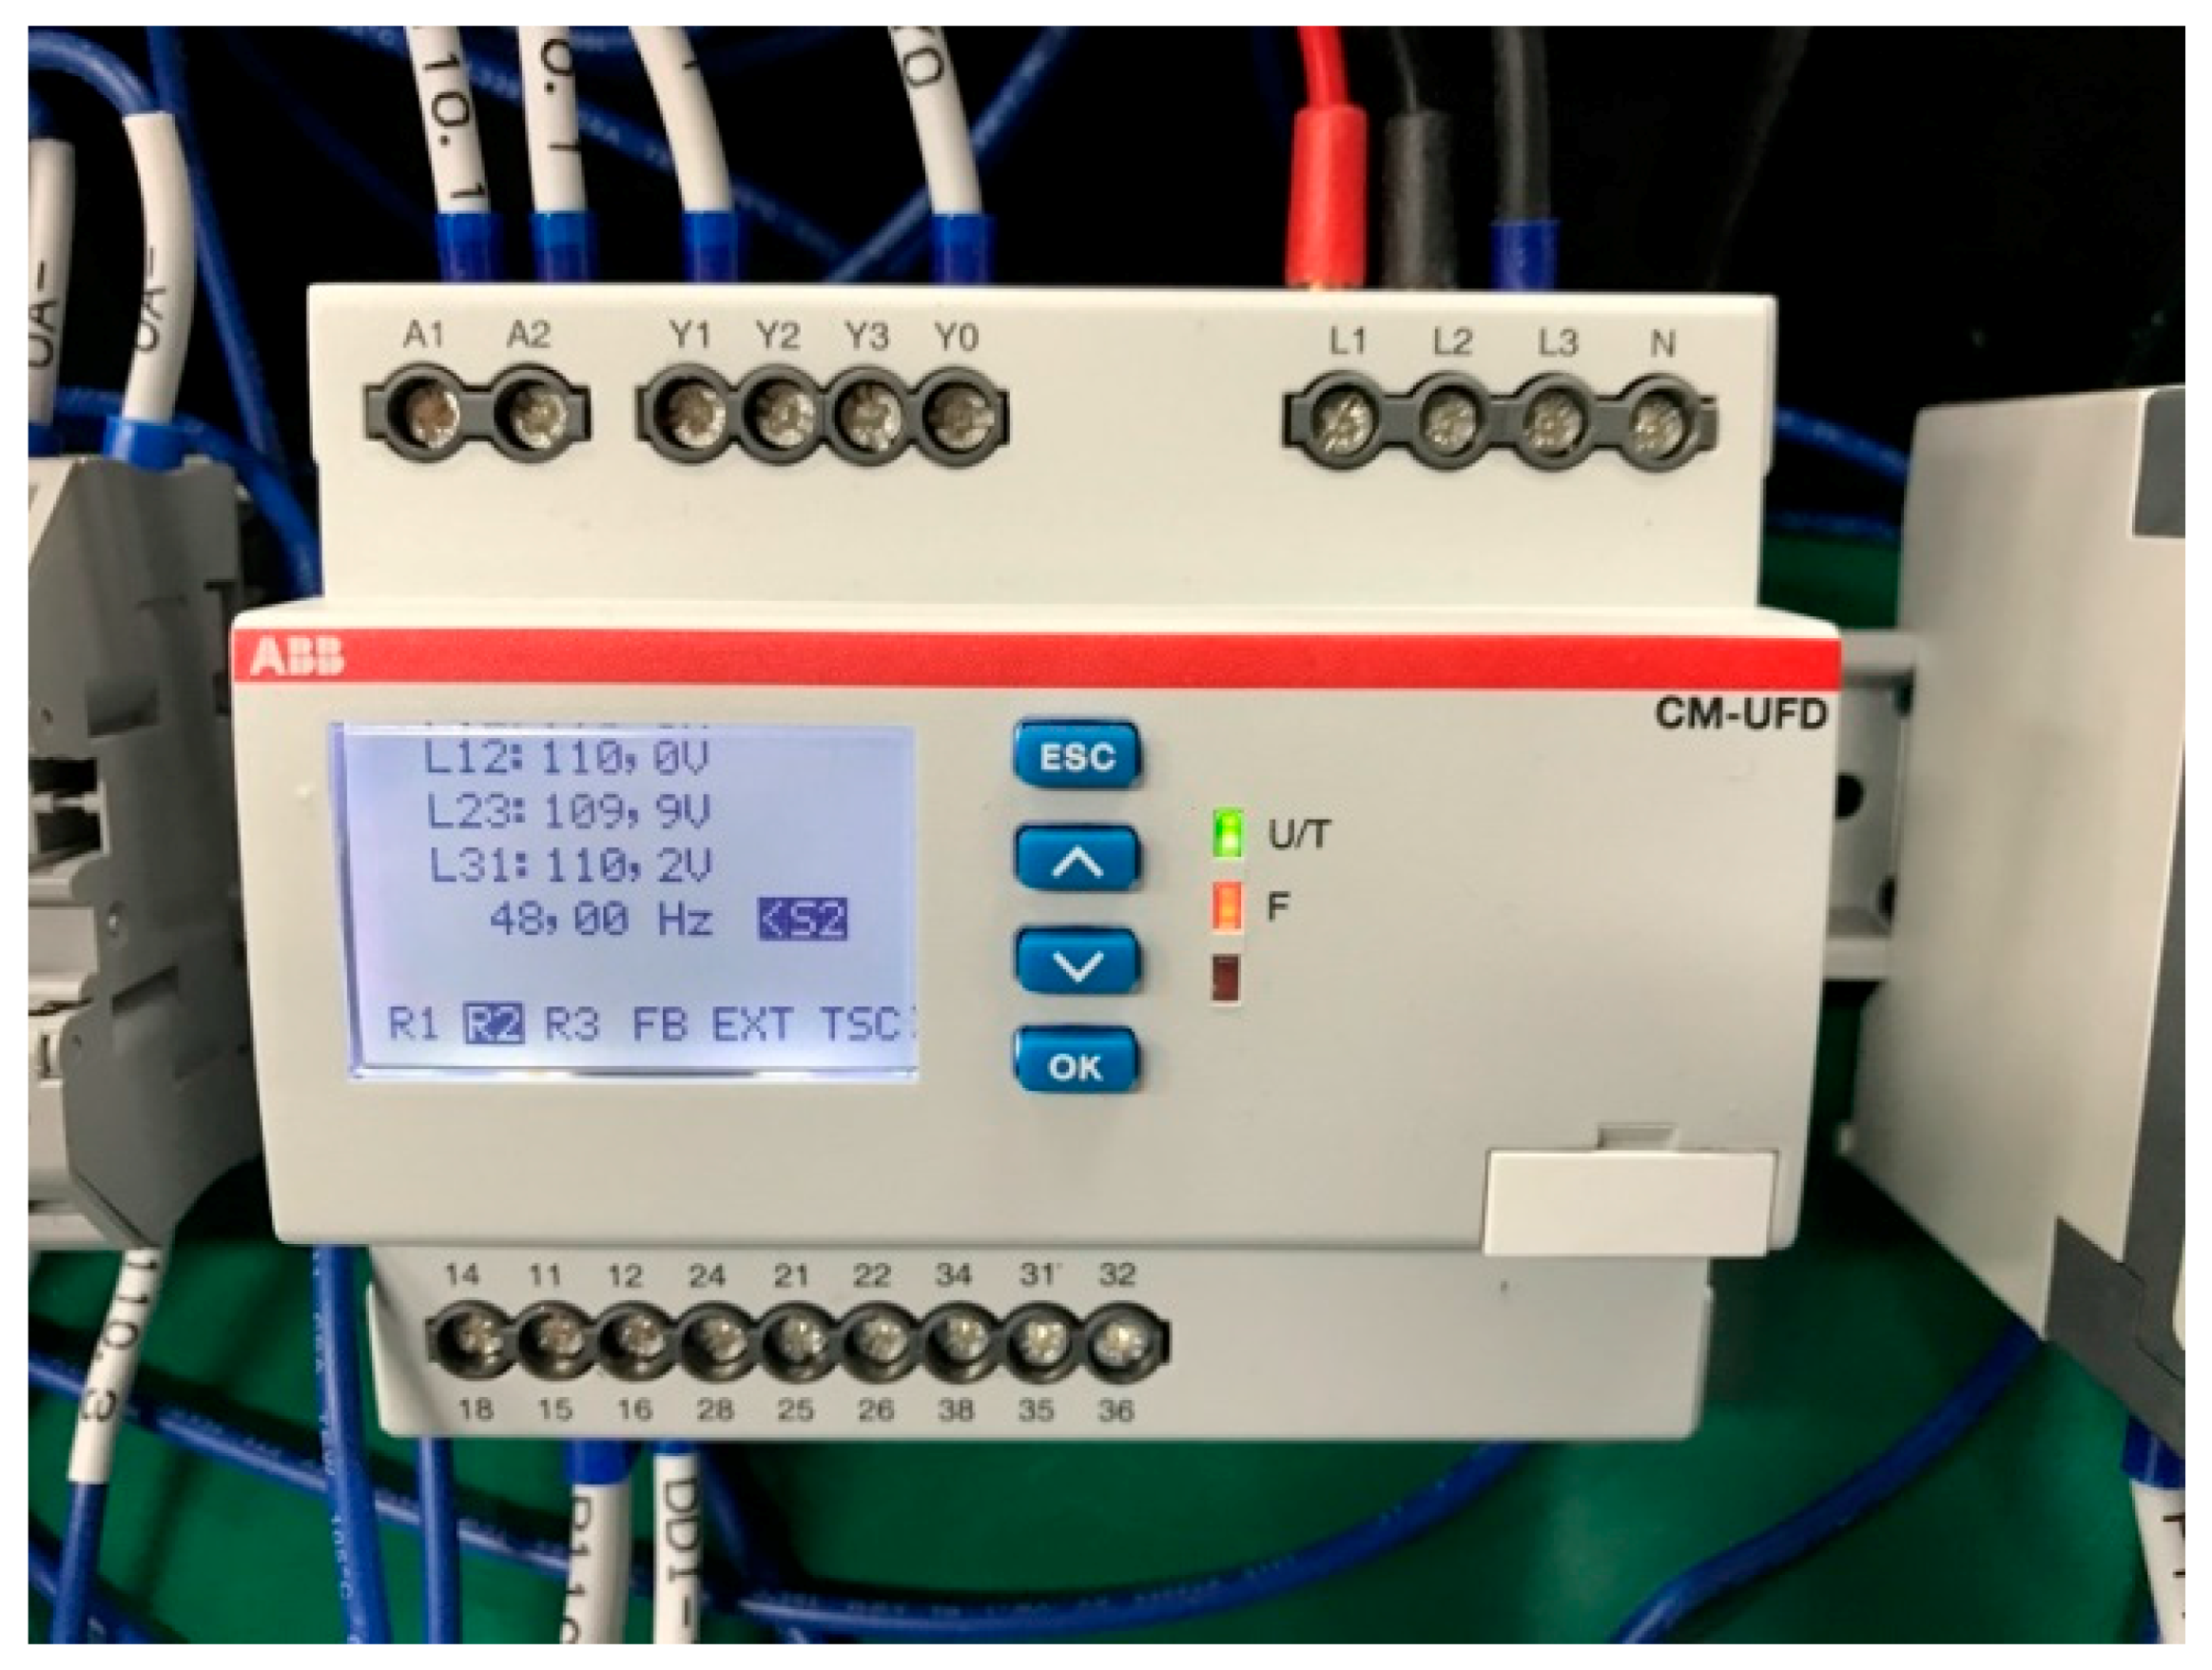
Figure 29 shows the performance of an under-frequency relay set at 48 Hz with 10 s delay. The same process was followed for the test as above, and as expected, the F-LED was lit again. Also, Figure 30 shows operation under frequency relay.
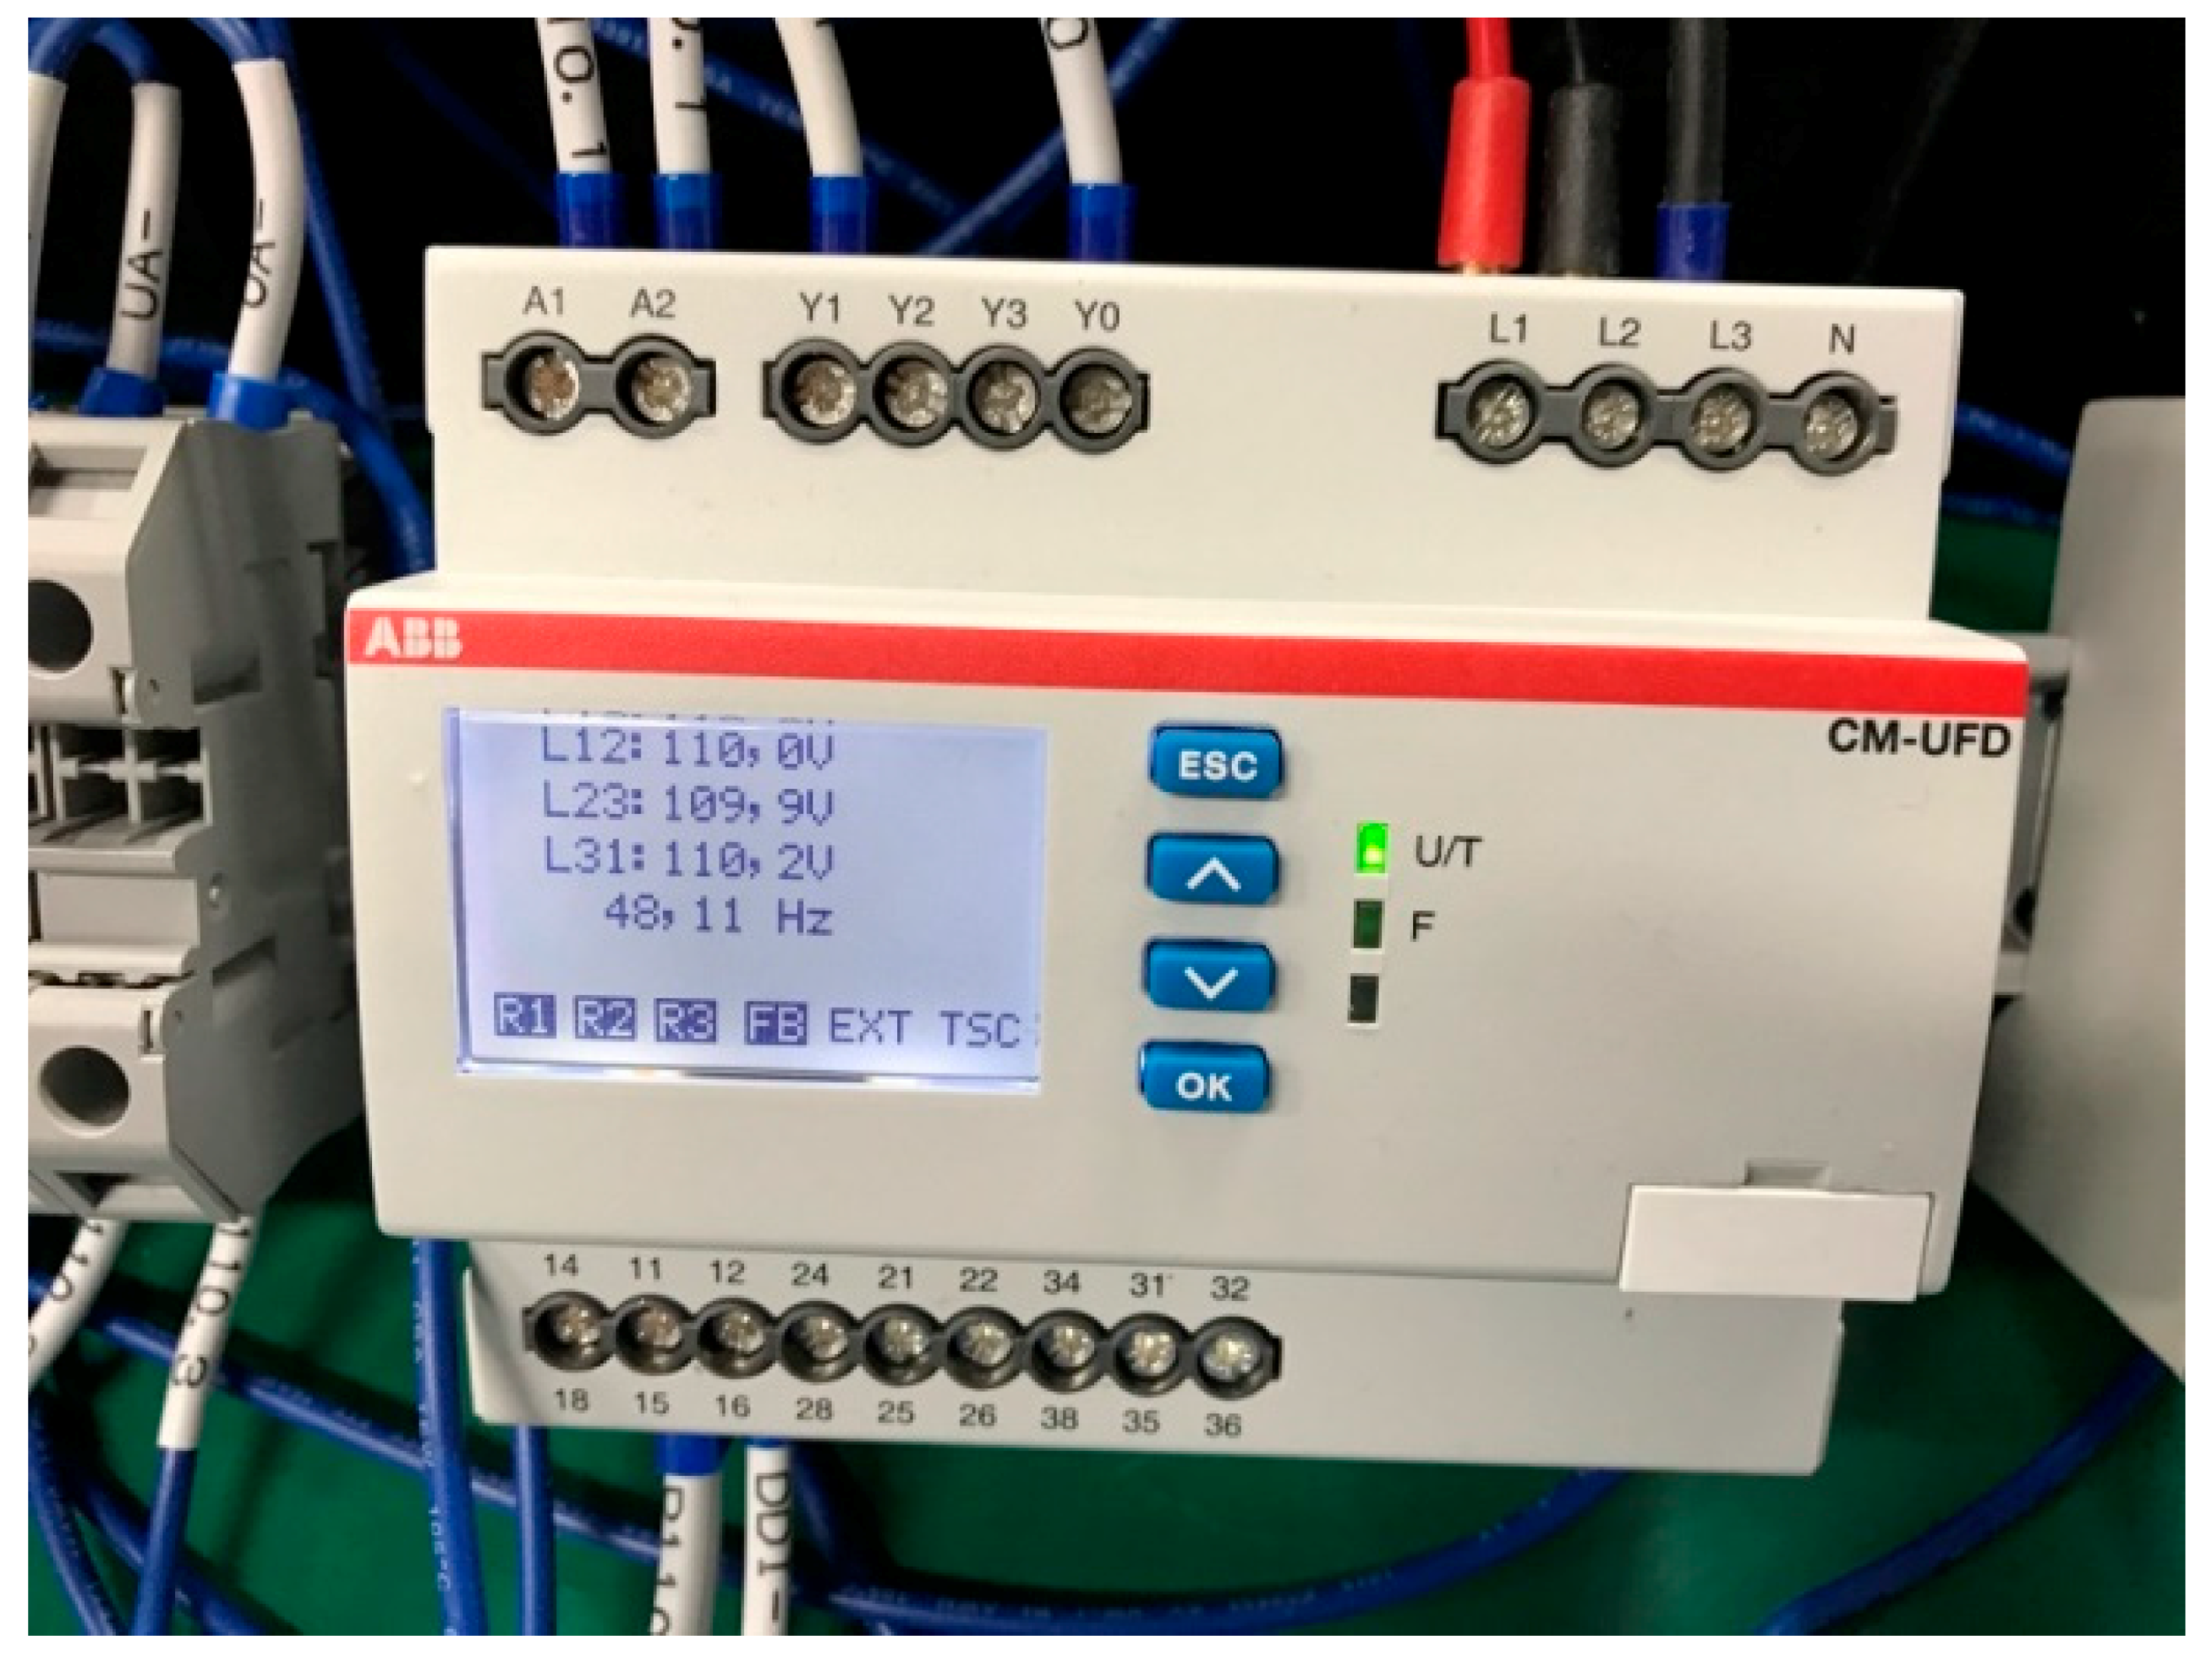
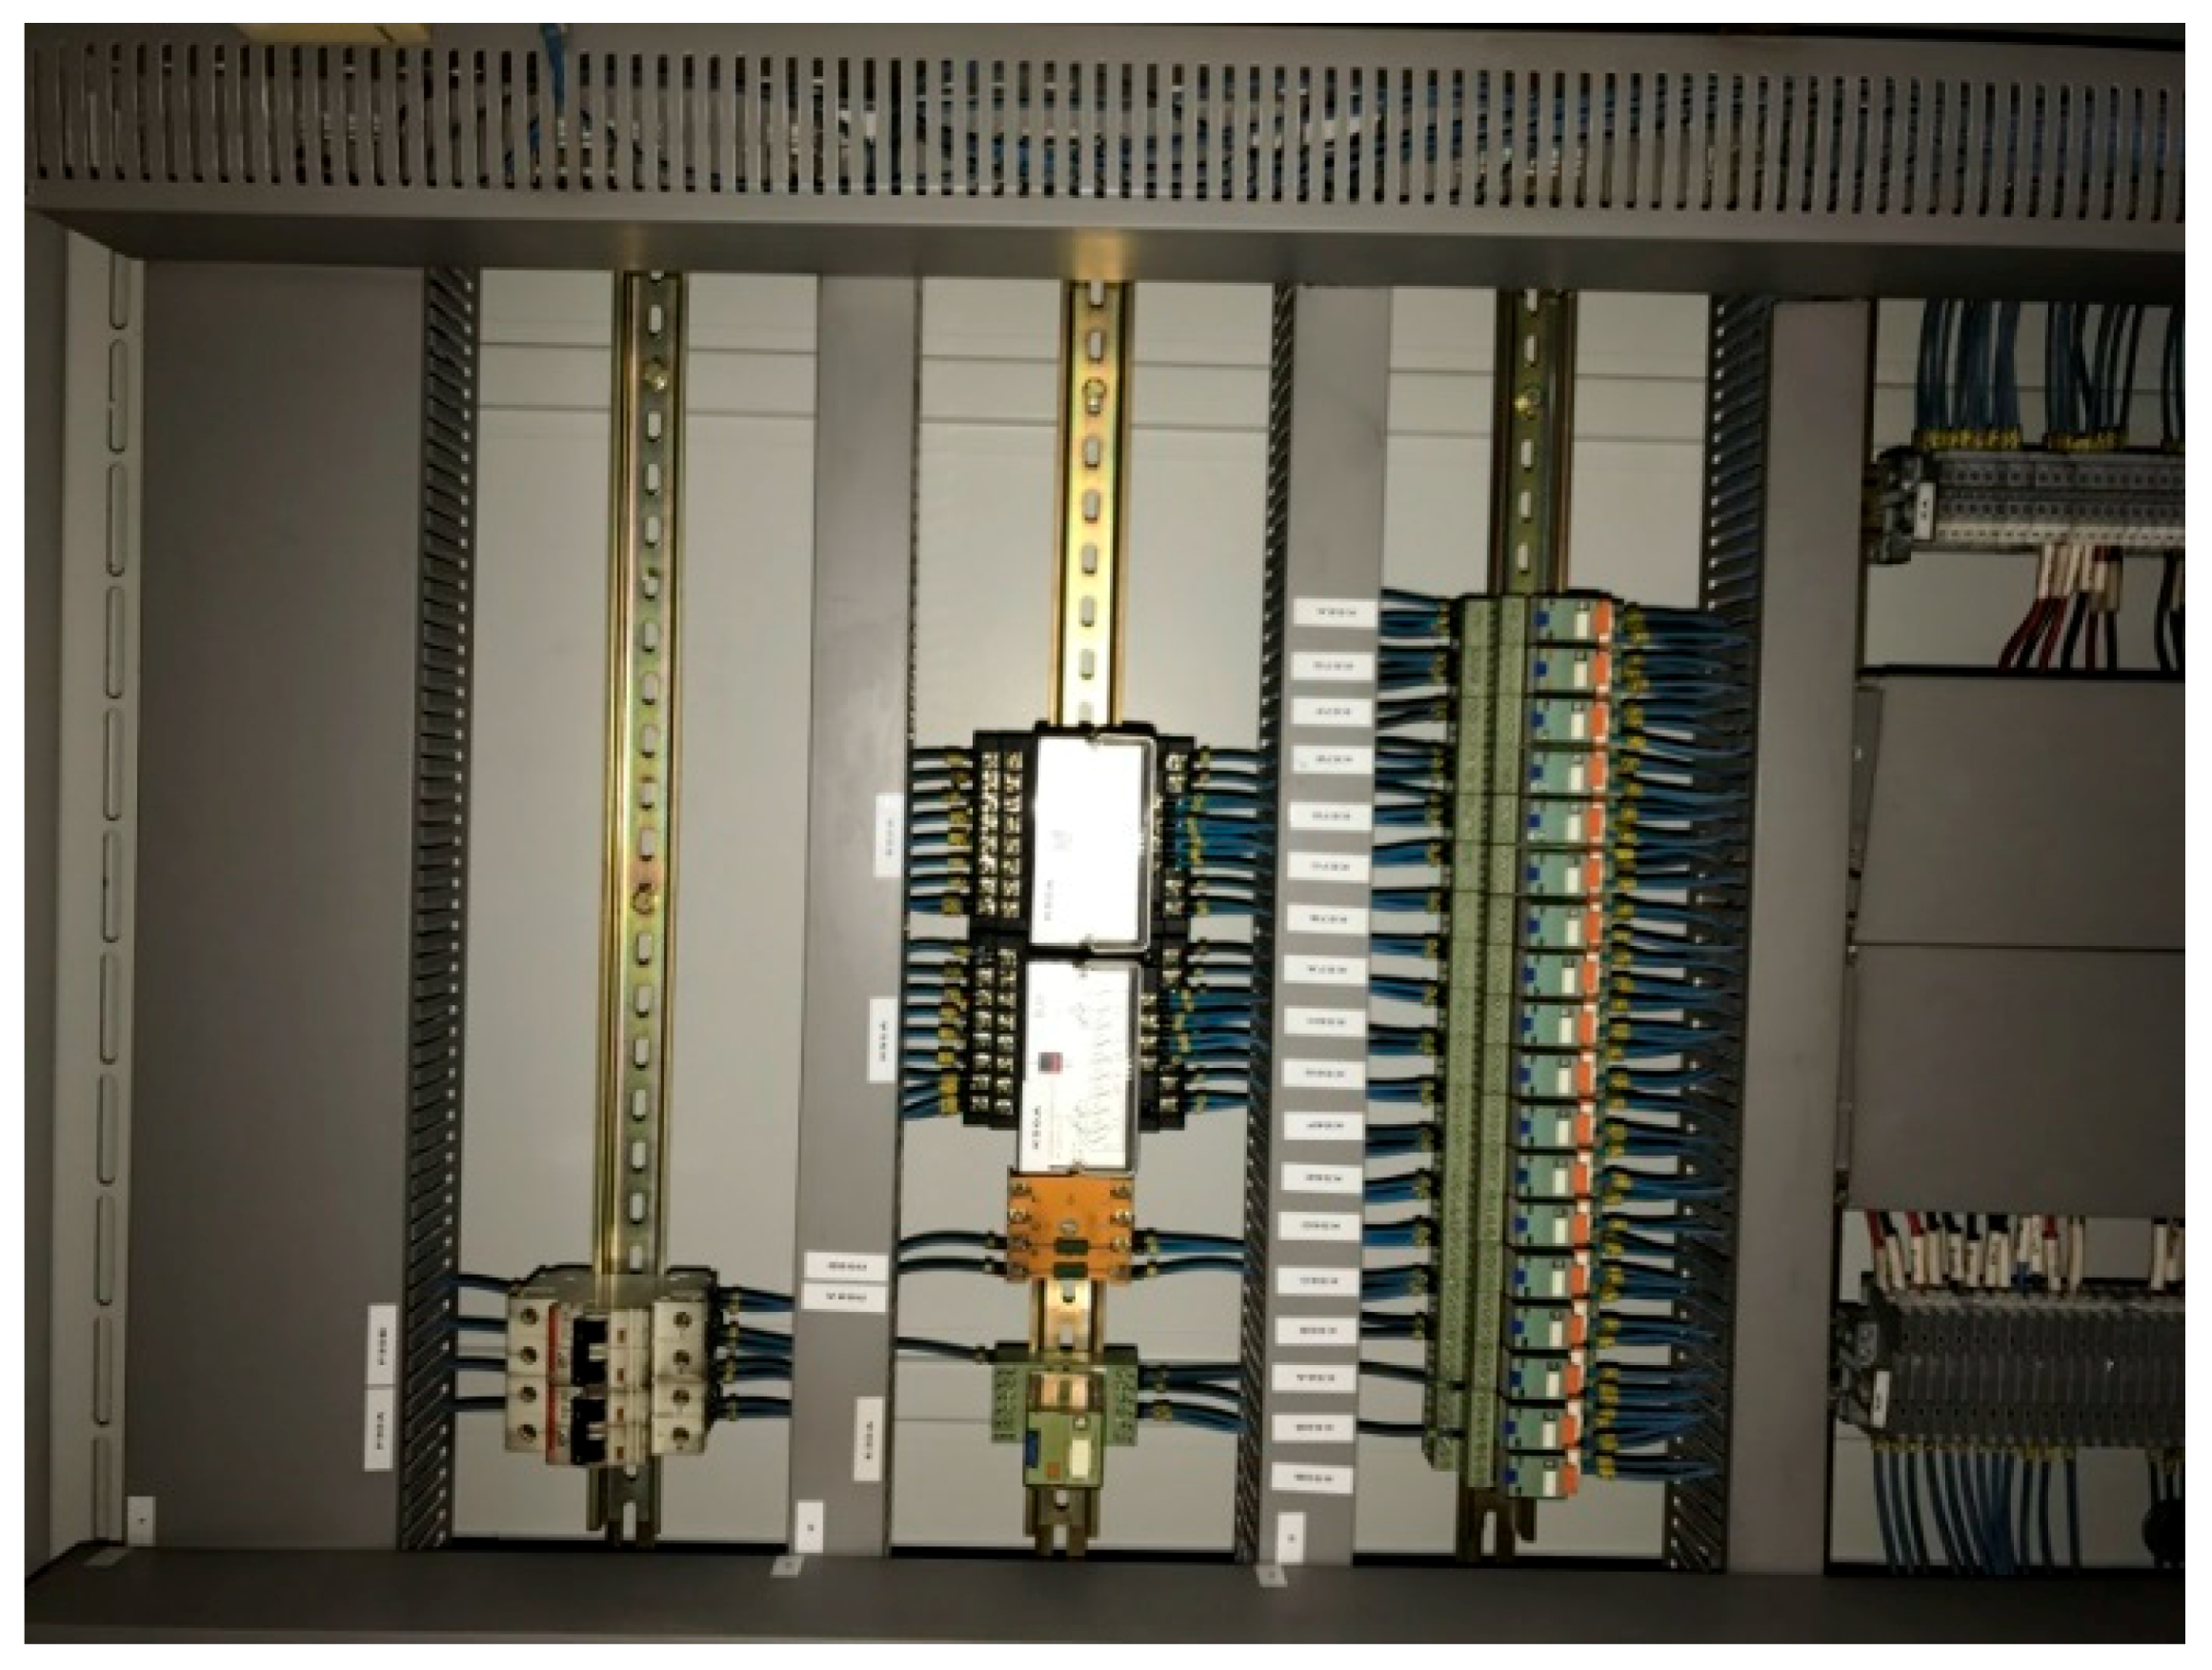
The resetting test for the under-frequency relay was conducted in Figure 31 with the same setting as above. In this case, although the frequency had increased, the relay performed normally after returning to a normal state within 10 s. Figure 32 and Figure 33 are the pictures of the panels before and after installing the relay, respectively.
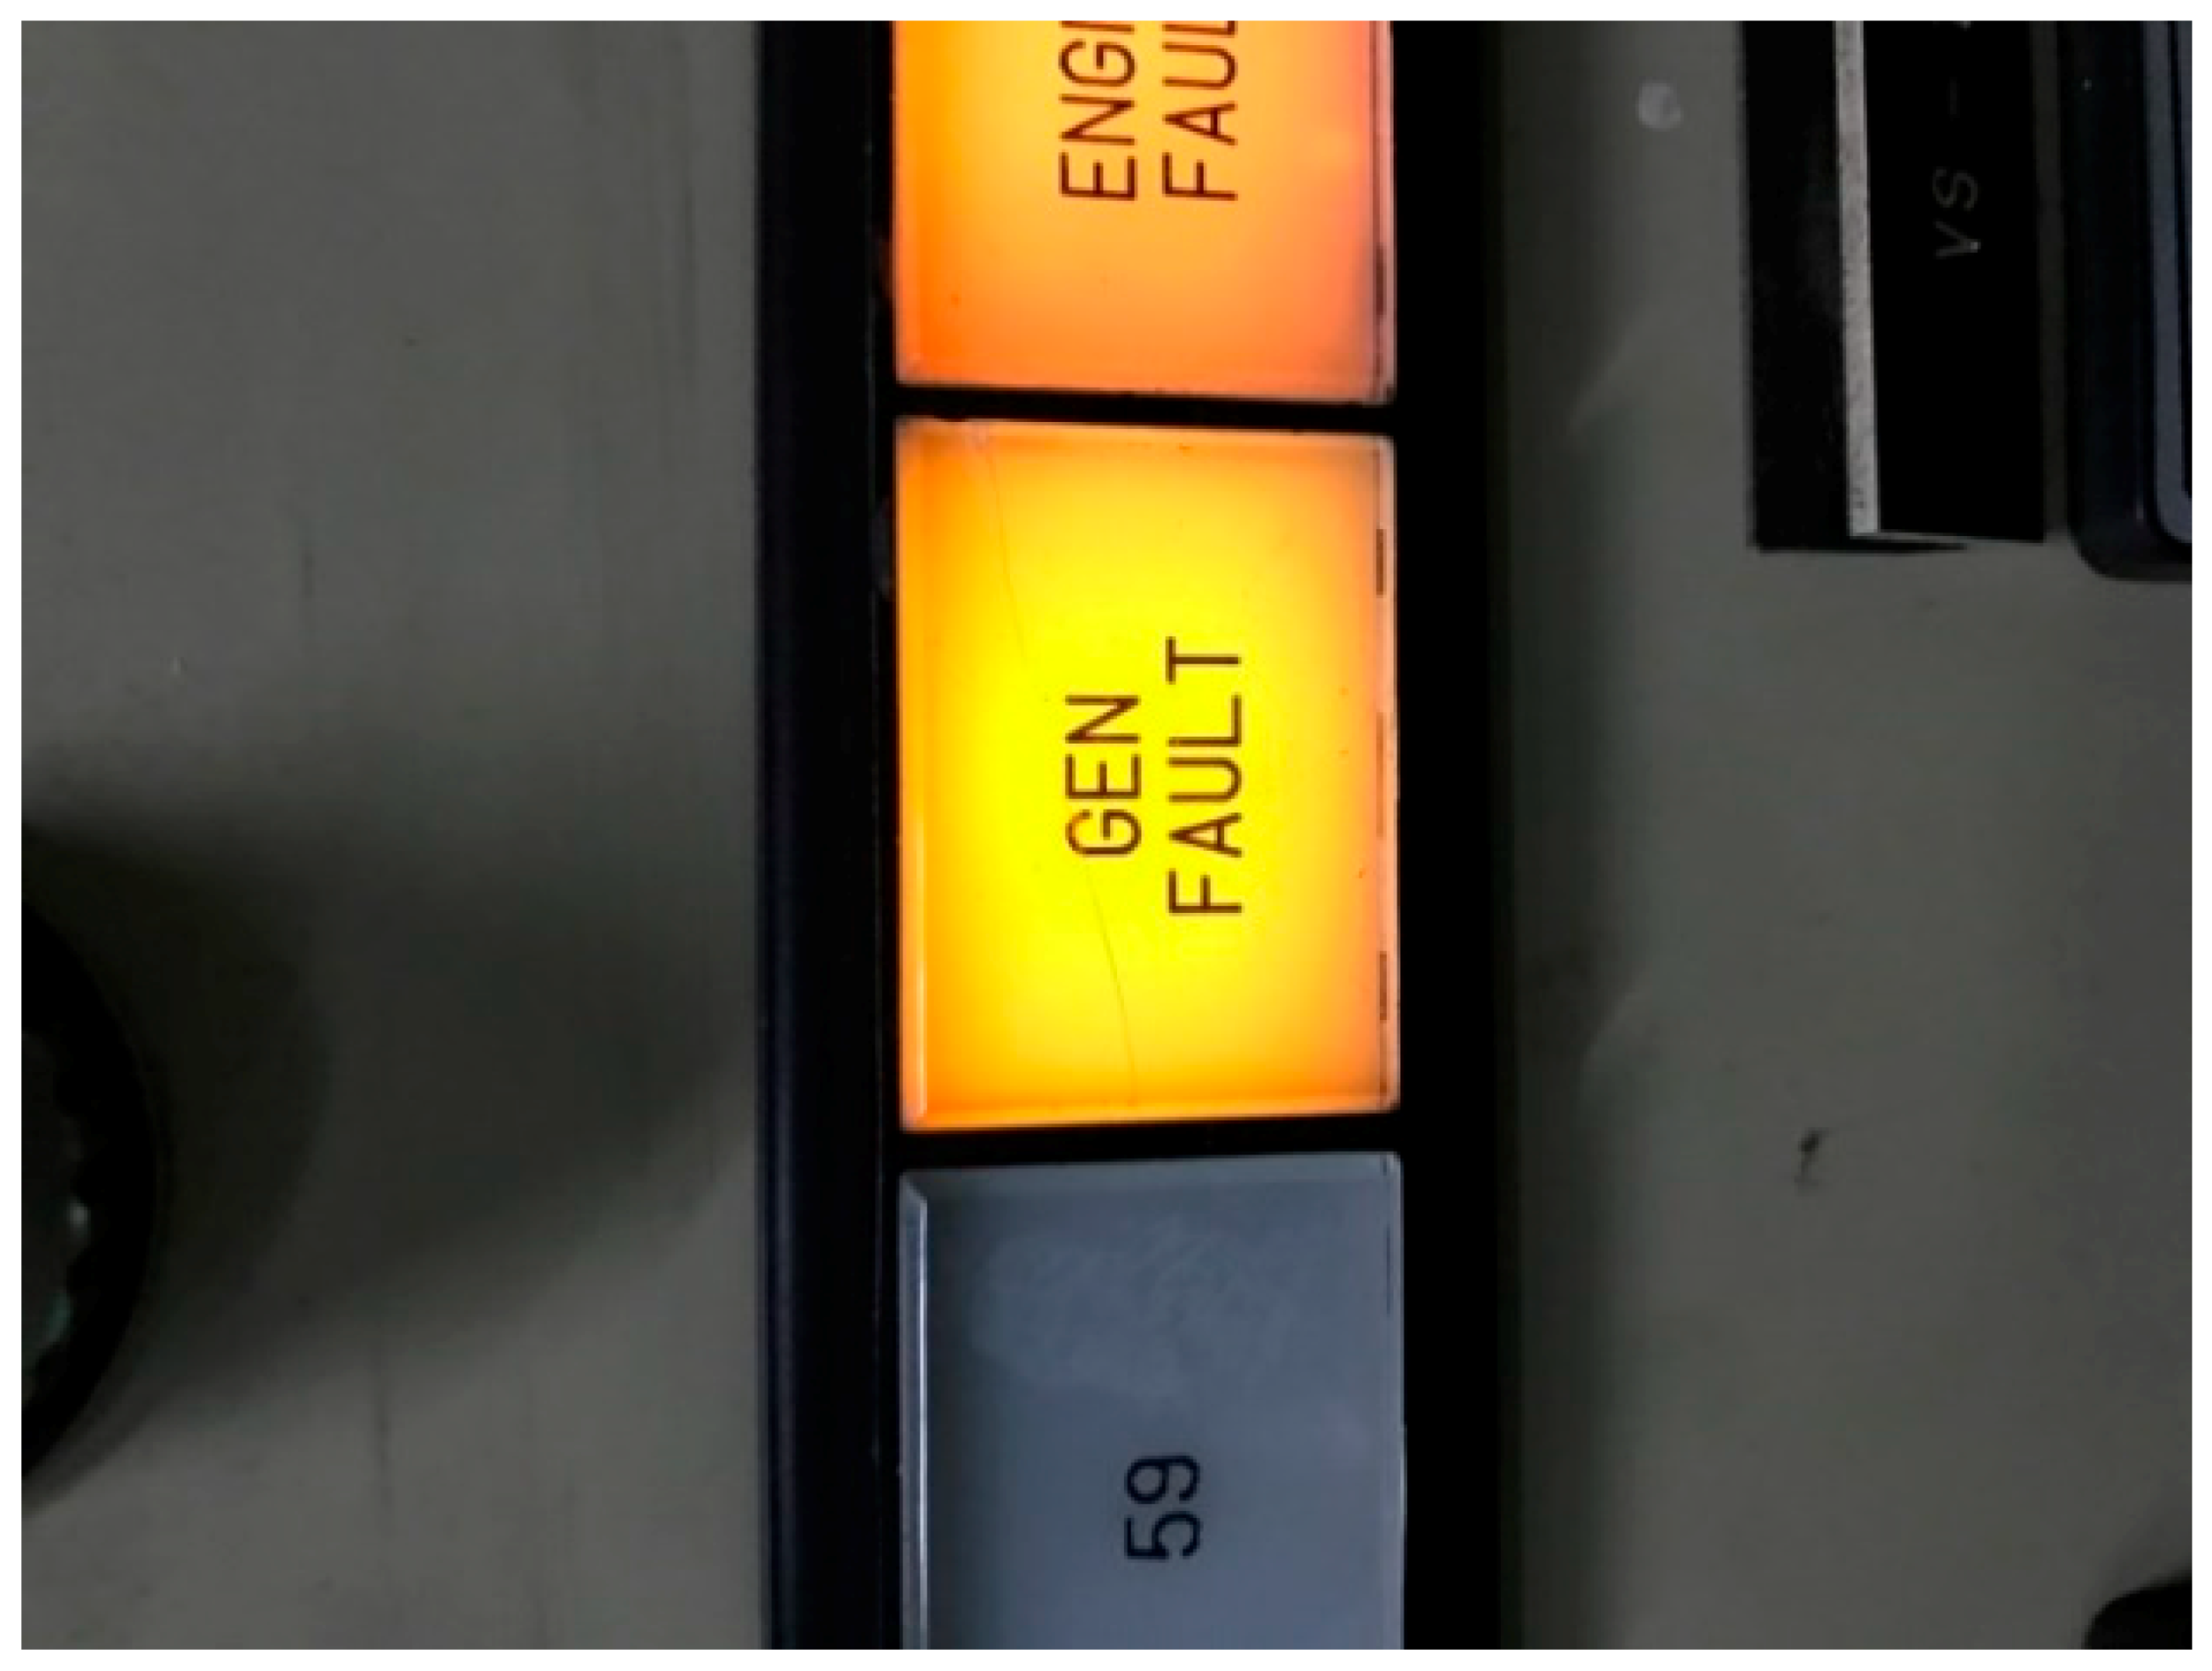
Figure 34 shows a lamp which checks the relay’s operational state. For testing, a simulated signal was transmitted to confirm its normal state. Figure 35 shows the signal measurements taken at both ends of the contact breaker used. This signal was actually transmitted to the relay being tested.
The verification results of the protective relay replacement work at Kanudi power plant in March 2017 are described in this study. The replacement of relays (27 & 81) in the protective relay system were carried out because of their defects. The process of the replacement work is described in this study along with a software-based verification method. The defective relays were replaced after removing the power supply of the control panel. The individual power output sections of new relays were connected in parallel with the existing relays functioning properly.
5.2. An Environment Monitoring Application for Smart Devices of Java Android-Based Excitation System
Excitation systems at nuclear or thermoelectric power stations are quite expensive and need thorough simulations prior to a test run. Thus, in this chapter, an attempt was made in a way that the result of the simulations of the excitation system can be easily checked with an embedded application for the convenience of power station management and staff.
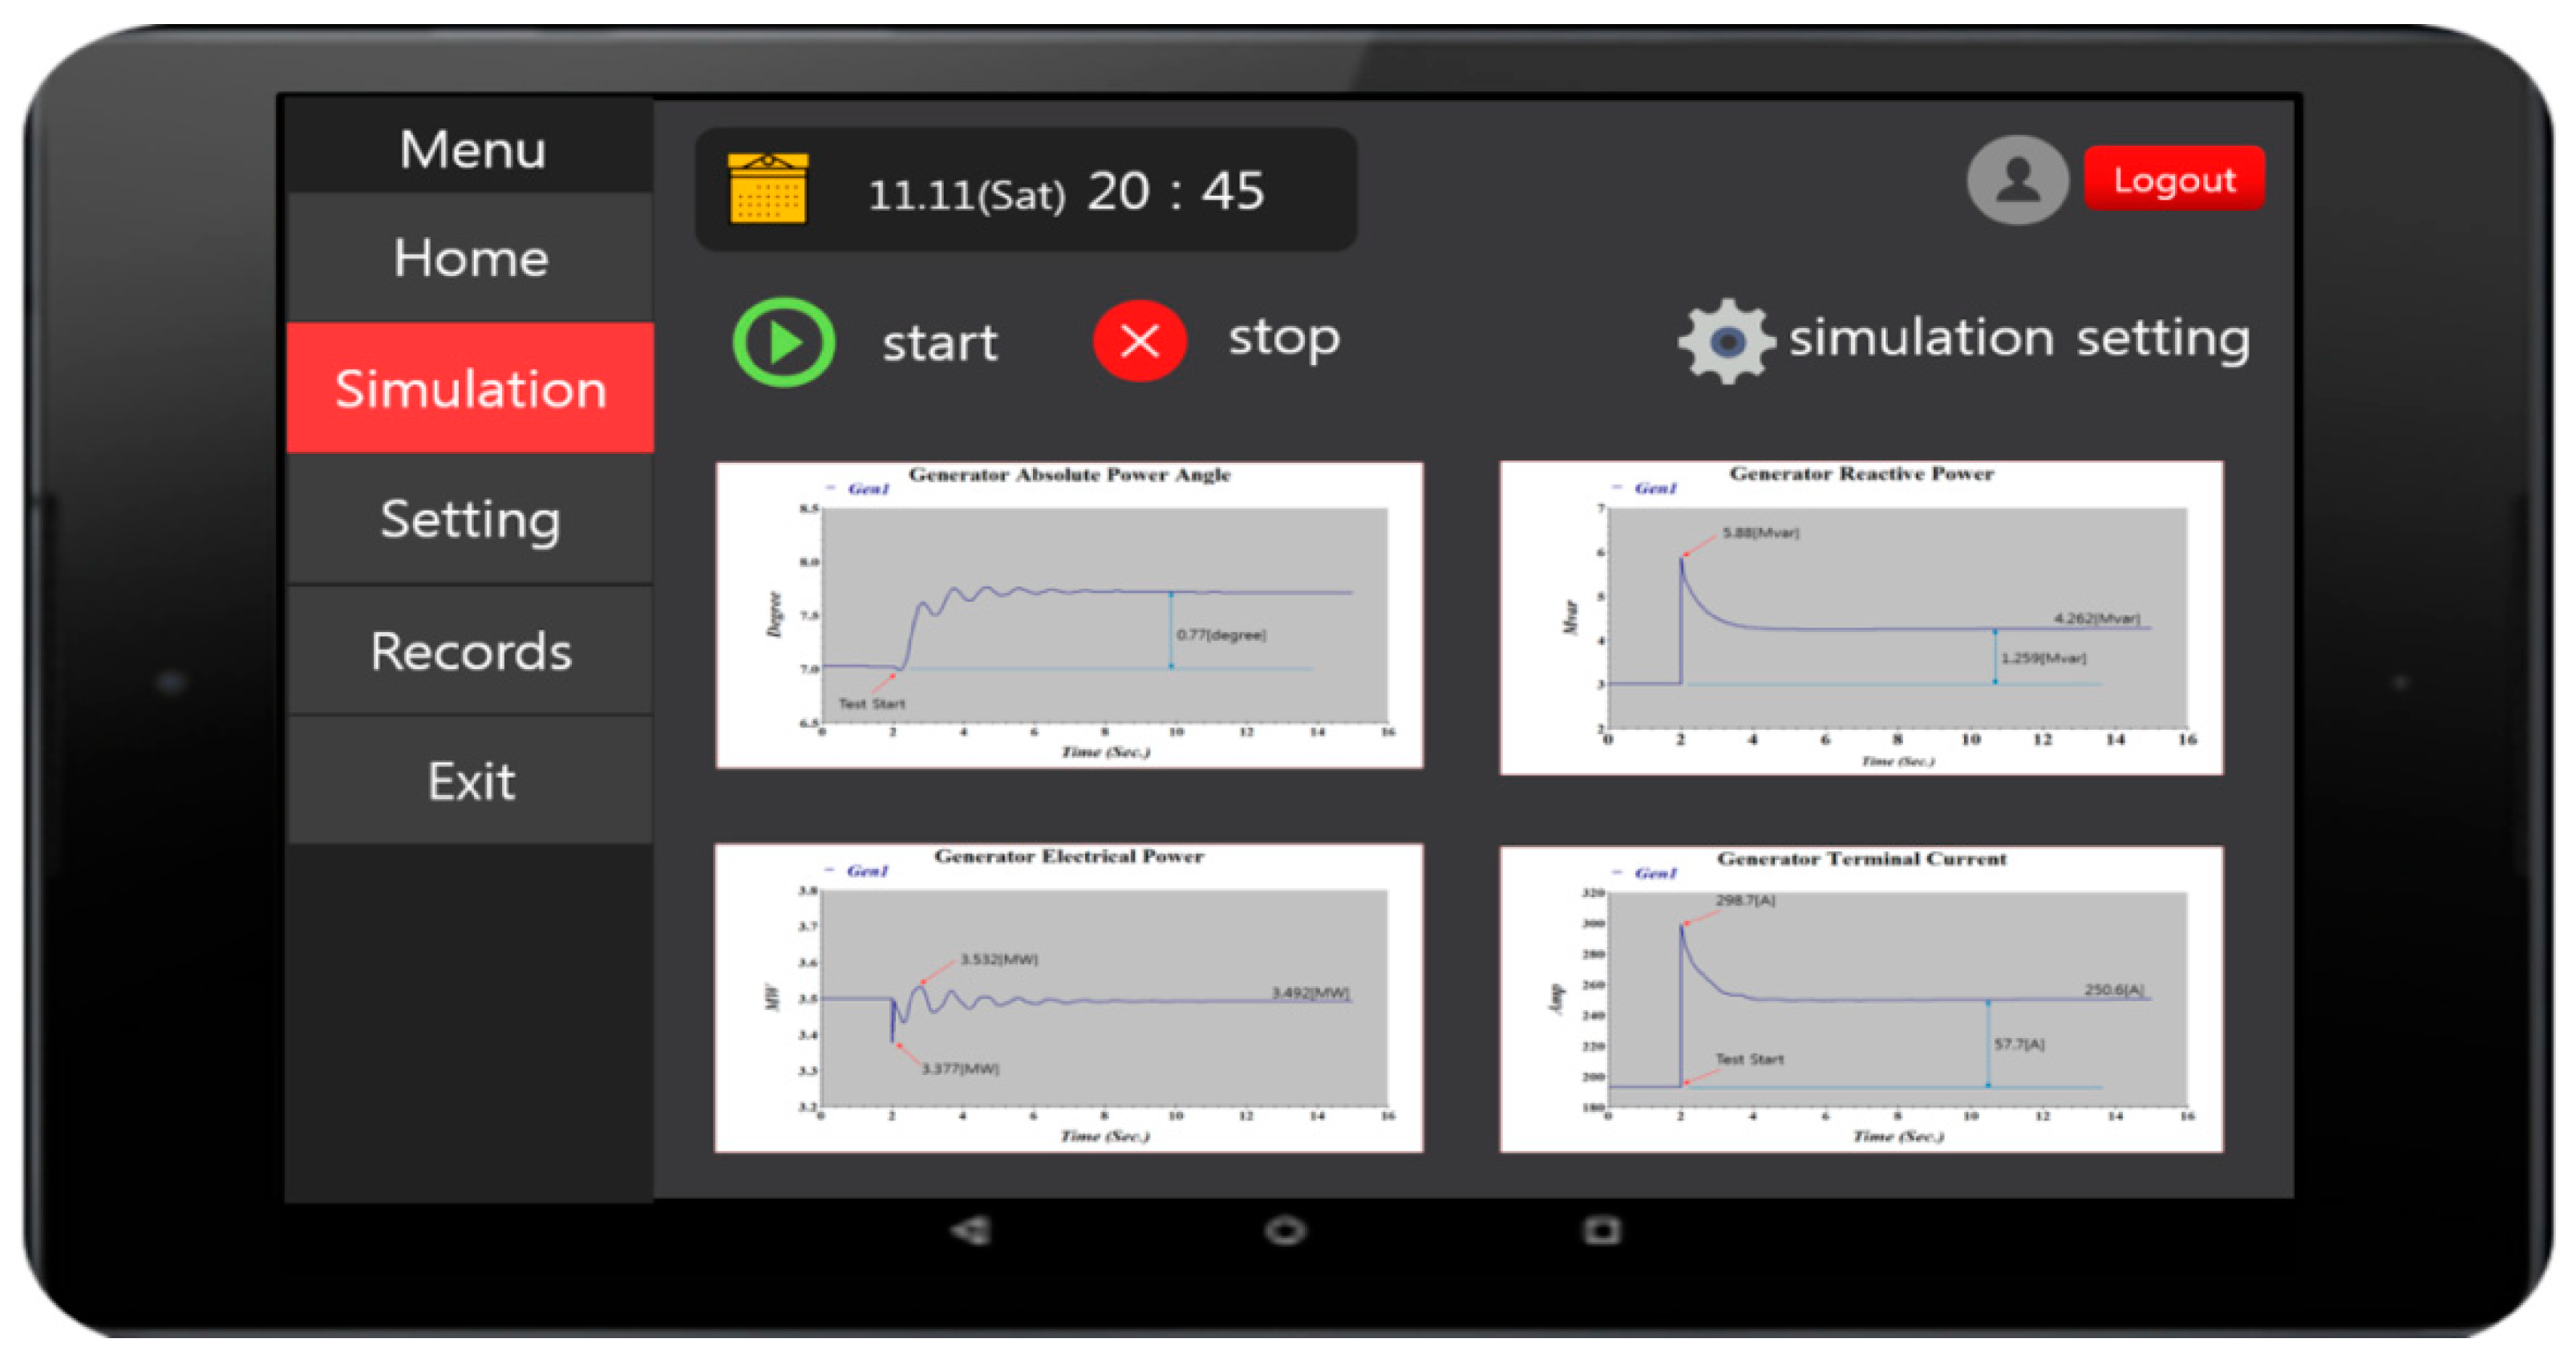
Figure 36 shows the environment monitoring application whose menu is located at the top left while the time and member information are positioned in the top right bar. This picture is a simulation screen that can be view with the application. The application structure wherein the resulting graph will appear once Start has been pushed after setting the simulation conditions has been implemented as well.
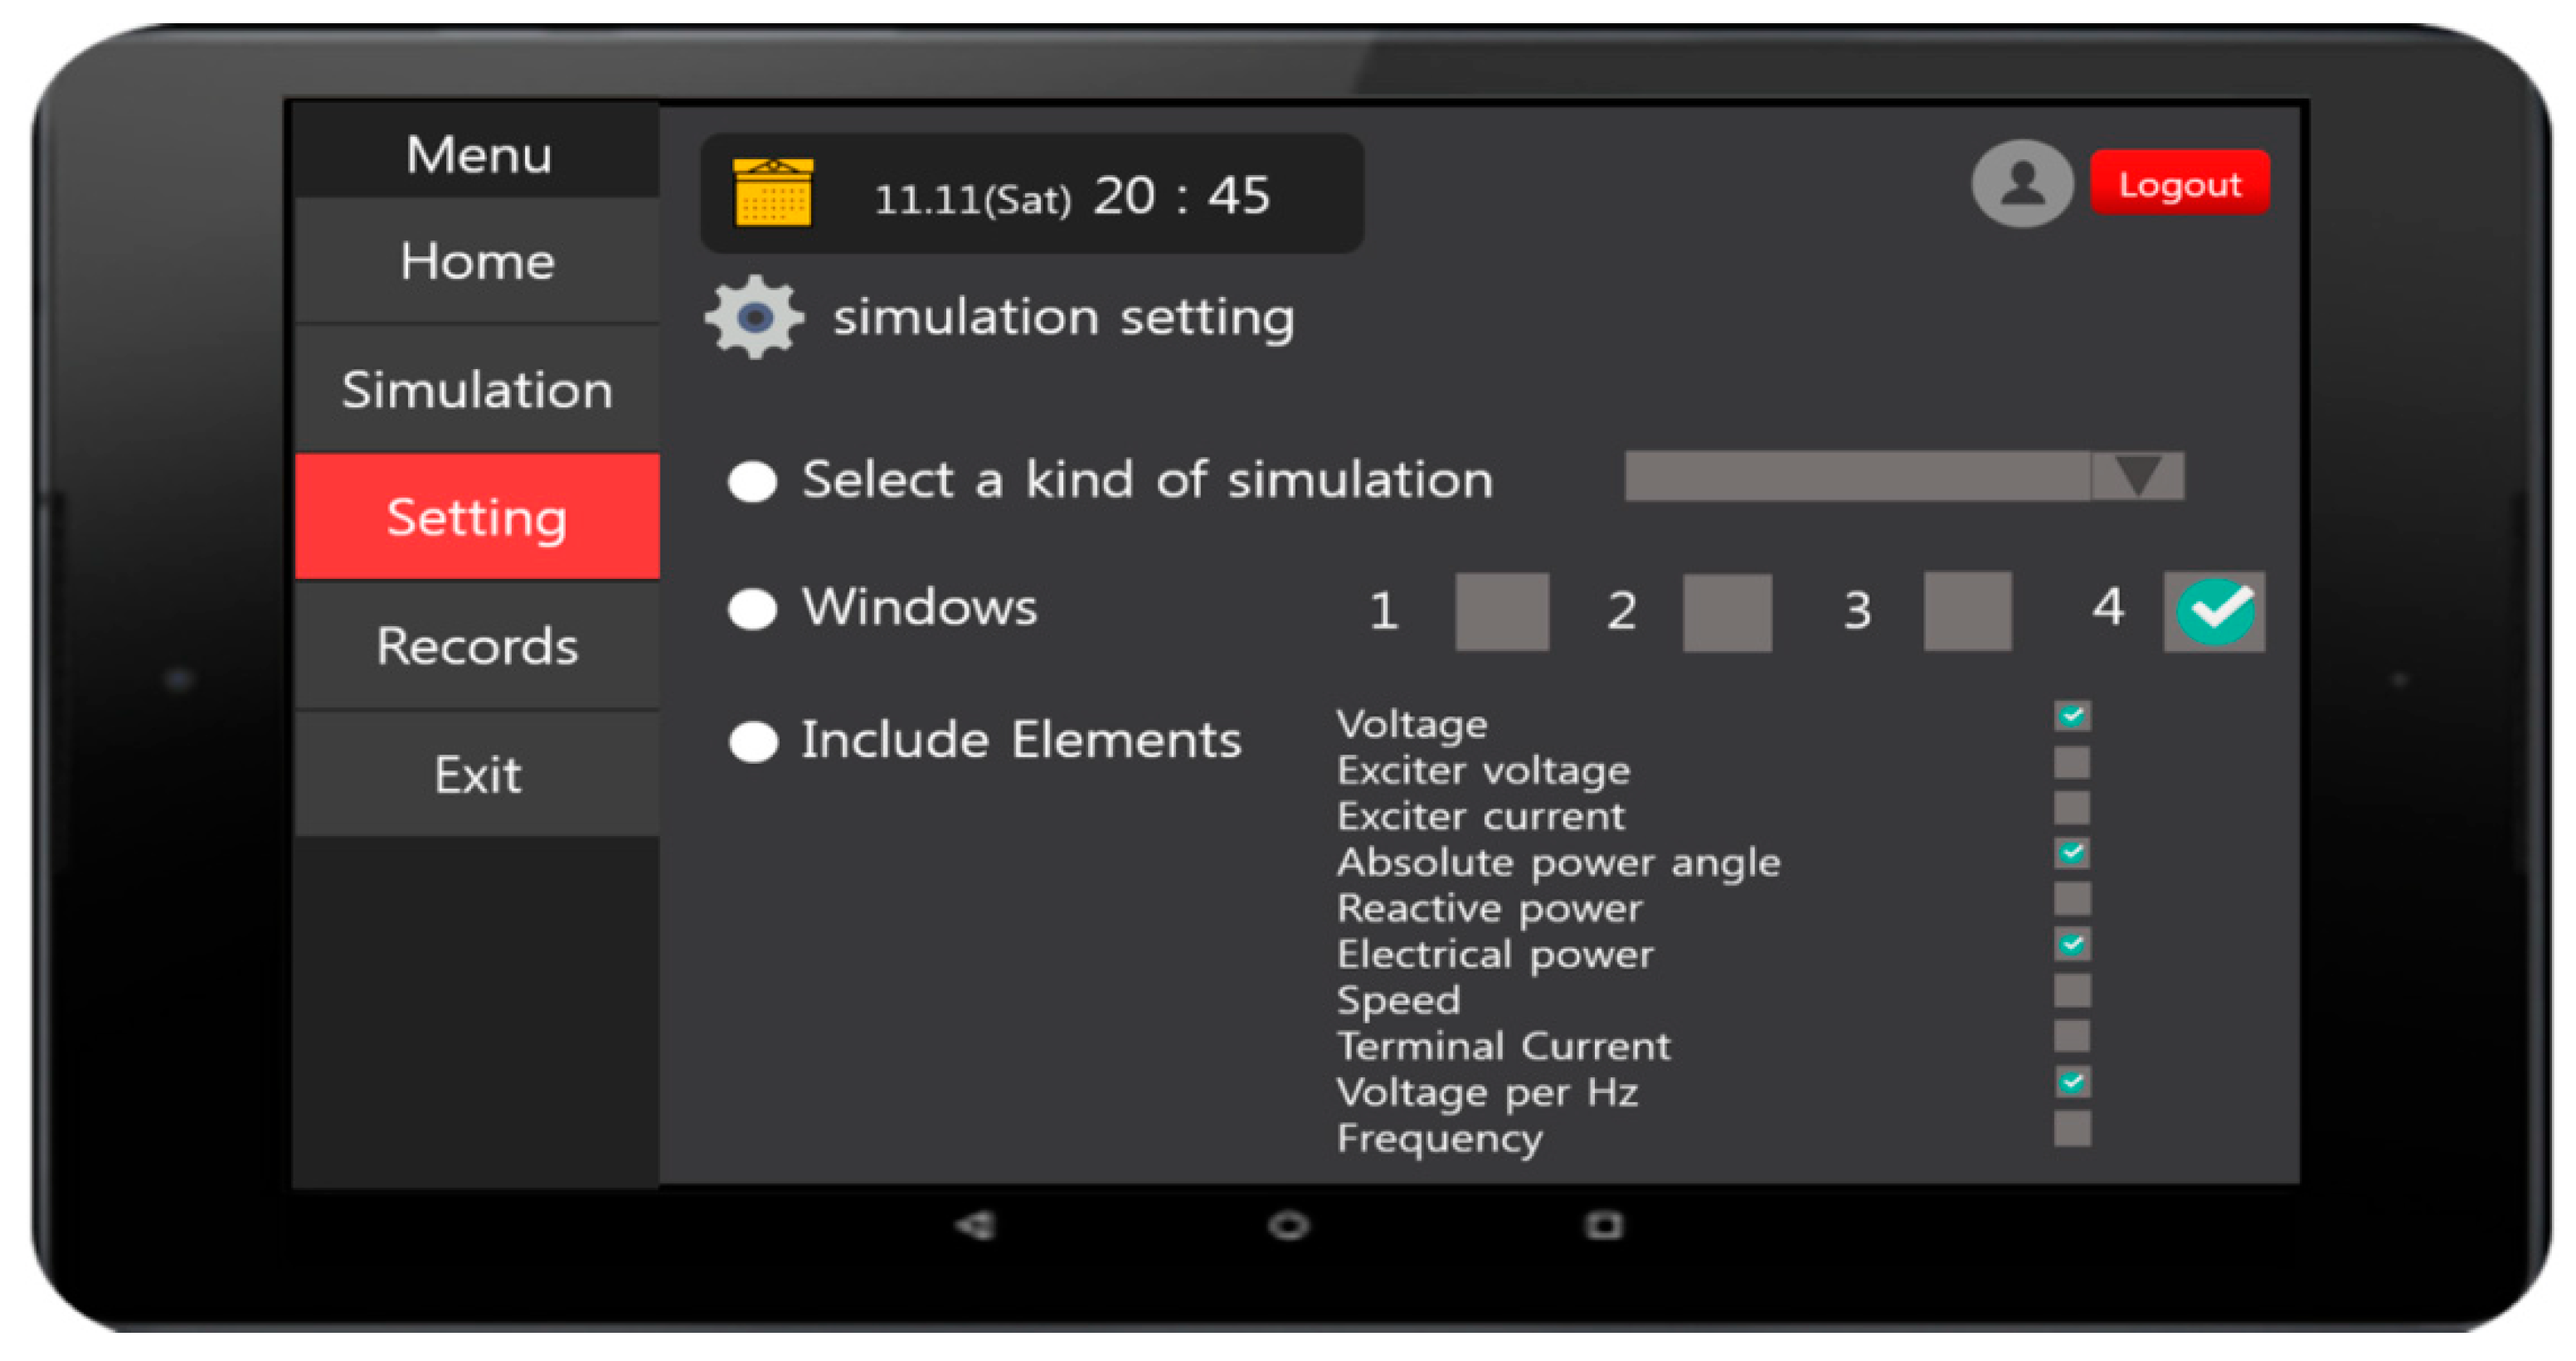
Figure 37 shows the UI pertaining to the application setting. The type of simulation can be selected from the first item. The second item, Windows, allows the user to set the number of windows to be displayed on the simulation screen. The last item lets the user determine which graph the simulation results should be represented with.
6. Conclusions
The contribution of this study is that simulations were performed for an excitation control system first to complete the framework. The algorithm and solution for controlling the excitation system by transmitting the necessary signals to the rectifier after performing a calculation based on the input values of generator voltage, field voltage, and current have been developed with the C language. The implementation results obtained from the Test Bed (Korea Western Power Pyeongtaek Combined power Station, Republic of Korea) validated that the proposed solution was effective and efficient. The successful replacement of protective relays at the Kanudi (Papua New Guinea) Power Station also confirmed that the systems have been operating organically. The Java Android-based application was developed to allow users to conveniently observe simulations or monitor the system operations.
The existing analog systems cannot check the progress (present value) but can only confirm the result. Also, most of their productions were discontinued so that it is impossible to replace them with the same new ones. The replacement system introduced in this study can check the present operating value anytime and has many benefits in the costs compared to the existing systems.
Thus, this study provides an alternative solution for existing excitation control systems. The design of the digital excitation control system introduced here can not only deal with the problems of analog excitation control systems but also offer more efficient operation/maintenance procedures. Also, the effectiveness of the proposed system has been validated through AVR and FCR operations where the system’s master and backup controllers performed properly as they were designed. For the functional comparison, one of the excitation control systems made by company A was chosen. The result of the overshoot transient testing showed that the generator voltage became stable rapidly at a speed of 60.3 ms. At the same time, the Automatic Voltage Regulator (AVR) and Under Excitation Limit (UEL) were controlled at 180 Hz, while the manual controls such as Field Current Build-up (FCR) and Over Excitation Limit (OEL) were controlled within the limit of six-pulse cycles forming a 360 Hz-control loop (60 Hz * 6 = 360 Hz). The elements such as AVR, FCR, Step Response, UEL, OEL, V/HZ Trip, and Over-Excitation Control worked properly as expected. In conclusion, the proposed digital excitation system can replace analog excitation systems and exhibits much better functionality with reduced possibility of malfunction often caused by noises. Also, its specification offers advanced protection and control functions based on the embedded real-time monitoring function. The excitation systems are divided into analog and digital excitation systems. This study covered the latter, and in the study, an Android application that can perform simulations and check overall operations performed at the testbed in Papua New Guinea was developed. The test results revealed that the testbed was successful. The system proposed in this study is capable of making an impact in achieving safe operation.
Author Contributions
Conceptualization, H.L.; Formal analysis, H.L.; Funding acquisition, H.L. and J.-H.H.; Methodology, H.L.; Project administration, J.-H.H.; Resources, J.-H.H.; Software, J.-H.H.; Writing original draft, J.-H.H.; Writing–review & editing, J.-H.H.
Funding
This work was supported by the National Research Foundation of Korea (NRF) grant funded by the Korea government (MSIT) (No.2017R1C1B5077157).
Acknowledgments
Conflicts of Interest
The authors declare no conflict of interest.
Abbreviations
| The ANSI | American National Standard Institute |
| AVR | Auto Voltage Regulator |
| Device number 27 | Under Voltage (IEEE Std C37.2-1996) |
| Device number 81 | Under Frequency (IEEE Std C37.2-1996) |
| ETAP | Electrical Transient Analyzer Program |
| FCR | Field Current Regulator |
| HMI | Human-Machine Interface |
| IoT | Internet of Things |
| ICT | Information and Communications Technologies |
| KEPCO | Korea Electric Power Corporation’s |
| OEL | Over Excitation Limit |
| OET | Over Excitation Trip |
| UEL | Under Excitation Limit |
References
- Lee, H.-G. Algorithm Development and Test Bed of Redundant Digital Excitation Control System. Ph.D. Thesis, University of Seoul, Seoul, Korea, 2018; pp. 1–31. (In Korean). [Google Scholar]
- Basler, M.J. Excitation System: The Current State of the Art. In Proceedings of the 2006 IEEE Power Engineering Society General Meeting, Montreal, QC, Canada, 18–22 June 2006. [Google Scholar]
- IEEE Digital Excitation System Task Force. Computer Models for Representation of Digital-Based Excitation Systems. IEEE Trans. Energy Convers. 1996, 11, 607–615. [Google Scholar]
- Park, J.; Harley, R.; Venayagamoorthy, G. Indirect Adaption control for Synchronous Generator: Comparison of MLP/RBF Neural Networks Approach with Lyapunov Stability Analysis. IEEE Trans. Neural Netw. 2004, 15, 460–464. [Google Scholar] [CrossRef] [PubMed]
- Venayagamoorthy, G.; Harley, R. Two Separate Continually Online-Tranied Neurocont rollers for Excitation and Turbine Control of a Turbogenerator. IEEE Trans. Ind. Appl. 2002, 38, 887–893. [Google Scholar] [CrossRef]
- Hariri, A.; Malik, O.P. Self-learning Adaptive-Network-Based Fuzzy Logic Power System Stabilizer in Multi-Machine Power System. Eng. Intell. Syst. 2001, 9, 129–136. [Google Scholar]
- Shamsollahi, P.; Malik, O.P. Real-Time Implementation and Experimental Studies of a Neural Adaptive Power System Stabilizer. IEEE Trans. Energy Convers. 1999, 14, 737–742. [Google Scholar] [CrossRef]
- Shamsollahi, P.; Malik, O.P. Generalized Neuron-Based Adaptive PSS for Multi machine Environment. IEEE Trans. Power Syst. 2005, 20, 358–366. [Google Scholar]
- IEEE Task Force on Excitat Ion Limiters. Under excitation Limiter Models for Power System Stability studies. IEEE Trans. Energy Convers. 1995, 10, 524–531. [Google Scholar]
- Ramakrishnan, K. Delay-Dependent Stability of Networked Generator-Excitation Control Systems: An LMI Based Approach. IFAC-PapersOnLine 2016, 49, 431–436. [Google Scholar] [CrossRef]
- Kundur, P.; Balu, N.J.; Lauby, M.G. Power System Stability and Control; McGraw-Hill: New York, NY, USA, 1994; Volume 23. [Google Scholar]
- Shah, D.; Nandi, S.; Neti, P. Stator-interturn-fault detection of doubly fed induction generators using rotor-current and search-coil-voltage signature analysis. IEEE Trans. Ind. Appl. 2009, 45, 1831–1842. [Google Scholar] [CrossRef]
- Hemmati, S.; Kojoori, S.S.; Saied, S.; Lipo, T.A. Modelling and experimental validation of internal short-circuit fault in salient-pole synchronous machines using numerical gap function including stator and rotor core saturation. IET Electr. Power Appl. 2013, 7, 391–399. [Google Scholar] [CrossRef]
- Hao, L.; Sun, Y.; Qiu, A.; Wang, X. Steady-state calculation and online monitoring of interturn short circuit of field windings in synchronous machines. IEEE Trans. Energy Convers. 2012, 27, 128–138. [Google Scholar] [CrossRef]
- Saha, S.; Aldeen, M.; Tan, C.P. Unsymmetrical fault diagnosis in transmission/distribution networks. Int. J. Electr. Power Energy Syst. 2013, 45, 252–263. [Google Scholar] [CrossRef]
- He, Z.; Fu, L.; Lin, S.; Bo, Z. Fault detection and classification in EHV transmission line based on wavelet singular entropy. IEEE Trans. Power Deliv. 2010, 25, 2156–2163. [Google Scholar] [CrossRef]
- Saha, S.; Aldeen, M.; Tan, C.P. Fault detection in transmission networks of power systems. Int. J. Electr. Power Energy Syst. 2011, 33, 887–900. [Google Scholar] [CrossRef]
- Saha, S.; Aldeen, M. Generic scalable fault diagnosis system for multimachine power grids. Int. J. Electr. Power Energy Syst. 2014, 59, 36–57. [Google Scholar] [CrossRef]
- Saha, S.; Aldeen, M. Modelling of Transmission Line Faults in Power System. In Proceedings of the 31st IASTED International Conference on Modelling, Identification and Control, Innsbruck, Austria, 14–16 February 2011. [Google Scholar]
- Mahat, P.; Zhe, C.; Bak-Jensen, B.; Bak, C.L. A simple adaptive overcurrent protection of distribution systems with distributed generation. IEEE Trans. Smart Grid 2011, 2, 428–437. [Google Scholar] [CrossRef]
- Chen, W.-H.; Liu, C.-W.; Tsai, M.-S. On-line fault diagnosis of distribution substations using hybrid cause-effect network and fuzzy rule-based method. IEEE Trans. Power Deliv. 2000, 15, 710–717. [Google Scholar] [CrossRef]
- Thukaram, D.; Khincha, H.; Vijaynarasimha, H. Artificial neural network and support vector machine approach for locating faults in radial distribution systems. IEEE Trans. Power Deliv. 2005, 20, 710–721. [Google Scholar] [CrossRef]
- Baxevanos, I.S.; Labridis, D.P. Implementing multiagent systems technology for power distribution network control and protection management. IEEE Trans. Power Deliv. 2007, 22, 433–443. [Google Scholar] [CrossRef]
- Salim, R.H.; de Oliveira, K.; Filomena, A.D.; Resener, M.; Bretas, A.S. Hybrid fault diagnosis scheme implementation for power distribution systems automation. IEEE Trans. Power Deliv. 2008, 23, 1846–1856. [Google Scholar] [CrossRef]
- Xiang, C.; Huang, E.X.; Yang, Z.; Wei, D. Fault Diagnosis for Excitation System Based on Wavelet Analyses. In Proceedings of the Second International Conference on Innovative Computing, Information and Control (ICICIC’07), Kumamoto, Japan, 5–7 September 2007; p. 611. [Google Scholar]
- Saha, S.; Aldeen, M. Excitation System Fault Diagnosis in Multi-Machine Power Grids. In Proceedings of the 2013 Australasian Universities Power Engineering Conference (AUPEC 2013), Hobart, Australia, 29 September–3 October 2013; University of Tasmania: Hobart, Australia, 2013. [Google Scholar]
- Aldeen, M.; Saha, S.; Evans, R.J. Faults Detection and Mitigation in Excitation Control of Synchronous Machines in Large-Scale Power Grids. In Proceedings of the 2015 IEEE 8th GCC Conference and Exhibition, Muscat, Oman, 1–4 February 2015. [Google Scholar]
- Khaitan, S. On-Line Cascading Event Tracking and Avoidance Decision Support Tool. Ph.D. Thesis, Iowa State University, Ames, IA, USA, 2008. [Google Scholar]
- Farnham, S.B.; Schenectady, N.Y.; Swarthout, R.W. Field excitation in relation to machine and system operation. Trans. Am. Inst. Electr. Eng. 1953, 72, 1215–1223. [Google Scholar]
- IEEE Std. 421.5-2005. IEEE Recommended Practice for Excitation System Models for Power System Stability Studies; IEEE: Piscataway, NJ, USA, 2006. [Google Scholar]
- Guttromson, R.T. Modeling distributed energy resource dynamics on the transmission system. IEEE Trans. Power Syst. 2002, 17, 1148–1153. [Google Scholar] [CrossRef] [Green Version]
- Teleke, S.; Abdulahovic, T.; Thiringer, T.; Svensson, J. Dynamic performance comparison of synchronous condenser and SVC. IEEE Trans. Power Deliv. 2008, 23, 1606–1612. [Google Scholar] [CrossRef]
- Vieira, J.C.; Freitas, W.; Xu, W.; Morelato, A. An investigation on the nondetection zones of synchronous distributed generation anti-islanding protection. IEEE Trans. Power Deliv. 2008, 23, 593–600. [Google Scholar] [CrossRef]
- Taborda, J. Comparison between Detailed and Simplified AC Exciter Models. In Proceedings of the 2010 IEEE PES General Meeting, Providence, RI, USA, 25–29 July 2010. [Google Scholar]
- Koo, K.L. Modeling and Cosimulation of AC Generator Excitation and Governor Systems Using Simulink Interfaced to PSS/E. In Proceedings of the 2004 IEEE PES Power Systems Conference and Exposition, New York, NY, USA, 10–13 October 2004; Volume 2, pp. 1095–1100. [Google Scholar]
- Lindenmeyer, D.; Moshref, A.; Schaeffer, M.C.; Benge, A. Simulation of the start-up of a Hydro Power plant for the emergency power supply of a nuclear powerstation. IEEE Trans. Power Syst. 2001, 16, 163–169. [Google Scholar] [CrossRef]
- Bhaskar, R.; Crow, M.L.; Ludwig, E.; Erickson, K.T.; Shah, K.S. Nonlinear parameterestimation of excitation systems. IEEE Trans. Power Syst. 2000, 15, 1225–1231. [Google Scholar] [CrossRef]
- Byoung-Kon, C.; Hsiao-Dong, C.; Hongbin, W.; Hua, L.; Yu, D.C. Exciter Model Reduction and Validation for Large-Scale Power System Dynamic Security Assessment. In Proceedings of the 2008 IEEE PES General Meeting—Conversion and Delivery of Electrical Energy in the 21st Century, Pittsburgh, PA, USA, 20–24 July 2008. [Google Scholar]
- Rasouli, M.; Karrari, M. Nonlinear identification of a brushless excitationsystem via field tests. IEEE Trans. Energy Convers. 2004, 19, 733–740. [Google Scholar] [CrossRef]
- IEEE Committee. Computer representation of excitation systems. IEEE Trans. Power Appar. Syst. 1968, 87, 1460–1464. [Google Scholar]
- Glaninger-Katschnig, A.; Nowak, F.; Bachle, M.; Taborda, J. New Digital Excitation System Models in Addition to IEEE.421.5 2005. In Proceedings of the 2010 IEEE PES General Meeting, Providence, RI, USA, 25–29 July 2010. [Google Scholar]
- Hajagos, L.M.; Basler, M.J. Changes to IEEE 421.5 Recommended Practice for Excitation System Models for Power System Stability Studies. In Proceedings of the 2005 IEEE Power Engineering Society General Meeting, San Francisco, CA, USA, 16 June 2005; pp. 334–336. [Google Scholar]
- Murdoch, A.; Boukarim, G.E.; D’Antonio, M.J.; Zeleznik, J. Use of the Latest 421.5 Standards for Modeling Today’s Excitation Systems. In Proceedings of the 2005 IEEE PES General Meeting, San Francisco, CA, USA, 16 June 2005; Volume 1, pp. 989–994. [Google Scholar]
- Máslo, K.; Kasembe, A.; Kolcun, M. Simplification and unification of IEEE standard models for excitation systems. Electr. Power Syst. Res. 2016, 140, 132–138. [Google Scholar] [CrossRef]
- Liu, J.; Miura, Y.; Bevrani, H.; Ise, T. Enhanced Virtual Synchronous Generator Control for Parallel Inverters in Microgrids. IEEE Trans. Smart Grid 2017, 8, 2268–2277. [Google Scholar] [CrossRef]
- Kim, K.; Schaefer, R.C. Tuning a PID Controller for a Digital Excitation Control System. IEEE Trans. Ind. Appl. 2005, 41, 485–492. [Google Scholar] [CrossRef]
- Lee, H.-G. Development of Cost-Effective Redundant Digital Excitation Control System in Small Power Plants. Master’s Thesis, University of Seoul, Seoul, Korea, 2014; pp. 1–26. (In Korean). [Google Scholar]
- Godhwani, A.; Basler, M.J. A Digital Excitation Control System for Use on Brushless Excited Synchronous Generators. IEEE Trans. Energy Convers. 1996, 11, 616–620. [Google Scholar] [CrossRef]
- Kim, K.; Rao, P.; Burnworth, J.A. Self-Tuning of the PID Controller for a Digital Excitation Control System. IEEE Trans. Ind. Appl. 2010, 46, 1518–1524. [Google Scholar]
- Godhwani, A.; Basler, M.J.; Kim, K.; Eberly, T.W. Commissioning Experience with a Modern Digital Excitation System. IEEE Trans. Energy Convers. 1998, 13, 183–187. [Google Scholar] [CrossRef]
- Hingston, R.S.; Ham, P.A.; Green, N.J. Development of a Digital Excitation Control System. In Proceedings of the Fourth International Conference on Electrical Machines and Drives, London, UK, 13–15 September 1989. [Google Scholar]
- Machowski, J.; Bialek, J.W.; Robak, S.; Bumby, J.R. Excitation control system for use with synchronous generators. IEE Proc. Gener. Transm. Distrib. 1998, 145, 537–546. [Google Scholar] [CrossRef]
- Kim, K.; Basler, M.J.; Godhwani, A. Supplemental Control in a Modern Digital Excitation System. In Proceedings of the 2000 IEEE Power Engineering Society Winter Meeting, Singapore, 23–27 January 2000; Volume 1, pp. 1–4. [Google Scholar]
- Kanniah, J.; Malik, O.P.; Hope, G.S. Excitation Control of Synchronous Generators Using Adaptive Eegulators Part I—Theory and Simulation Results. IEEE Trans. Power Appar. Syst. 1984, 5, 897–903. [Google Scholar] [CrossRef]
- Yang, L.; Wang, J.; Ma, Y.; Wang, J.; Zhang, X.; Tolbert, L.M.; Wang, F.F.; Tomsovic, K. Three-Phase Power Converter-based Real-Time Synchronous Generator Emulation. IEEE Trans. Power Electron. 2017, 32, 1651–1665. [Google Scholar] [CrossRef]
- Zhao, H.; Yang, Q.; Zeng, H. Multi-Loop Virtual Synchronous Generator Control of Inverter-based DGs under Microgrid Dynamics. IET Gener. Transm. Distrib. 2017, 11, 795–803. [Google Scholar] [CrossRef]
- Serban, I.; Ion, C.P. Microgrid control based on a grid-forming inverter operating as virtual synchronous generator with enhanced dynamic response capability. Int. J. Electr. Power Energy Syst. 2017, 89, 94–105. [Google Scholar] [CrossRef]
- Nasiri, M.; Milimonfared, J.; Fathi, S.H. Modeling, analysis and comparison of TSR and OTC methods for MPPT and power smoothing in permanent magnet synchronous generator-based wind turbines. Energy Convers. Manag. 2014, 86, 892–900. [Google Scholar] [CrossRef]
- Lee, H.G.; Kim, H.S. A Method for Replacing Protective Relay at Kanudi Power Plant and Validation. In Advances in Computer Science and Ubiquitous Computing. Lecture Notes in Electrical Engineering; Springer: Singapore, 2017; Volume 474, pp. 143–148. [Google Scholar]
- Lee, H.G.; Kim, H.S. Implementation of Redundant Digital Excitation Control System Algorithm. In Advances in Computer Science and Ubiquitous Computing. Lecture Notes in Electrical Engineering; Springer: Singapore, 2017; Volume 474, pp. 131–136. [Google Scholar]
- Lee, H.G.; Kim, H.S. Cost-Effective Redundant Digital Excitation Control System. In Proceedings of the MUE 2017, Seoul, Korea, 22–24 May 2017; p. 1. [Google Scholar]
Figure 1.
General block diagram of an excitation system.

Figure 2.
Generator output voltage control method for direct current excitation system.

Figure 3.
Generator output voltage control method for alternating current rotary excitation system.

Figure 4.
Generator output voltage control method for static excitation system.

Figure 5.
Excitation system architecture.
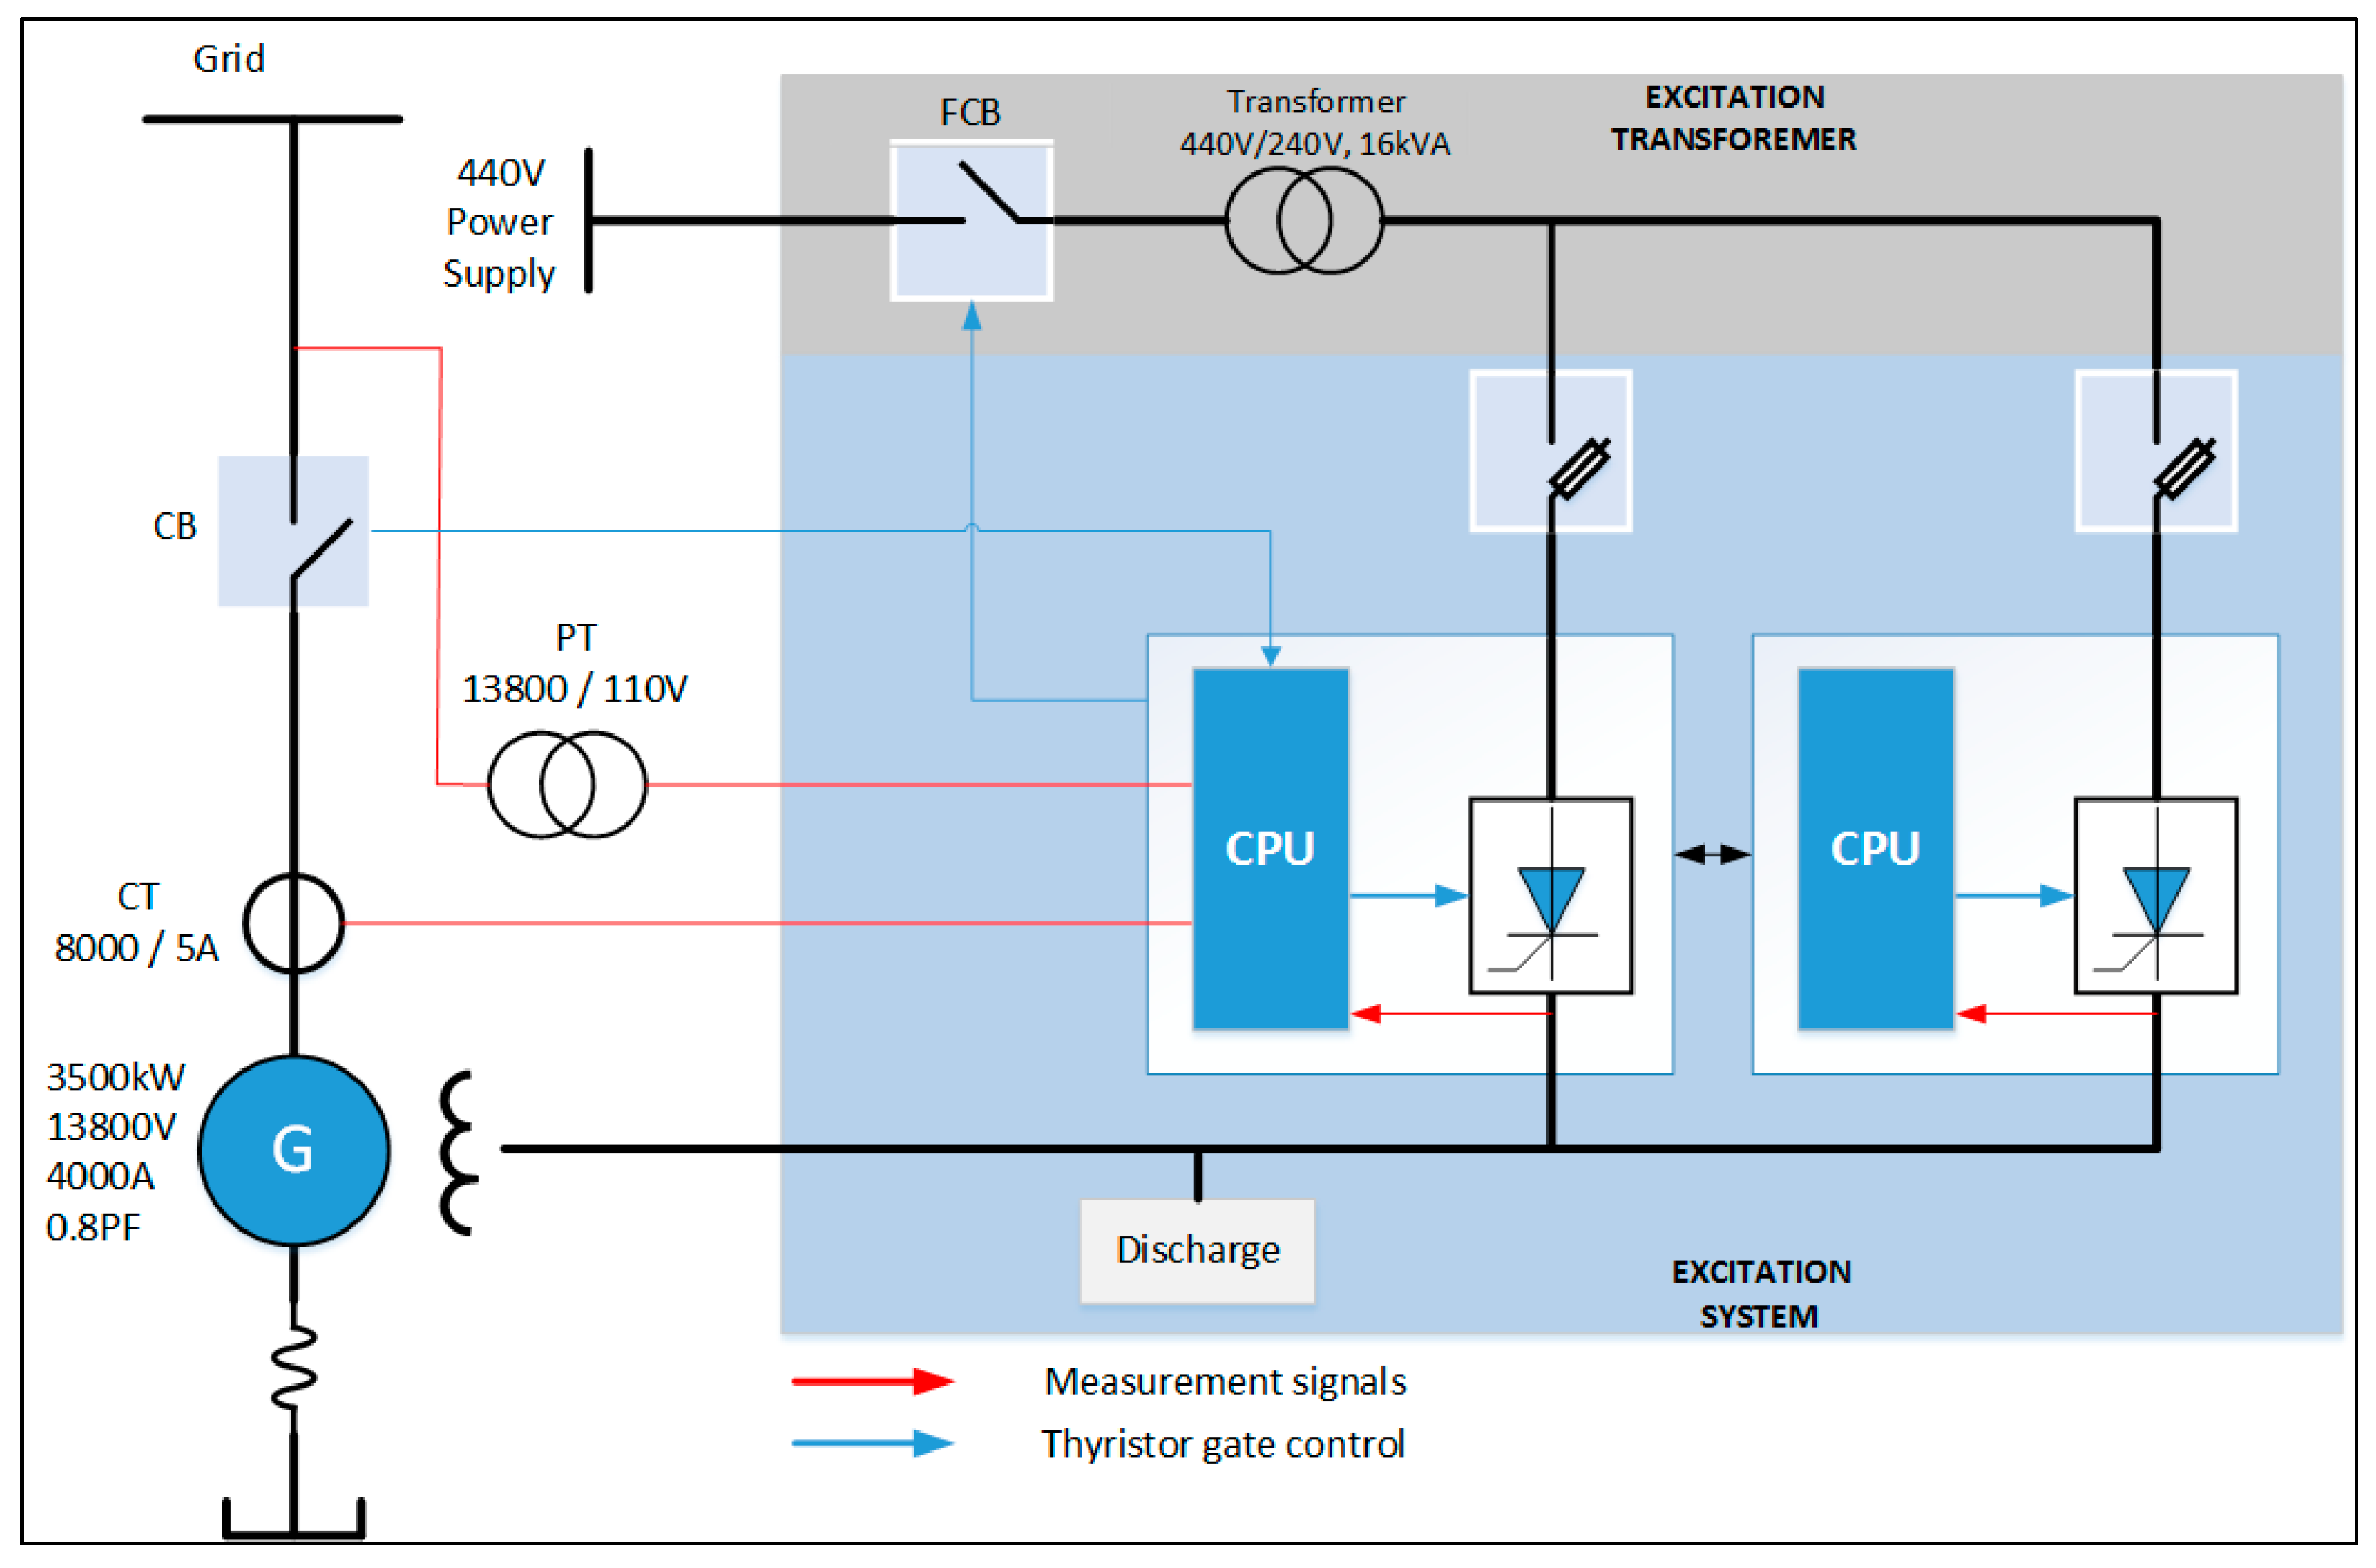
Figure 6.
Digital excitation system algorithm.

Figure 7.
System simulation circuit.

Figure 8.
OEL modeling.

Figure 9.
Without OEL (Over Excitation Limit) at −10% impact in grind.

Figure 10.
With OEL at −10% impact in grind.

Figure 11.
Comparison of results.

Figure 12.
UEL (Under Excitation Limit) modeling.

Figure 13.
Without UEL at −10% impact in grind.

Figure 14.
With UEL at −10% impact in grind.

Figure 15.
Comparison of results.

Figure 16.
The initial waveform of terminal voltage in auto mode (No-load state).

Figure 17.
The initial waveform of terminal voltage in manual mode (No-load state).

Figure 18.
Waveform resulting from 5% step-response test in auto mode (No-load state).

Figure 19.
Waveform resulting from the under-excitation limit test (loaded).

Figure 20.
V/Hz trip time curve.

Figure 21.
Over excitation trip time curve.

Figure 22.
A relay circuit.

Figure 23.
Assembling a test jig to test the relay.

Figure 24.
Testing equipment.

Figure 25.
Entering voltage and frequency.

Figure 26.
Relay testing.

Figure 27.
Normal operation of relay.

Figure 28.
Under voltage relay operation.

Figure 29.
Resetting under voltage relay.

Figure 30.
Operating under frequency relay.

Figure 31.
Resetting under frequency relay.

Figure 32.
The panel before installing the relay.

Figure 33.
The panel after installing the relay.
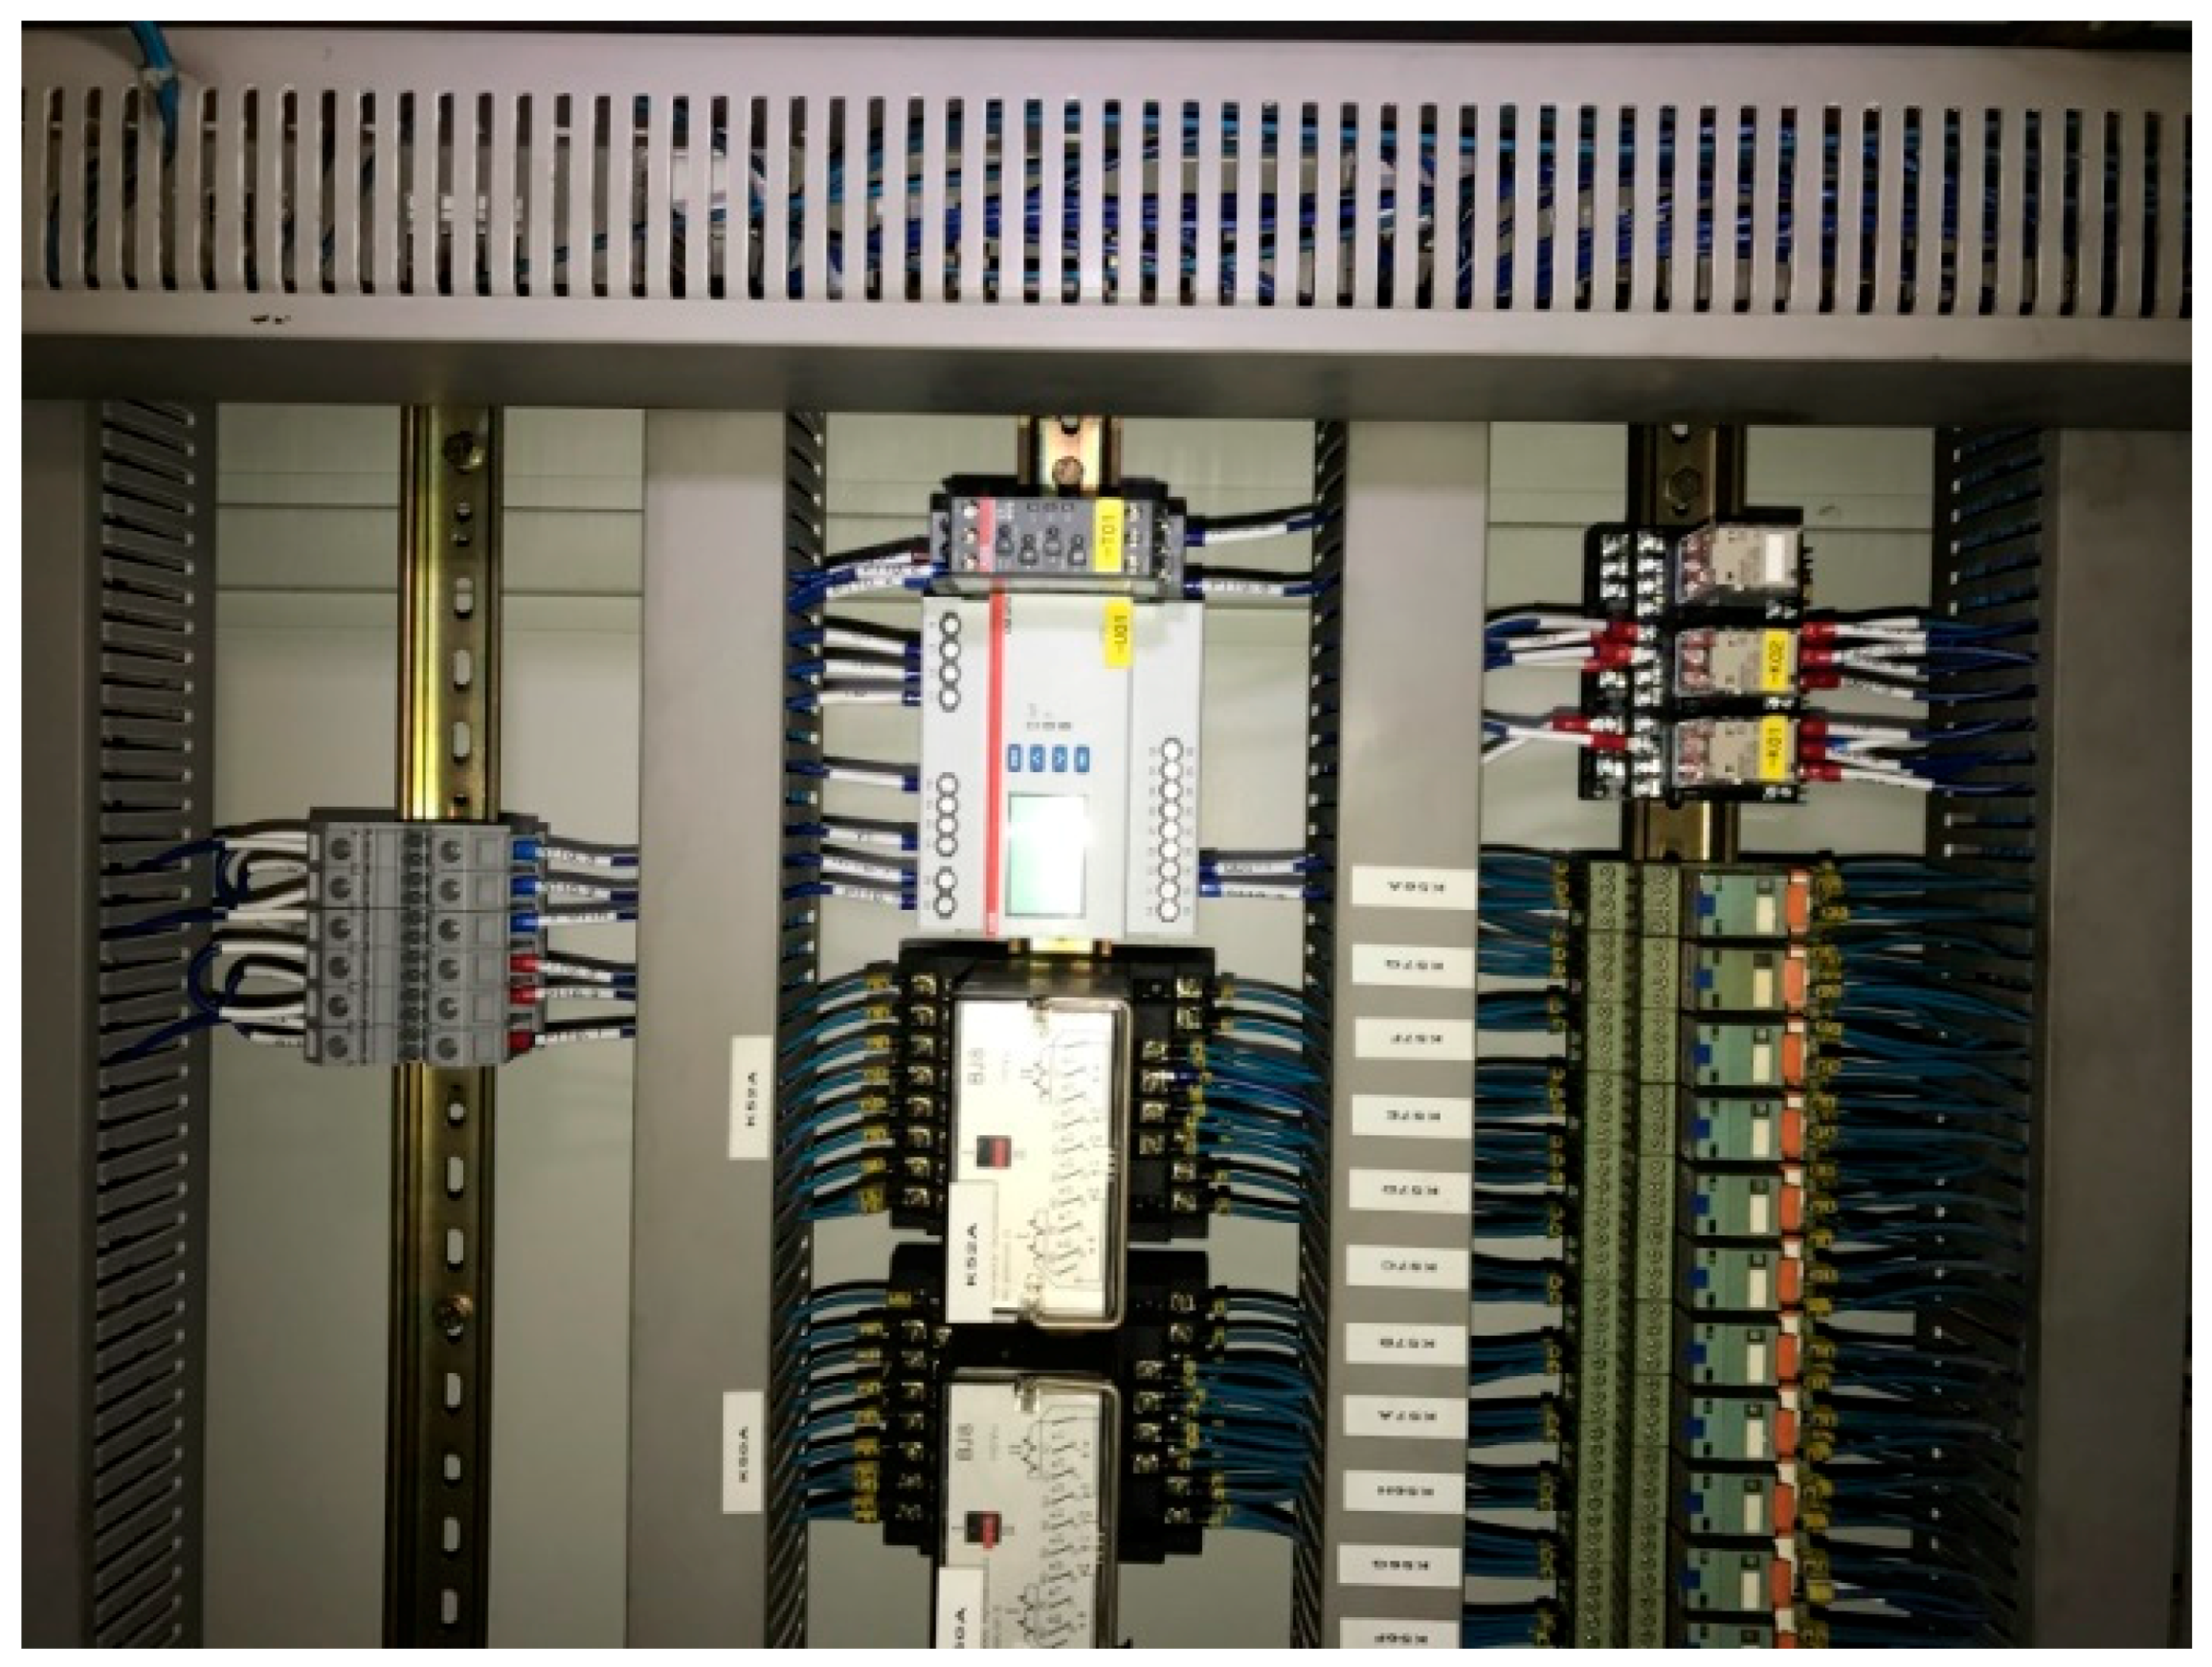
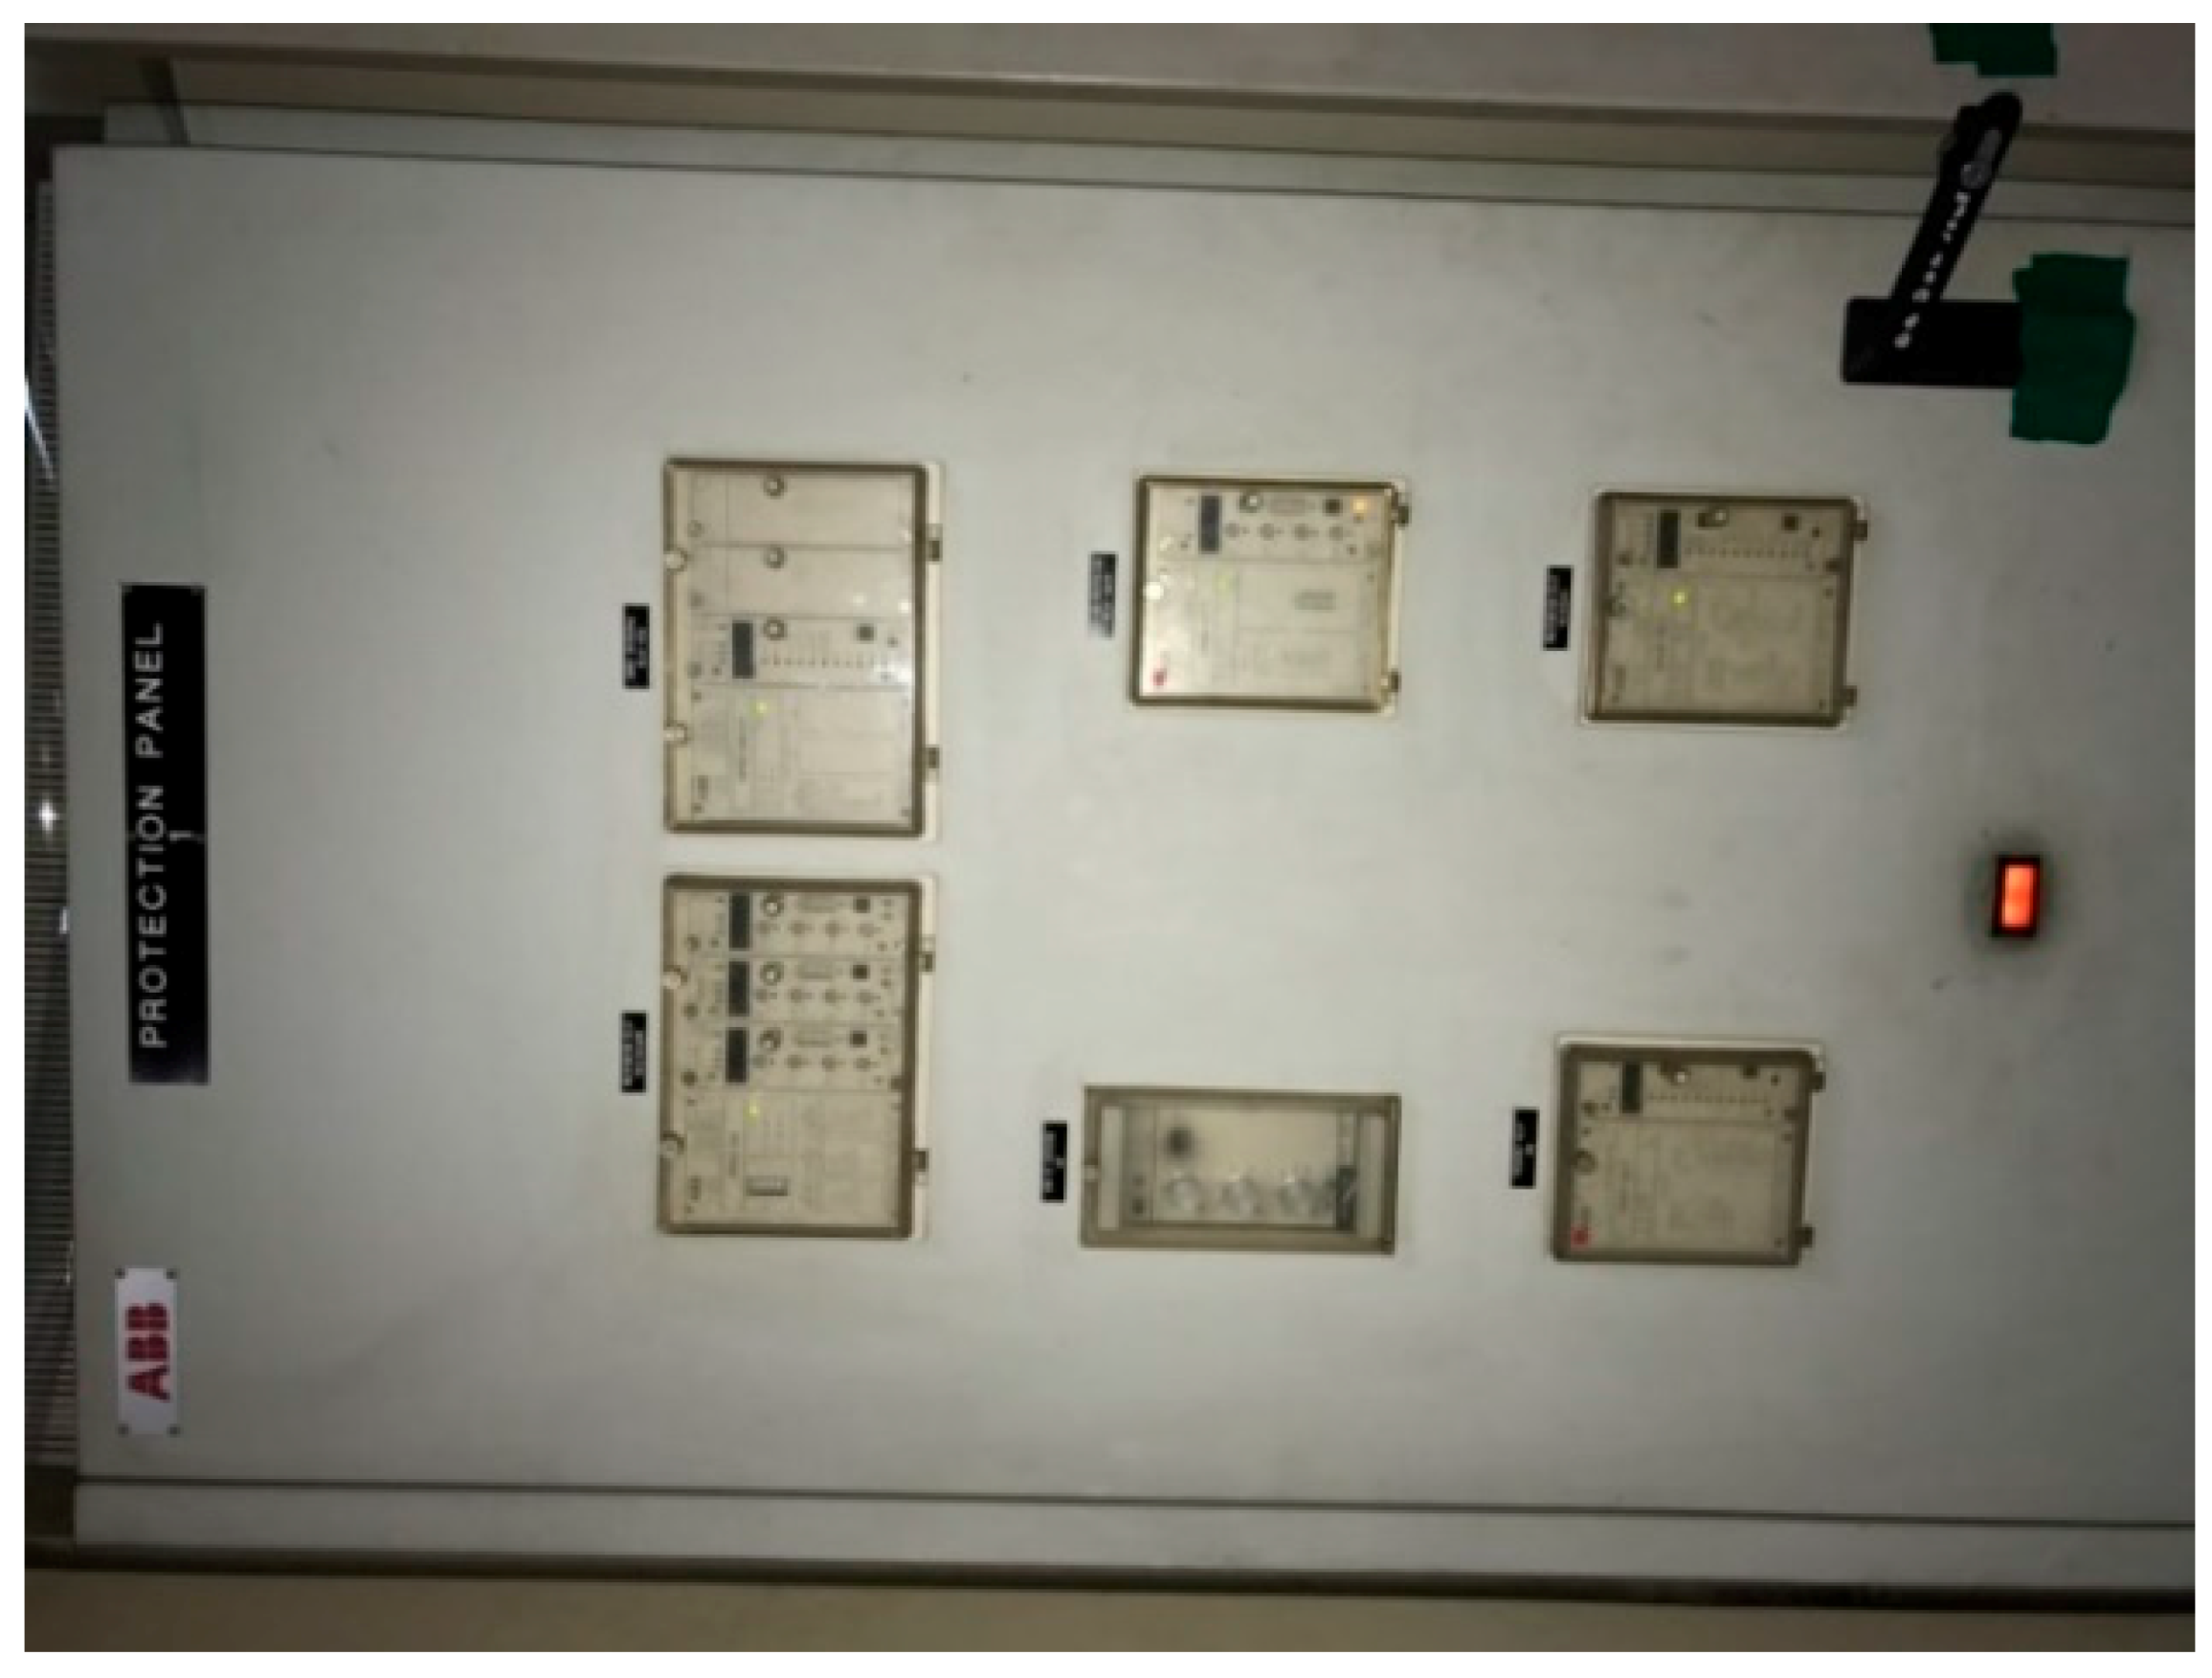
Figure 34.
Operation of protection panel.

Figure 35.
Operation of VCB panel.

Figure 36.
The Android-based environment monitoring application for an excitation system.

Figure 37.
The user interface pertaining to the application setting.


Table 1.
The specifications of a gas turbine at thermal power plant.
| Parameter | Value |
|---|---|
| Rated Capacity | 112,800 [KVA] |
| Rated Voltage and Frequency | 13,800 [V], 60 [Hz] |
| Field Voltage and Current | 300 [V], 900 [A] |
| Power Factor | 0.9 |
Table 2.
The specification of a gas turbine at the thermal power plant (1).
| Contents | Terminal Voltage | Frequency | Control Signal |
|---|---|---|---|
| Measurements | 13,785 V | 60 Hz | 1.337 [PU] |
| Contents | Field Current | Field Voltage | - |
| Measurements | 288 A | 66 V | - |
Table 3.
The specification of a gas turbine at the thermal power plant (2).
| Contents | Terminal Voltage | Frequency | Control Signal |
|---|---|---|---|
| Measurements | 12,637 V | 60 Hz | 1.335 [PU] |
| Contents | Field Current | Field Voltage | - |
| Measurements | 254 A | 59 V | - |
Table 4.
V/Hz set values.
| Description | P.U | Actual Value |
|---|---|---|
| Inverse Pickup 1 | 1.12 | Generator voltage: 15.45 kV |
| Inverse Pickup 2 | 1.18 | Generator voltage: 16.28 kV |
| Inverse Trip Time | 40 | - |
Table 5.
Set values for over-excitation.
| Description | P.U | Actual Value |
|---|---|---|
| Inverse Pickup 1 | 0.432 | Field Current: 635.4A |
| Inverse Pickup 2 | 0.45 | Field Current: 380.7A |
| Inverse Trip Time | 50 | - |
Table 6.
The specifications of a diesel combustion power station in Papua New Guinea.
| Parameter | Value |
|---|---|
| Rated Capacity | 16,087 [KVA] |
| Rated Voltage and Frequency | 11,000 [V], 50 [Hz] |
| Field Voltage and Current | 243 [V], 377 [A] |
| Power Factor | 0.8 |
© 2018 by the authors. Licensee MDPI, Basel, Switzerland. This article is an open access article distributed under the terms and conditions of the Creative Commons Attribution (CC BY) license (http://creativecommons.org/licenses/by/4.0/).
Share and Cite
MDPI and ACS Style
Lee, H.-G.; Huh, J.-H. A Cost-Effective Redundant Digital Excitation Control System and Test Bed Experiment for Safe Power Supply for Process Industry 4.0. Processes 2018, 6, 85. https://doi.org/10.3390/pr6070085
AMA Style
Lee H-G, Huh J-H. A Cost-Effective Redundant Digital Excitation Control System and Test Bed Experiment for Safe Power Supply for Process Industry 4.0. Processes. 2018; 6(7):85. https://doi.org/10.3390/pr6070085
Chicago/Turabian StyleLee, Hoon-Gi, and Jun-Ho Huh. 2018. "A Cost-Effective Redundant Digital Excitation Control System and Test Bed Experiment for Safe Power Supply for Process Industry 4.0" Processes 6, no. 7: 85. https://doi.org/10.3390/pr6070085
Note that from the first issue of 2016, this journal uses article numbers instead of page numbers. See further details here.