Article

Effects of Pulse Interval and Dosing Flux on Cells Varying the Relative Velocity of Micro Droplets and Culture Solution

1
School of Mechanical Engineering and Automation, Northeastern University, Shenyang 110819, China
2
Department of Oncology, Tongji Hospital, Tongji Medical College, Huazhong University of Science and Technology, Wuhan 430030, China
*
Authors to whom correspondence should be addressed.
Processes 2018, 6(8), 119; https://doi.org/10.3390/pr6080119
Submission received: 28 June 2018 / Revised: 2 August 2018 / Accepted: 3 August 2018 / Published: 7 August 2018
(This article belongs to the Special Issue Transport of Fluids in Nanoporous Materials)

Abstract

:
Microdroplet dosing to cell on a chip could meet the demand of narrow diffusion distance, controllable pulse dosing and less impact to cells. In this work, we studied the diffusion process of microdroplet cell pulse dosing in the three-layer sandwich structure of PDMS (polydimethylsiloxane)/PCTE (polycarbonate) microporous membrane/PDMS chip. The mathematical model is established to solve the diffusion process and the process of rhodamine transfer to micro-traps is simulated. The rhodamine mass fraction distribution, pressure field and velocity field around the microdroplet and cell surfaces are analyzed for further study of interdiffusion and convective diffusion effect. The cell pulse dosing time and drug delivery efficiency could be controlled by adjusting microdroplet and culture solution velocity without impairing cells at micro-traps. Furthermore, the accuracy and controllability of the cell dosing pulse time and maximum drug mass fraction on cell surfaces are achieved and the drug effect on cells could be analyzed more precisely especially for neuron cell dosing.

Graphical Abstract

1. Introduction

Microfluidic chip can achieve the basic function of macroscopic laboratory by manipulating the flow at the micro scale. The use of microfluidic chip for chemical analysis, drug screening and transportation, cell culture and other functions by means of microfluidic control is regarded as the miniaturization and integration of macroscopic laboratories [1,2,3,4], which has advantages as follows: (1) controllable liquid flow; (2) rare consumption of samples and reagents; (3) analysis process automation; (4) significant increased analysis efficiency [5]. In the aspect of cell culture, the microfluidic chip cell laboratory has micron-level and relatively closed three-dimensional cell culture, sorting, cracking and other operating units, which plays a unique role in cell research [6,7]. For cell dosing, the latest fourth-generation targeted dosing system can concentrate the drug to the target cell or the target tissue, which accumulates the drug in a small range to realize the improvement of therapeutic effect yet reducing the drug side-effect [8,9]. Therefore, many researchers have been focused on the application of microfluidic chip in cell dosing system. The first invented microchip based on electrochemical dissolution microcapsule experimentally demonstrated the release of drug [10]. A multilayer polymer drug handling facility was designed for oral dosing of treatment and provided a variety of unidirectional release treatments, the concentration of drug into the intestinal epithelial cells was more than 10 times that of the conventional method [11]. Three-dimensional tissue platform based on a microfluidic chip can be used to diagnose and quantify cellular heterogeneity [12]. Integrated microfluidic chip platform can simulate the microenvironment of the blood-brain barrier and glioma in vivo and conduct drug penetration experiments [13].
The conventional cell dosing methods on a chip often inject drug solution into microfluidic chip directly or use two-phase fluid in the microchannel through the semi-permeable membrane to realize drug diffusion [14,15,16,17,18]. The drug was wasted a lot and the precision was low for the former and it was difficult to control drug distribution for the latter. So, the jet microfluidic was used to dose cell and the control precision was improved, both the consumption of drug and the dosing time were reduced [19,20,21,22,
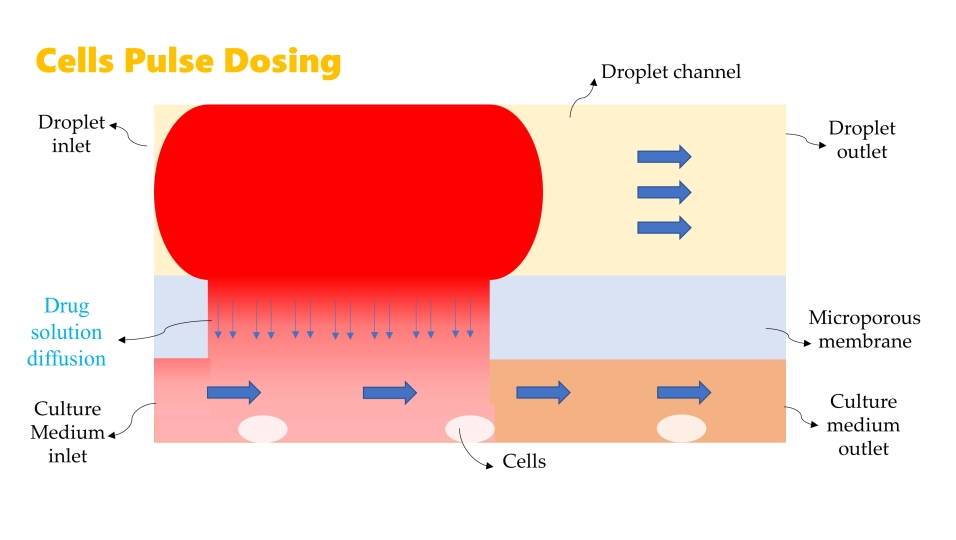
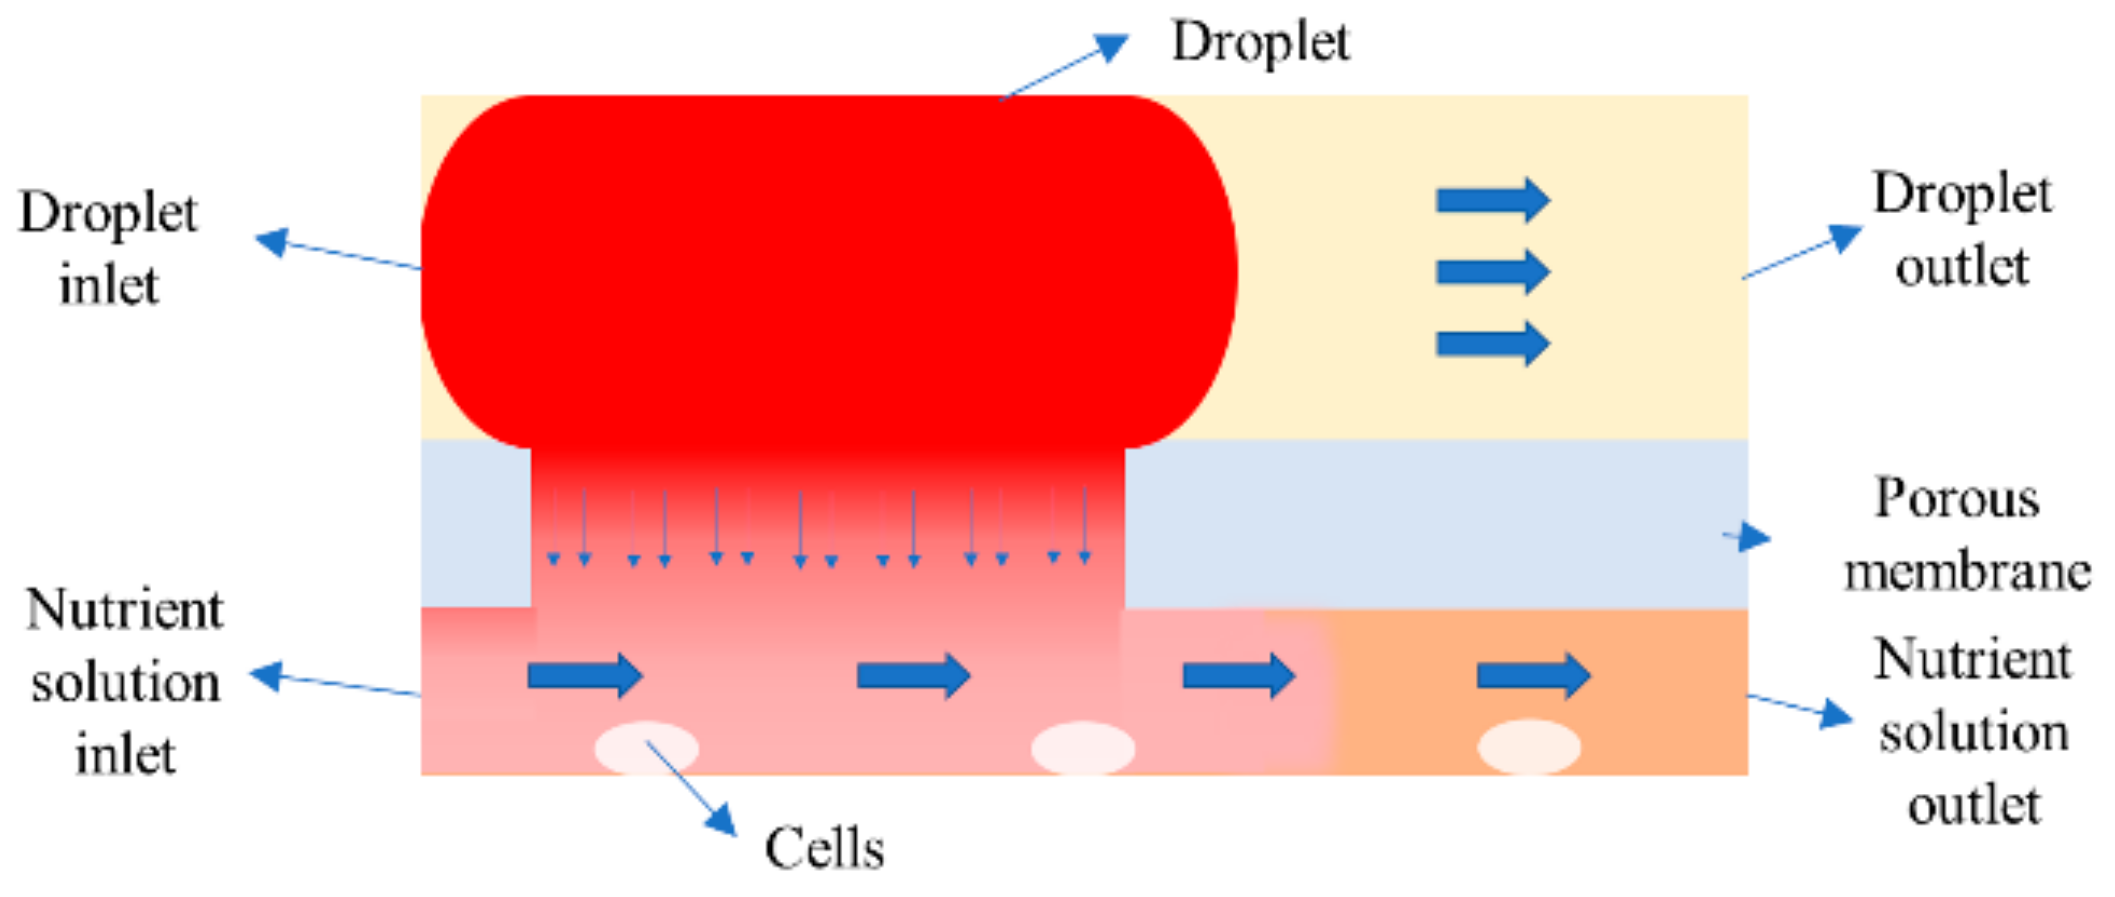
23]. But the dosing pressure towards to cell was quite tough, which may impair cell severely and the dosing time was difficult to control. For overcoming these dosing problems, the microporous membrane is used to support drug microdroplets flowing and buffer the diffusion, the microdroplets velocity is controlled to adjust dosing time. Considering that polydimethylsiloxane (PDMS) has good biocompatibility, high transparence and is permeable to water and CO2 and polycarbonate (PCTE) etching membrane also has good biocompatibility, high transparence and impact resistance, customizable micropore diameter and porosity, a novel three-layer sandwich structure of PDMS/PCTE microporous membrane/PDMS chip was designed, which supports microdroplets flow in the microchannel upon membrane, the drug carried in microdroplets could diffuse through microporous membrane into cells trapped at micro-traps. Precise pulse dosing to cells could be achieved by controlling the flow of microdroplets and culture solution. Researching the drug transfer process in this novel device is necessary for supporting the control method for cell pulse dosing. It is known that the mass transfer between deionized water droplets and continuous phases octanol can be observed that there is a vortex on the surface of the microdroplets [24] and the solute transfer at the instantaneous two-phase interface is proportional to the square of the time [25]. The drug diffusion to cells through microporous membrane from microdroplet surround by oil is influenced by these factors, especially the mechanism of mass transfer through membrane in fluid. The hydrophilic nanoporous membrane does not exhibit any pore wetting because of the dramatically increased shear viscous force of water with respect to the hydrophilic pore wall [26]. The surface tension of water decreases with the decreasing of film thickness on the surface of aqueous nano-films [27]. More investigations about drug diffusion through membrane could be expanded and more deeply discussed based on these achievements.
In current study, we studied the convective diffusion process of microdroplet cell dosing in the three-layer sandwich structure of PDMS/PCTE microporous membrane/PDMS chip. The flow velocities of microdroplets and culture medium were investigated for the convenience of studying and controlling the cells dosing pulse time ignoring other factors influence. Although the microdroplets size or surface chemical complexity and so forth also influence the diffusive dosing process. But it is not convenient to control the pulse time in drug experiments by change the microdroplets size or surface chemical character. The mathematical model was established to solve the convective diffusion process and the process of drug transfer to micro-traps was simulated. The drug concentration, convective diffusion time, pressure field and velocity field around micro-traps were analyzed. The applicability of microdroplet micropore diffusion for cell dosing was further promoted, which contributes more controllable instant pulse dosing time and flux to cells while less impact to cells.

2. Computational Model

2.1. Mathematical Model

The micropore is considered as cuboid and simplified as a one-dimensional model ignoring the influence of cuboid length as Figure 1a, which means drug convection diffusion from source to the other side directly. A rectangular coordinate system is set on the section of the model as Figure 1b. The fluid is considered incompressible and isotropic ignoring temperature changes.
The concentration diffusion is distributed by Fick’s second law during unsteady transmission when ignoring convection, which means that the change rate of mole concentration C in the cross-section x is equal to the change rate of diffusion flux by x.
C t = x ( D C x )
Due to the velocity along the Y direction in micropore which means convection term, the equation is altered:
C ( x , t ) t + v C ( x , t ) x = D 2 C ( x , t ) x 2 )
where C is mole concentration of diffusate, V is convection coefficient, D is diffusion coefficient, t is diffusion time.
The generalized equation of convective diffusion is modified for calculation:
C ( x , t ) t = a C ( x , t ) x + b 2 2 C ( x , t ) x 2
The boundary between diffusion source and microchannel is free diffusion boundary, the wall below microchannel is the boundary without mass and energy exchange. The upper and lower boundaries satisfy the first boundary condition and the second boundary condition and the math equation is shown:
{ C ( 0 , t ) = C 0 , t 0 C ( δ , t ) = 0 , t 0
C ( 0 , t ) x = 0 ,   t 0
C ( δ , t ) x = 0 ,   t 0
The initial concentration in microchannel is constant:
C ( x , 0 ) = C 0 ,   0 < x δ
The fundamental equation is equivalently transformed for the convenience to solve the problem and the new function L(x, t) is introduced:
C ( x , t ) = L ( x , t ) e a 2 b 2 x a 2 4 b 2 t
Separating variables is the fundamental method to solve the mathematical physical equation, which transforms the multi-variable partial differential equation to ordinary differential equation with several univariates:
L ( x , t ) = H ( x ) K ( t )
The fundamental equation is shown:
b 2 K ( t ) 2 H ( x ) x = H ( x ) K ( t ) t 1 H ( x ) 2 H ( x ) x = 1 b 2 K ( t ) K ( t ) t H ( x ) H ( x ) = K ( t ) b 2 K ( t )
The t and x are separately independent variables, so the equation is established when they are constant. The equation is shown assuming the separation constant as −λ2:
H ( x ) H ( x ) = K ( t ) b 2 K ( t ) = λ 2
The equation is obtained by substituting boundary conditions:
{ H ( 0 ) K ( t ) = L 0 e a 2 4 b 2 H ( 0 ) K ( t ) = a 2 2 b 2 L 0 e a 2 4 b 2
The eigenvalue constant λ2 must be obtained by the boundary conditions, otherwise the fundamental equation would have no non-zero solution. The eigenvalue is discussed as below.
Firstly, assuming that:
H ( x ) = e γ x
If λ2 = 0, the general solution is shown:
H ( x ) = ( c 1 + c 2 x ) e 0 x
Substituting boundary conditions, the eigenvalue is obtained:
λ 2 = ( π 2 + n π δ ) 2 ,   n = 0 , 1 , 2 , 3
The general solution of K(t) is obtained by solving the total differential equation:
K n ( x ) = c 1 e b 2 [ ( n + 1 2 ) π δ ] 2 t , n = 0 , 1 , 2 , 3
Assuming that:
φ ( x , t ) = sin [ ( n + 1 2 ) π δ x ] e b 2 [ ( n + 1 2 ) π δ ] 2 t
The solution of C (x, t) is shown:
C ( x , t ) = 2 L 0 0 1 a 2 δ 4 b 4 + ( n + 1 ) 2 π 2 δ [ 1 δ a ( 2 n + 1 ) π b 2 e a δ 2 b 2 sin ( n + 1 2 ) π ] · φ ( x , t ) e a 2 b 2 x a 2 4 b 2 t

2.2. Numerical Simulation

The microdroplet dosing chip model was established and numbered as Figure 2. The simulation zone is a part of the chip with the overall size of 350 μm in length, 150 μm in width, 90 μm in height, which consists of microdroplet channel, microporous membrane and micro-traps array considering the repeatability of the whole structure. A microdroplet channel is 350 μm long, 150 μm wide and 50 μm high. A microporous membrane is 350 μm long, 200 μm wide and 20 μm thick. A double-slit micro-trap array zone is 350 μm long, 200 μm wide and 20 μm high, which contains 7 micro-traps and every double-slit micro-trap is 50 μm long, 50 μm wide and 20 μm high. The material of microdroplet channel and micro-traps is PDMS and the material of microporous membrane is PCTE.
The diffusion process of rhodamine solution microdroplet from droplet channel to cells through microporous membrane is shown as Figure 3. In this study, we focused on controlling the drug delivery process by changing fluids velocity, so the rhodamine concentration effects were neglected for controlling variate. It is applicable in multi drug solution microdroplets dosing experiments and the evaluation accuracy under specific conditions could be further improved by adding relevant initial drug concentration. The rhodamine solution microdroplet is regarded as a component, considering the self-diffusion, inter-diffusion and convection diffusion in microdroplet and culture medium. This microfluidic system promotes the microdroplet diffusion in culture medium mainly by natural convection and especially the effect of forced convection. The rhodamine spread phenomenon in culture medium is regarded as the characterization of rhodamine molecular diffusion effect. The microdroplet is surrounded by oil and flows from inlet to outlet with oil in droplet channel upon microporous membrane. In the meanwhile, the culture medium is flowing from inlet to outlet in micro-traps channel. The rhodamine solution diffuses from microdroplet into culture medium through microporous membrane. The cell surface maximum rhodamine mass fraction and pulse time are controlled by changing the culture medium velocity and microdroplet relative velocity.
In the microfluidic system, fluid is laminar and is mainly influenced by capillary force. Capillary force is represented by dimensionless number Ca. Ca = μU/γ, where γ is the surface tension coefficient between the two phases, μ and U is the fluid viscosity and velocity of the continuous phase respectively.
In this paper, the volume of fluid method and the transport of species transport without chemical reaction method was used to simulate the dynamics of microdroplet dosing to cells trapped at micro-traps in 3-D microfluidic chip. Water and oil were chosen as dispersed phase and continuous phase respectively. The fluids were modeled as incompressible Newtonian flow. The continuity equation and momentum equation were used in the application mode.
∇∙u = 0
ρ du/dt = F − ∇p + ∇2u
where P, u, ρ and μ is pressure, velocity field, the volume-fraction-weighted density and viscosity respectively. F is the surface tension force which needs special treatment to be computed.
The Young–Laplace equation was used to obtain the contact angle of silicon oil-water on PDMS. The surface tension of silicon oil-water system was taken as 42.6 mN/m [28], the air-silicon oil system as 20.8 mN/m (provided by the silicon oil manufacturer Dow Corning), the air-water system as 72.1 mN/m and the contact angle for air-silicon oil system was taken as 15° [29], the air-water system as 98° [29]. The contact angle of oil-water system in these simulations was obtained as 135° [29]. The contact angle of oil-water on PCTE is not necessary to be calculated, because the capillary force between microdroplet and culture solution would impact the shape of microdroplet apparently.
Numerical simulations were performed in the boundary condition with Qwater ≤ Qoil ≤ 60 μL/min or Uwater ≤ Uoil ≤ 0.1 m/s according to our former experiments [29]. The interface tension between the two phases was taken as 0.06 N/m, because the microdroplet fully fills the microchannel so as to cling to microporous membrane to prompt convective diffusion. The culture medium was blended by RPMI 1640, Fatal bovine serum, Penicillin-Streptomycin Solution, dextran and so forth were all purchased from Sangon Biotech Co., Ltd. (Shanghai, China), and the dynamic viscosity was measured by PND401a intelligent Kinematic viscosity testers, Puruite Instrument, Jilin, China. The velocity field around cells, static pressure and mass fraction of rhodamine B on cell surface were monitored every 0.5 ms. The simulation parameters are set as Table 1.

3. Results and Discussion

3.1. Area-Weighted Rhodamine Mass Fraction on Cell Surfaces

The advantages of microdroplet dosing to cell on a chip is tiny waste of drug, controllable pulse dosing and less impact to cell. So, the area-weighted mass fraction on cell surfaces that describes the rhodamine molecules mass reaching cell surfaces, the method for controlling pulse time and the impact on cells especially about cell surfaces pressure are significant parameters in this microfluidic system. More rhodamine mass fraction on cell surfaces, more mild pressure impact on cell surfaces and less pulse dosing time would contribute better cell pulse dosing effect.
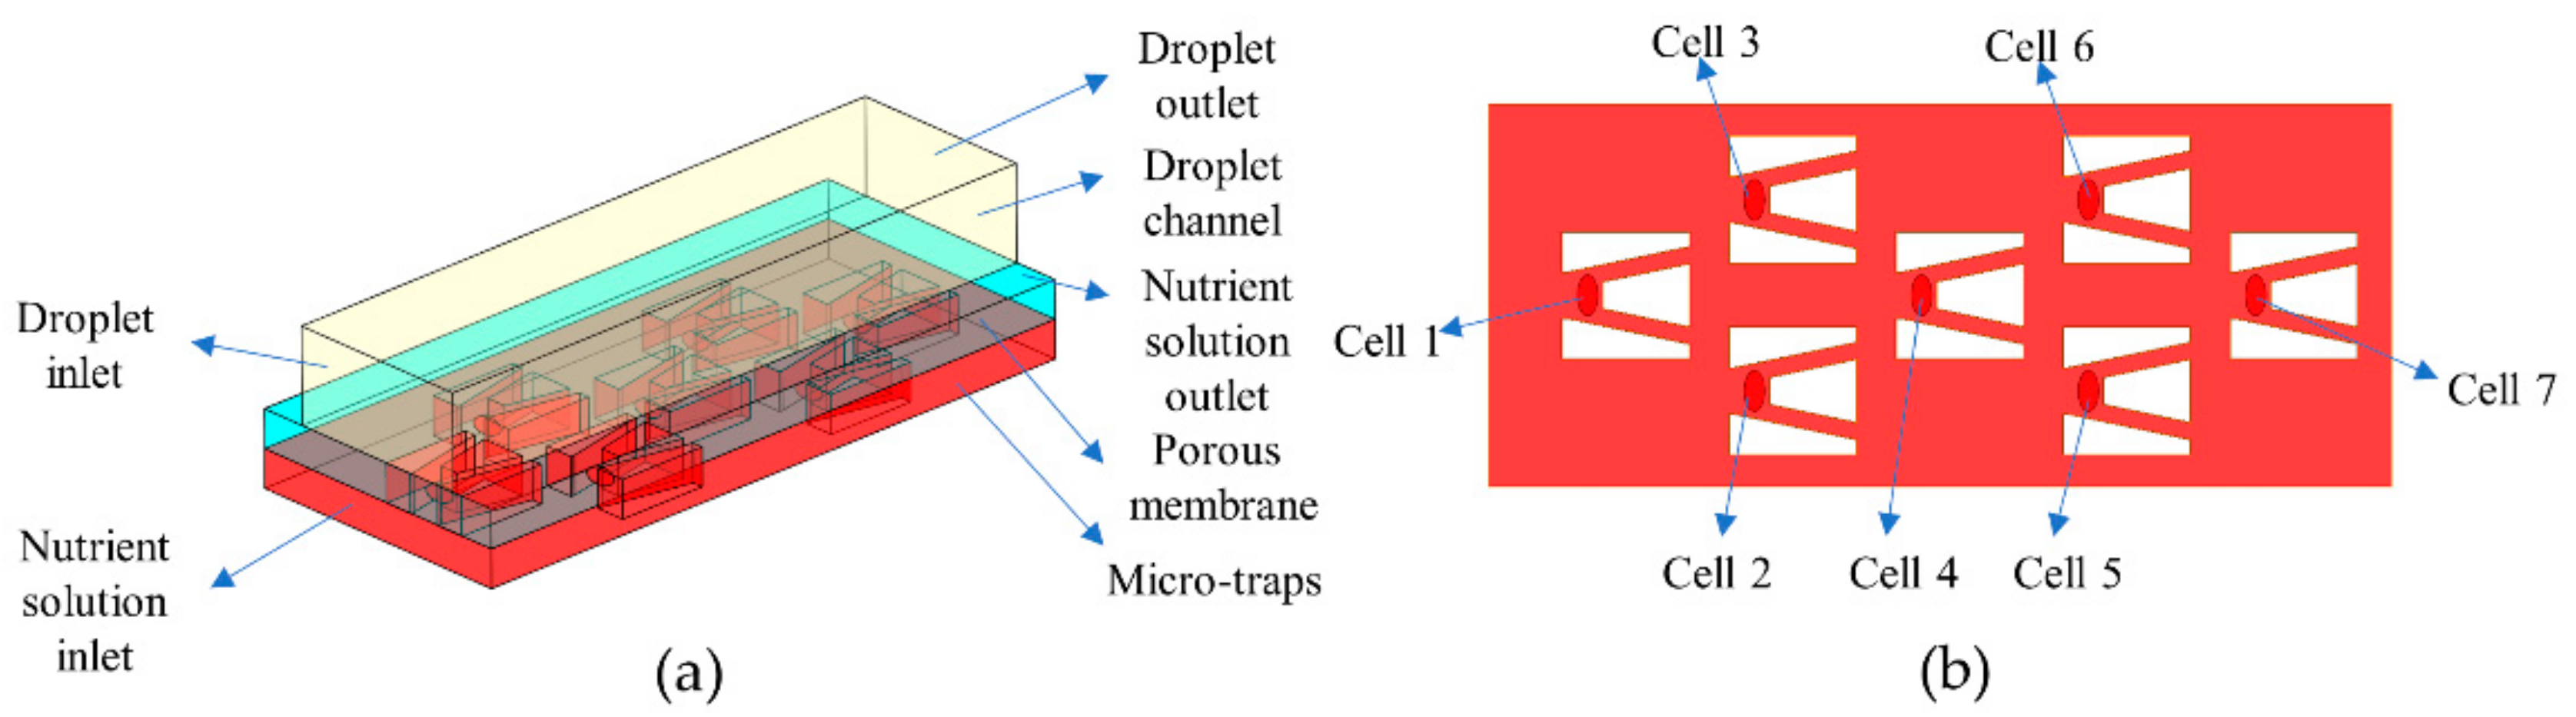
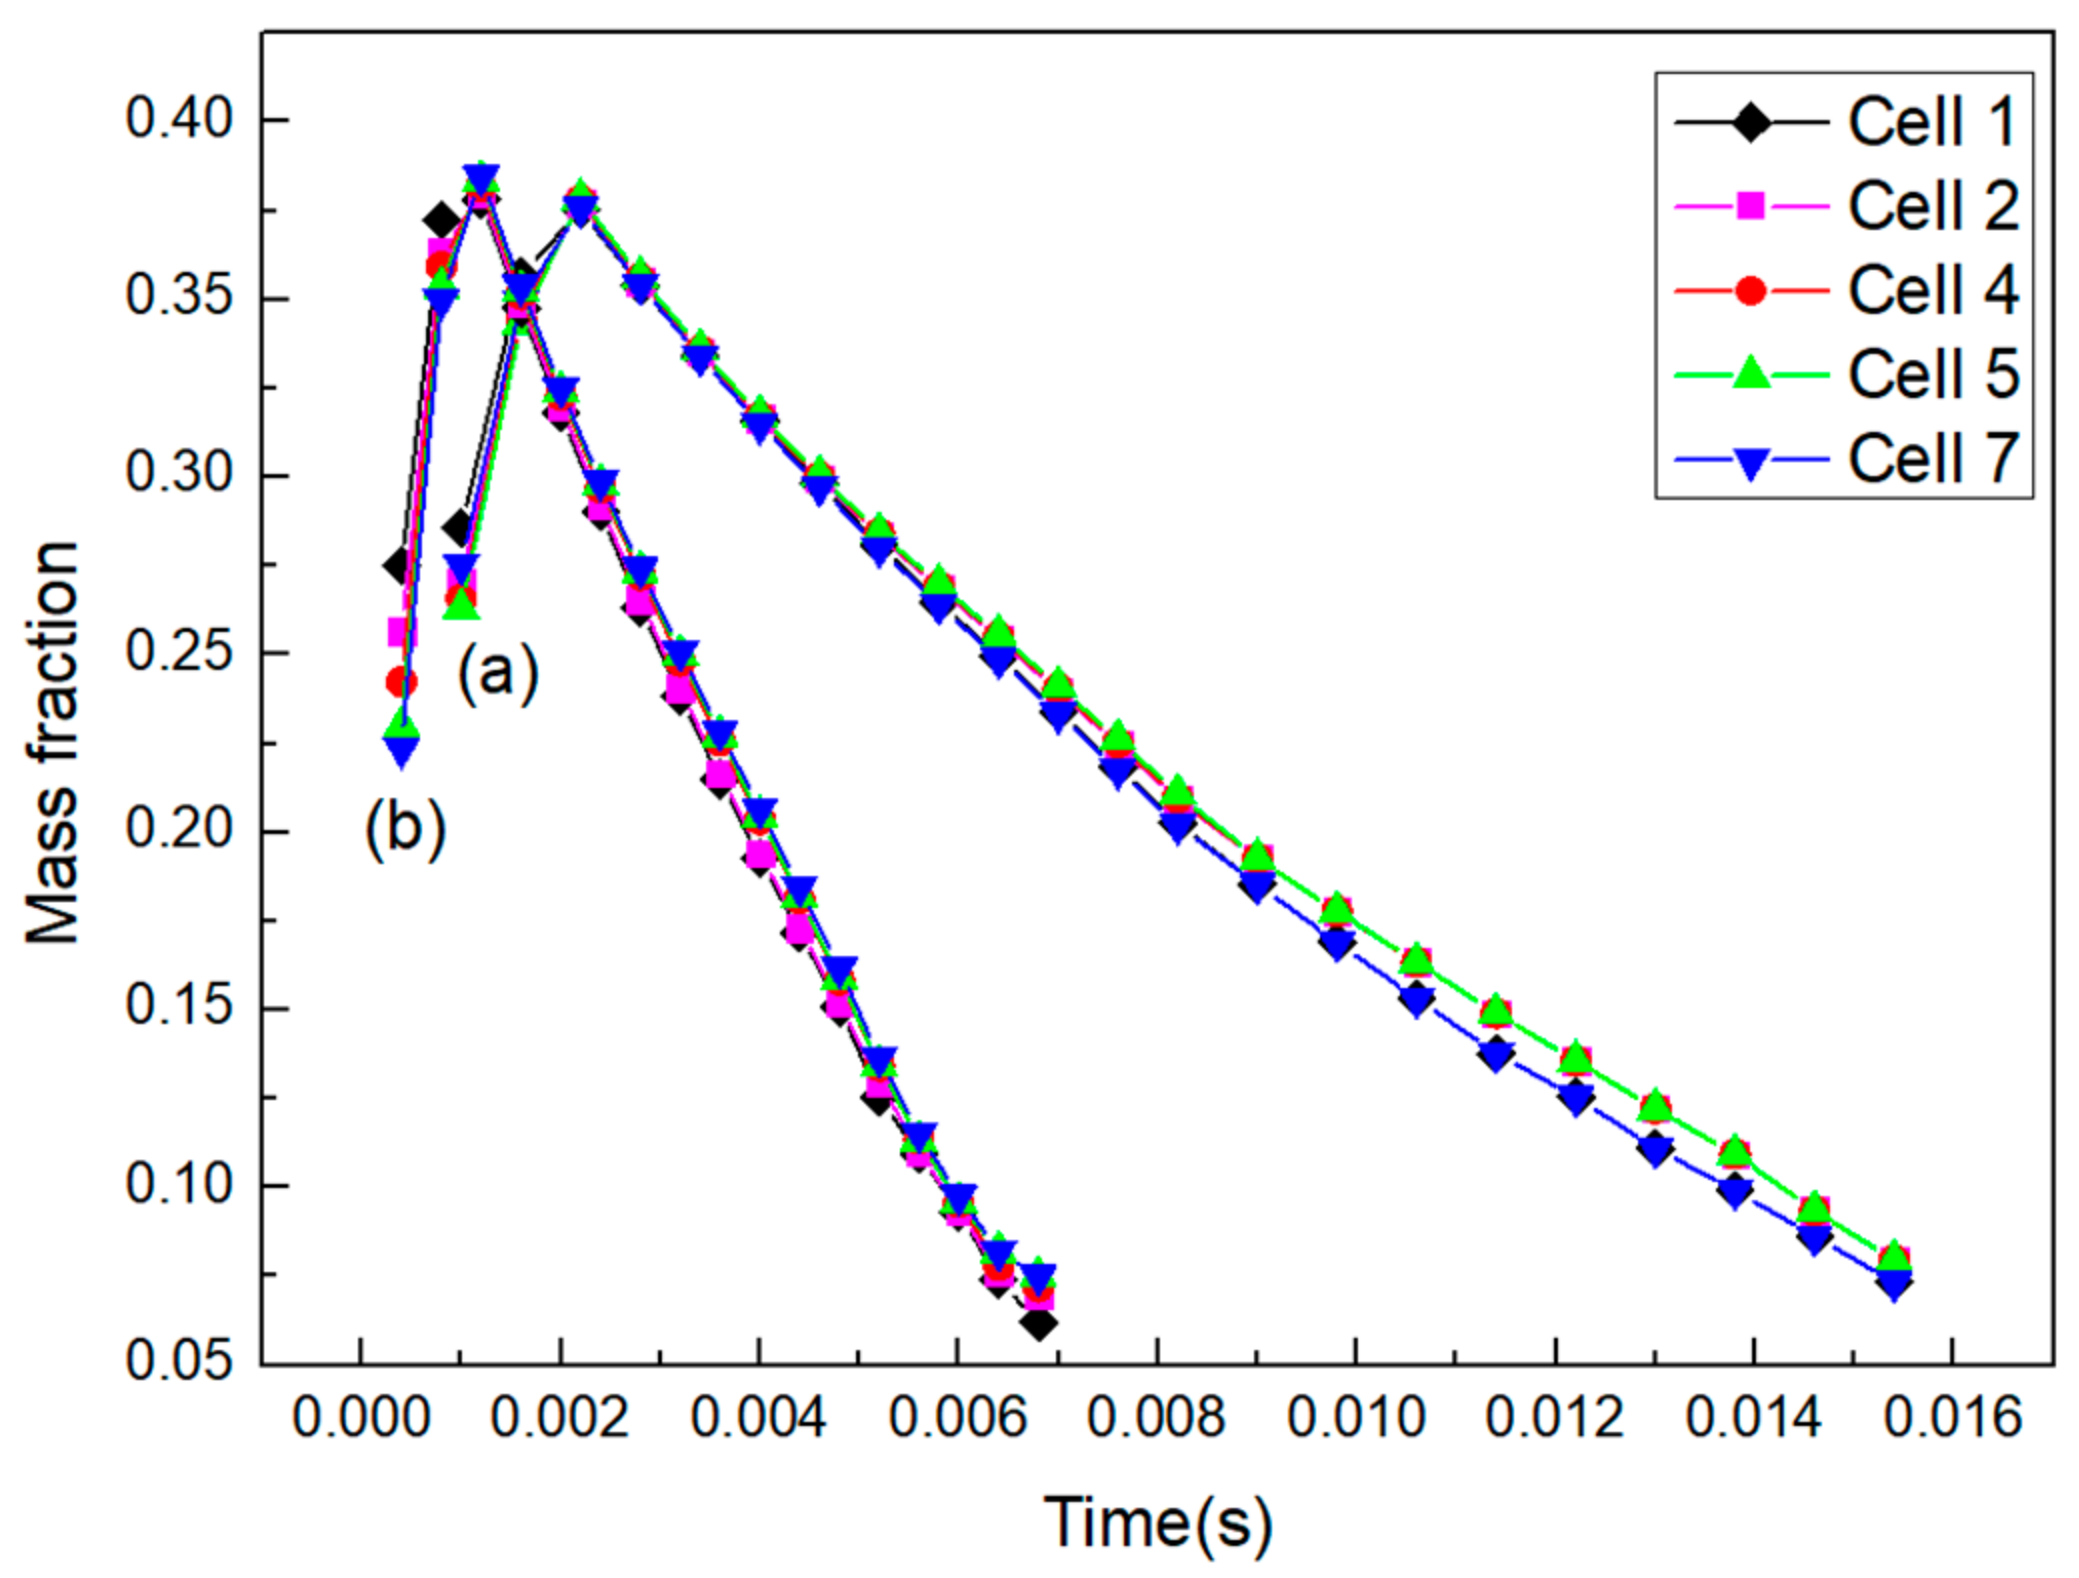
The rhodamine mass fraction profiles at Cell 1–7 cell surfaces except at Cell 3 and Cell 6 cells are shown as Figure 4, because Cell 3 and Cell 6 cells are symmetric along the plane at middle of micro-traps perpendicular to Y axis with Cell 4 and Cell 5 cells. The diffusion effect is uniform and the maximum rhodamine mass fraction is invariable when fluid velocities in droplet channel and culture solution channel are same. The maximum rhodamine mass fraction on Cell 1–7 cell surfaces is 0.38 and all cells have attained it. It is obvious that the maximum rhodamine mass frication on cell surfaces is independent with velocity change when microdroplet velocity is equal to culture solution velocity.
As the rhodamine molecules last Brownian motion, they would collide with other molecules. The rhodamine molecules would keep a certain speed and would move a distance after the collision at certain moments causing self-diffusion [30]. The multi-component inter-diffusion happens when concentration gradient exists in mixture, rhodamine molecules diffuse to culture solution while culture solution diffuses to droplet. But in this dosing system, there are convective diffusion and capillary force particularly influencing the rhodamine transport process besides self-diffusion and inter-diffusion. These factors play different important roles as the microdroplet and culture solution inlet velocity change.
More drug delivery efficiency could be realized by controlling the relative velocity of microdroplet to culture solution. The maximum mass fraction at cell surfaces when the relative velocity of microdroplet to culture solution changes from 0–0.09 m/s is shown as Figure 5. As culture solution velocity is 0.01 m/s, the maximum mass fraction at cell surfaces improved with the increase of the relative velocity of microdroplet and it almost all exceeds 0.5 when relative velocity is 0.03 m/s but the maximum mass fraction decreases gradually when relative velocity exceeds 0.03 m/s.
The trend of convective diffusion of rhodamine from microdroplet to culture solution was aroused by the flow of high velocity fluid to low velocity fluid zone and was enhanced gradually when the relative velocity of microdroplet increased. However, large difference between fluid velocities also promotes impacts of oil on membrane and microdroplet, a little two phases mixing caused by a part of oil break the surface tension between water phase and oil phase. The vortex between microdroplet and culture solution caused by the relative velocity was aggravated, so the mass diffusion was hindered [31]. Thus, the rhodamine convective diffusion is weakened when the vortex and mix effect are stronger as microdroplets flow velocity increases.

3.2. Pulse Time

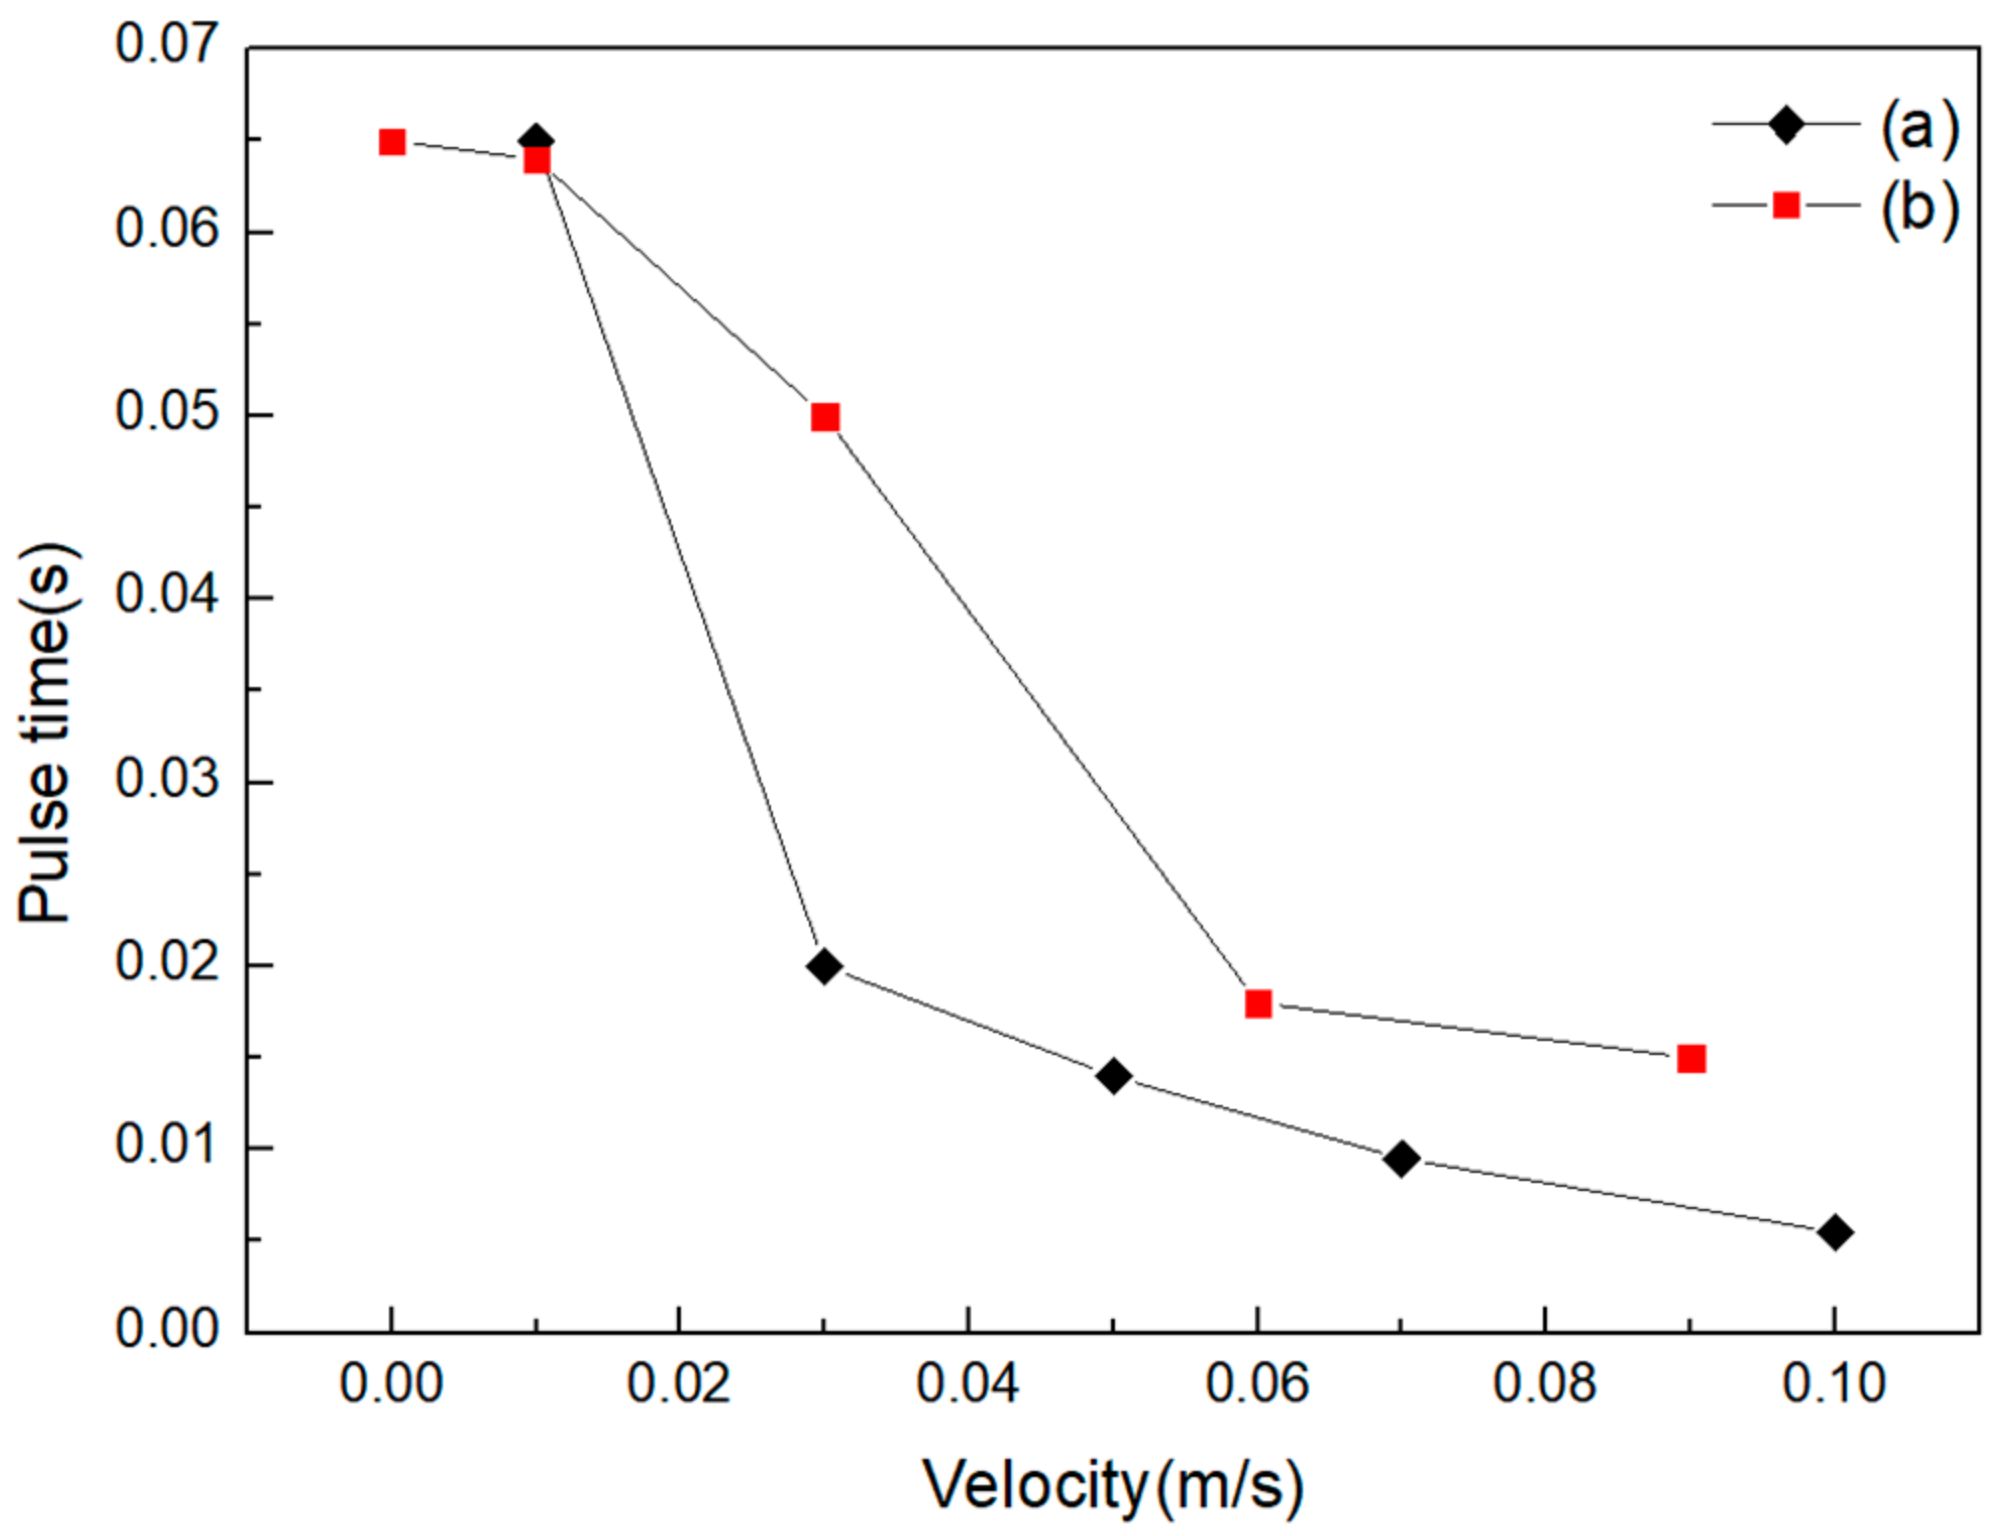
Controllable and instant pulse drug delivery is the most advantage of this microfluidic chip. The time is assumed as effective dosing time when the rhodamine solution mass fraction at cell surfaces is larger than 0.01. The drug delivery pulse time changing with microdroplet and culture solution inlet velocity is shown as Figure 6. The pulse time decreases rapidly as all fluids inlet velocity increases to 0.03 m/s but then decreases slowly when culture solution inlet velocity is over 0.03 m/s. The pulse time decreases rapidly when the relative velocity of microdroplet to culture solution varies from 0.01 m/s to 0.06 m/s but decreases slightly under other relative velocities.
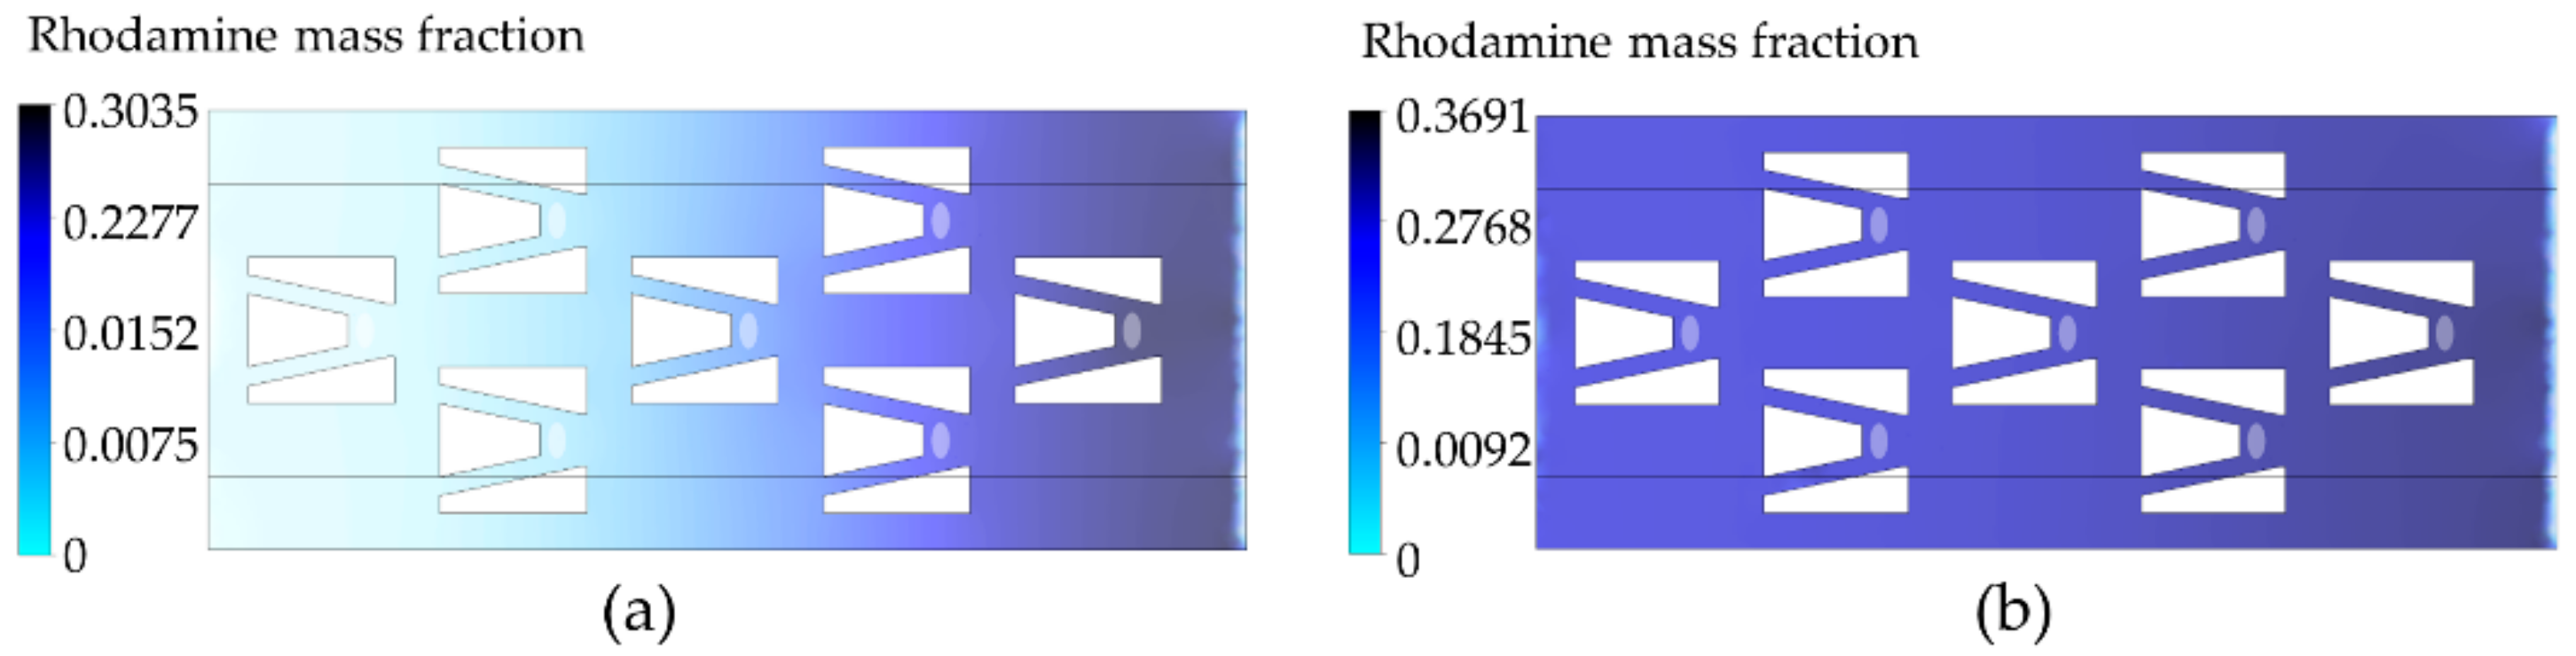
The inter-diffusion effect is predominant when the concentration gradient is pretty large and culture solution inlet velocity is relatively slow, so culture solution takes more time to dilute and carry rhodamine to outlet direction. The rhodamine mass fraction distribution in micro-traps at 2 ms is shown as Figure 7. The rhodamine mass fraction diffuses from microdroplet to culture solution through microporous membrane once the microdroplet attains membrane zone and it dramatically decreased from inlet to outlet at 4 ms when both microdroplet and culture solution velocity are 0.03 m/s. However, the rhodamine mass fraction is quite uniform in 7 micro-traps just at 2 ms when the relative velocity of microdroplet to culture solution is 0.06 m/s.
Inter-diffusion velocity along X direction is nearly equal to culture solution velocity when little rhodamine diffuses to inlet direction and it is around 0.03 m/s. Thus, the time of rhodamine staying at cell surfaces almost only depends on culture solution inlet velocity, because inter-diffusion velocity is far less than culture solution velocity, the inter-diffusion direction was changed mainly towards outlet. The rhodamine was carried away by culture solution rapidly once they diffused to cell surfaces. Moreover, the microdroplet is extruded to micro-traps zone through porous zone when relative velocity is larger than 0.01 m/s. As a result, the mass fraction of rhodamine on micro-traps grows more rapidly than the situation when the microdroplet velocity is the same as culture solution velocity and the convective diffusion effect is much enhanced when the relative velocity increases. But the time of microdroplet extruded into culture solution decreases slightly when the relative velocity of microdroplet to culture solution is larger than 0.06 m/s, the fluid velocity located under microdroplet zone could not be improved significantly.

3.3. Pressure Field

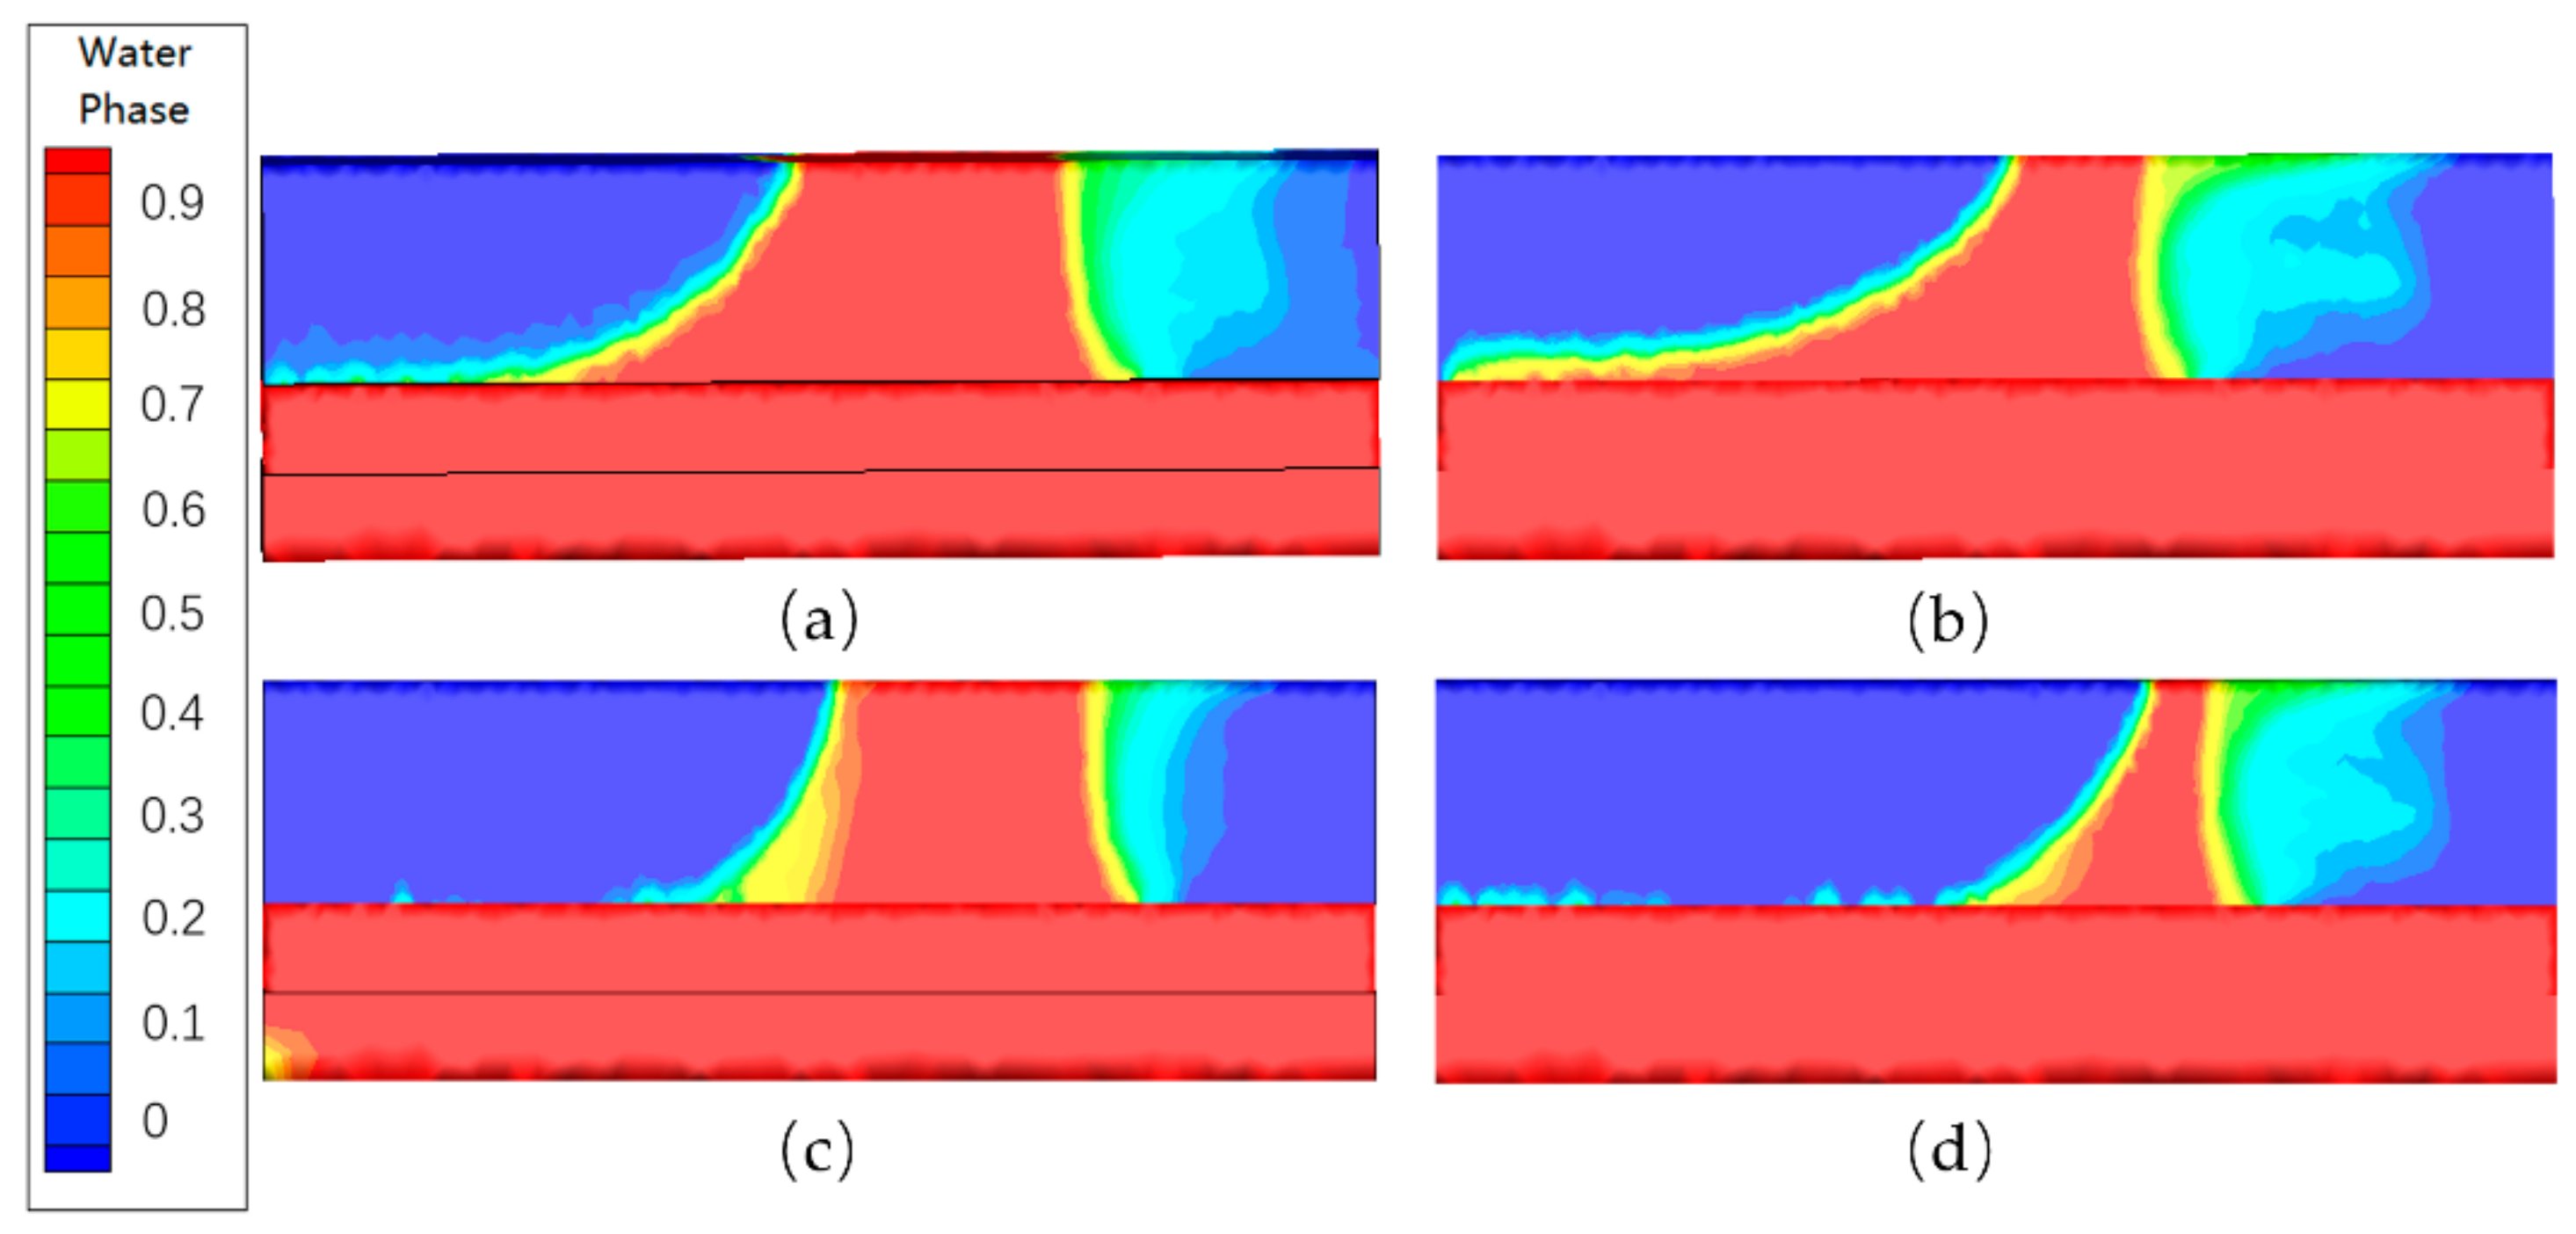
The fluid pressure on cell surfaces is directly related with cell culture and dosing analysis, high pressure on cell surfaces should be avoided in this system. Other than that, the fluid pressure around microdroplet also influences the rhodamine diffusion efficiency and the impact to cells. The microdroplet was affected by capillary force and especially fluid pressure, its shape is changed to trapezoid from slug as shown in Figure 8. The contact angle and area between microdroplet and culture solution are expanded when microdroplet velocity and culture solution velocity increase and the microdroplet is extruded to culture solution more rapidly when relative velocity enlarges.
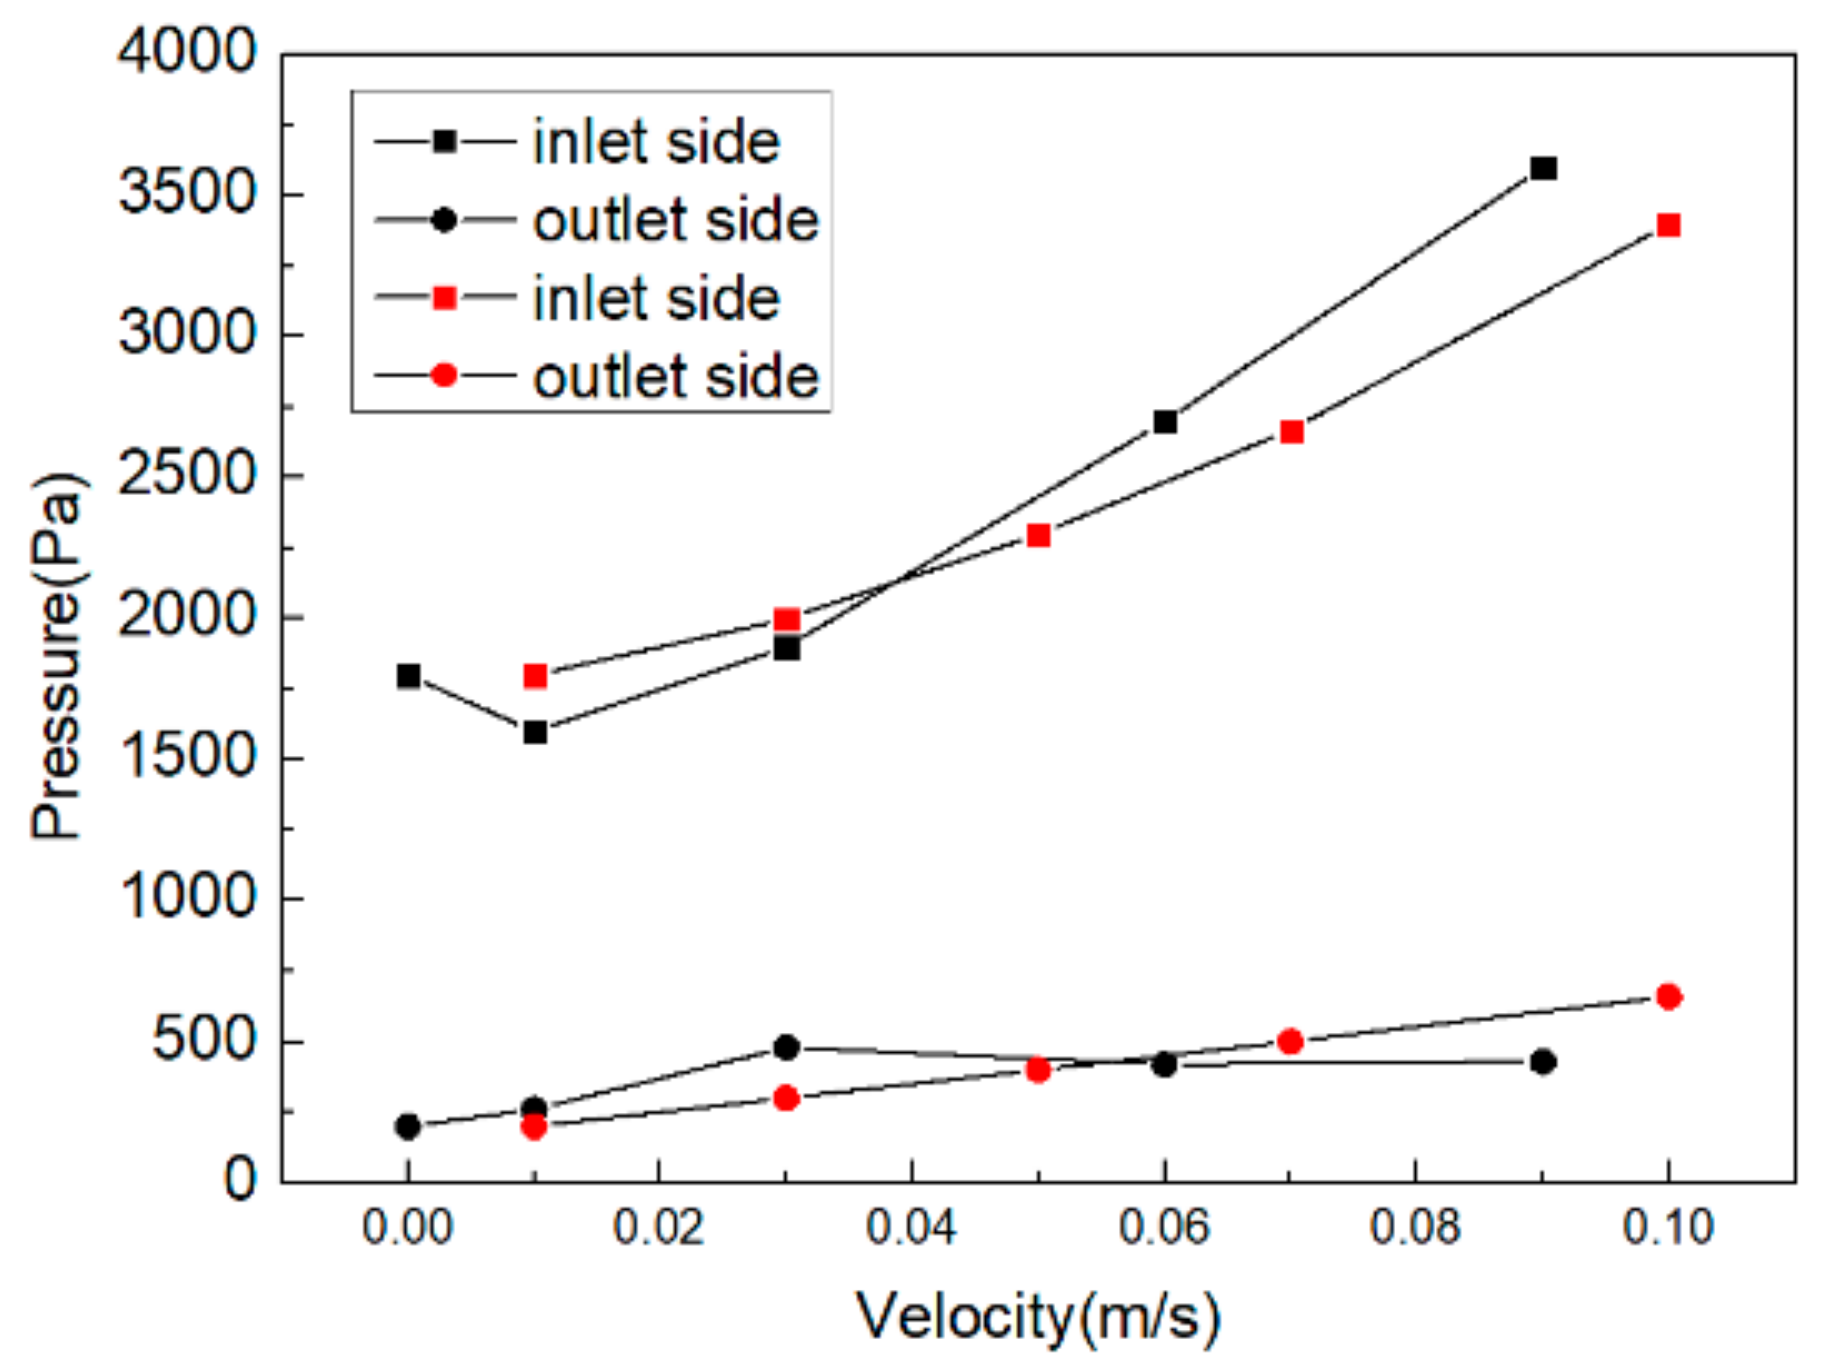
From the pressure change around microdroplet with microdroplet and culture solution velocities shown as Figure 9. The pressure increase on the inlet side is 1200 Pa when the microdroplet and culture solution velocities increase from 0.05 m/s to 0.1 m/s; meanwhile, the pressure on the outlet side only increases by 200 Pa. From Figure 8 and Figure 9 it can be concluded that the pressure around the microdroplet is mainly responsible for the much larger contact angle and area on the outlet side than those on inlet side. Because the pressure difference between the two ends of the droplet will increase when the relative velocity of the droplet increases, regardless of whether the medium velocity increases or not. The interface between microdroplet and oil close to inlet suffers from much severer fluid pressure, which pushes microdroplet to flow and maintain original shape. However, the interface between microdroplet and oil towards outlet side not only lacks sufficient pressure support but also is dragged by faster culture solution below the membrane. The pressure difference between the two ends of the droplet is mainly affected by the oil phase velocity. The contact angle of between microdroplets and microporous membrane that close the outlet increases with the increase of the flow velocity of the culture medium, so that the contact area between the droplet and the medium also increases.
The capillary force at microporous membrane zone plays an important role in rhodamine diffusion when microdroplet flow velocity is equal to culture solution flow velocity. The capillary force drags the microdroplet, arousing a tendency to flow into culture solution. What’s more, the microporous membrane surface is quite rough in microscale, which causing droplet spreading and absorption phenomenon [32]. As a result, the contact area microdroplet between culture solution is relatively extended, so rhodamine inter-diffusion effect is improved and the number of cells dosing at a moment is increased too.
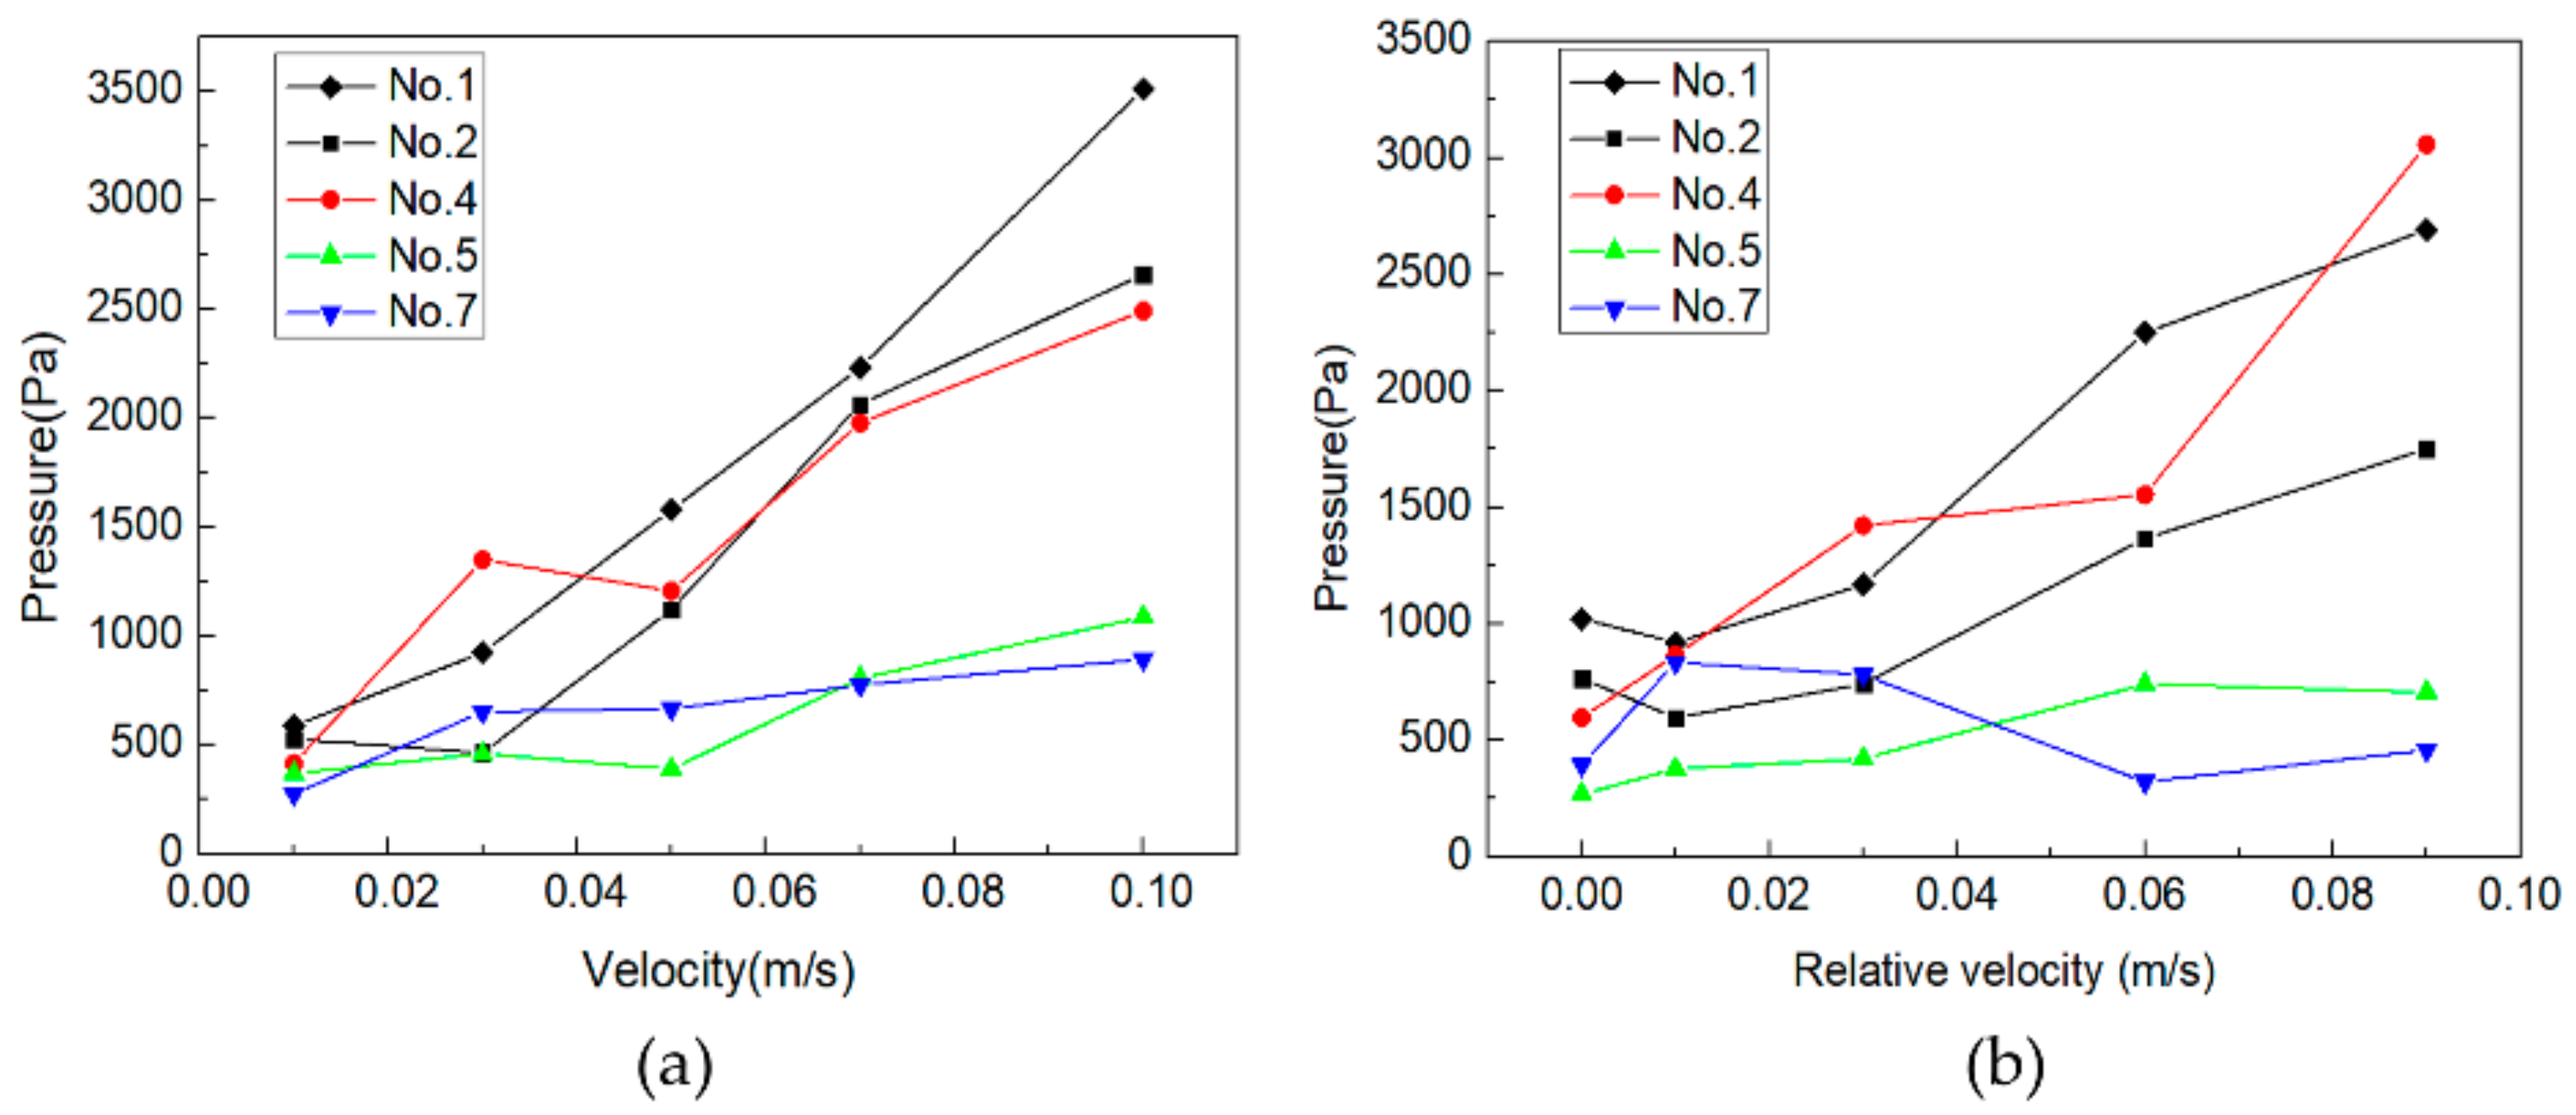
In addition, microdroplet would be extruded to culture solution channel through porous membrane gradually because of relative velocity and it is extruded more rapidly as the relative velocity becomes larger. The cell surfaces pressure caused by fluids flow field change may influence cell culture environment, culture solution velocity and the relative velocity of microdroplet and should be focused. The cell surfaces pressure influenced by culture velocity when the relative velocity of microdroplet is 0 and as shown in Figure 10a, the cell surfaces pressure influenced by the relative velocity of microdroplet when culture velocity is 0.01 m/s as shown in Figure 10b. All the cell surfaces pressure increases especially for Cell 1–4 when the flow velocity of microdroplet and culture solution increase at equal rates. All the cell surfaces pressure increased generally when microdroplet and culture velocity or the relative velocity of microdroplet enlarged but it is only Cell 4 cell surface pressure always keeps growing tendency.
Cells located at micro-traps close to the culture solution inlet suffer more dramatic fluid impact force when microdroplet velocity increases, while the cells far from the inlet suffer only slight impact. The microdroplet velocity does not influence cells because the laminar situation, the convective diffusion between microdroplet and culture solution is tiny. Because the microdroplet diffusion process always covers Cell 4 cell, it causes more pressure as it diffuses through microporous membrane faster. The cells behind Cell 4 would not suffer too much from microdroplet diffusion pressure because of most microdroplets diffused to culture solution and buffered located around Cell 1–4 cells zone. In general, this microfluidic system could further reduce the drug consumption in cells dosing experiments and promote experiments efficiency and observability. The impairment of cells caused by fluid pressure would be reduced a lot compared to jet dosing and the dosing efficiency would be improved, as well as an instant controllable dosing time is realized [19,20,21,22,23].

3.4. Combined Influence on Cell Dosing

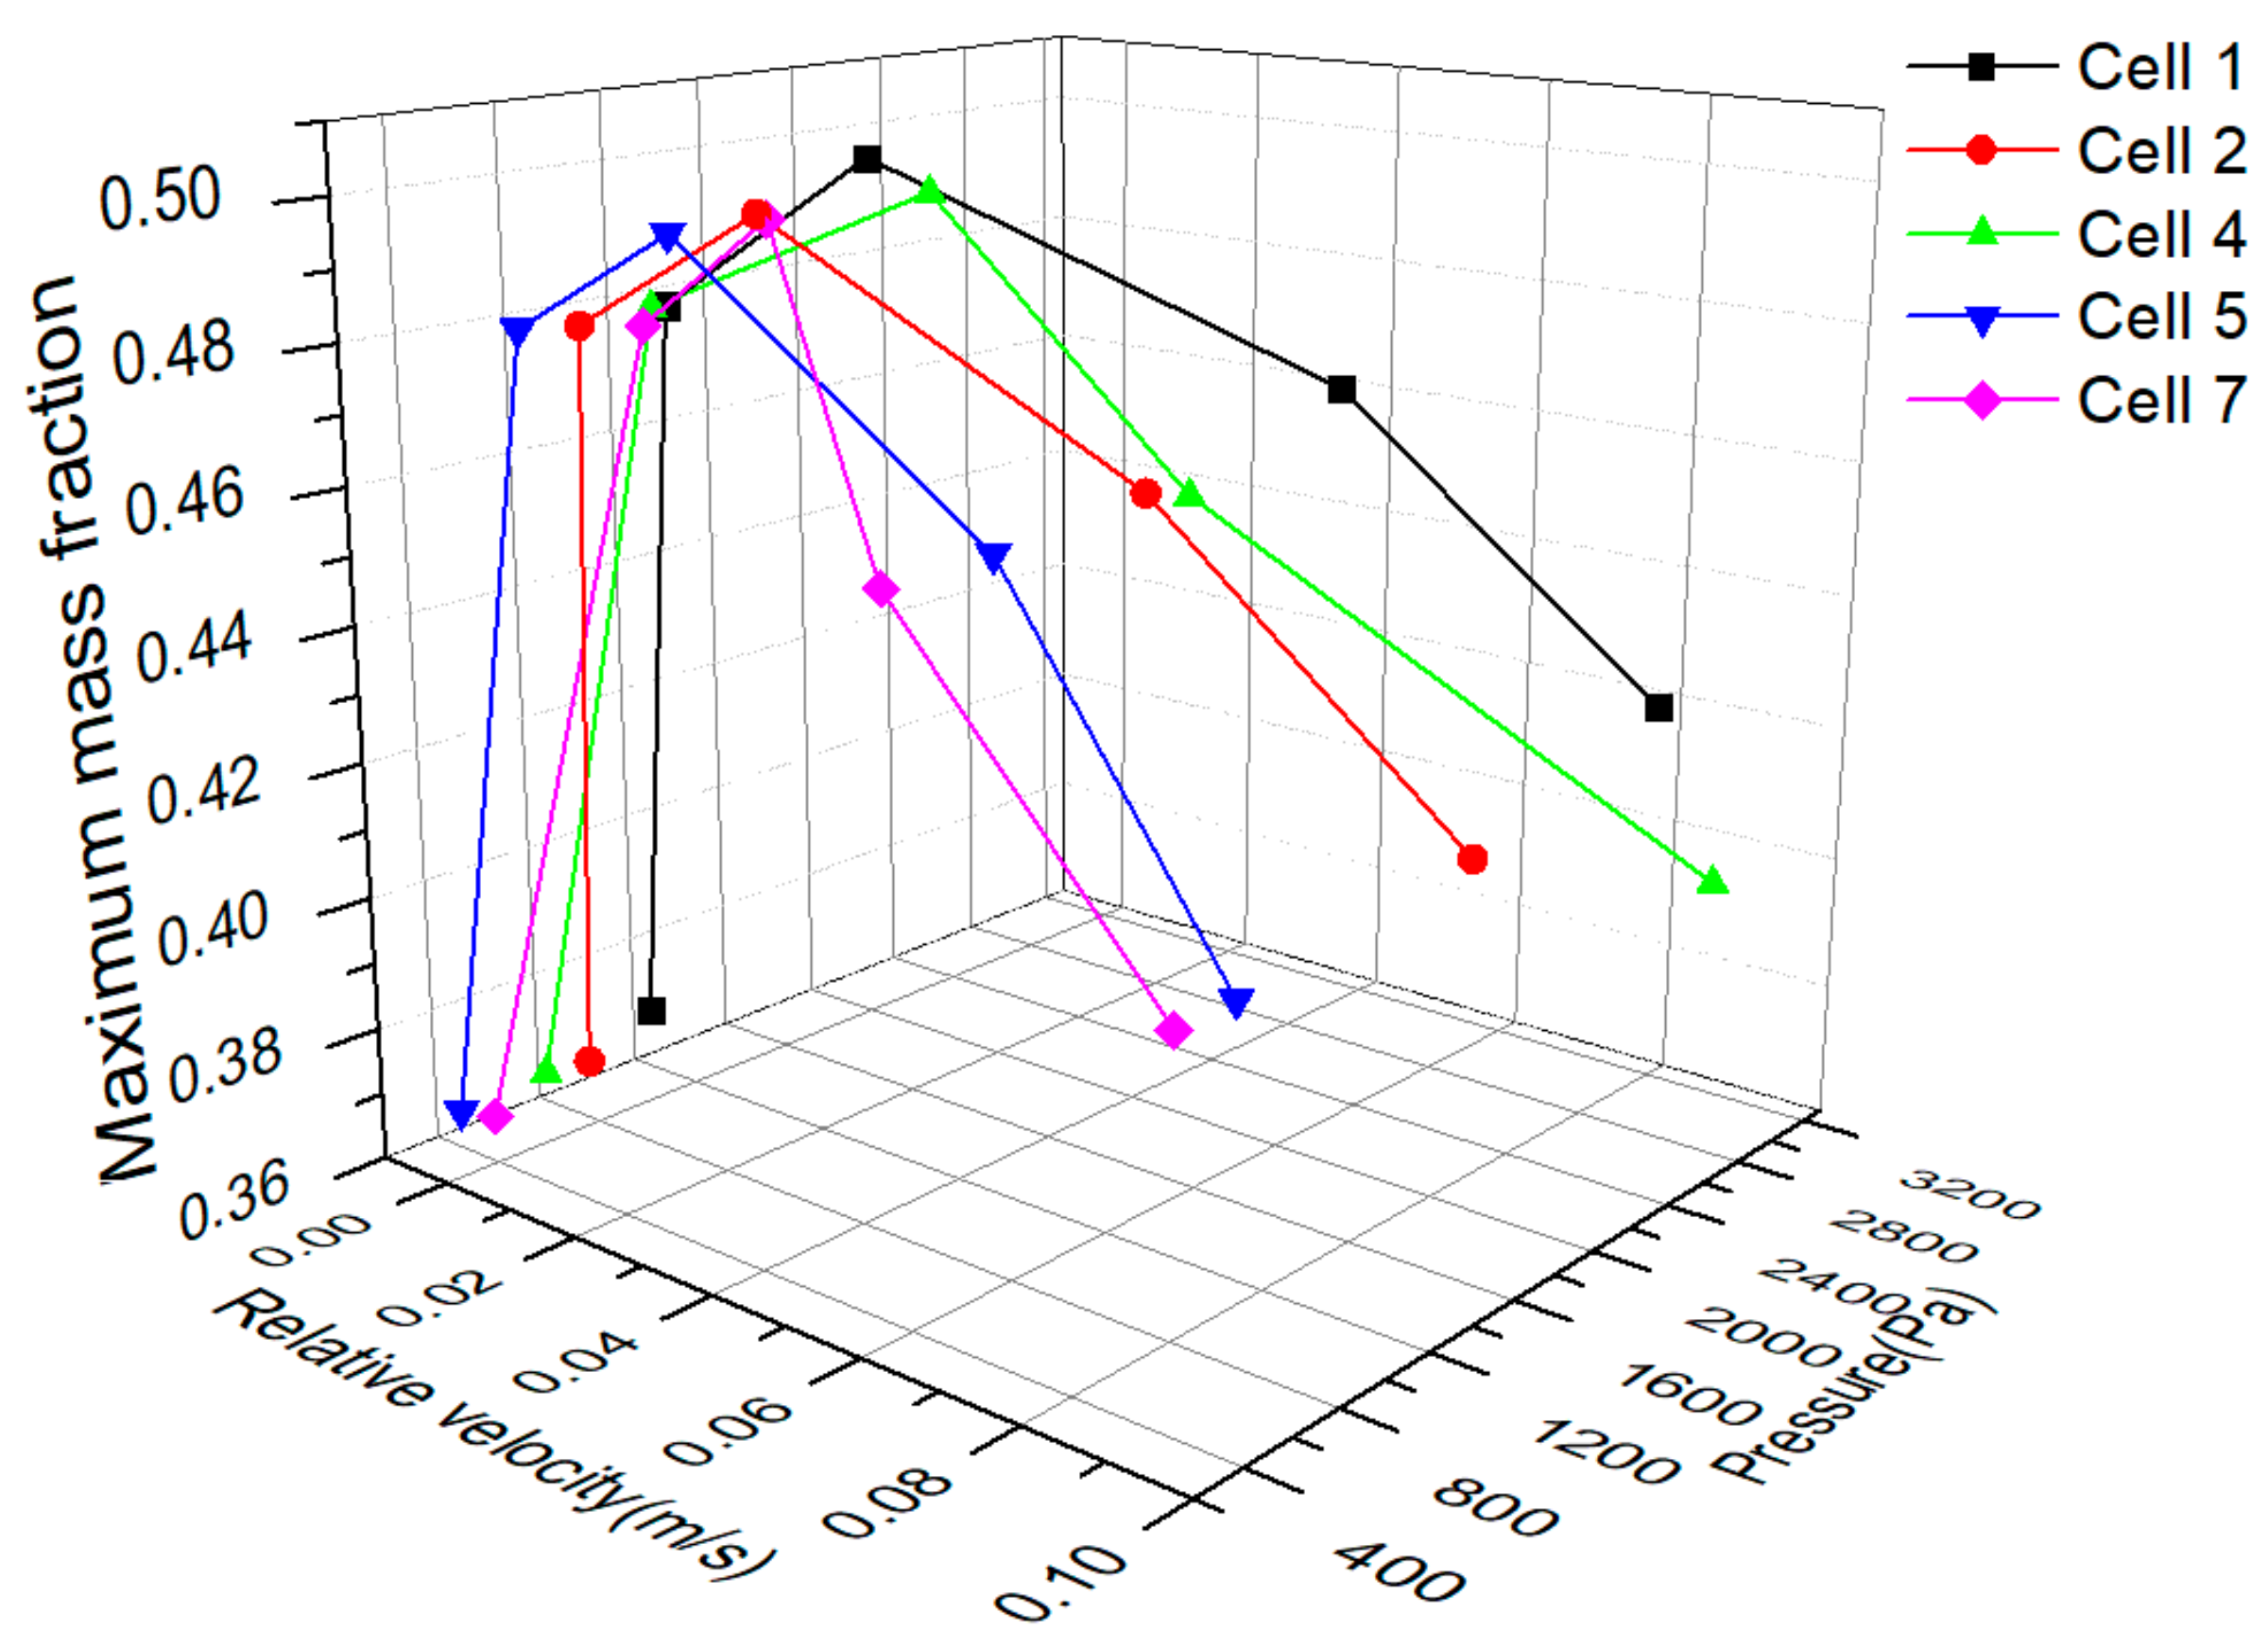
The cell pulse dosing should be carried out in condition of low pressure, as high as possible drug mass fraction on cell surfaces and controllable pulse time. From above results and discussion, the change of rhodamine mass fraction with relative velocity and pressure is shown in Figure 11. The diffusion process of rhodamine to cells attains best effect when the relative velocity of microdroplet to culture solution is 0.03 m/s and cells suffer more pressure when relative velocity increases.
Convective velocity of Rhodamine molecules to micro-traps increases when the relative velocity of microdroplet enhanced. The pressure around the microdroplets would not only extrude microdroplets into culture medium but also increase the friction between the microdroplets and the wall surface or the surface of the microporous membrane. And the vortex between the microdroplets and the microporous membrane would be enhanced because of high fluid pressure, which may hinder the diffusion process. In the meanwhile, cells would be impaired in high fluid pressure environment should be considered. As a result, high efficiency cell pulse dosing could be achieved at the relative velocity of microdroplet is 0.03 m/s when culture solution velocity is 0.01 m/s and shorter pulse time could be achieved by increasing microdroplet and culture solution velocity at the same time or increasing the relative velocity of microdroplet to culture solution.

4. Conclusions

In this paper, we analyzed the convective diffusion process of microdroplet cell dosing in the three-layer sandwich structure of PDMS/PCTE microporous membrane/PDMS chip, which mainly focused on the drug delivery mechanism, pulse time, mass fraction on cell surfaces, the effect of the change on microdroplet velocity and culture solution velocity. We found that cells close to culture solution suffer more fluid pressure impact when culture solution inlet velocity or the relative velocity of microdroplet to culture solution increased, otherwise cells are affected slightly. The mechanism of the changes of cell dosing pulse time with microdroplet and culture solution velocity is obtained. Inter-diffusion and convective diffusion play different degrees of importance during drug delivery through microporous membrane to cells. In condition of the relative velocity of microdroplet to culture solution is 0, the cell dosing pulse time decreases notably until flow velocity increases to 0.03 m/s, while it decreased slowly when flow velocity is faster than 0.03 m/s. In condition of constant culture solution velocity, the cell dosing pulse time decreases notably until the relative velocity of microdroplet increases to 0.06 m/s, while it decreases slowly when flow velocity is faster than 0.06 m/s. The pulse time could be controlled by changing microdroplet and culture solution velocities. For better cell dosing efficiency, the rhodamine mass fraction on cell surfaces attains the maximum value when the relative velocity of microdroplet to culture solution is 0.03 m/s. And the cells dosing pulse time or drug concentration could be controlled by changing the flow velocity of microdroplets and culture medium, which is convenient for studying the pulse time influence. Compared to traditional dosing in living body or jet dosing in microfluidic chip, this microdroplet cell dosing chip could achieve more controllable pulse dosing and observe the instant drug effects on cells. The knowledge obtained in this work may provide useful information for microfluidic chip applied to cell culture and dosing.

Author Contributions

K.L. and D.B. proposed the idea of single-cell trapping model; J.N. and M.H. designed the structure of the chip and performed the draft simulation; Z.W. and S.C. proposed the numerical model and performed the simulation; Z.W. and D.W. analyzed the data; Z.W. wrote the paper; Y.B. joined in the discussion and inspected the accuracy; Q.M. contributed reagents and materials and joined in the discussion of experimental data; K.L. and D.B. organized the entire teamwork and supported this work with their funding.

Funding

This research was jointly funded by the Fundamental Research Funds for the Central Universities of China (N160302001), National Natural Science Foundation of China (51376039), the CAST-BISEE Fund Project (CAST-BISEE2017-011), the 13th Five-Year National Science and Technology Major Project (2017ZX02201005-001).

Acknowledgments

This research has been supported by Key Laboratory of Vibration and Control of Aeronautical Equipment, Ministry of Education, Northeastern University (VCAME201604).

Conflicts of Interest

The authors declare no conflict of interest.

References

  1. Millet, L.J.; Gillette, M.U. New perspectives on neuronal development via microfluidic environments. Trends Neurosci. 2012, 35, 752–761. [Google Scholar] [CrossRef] [PubMed] [Green Version]
  2. Lion, N.; Rohner, T.C.; Dayon, L.; Arnaud, I.L.; Damoc, E.; Youhnovski, N.; Wu, Z.Y.; Roussel, C.; Josserand, J.; Jensen, H.; et al. Microfluidic systems in proteomics. Electrophoresis 2003, 24, 3533–3562. [Google Scholar] [CrossRef] [PubMed]
  3. Wang, P.; DeVoe, D.L.; Lee, C.S. Integration of polymeric membranes with microfluidic networks for bioanalytical applications. Electrophoresis 2001, 22, 3857–3867. [Google Scholar] [CrossRef]
  4. Benjamin, R.K.; Hochberg, F.H.; Fox, E.; Bungay, P.M.; Elmquist, W.F.; Stewart, C.F.; Gallo, J.M.; Collins, J.M.; Pelletier, R.P.; de Groot, J.F.; et al. Review of microdialysis in brain tumors, from concept to application: First annual Carolyn Frye-Halloran symposium. Neuro Oncol. 2004, 6, 65–74. [Google Scholar] [CrossRef] [PubMed]
  5. Fair, R.B. Digital microfluidics: Is a true lab-on-a-chip possible? Microfluid. Nanofluid. 2007, 3, 245–281. [Google Scholar] [CrossRef]
  6. Chengfu, C.; Drew, K.L. Droplet-based microdialysis—Concept, theory, and design considerations. J. Chromatogr. A 2008, 1209, 29–36. [Google Scholar] [CrossRef] [Green Version]
  7. Lee, T.Y.; Hyun, K.A.; Kim, S.I.; Jung, H.I. An integrated microfluidic chip for one-step isolation of circulating tumor cells. Sens. Actuators B Chem. 2016, 238, 1144–1150. [Google Scholar] [CrossRef]
  8. Mao, H.; Cremer, P.S.; Manson, M.D. A sensitive, versatile microfluidic assay for bacterial chemotaxis. Proc. Natl. Acad. Sci. USA 2003, 100, 5449–5454. [Google Scholar] [CrossRef] [PubMed] [Green Version]
  9. Dertinger, S.K.; Jiang, X.; Li, Z.; Murthy, V.N.; Whitesides, G.M. Gradients of substrate-bound laminin orient axonal specification of neurons. Proc. Natl. Acad. Sci. USA 2002, 99, 12542–12547. [Google Scholar] [CrossRef] [PubMed] [Green Version]
  10. Schiff, N.D.; Giacino, J.T.; Kalmar, K.; Victor, J.D.; Baker, K.; Gerber, M.; Fritz, B.; Eisenberg, B.; O’connor, J.; Kobylarz, E.J.; et al. Behavioural improvements with thalamic stimulation after severe traumatic brain injury. Nature 2007, 448, 600–603. [Google Scholar] [CrossRef] [PubMed]
  11. Asaad, W.; Eskandar, E. The movers and shakers of deep brain stimulation. Nat. Med. 2008, 14, 17–18. [Google Scholar] [CrossRef] [PubMed]
  12. Fytagoridis, A.; Åström, M.; Wårdell, K.; Blomstedt, P. Stimulation-induced side effects in the posterior subthalamic area: Distribution, characteristics and visualization. Clin. Neurol. Neurosurg. 2013, 115, 65–71. [Google Scholar] [CrossRef] [PubMed]
  13. Lopes, C.D.; Gomes, C.P.; Neto, E.; Sampaio, P.; Aguiar, P.; Pêgo, A.P. Microfluidic-based platform to mimic the in vivo peripheral administration of neurotropic nanoparticles. Nanomedicine 2016, 11, 3205–3221. [Google Scholar] [CrossRef] [PubMed]
  14. Wu, L.; Tsutahara, M.; Kim, L.; Ha, M. Numerical simulations of droplet formation in a cross-junction microchannel by the lattice Boltzmann method. Int. J. Numer. Methods Fluids 2007, 57, 793–810. [Google Scholar] [CrossRef]
  15. Wu, L.; Tsutahara, M.; Kim, L.S.; Ha, M. Hree-dimensional lattice Boltzmann simulations of droplet formation in a cross-junction microchannel. Int. J. Multiph. Flow 2008, 34, 852–864. [Google Scholar] [CrossRef]
  16. Raj, R.; Mathur, N.; Buwa, V.V. Numerical simulations of liquid–liquid flows in microchannels. Ind. Eng. Chem. Res. 2010, 49, 10606–10614. [Google Scholar] [CrossRef]
  17. Raimondi, N.D.M.; Prat, L. Numerical study of the coupling between reaction and mass transfer for liquid–liquid slug flow in square microchannels. AICHE J. 2011, 57, 1719–1732. [Google Scholar] [CrossRef] [Green Version]
  18. Raimondi, N.M.; Prat, L.; Gourdon, C.; Cognet, P. Direct numerical simulations of mass transfer in square microchannels for liquid–liquid slug flow. Chem. Eng. Sci. 2008, 63, 5522–5530. [Google Scholar] [CrossRef] [Green Version]
  19. Pfaff, D.; Waters, E.; Khan, Q.; Zhang, X.; Numan, M. Minireview: Estrogen Receptor-Initiated Mechanisms Causal to Mammalian Reproductive Behaviors. Endocrinology 2012, 152, 1209–1217. [Google Scholar] [CrossRef] [PubMed]
  20. Serwer, L.P.; James, C.D. Challenges in drug delivery to tumors of the central nervous system: An overview of pharmacological and surgical considerations. Adv. Drug Deliv. Rev. 2012, 64, 590–597. [Google Scholar] [CrossRef] [PubMed]
  21. Chen, Y.; Liu, L.H. Modern methods for delivery of drugs across the blood-brain barrier. Adv. Drug Deliv. Rev. 2012, 64, 640–665. [Google Scholar] [CrossRef] [PubMed]
  22. Monopoli, M.P.; Aberg, C.; Salvati, A.; Dawson, K.A. Biomolecular coronas provide the biological identity of nanosized materials. Nat. Nanotechnol. 2012, 7, 779–786. [Google Scholar] [CrossRef] [PubMed] [Green Version]
  23. Sugiura, S.; Hattori, K.; Kanamori, T. Microfluidic serial dilution cell-based assay for analyzing drug dose response over a wide concentration range. Anal. Chem. 2010, 82, 8278–8282. [Google Scholar] [CrossRef] [PubMed]
  24. Mary, P.; Studer, V.; Tabeling, P. Microfluidic droplet-based liquid-liquid extraction. Anal. Chem. 2008, 80, 2680–2687. [Google Scholar] [CrossRef] [PubMed]
  25. Nerín, C.; Salafranca, J.; Aznar, M.; Batlle, R. Critical review on recent developments in solventless techniques for extraction of analytes. Anal. Bioanal. Chem. 2009, 393, 809–833. [Google Scholar] [CrossRef] [PubMed]
  26. Chua, Y.T.; Ji, G.; Birkett, G.; Lin, C.X.C.; Kleitz, F.; Smart, S. Nanoporous organosilica membrane for water desalination: Theoretical study on the water transport. J. Membr. Sci. 2015, 482, 56–66. [Google Scholar] [CrossRef] [Green Version]
  27. Peng, T.; Li, Q.; Chen, J.; Gao, X. Quantitative analysis of surface tension of liquid nano-film with thickness: Two stage stability mechanism, molecular dynamics and thermodynamics approach. Phys. A Stat. Mech. Appl. 2016, 462, 1018–1028. [Google Scholar] [CrossRef]
  28. Qu, J.; Wang, Q.; He, Z.X.; Jian, Q.U.; Qian, W.; Zhi-Xia, H.E.; Han, X.Y.; Zi-Cheng, H.U.; Tao, L. An experimental study of formation and flow charactristics of droplets in a rectangular microchannel. J. Shanghai Jiaotong Univ. 2015, 49, 86–90. [Google Scholar] [CrossRef]
  29. Chen, S.; Liu, K.; Liu, C.; Wang, D.; Ba, D.; Xie, Y.; Du, G.; Ba, Y.; Lin, Q. Effects of surface tension and viscosity on the forming and transferring process of microscale droplets. Appl. Surf. Sci. 2016, 388, 196–202. [Google Scholar] [CrossRef]
  30. Fujita, H.; Einaga, Y. Self-Diffusion and Viscoelasticity in Entangled Systems I. Self-Diffusion Coefficients. Polym. J. 1985, 17, 1131–1139. [Google Scholar] [CrossRef]
  31. Dunca, A.A.; Neda, M.; Rebholz, L.G. A mathematical and numerical study of a filtering-based multiscale fluid model with nonlinear eddy viscosity. Comput. Math. Appl. 2013, 66, 917–933. [Google Scholar] [CrossRef]
  32. Espin, L.; Kumar, S. Droplet spreading and absorption on rough, permeable substrates. J. Fluid Mech. 2015, 784, 465–486. [Google Scholar] [CrossRef]
Figure 1. Convective diffusion model of microfluidic chip for drug delivery: (a) The simplified convective diffusion model; (b) The rectangular coordinate system of the section of convective diffusion model.
Processes 06 00119 g001
Figure 2. Three-layer sandwich structure of PDMS/PCTE microporous membrane/PDMS microfluidic chip: (a) computational zone of cell dosing microfluidic chip; (b) the number of cells trapped in micro-traps.
Processes 06 00119 g002
Figure 3. Diffusion process of rhodamine solution from microdroplet to cells.
Processes 06 00119 g003
Figure 4. Change of cell surfaces mass fraction with time at Cell 1–7 micro-trap: (a) the microdroplet and culture solution flow velocities are 0.05 m/s; (b) the microdroplet and culture solution flow velocities are 0.1 m/s.
Processes 06 00119 g004
Figure 5. Change of maximum rhodamine mass fraction on cell surfaces with the relative velocity of microdroplet to culture solution when culture solution velocity is 0.01 m/s.
Processes 06 00119 g005
Figure 6. Change of the cell surfaces dosing pulse time with fluids flow velocity: (a) the relative velocity between microdroplet and culture solution is 0 m/s and microdroplet and culture solution velocity change from 0.01 m/s to 0.1 m/s; (b) change of the relative velocity of microdroplet to culture solution from 0 to 0.09 m/s.
Processes 06 00119 g006
Figure 7. Distribution of rhodamine mass fraction in micro-traps: (a) microdroplet and culture solution velocity are 0.03 m/s; (b) relative velocity of the microdroplet to culture solution is 0.06 m/s.
Processes 06 00119 g007
Figure 8. Distribution of water phase: (a) both microdroplet and culture solution flow velocities are 0.05 m/s; (b) microdroplet and culture solution flow velocities are 0.1 m/s; (c) the relative velocity of microdroplet to culture solution is 0.03 m/s when culture solution velocity is 0.01 m/s; (d) the relative velocity of microdroplet to culture solution is 0.09 m/s when culture solution velocity is 0.01 m/s.
Processes 06 00119 g008
Figure 9. Pressure around microdroplet influenced by velocity: black symbol means the pressure change with the relative velocity of microdroplet; red symbol means the pressure change with microdroplet velocity when there is no relative velocity between microdroplet and culture solution.
Processes 06 00119 g009
Figure 10. Simulation results of cell surfaces suffer pressure: (a) relation of cell surfaces pressure with culture solution inlet velocity when microdroplet relative velocity is 0; (b) relation of cell surfaces pressure with the relative velocity of microdroplet when culture solution inlet velocity is 0.01 m/s.
Processes 06 00119 g010
Figure 11. Simulation results of cell surfaces maximum rhodamine mass fraction influenced by the relative velocity of microdroplet and cell surfaces pressure.
Processes 06 00119 g011
Table 1. Numerical simulation parameters.
ParametersValue
Culture medium density ρ11038 kg/m3
Culture medium dynamic viscosity μ13.07 × 10⁻³ Pa·s
Rhodamine B solution density ρ21.053 kg/m3
Rhodamine B solution dynamic viscosity μ21 × 10−3 Pa·s
Oil density ρ2960 kg/m3
Oil density dynamic viscosity μ30.012–0.096 Pa·s
Inlet velocity v0≤0.1 m/s
Porosity ρ0.1

