Computational Molecular Modeling of Transport Processes in Nanoporous Membranes


1
Department of Chemical Engineering, University of Illinois at Chicago, Chicago, IL 60607, USA
2
Department of Chemical and Biological Engineering, Illinois Institute of Technology, Chicago, IL 60616, USA
3
State Key Laboratory of Materials-Oriented Chemical Engineering, Nanjing Tech University, Nanjing 210009 China
*
Author to whom correspondence should be addressed.
†
Current Address: Department of Chemical and Materials Engineering, University of Dayton, Dayton, OH 45469, USA.
Processes 2018, 6(8), 124; https://doi.org/10.3390/pr6080124
Submission received: 19 July 2018
/
Revised: 3 August 2018
/
Accepted: 4 August 2018
/
Published: 9 August 2018
(This article belongs to the Special Issue Transport of Fluids in Nanoporous Materials)
Abstract
:In this report we have discussed the important role of molecular modeling, especially the use of the molecular dynamics method, in investigating transport processes in nanoporous materials such as membranes. With the availability of high performance computers, molecular modeling can now be used to study rather complex systems at a fraction of the cost or time requirements of experimental studies. Molecular modeling techniques have the advantage of being able to access spatial and temporal resolution which are difficult to reach in experimental studies. For example, sub-Angstrom level spatial resolution is very accessible as is sub-femtosecond temporal resolution. Due to these advantages, simulation can play two important roles: Firstly because of the increased spatial and temporal resolution, it can help understand phenomena not well understood. As an example, we discuss the study of reverse osmosis processes. Before simulations were used it was thought the separation of water from salt was purely a coulombic phenomenon. However, by applying molecular simulation techniques, it was clearly demonstrated that the solvation of ions made the separation in effect a steric separation and it was the flux which was strongly affected by the coulombic interactions between water and the membrane surface. Additionally, because of their relatively low cost and quick turnaround (by using multiple processor systems now increasingly available) simulations can be a useful screening tool to identify membranes for a potential application. To this end, we have described our studies in determining the most suitable zeolite membrane for redox flow battery applications. As computing facilities become more widely available and new computational methods are developed, we believe molecular modeling will become a key tool in the study of transport processes in nanoporous materials.
1. Introduction
It is estimated that approximately 55% of all energy consumed in chemical processes is spent on separations, of which about 50% is consumed by distillation, 20% by evaporation and 10% by drying, and the remaining 20% by non-thermal separations, include membrane-based separations [1]. Thus, further development of membrane-based separation processes to enable their use in applications currently employing thermal separations can lead to significant energy savings in e chemical process industries. One obstacle to the development of membranes for these energy intensive separations is that many membrane-based separation processes are not well understood at the fundamental molecular level, thereby resulting in membrane synthesis becoming an art rather than a science [2,3,4,5]. Computational molecular modeling tools such as molecular dynamics [6] can play a crucial role in clarifying the molecular forces that result in making a membrane effective for a proposed application. Such molecular level understanding can thus greatly assist in the design of new membranes for a desired separation. In addition, such molecular level tools can also assist in understanding unexpected behavior observed during membrane separation processes by providing access to spatial resolution to a fraction of an Angstrom and temporal resolution to a fraction of a femtosecond. This level of resolution is often difficult to achieve in experimental methods. Selectively permeable membranes perform important roles in a wide range of systems from naturally occurring lipid membranes in biological systems to engineered polymeric membranes in filtration and energy technologies. In order to design technologies that incorporate such membranes, it is crucial to understand the behavior of these systems at the molecular level so that optimal performance and maximum efficiencies can be achieved. Computational molecular modeling tools such as molecular dynamics are ideally suited to provide detail at a level that can aid in the understanding of the transport process.
In this paper we briefly summarize three applications that use molecular dynamics techniques to examine intramembrane transport:
- Transport of water and ions in reverse osmosis (RO) nanoporous membranes and the role played by ion-solvation in such membranes.
- Ion exchange in zeolite membranes and our finding that the separations were almost completely enthalpically driven rather than entropically.
- Separation of gases using zeolite membranes and the role of membrane loading and diffusion in the observed separation factors achieved in the membranes.
These brief overviews are followed by more detailed discussions of two recent investigations by our group:
- We describe our investigations of multiple zeolite framework types to determine their transport behavior regarding water, protons, and vanadium ions, and investigate at the molecular level the requirements for their suitability in ion exchange membrane (IEM) applications. In addition to investigating different zeolite frameworks, the effect of composition is also examined by introducing different levels of aluminum substitution into the crystalline structure of a specific zeolite framework. By investigating two characteristics, membrane loading and intramembrane diffusion, it was possible for us to predict the overall ion permeability with the goal of optimizing the amount of aluminum substitution for high proton permeability while maintaining selectivity to undesirable ions. These and similar studies can be instrumental in designing more efficient membranes for important applications such as water purification/desalination and in many proposed applications in energy sustainability.
- The second application focuses on how molecular simulations can help to understand unexpected or non-intuitive results obtained during experiments. A recent experimental study on the dehydration of alcohols using zeolite membranes showed [7] that the membrane was effective in dehydrating alcohol when 5% water was present but became surprisingly ineffective when the water content was 1%. This was an intriguing observation that molecular simulation was able to explain because of the fine spatial and temporal resolution accessible in such investigations that may not be possible experimentally.
2. Molecular Simulations Applied to Various Membrane Applications
Here we demonstrate the wide range of applications that can be addressed using molecular simulations.
2.1. Transport in Reverse Osmosis Membranes
Reverse osmosis (RO) separations of aqueous electrolyte solutions (such as the desalination process), is a rather challenging problem, because it is not an obvious case of separations enabled by differences in molecular sizes (steric separation). In the case of an aqueous NaCl solution, for example, the size of Na+ ion (<0.2 nm) is considerably smaller than that of a water molecule (~0.3 nm). In spite of this difference in sizes, it is well known that desalination membranes, such as those described earlier, are very effective in removing salt from water. Since this permeation could not be explained due to size differences, it was generally believed that this was due to surface interactions between the membrane surface and the solute/solvent molecules. Molecular simulations could therefore provide a useful tool for understanding these molecular forces [8]. This problem was examined in considerable detail using the molecular dynamics method and has led to a considerable improvement in our understanding of the intermolecular forces that play a significant role in the RO-based separation of electrolyte solutions as described below.
The simulations used previously developed intermolecular potential models for both the water and the ions. For water, the simple point charge (SPC) model was used [9], while for the ions the primitive model was used [10]. These models provide a realistic representation of these systems for a wide range of properties and state conditions [8,9]. The reaction field method [11] was used to include long-range forces. The membrane was represented by a thin ZK4 zeolite layer with pores of 0.42 nm diameter (see Figure 1). The atoms forming the membrane were not charged so that essentially only steric (size based) separation would be possible in these membranes.
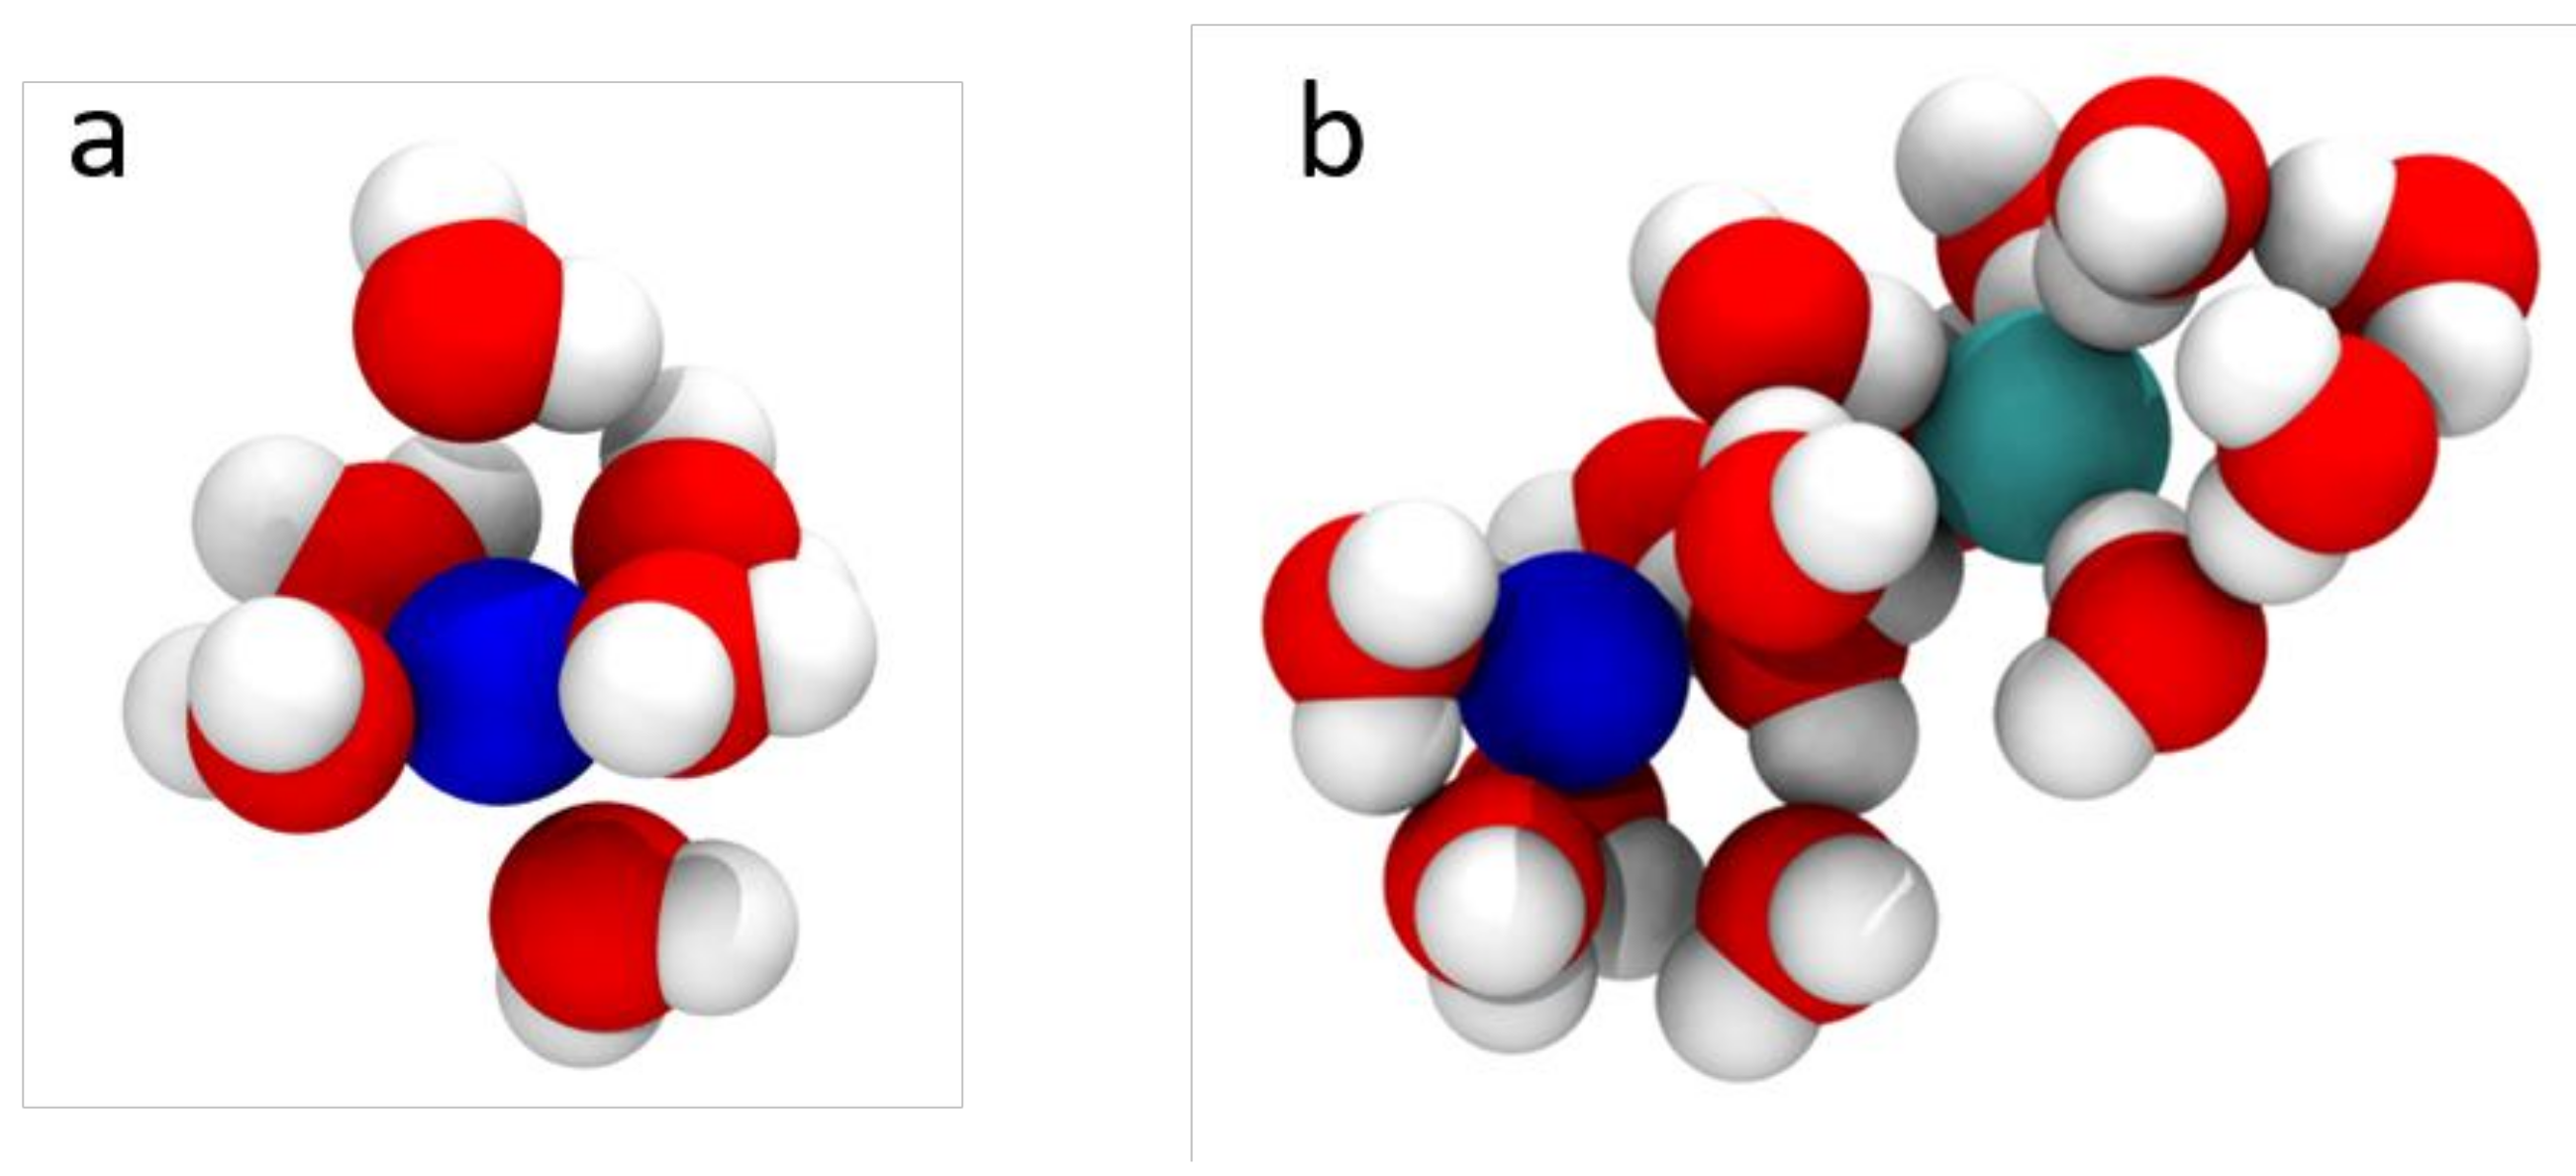
One of the most significant observation from the molecular simulation studies of aqueous electrolyte solutions was that no additional intermolecular forces were needed to prevent the much smaller ions from permeating the membrane, while permitting the larger water molecules to readily permeate the membrane. This appeared to be due to the large solvated ionic clusters formed when ions are dissolved in water. The ions were surrounded by the solvating water molecules, thus increasing their effective size to almost 1 nm. A typical cluster observed due to the interaction between the ions and water is shown in Figure 2. These clusters were quite stable, with a rather high energy of de-solvation [10]. In addition to the clusters shown in Figure 2a, larger clusters which involved more than one ion were also presented. Figure 2b shows one such example when two ions separated by an intervening layer of water molecules forming one larger cluster. By increasing the temperature of the solution, it was possible to make ions permeate the membrane. The increased temperature effectively made the larger ionic clusters less stable, and the ions were able to break away from the clusters, and the almost “bare” ions could then permeate the membrane. This was also found to be the case when the simulation system was subjected to an external electric field [12]. The electric field similarly weakened the ionic clusters and again allowed ions to then permeate the membrane. These simulations have shown that the solvation of ions is at least in part responsible for these separations, and these forces must be taken into account as part of the design in RO-based separations of aqueous electrolyte solutions.
The ionic clusters observed are not limited to just aqueous electrolyte solutions. In fact, similar clusters results were observed in methanolic solutions as well [12]. This shows that such large and stable ionic clusters are a fairly common occurrence whenever ions are dissolved in polar solvents. These clusters are therefore an essential factor in the facilitation of reverse osmosis purification. Since many industrially important solutions include ions in polar solvents, it is important to account for them in separations involving such solvents. The transport of water and ions inside polymide membranes has also been studied using molecular simulation [13].
2.2. Transport in Ion-Exchange Membranes
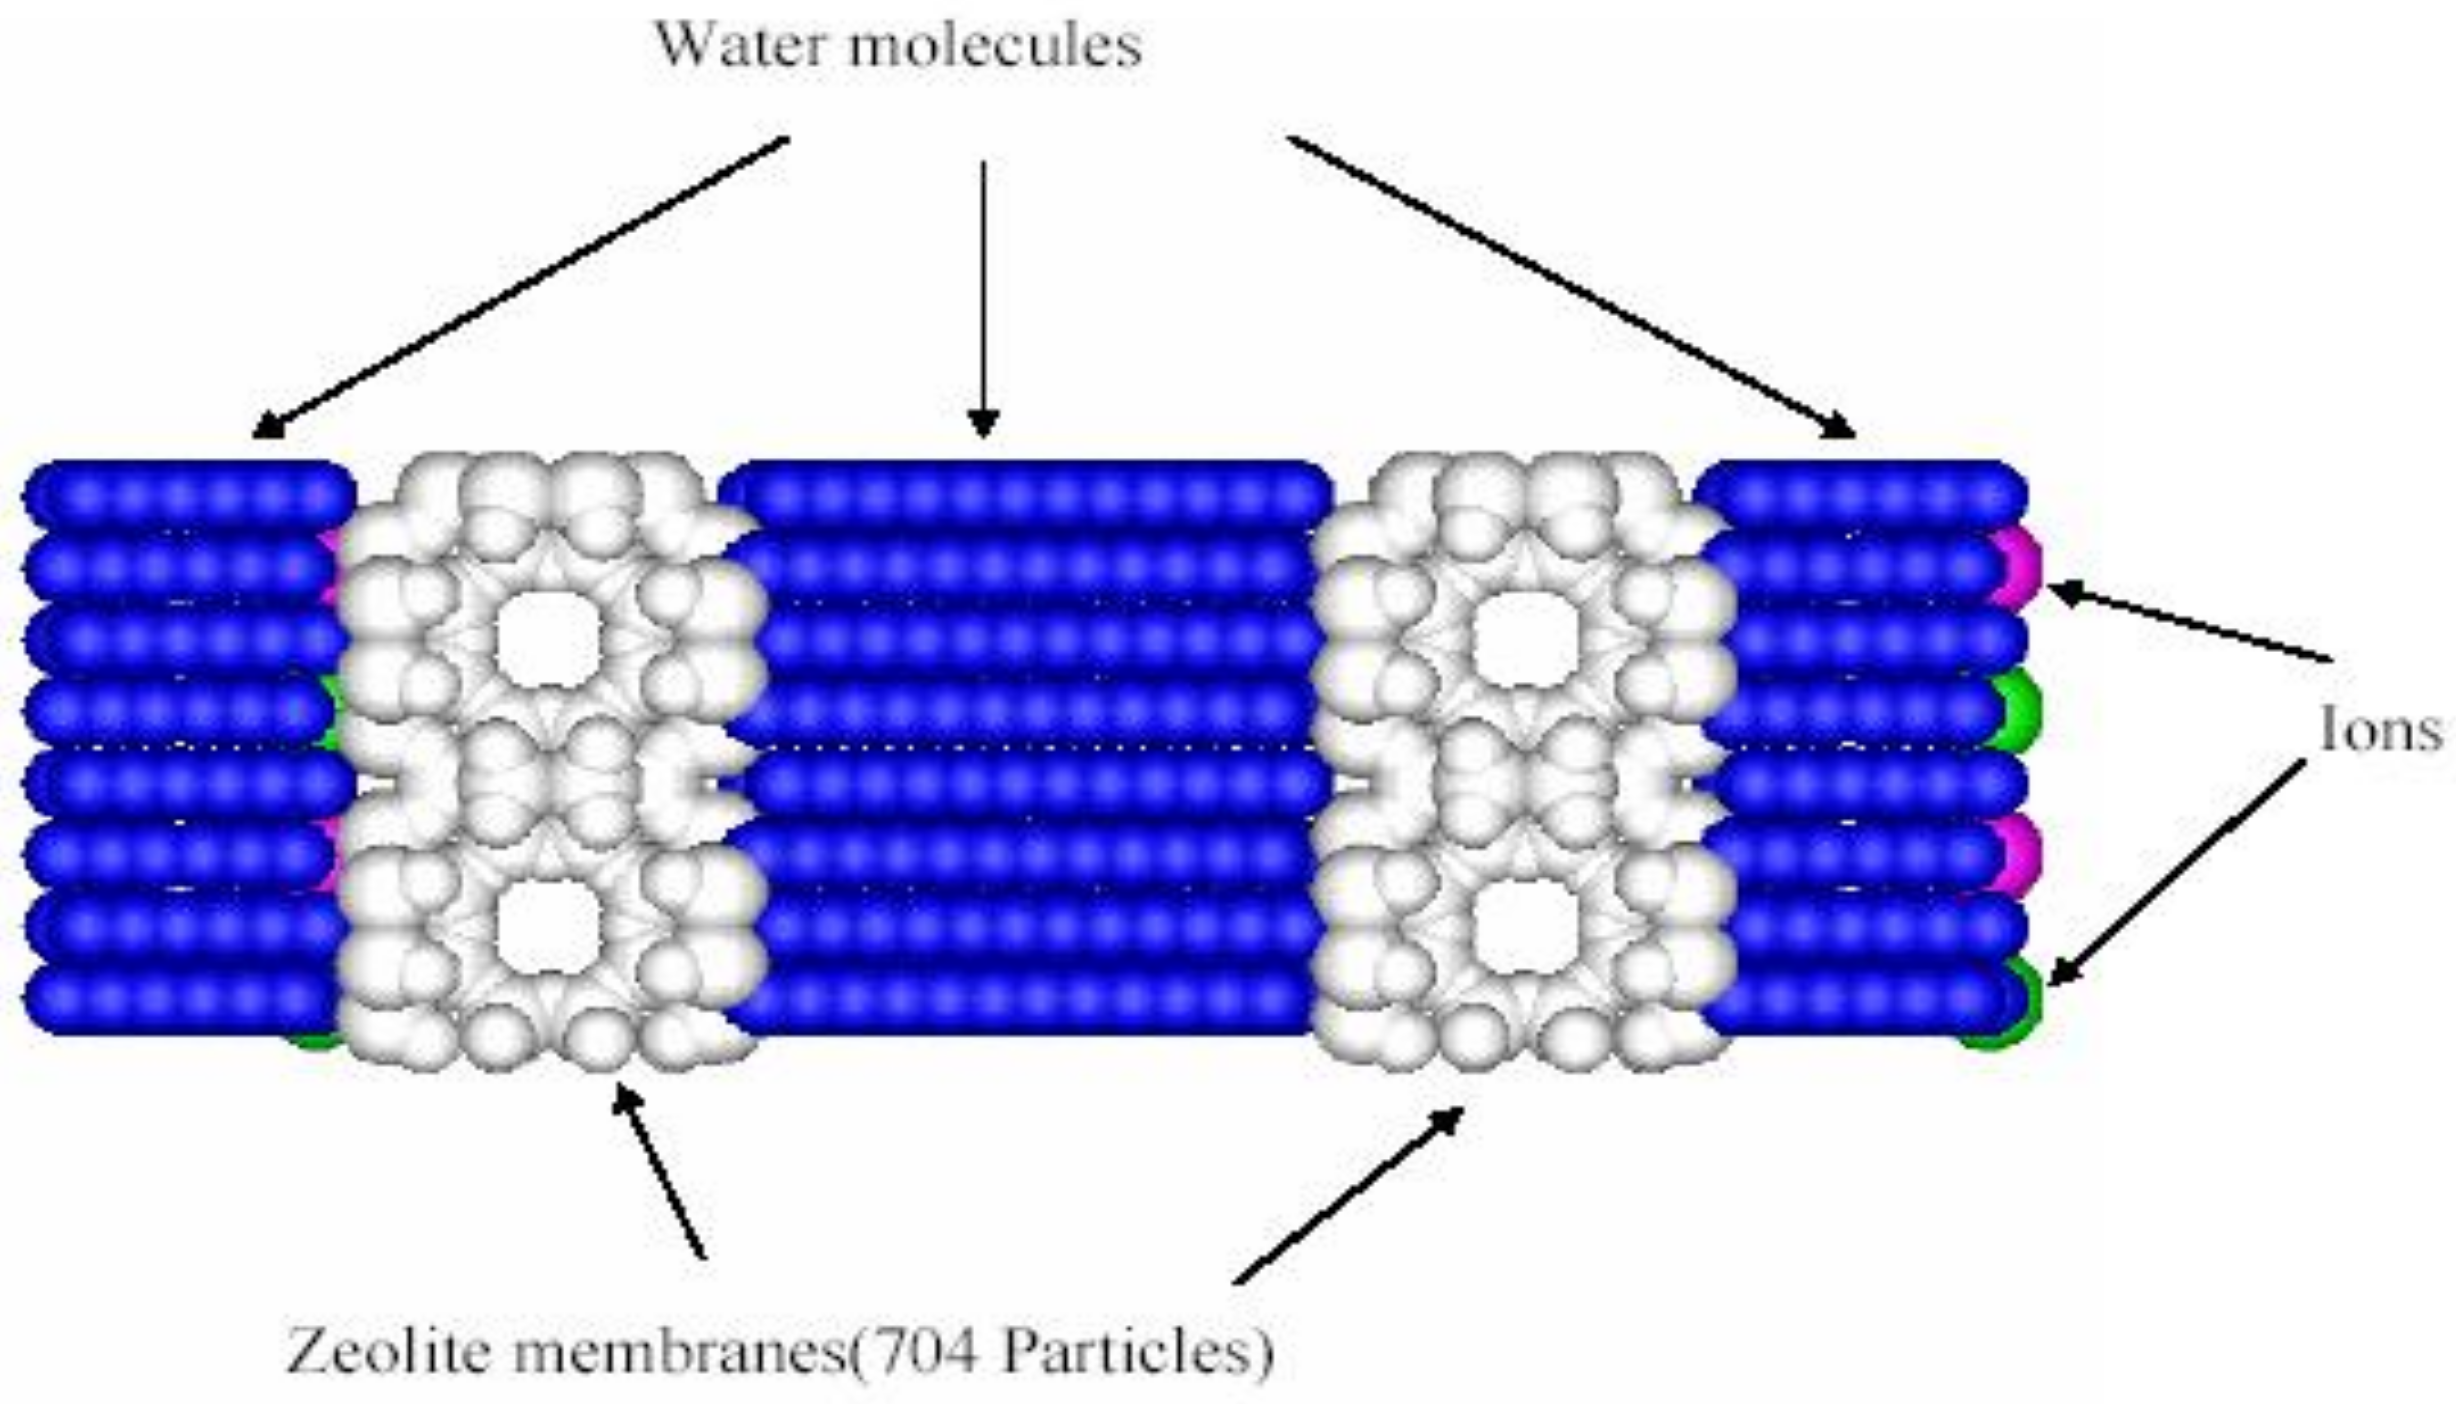
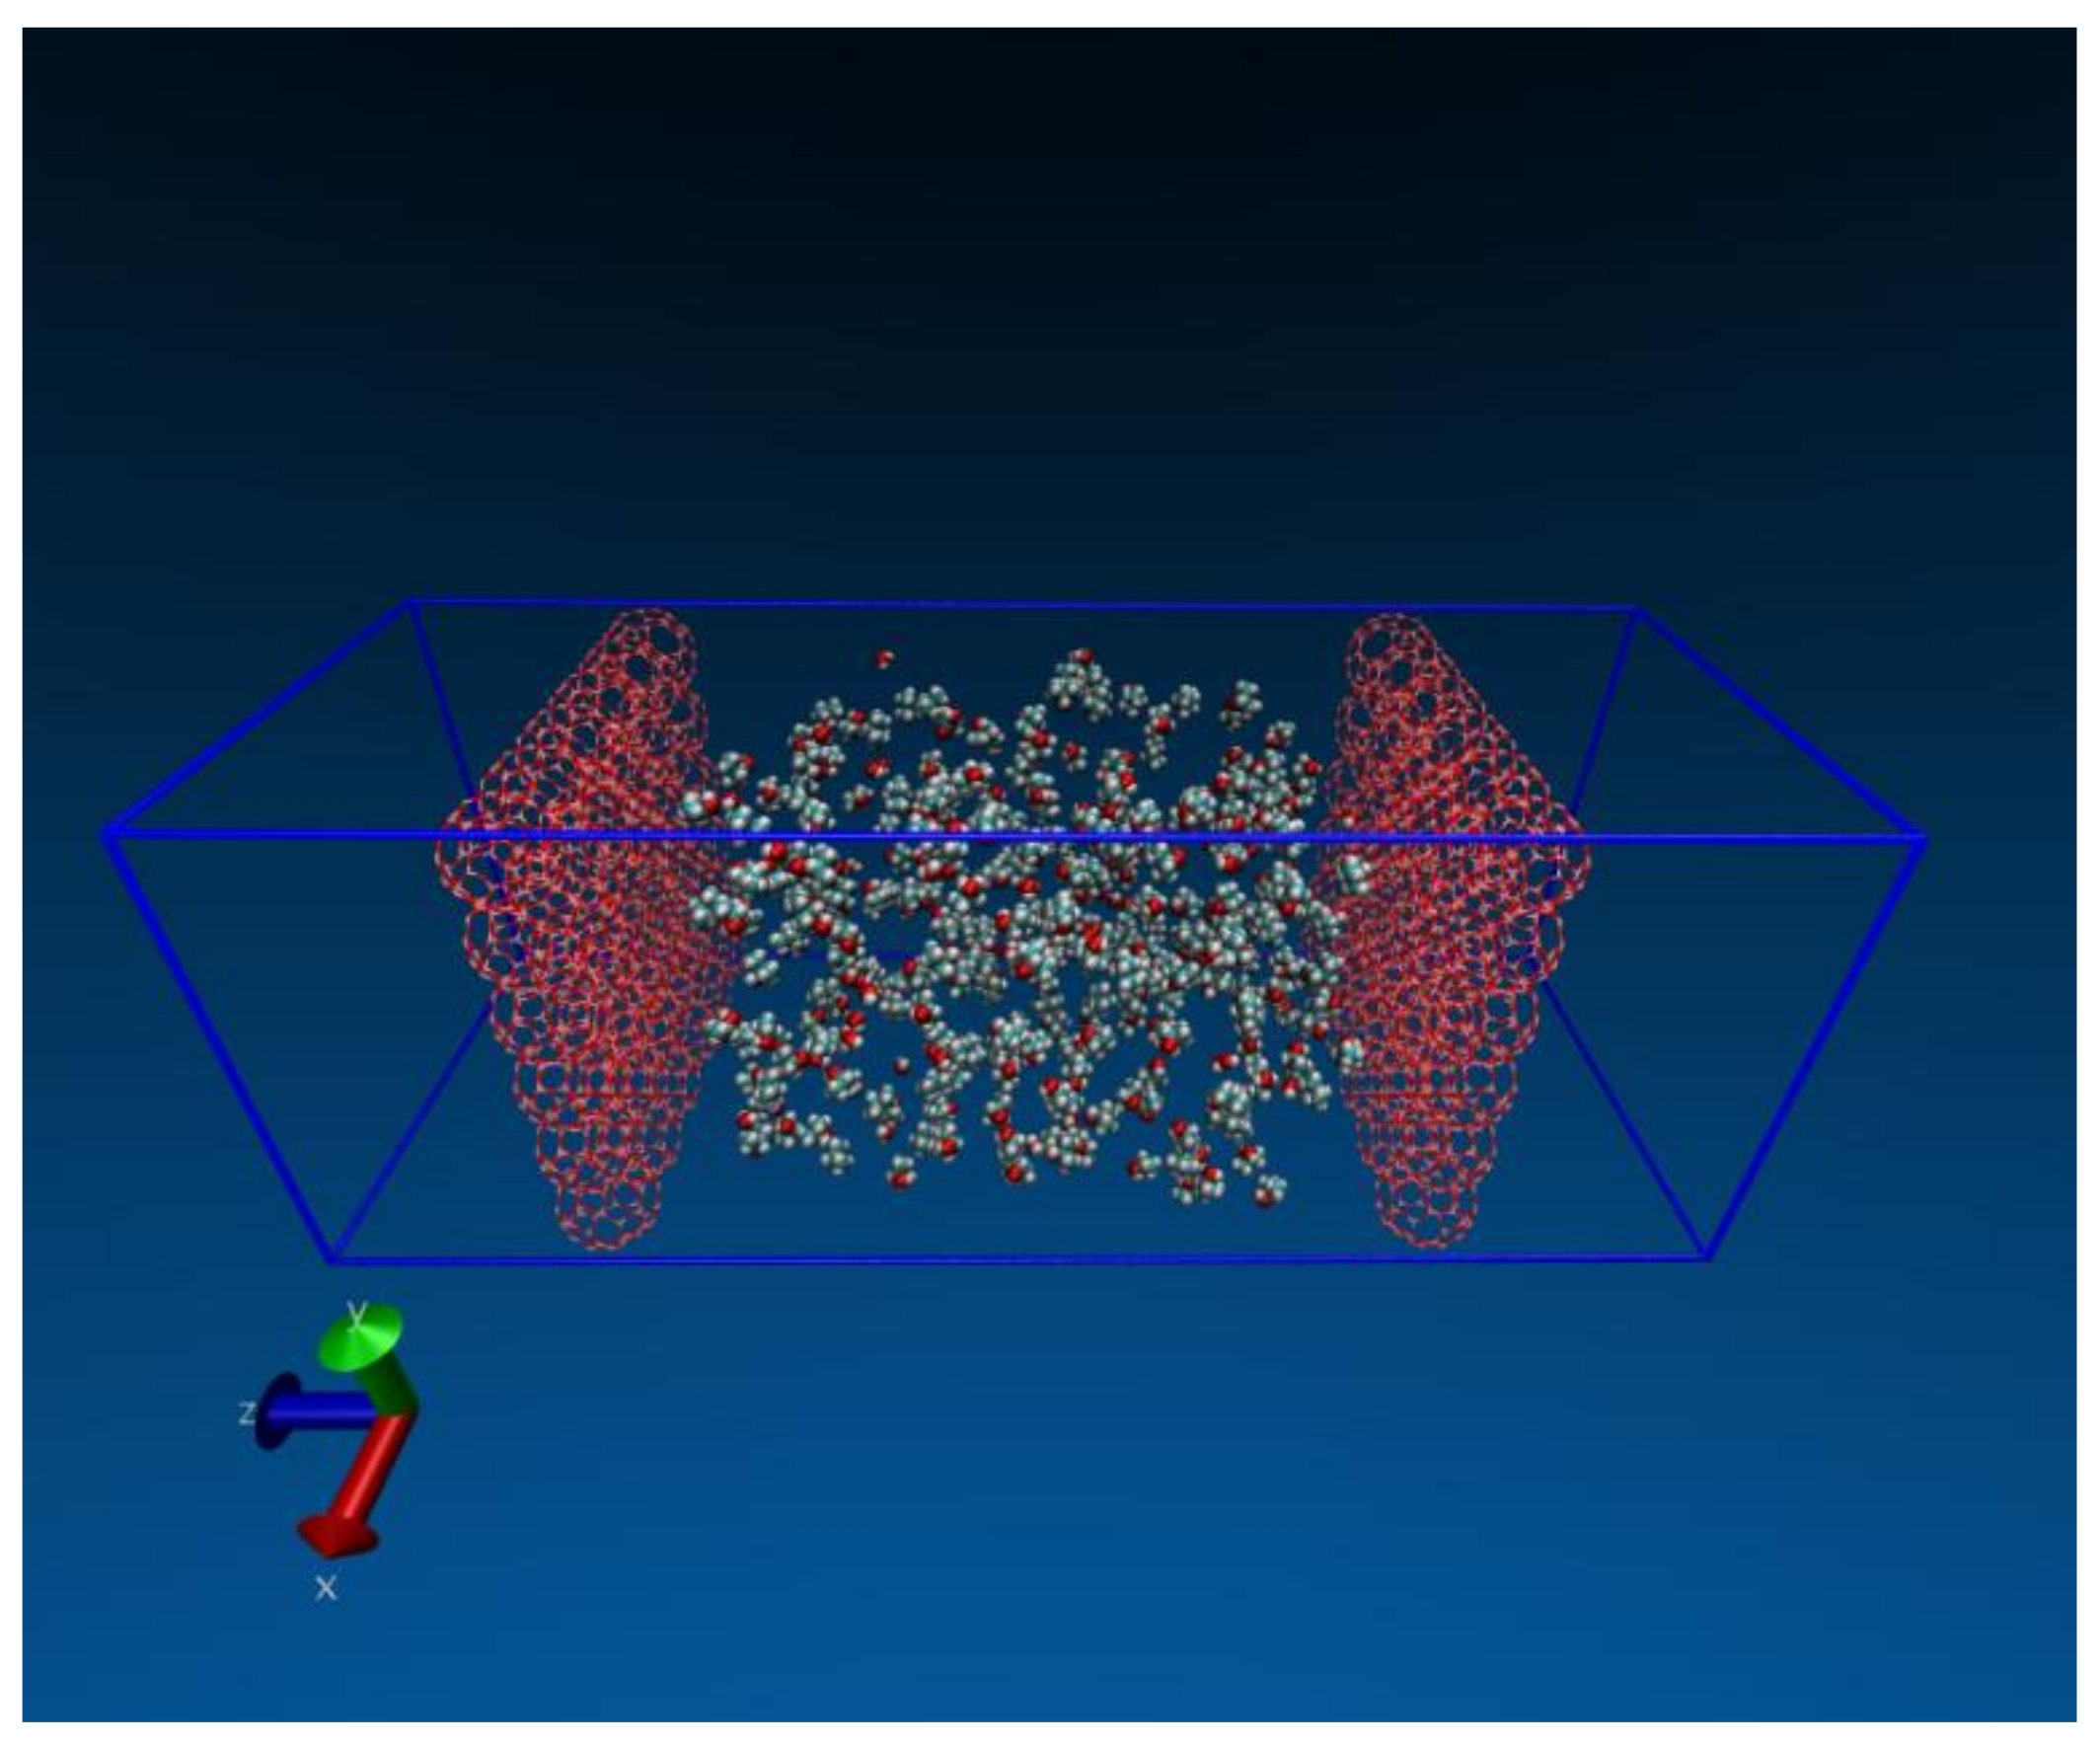
Another example of the use of molecular simulation to examine transport of water and ions in nanoporous membranes is the ion exchange between an aqueous solution and NaA zeolite. Our group carried out such a simulation to understand the molecular basis of such exchanges [14]. The schematic for such a simulation is shown in Figure 3.
Molecular simulations were used to study both the dynamics and energetics of ion exchanges between monovalent and bivalent cations in aqueous solutions (both supercritical and subcritical/liquid. In this study simulations of up to a nanosecond or more were carried out in which Li+ and Ca++ in aqueous solutions of LiCl and CaCl2 came in contact with an ion exchange membrane (NaA zeolite). NaA zeolites are widely used in many commercially used on exchange processes including detergents. Our results showed that with appropriate driving forces (in this case pressure driven), such ion exchange processes can be clearly observed and investigated using molecular simulations at the time scales accessible in simulations. We were also able to understand the phenomenon of ion-exchange itself at the molecular level. Our simulations have shown that the ion-exchange process is primarily energetically driven and entropic forces do not appear to play a significant role in the ion exchanges observed. For supercritical LiCl solutions, we found rather small differences between the energy of the Li+ ion inside and outside the membrane. In contrast, for Na+ there was a significant energetic advantage in being outside the membrane, making the overall exchange process more energetically favorable. In subcritical (liquid) LiCl solutions we found exchange to be more favorable energetically than in supercritical solutions. For Ca++ similar behavior was observed, except for the observation that the differences in the energies were much larger (compared to the corresponding Li+ exchanges), making them more energetically efficient, as has also been observed experimentally [15]. These differences are in clearly shown in Figure 4. In addition to clarifying the molecular basis for these ion exchanges, simulations can also potentially be very useful to determine the behavior (e.g., state dependence, etc.) of hydrodynamic parameters commonly used to characterize ion-exchange processes at a fundamental molecular level, and to determine if the continuum hydrodynamic equations used for ion-exchange processes are applicable to nano-systems.
2.3. Transport in Gas Separations Membranes
Molecular modeling has also been used to study the transport and subsequent separation of gases using nanoporous membranes. A study carried out by our group using a range of zeolite membranes to support gaseous mixtures has shown good agreement with experiments exhibiting the viability of using molecular modeling to study such separations [14]. The simulation setup for such a study is shown in Figure 5.
We performed a rather vigorous test of the reliability of the simulation technique to examine the separation factor of CO2/N2 and O2/N2 mixtures in zeolite membranes. In separations, the ideal separation factor (ISF) is defined as the ratio of the permeabilities of the two gases in their pure state and the usual separation factor (SF) relates to the permeabilities in mixtures (equimolar in our studies). Data obtained from our simulations can be seen in Figure 6 along with experimental results measured on similar systems.
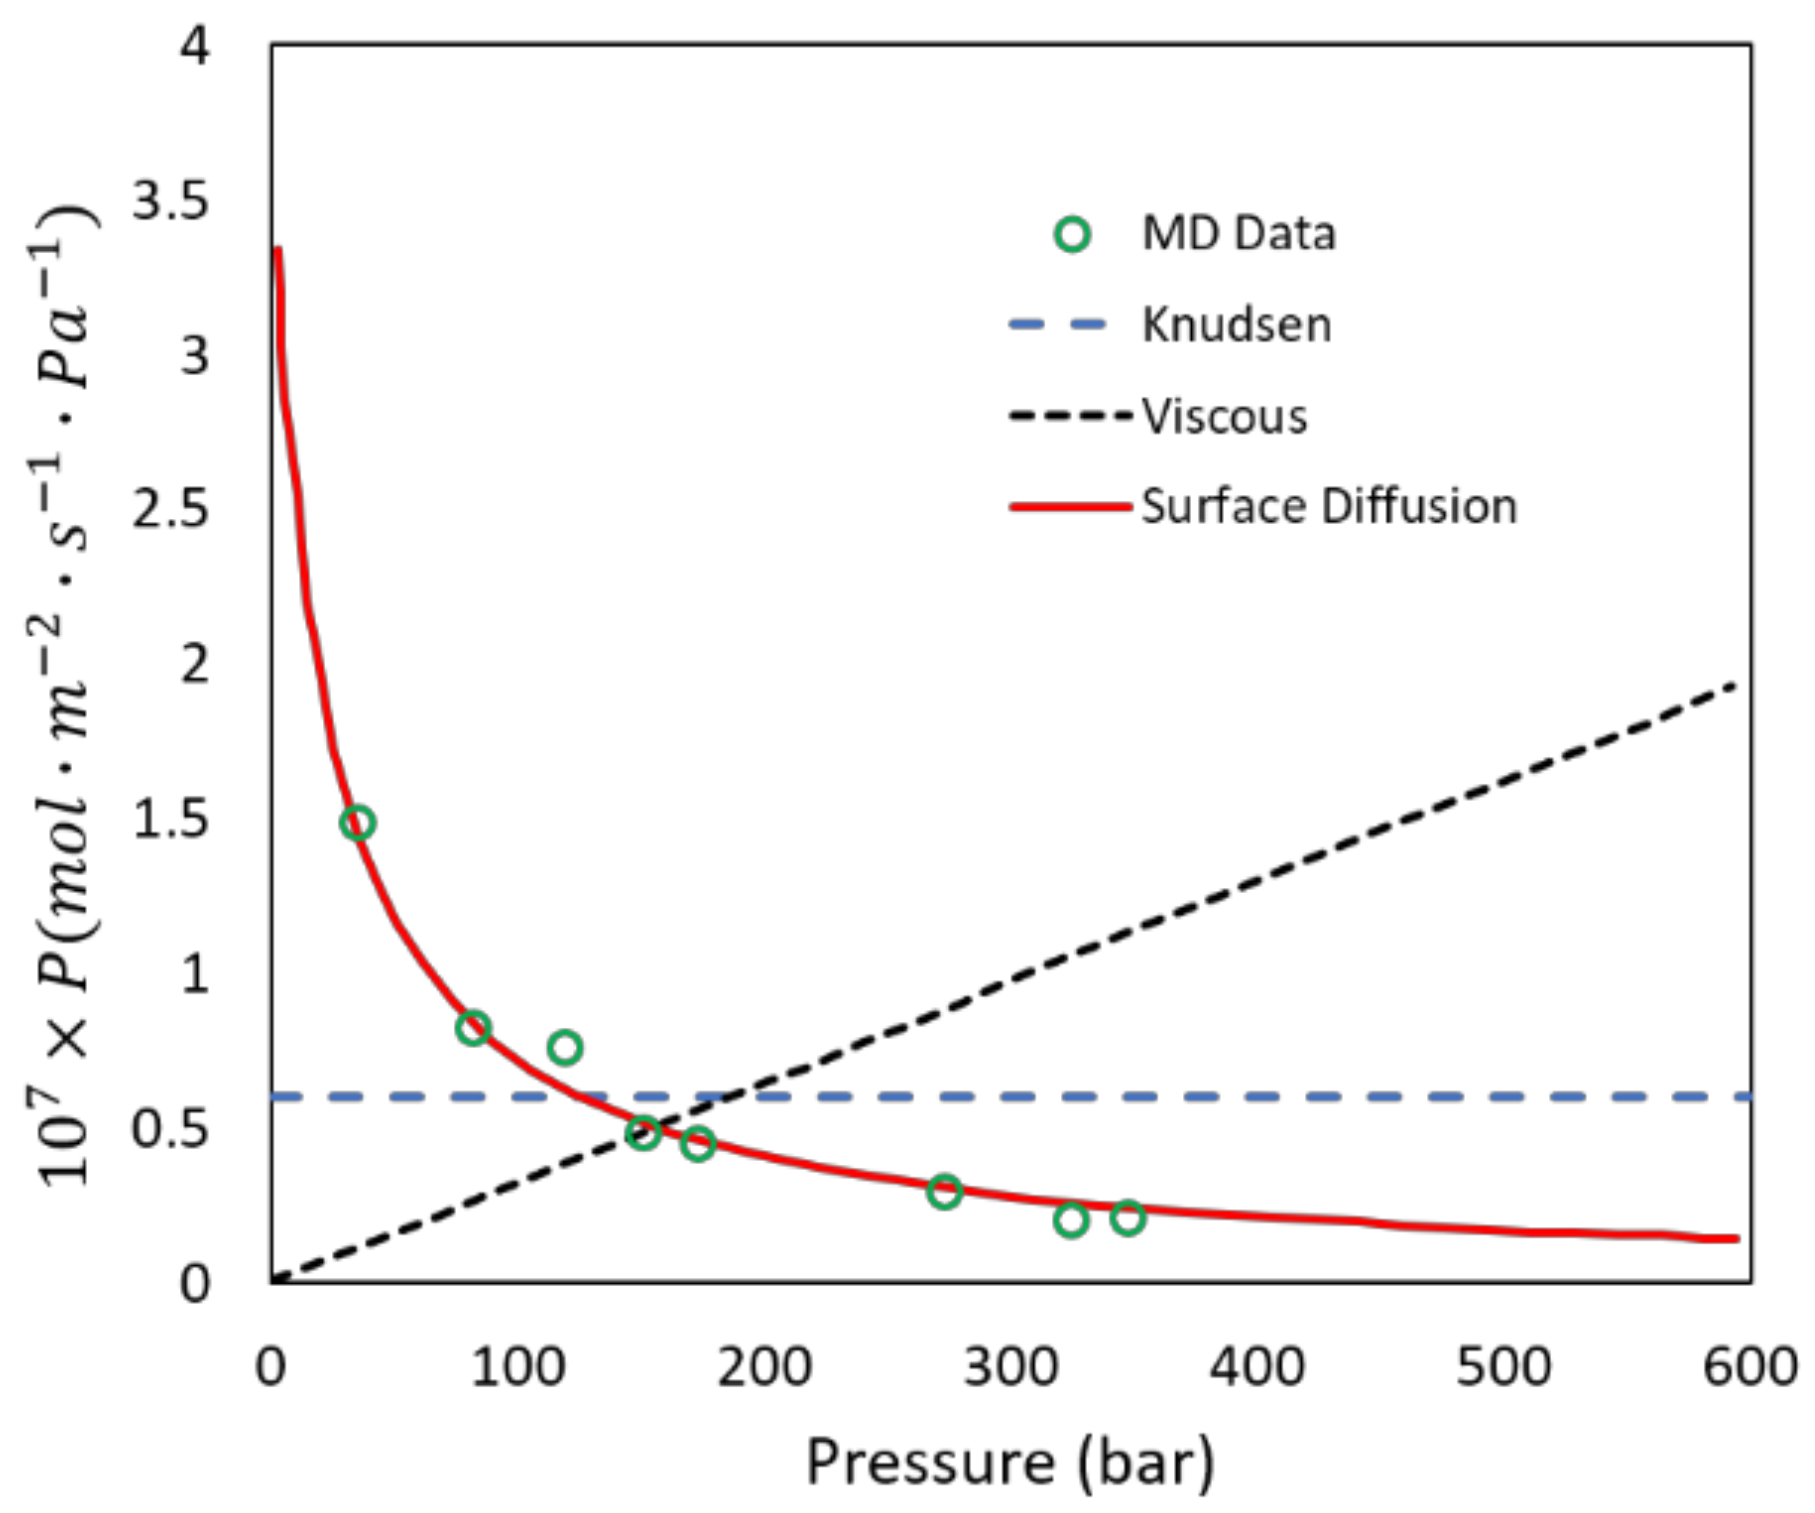
While examining N2/O2 mixtures the ISF > SF, in CO2/N2 mixtures the opposite trend is observed (SF > ISF). Additional results from our simulations are shown in Figure 7 and confirm this behavior. This phenomenon can be explained as follows, based on observations from our simulations. In the case of N2/O2 for pure fluids N2 has a higher diffusion rate than oxygen which leads to high SF since both have similar loadings. In mixtures this effect is dampened since the narrow pores do not allow N2 to cross O2 in mixtures. For pure CO2 and N2, CO2 has a somewhat higher loading than N2 which leads to CO2 having a higher selectivity. In mixtures, the loading is exclusively CO2 because of its high quadrupolar moment, which increases the selectivity in mixtures by almost a factor of 3, correctly predicted by the simulations. In addition, simulations can be a useful tool to determine the type of diffusion in the nanopores. For example, the simulations clearly show surface diffusion of N2 in the zeolite pores as shown in Figure 7.
2.4. Membranes for Redox Flow Batteries
Redox flow batteries (RFBs) show significant potential for energy storage because of their safety, capacity, and small environmental footprint [16,17]. However, this technology is not currently widely available due to problems with the ion-exchange membranes needed in RFBs. For an RFB with high storage capacity and high efficiency: (i) the electrode reactions must be reversible; (ii) both the oxidized and reduced species must have a high solubility in the electrolyte solution; (iii) there must be a large difference between the redox potentials. Several ion pairs satisfy these requirements, among them Fe/Cr [18], Zn/Br [19], and Zn/Ce [20]. Vanadium RFBs [21] constitute a special case in that only a single elemental species is present in the ions on both sides of the ion-exchange membrane (IEM). For this case the two half reactions are shown in Equation (1).
During charging and discharging process, current is transmitted through an external circuit while protons are transported across an IEM between the two electrode compartments. IEMs therefor play a critical role in the design of a RFB [22]. IEMs while being electrically insulating must also be impermeable to the reactive, vanadium ions species (see reactions above). RFBs currently employ polymeric membranes, more specifically sulfonated fluoropolymer-copolymers (commercially known as Nafion) [23]. While these polymer membranes show acceptable behavior as proton exchange membranes in fuel cells (PEMFC) as well as in direct methanol fuel cells (DMFC) [24], they do work as well in RFBs as they have stability problems in the highly reactive environment, resulting in the crossover of reactive ions and thus the reduction of cell efficiency and lifetime [25]. The highly oxidizing environment in RFBs also tends to degrade the polymer membrane [26,27]. While some improvements have been made in these polymeric membranes to increase selectivity and stability [23], they have not yet overcome all the obstacles for their widespread use in RFBs. New materials must therefore be considered if RFBs are to become an economically viable means of energy storage. We have focused on using zeolite membranes as an alternative to polymeric membranes. Zeolites are aluminosilicate crystals with ordered pore sizes ranging from 0.3 nm to >1.0 nm depending on the framework type. Zeolites with higher Si/Al ratios are electrically insulating and are also extremely stable in both acidic and basic conditions due to their inert chemical nature [28,29,30]. Previously, thin zeolite membranes have been observed to enable water/ion separation via the size-exclusion mechanism [8,31,32]. We believe that thin film zeolite membranes show considerable potential as IEMs in RFBs. The first experimental study to demonstrate this was carried out by Yang et al. [33].
To test this possibility, we have carried out molecular dynamics studies of six different zeolite frameworks (ERI, LTA, MFI, BEC, CFI, DON) for vanadium RFBs to determine the transport behavior of ions, protons, and solvent in the nanopores of the membranes [34]. The structure of these membranes were obtained from the IZA-SC’s Database of Zeolite Structures [35] and constructed to have a thickness of a single unit cell. As discussed previously, the hydration of the vanadium(II) [V2+], vanadium(III) [V3+], oxovanadium(IV) [VO2+], and dioxovanadium(V) [VO2+] ions plays a key role in ion transport and this effect was examined in detail. We found that a relatively large pore (~7 Å) was necessary for ion transport due to the strongly bound hydration shell that effectively increases the size of the ion. At higher ion concentrations we have observed passive (spontaneous with no external forces) permeation of the pores by the ions. This was observed in our studies when both the ion concentration and the temperature were significantly higher than the normal operating conditions in RFBs (8 mol %, 400 K). We note that even at these extreme conditions, we observed permeation and subsequent transport of only H3O+ ions in ERI, LTA, and MFI membranes. We did not observe any vanadium ion transport across the zeolite (Figure 8b). Therefore, we propose these membranes would be more suited in RFBs because they exhibit the necessary ion selectivity. This agrees with experimental measurements by Xu et al. [36] who have reported similar selective transport using substrate-supported zeolite membranes with ERI frameworks. In contrast, the larger pores in BEC, CFI, and DON frameworks did allow permeation and transport of all ion species V2+, V3+, VO2+, and VO2+ in addition to hydronium ions (Figure 8a), which would thus make them unsuitable for vanadium redox flow batteries as they present no proton selectivity.
This again showed that the size of the hydrated ion complex is a significant factor in zeolite membrane transport. The only ion transported through the membranes with smaller pores (<5 Å) such as ERI, LTA, and MFI zeolite frameworks was the hydronium ion (H3O+/proton) which has a kinetic diameter of 0.31 nm compared to 0.58 nm of V++. Therefore, these membranes demonstrate selective transport of hydronium ions over vanadium ions that is an essential requirement for IEMs in vanadium RFBs.
To improve our understanding of the transport mechanism of the hydrated ions through a range of zeolite pores, we placed a single ion on the pore axis and transported it through the membrane at a constant velocity of 0.75 m/s. This steered molecular dynamics (SMD) method differs from the passive diffusion observed previously and permits the calculation of the Kirkwood potential of mean force (PMF) [37] across the membrane. The PMF measures the average force for all configurations along the “reaction path”. PMF can be used to determine the energy barriers for membrane permeation [38]. The force needed to keep the hydrated ion on the pore axis (Fc) is assumed to be the opposite of the total pairwise force (Fp) exerted on the ion:
where U is the total pairwise intermolecular potential. This force can then be integrated along the path maintained by the SMD which, for the one-dimensional path used here, leads to Equation (3):
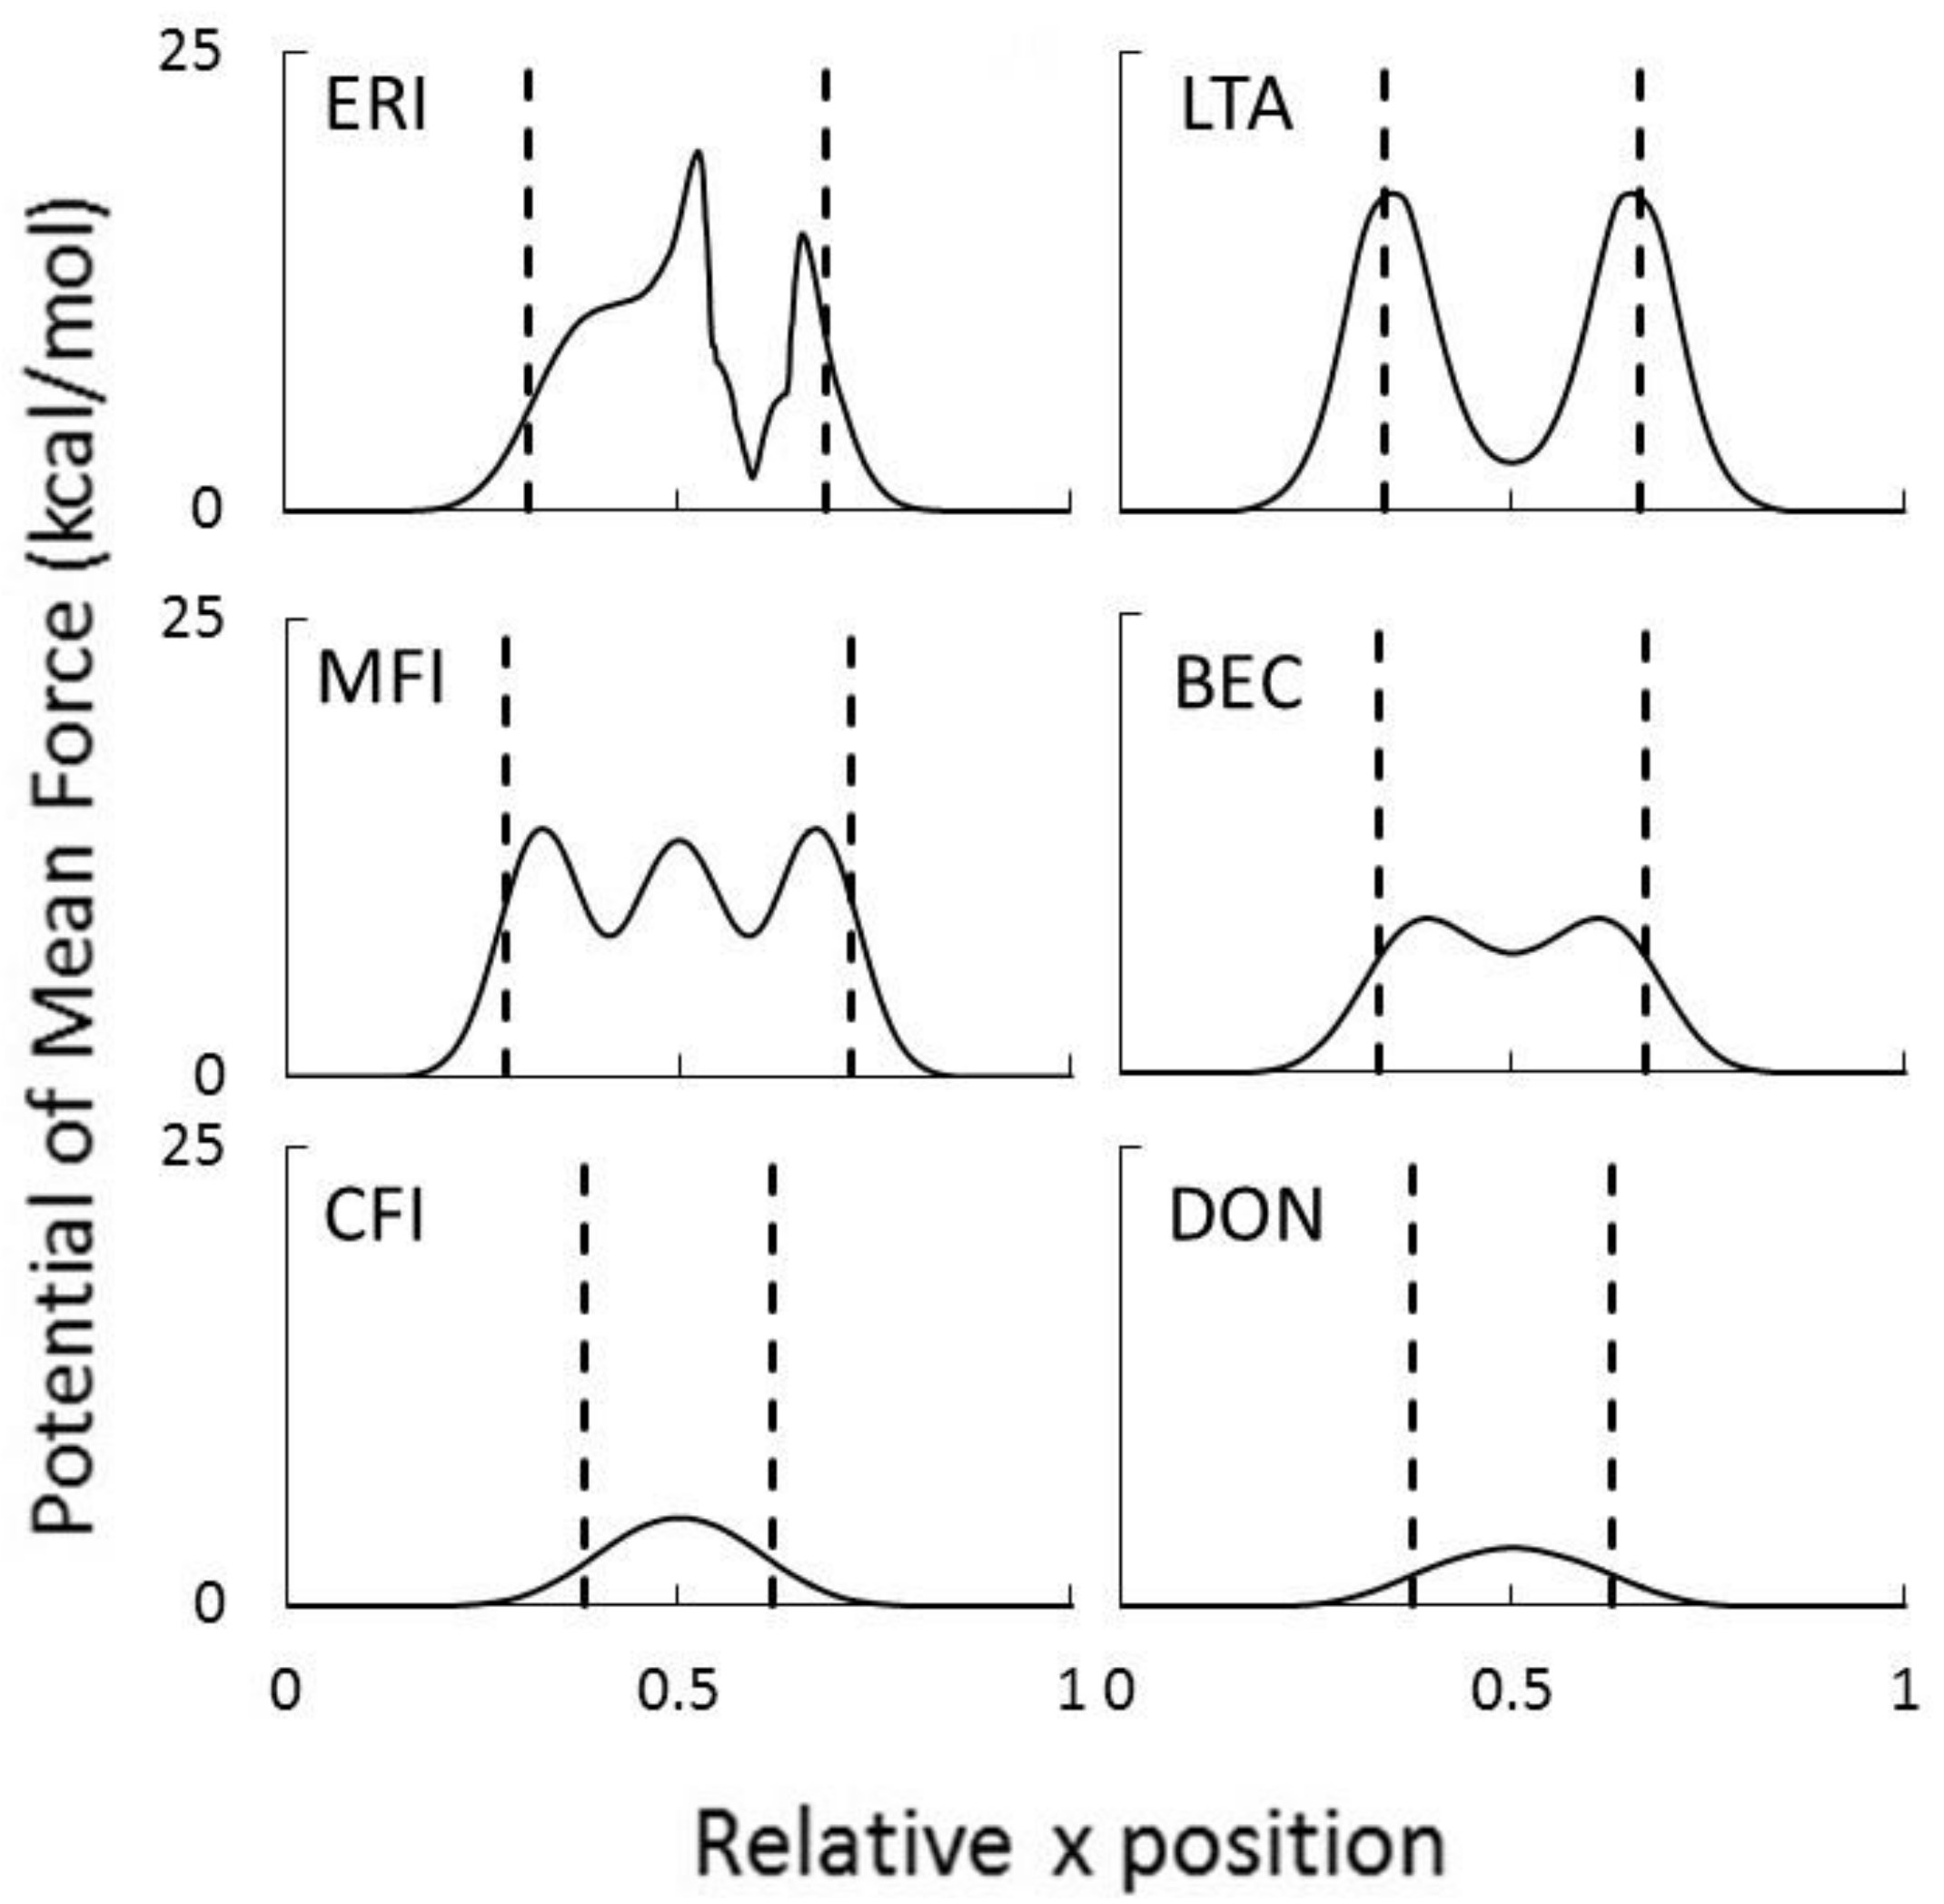
The PMFs obtained using this approach are shown in Figure 9.
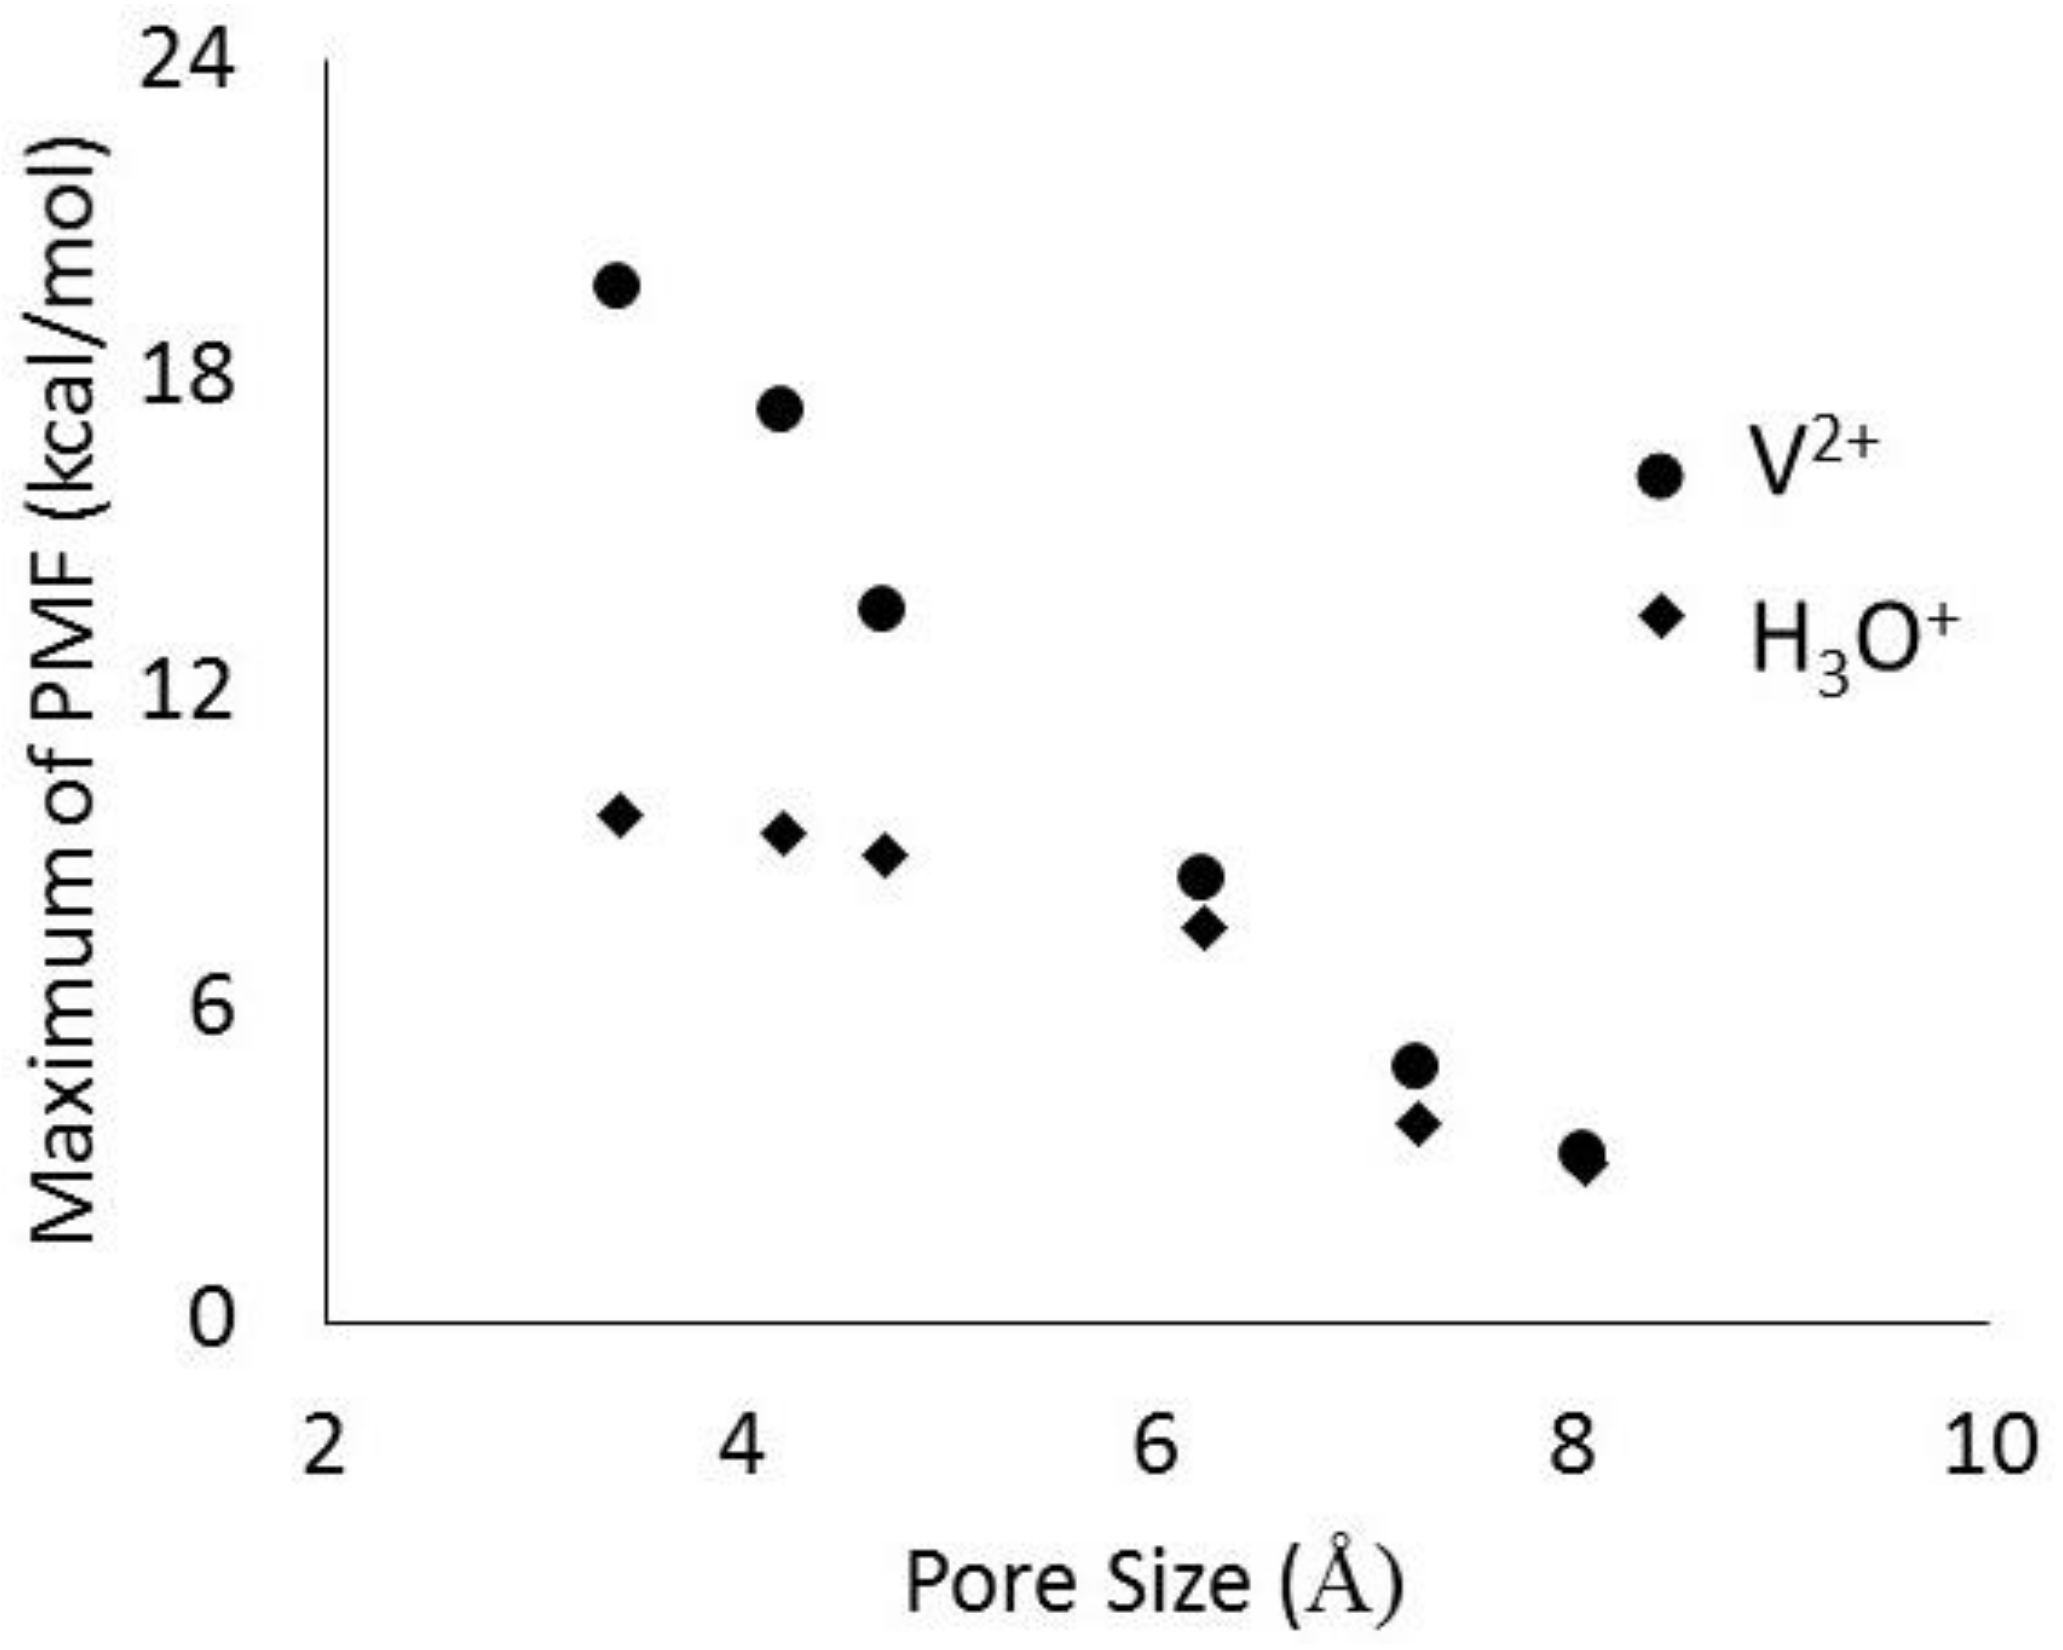
The jagged (sharp peaks) behavior of the PMF for the ERI membrane results from changes in the number of water molecules in the hydration shell as it moves across the membrane. These pores are rather small, so in order for the ion to be forced through the pores, some of the hydrating waters must be removed so that the cluster is small enough to enter the pore. Once it leaves the membrane, the ion is hydrated again resulting in the reappearance of the stable cluster. The ERI profile also shows asymmetric behavior. This is because the rather quick movement of the ion in the membrance (0.75 m/s) does not allow for local equilibrium of the changing number of water molecules in the hydration shell as it moves along the pore axis. The local minima shown for LTA, MFI, and BEC membranes also indicates the most favorable location for the hydrated complex within the pore. These locations correspond to the cavity at the intersection of the channels running in 3 directions within the zeolite membrane. For CFI and DON membranes the maxima is observed at the center because their pores are 1-dimensional channels. In Figure 9, it is also clear that the free energy barrier at the entrance decreases with increasing pore size. While results for other vanadium ions all showed similar behavior, the hydronium ion profiles are quite different in magnitude. In Figure 10 we have compared the PMF peak heights for V2+ and H3O+ ions in the six zeolites membranes shown in Figure 9. The large differences observed in the free energy barriers for the vanadium ions and hydronium ions for zeolites with pores less than 5 Å shows the effectiveness of selective transport, a desirable characteristic of RFB IEMs.
Further examination of the orientation of the hydrated ion complexes during membrane permeation yields additional insights to the relative size of the zeolite pores and the diffusing species. The [V(H2O)6]2+/3+, [VO(H2O)5]2+, and [VO2(H2O)4]+ complexes have rather stable octahedral structures, so it is interesting to monitor the changes in orientation of the hydrated ions as they traverse the membrane during our directed simulations. We calculated the angle between: (1) a single V2+/3+-water pair and the pore axis for V2+/3+; (2) In the case of VO2+ the V-O bond and the pore axis, and finally for (3) VO2+ one of the V-O bonds and the pore axis. The results obtained are shown in Figure 11 for the BEC membrane. This membrane was chosen as the cluster size closely matches the pore dimensions (~6.08 Å for the cluster and ~6.23 Å for the pore). Unsurprisingly, this analysis shows that outside the membrane, the [V(H2O)6]2+ complex exhibits random tumbling. However, in the small pore of the BEC membrane the angular motion of the complex is restricted, and it remains in a certain orientation until it leaves the channel.
In addition to determining how zeolite pore size affects ion transport, we also investigated how zeolite composition could lead to differing behavior. The membranes described in the above analyses all consisted of solely silicon and oxygen representing a Si/Al ratio of infinity. These membranes were shown to display selectivity of the hydronium ion over the heavy vanadium ions in the vanadium-RFB at pore sizes below a certain threshold. The composition of these membranes was then modified to incorporate various levels of aluminum substitution. Seven membranes of the identical MFI framework, but varying aluminum content were constructed representing Si/Al ratios of infinity, 383, 191, 95, 54, 47, and 31. The aluminum atoms were substituted at sites corresponding to the T7, T10, and T12 sites as described in studies which previously modeled the uptake of gas into MFI zeolites [39,40]. The substitutions also followed Lowenstein’s Rule [41,42] which does not allow for the presence of Al-O-Al linkages. In order to ensure that the membrane remained charge neutral, the local negative charges due to the aluminum atoms were spread across the four neighboring oxygens and an extra-framework sodium ion was placed in the channel in the vicinity of the substitution. These cations were allowed to equilibrate and find their lowest energy positions prior to the addition of any water or ions to the system.
The aluminum-substituted MFI membranes were used with the same protocol and system setup to ensure that the local charges on the aluminum atoms did not disrupt the hydrated ion complex or allow vanadium ions to permeate the membrane and alter its selective character. Our results showed that for all levels of Si/Al ratios, we still observed no spontaneous vanadium permeation for the entire simulation time of 10 ns. Once this selective characteristic had again been confirmed, the vanadium cations were replaced with hydronium ions in order to measure the dynamics of proton transport. Since the principle of the RFB mechanism rests on protons being released by the reaction in one half-cell and moving through the membrane to be used in the complimentary reaction in the other half-cell, the membranes not only need to be selective for proton transport, but also must have a high enough permeability that they not limit the reaction. For this reason, it is necessary to observe whether or not the membrane permeability is tunable using the Si/Al ratio in order that the proton flux be maximized. The flux of any species through a membrane is proportional to the concentration difference and the permeability [43] (Equation (4)).
Here the permeability, Pm, can be represented as the product of the membrane loading, , and the intramembrane diffusion, Dm (Equation (5)). Each of these quantities were measured independently in order to determine which was more strongly affected by the membrane composition.
Membrane Loading: In order to observe the ionic loading of the membrane, the system consisting of a single membrane with solution on both sides was studied with the various levels of aluminum substitution. The solution consisted of a 5 mol % HCl solution in which the dissociated proton was modeled as a hydronium ion, or protonated water molecule (H3O+). For each membrane, the system was simulated until the number of hydronium ions absorbed reached an equilibrium value, this process was usually complete after ~2 ns. The number was then averaged over an additional 0.5 ns to obtain the final values presented in Table 1.
The data clearly shows an increase in the number of framework substitutions results in an increase in the uptake of hydronium ions. This agrees with previous findings regarding water uptake in MFI membranes [44], however the difference is much more pronounced with the charged species in this study. This increase in absorption is due to Coulombic attraction between the positively charged hydronium ions and the local negative charges present on the oxygens where aluminum atoms have been substituted within the zeolite membrane framework.
Intramembrane Diffusion: In molecular dynamics simulations, the calculation of diffusion coefficients in three dimensional systems is commonly performed using Equation (6), where MSD is the mean square displacement of the species of interest.
Because we are only interested in the rate of diffusion within the membrane and not in the bulk, care must be taken, when finding the MSD, that one accounts only for the intramembrane ions. This method indicates a slight decrease in the diffusion as more framework substitutions are made (Table 2). This decrease can be explained in a similar manner as the charged framework attracts more hydronium ion and results in an increased loading, this attraction also reduces the mobility of the absorbed ions when compared to those in the bulk solution.
However, our model for the proton provides an incomplete picture of what occurs in reality. Protons in aqueous solution are known to diffuse by hopping from one water molecule to another adjacent molecule via a process known as the Grothuss mechanism [45]. Work on this topic has been quite extensive [46,47,48,49,50] and modeling of this phenomenon is usually performed using techniques that account for quantum behavior. Here, the model we are using is solely classical in nature and represents a permanently hydrated water molecule [48]. Due to this quantum hopping, the mobility of H+ ions in water is significantly higher than other monoatomic ions. The diffusion measured above only accounts for what is termed “vehicular diffusion”, or the proton riding along with the water molecule. A measure of the “hopping diffusion”, which is the quantum effect, would provide a more complete picture of the hydronium diffusion, but is beyond the scope of this study. In addition quantum effects can also play a role in the entry of protons in the zeolite pores and this effect has not been explicitly included in our study, but we believe it is not as significant a contribution as the proton hopping inside the pore.
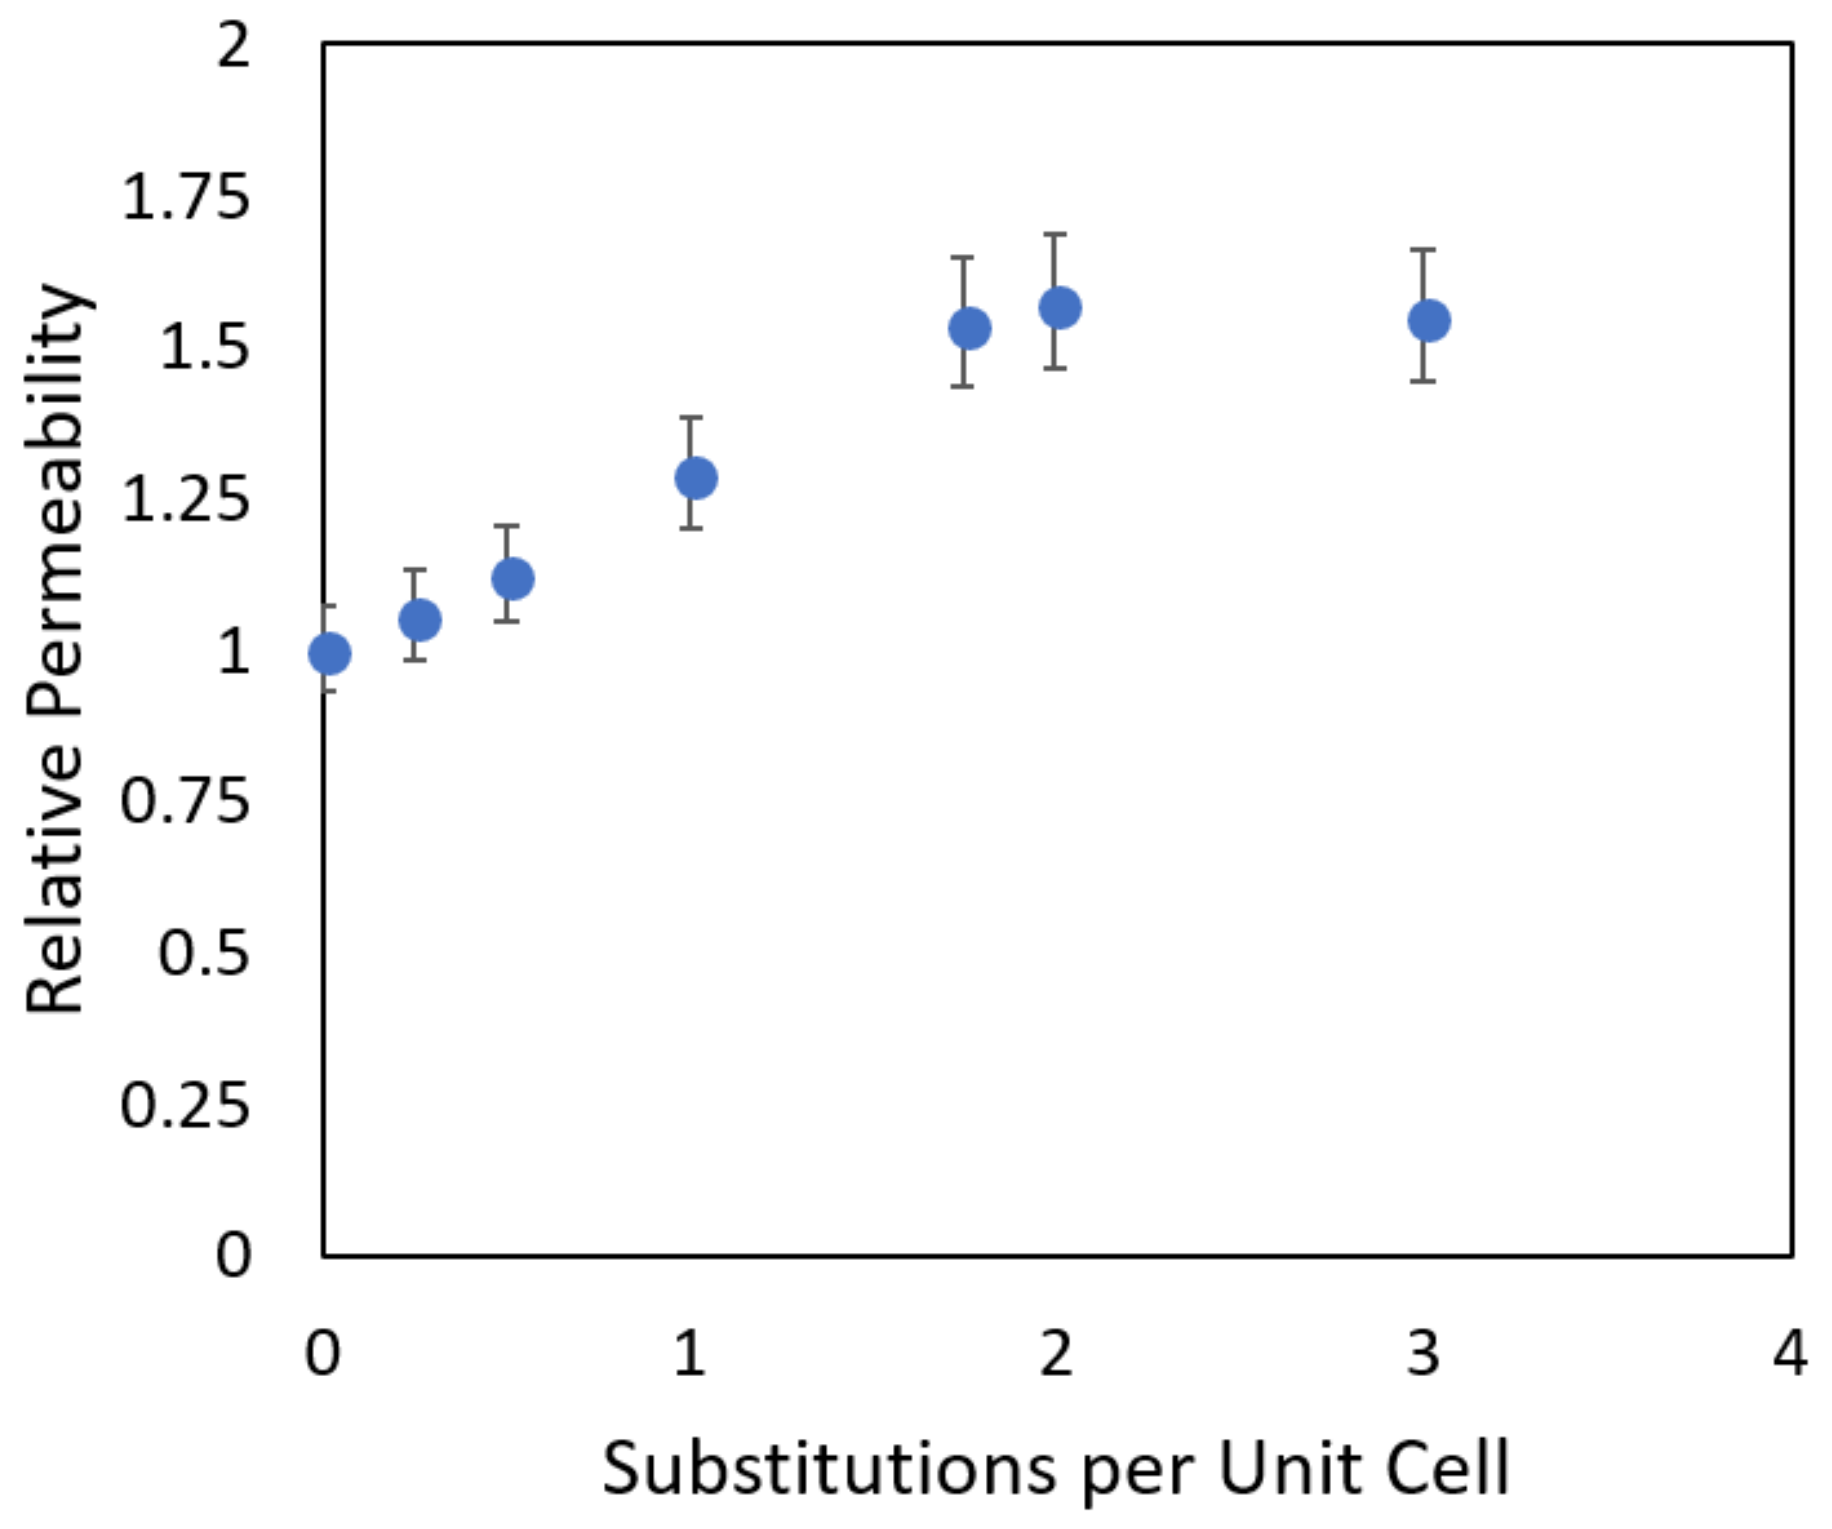
When the membrane loading and intra-membrane diffusion of the various systems are scaled relative to the pure silica membrane and the product is taken to find the relative permeability, an interesting trend emerges (Figure 12). At high Si/Al ratios (low substitution numbers), the relative permeability increases as the higher ion uptake dominates, but as more framework substitutions are made, the decreasing diffusion rate forces the permeability to stabilize at a constant value.
In this case, we observe that a substitution rate of ~2 per unit cell, corresponding to a Si/Al ratio of ~45 there exists a threshold beyond which we no longer see an increasing ionic flux. In this context, this represents the minimum number of aluminum substitutions per unit cell of zeolite that will maximize the proton transport through the membrane. As the values used here are relative to the pure silica membrane, one should not view these values as absolute, but the trends should be reproducible using experimental methods. Our simulations show that both the resistance to ion entry to the zeolite pores and their subsequent diffusion inside the pore play an important role in the overall permeation rate in the zeolite membrane. For example as shown in Figure 9, other than the LTA membrane the highest resistance to ion transport does not occur at the pore entrance. In these cases the diffusion rate can be the rate determining step for the overall permeation.
2.5. Dehydration of Alcohol
We discuss finally our recent studies using molecular dynamics to understand unexpected results observed in experiments [7]. Again, we emphasize the high temporal and spatial resolution provided by molecular simulations lead to increased insights into certain non-intuitive phenomena. In this particular case, a NaA zeolite membrane was used to dehydrate alcohol via vapor phase pervaporation. While the membrane was quite effective when the water content was 5% by weight, it became ineffective when the water content dropped to 1%. Such an observation certainly is counter-intuitive because in general membranes should be more effective when the undesirable component is at a lower concentration. The schematic of the system designed for this study is shown in Figure 13. The middle compartment of the simulation system contains the vapor phase mixture being investigated. Two layers of NaA zeolite membranes separate this compartment from the two side compartments which are initially empty (vacuum). This provides the driving force for the vapor to permeate the zeolite membranes. The system size was chosen to ensure that no vapor condensation takes place in the bulk phase of the vapor compartment at the system temperature of 423 K. By removing some atoms that constitute the membrane we are also able to simulate a zeolite membrane with defects of approximately 1 nm—similar to those observed experimentally [7].
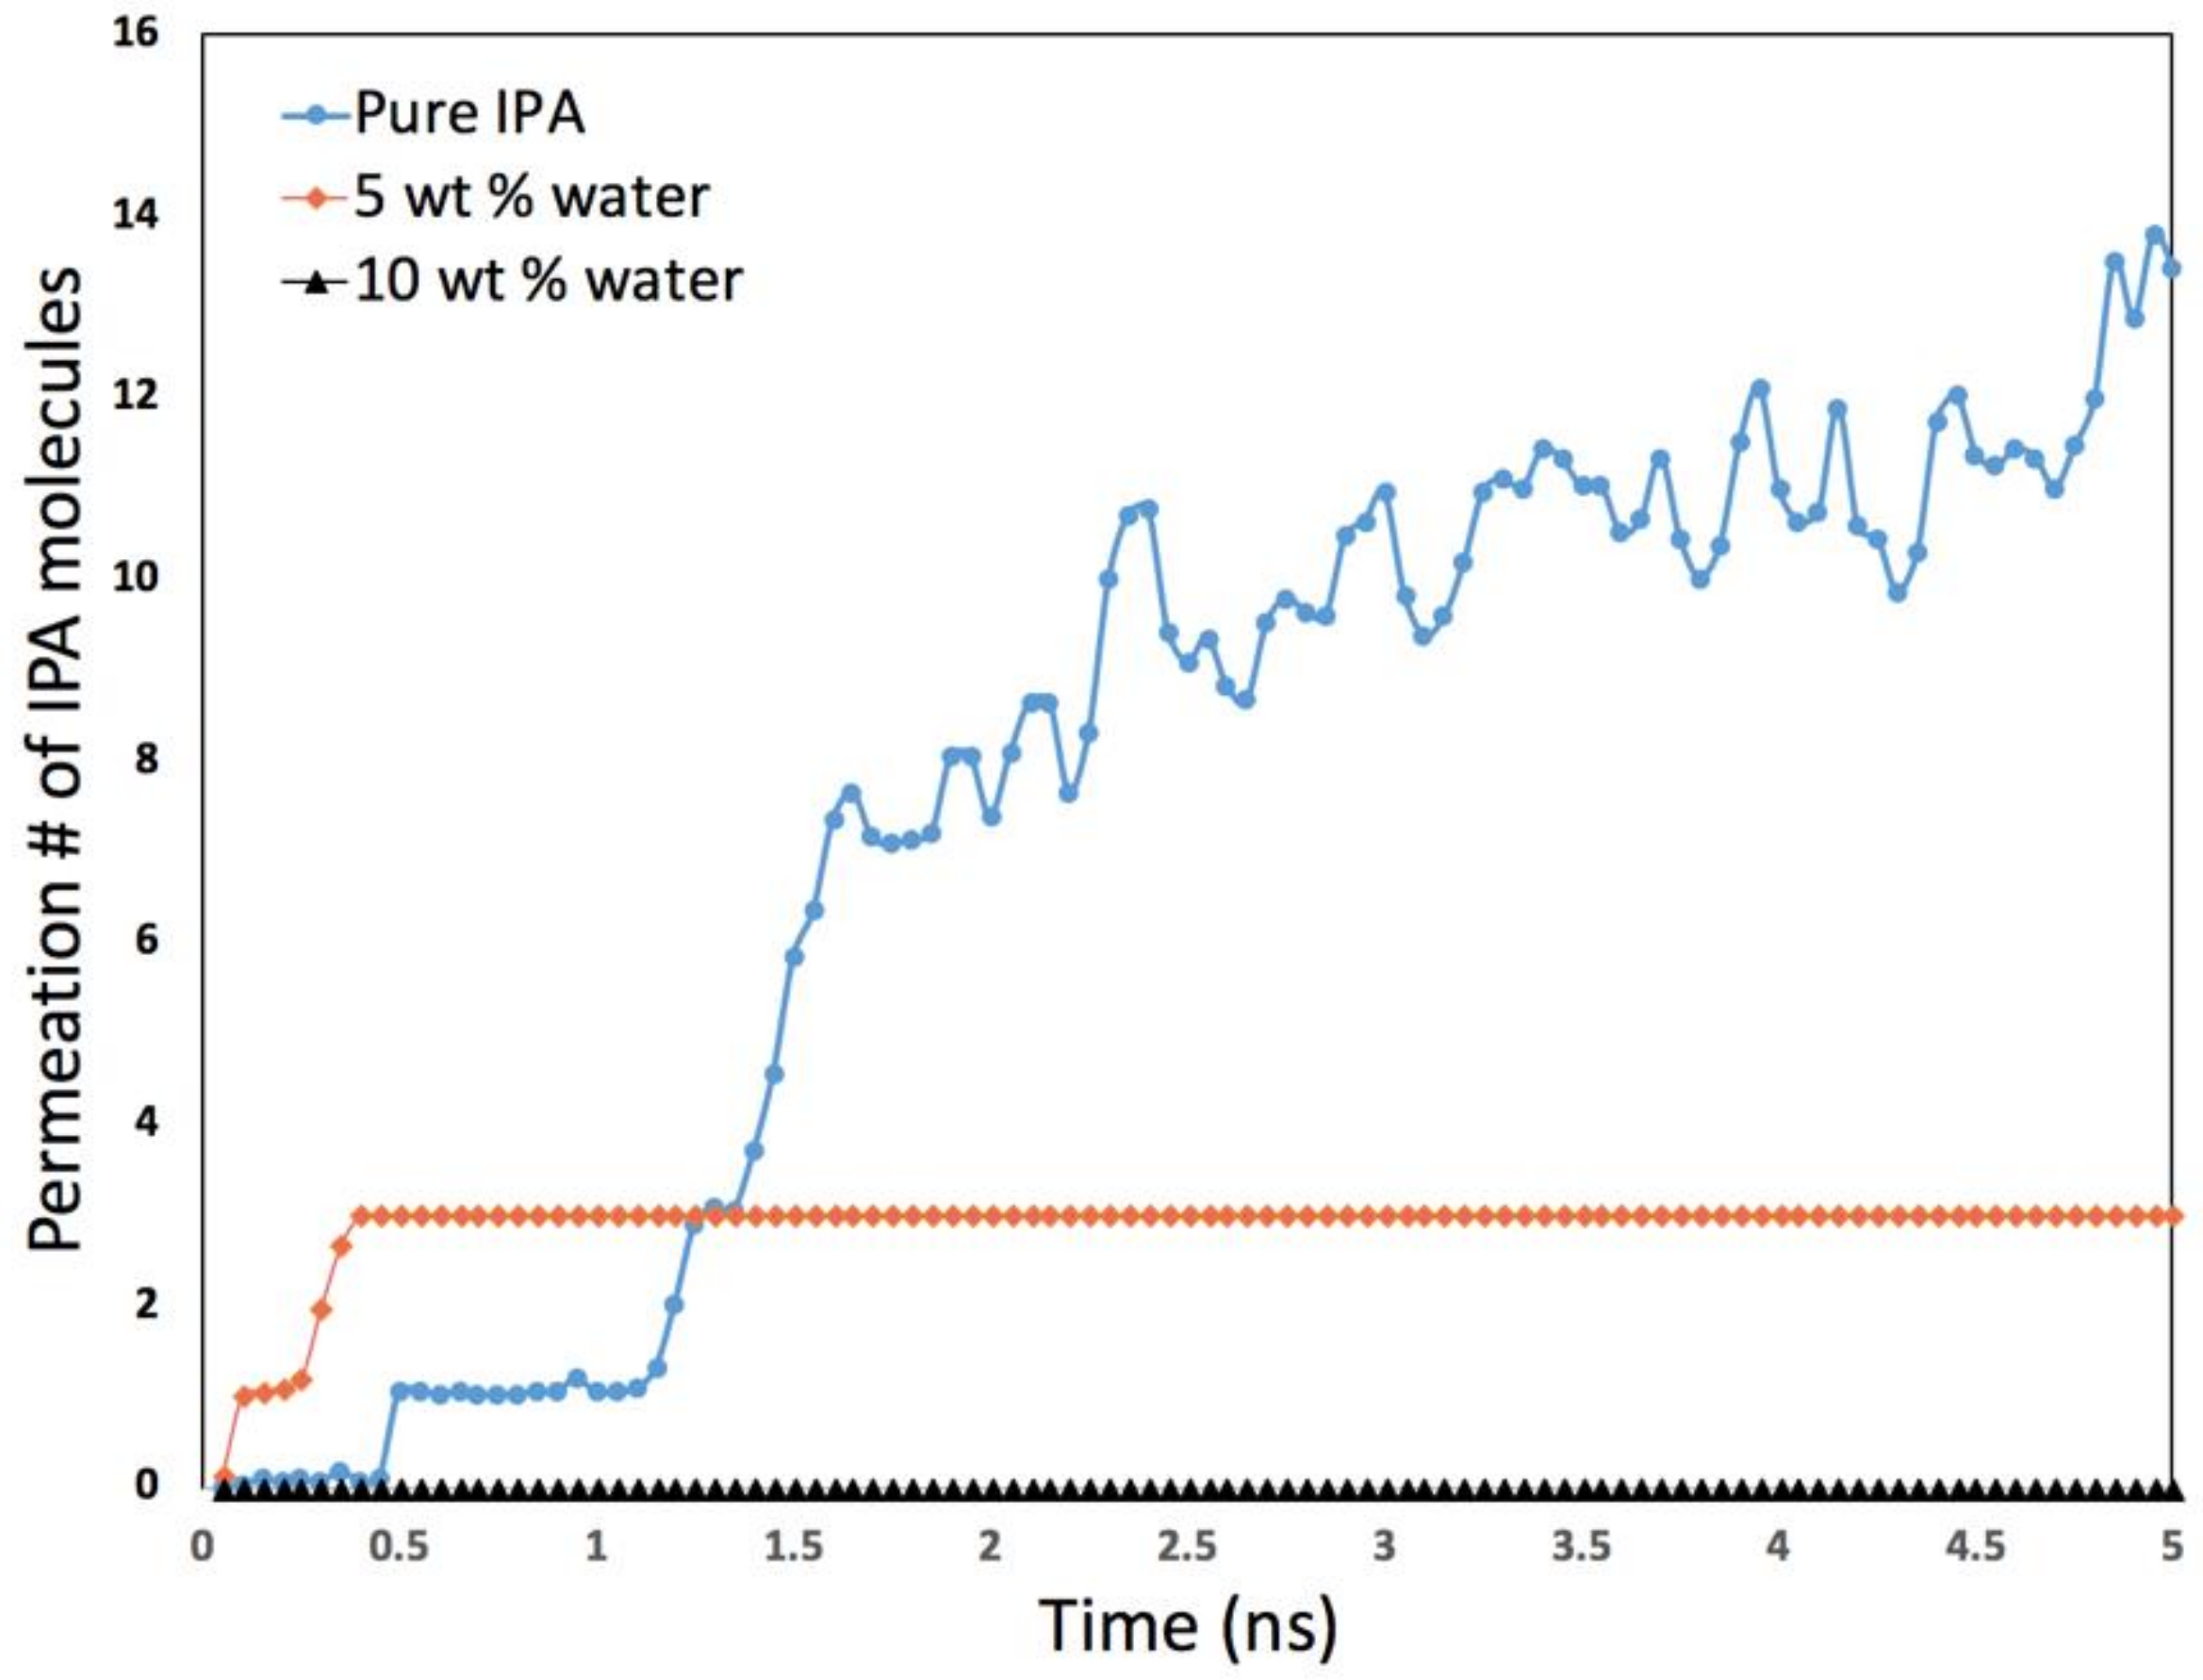
Our simulation results, as shown in Figure 14, confirm the non-intuitive trend observed during experiments [7]. In addition, the simulations also provided significant insight into why this unusual and unexpected phenomenon occurred. Simulations were carried out for pure iso-propyl alcohol (IPA), as well as with 5 and 10% by weight water in the IPA. As can be clearly observed, the IPA was able to readily permeate the defect in the absence of water. Once water was included in the mixture the IPA permeation completely stopped in our time frame.
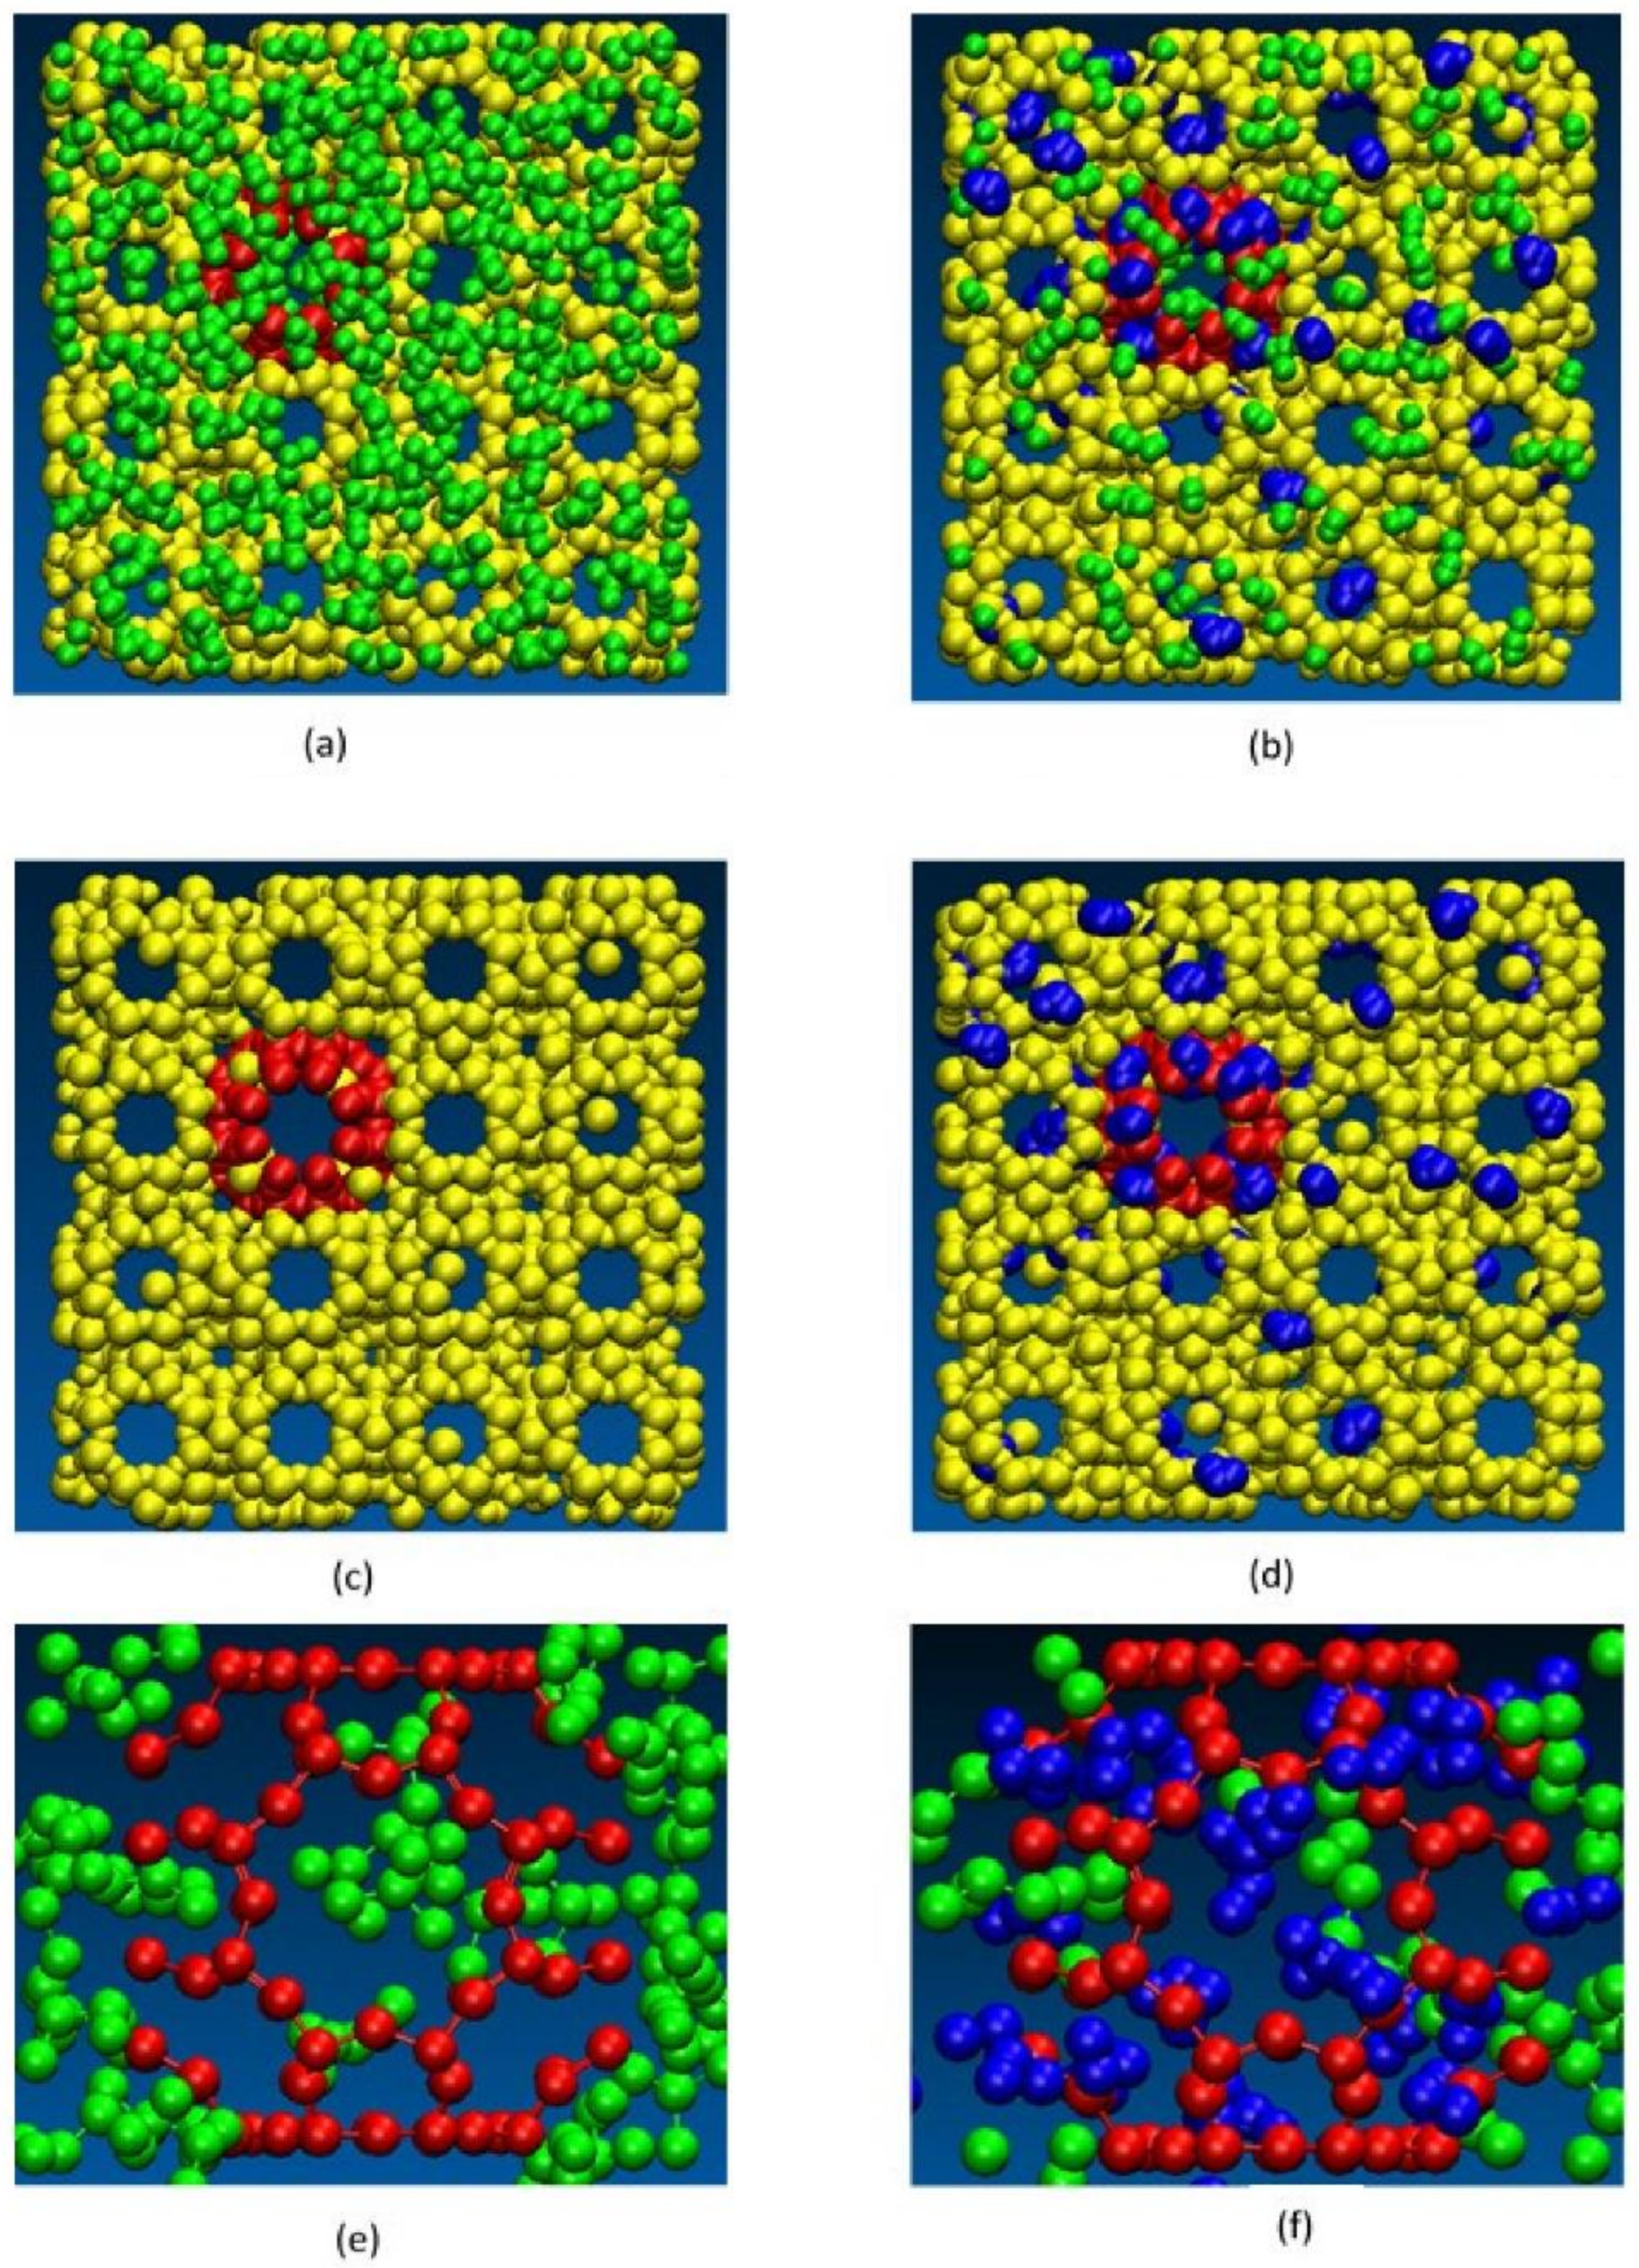
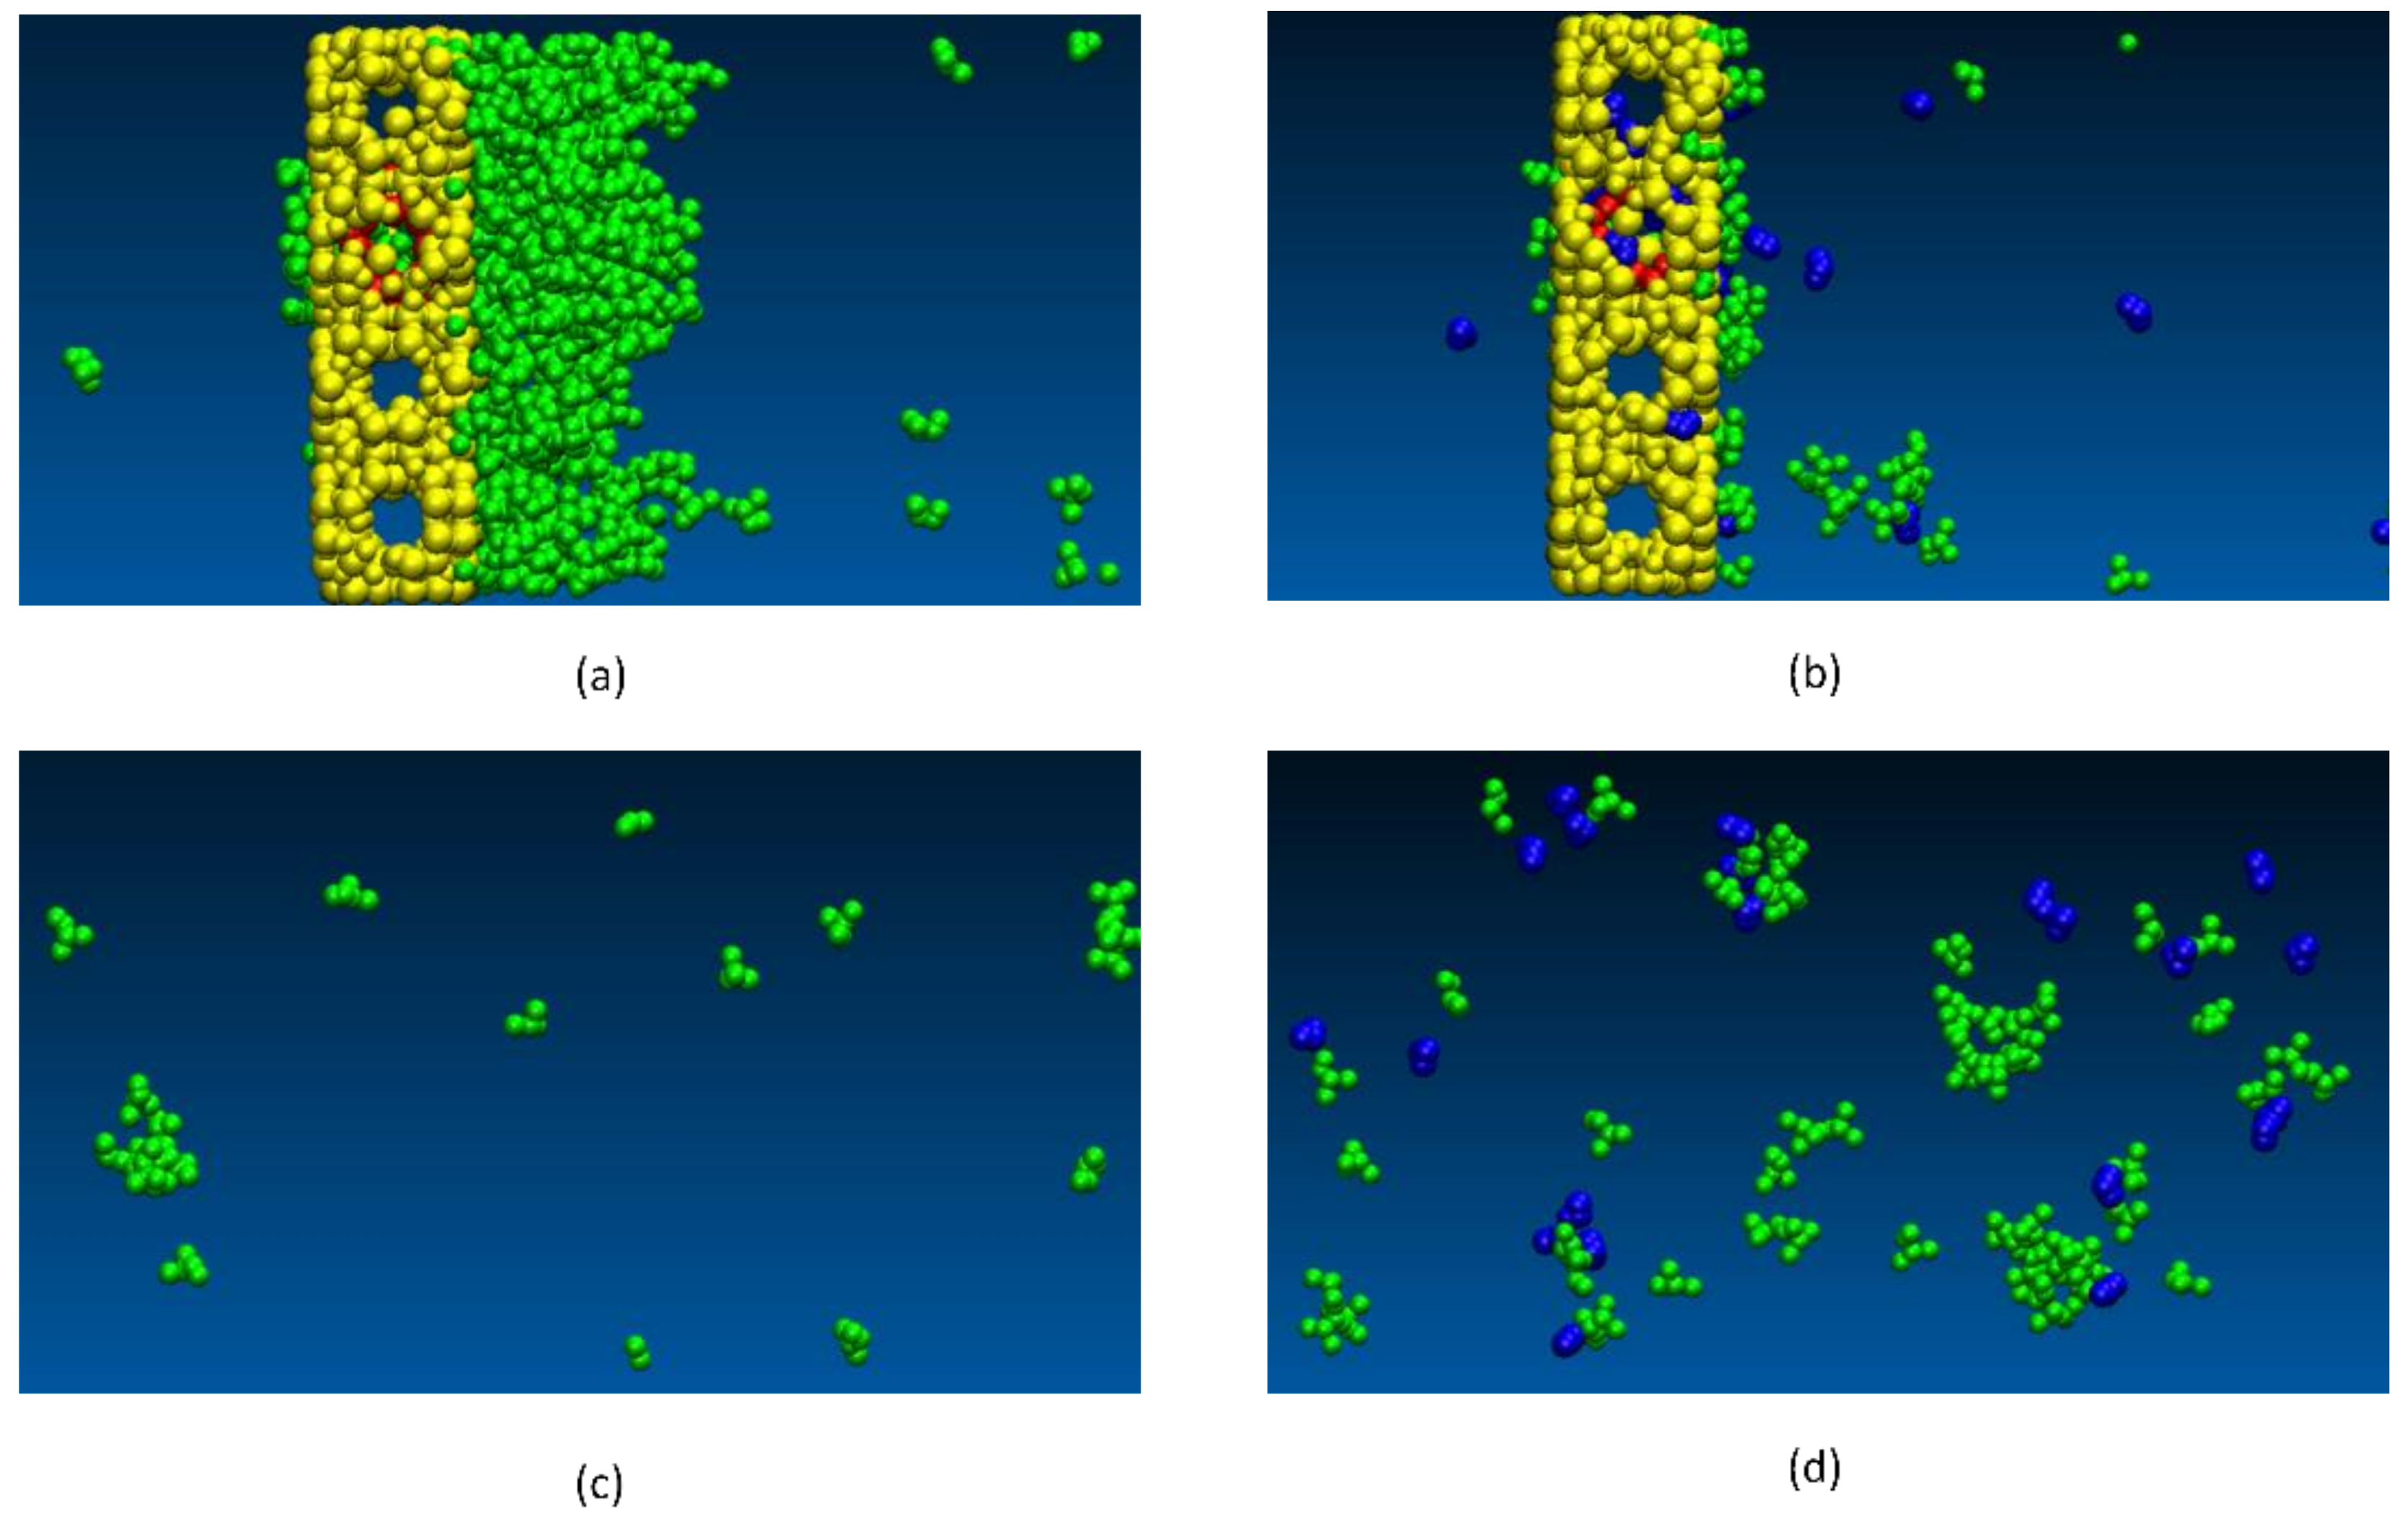
Upon further investigation, our simulations showed that there were two primary reasons that explain the decrease in IPA permeation when water is present. Firstly, we found that water molecules get adsorbed in zeolite pores as well as the defects, thus effectively reducing the effective size of the defects. When water is present at the defect sites, IPA molecules can also get adsorbed (with high adsorption energy) which further contributes to blocking the defect (Figure 15). In addition, we observed another interesting phenomenon in our simulations. In the bulk vapor phase in the presence of water, the IPA molecules tend to form larger IPA clusters which as a result effectively increases the dynamic diameter of the IPA molecules, making it more difficult for them to permeate the zeolite defects. This can be clearly observed in Figure 16. In addition to this, as can be seen from Figure 16c,d, the presence of water also results in fewer IPA molecules at the surface of the zeolite, which further restricts the permeation of IPA into the zeolite. We also observed that when water was present no IPA permeated the membrane.
3. Conclusions
Membrane separations have a number of advantages over other more conventional techniques including minimal maintenance due to the lack of moving parts and the fact that unlike other techniques it does not require a phase change. As an increasing amount of membrane-based separations are developed in fields as diverse as gas separation, desalination, dialysis, batteries, biosensing, and drug delivery, it is crucial that these processes be well understood so that their efficiencies can be maximized. This requires a more complete picture of the molecular level phenomena that occur between the membranes and the species they are separating.
In this paper we have discussed the important role molecular simulations (specifically the technique of molecular dynamics) can play towards the realization of this goal. We have described our previous work which has helped provide an improved understanding of fluid and ionic transport in processes as diverse as reverse osmosis, ion exchange, gas separations, and redox flow batteries. The application of these simulations has shown how they can play two important roles. Foremost, they can allow us to understand phenomena not well understood, e.g., why water can permeate membranes in RO separations and ions cannot; or why N2/O2 and CO2/N2 show opposite behavior in their separation factors when switching from pure fluids to mixtures; or why zeolite membranes can be effective in dehydrating alcohols via pervaporation when 5% water is present and become ineffective when only 1% water is present. Secondly, they can be effective screening tools for determining which membranes are suitable for a potential application, e.g., simulations clearly identified the zeolite membranes best suited for redox flow batteries while simultaneously revealing details about the ion transport process and how it can be affected by membrane structure and composition. Both of these roles can ultimately help provide a better understanding of the physiochemical behavior of many such membrane-based applications and aid in more efficient process design and optimization.
Author Contributions
All authors contributed equally to all aspects of this publication.
Funding
This research was supported by grants from the National Science Foundation (CBET 1545560) and State Key Laboratory of Materials-Oriented Chemical Engineering (KL13-05).
Conflicts of Interest
The authors declare no conflict of interest.
References
- Sholl, D.S.; Lively, R.P. Seven chemical separations to change the world. Nature 2016, 532, 435–437. [Google Scholar] [CrossRef] [PubMed] [Green Version]
- Lively, R.P.; Sholl, D.S. From water to organics in membrane separations. Nat. Mater. 2017, 16, 276–279. [Google Scholar] [CrossRef] [PubMed]
- Widodo, S.; Khoiruddin; Ariono, D.; Subagjo; Wenten, I.G. Membrane separation for non-aqueous solution. IOP Conf. Ser. Mater. Sci. Eng. 2018, 285, 012008. [Google Scholar] [CrossRef] [Green Version]
- Yuan, H.; Yu, B.; Cong, H.; Peng, Q.; Yang, R.; Yang, S.; Yang, Z.; Luo, Y.; Xu, T.; Zhang, H.; et al. Modification Progress of Polymer Membranes for Gas Separation. Rev. Adv. Mater. Sci. 2016, 44, 207–220. [Google Scholar]
- Soleimany, A.; Hosseini, S.S.; Gallucci, F. Recent progress in developments of membrane materials and modification techniques for high performance helium separation and recovery: A review. Chem. Eng. Process. Process Intensif. 2017, 122, 296–318. [Google Scholar] [CrossRef]
- Allen, M.P.; Tildesley, D.J. Computer Simulation of Liquids, 2nd ed.; Oxford University Press: Oxford, UK, 2017; ISBN 978-0-19-252470-6. [Google Scholar]
- Qu, F.; Shi, R.; Peng, L.; Zhang, Y.; Gu, X.; Wang, X.; Murad, S. Understanding the effect of zeolite crystal expansion/contraction on separation performance of NaA zeolite membrane: A combined experimental and molecular simulation study. J. Membr. Sci. 2017, 539, 14–23. [Google Scholar] [CrossRef]
- Lin, J.; Murad, S. A computer simulation study of the separation of aqueous solutions using thin zeolite membranes. Mol. Phys. 2001, 99, 1175–1181. [Google Scholar] [CrossRef]
- Berendsen, H.J.C.; Postma, J.P.M.; van Gunsteren, W.F.; Hermans, J. Interaction Models for Water in Relation to Protein Hydration. In Intermolecular Forces; The Jerusalem Symposia on Quantum Chemistry and Biochemistry; Springer: Dordrecht, The Netherlands, 1981; pp. 331–342. ISBN 978-90-481-8368-5. [Google Scholar]
- Jorgensen, W.L.; Bigot, B.; Chandrasekhar, J. Quantum and statistical mechanical studies of liquids. 21. The nature of dilute solutions of sodium and methoxide ions in methanol. J. Am. Chem. Soc. 1982, 104, 4584–4591. [Google Scholar] [CrossRef]
- Tironi, I.G.; Sperb, R.; Smith, P.E.; van Gunsteren, W.F. A generalized reaction field method for molecular dynamics simulations. J. Chem. Phys. 1995, 102, 5451–5459. [Google Scholar] [CrossRef]
- Murad, S.; Oder, K.; Lin, J. Molecular simulation of osmosis, reverse osmosis, and electro-osmosis in aqueous and methanolic electrolyte solutions. Mol. Phys. 1998, 95, 401–408. [Google Scholar] [CrossRef]
- Kotelyanskii, M.J.; Wagner, N.J.; Paulaitis, M.E. Atomistic simulation of water and salt transport in the reverse osmosis membrane FT-30. J. Membr. Sci. 1998, 139, 1–16. [Google Scholar] [CrossRef]
- Murad, S.; Jia, W.; Krishnamurthy, M. Ion-exchange of monovalent and bivalent cations with NaA zeolite membranes: A molecular dynamics study. Mol. Phys. 2004, 102, 2103–2112. [Google Scholar] [CrossRef]
- Townsend, R.P.; Harjula, R. Ion Exchange in Molecular Sieves by Conventional Techniques. In Post-Synthesis Modification I; Molecular Sieves; Springer: Berlin/Heidelberg, Germany, 2002; pp. 1–42. ISBN 978-3-540-64334-0. [Google Scholar]
- Ponce de León, C.; Frías-Ferrer, A.; González-García, J.; Szánto, D.A.; Walsh, F.C. Redox flow cells for energy conversion. J. Power Sources 2006, 160, 716–732. [Google Scholar] [CrossRef] [Green Version]
- Cheng, F.; Liang, J.; Tao, Z.; Chen, J. Functional Materials for Rechargeable Batteries. Adv. Mater. 2011, 23, 1695–1715. [Google Scholar] [CrossRef] [PubMed]
- Codina, G.; Perez, J.R.; Lopez-Atalaya, M.; Vasquez, J.L.; Aldaz, A. Development of a 0.1 kW power accumulation pilot plant based on an Fe/Cr redox flow battery Part I. Considerations on flow-distribution design. J. Power Sources 1994, 48, 293–302. [Google Scholar] [CrossRef]
- Lim, H.S.; Lackner, A.M.; Knechtli, R.C. Zinc-Bromine Secondary Battery. J. Electrochem. Soc. 1977, 124, 1154–1157. [Google Scholar] [CrossRef]
- Clarke, R.L.; Dougherty, B.J.; Harrison, S.; Millington, J.P.; Mohanta, S. Battery with Bifunctional Electrolyte. U.S. Patent 6,986,966, 17 January 2006. [Google Scholar]
- Skyllas-Kazacos, M.; Rychcik, M.; Robins, R.G.; Fane, A.G.; Green, M.A. New All-Vanadium Redox Flow Cell. J. Electrochem. Soc. 1986, 133, 1057–1058. [Google Scholar] [CrossRef]
- Díaz-González, F.; Sumper, A.; Gomis-Bellmunt, O.; Villafáfila-Robles, R. A review of energy storage technologies for wind power applications. Renew. Sustain. Energy Rev. 2012, 16, 2154–2171. [Google Scholar] [CrossRef]
- Li, X.; Zhang, H.; Mai, Z.; Zhang, H.; Vankelecom, I. Ion exchange membranes for vanadium redox flow battery (VRB) applications. Energy Environ. Sci. 2011, 4, 1147–1160. [Google Scholar] [CrossRef] [Green Version]
- Li, X. Principles of Fuel Cells; Taylor & Francis: Boca Raton, FL, USA, 2005; ISBN 978-1-59169-022-1. [Google Scholar]
- Vijayakumar, M.; Bhuvaneswari, M.S.; Nachimuthu, P.; Schwenzer, B.; Kim, S.; Yang, Z.; Liu, J.; Graff, G.L.; Thevuthasan, S.; Hu, J. Spectroscopic investigations of the fouling process on Nafion membranes in vanadium redox flow batteries. J. Membr. Sci. 2011, 366, 325–334. [Google Scholar] [CrossRef]
- Mohammadi, T.; Kazacos, M.S. Evaluation of the chemical stability of some membranes in vanadium solution. J. Appl. Electrochem. 1997, 27, 153–160. [Google Scholar] [CrossRef]
- Dai, H.; Zhang, H.; Zhong, H.; Li, X.; Xiao, S.; Mai, Z. High performance composite membranes with enhanced dimensional stability for use in PEMFC. Int. J. Hydrog. Energy 2010, 35, 4209–4214. [Google Scholar] [CrossRef]
- Lew, C.M.; Cai, R.; Yan, Y. Zeolite Thin Films: From Computer Chips to Space Stations. Acc. Chem. Res. 2010, 43, 210–219. [Google Scholar] [CrossRef] [PubMed]
- Deng, S.G.; Lin, Y.S. Sulfur Dioxide Sorption Properties and Thermal Stability of Hydrophobic Zeolites. Ind. Eng. Chem. Res. 1995, 34, 4063–4070. [Google Scholar] [CrossRef]
- Auerbach, S.M.; Carrado, K.A.; Dutta, P.K. Handbook of Zeolite Science and Technology; CRC Press: Boca Raton, FL, USA, 2003; ISBN 978-0-203-91116-7. [Google Scholar]
- Li, L.; Dong, J.; Nenoff, T.M.; Lee, R. Desalination by reverse osmosis using MFI zeolite membranes. J. Membr. Sci. 2004, 243, 401–404. [Google Scholar] [CrossRef]
- Lia, L.; Dong, J.; Nenoff, T.M.; Lee, R. Reverse osmosis of ionic aqueous solutions on a MFI zeolite membrane. Desalination 2004, 170, 309–316. [Google Scholar] [CrossRef]
- Yang, R.; Xu, Z.; Yang, S.; Li, L.; Angelopoulos, A.; Dong, J. Nonionic Zeolite Membrane as Potential Ion Separator in Redox-Flow Battery. J. Membr. Sci. 2014, 450, 12–17. [Google Scholar] [CrossRef]
- Hinkle, K.R.; Jameson, C.J.; Murad, S. Transport of Vanadium and Oxovanadium Ions Across Zeolite Membranes: A Molecular Dynamics Study. J. Phys. Chem. C 2014, 118, 23803–23810. [Google Scholar] [CrossRef]
- Baerlocher, C.; McCusker, L.B.; Olson, D.H. Atlas of Zeolite Framework Types; Elsevier: New York, NY, USA, 2007; ISBN 978-0-08-055434-1. [Google Scholar]
- Xu, Z.; Michos, I.; Wang, X.; Yang, R.; Gu, X.; Dong, J. A zeolite ion exchange membrane for redox flow batteries. Chem. Commun. 2014, 50, 2416–2419. [Google Scholar] [CrossRef] [PubMed]
- Kirkwood, J.G. Statistical Mechanics of Fluid Mixtures. J. Chem. Phys. 1935, 3, 300–313. [Google Scholar] [CrossRef]
- Song, B.; Yuan, H.; Jameson, C.J.; Murad, S. Role of surface ligands in nanoparticle permeation through a model membrane: A coarse-grained molecular dynamics simulations study. Mol. Phys. 2012, 110, 2181–2195. [Google Scholar] [CrossRef]
- Olson, D.H.; Khosrovani, N.; Peters, A.W.; Toby, B.H. Crystal Structure of Dehydrated CsZSM-5 (5.8Al): Evidence for Nonrandom Aluminum Distribution. J. Phys. Chem. B 2000, 104, 4844–4848. [Google Scholar] [CrossRef]
- Sethia, G.; Pillai, R.S.; Dangi, G.P.; Somani, R.S.; Bajaj, H.C.; Jasra, R.V. Sorption of Methane, Nitrogen, Oxygen, and Argon in ZSM-5 with different SiO2/Al2O3 Ratios: Grand Canonical Monte Carlo Simulation and Volumetric Measurements. Ind. Eng. Chem. Res. 2010, 49, 2353–2362. [Google Scholar] [CrossRef]
- Bell, R.G.; Jackson, R.A.; Catlow, C.R.A. Löwenstein’s rule in zeolite A: A computational study. Zeolites 1992, 12, 870–871. [Google Scholar] [CrossRef]
- Catlow, C.R.A.; George, A.R.; Freeman, C.M. Ab initio and molecular-mechanics studies of aluminosilicate fragments, and the origin of Lowenstein’s rule. Chem. Commun. 1996, 0, 1311–1312. [Google Scholar] [CrossRef]
- Wijmans, J.G.; Baker, R.W. The solution-diffusion model: A review. J. Membr. Sci. 1995, 107, 1–21. [Google Scholar] [CrossRef]
- Xu, Z.; Michos, I.; Cao, Z.; Jing, W.; Gu, X.; Hinkle, K.; Murad, S.; Dong, J. Proton-Selective Ion Transport in ZSM-5 Zeolite Membrane. J. Phys. Chem. C 2016, 120, 26386–26392. [Google Scholar] [CrossRef]
- Agmon, N. The Grotthuss mechanism. Chem. Phys. Lett. 1995, 244, 456–462. [Google Scholar] [CrossRef]
- Lobaugh, J.; Voth, G.A. The quantum dynamics of an excess proton in water. J. Chem. Phys. 1996, 104, 2056–2069. [Google Scholar] [CrossRef]
- Schmitt, U.W.; Voth, G.A. Multistate Empirical Valence Bond Model for Proton Transport in Water. J. Phys. Chem. B 1998, 102, 5547–5551. [Google Scholar] [CrossRef]
- Schmitt, U.W.; Voth, G.A. The computer simulation of proton transport in water. J. Chem. Phys. 1999, 111, 9361–9381. [Google Scholar] [CrossRef]
- Day, T.J.F.; Schmitt, U.W.; Voth, G.A. The Mechanism of Hydrated Proton Transport in Water. J. Am. Chem. Soc. 2000, 122, 12027–12028. [Google Scholar] [CrossRef]
- Kusaka, I.; Wang, Z.-G.; Seinfeld, J.H. Binary nucleation of sulfuric acid-water: Monte Carlo simulation. J. Chem. Phys. 1998, 108, 6829–6848. [Google Scholar] [CrossRef] [Green Version]
Figure 1.
Set up for reverse osmosis separation of brine with zeolite membranes.

Figure 2.
(a) Na+ ion (blue) solvated with water (red/white) to effectively increase its size; (b) A hydrated ion pair of Na+ (blue) and Cl− ions (cyan).
Figure 2.
(a) Na+ ion (blue) solvated with water (red/white) to effectively increase its size; (b) A hydrated ion pair of Na+ (blue) and Cl− ions (cyan).

Figure 3.
A typical system set up for ion exchange. (a) Zeolite membrane; (b) Two reservoirs and two membranes in conjunction with periodic boundary conditions are usually used in simulations as shown here.
Figure 3.
A typical system set up for ion exchange. (a) Zeolite membrane; (b) Two reservoirs and two membranes in conjunction with periodic boundary conditions are usually used in simulations as shown here.
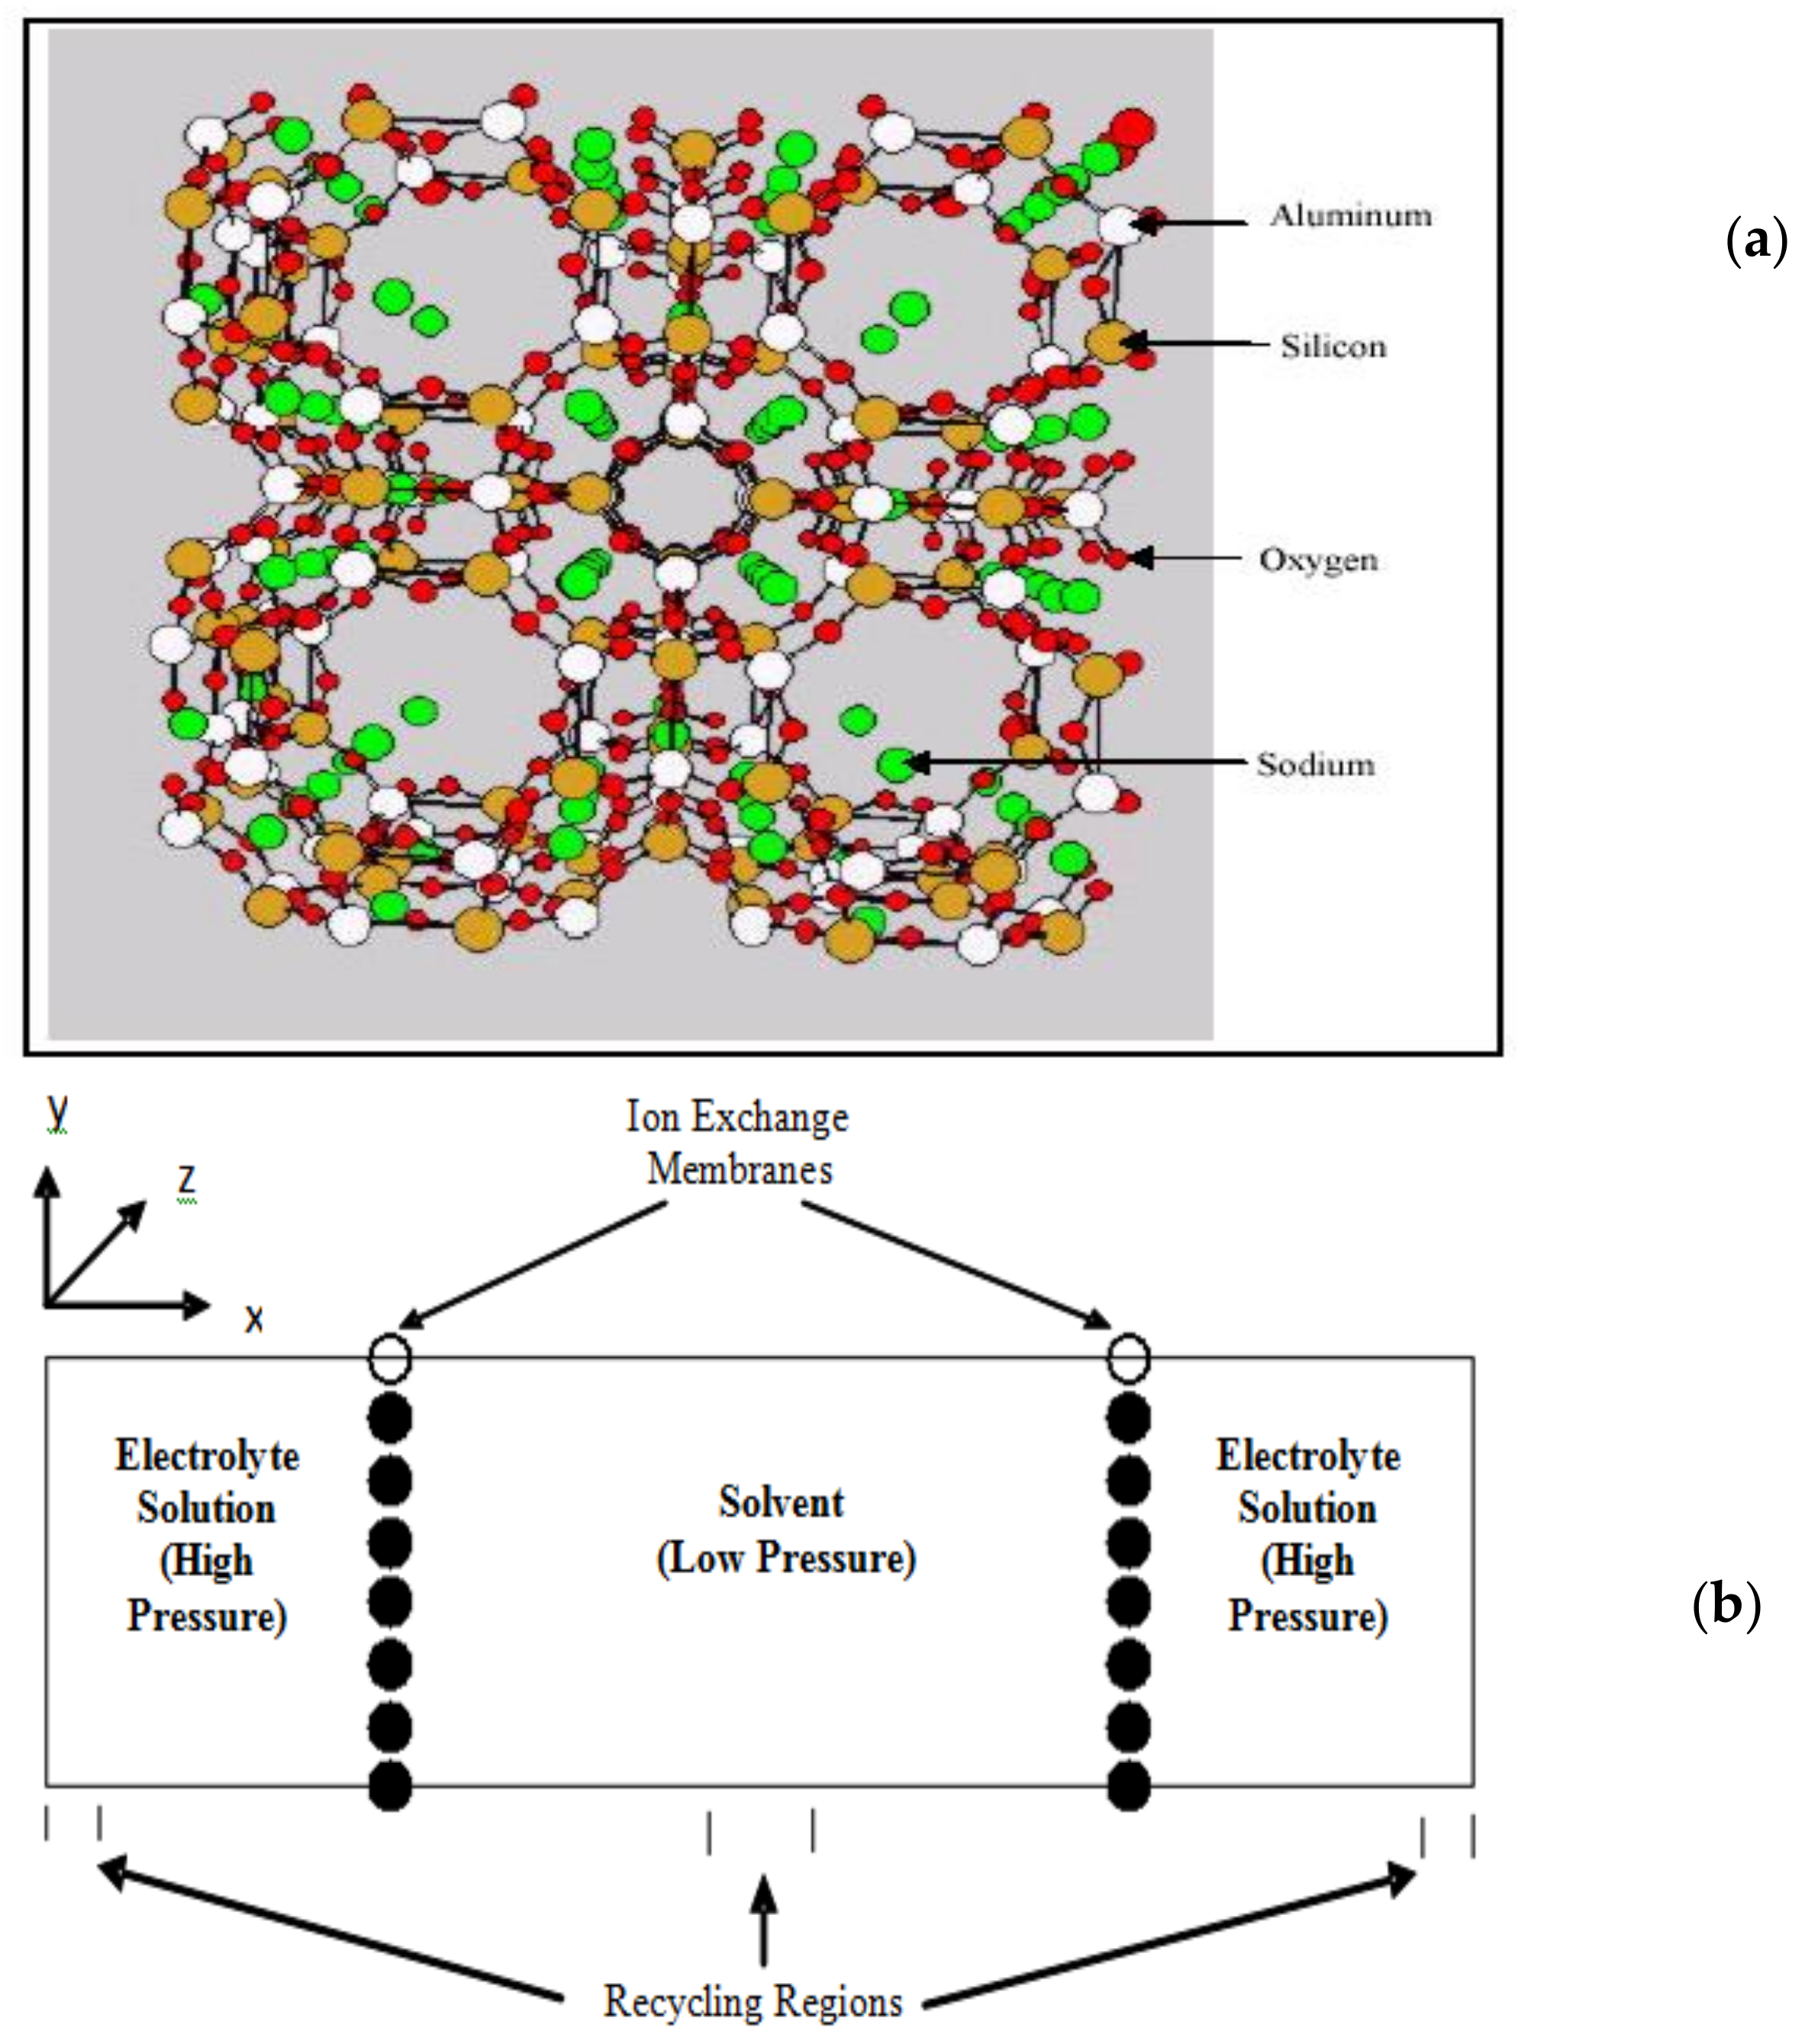
Figure 4.
The differences in configurational energy of, Li+, Ca++ and Na+ ions (kJ/mol) inside and outside the membrane plotted against the number of time steps. A positive number indicates a preference for being outside the membrane. (a) Li+/Na+; (b) Ca++/Na+.
Figure 4.
The differences in configurational energy of, Li+, Ca++ and Na+ ions (kJ/mol) inside and outside the membrane plotted against the number of time steps. A positive number indicates a preference for being outside the membrane. (a) Li+/Na+; (b) Ca++/Na+.
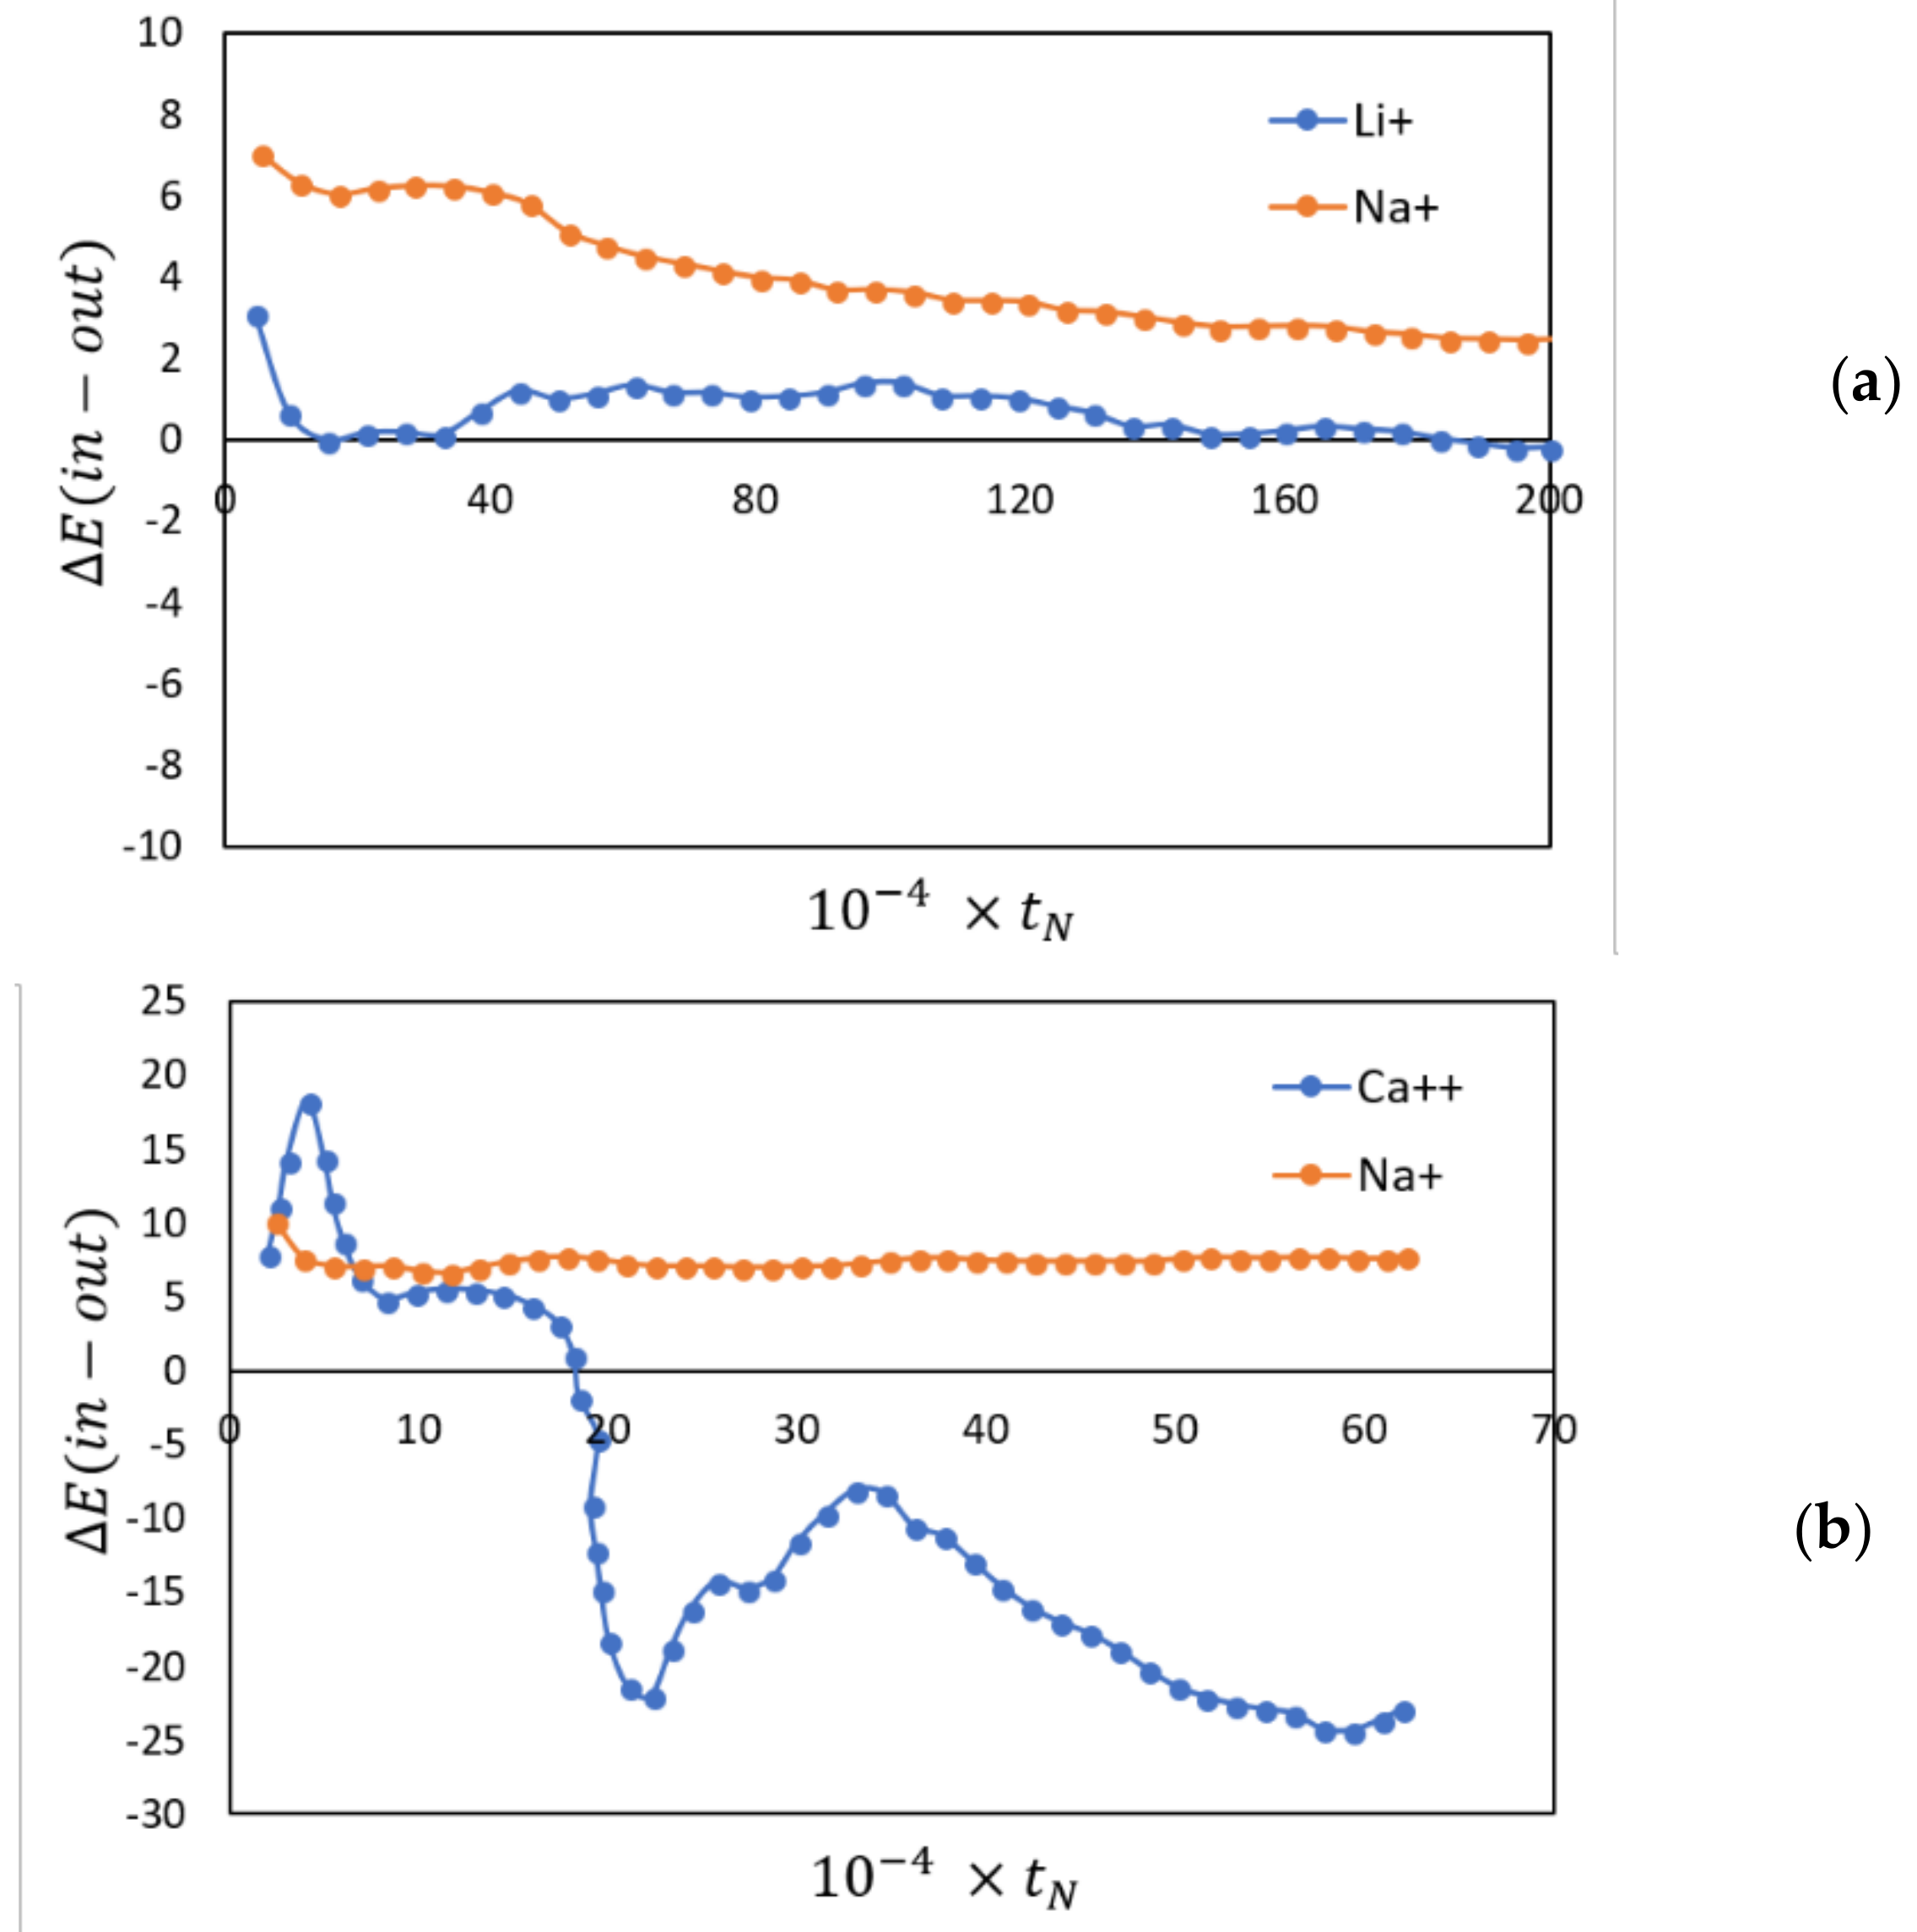
Figure 5.
Initial system setup for gas separation simulations and the structure of FAU, MFI and CHA unit cell.
Figure 5.
Initial system setup for gas separation simulations and the structure of FAU, MFI and CHA unit cell.
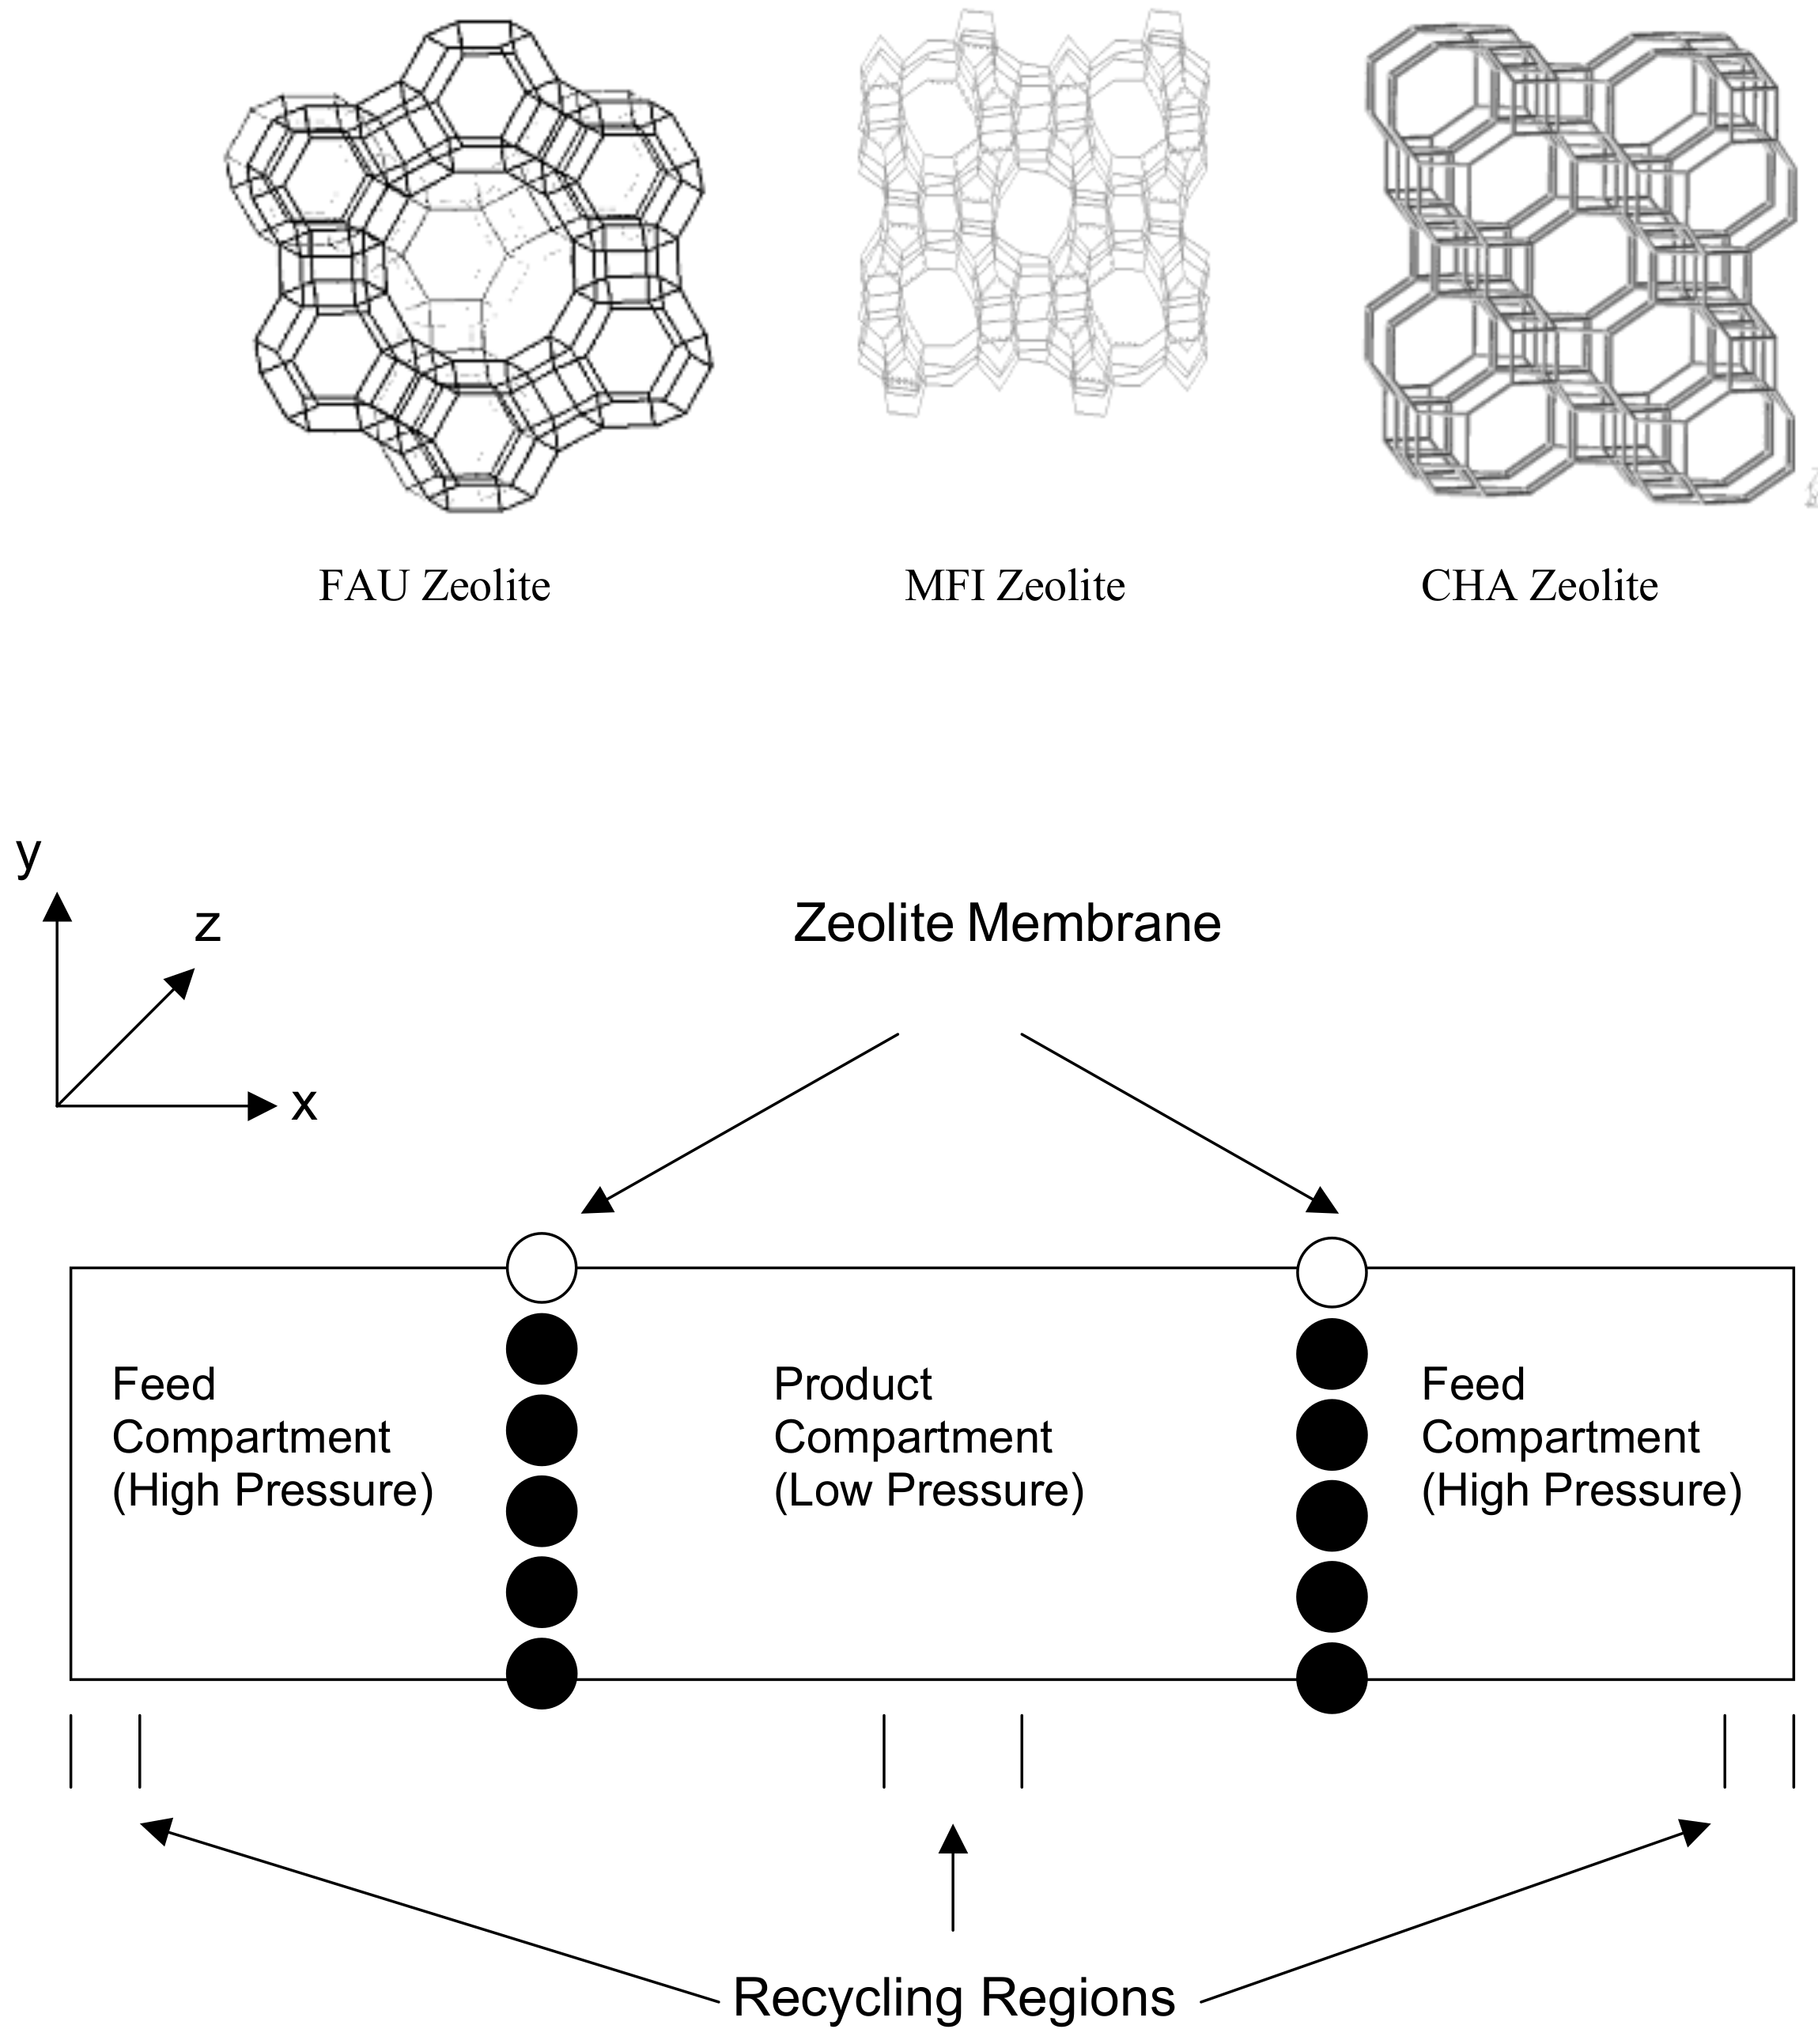
Figure 6.
The permeance of (a) O2/N2 and (b) CO2/N2 for both pure systems and equimolar binary mixtures compared with experimental results. The first two sets are experimental results while the last two are simulation results as marked. The numbers above the permeances represent the separation factors (SF). Note the contrasting behavior between pure fluids and mixtures for the two systems that the simulation results correctly predict.
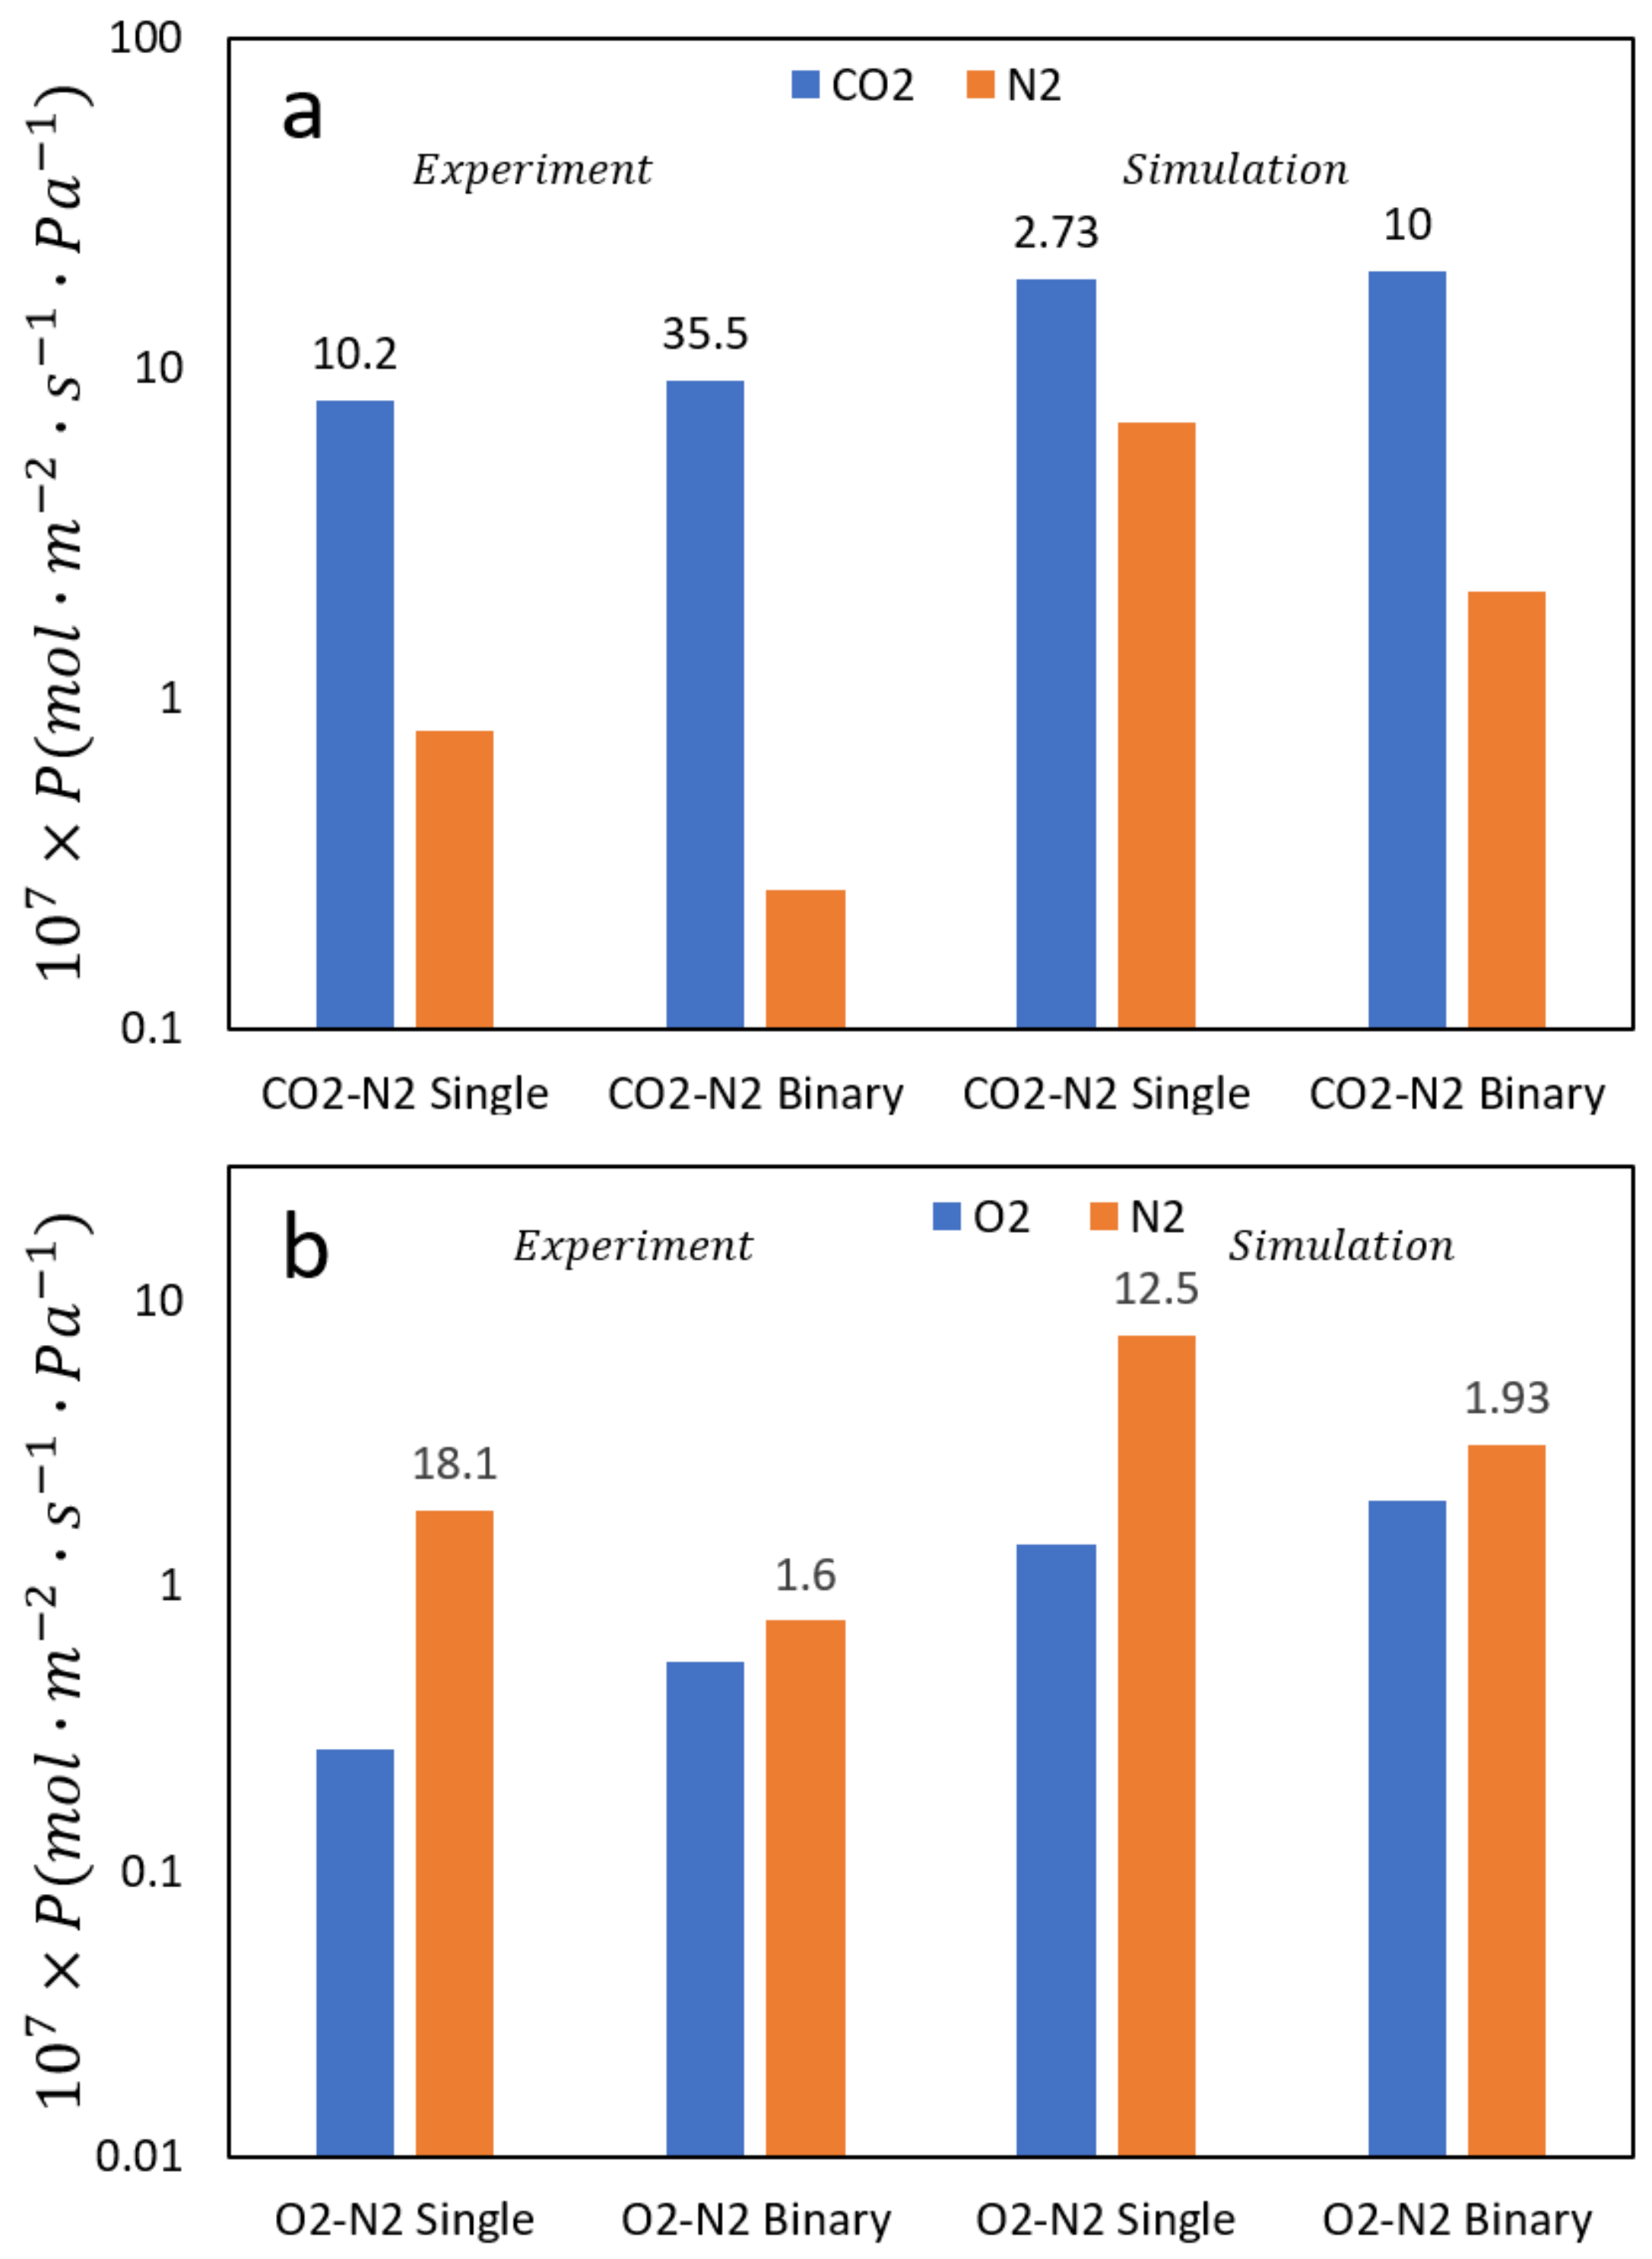
Figure 7.
Simulation data on permeance of N2 at 322 K in an equimolar N2/O2 mixture as a function of pressure. Note that except for surface diffusion, the two other mechanisms are clearly qualitatively incorrect.
Figure 7.
Simulation data on permeance of N2 at 322 K in an equimolar N2/O2 mixture as a function of pressure. Note that except for surface diffusion, the two other mechanisms are clearly qualitatively incorrect.

Figure 8.
Ion transport events for (a) DON framework and (b) MFI framework (straight channel) at 8 mol% and 400 K.
Figure 8.
Ion transport events for (a) DON framework and (b) MFI framework (straight channel) at 8 mol% and 400 K.
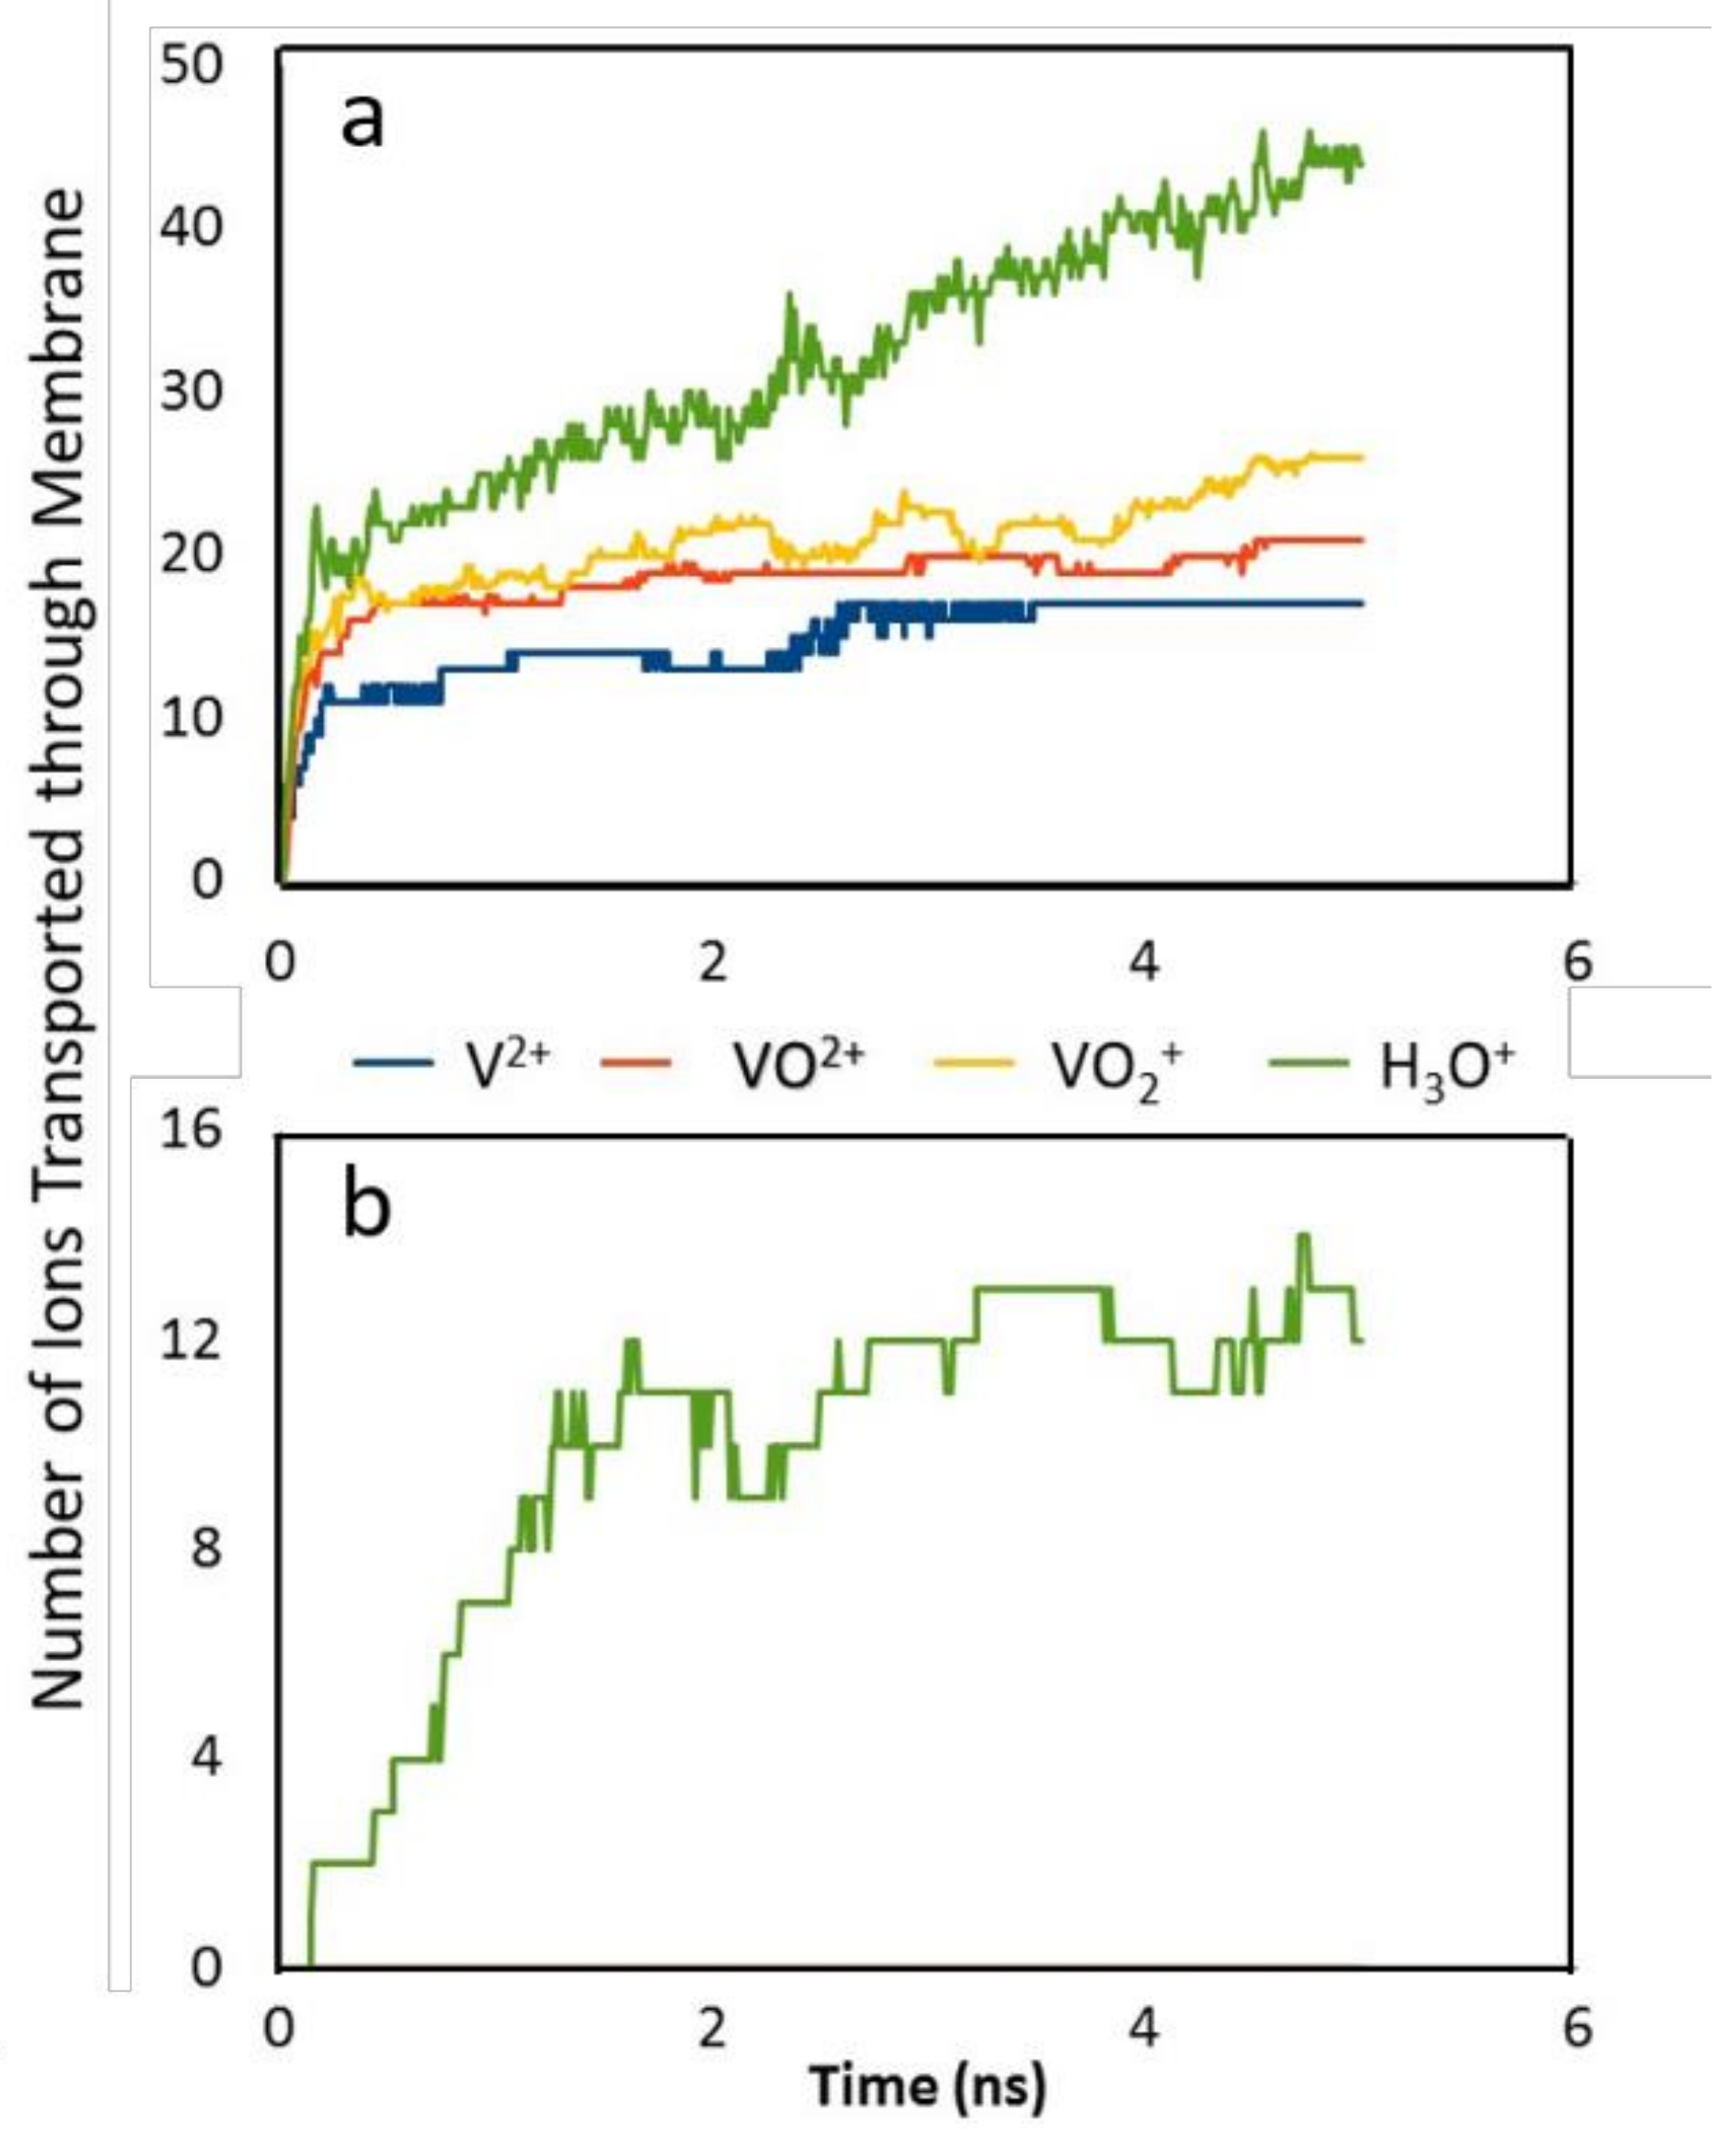
Figure 9.
Potentials of mean force for hydrated V2+ ion passing through the 6 membrane framework types at 325 K.
Figure 9.
Potentials of mean force for hydrated V2+ ion passing through the 6 membrane framework types at 325 K.

Figure 10.
Magnitude of free energy barriers for V2+ and H3O+ ions as they traverse the pore of different zeolite membranes.
Figure 10.
Magnitude of free energy barriers for V2+ and H3O+ ions as they traverse the pore of different zeolite membranes.

Figure 11.
Orientation of the [V(H2O)6]2+ complex with respect to the pore axis during membrane transport in BEC zeolite membrane. The dashed lines indicate the zeolite boundary. Tumbling, followed by alignment and finally tumbling are observed.
Figure 11.
Orientation of the [V(H2O)6]2+ complex with respect to the pore axis during membrane transport in BEC zeolite membrane. The dashed lines indicate the zeolite boundary. Tumbling, followed by alignment and finally tumbling are observed.

Figure 12.
Relative permeability of MFI zeolite membranes at increasing levels of aluminum substitution.
Figure 12.
Relative permeability of MFI zeolite membranes at increasing levels of aluminum substitution.

Figure 13.
Schematic of the simulation system for vapor permeation through NaA zeolite membranes. Red represents the zeolite framework, water and iso-propyl alcohol (IPA) are between the two zeolite membranes.
Figure 13.
Schematic of the simulation system for vapor permeation through NaA zeolite membranes. Red represents the zeolite framework, water and iso-propyl alcohol (IPA) are between the two zeolite membranes.

Figure 14.
Number of IPA molecules permeating the membrane as a function of time for different compositions.
Figure 14.
Number of IPA molecules permeating the membrane as a function of time for different compositions.

Figure 15.
Changes in behavior observed in pure IPA (left side, a,c,e) and 5 wt % water (right side, b,d,f): axial snapshots of the membrane defect showing (a) pure IPA molecules permeating membrane defect and (b) water and IPA molecules blocking the membrane defect (water in blue); (c) as (a) above but IPA molecules removed; (d) as (b) above but IPA molecules removed; (e) cross section views showing pure IPA in cavity and (f) cross sectional view of both water and IPA molecules in cavity. The molecular diameters shown in the figure as spheres are not to scale.

Figure 16.
Differences in the observed behavior of the vapor phase when water is present: (a) snapshot of the pure IPA system near the zeolite membrane; (b) snapshot of system with 5 wt % water in vapor phase near the zeolite membrane. (c); snapshot of the pure IPA system away from membrane; (d): snapshot with 5 wt % water in vapor phase away from membrane; Key: yellow zeolite membrane; green IPA; and blue water; red: membrane defects.


Table 1.
Hydronium loading in membranes with increasing aluminum substitution levels. Uncertainties represent one standard deviation of the ion loading over 0.5 ns of simulation.
Table 1.
Hydronium loading in membranes with increasing aluminum substitution levels. Uncertainties represent one standard deviation of the ion loading over 0.5 ns of simulation.
| No. of Substitutions Per Unit Cell | Si/Al Ratio | Hydronium Ion Concentration, mol/L |
|---|---|---|
| 0.00 | ∞ | 1.86 ± 0.46 |
| 0.25 | 383 | 2.02 ± 0.50 |
| 0.50 | 191 | 2.22 ± 0.57 |
| 1.00 | 95 | 2.77 ± 0.54 |
| 1.75 | 54 | 4.36 ± 0.52 |
| 2.00 | 47 | 5.42 ± 0.63 |
| 3.00 | 31 | 6.37 ± 0.61 |
Table 2.
Hydronium diffusion in membranes with increasing aluminum substitution levels.
| No. of Substitutions Per Unit Cell | Si/Al Ratio | Hydronium Ion Diffusion, ×105 cm2/s |
|---|---|---|
| 0.00 | ∞ | 2.66 ± 0.11 |
| 0.25 | 383 | 2.56 ± 0.24 |
| 0.50 | 191 | 2.40 ± 0.11 |
| 1.00 | 95 | 2.35 ± 0.25 |
| 1.75 | 53.86 | 2.31 ± 0.23 |
| 2.00 | 47 | 2.09 ± 0.18 |
| 3.00 | 31 | 1.98 ± 0.31 |
© 2018 by the authors. Licensee MDPI, Basel, Switzerland. This article is an open access article distributed under the terms and conditions of the Creative Commons Attribution (CC BY) license (http://creativecommons.org/licenses/by/4.0/).
Share and Cite
MDPI and ACS Style
Hinkle, K.R.; Wang, X.; Gu, X.; Jameson, C.J.; Murad, S. Computational Molecular Modeling of Transport Processes in Nanoporous Membranes. Processes 2018, 6, 124. https://doi.org/10.3390/pr6080124
AMA Style
Hinkle KR, Wang X, Gu X, Jameson CJ, Murad S. Computational Molecular Modeling of Transport Processes in Nanoporous Membranes. Processes. 2018; 6(8):124. https://doi.org/10.3390/pr6080124
Chicago/Turabian StyleHinkle, Kevin R., Xiaoyu Wang, Xuehong Gu, Cynthia J. Jameson, and Sohail Murad. 2018. "Computational Molecular Modeling of Transport Processes in Nanoporous Membranes" Processes 6, no. 8: 124. https://doi.org/10.3390/pr6080124
Note that from the first issue of 2016, this journal uses article numbers instead of page numbers. See further details here.