A Cybernetic Approach to Modeling Lipid Metabolism in Mammalian Cells
by
 ,
,
Lina Aboulmouna
1, 
Shakti Gupta
2,
Mano R. Maurya
2,
Frank T. DeVilbiss
1,
Shankar Subramaniam
2,3,* and
Doraiswami Ramkrishna
1,* 
1
The Davidson School of Chemical Engineering, Purdue University, West Lafayette, IN 47907, USA
2
Department of Bioengineering and San Diego Supercomputer Center, University of California San Diego, La Jolla, CA 92093, USA
3
Departments of Computer Science and Engineering, Cellular and Molecular Medicine, and the Graduate Program in Bioinformatics, University of California San Diego, La Jolla, CA 92093, USA
*
Authors to whom correspondence should be addressed.
Processes 2018, 6(8), 126; https://doi.org/10.3390/pr6080126
Submission received: 16 July 2018
/
Revised: 3 August 2018
/
Accepted: 7 August 2018
/
Published: 12 August 2018
(This article belongs to the Special Issue Feature Papers for the Fifth Year Anniversary of the Founding of Processes)
Abstract
:The goal-oriented control policies of cybernetic models have been used to predict metabolic phenomena such as the behavior of gene knockout strains, complex substrate uptake patterns, and dynamic metabolic flux distributions. Cybernetic theory builds on the principle that metabolic regulation is driven towards attaining goals that correspond to an organism’s survival or displaying a specific phenotype in response to a stimulus. Here, we have modeled the prostaglandin (PG) metabolism in mouse bone marrow derived macrophage (BMDM) cells stimulated by Kdo2-Lipid A (KLA) and adenosine triphosphate (ATP), using cybernetic control variables. Prostaglandins are a well characterized set of inflammatory lipids derived from arachidonic acid. The transcriptomic and lipidomic data for prostaglandin biosynthesis and conversion were obtained from the LIPID MAPS database. The model parameters were estimated using a two-step hybrid optimization approach. A genetic algorithm was used to determine the population of near optimal parameter values, and a generalized constrained non-linear optimization employing a gradient search method was used to further refine the parameters. We validated our model by predicting an independent data set, the prostaglandin response of KLA primed ATP stimulated BMDM cells. We show that the cybernetic model captures the complex regulation of PG metabolism and provides a reliable description of PG formation.
1. Introduction
Engineering methodologies are critical for a quantitative understanding of the physiological mechanisms in normal and disease states. Systems biology relies upon the use of models to organize biological knowledge and make predictions of complex processes. A variety of multi-omic data and mathematical approaches are available for modeling with varying (simple to complex) degrees of resolution [1,2]. One approach, cybernetic modeling, has been used for over three decades to predict a variety of metabolic phenomena [3,4]. Cybernetic modeling of metabolism, at its core, embodies a framework of ordinary differential equations for kinetic modeling, which describes the time-dependent evolution of metabolite concentrations, enzyme concentrations, and cellular growth. In cells, these changes in concentrations, both inside and outside of the cell, are governed by the directed actions of complex biological processes.
The cybernetic modeling framework distinguishes itself from traditional kinetic modeling by indirectly accounting for the unknown regulatory processes in the cell. These regulations are a cooperative cascade of molecular mechanisms that enhance cellular function, such as growth or survival. In the absence of high resolution knowledge of all cellular signaling and metabolic events, cybernetic regulation offers a significant advantage and modulates the level of key enzymes through the introduction of cybernetic variables for induction () and activation (). Cybernetic models of metabolism were first formulated to describe the growth behavior of cells in multi-substrate environments. These models build on the assumption that the synthesis and activity of the enzymatic machinery are regulated to maximize a return on investment (ROI), such as, biomass, carbon uptake, etc. [5,6,7]. For example, in the classic scenario of diauxic growth, E. coli regulates its transport enzymes and prioritizes the utilization of the substitutable substrates based on an optimal growth rate [5]. While cybernetic models have focused on bacterial systems in the past, we presently adapt this framework to model the dynamic behavior of prostaglandin (PG) formation as an inflammatory response of bone marrow derived macrophages (BMDM) in a mammalian system [7,8,9,10].
Inflammation is an active defense mechanism of multicellular organisms in response to various harmful stressors. The primary role of inflammation is to counter the effects of these stressors and to initiate cell and tissue repair. Multiple factors in the immune system respond to inflammation; for example, macrophages are a type of white blood cell of the immune system designed to target substances that lack surface proteins associated with healthy body cells [11]. Upon infection, macrophage cells are activated via induced metabolic changes associated with lipids [12,13]. Consequently, we focus our study on a sub-category of fatty acyls known to contribute to inflammation, the eicosanoids. Eicosanoids are derived from arachidonic acid (AA), a 20-carbon fatty acid and are further classified into prostaglandins, thromboxanes, leukotrienes, and other oxidized products [14]. PGs have been found to mediate pain, fever, and other symptoms associated with inflammation [15]. PGs are synthesized from AA via the enzyme Prostaglandin G/H synthase (EC 1.14.99.1; cyclooxygenase (COX)), which has been targeted for treating inflammation, musculoskeletal pain, and other conditions. COX inhibitors are common and found in daily-use drugs such as aspirin and ibuprofen [16].
Lipid biosynthesis often requires the active transport and the chemical transformation of several intermediates. Lipid biosynthesis is further regulated at the corresponding enzyme synthesis levels starting from enzyme transcription through RNA processing, translation, and posttranslational modifications. We previously developed an approach to model the flux of AA and its downstream metabolites and applied it to the data from the murine macrophage-like (RAW 264.7) cells [17]. We also extended this model to bone marrow derived macrophages (BMDM) primed with the lipopolysaccharide (LPS) analogue KDO2-Lipid A (KLA) and activated with a purinergic P2X7 receptor agonist adenosine triphosphate (ATP) [18]. Despite their ability to effectively predict the metabolite levels, these models either do not incorporate biological regulatory mechanisms or only account for simple regulation, such as at the gene expression level [17,18,19,20]. Given that biological processes are regulated at many other stages, such as posttranslational protein modification and interaction with a protein or substrate molecule, we have used the cybernetic modeling framework to account for such regulations in the modeling of lipid metabolism in this work.
The work presented here serves to provide a predictive kinetic model incorporating cellular regulatory mechanisms for eicosanoid metabolism, and signaling using the cybernetic framework, with inflammation as the system objective. While there is no single entity that represents the totality of inflammation by itself, the cytokine tumor necrosis factor alpha (TNFα) is well-known for its role in the generation of systemic inflammation and is a product of the response of macrophages to ATP and LPS [21,22]. We hypothesize that PG metabolism is regulated to maximize inflammation, characterized by the amount of TNFα generated by the system. Using the lipid pathways derived from the Kyoto Encyclopedia of Genes and Genomes (KEGG) pathway database and the time-course data from LIPID MAPS, our cybernetic approach to model the macrophage system provides a quantitative model of eicosanoid metabolism initiated with changes in the levels of AA (input) and resulting in the inflammatory outcome represented by TNFα [23,24,25,26,27]. The present study is an exemplar that highlights the potential for cybernetic approaches.
2. Materials and Methods
To describe the time-dependent formation of PGs, a kinetic model is generated. This description approximates the conversion of AA into an intermediate product, prostaglandin H2 (PGH2), and its subsequent conversion into downstream products, prostaglandin D2 (PGD2), prostaglandin E2 (PGE2), and prostaglandin F2α (PGF2α). In this simple network of PG formation, the main focus is on how the PGH2 conversion into the three downstream PG products is regulated, which may represent a central decision point in the lipid metabolic system in the macrophage inflammatory response (Figure 1a). The behavior of this network is modeled in three separate conditions, a control, a treatment with ATP, and a combined treatment of ATP and KLA. Measurements were made at 0, 0.25, 0.5, 1, 2, 4, 8, and 20 h after ATP stimulation (Figure 1b). The data for all these conditions was taken from LIPID MAPS [28,29,30,31]. Details of the experimental procedure can be obtained from the LIPID MAPS website (protocol available at: www.lipidmaps.org/protocols/PP0000004702.pdf).
2.1. Development of the Kinetic Model
The structure of the kinetics for this reaction network is arranged into two segments (Figure 1c). The first describes the conversion of AA into PGH2 using simple linear kinetics. The kinetics of this reaction is modeled as three separate mechanisms, including a basal rate of synthesis, generation due to ATP stimulation, and KLA priming of cells.
To capture the effect of ATP, the treatments to the culture are modeled as a piecewise function, f(t). This piecewise function ramps up to a maximum value of 1 at 0.5 h (ks = 2 h−1) and decreases exponentially (kd = 17.2 h−1) following the initial half hour of the experiment. For the KLA treatment case, the same f(t) was used with a 4 h adjustment to account for the 4 h priming of KLA prior to the ATP stimulation.
The primary difference in this function from previous work is in the second term, which includes exponential decay instead of a linear function to describe desensitization of cells to a given stimulus [32].
2.2. The Cybernetic Framework
The other segment of this model employs the cybernetic framework to capture the regulation between the different metabolic options [32]. In the cybernetic framework, there are two descriptions of the reaction kinetics. The first is the raw, enzyme-dependent rate of reaction, which we termed the kinetic rate of reaction, . This kinetic rate includes an enzyme quantity, , which represents the amount of enzyme devoted to the conversion of PGH2 to a PG product.
The second description uses the cybernetic approach, which assumes a certain metabolic objective, namely, the optimal production of PG derivatives leading to maximum TNFα production. The framework views each pathway as a metabolic option to achieve such an objective and describes metabolic regulation in terms of their optimal combinations. Flux through the ith pathway is modeled as regulated by the control of the enzyme level and its activity, that is:
where is the cybernetic variable controlling enzyme activity. The resulting ordinary differential equations (ODEs) for each metabolite incorporated into the model (Figure 1c) can be written as a combination of regulated rates, , and degradation, where is the degradation rate constant, of the metabolites, as follows:
The enzyme level, , is governed by the following dynamic equations:
where is the second cybernetic variable regulating the induction of the enzyme synthesis. The three terms on the right-hand side denote constitutive rate, , and inducible rate of enzyme synthesis modulated by the cybernetic variable, , and the decrease of the enzyme levels by degradation, where is the degradation rate constant. The cybernetic control variables, and , are computed from the Matching and Proportional laws, respectively, as follows:
where the ROI, , is defined by the flux through a particular pathway and is determined based on the designated system goal or objective [33].
2.3. Defining the Cybernetic Goal or Objective
PGs are well-characterized for their roles in the inflammatory response. Thus, in this paper, we focus on the regulation of PG synthesis as a function of TNFα, a marker of inflammation, for the selection of the model’s objective function. To quantify the relationship between the PGs and TNFα, a simple, linear model of TNFα level is developed as a function of levels using their time-series data, as follows:
We can also approximate the time derivative of TNFα concentration as a linear combination of time derivatives of concentrations over the time course. Additionally, due to the difference in magnitude of the different levels, a scaling was used to determine the contribution of each pathway leading to TNFα production. Thus, we define the weights, , as follows:
where is the weight associated with the branch leading to TNFα production ( values of 0.2114, 0.2201, and 0.5685 for i = 1, 2, and 3 correspond to PGE2, PGF2α, and PGD2, respectively). Weights were obtained from and , the average concentration of across time, via regression of and TNFα data (Matlab® function ‘fmincon’, using the interior-point algorithm) using eight time points across ATP stimulated and control conditions; does not change with time. Of the three pathways modeled, there is a varying degree of inflammation that results from the generation of each as described by the objective function. In this particular system, the ROI for each pathway is assumed to be the amount of TNFα that each unregulated pathway can yield at each instant in time, which is described by .
2.4. Estimation of the Kinetic Rate Parameters and Uncertainty Analysis
The model was parameterized using data from two of the three conditions, the control and the ATP treatment cases. Data was available for the AA, PGE2, PGF2α, and PGD2 metabolites as an eight-point time series over a 20 h time window. PGH2 is an unstable intermediate metabolite we could not measure experimentally; in our model, we constrained the maximum concentration of PGH2 to be ~10 pmol/μg DNA based on the total amount of PGs produced. The magnitudes of the different metabolites varied from 0.001 to 10 pmol/μg of DNA. To fit the model to the data, a least squared fit error was computed from the scaled profiles of the lipid, with respect to its maximum value, to ensure that the varying magnitude of each PG’s level did not skew the parameters towards the sole fit of the PGs with higher magnitudes. The overall objective function for fitting the data was to minimize the fit-error between the experimental and the predicted metabolite concentrations [17], as follows:
where K is the set of parameters or rate constants; X0 is the set of initial conditions of the enzyme concentrations; ni is the number of time-points, 21, interpolated from 0 to 20 h (indexed as j) in order to provide equal weightage to later time points in the model fit; and nsp is the total number of species (indexed as i). The ODEs in the model were solved using ode15s for the stiff systems in MATLAB (version 9.4.0.813654, R2018a, Natick, MA, USA). The parameters (Table A1) were optimized using a two-step hybrid optimization procedure that started with a genetic algorithm seeded with random initial parameter values and evolved up to 100 generations in order to determine near optimal parameter values (Matlab® function ‘ga’). The results from the application of the genetic algorithm-based optimization were then further refined using a generalized constrained non-linear optimization employing a gradient search method (Matlab® function ‘fmincon’, using the interior-point algorithm).
The quality of our model fit was assessed by comparing the variance for the fitted data to the variance in the experimental (replicate) data (treatment and control data combined) using the F-test, as follows [18]:
where Xj, j, and Yj denote the experimental data, mean experimental data, and simulated (fitted) data at time point j, respectively; nr is the number of replicates (nr = 3, indexed as i); nt is the number of experimental time points (nt = 8, indexed as j); and trt and ctrl are treatment and control groups, respectively. The degrees of freedom for determining the F distribution are df1 = and df2 = . F statistic values smaller than F0.95(16, 32) = 1.97 indicate statistically equal variance in simulated (fitted) and experimental data; whereas, F values smaller than F0.05(16, 32) = 0.4580 indicate the fit-error is statistically smaller than the experimental error.
3. Results
3.1. Development of the Kinetic Model for the COX Pathway
Our cybernetic model describes the conversion of AA into the intermediate product, PGH2, and its subsequent conversion into downstream prostaglandin products, PGE2, PGF2α, and PGD2. In this simple network of PG formation, the primary intent is on the regulation of PGH2 conversion into the three downstream PG products. To address the latter, cybernetic regulation (implementation of and variables) was used at this branch point. The model for the COX pathway was described by 7 ODEs and 18 kinetic parameters (Table A1) in total; these 18 rate constants were estimated using a hybrid optimization approach (Materials and Methods). Using the optimized parameters, the eicosanoid profiles for the control and ATP stimulated cases were simulated (Figure 2). For most time points, the difference between the simulated and experimental data in both the treatment and control conditions fell within the standard error of the mean. The goodness of fit for the model was further examined by performing the F-test, indicating that the fit-error was less than the experimental measurement error (Table 1).
The eicosanoid model robustness was evaluated by performing a parametric sensitivity analysis. Each parameter was varied individually by ± two-fold of the original optimized value and the maximum difference in the treatment and control case concentrations of each metabolite was plotted. The slopes of each metabolite sensitivity curve were calculated to evaluate the sensitivity for each parameter at the optimized value of that parameter. A heat map of the slopes was then generated (Figure 3). Small to moderate sensitivities in most of the parameters were observed. As expected, very little or no variation in the degradation parameters for PGD2, PGE2, and PGF2α or in the KLA parameter is seen in response to metabolite changes. This is especially relevant to note given that the data set in which the parameter set was optimized for simulation was not treated with KLA and, consequently, would not have a dependence on this parameter. Based on these results, our model of eicosanoid metabolism is shown to be robust with respect to parametric perturbations.
3.2. Prediction of the Eicosanoid Profile in KLA Primed ATP Stimulated Macrophages
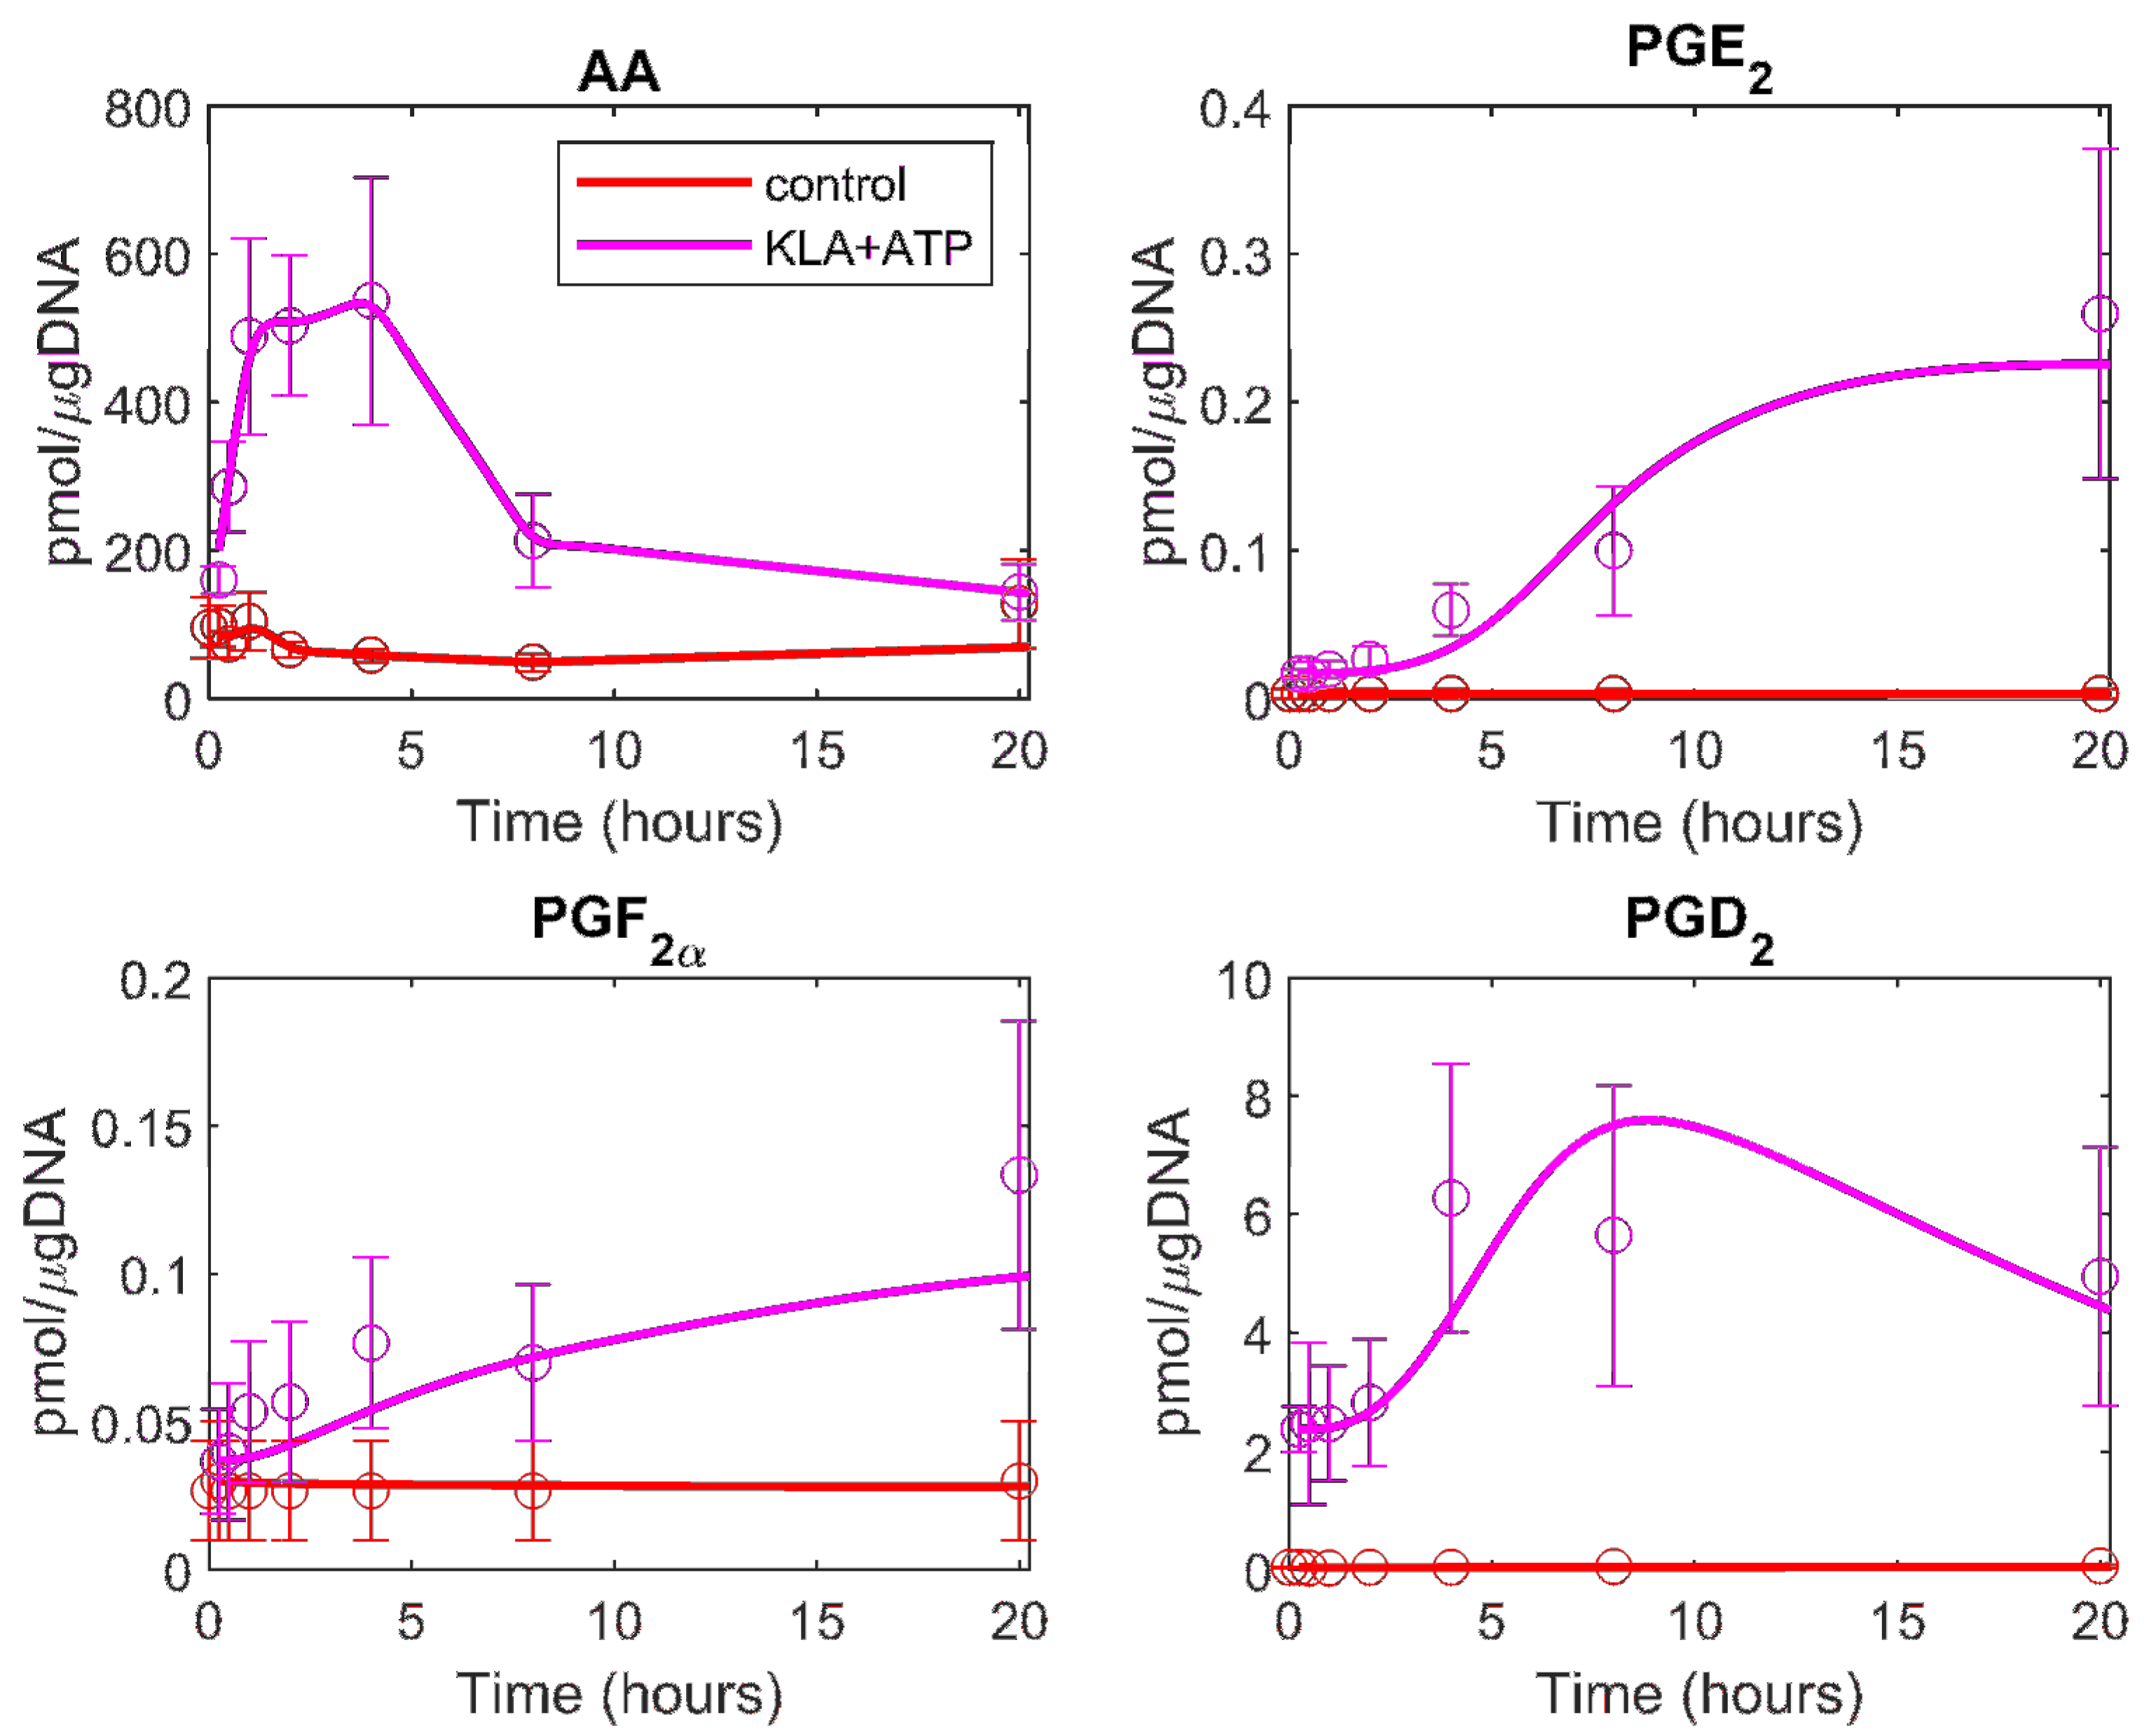
To test the validity of the above obtained parameters, we used the parameter values to predict the new data set, the eicosanoid profile in KLA primed ATP stimulated BMDM cells. When the profiles were predicted with the optimized parameter values, the model prediction did not fit the experimental data well. We allowed up to 30% variability in the originally optimized parameter values for the re-estimation of parameters in the KLA primed ATP stimulated case. The range of 30% variability was chosen based on previous work by our group in determining the uncertainty of the calculated parameters in the ATP stimulated model [18]. The prediction with the relaxed bounds on the parameters yields a good fit to the experimental data (Figure 4 and see the results of F-test in Table 1). This prediction of an independent experimental dataset (KLA primed and ATP stimulated case), which was not used to fit the ATP stimulation data, further validated the model and parameter values. The mathematical model reflects the AA metabolic network dynamics in BMDM cells.
3.3. Understanding the Role of Regulation in the Cybernetic Variables
In order to validate the cybernetic control mechanism that drives the modulation of the reaction rates in the model, the scaled gene expression data (representative of the enzymes synthesized) were compared to the scaled versions of the predicted enzyme levels. The qualitative trends among both the gene expression data and the predicted enzyme levels are expected to be similar [34]. Simply stated, if the gene expression level of the enzyme for one of the pathway branches is increasing over a certain time period, the cybernetic variable for the enzyme synthesis control and, therefore, the predicted enzyme levels should also be increasing.
For comparative purposes, we first identified the genes related to the respective branch in the eicosanoid metabolic pathways. These genes were selected using the KEGG database (Table 2) [24,27]. For two of the three branches in the pathway modeled, there are genes associated with enzymes for the catalysis of those pathways in the network. However, the PGF2α branch is a non-enzymatically regulated process and does not have an associated gene for comparison with the corresponding cybernetic variable.
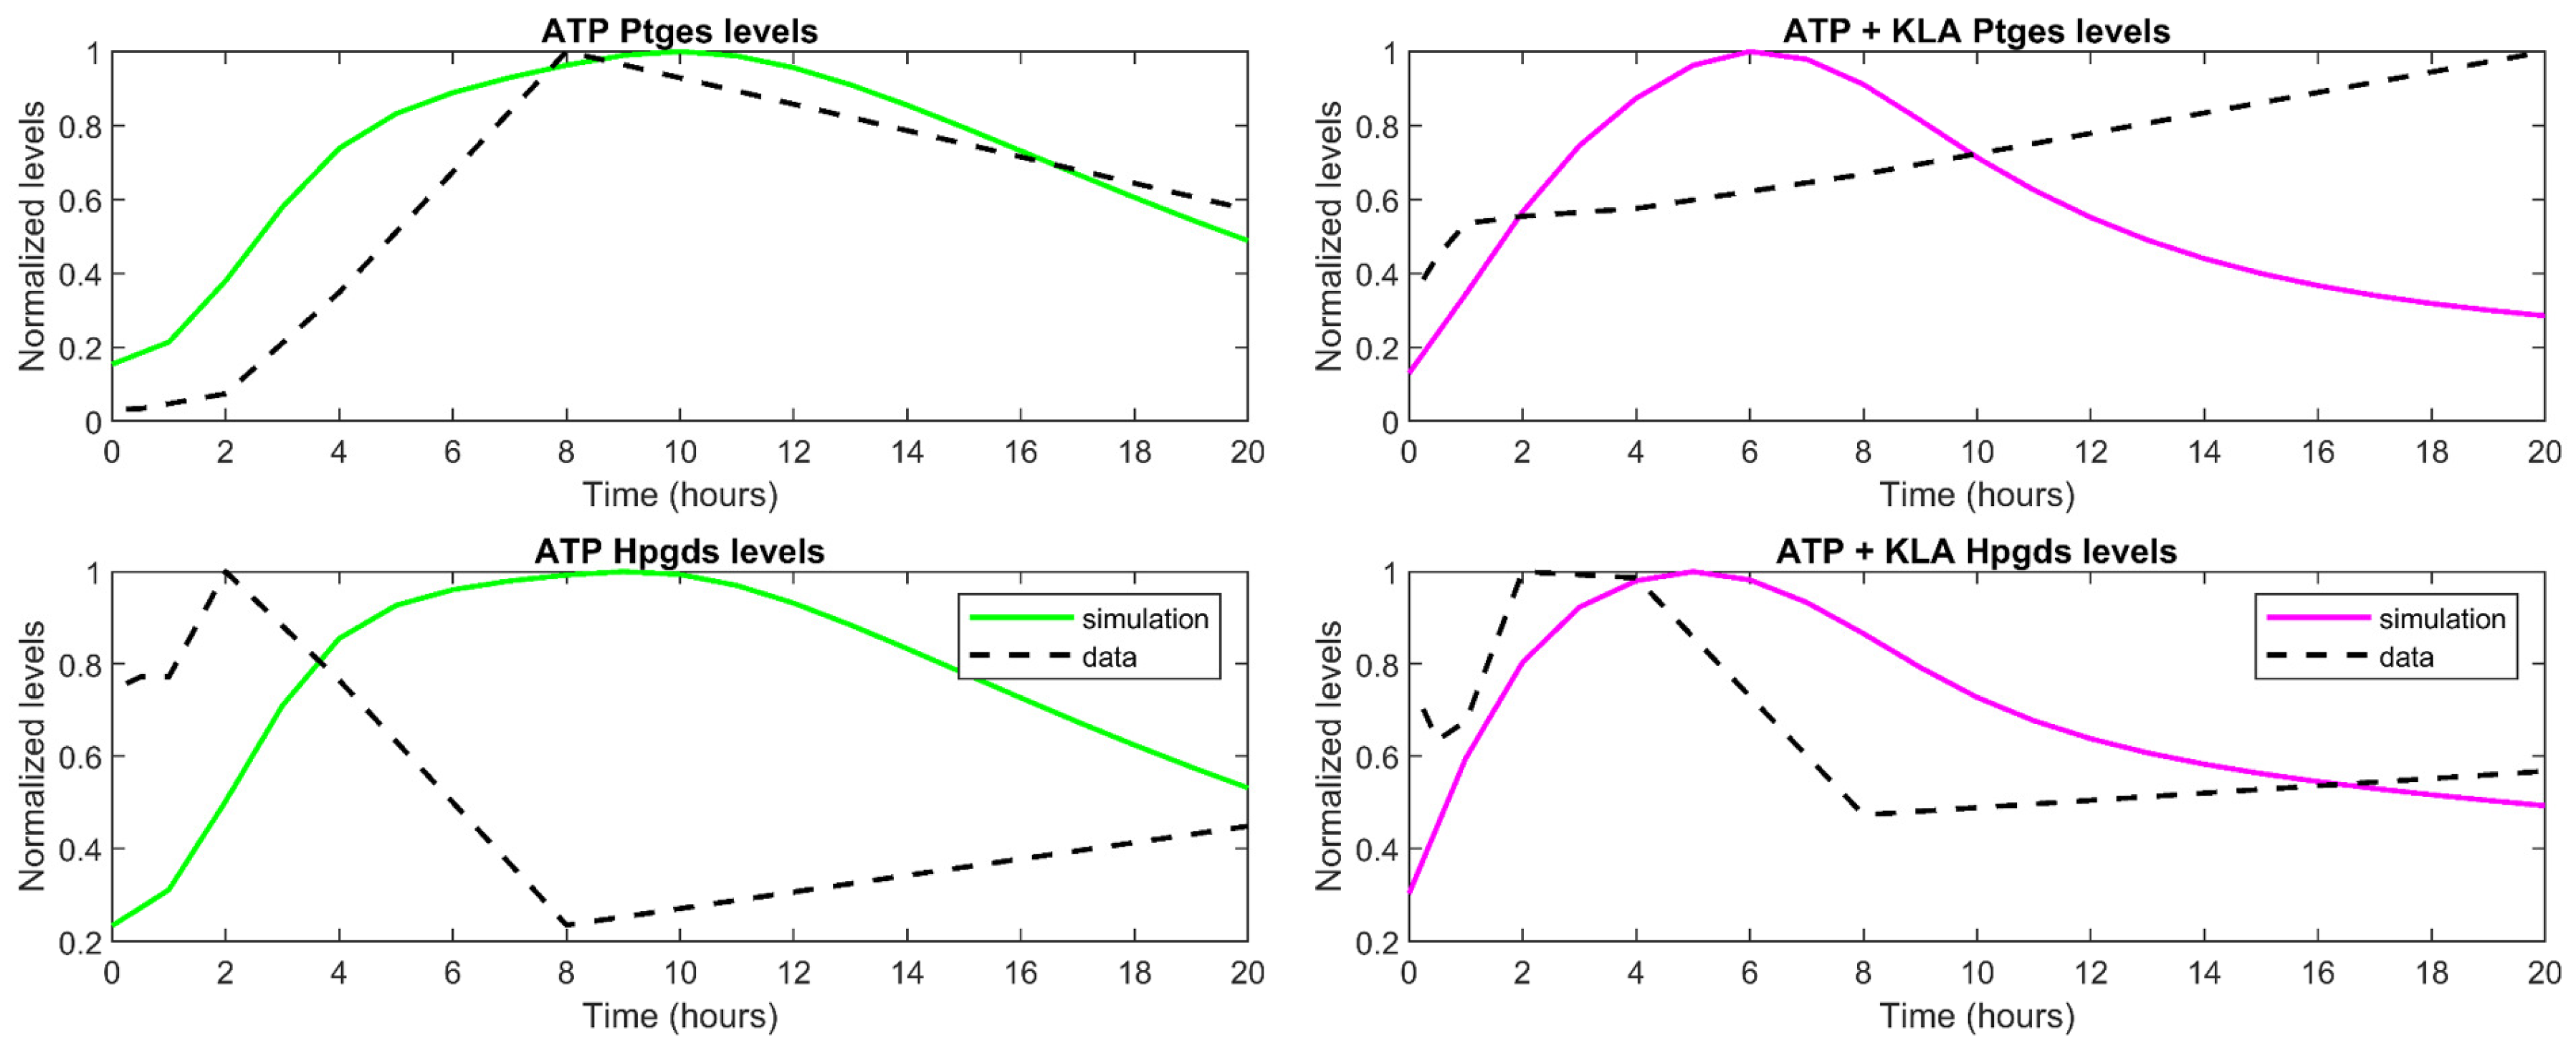
Gene expression data inform the relative levels of the enzymes present. To validate the cybernetic approach, we qualitatively compare the gene expression measurements with the corresponding cybernetic enzyme levels. Given that the gene expression data is represented as a fold change with respect to the control case, we have also taken fold changes of the enzyme levels from the cybernetic model in the treatment cases with respect to their corresponding value in the control cases. Both the gene expression and cybernetic enzyme level data were normalized by their corresponding maximum values (ei/ei,max) to visualize a clear comparison of the dynamic trends. These comparisons are made for both the ATP and the combined KLA primed ATP stimulated treatment conditions. Overall, the scaled predicted enzyme profiles in solid green (ATP stimulated case) and magenta (KLA primed ATP stimulated case) match the general behavior of their corresponding genes, identified in Table 2, which are denoted by dashed black lines (Figure 5). There are some discrepancies such as in the Ptges profile for KLA primed and ATP stimulated BMDM, as well as, the Hpgds profile for ATP stimulated BMDM. This could be attributed to the different types of data used in the comparison plot of the cybernetic variables, which represent the modeled proteomic levels of the enzymes with the available transcriptomic data.
4. Discussion
The cybernetic approach differs substantially from other modeling methods. For traditional kinetic modeling, detailed metabolic regulatory mechanisms are necessary [35,36]; however, the cybernetic approach models these regulatory actions as a collective process with an optimal system objective. Cybernetic enzymes and variables are used to describe a succinct mode of regulation related to the organism’s goal. Cybernetic models have been useful in not only describing complex substrate uptake patterns [7] but have also yielded successful predictions of intracellular fluxes [37], gene-knockout behaviors [38], and multiplicity of steady states in chemostats [39]. While we show that cybernetic modeling predicts complex cellular phenomena, we also validate the assumption that the cybernetic control mechanisms mimic cellular regulation [34]. The cybernetic variables for enzyme synthesis and activity, and , are compared with experimental data representative of the regulatory mechanisms in cells. We show that the scaled predicted enzyme profiles generally match the behavior of their corresponding genes identified from literature (Section 3.3). These predicted enzyme levels are calculated from metabolomics data based on the assumption that the enzymes for different pathways are regulated in such a way as to optimize the objective function—in this case, the formation of TNFα. The predicted enzyme levels, as informed by the control variables, are independent of the gene expression data. Qualitatively comparing the behavior of the dynamic gene expression profiles with the predicted enzyme levels further validates our cybernetic model (Figure 5) and serves to validate the idea that modeling macrophage cells from a goal-oriented perspective is useful.
The objective function used in the model, maximizing the rate of TNFα formation, is a central postulate of the cybernetic model presented here. While TNFα is well characterized as a signaling molecule generated in the macrophage response of LPS binding to the TLR4 receptor, other inflammatory cytokines, such as the interleukins (ILs) like IL-1, IL-6, and IL-12, can also be used to describe the goal of the system [40]. Control goals related to other functions of PGs, besides inflammation, are also of interest; however, given that the response of the macrophages to ATP and KLA is an inflammatory one, the objective function centered around TNFα is most relevant within the context of the system and conditions studied in this paper. To generate the cybernetic model, it is necessary to first make an assumption of the control goal. This assumption was further tested on the basis of whether or not the model is capable of making predictions of data beyond what the model is trained on. The fact that the model, with the TNFα objective function, is able to make predictions of the KLA primed and ATP stimulated treatment case, as well as of the gene expression trends, validates the use of TNFα as a control assumption central to the model.
The statistical analysis of multi-omics data coupled with the development of mathematical models aid in the unraveling of complex biological systems. We used a two-step, hybrid optimization approach in our study to estimate the rate constants of the AA metabolic network in BMDM using time-course lipidomic data. All of the kinetic parameters in our model were estimated through a nonlinear optimization approach based on the experimental data. Therefore, this study, using a multi-omics, data-driven, systems biology approach, is useful for understanding in vitro eicosanoid metabolism. Our model showed a good fit to the experimental data as seen from the goodness of fit performed by the F-test (Table 1), which suggests that the model captured the key characteristics of the lipid metabolic network in the BMDM cells. After fitting the parameters to two conditions (i.e., the control and ATP treatment conditions), the model provided the fits, which are shown in Figure 2. Effectively, this model is reliable as it is also evident that the model correctly explains the evolution of the metabolite concentrations for the different conditions involved in the fit. In the control condition, we see a relatively low rate of prostaglandin formation as we would expect. The ATP treatment case shows a good agreement with all of the prostaglandin products generated, and the kinetics of the model are cross-validated using an additional treatment condition, KLA primed ATP stimulated BMDM cells (Figure 2 and Figure 3).
We then compared the effective rate constants associated with the enzymes of Hpgds/Ptgds2 (EC 5.3.99.2) and Ptges (EC 5.3.99.3) and their corresponding values reported in the literature to confirm the reliability of our optimized parameter values [41,42,43,44,45,46,47]. In order to compare the enzyme activities obtained from concentrations in the LIPID MAPS experimental data and literature values of enzyme-enriched protein, we used appropriate conversion factors, as discussed in Kihara et al., 2014 [18]. In summary, the calculated values from our simulation of the eicosanoid metabolism for Ptgds2 activity and Ptges were within the expected range of the values reported in the literature. The reported flux of PGD2 in macrophages is not detectable and is determined to be less than 1 nmol/min/mg of total protein, which is consistent with our model value, 1 × 10⁻⁵ nmol/min/mg of total protein [46]. For the flux of PGE2, the reported literature value of 0.4 pmol/min/mg of the total protein is of the same order as our computed value, 0.1 pmol/min/mg of protein [43]. Our computed values are consistent with those reported in the literature and further validate our computational model.
In conclusion, we have developed a quantitative model of the eicosanoid metabolic pathway by using cybernetic regulation in primary macrophages under control (basal) and ATP stimulated conditions. Additionally, we have been successful in predicting the metabolite levels of the eicosanoid profiles and capturing the relative changes in gene expression of relevant enzymes under a set of conditions different from that used for calculating the model rate constants. In particular, we successfully predicted the eicosanoid profiles for the KLA primed ATP stimulated case. We have demonstrated the use of the cybernetic approach to model the regulation of mammalian lipid metabolism. The cybernetic model provides a robust description of metabolite formation and can be used to predict perturbations to metabolism. Our computational model assists in understanding the complexity of eicosanoid metabolism and in examining complex regulatory phenomena.
Author Contributions
Conceptualization, D.R., S.S., L.A., S.G., M.R.M., and F.T.D.; methodology, L.A., S.G., M.R.M., and F.T.D.; validation, L.A., S.G., and M.R.M.; formal analysis, L.A. and S.G.; investigation, L.A., S.G., and M.R.M.; resources, D.R. and S.S.; data curation, S.G., L.A., and M.R.M.; writing (original draft preparation), L.A.; writing (review and editing), L.A., S.G., M.R.M., F.T.D., D.R., and S.S.; visualization, L.A. and S.G.; supervision, D.R. and S.S.; project administration, D.R. and S.S.; funding acquisition, D.R. and S.S.
Funding
This work is supported by the Center for Science of Information (CSoI), a National Science Foundation Science and Technology Center, under grant agreement CCF-0939370 (S.S. and D.R.) and NIH Research Grants R01HL106579 (to S.S.), HL108735 (to S.S.), U01CA198941 (to S.S.), R01LM012595 (to S.S. and M.R.M.), and U19AI090023 (to S.S.).
Acknowledgments
We acknowledge Raja Hemanth—an undergraduate summer research student from the Department of Chemical Engineering, Indian Institute of Technology, Bombay, Mumbai, India—for his help with the initial weight calculations.
Conflicts of Interest
The authors declare no conflict of interest.
Appendix A

Table A1.
Reaction parameters were estimated for the eicosanoid metabolism model. The simulated and predicted columns refer to the parameters optimized for ATP stimulated BMDM cells and KLA primed ATP stimulated BMDM cells, respectively. The predicted parameters were further optimized from the simulated parameters within 30% variability.
| PARAMETER | SIMULATED | PREDICTED |
|---|---|---|
| KPGH2 | 0.0022 | 0.0016 |
| KPGE2 | 0.0044 | 0.0031 |
| KPGF2α | 0.0326 | 0.0339 |
| KPGD2 | 0.0533 | 0.0585 |
| 𝛾PGE2 | 0.0062 | 0.0044 |
| 𝛾PGF2α | 0.0205 | 0.0197 |
| 𝛾PGD2 | 0.1275 | 0.0893 |
| KKLA | 17.3923 | 0.0001 |
| KATP | 11.9112 | 8.3379 |
| KE,PGE2 | 8.0801 | 10.4215 |
| KE,PGF2α | 0.2078 | 0.1478 |
| KE,PGD2 | 0.2243 | 0.157 |
| 𝛾PGH2 | 0.2603 | 0.3384 |
| α | 0.2244 | 0.2918 |
| β | 0.7757 | 1.0082 |
| E0,PGE2 | 0.3974 | 0.5094 |
| E0,PGF2α | 0.0133 | 0.0105 |
| E0,PGD2 | 0.2601 | 0.3379 |
References
- Maurya, M.R.; Subramaniam, S. Computational Challenges in Systems Biology; Systems Biomedicine: Concepts and Perspectives; Elsevier: Oxford, UK, 2010; pp. 177–223. [Google Scholar]
- Gupta, S.; Ashok, R.D.; Merril, J.G.; Maurya, M.R.; Subramaniam, S. Omics Approaches to Macrophage Biology. In Macrophages: Biology and Role in the Pathology of Diseases; Springer: Berlin, Germany, 2014; pp. 587–615. [Google Scholar]
- Ramkrishna, D. A Cybernetic Perspective of Microbial Growth. In Foundations of Biochemical Engineering: Kinetics and thermodynamics in biological systems; American Chemical Society: Washington, DC, USA, 1982; pp. 161–178. [Google Scholar]
- Ramkrishna, D.; Song, H.S. Cybernetic Modeling for Bioreaction Engineering; Cambridge University Press: Cambridge, UK, 2018. [Google Scholar]
- Dhurjati, P.; Flickinger, M.C.; Tsao, G.T. A cybernetic view of microbial growth: Modeling of cells as optimal strategists. Biotechnol. Bioeng. 1985, 27, 1–9. [Google Scholar] [PubMed]
- Kompala, D.S.; Ramkrishna, D.; Jansen, N.B.; Tsao, G.T. Investigation of bacterial growth on mixed substrates: Experimental evaluation of cybernetic models. Biotechnol. Bioeng. 1986, 28, 1044–1055. [Google Scholar] [CrossRef] [PubMed]
- Ramakrishna, R.; Ramkrishna, D.; Konopka, A.E. Cybernetic modeling of growth in mixed, substitutable substrate environments: Preferential and simultaneous utilization. Biotechnol. Bioeng. 1996, 52, 141–151. [Google Scholar] [PubMed]
- Song, H.S.; Ramkrishna, D. Cybernetic models based on lumped elementary modes accurately predict strain-specific metabolic function. Biotechnol. Bioeng. 2011, 108, 27–40. [Google Scholar]
- Turner, B.G.; Ramkrishna, D.; Jansen, N.B. Cybernetic modeling of bacterial cultures at low growth rates: Mixed-substrate systems. Biotechnol. Bioeng. 1988, 32, 46–54. [Google Scholar] [CrossRef] [PubMed]
- Young, J.D.; Henne, K.L.; Morgan, J.A.; Konopka, A.E. Integrating cybernetic modeling with pathway analysis provides a dynamic, systems-level description of metabolic control. Biotechnol. Bioeng. 2008, 100, 542–559. [Google Scholar] [CrossRef] [PubMed]
- Koh, T.J.; DiPietro, L.A. Inflammation and wound healing: The role of the macrophage. Expert Rev. Mol. Med. 2011, 13, e23. [Google Scholar] [CrossRef] [PubMed]
- Remmerie, A.; Scott, C.L. Macrophages and lipid metabolism. Cell Immunol. 2018. [Google Scholar] [CrossRef] [PubMed]
- Hubler, M.J.; Kennedy, A.J. Role of lipids in the metabolism and activation of immune cells. J. Nutr. Biochem. 2016, 34, 1–7. [Google Scholar] [CrossRef] [PubMed] [Green Version]
- Funk, C.D. Prostaglandins and leukotrienes: Advances in eicosanoid biology. Science 2001, 294, 1871–1875. [Google Scholar] [CrossRef] [PubMed]
- Shimizu, T. Lipid mediators in health and disease: Enzymes and receptors as therapeutic targets for the regulation of immunity and inflammation. Annu. Rev. Pharmacol. Toxicol. 2009, 49, 123–150. [Google Scholar] [CrossRef] [PubMed]
- Smith, W.L.; DeWitt, D.L.; Garavito, R.M. Cyclooxygenases: Structural, cellular, and molecular biology. Annu. Rev. Biochem. 2000, 69, 145–182. [Google Scholar] [CrossRef] [PubMed]
- Gupta, S.; Maurya, M.R.; Stephens, D.L.; Dennis, E.A.; Subramaniam, S. An integrated model of eicosanoid metabolism and signaling based on lipidomics flux analysis. Biophys. J. 2009, 96, 4542–4551. [Google Scholar] [CrossRef] [PubMed]
- Kihara, Y.; Gupta, S.; Maurya, M.R.; Armando, A.; Shah, I.; Quehenberger, O.; Glass, C.K.; Dennis, E.A.; Subramaniam, S. Modeling of eicosanoid fluxes reveals functional coupling between cyclooxygenases and terminal synthases. Biophys. J. 2014, 106, 966–975. [Google Scholar] [CrossRef] [PubMed]
- Gupta, S.; Kihara, Y.; Maurya, M.R.; Norris, P.C.; Dennis, E.A.; Subramaniam, S. Computational modeling of competitive metabolism between omega3- and omega6-polyunsaturated fatty acids in inflammatory macrophages. J. Phys. Chem. B 2016, 120, 8346–8353. [Google Scholar] [CrossRef] [PubMed]
- Gupta, S.; Maurya, M.R.; Merrill, A.H., Jr; Glass, C.K.; Subramaniam, S. Integration of lipidomics and transcriptomics data towards a systems biology model of sphingolipid metabolism. BMC Syst. Biol. 2011, 5, 26. [Google Scholar] [CrossRef] [PubMed] [Green Version]
- Suzuki, T.; Hide, I.; Ido, K.; Kohsaka, S.; Inoue, K.; Nakata, Y. Production and release of neuroprotective tumor necrosis factor by P2X7 receptor-activated microglia. J. Neurosci. 2004, 24, 1–7. [Google Scholar] [CrossRef] [PubMed]
- Van der Bruggen, T.; Nijenhuis, S.; van Raaij, E.; Verhoef, J.; van Asbeck, B.S. Lipopolysaccharide-induced tumor necrosis factor alpha production by human monocytes involves the raf-1/MEK1-MEK2/ERK1-ERK2 pathway. Infect. Immun. 1999, 67, 3824–3829. [Google Scholar] [PubMed]
- Kanehisa, M.; Sato, Y.; Kawashima, M.; Furumichi, M.; Tanabe, M. KEGG as a reference resource for gene and protein annotation. Nucleic Acids Res. 2016, 44, D457–462. [Google Scholar] [CrossRef] [PubMed]
- Tanabe, M.; Kanehisa, M. Using the KEGG database resource. Curr. Protoc. Bioinf. 2012, 38, 1.12.1–1.12.43. Available online: https://doi.org/10.1002/0471250953.bi0112s38 (accessed on 7 August 2018).
- Fahy, E.; Cotter, D.; Sud, M.; Subramaniam, S. Update of the LIPID MAPS comprehensive classification system for lipids. J. Lipid Res. 2009, 50, S9–S14. [Google Scholar] [CrossRef] [PubMed]
- Sud, M.; Fahy, E.; Cotter, D.; Brown, A.; Dennis, E.A.; Glass, C.K.; Merrill, A.H.Jr.; Murphy, R.C.; Raetz, C.R.; Russell, D.W.; et al. LMSD: LIPID MAPS structure database. Nucleic Acids Res. 2007, 35, D527–532. [Google Scholar] [CrossRef] [PubMed]
- Ogata, H.; Goto, S.; Sato, K.; Fujibuchi, W.; Boho, H.; Kanehisa, M. KEGG: Kyoto encyclopedia of genes and genomes. Nucleic Acids Res. 1999, 27, 29–34. [Google Scholar] [CrossRef] [PubMed]
- The LIPID MAPS Lipidomics Gateway. Available online: http://www.lipidmaps.org/ (accessed on 7 August 2018).
- Dennis, E.A.; Deems, R.A.; Harkewicz, R.; Quehenberger, O.; Brown, H.A.; Milne, S.B.; Myers, D.S.; Glass, C.K.; Hardiman, G.; Reichart, D.; et al. A mouse macrophage lipidome. J. Biol. Chem. 2010, 285, 39976–39985. [Google Scholar] [CrossRef] [PubMed]
- Dinasarapu, A.R.; Gupta, S.; Ram Maurya, M.; Fahy, E.; Min, J.; Sud, M.; Gersten, M.J.; Glass, C.K.; Subramaniam, S. A combined omics study on activated macrophages–enhanced role of STATs in apoptosis, immunity and lipid metabolism. Bioinformatics 2013, 29, 2735–2743. [Google Scholar] [CrossRef] [PubMed]
- Subramaniam, S.; Fahy, E.; Gupta, S.; Sud, M.; Byrnes, R.W.; Cotter, D.; Dinasarapu, A.R.; Maurya, M.R. Bioinformatics and systems biology of the lipidome. Chem. Rev. 2011, 111, 6452–6490. [Google Scholar] [CrossRef] [PubMed]
- DeVilbiss, F.T. Is Metabolism Goal-Directed? Investigating the Validaty of Modeling Biological Systems with Cybernetic Control via Omic Data. Ph.D Thesis, Purdue University, West Lafayette, IN, USA, 2016. [Google Scholar]
- Young, J.D.; Ramkrishna, D. On the matching and proportional laws of cybernetic models. Biotechnol. Prog. 2007, 23, 83–99. [Google Scholar] [CrossRef] [PubMed]
- DeVilbiss, F.; Mandli, A.; Ramkrishna, D. Consistency of cybernetic variables with gene expression profiles: A more rigorous test. Biotechnol. Prog. 2018. In press. [Google Scholar] [CrossRef] [PubMed]
- Jahan, N.; Maeda, K.; Matsouka, Y.; Sugimoto, Y.; Kurata, H. Development of an accurate kinetic model for the central carbon metabolism of Escherichia coli. Microb. Cell Fact 2016, 15, 1–19. [Google Scholar] [CrossRef] [PubMed]
- Kotte, O.; Zaugg, J.B.; Heinemann, M. Bacterial adaptation through distributed sensing of metabolic fluxes. Mol. Syst. Biol. 2010, 6, 355–364. [Google Scholar] [CrossRef] [PubMed] [Green Version]
- Song, H.S.; Ramkrishna, D.; Pinchu, G.E.; Belaiev, A.S.; Konopka, A.E.; Frederickson, J.K. Dynamic modeling of aerobic growth of Shewanella oneidensis. Predicting triauxic growth, flux distributions, and energy requirement for growth. Metab. Eng. 2013, 15, 25–33. [Google Scholar] [CrossRef] [PubMed]
- Song, H.S.; Ramkrishna, D. Prediction of dynamic behavior of mutant strains from limited wild-type data. Metab. Eng. 2012, 14, 69–80. [Google Scholar] [CrossRef] [PubMed]
- Kim, J.I.; Song, H.S.; Sunkara, S.R.; Lali, A.; Ramkrishna, D. Exacting predictions by cybernetic model confirmed experimentally: Steady state multiplicity in the chemostat. Biotechnol. Prog. 2012, 28, 1160–1166. [Google Scholar] [CrossRef] [PubMed]
- Balkwill, F.R.; Burke, F. The cytokine network. Immunol. Today 1989, 10, 299–304. [Google Scholar] [CrossRef]
- Boulet, L.; Ouellet, M.; Bateman, K.P.; Ethier, D.; Percival, M.D.; Riendeau, D.; Mancini, J.A.; Méthot, N. Deletion of microsomal prostaglandin E2 (PGE2) synthase-1 reduces inducible and basal PGE2 production and alters the gastric prostanoid profile. J. Biol. Chem. 2004, 279, 23229–23237. [Google Scholar] [CrossRef] [PubMed]
- Schomburg, I.; Chang, A.; Ebeling, C.; Gremse, M.; Heldt, C.; Huhn, G.; Schomburg, D. BRENDA, the enzyme database: Updates and major new developments. Nucleic Acids Res. 2004, 32, D431–433. [Google Scholar] [CrossRef] [PubMed]
- Lazarus, M.; Kubata, B.K.; Eguchi, N.; Fujitani, Y.; Urade, Y.; Hayaishi, O. Biochemical characterization of mouse microsomal prostaglandin E synthase-1 and its colocalization with cyclooxygenase-2 in peritoneal macrophages. Arch. Biochem. Biophys. 2002, 397, 336–341. [Google Scholar] [CrossRef] [PubMed]
- Tanioka, T.; Nakatani, Y.; Semmyo, N.; Murakami, M.; Kudo, I. Molecular identification of cytosolic prostaglandin E2 synthase that is functionally coupled with cyclooxygenase-1 in immediate prostaglandin E2 biosynthesis. J. Biol. Chem. 2000, 275, 32775–32782. [Google Scholar] [CrossRef] [PubMed]
- Chan, G.; Boyle, J.O.; Yang, E.K.; Zhang, F.; Sacks, P.G.; Shah, J.P.; Edelstein, D.; Soslow, R.A.; Koki, A.T.; Woerner, B.M. Cyclooxygenase-2 expression is up-regulated in squamous cell carcinoma of the head and neck. Cancer Res. 1999, 59, 991–994. [Google Scholar] [PubMed]
- Urade, Y.; Ujihara, M.; Horiguchi, Y.; Igarashi, M.; Nagata, A.; Ikai, K.; Hayaishi, O. Mast cells contain spleen-type prostaglandin D synthetase. J. Biol. Chem. 1990, 265, 371–375. [Google Scholar] [PubMed]
- Shimizu, T.; Yamamoto, S.; Hayaishi, O. Purification and properties of prostaglandin D synthetase from rat brain. J. Biol. Chem. 1979, 254, 5222–5228. [Google Scholar] [PubMed]
Figure 1.
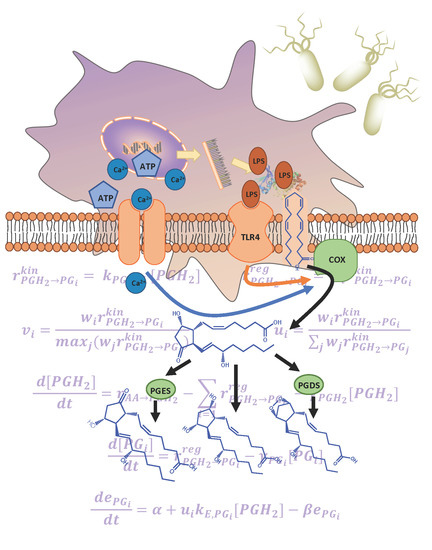
(a) The arachidonic acid metabolic pathway map for the breakdown of arachidonic acid into respective prostaglandin products via prostaglandin H2 (PGH2) is shown: (rectangles) enzymes, (ellipses) lipid metabolites, (shaded) measured metabolites, (arrows) enzymatic and non-enzymatic reactions; (b) bone marrow derived macrophages (BMDM) were pretreated with or without KLA for 4 h and then stimulated with or without ATP. The media and cells were collected for lipidomic, tumor necrosis factor alpha (TNFα) and transcriptomic analysis at 0, 0.25, 0.5, 1, 2, 4, 8, and 20 h after ATP stimulation; (c) depiction of the simplified system network used for kinetic modeling illustrates PGH2 as a control point and e1, e2, and e3 as cybernetic enzymes regulated via cybernetic variables for the regulation of PGD2, PGE2, and PGF2α fluxes.
Figure 1.
(a) The arachidonic acid metabolic pathway map for the breakdown of arachidonic acid into respective prostaglandin products via prostaglandin H2 (PGH2) is shown: (rectangles) enzymes, (ellipses) lipid metabolites, (shaded) measured metabolites, (arrows) enzymatic and non-enzymatic reactions; (b) bone marrow derived macrophages (BMDM) were pretreated with or without KLA for 4 h and then stimulated with or without ATP. The media and cells were collected for lipidomic, tumor necrosis factor alpha (TNFα) and transcriptomic analysis at 0, 0.25, 0.5, 1, 2, 4, 8, and 20 h after ATP stimulation; (c) depiction of the simplified system network used for kinetic modeling illustrates PGH2 as a control point and e1, e2, and e3 as cybernetic enzymes regulated via cybernetic variables for the regulation of PGD2, PGE2, and PGF2α fluxes.

Figure 2.
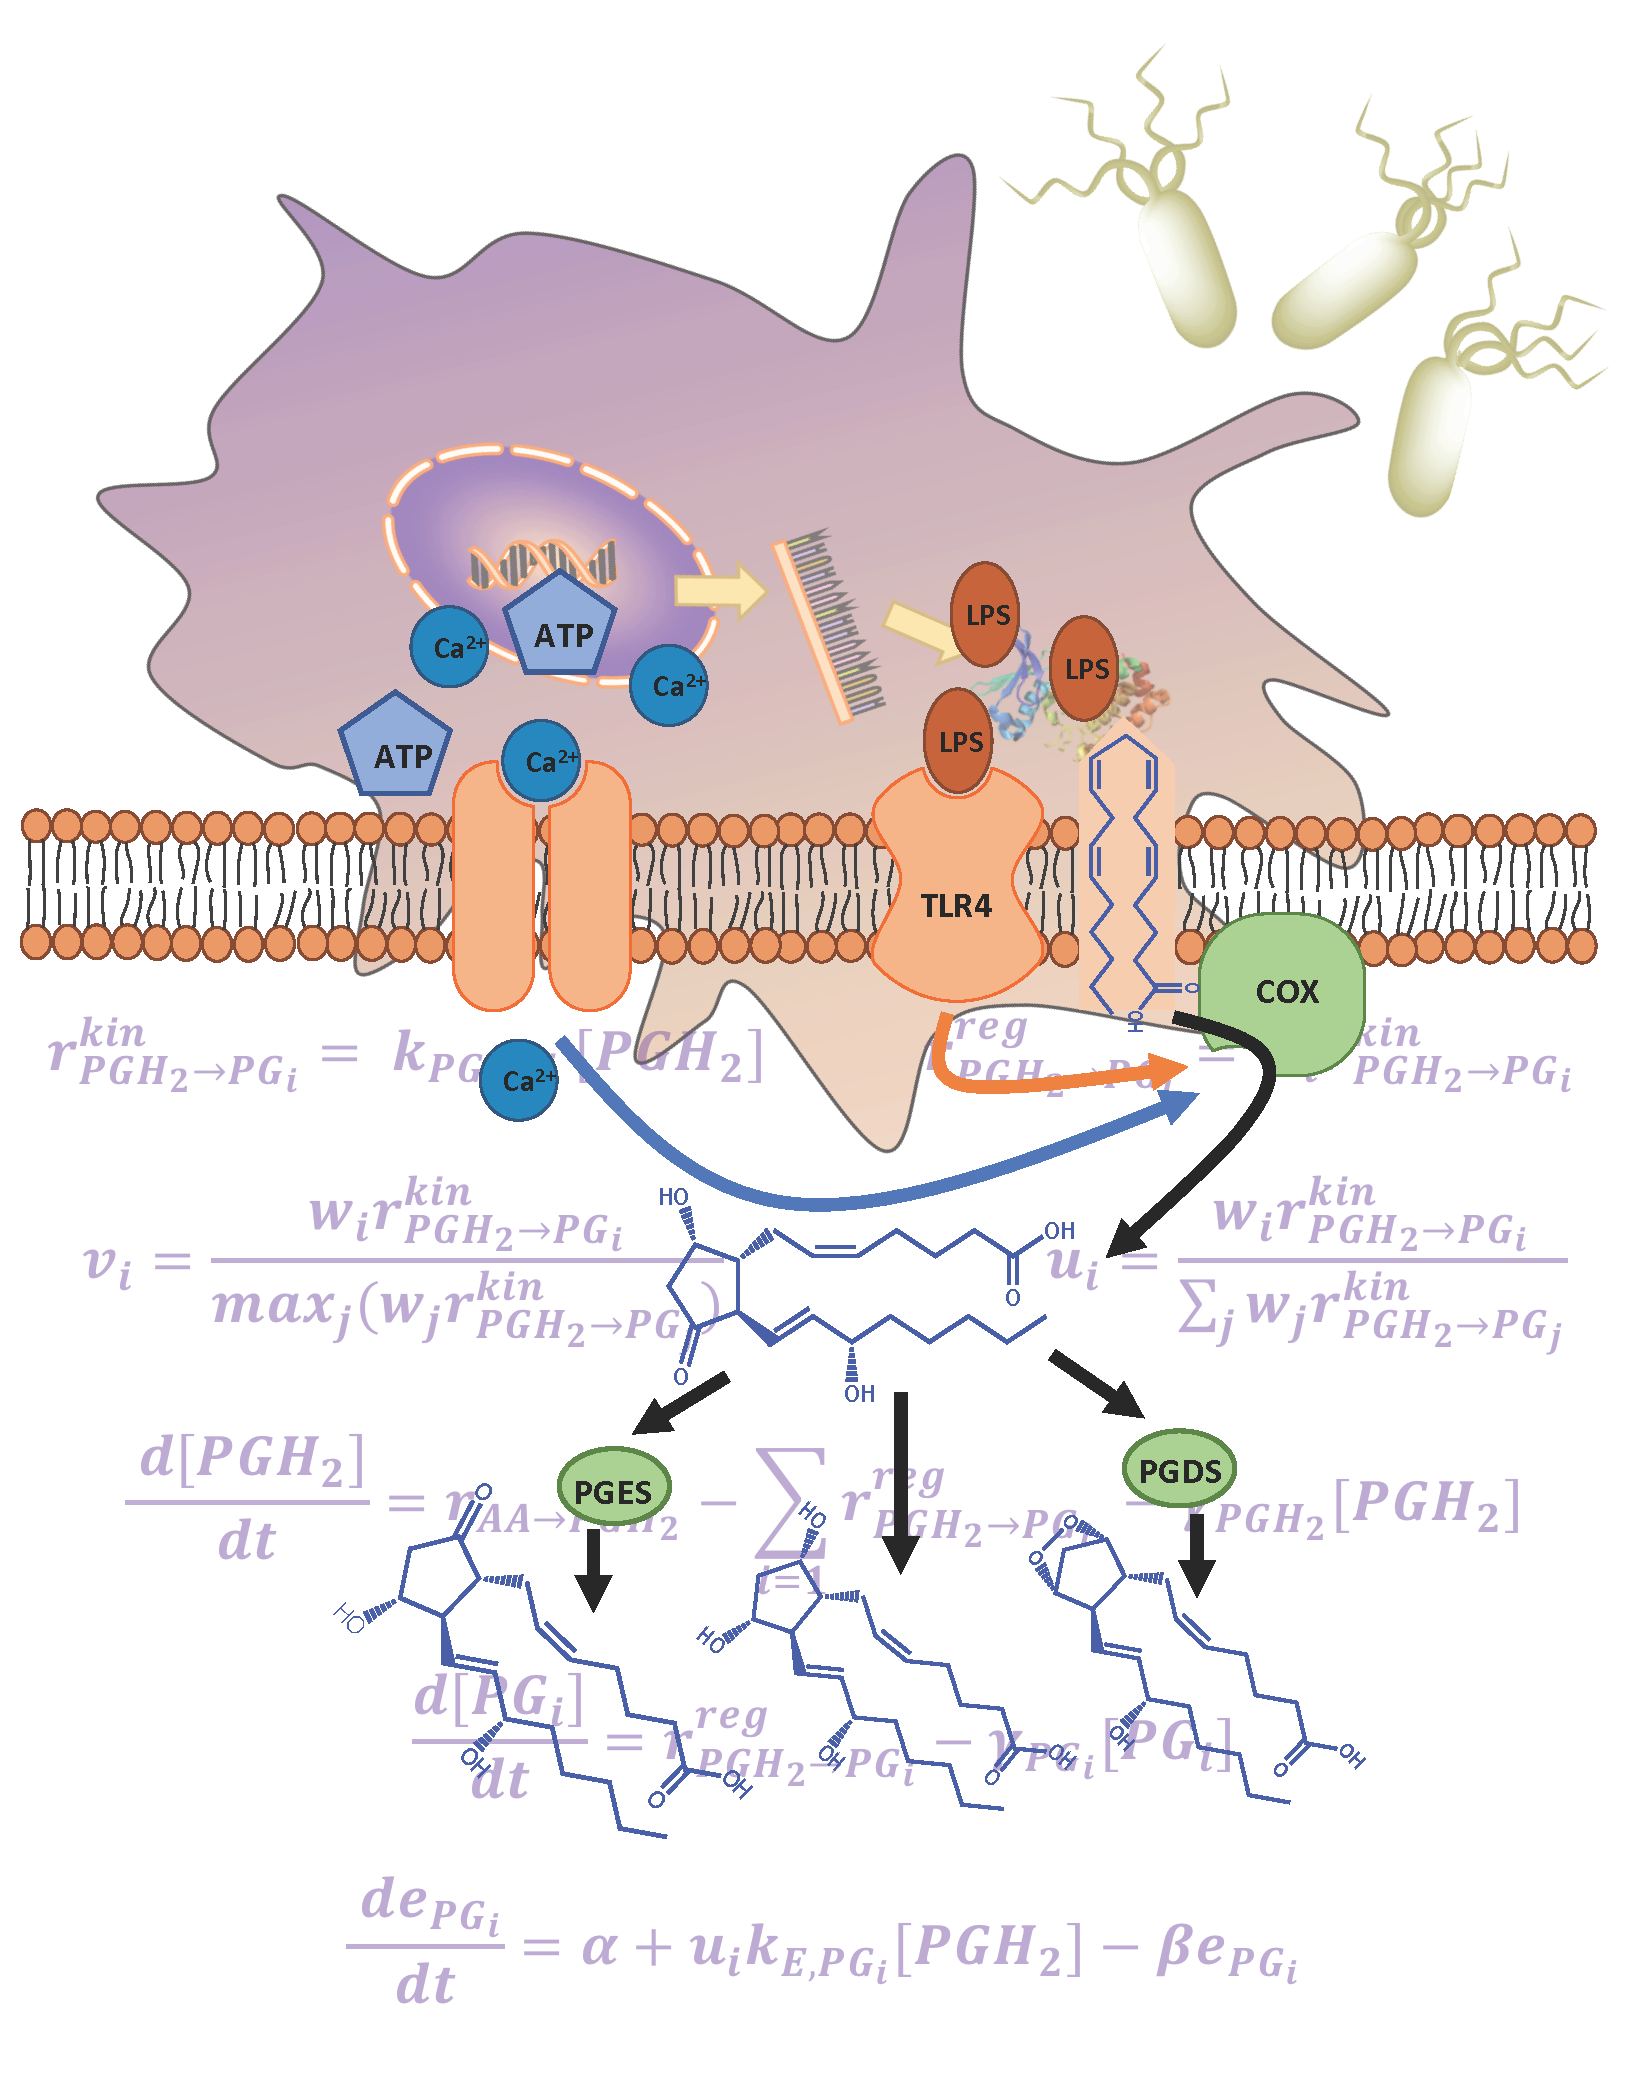
The computational simulation of the eicosanoid profile is generated using the cybernetic model in ATP stimulated BMDM. The mean experimental data (circles) with associated standard error of the mean (SEM) from three replicate experiments (n = 3) for the ATP stimulated (green) and control (red) cases are taken from the mass spectrometry measurements of lipids. The simulation results are shown for the treatment and control cases (solid green and red curves, respectively).
Figure 2.
The computational simulation of the eicosanoid profile is generated using the cybernetic model in ATP stimulated BMDM. The mean experimental data (circles) with associated standard error of the mean (SEM) from three replicate experiments (n = 3) for the ATP stimulated (green) and control (red) cases are taken from the mass spectrometry measurements of lipids. The simulation results are shown for the treatment and control cases (solid green and red curves, respectively).

Figure 3.
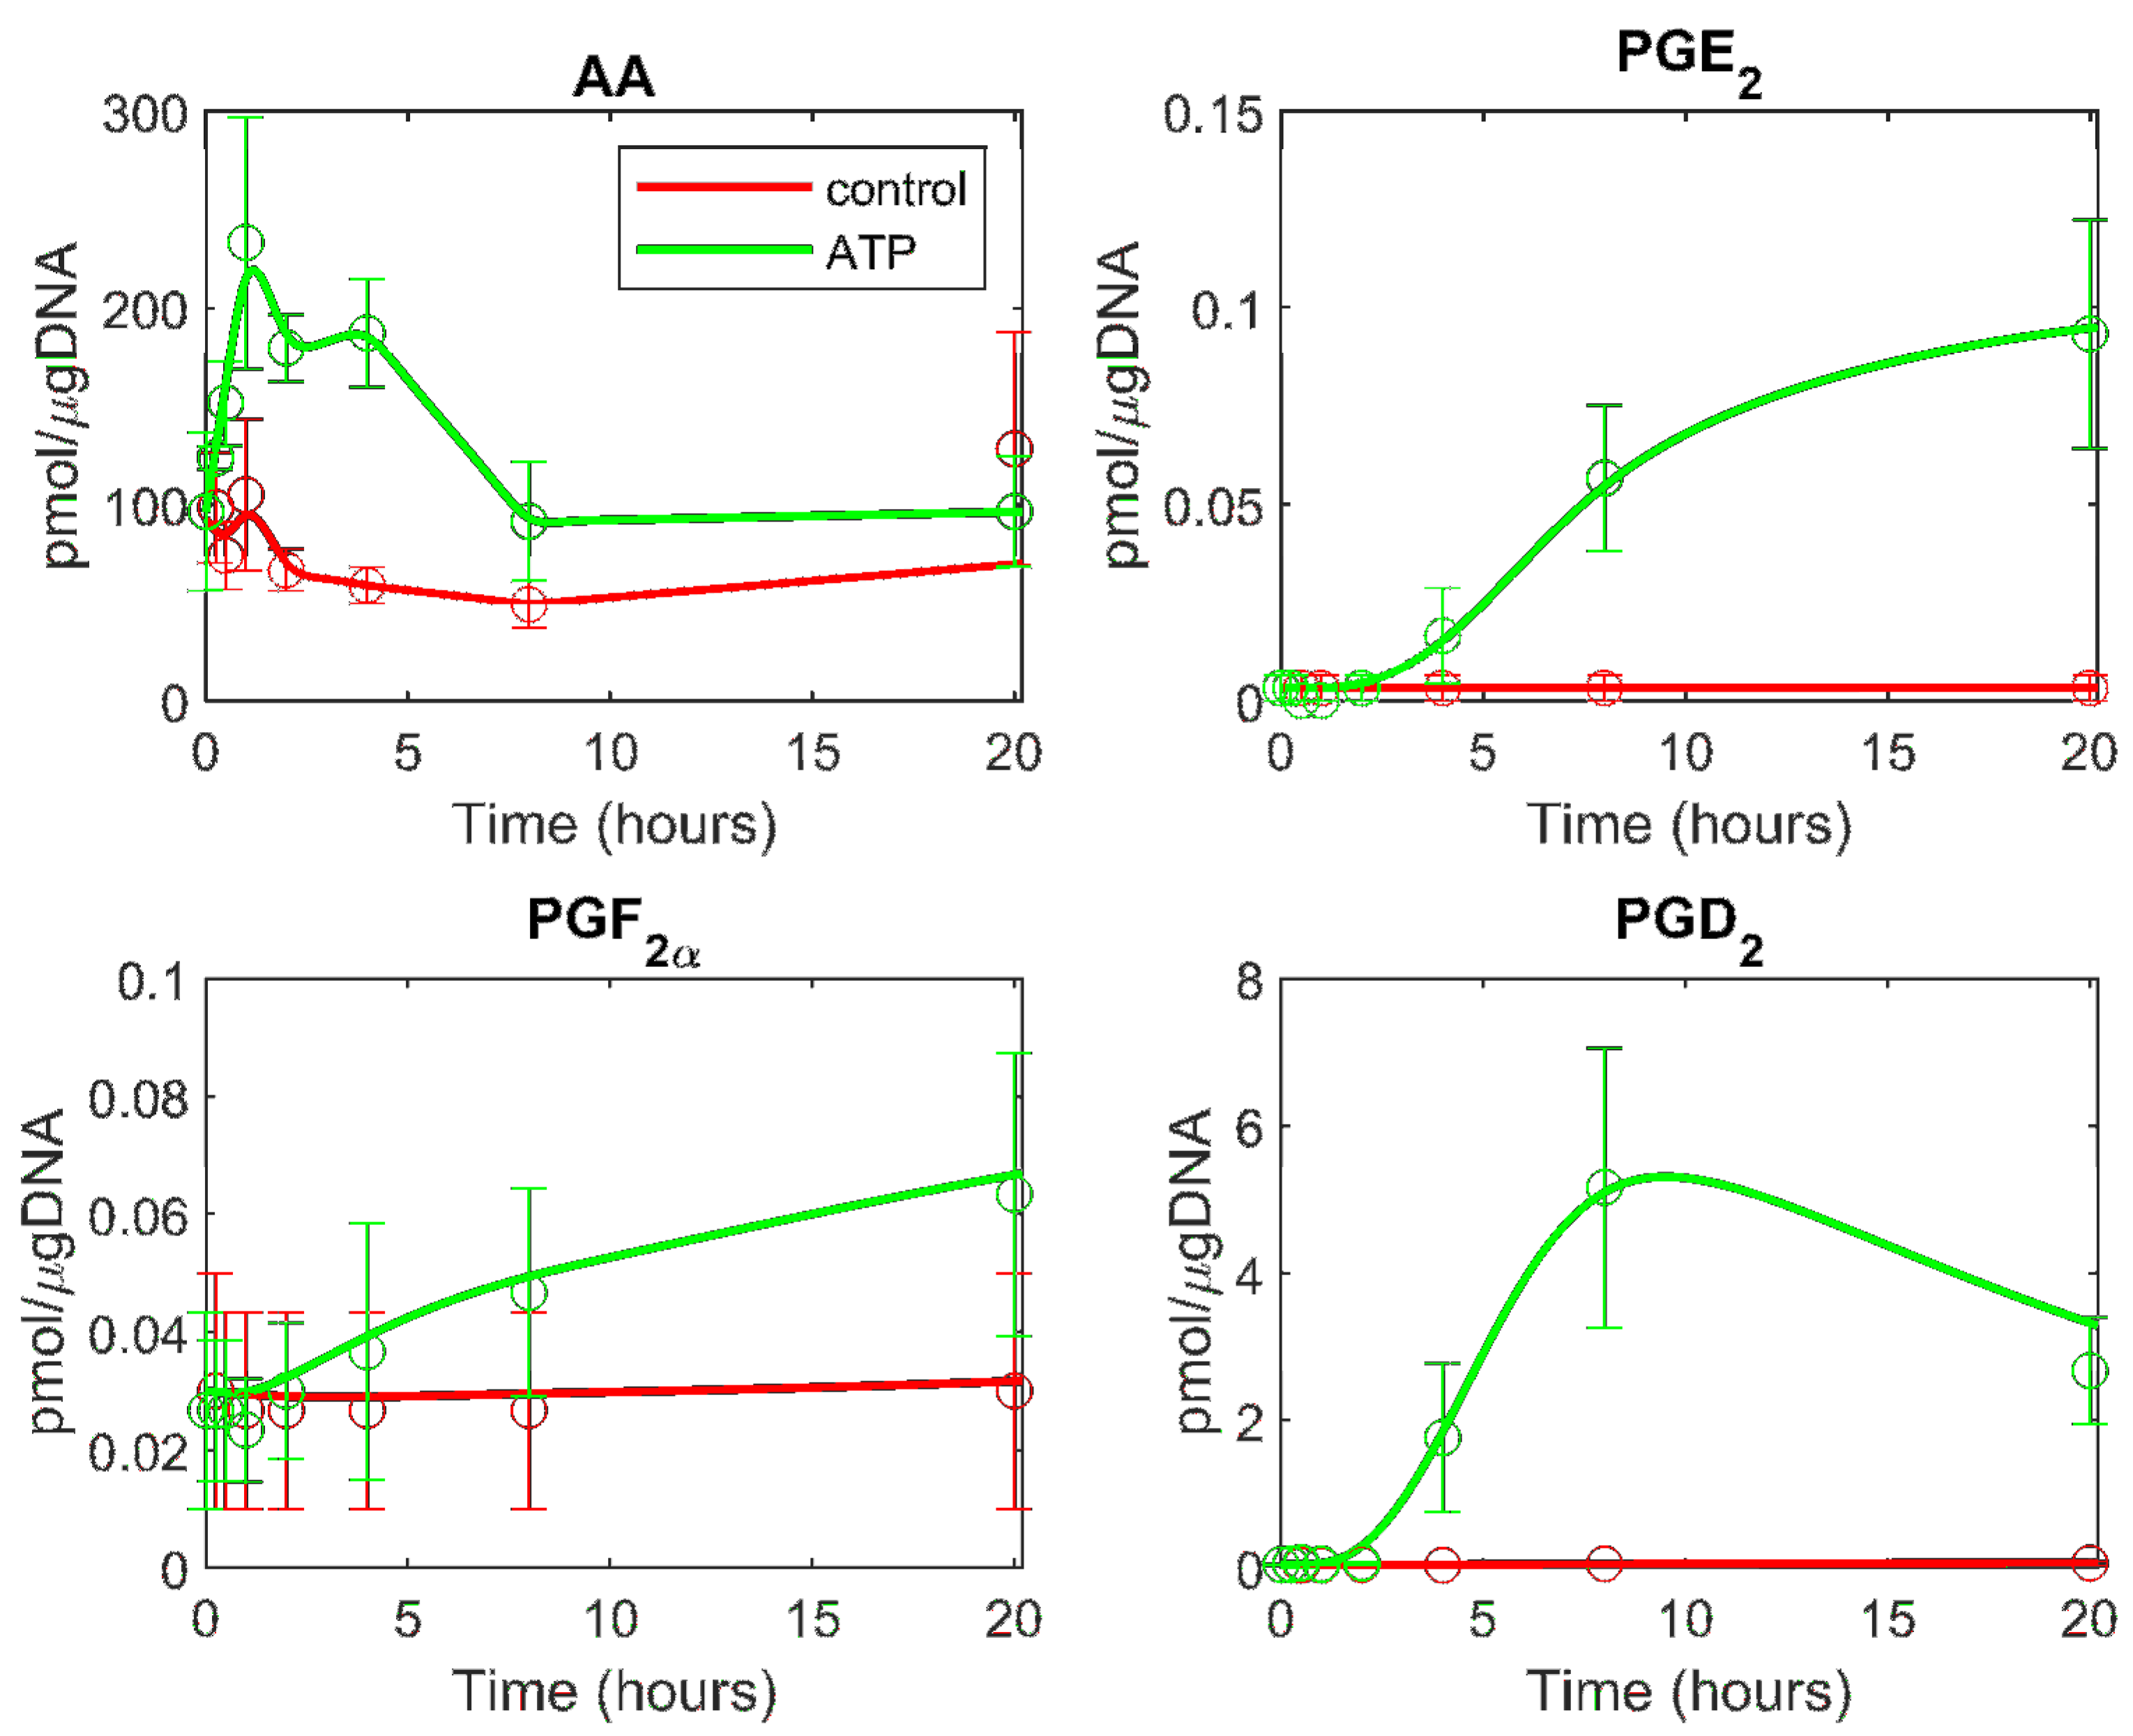
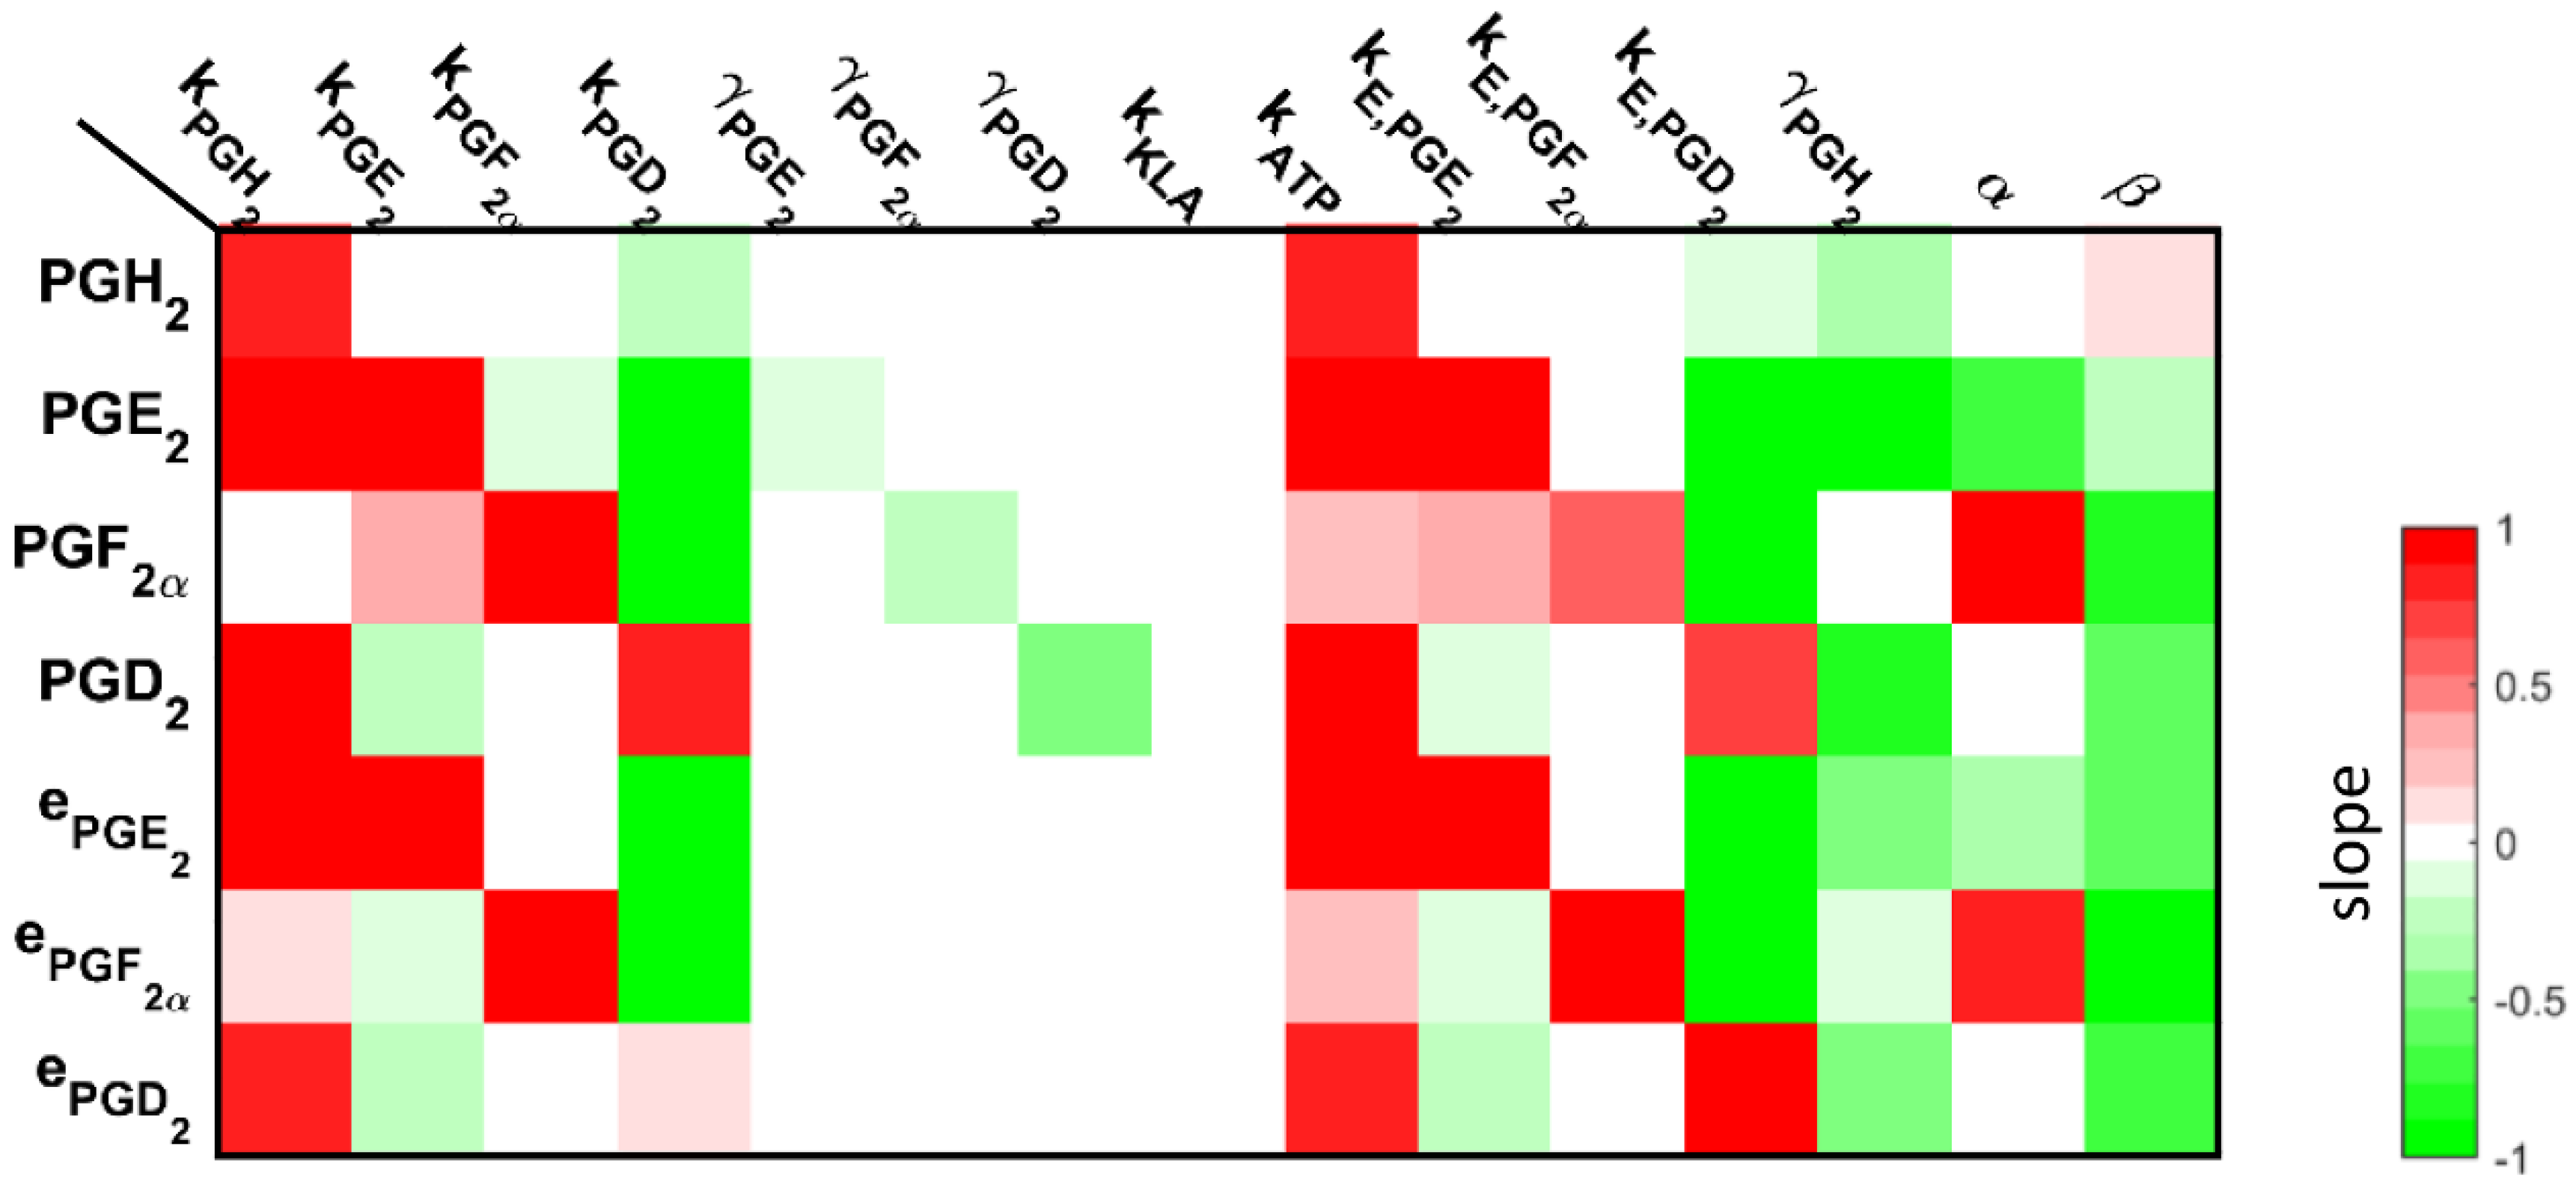
The slope of the sensitivity curves of the arachidonic acid (AA) metabolism are shown as a heat map. For example, the changes in the parameter associated with a conversion of AA into prostaglandin H2 (PGH2) resulted in an increase in all of the metabolites; whereas, changes in the degradation of PGH2 resulted in a decrease in all of the metabolites. This is expected, given that PGH2 is in the upper part of the network, so the changes associated with these parameters will result in an impact on all of the corresponding downstream metabolites.
Figure 3.
The slope of the sensitivity curves of the arachidonic acid (AA) metabolism are shown as a heat map. For example, the changes in the parameter associated with a conversion of AA into prostaglandin H2 (PGH2) resulted in an increase in all of the metabolites; whereas, changes in the degradation of PGH2 resulted in a decrease in all of the metabolites. This is expected, given that PGH2 is in the upper part of the network, so the changes associated with these parameters will result in an impact on all of the corresponding downstream metabolites.

Figure 4.
The computational prediction of the eicosanoid profile is generated using the cybernetic model in KLA primed and ATP stimulated BMDM. The mean experimental data (circles) with associated standard error of the mean (SEM) from three replicate experiments (n = 3) for KLA primed ATP-treated (magenta) and control (red) cases are taken from the mass spectrometry measurements of the lipids. The prediction results are shown for the treatment and control cases (solid magenta and red curves, respectively).

Figure 5.
The behavior of the scaled cybernetic model enzyme level simulations (green in ATP stimulated case and magenta in KLA primed, followed by ATP stimulated case) generally match the trends of the scaled gene expression values (black dashed lines) for Ptges and Hpgds/Ptgds2 pathways in (left) ATP and (right) combined KLA primed ATP stimulated treatments.

Table 1.
Goodness of fit, F-test, for simulated/optimized (adenosine triphosphate (ATP) stimulated data) and predicted (Kdo2-Lipid A (KLA) primed and ATP stimulated) cases. F values smaller than F0.05(16, 32) = 0.4580 indicate that the fit-error is statistically smaller than the experimental error; whereas the F values smaller than F0.95(16, 32) = 1.97 indicate that the fit-error is statistically comparable to the experimental error. PGD2—prostaglandin D2; PGE2—prostaglandin E2; PGF2α—prostaglandin F2α.
| Metabolite | Model Fit to ATP Data | Model Fit to KLA and ATP Data |
|---|---|---|
| PGE2 | 0.0312 | 0.2421 |
| PGF2α | 0.0470 | 0.0342 |
| PGD2 | 0.2636 | 0.1192 |
Table 2.
Enzymes were identified from the Kyoto Encyclopedia of Genes and Genomes (KEGG) database and other selected resources for each pathway downstream of prostaglandin H2 (PGH2) in prostaglandin synthesis. There is not a specific enzyme associated with the regulation of PGH2 into PGF2α.
Table 2.
Enzymes were identified from the Kyoto Encyclopedia of Genes and Genomes (KEGG) database and other selected resources for each pathway downstream of prostaglandin H2 (PGH2) in prostaglandin synthesis. There is not a specific enzyme associated with the regulation of PGH2 into PGF2α.
| Entrez ID | Pathway | Gene Symbol | Name |
|---|---|---|---|
| 64292 | PGH2 → PGE2 | Ptges | prostaglandin E synthase |
| 54486 | PGH2 → PGD2 | Hpgds/Ptgds2 | hematopoietic prostaglandin D2 synthase |
© 2018 by the authors. Licensee MDPI, Basel, Switzerland. This article is an open access article distributed under the terms and conditions of the Creative Commons Attribution (CC BY) license (http://creativecommons.org/licenses/by/4.0/).
Share and Cite
MDPI and ACS Style
Aboulmouna, L.; Gupta, S.; Maurya, M.R.; DeVilbiss, F.T.; Subramaniam, S.; Ramkrishna, D. A Cybernetic Approach to Modeling Lipid Metabolism in Mammalian Cells. Processes 2018, 6, 126. https://doi.org/10.3390/pr6080126
AMA Style
Aboulmouna L, Gupta S, Maurya MR, DeVilbiss FT, Subramaniam S, Ramkrishna D. A Cybernetic Approach to Modeling Lipid Metabolism in Mammalian Cells. Processes. 2018; 6(8):126. https://doi.org/10.3390/pr6080126
Chicago/Turabian StyleAboulmouna, Lina, Shakti Gupta, Mano R. Maurya, Frank T. DeVilbiss, Shankar Subramaniam, and Doraiswami Ramkrishna. 2018. "A Cybernetic Approach to Modeling Lipid Metabolism in Mammalian Cells" Processes 6, no. 8: 126. https://doi.org/10.3390/pr6080126
Note that from the first issue of 2016, this journal uses article numbers instead of page numbers. See further details here.