Article

Achieving a Near-Theoretical Maximum in Peak Capacity Gain for the Forensic Analysis of Ignitable Liquids Using GC×GC-TOFMS

1
Centre for Forensic Science, University of Technology Sydney, P.O. Box 123, Ultimo, NSW 2007, Australia
2
Restek Corporation, 110 Benner Circle, Bellefonte, PA 16823, USA
*
Author to whom correspondence should be addressed.
Separations 2016, 3(3), 26; https://doi.org/10.3390/separations3030026
Submission received: 2 June 2016 / Revised: 10 August 2016 / Accepted: 17 August 2016 / Published: 1 September 2016
(This article belongs to the Special Issue Two-Dimensional Gas Chromatography)

Abstract

:
At present, gas chromatography–quadrupole mass spectrometry (GC-qMS) is considered the gold standard amongst analytical techniques for fire debris analysis in forensic laboratories worldwide, specifically for the detection and classification of ignitable liquids. Due to the highly complex and unpredictable nature of fire debris, traditional one-dimensional GC-qMS often produces chromatograms that display an unresolved complex mixture containing only trace levels of the ignitable liquid among numerous background pyrolysis products that interfere with pattern recognition necessary to verify the presence and identification of the ignitable liquid. To combat these challenges, this study presents a method optimized to achieve a near-theoretical maximum in peak capacity gain using comprehensive two-dimensional gas chromatography (GC×GC) coupled to time-of-flight mass spectrometry (TOFMS) for the forensic analysis of petroleum-based ignitable liquids. An overall peak capacity gain of ~9.3 was achieved, which is only ~17% below the system’s theoretical maximum of ~11.2. In addition, through the preservation of efficient separation in the first dimension and optimal stationary phase selection in the second dimension, the presented method demonstrated improved resolution, enhanced sensitivity, increased peak detectability and structured chromatograms well-suited for the rapid classification of ignitable liquids. As a result, the method generated extremely detailed fingerprints of petroleum-based ignitable liquids including gasoline, kerosene, mineral spirits and diesel fuel. The resultant data was also shown to be amenable to chromatographic alignment and multivariate statistical analysis for future evaluation of chemometric models for the rapid, objective and automated classification of ignitable liquids in fire debris extracts.

Graphical Abstract

1. Introduction

In Australia, the state of New South Wales (NSW) Crime Act 1900 defines arson as the “malicious destruction and damage of property by fire” [1]. In many cases, ignitable liquids (such as gasoline) are used to accelerate the combustion of materials that do not readily burn, and to direct or promote the spread of fire [2]. Arson requires no special knowledge; the necessary supplies are inexpensive and readily available to the general public. It is estimated that arson-related incidents cause the Australian community approximately $600 million dollars in damage every year [1].
The chemical analysis of fire debris for the detection and identification of ignitable liquids comprises three essential steps: (1) extraction and concentration of the suspected ignitable liquid residue from the fire debris; (2) instrumental analysis of the extracted sample; and (3) interpretation of the results. The American Society of Testing and Materials (ASTM International) has provided a number of standard guides, practices and test methods for each of these steps since 1990. Active standard practices for the separation (and concentration) of ignitable liquid residues from fire debris samples include: solvent extraction (i.e., ASTM E1386-15 [3]), direct headspace (i.e., ASTM E1388-12 [4]), dynamic headspace concentration (i.e., ASTM E1413-13 [5]), passive headspace concentration with activated charcoal (i.e., ASTM E1412-16 [6]) and passive headspace concentration with solid phase microextraction (SPME) (i.e., ASTM E2154-15a [7]). The gold standard in instrumental analysis of fire debris extracts is gas chromatography–quadrupole mass spectrometry (GC-qMS). ASTM E1618-14 [8], the “Standard Test Method for Ignitable Liquid Residues in Extracts from Fire Debris Samples by Gas Chromatography-Mass Spectrometry”, also includes sections on data analysis, ignitable liquid classification and the interpretation of results, in addition to guidelines for preparing the subsequent forensic laboratory report.
In the past, much of the research in the literature has revolved around step 1, evidenced by the broad spectrum of approved standard practices for the extraction and concentration of ignitable liquid residues. This study focuses on challenges with instrumental analysis, and how these challenges can filter down to data interpretation, creating a bottleneck in fire debris analysis.
Petroleum-based ignitable liquids (e.g., gasoline, kerosene and diesel fuel) represent the preferred choice of accelerant for arsonists based on accessibility and low-cost. The complex nature of these ignitable liquids poses a number of challenges for arson investigators. Petroleum-based ignitable liquids are composed of hundreds of compounds having different chemical and physical properties. Throughout the course of a fire and during firefighting efforts, these compounds will be consumed or otherwise weathered at an unpredictable rate, often leaving behind only trace quantities or residues of the original fuel [9,10]. Furthermore, ignitable liquid residues are susceptible to microbial degradation; this is problematic when extensive case backlogs prevent immediate analysis, and fire debris evidence must be stored at room temperature for extended periods [11].
Many of the target compounds necessary for pattern recognition and definitive classification of an ignitable liquid may be reduced or lost as a result of these processes, and are therefore at risk of appearing below the detection limit of traditional one-dimensional (1D) GC-qMS. Pattern recognition is further hindered by the numerous background volatiles and pyrolysis products that arise from the debris matrix [12], leading to incomplete separation of target and matrix components (i.e., an unresolved complex mixture). As a result, an expensive bottleneck in fire debris analysis is created due to the lengthy manual examinations required, often by multiple analysts, to interpret and verify the resultant data [13].
To combat these challenges, researchers have recently begun to investigate the use of advanced analytical methods such as comprehensive two-dimensional gas chromatography (GC×GC) [14,15]. GC×GC, first demonstrated by Liu and Phillips in 1991 [16], has numerous applications in the petroleum industry where the technique has been supported and promoted since its inception [17,18,19]. In fact, the concept of comprehensive multidimensional separation techniques was developed in response to the challenges presented by petroleum products.
GC×GC employs two GC columns with contrasting stationary phases that separate compounds based on different retention mechanisms. The first dimension (1D) column typically has similar dimensions (i.e., length and inner diameter (i.d.)) to that used in traditional 1D GC (e.g., 10–60 m × 0.18–0.25 mm), while the second dimension (2D) column is typically much shorter (e.g., 0.5–2 m). The two columns are coupled in series at an interface known as a modulator. The purpose of the modulator is two-fold: (1) to trap analytes as they elute from the 1D column; and (2) to periodically inject the analytes onto the 2D column in a series of short pulses. Modulation and separation in the 2D occur simultaneously, resulting in an overall runtime comparable to that found in 1D GC methods. The resulting chromatogram is typically viewed as a two-dimensional (2D) multi-coloured plot (i.e., contour plot) with the 1D retention time on the x-axis, the 2D retention time on the y-axis and the signal intensity represented by a colour gradient.
GC×GC offers a number of advantages over traditional 1D GC. First, GC×GC offers the potential for increased peak capacity (i.e., the maximum theoretical number of resolvable peaks that can fit within a given separation space at a specified resolution) over a comparable 1D system if operated efficiently, resulting in improved resolution and separation power. Second, when using thermal modulators, cryogenic zone compression occurring at the modulator compresses the chromatographic peaks into highly focused pulses enhancing peak detectability and delivering lower limits of detection, quantification and identification [20]. Third, the 2D separation decreases noise and improves sensitivity by removing interfering chemical signals (such as column bleed). Finally, GC×GC also provides ordered chromatograms where structurally-related compounds (e.g., homologues or isomers) elute with distinct patterns on the retention plane, assisting in sample characterization and compound identification [21,22,23].
The application of comprehensive two-dimensional gas chromatography for the forensic analysis of ignitable liquids in fire debris has only been reported twice in the literature—first in 2002 by Frysinger and Gaines [14], using GC×GC coupled with flame ionization detection, and a second time in 2012 by Taylor et al. [15] using GC×GC coupled with quadrupole mass spectrometry. Both studies concluded that GC×GC is well-suited for the analysis of complex petroleum-based ignitable liquids providing improved resolution, increased peak detectability, enhanced sensitivity and structured chromatograms. Neither method, however, comes close to exploiting the potential peak capacity gain capable of a GC×GC system. The use of GC×GC for the forensic analysis of fire debris has also been reviewed by Stauffer et al. in 2008 [24], and again more recently in 2016 by Sampat et al. [25] and by Martín-Alberca et al. [26]. With the ever-increasing use and awareness of GC×GC in forensic research laboratories worldwide (e.g., decomposition odor profiling in taphonomic experimental research [27,28,29], environmental forensics [30,31,32], etc.), it is anticipated that in the next 10–15 years, this advanced analytical technique will begin to play a more important role in the forensic analysis of fire debris for the detection and classification of ignitable liquids.
The objective of this study was to develop a GC×GC system coupled to a time-of-flight mass spectrometer that achieves a near-theoretical maximum in peak capacity gain for the forensic analysis of ignitable liquids using the recommended conditions recently published by Klee et al. [33]: (1) relatively sharp (about 20 ms at half height) reinjection pulses into the 2D column; (2) a relatively long 1D column (e.g., 60 m); (3) identical inner diameter in the 1D and 2D columns; (4) relatively low retention factor (k) at the end of the 2D analysis (i.e., k ≈ 5 instead of 15, optimal for ideal conditions); (5) optimum flow rate in both columns; (6) optimum heating rate in both columns; and (7) helium (rather than hydrogen) used as the carrier gas. The goal of this system is to produce the highest peak capacity possible in both dimensions using a column set that has been chosen to provide very efficient 1D separations and 2D selectivity for compounds important to arson investigations (e.g., substituted aromatics, oxygenates, etc.). A high peak capacity in the 1D is vital for isobaric compounds (i.e., compounds with the same molecular weight) that will not be resolved from each other in the 2D. To the authors’ knowledge, this work is the first reported use of GC×GC coupled to time-of-flight mass spectrometry (TOFMS) for the forensic analysis of ignitable liquids in the literature. A time-of-flight mass spectrometer detects all ions simultaneously providing mass spectral identifications with automated deconvolution capabilities, contributing a further improvement in sensitivity and identification accuracy over typical quadrupole mass spectrometers, which scan through the entire mass acquisition range.

2. Materials and Methods

2.1. Materials

Ignitable liquid standards were purchased as certified reference materials from Restek Corporation (Bellefonte, PA, USA). The standards included: E1618 Test Mixture, unleaded gasoline (0%, 25%, 50%, 75%, and 99% weathered), kerosene (0%, 25%, 50%, and 75% weathered), mineral spirits (0%, 25%, 50%, and 75% weathered), and diesel fuel (0%, 25%, 50%, and 75% weathered). The E1618 Test Mixture (defined in ASTM E1618-14 [8]) contained even-numbered normal alkanes ranging from n-hexane (n-C6) to n-eicosane (n-C20), o-ethyltoluene, m-ethyltoluene, toluene, 1,2,4-trimethylbenzene, and p-xylene. Weathered standards are characterized by their percent weight loss from the original material by means of evaporation. The E1618 Test Mixture had a concentration of 0.5 μL/mL (or 0.05% v/v) in methylene chloride while all other ignitable liquid standards had a concentration of ~5000 μg/mL in methylene chloride (with the exception of the gasoline standards which were received at a concentration of ~5000 μg/mL in P & T methanol). To obtain the working concentration specified in ASTM E1618-14 [8] (i.e., 0.05 μL/mL or 0.005% v/v), the E1618 Test Mixture was diluted 10× in methylene chloride (AR Grade; Chem-Supply Pty Ltd., Gillman, SA, Australia). All other ignitable liquid standards were also diluted 10× in methylene chloride to achieve a working concentration of ~500 μg/mL.

2.2. Instrumental Conditions

Sample analysis was performed using a Pegasus® 4D GC×GC-TOFMS system (LECO, Castle Hill, NSW, Australia) equipped with a liquid nitrogen dual-stage, quad-jet thermal modulator and an independent 2D oven. ChromaTOF® software (version 4.51.6.0; LECO) was used for instrument control. Experimental conditions were selected following recommendations proposed by Klee et al. [33] in order to achieve a near-theoretical maximum in peak capacity gain. Column configuration consisted of a nonpolar Rxi®-1ms column (Crossbond® dimethyl polysiloxane; 60 m × 0.25 mm i.d., 0.50 μm film thickness (df)) in the 1D and a polar Stabilwax® column (Crossbond® polyethylene glycol; 1.1 m × 0.25 mm i.d., 0.5 μm df) in the 2D (Restek Corporation). A SilTite™ µ-Union (SGE Analytical Science, Wetherill Park, NSW, Australia) was used to connect the 1D and 2D columns before the modulator.
High purity helium (BOC, Sydney, NSW, Australia) operated at a constant speed-optimized flow [34] of 2.0 mL/min was used as the carrier gas. All injections were performed in triplicate using 1 µL of sample with an Agilent 7693A Series autosampler (10 µL Gold Standard autosampler syringe; Agilent Technologies, Mulgrave, NSW, Australia), splitless injection (Sky® 4.0 mm i.d. Single Taper Inlet Liner with Wool; Restek Corporation), an inlet temperature of 250 °C, a purge time of 30 s, and an inlet purge flow of 20 mL/min. The 1D oven was temperature programmed from 40 °C (held for 1 min) to 255 °C (held for 5 min) at an optimal heating rate [35] of 3.5 °C/min (total runtime = 67.43 min). The 2D oven and modulator were programmed to have +5 °C and +20 °C offsets relative to the 1D oven, respectively. A modulation period of 2 s was used with a 0.5 s hot pulse and 0.5 s cooling time between stages. Following a 360 s solvent/acquisition delay, mass spectra were acquired at a rate of 400 spectra/s from m/z 35–400. The MS transfer line and ion source were maintained at 240 °C and 225 °C, respectively, the electron ionization energy was set at 70 eV and the detector was operated with a detector voltage of 1544 V. The TOFMS was tuned and calibrated using perfluorotributylamine (PFTBA) each day before the instrument was used.
For comparative purposes, the E1618 Test Mixture and each ignitable liquid standard was also analyzed using 1D gas chromatography–time-of-flight mass spectrometry (GC-TOFMS) with a modulation period of 0 s and a reduced data acquisition rate of 10 spectra/s; all other instrumental conditions remained the same.

2.3. Data Processing

ChromaTOF® software (version 4.51.6.0; LECO) was also used for data processing and chromatographic visualization. The baseline was automatically smoothed with an 80% offset. For peak searching, expected peak widths were set at 8 s in the 1D and 0.1 s in the 2D, and the signal-to-noise cutoff was set at 250 for base peaks and 20 for sub-peaks. The expected 1D peak width was estimated based on the expected number of slices (i.e., ~4) multiplied by the modulation period (i.e., 2), while the expected peak width in the 2D was established based on the typical widths observed for the narrowest, non-saturated peaks detected within the resultant chromatograms. A mass spectral match >650 was required to combine sub-peaks with each other and their corresponding base peak. The detected peaks were tentatively identified by means of a forward search of the 2011 National Institute of Standards and Technology (NIST) mass spectral library database using a minimum similarity match >800 in order for a name to be assigned in the peak table. 1D GC-TOFMS chromatograms were processed using an expected peak width of 8 s and a signal-to-noise cutoff of 250; all other data processing criteria remained the same.
The Statistical Compare software feature in ChromaTOF® was used for peak alignment and Fisher ratio calculation. Triplicate samples of each ignitable liquid standard investigated (excluding the E1618 Test Mixture) were input into Statistical Compare and separated into 4 classes (i.e., gasoline, n = 15; kerosene, n = 12; mineral spirits, n = 12; and diesel fuel, n = 12). A signal-to-noise cutoff of 20 was used for peak researching (i.e., to search for peaks not found during the initial peak finding step). Analytes were retained after alignment if found in at least two of the samples within a class. A mass spectral match >600 was required for peaks to be identified as the same compound across chromatograms during alignment. If analytes did not meet this mass spectral match threshold, they were removed from the final compound list. To allow for retention time deviations between samples, the maximum retention time differences permitted in the 1D and 2D during alignment were 2 s (i.e., 1 modulation period) and 0 s, respectively. After alignment, a Fisher ratio (i.e., the ratio of between-class variance to within-class variance) was calculated for each analyte. A critical value (Fcrit) was computed in Microsoft Excel using the F-distribution based on the number of classes in the analysis, the degrees of freedom for each class and the significance level chosen (α = 0.05). Analytes with Fisher ratios above the critical value (Fcrit = 2.08) were exported as a *.csv file and imported into Microsoft Excel for the manual removal of chromatographic artefacts (e.g., column bleed).
Principal component analysis (PCA) was carried out using The Unscrambler® X (version 10.3.31813.89; CAMO Software, Oslo, Norway). Prior to PCA, data pre-processing steps performed in The Unscrambler® X included mean centering, variance scaling and unit vector normalization [11]. Following PCA, the dataset was verified to contain no outliers by means of the Hotelling’s T2 95% confidence limit.

3. Results and Discussion

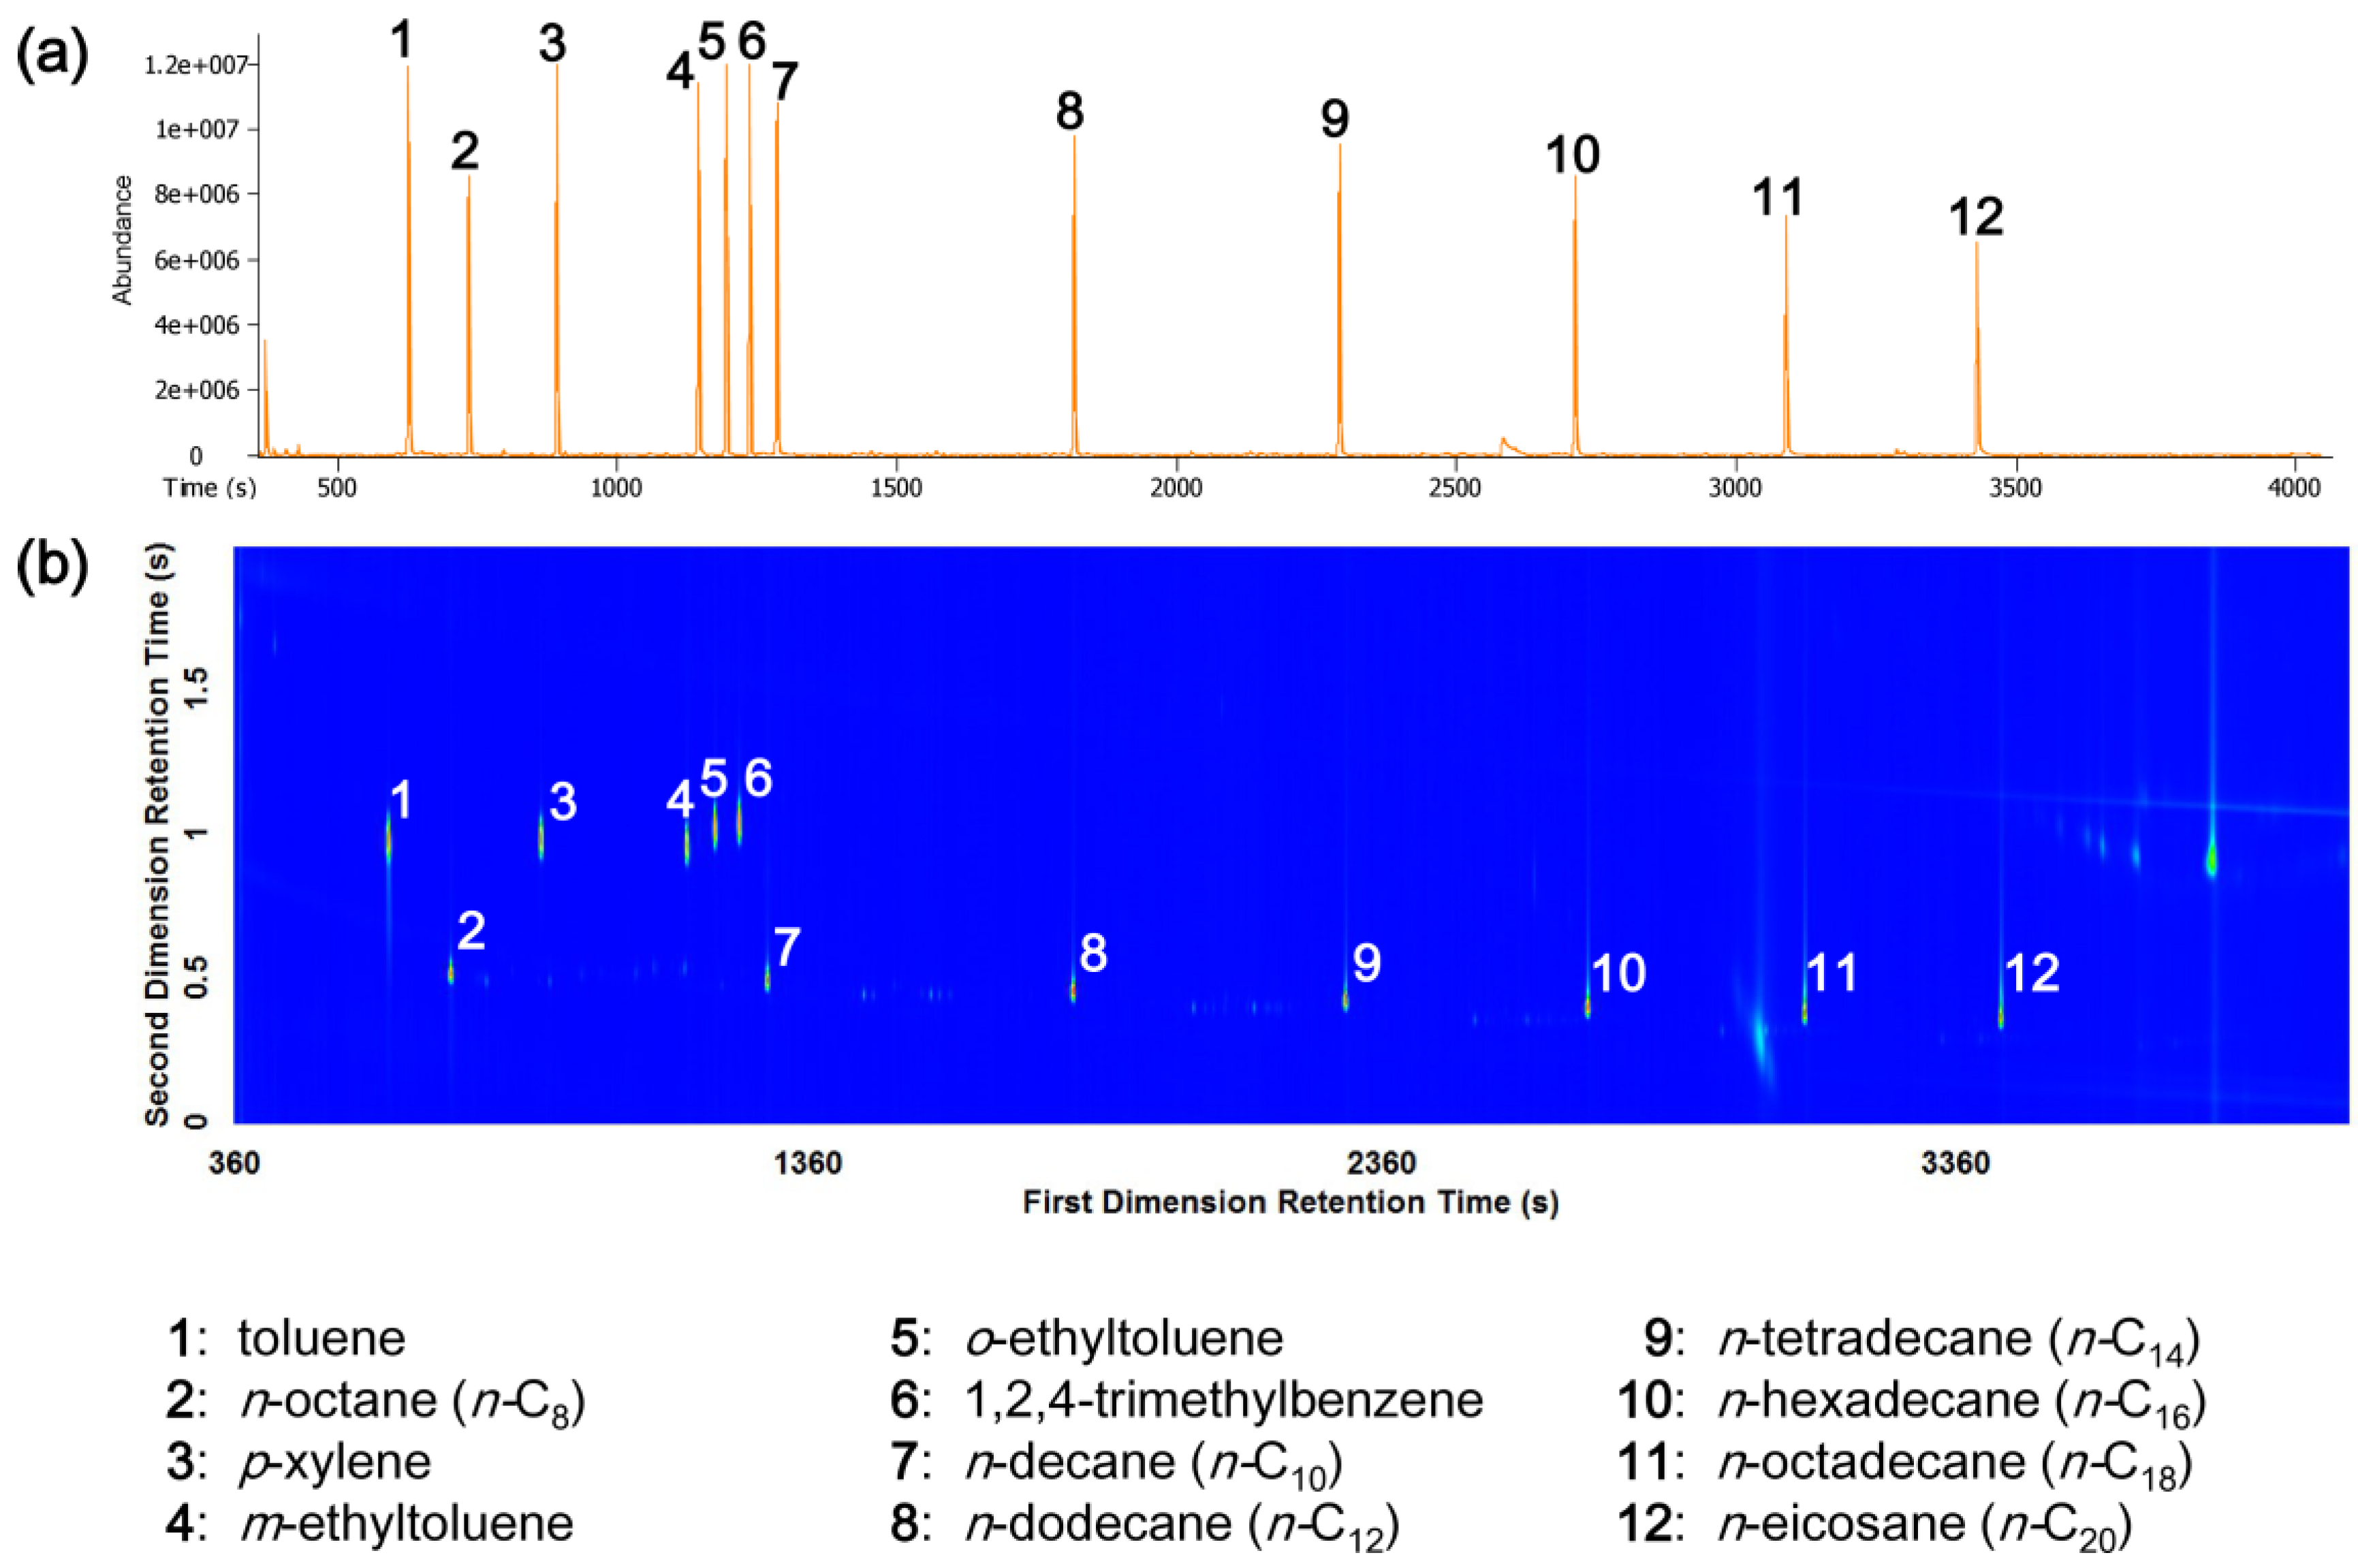
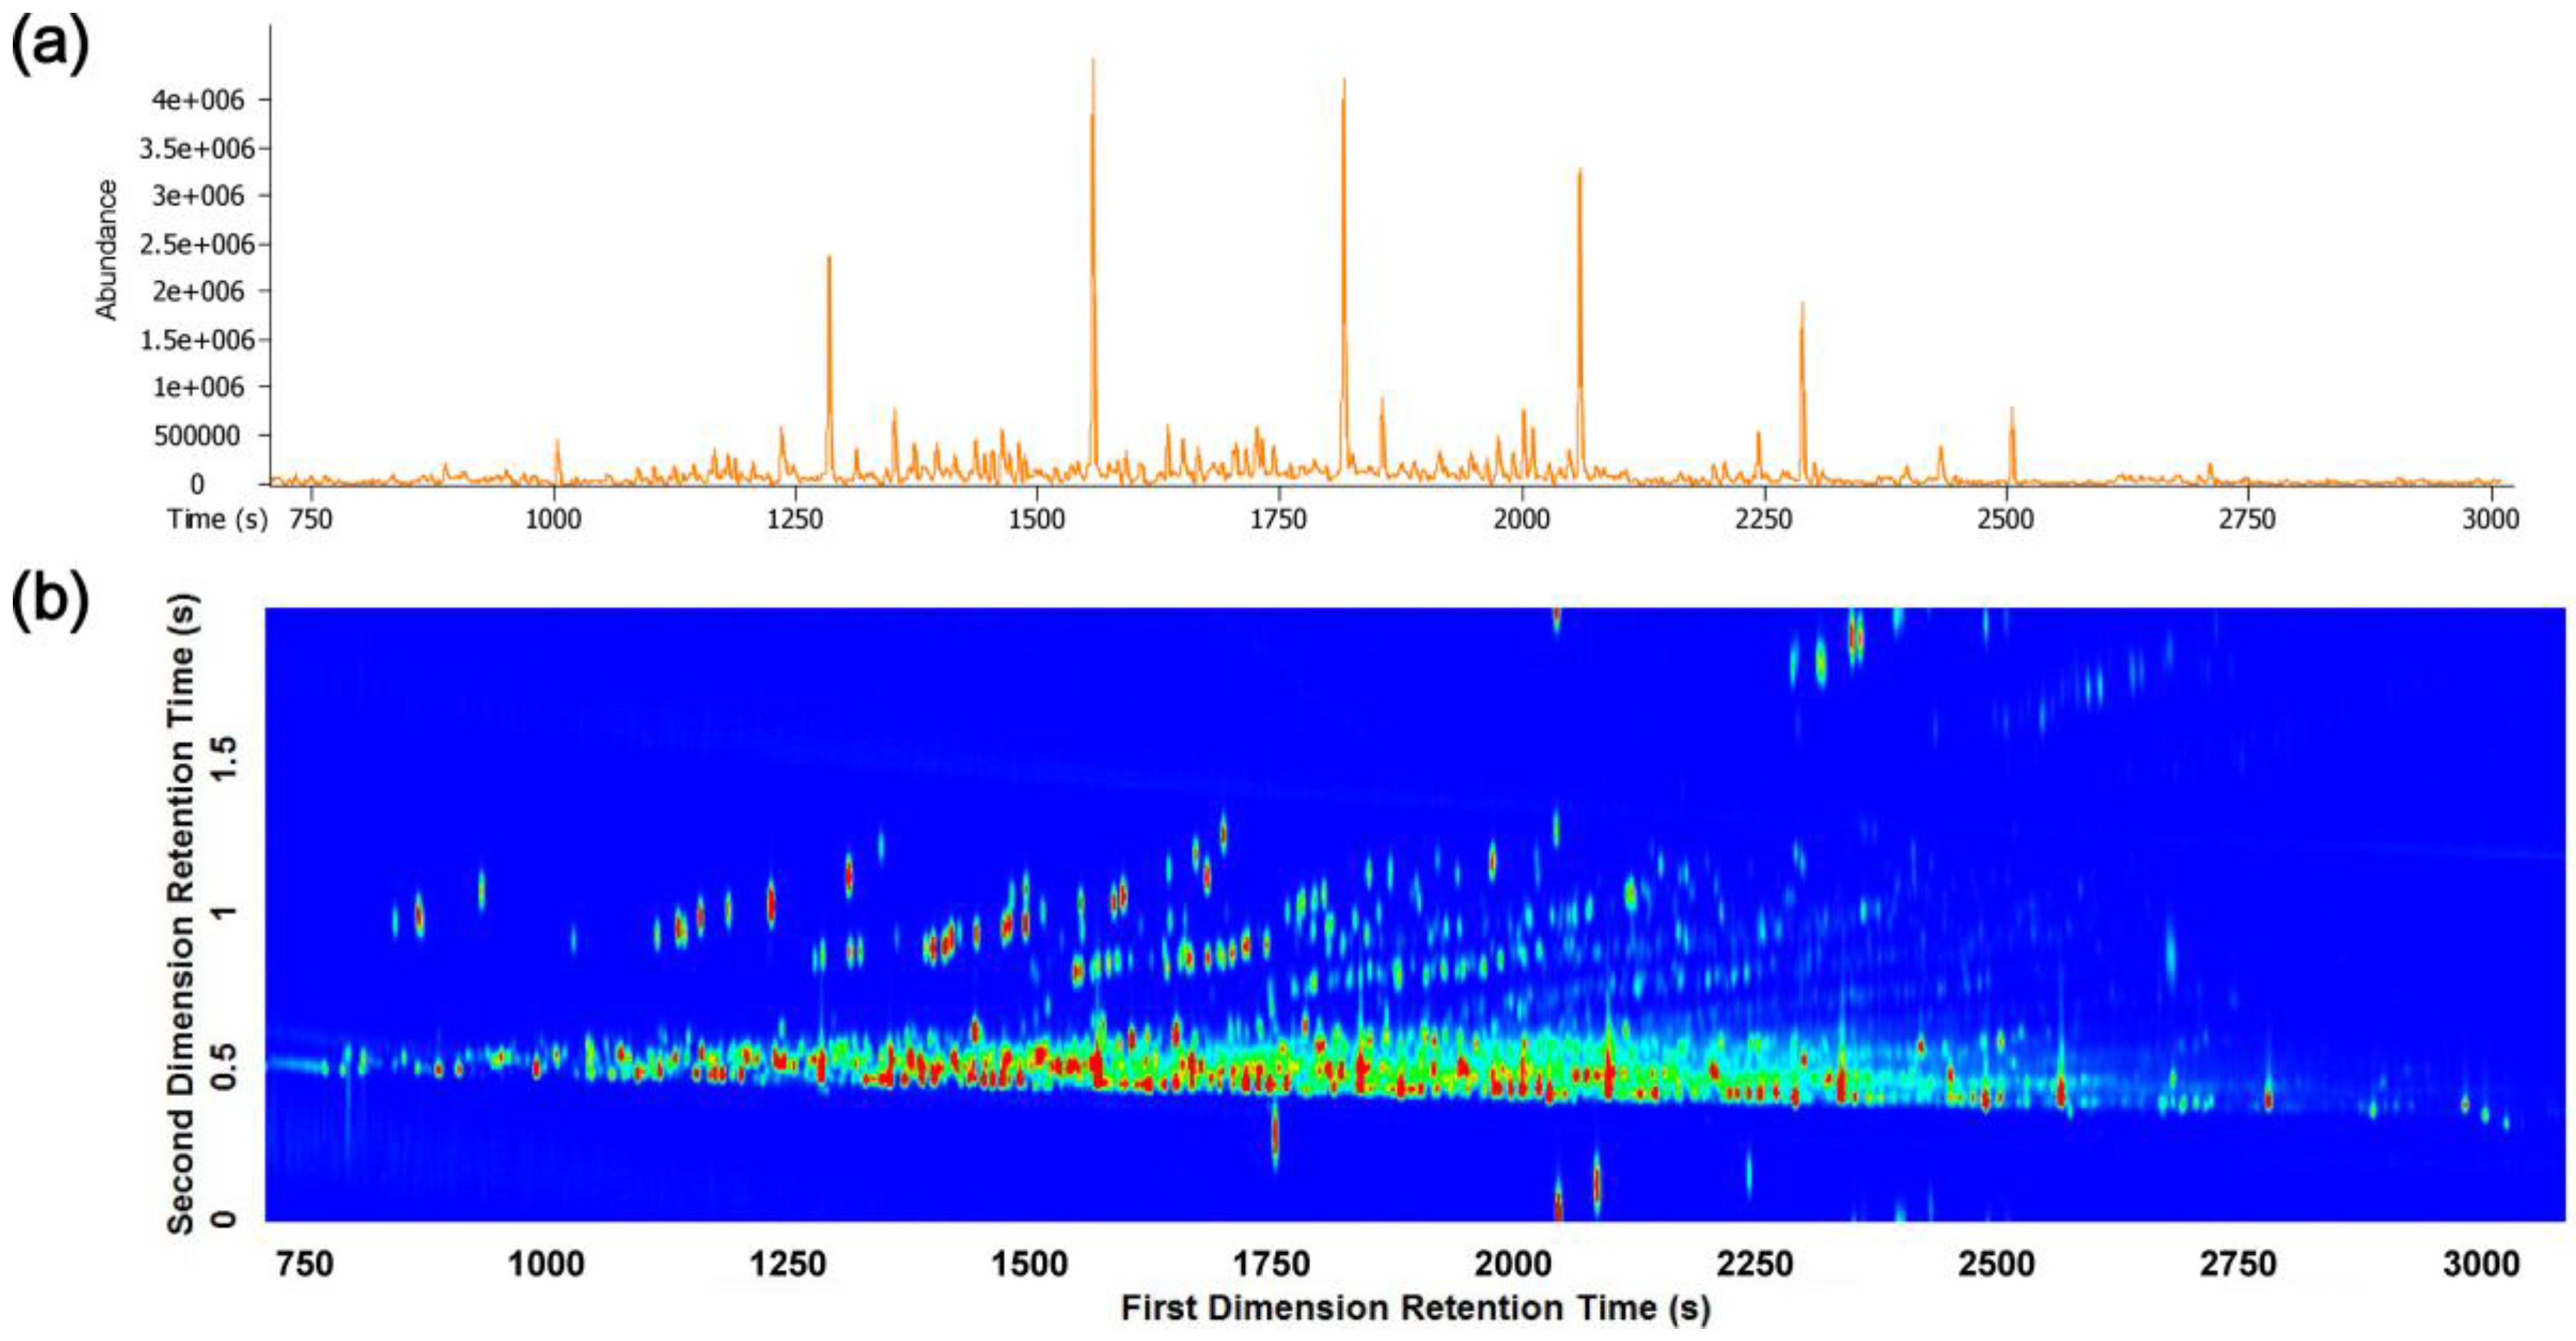
3.1. GC-TOFMS and GC×GC-TOFMS Analysis

Following experimental conditions proposed by Klee et al. [33], this study aimed to develop a GC×GC-TOFMS system optimized to achieve a near-theoretical maximum in peak capacity gain for the forensic analysis of ignitable liquids. The method presented also adheres to the guidelines provided by ASTM International in the “Standard Test Method for Ignitable Liquid Residues in Extracts from Fire Debris Samples by Gas Chromatography-Mass Spectrometry” (i.e., ASTM E1618-14) [8]. A nonpolar dimethyl polysiloxane capillary column (Rxi®-1ms) was used in the 1D for a separation of compounds based on boiling point. This stationary phase represents a typical column choice for the analysis of ignitable liquid residues in fire debris when using 1D GC-qMS [8]. A polar polyethylene glycol capillary column (Stabilwax®) was chosen for the 2D to provide additional selectivity and separation of compounds based on polarity.
In accordance with ASTM E1618-14 [8], a standard test mixture (E1618 Test Mixture, Restek Corporation) containing even-numbered normal alkanes ranging from n-hexane (n-C6) to n-eicosane (n-C20), o-ethyltoluene, m-ethyltoluene, toluene, 1,2,4-trimethylbenzene, and p-xylene was used to evaluate the instrumental conditions. All 13 compounds within the test mixture, with the exception of n-hexane which eluted during the solvent/acquisition delay, were adequately separated using the column configuration and temperature programming conditions presented herein (see Section 2.2 Instrumental Conditions) using both 1D GC-TOFMS and GC×GC-TOFMS (Figure 1). The retention times of the normal alkanes in the E1618 Test Mixture displayed in Figure 1 can be used to determine the carbon number range of a suspected ignitable liquid. The carbon number range can then be used to classify the suspected ignitable liquid as a light (i.e., C4–C9), medium (i.e., C8–C13) or heavy (i.e., C9–C20+) product according to the ignitable liquid classification scheme outlined in ASTM E1618-14 [8]. Based on the individual compounds identified in the suspected ignitable liquid (present at approximately the same relative concentrations as observed in samples of a reference ignitable liquid), the ignitable liquid can be further classified into one of eight classes: gasoline (all brands), petroleum distillates (including de-aromatized), isoparaffinic products, aromatic products, naphthenic-paraffinic products, normal-alkanes products, oxygenated solvents or others/miscellaneous (for those ignitable liquids that do not fall into one of the first seven major ignitable liquid classes) [8].
Using 1D GC-TOFMS, a total of 231 peaks were detected above the total ion current (TIC) signal-to-noise cutoff of 250 in the unweathered kerosene standard (Figure 2a). An order-of-magnitude increase in the number of peaks detected (i.e., an average of 2384 peaks above the TIC signal-to-noise cutoff of 250) was observed for the unweathered kerosene standard when using GC×GC-TOFMS (Figure 2b), demonstrating the increased peak detectability and lower limits of detection provided by GC×GC (i.e., a direct result of the zone compression occurring at the modulator [20]). A comparable order-of-magnitude increase in the number of peaks detected was observed for all standards at all stages of weathering investigated herein when using GC×GC-TOFMS compared to 1D GC-TOFMS. The increased peak detectability produced by GC×GC will be beneficial for the analysis of highly weathered ignitable liquids, where target compounds necessary for pattern recognition and definitive classification may be present at levels below the limit of detection (or limit of identification) of traditional 1D GC-qMS instrumentation.
Adopting the conditions recently recommended by Klee et al. [33], the GC×GC-TOFMS method developed herein for the analysis of ignitable liquids employed: (1) sharp reinjection pulses into the 2D column (i.e., ~28 ms at half height—estimated using unretained siloxane peaks); (2) a 60 m long 1D column; (3) identical inner diameter in the 1D and 2D columns (i.e., 0.25 mm i.d.); (4) a low retention factor at the end of the 2D analysis (i.e., maximum k ≈ 5—estimated using an unretained siloxane peak and naphthalene, a compound found to wrap around in the 2D); (5) an optimal flow rate in both columns (i.e., 2.0 mL/min [34]); (6) an optimal heating rate in both columns (i.e., 3.5 °C/min [35]); and (7) helium (rather than hydrogen) as the carrier gas. The peak capacity gain of a GC×GC system is defined as “the ratio of the system peak capacity to that of an optimized 1D GC analysis lasting the same time and providing at least the same detection limit” [33]. Applying the equations outlined by Klee et al. [33], the peak capacity gain achieved by the system was ~9.3, which is only ~17% below the system’s theoretical maximum of ~11.2. Together, the adopted conditions maximized peak capacity in both dimensions, achieving an overall near-theoretical maximum in peak capacity gain for the GC×GC system presented. Previously reported GC×GC systems developed for the forensic analysis of ignitable liquids [14,15] did not exploit the potential peak capacity gain capable of a GC×GC system, with theoretical maximums of only 5.4 and 7.4, respectively. Furthermore, it is unlikely that the true peak capacity gain achieved by either of these systems approached the theoretical maximum due to insufficiently sharp reinjection pulses into the 2D (e.g., ~90 ms at half height [14]) and the use of relatively short 1D columns (i.e., 4.75 m and 30 m, respectively).
GC×GC-TOFMS TIC contour plots for the unweathered and weathered gasoline, kerosene, mineral spirits and diesel fuel standards investigated are displayed in Figure 3, Figure 4, Figure 5 and Figure 6, respectively. Difficulties in chromatography observed early in the chromatograms (particularly for gasoline in Figure 3) are due to limitations of using splitless injection for extremely volatile compounds on columns with very thin stationary phases (such as that used herein), which are not built perfectly for the analysis of highly volatile compounds. Typically, the highly volatile compounds appearing at the beginning of the chromatogram will be lost due to weathering in the case of fire debris analysis, and this problem will likely not be present in the analysis of ignitable liquids recovered from real fire debris samples. So far, this appears to be true with the real fire debris samples analyzed from the authors’ preliminary burn experiments with gasoline using sorbent tubes for sample collection and thermal desorption for sample injection.
As previously mentioned, petroleum-based ignitable liquids are susceptible to weathering, including physical, chemical and biological degradation [10]. Evaporative weathering typically results in the loss of those compounds which are highly volatile in nature (i.e., compounds which exhibit low boiling points and high vapour pressures). The anticipated loss of volatile compounds as a result of evaporative weathering can be observed for several successive stages of weathering in the gasoline, kerosene and diesel fuel GC×GC-TOFMS TIC chromatograms displayed in Figure 3, Figure 4 and Figure 6, respectively. The resultant weathering pattern shows a continued loss of lower boiling point compounds with increased evaporation. However, visual examination of the GC×GC-TOFMS TIC chromatograms acquired for the mineral spirits samples (Figure 5) revealed an atypical weathering pattern. The 25% and 50% weathered mineral spirits samples (displayed in Figure 5b,c, respectively) were found to contain a higher abundance of lighter volatiles than the unweathered mineral spirits sample (Figure 5a). Upon discussion with the manufacturer, it was discovered that the weathered standards are not linked to each other or to the unweathered standards throughout their preparation, history and storage. That is, stock samples of a particular ignitable liquid are obtained as required, diluted and ampuled as an unweathered standard. The stock samples are then weathered by means of evaporation, diluted and ampuled to create several levels of weathered standards. Previous research has demonstrated that samples of gasoline obtained from different refineries and/or service stations may have slightly different profiles, allowing the samples to be distinguished from one another [36]. Therefore, it is possible that the unweathered and weathered mineral spirits standards analyzed herein did not originate from the same stock sample, and this could account for the atypical weathering patterns observed as a result of potentially differing profiles for the original stock standards used to prepare the subsequent weathered standards.
While much of the focus in GC×GC analyses has previously focused on the 2D separation, which in petroleum product analysis involves shifting aromatics and other compounds away from bulk aliphatics, it is just as important to achieve and maintain efficient 1D separations [37,38]. Preserving efficient separation in the 1D is critical for the separation and subsequent detection and identification of isomers (e.g., C3 and C4-alkylbenzenes), which could be significant for the chemical fingerprinting of ignitable liquids. This is because isomers that co-elute in the 1D are rarely separated in the 2D; regardless of the stationary phase selectivity chosen, the 2D column is simply too short. Overall, the chromatograms presented in Figure 3, Figure 4, Figure 5 and Figure 6 demonstrate the extraordinary separation efficiency generated and preserved in the first dimension, in addition to the optimal separation achieved in the second dimension, placing the aromatic analytes (bands of peaks near the middle-to-top of the contour plot) further away from the aliphatic compounds (line of peaks across the bottom of the contour plot). Any peaks that line up vertically in the contour plots presented in Figure 3, Figure 4, Figure 5 and Figure 6 represent analytes that would have co-eluted in traditional 1D GC using a dimethyl polysiloxane stationary phase. The column combination used herein (i.e., dimethyl polysiloxane × polyethylene glycol) provides the necessary selectivity for petroleum-based ignitable liquids ranging from gasoline and medium petroleum distillates (e.g., mineral spirits) to heavy petroleum distillates (e.g., kerosene and diesel fuel), allowing for full use of the 2D separation space when analyzing several successive stages of evaporation/weathering as demonstrated in Figure 3, Figure 4, Figure 5 and Figure 6.

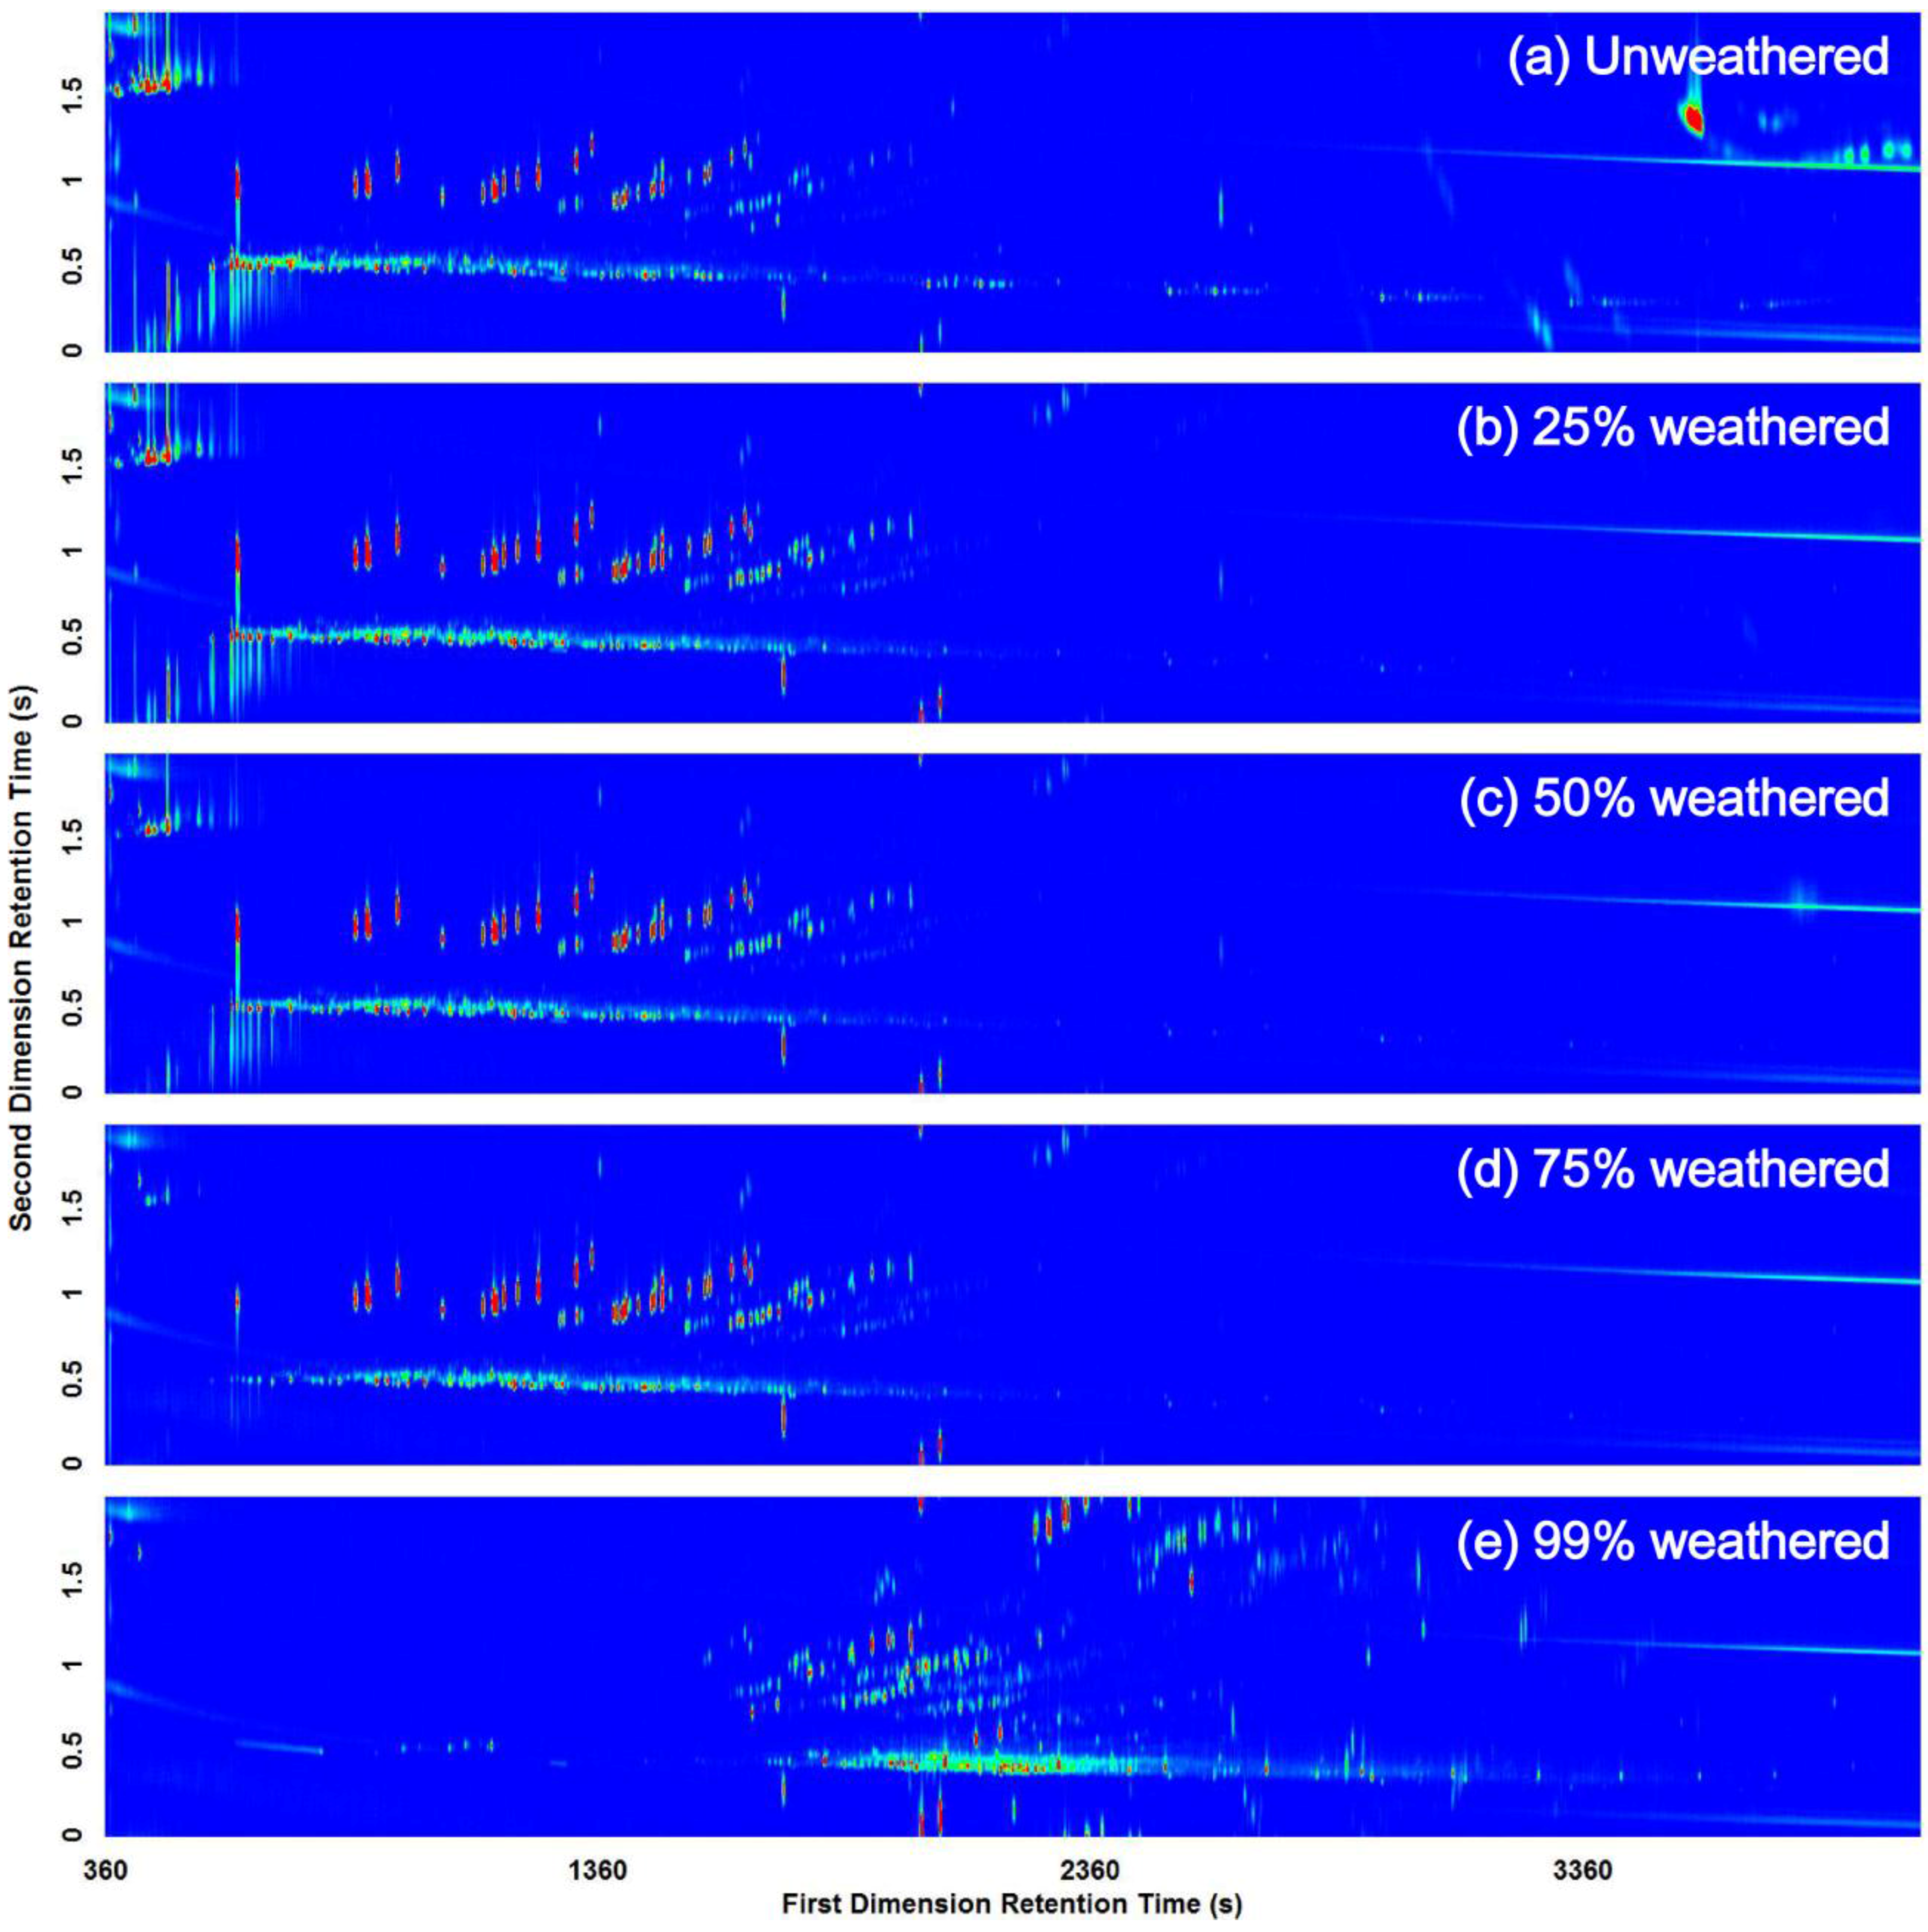
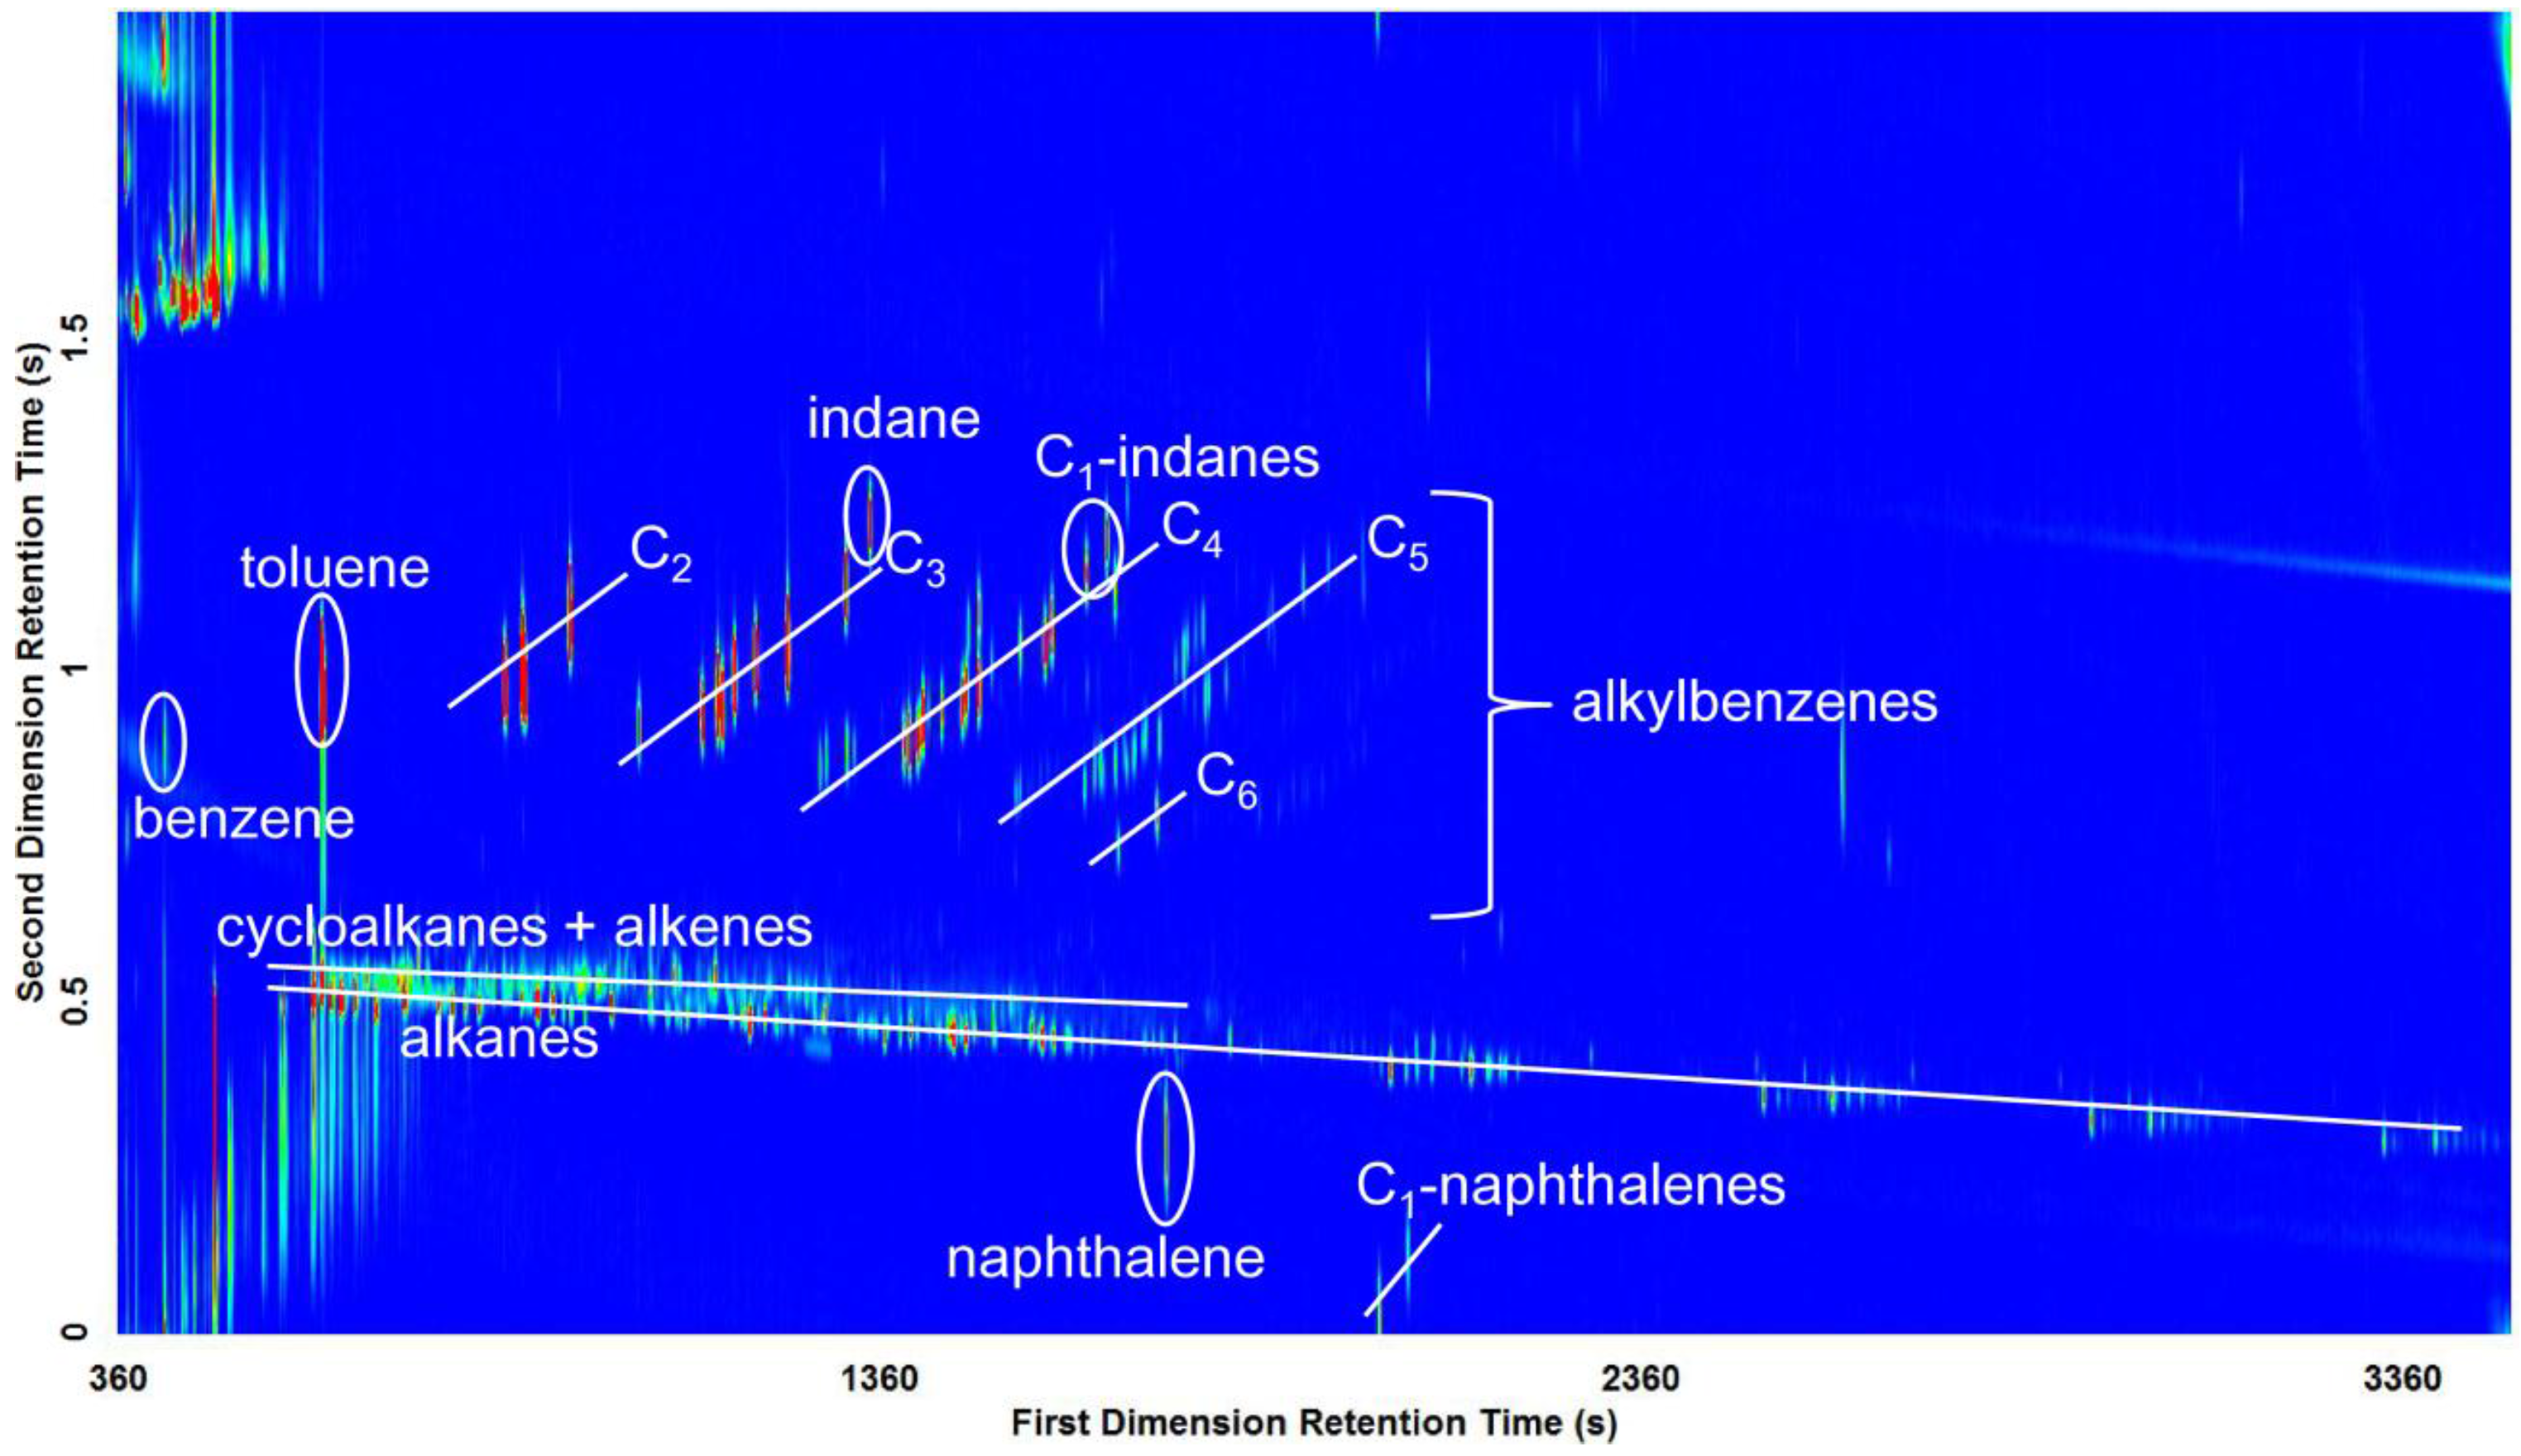
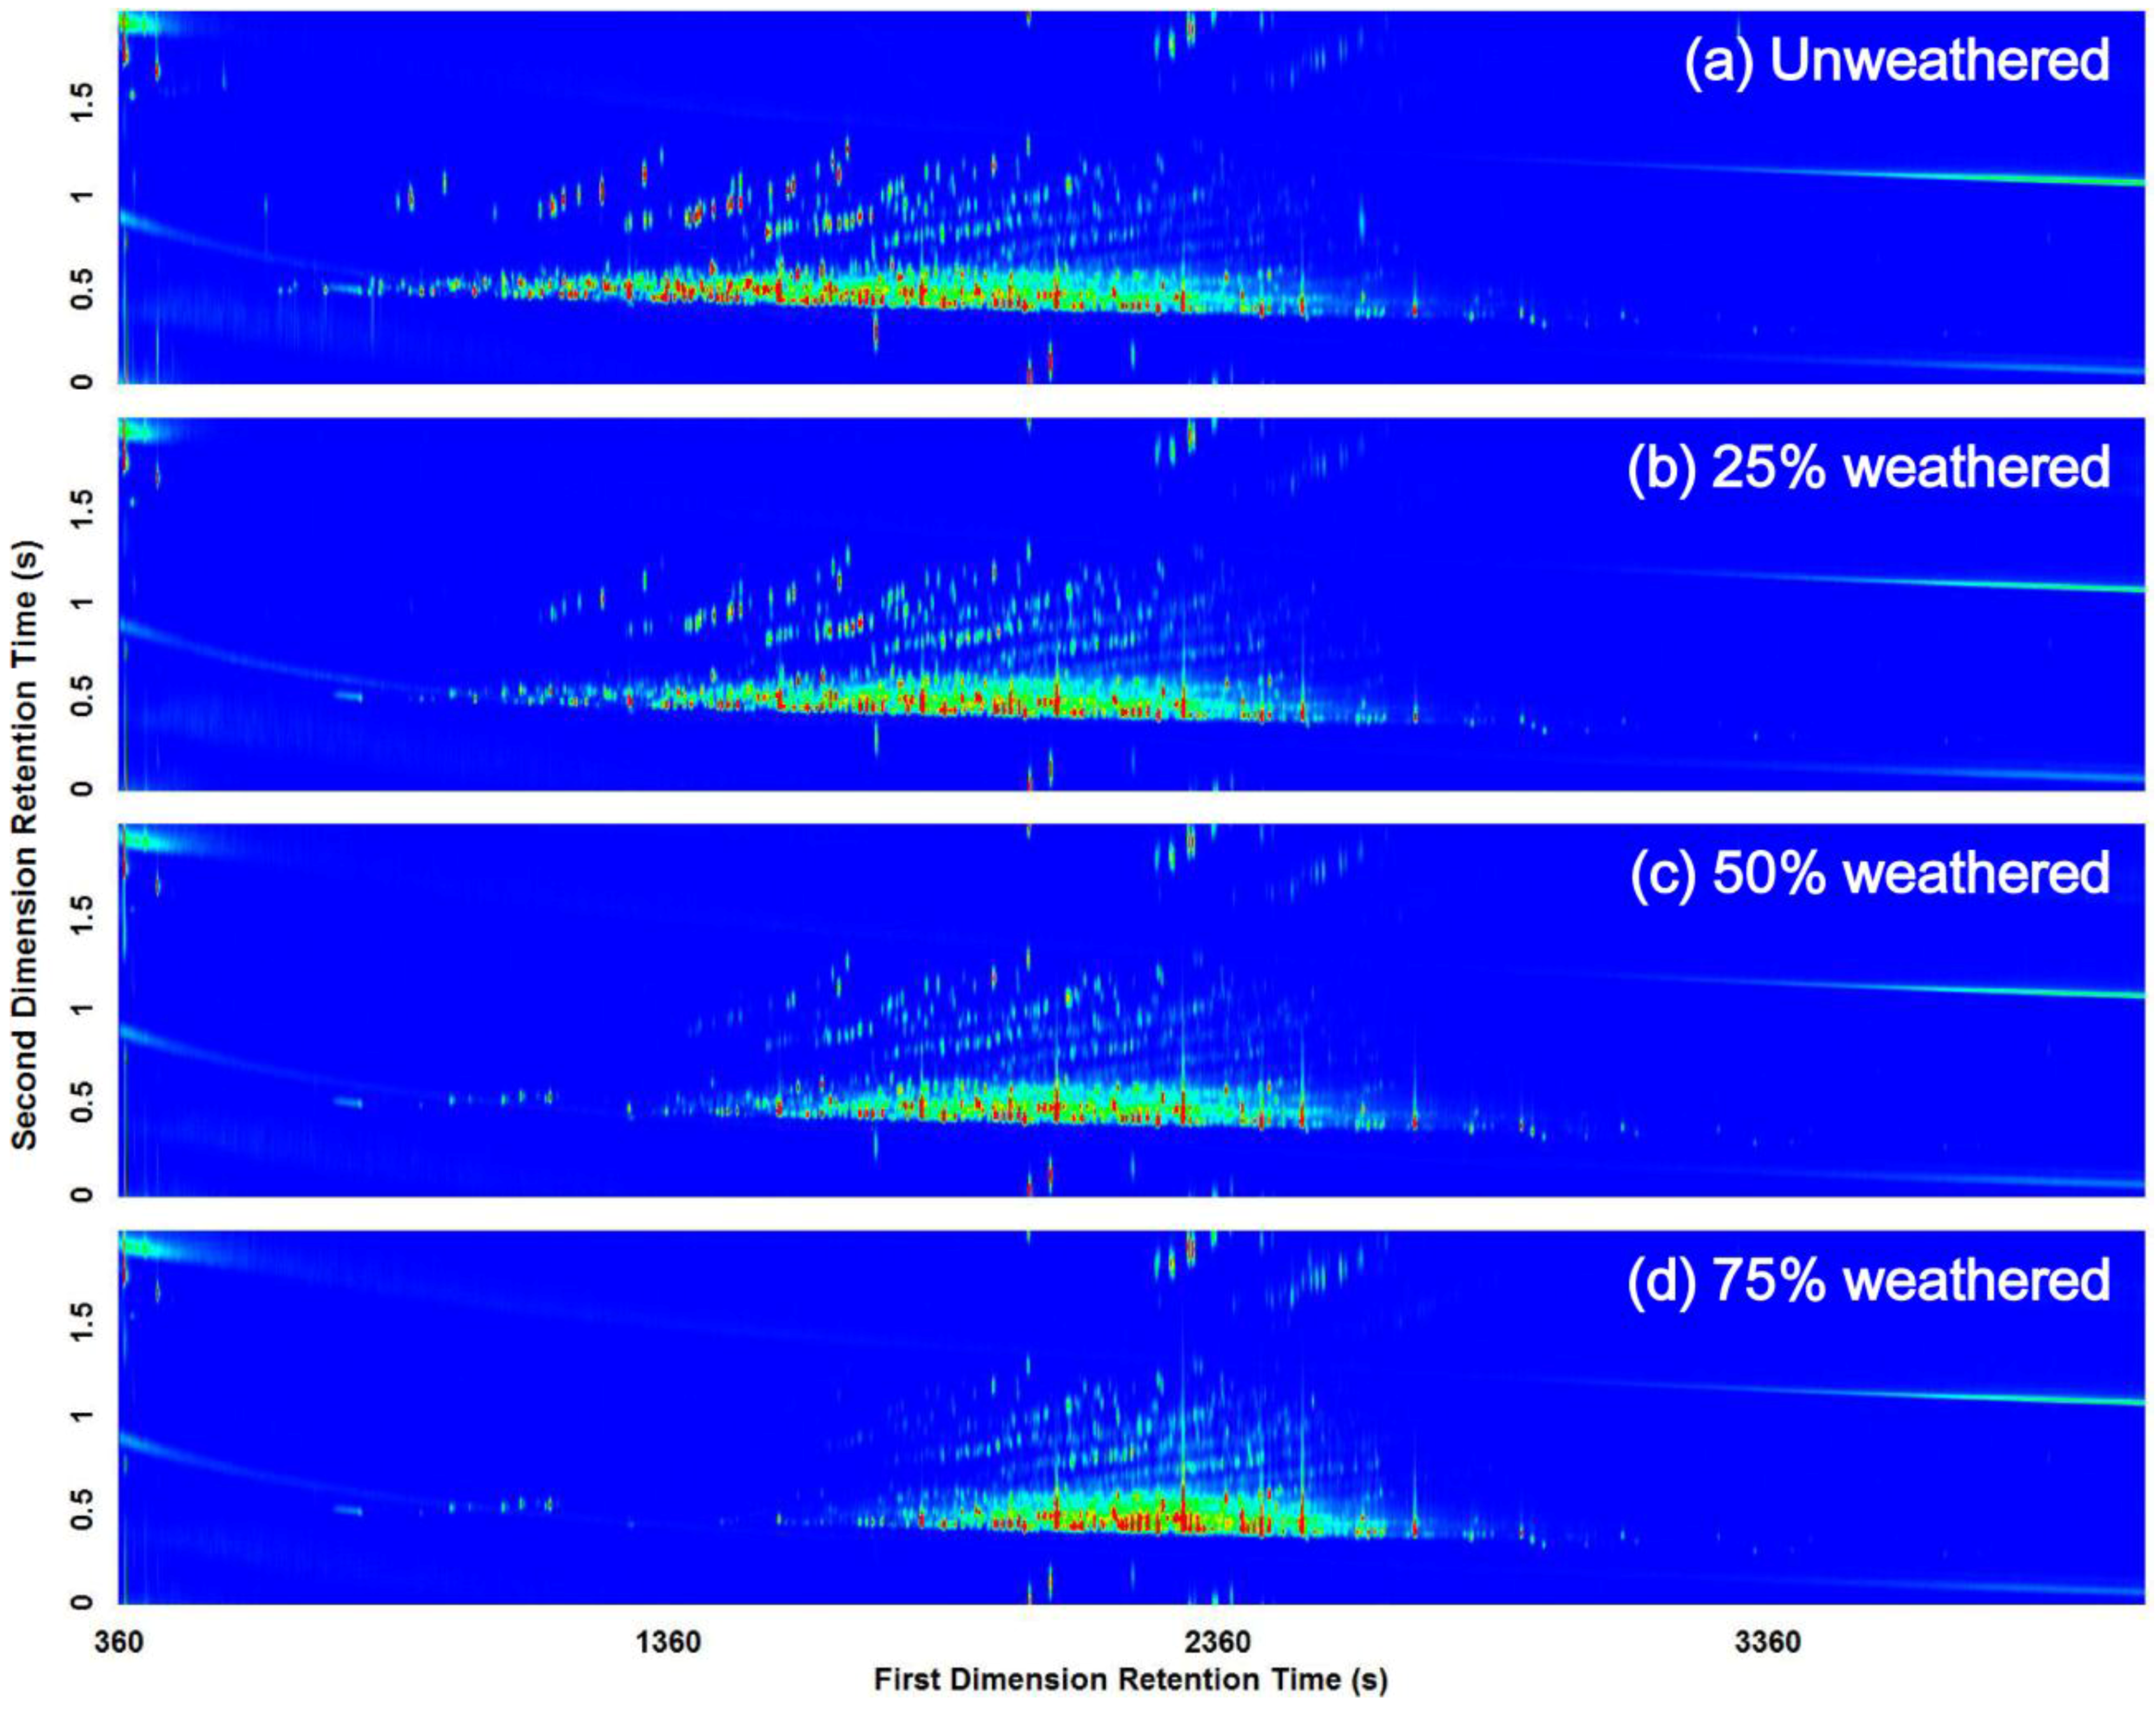
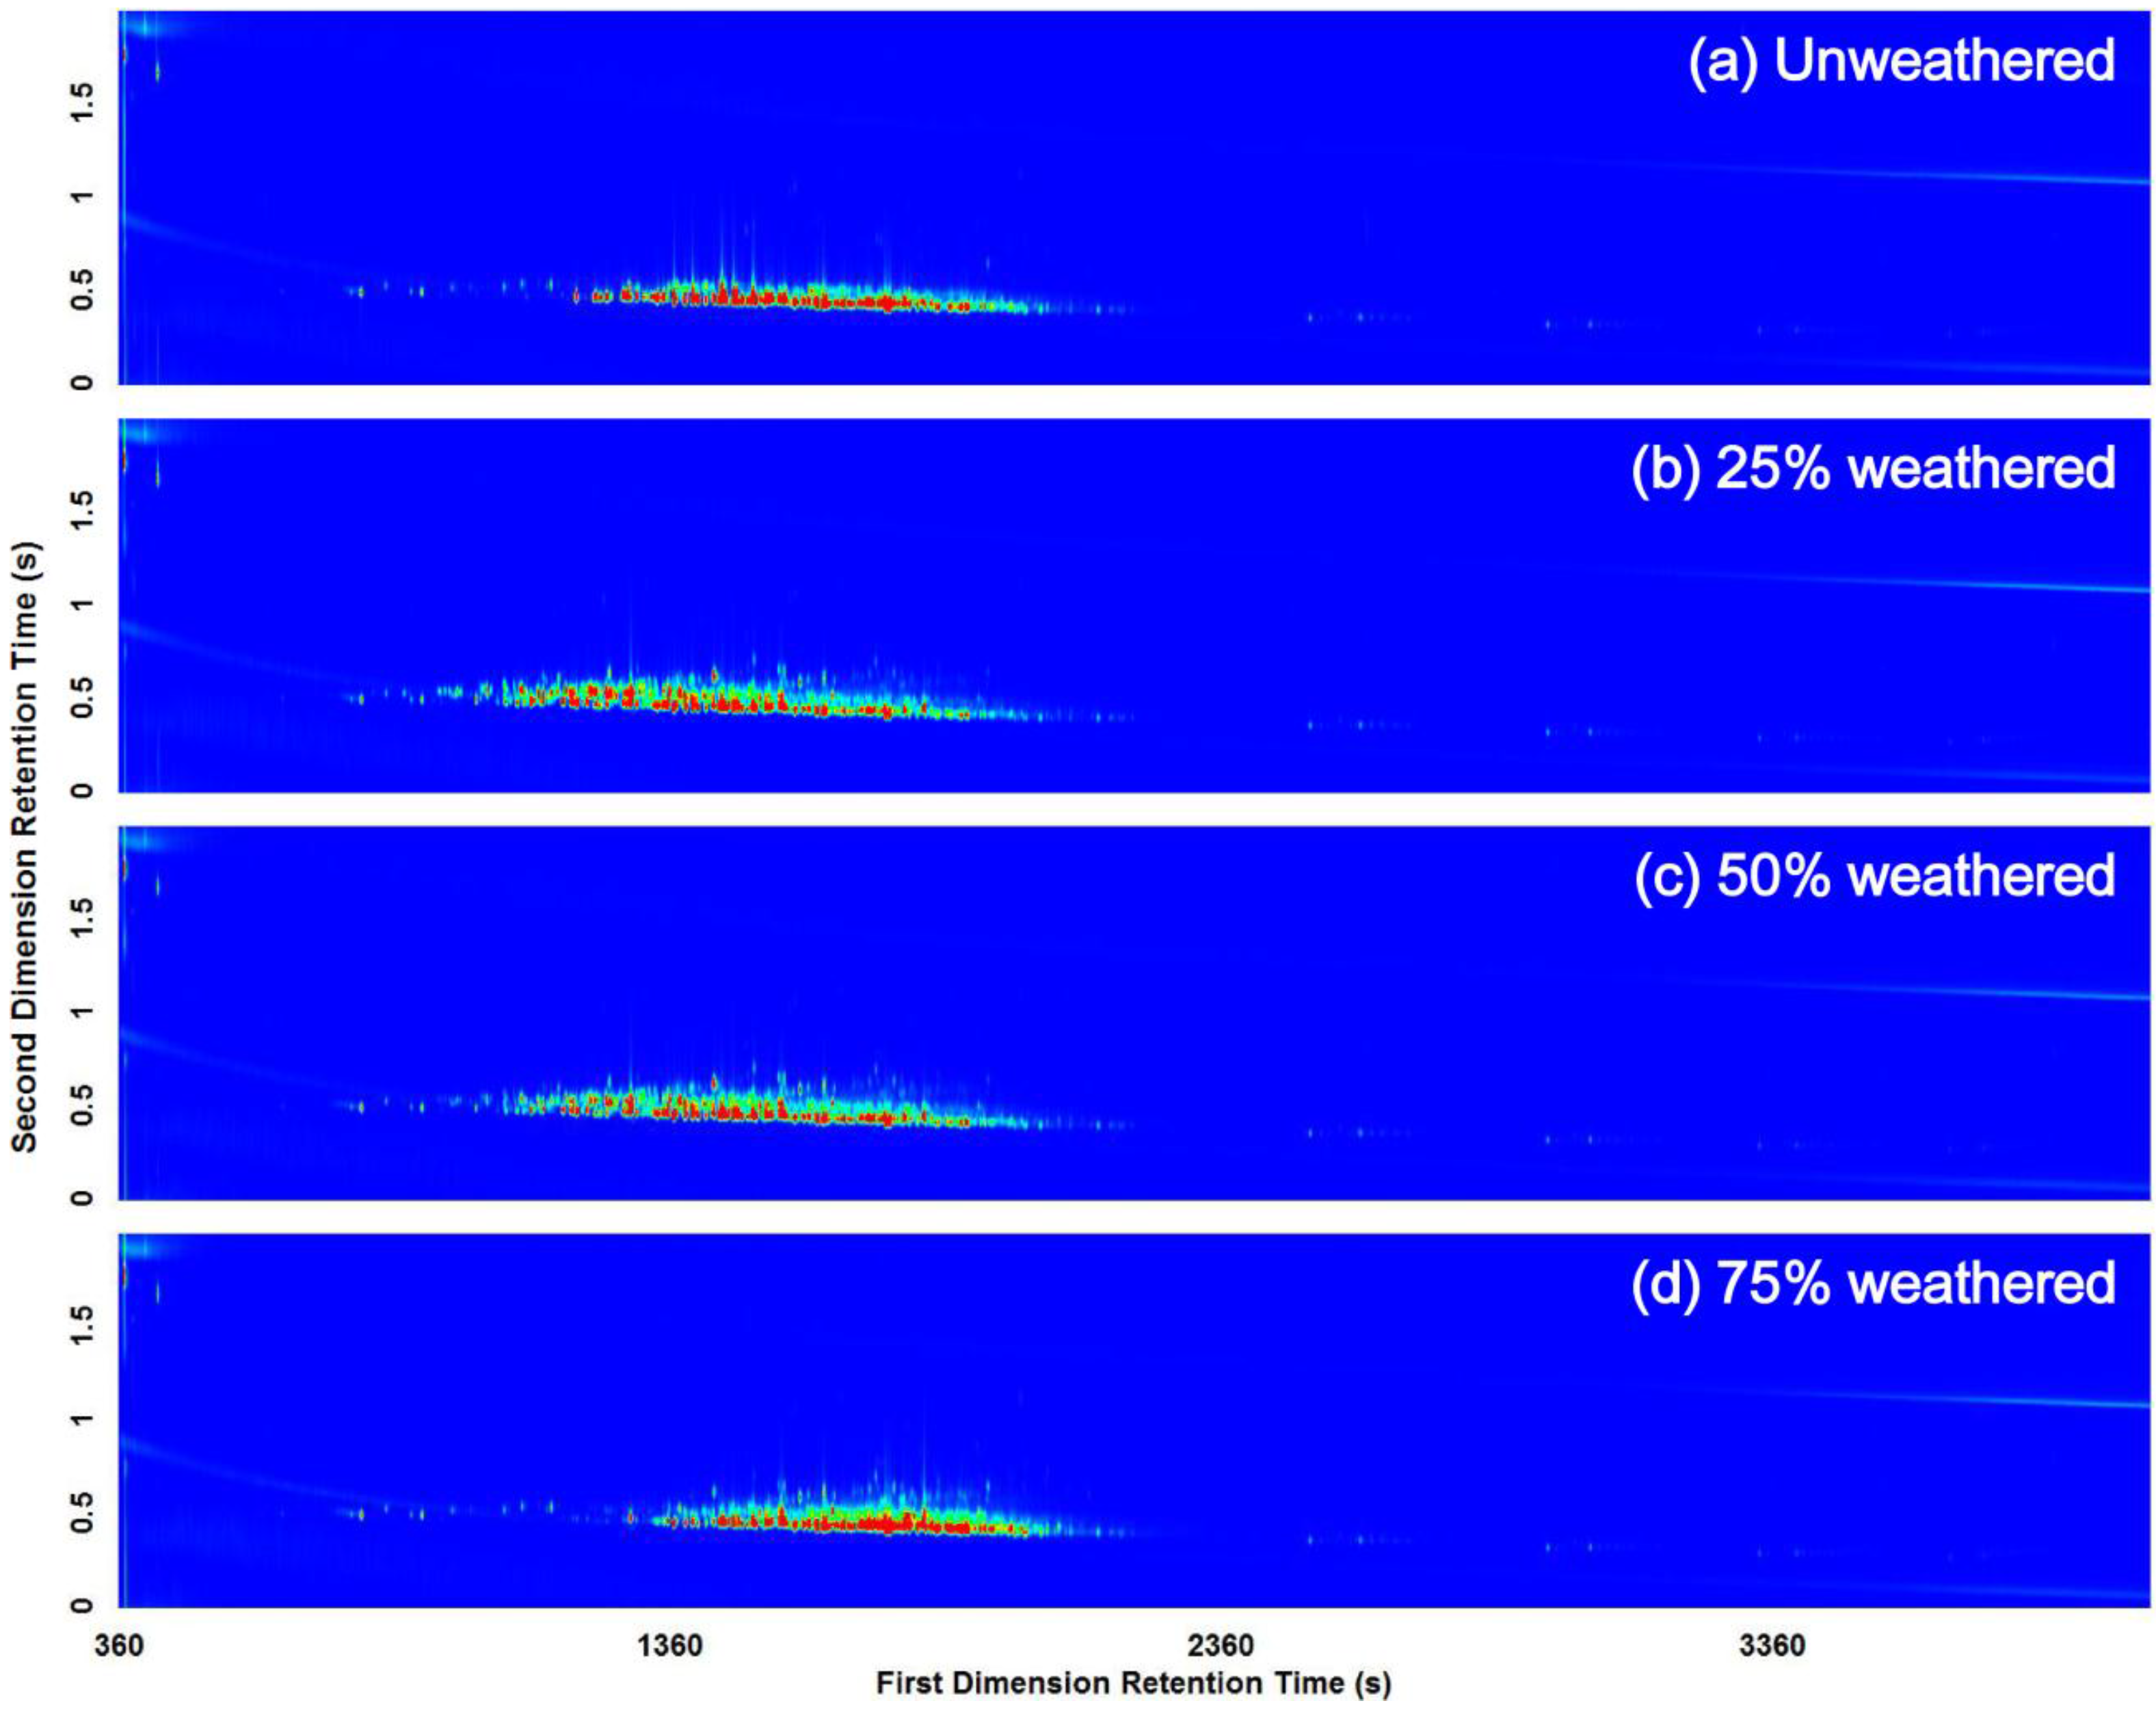
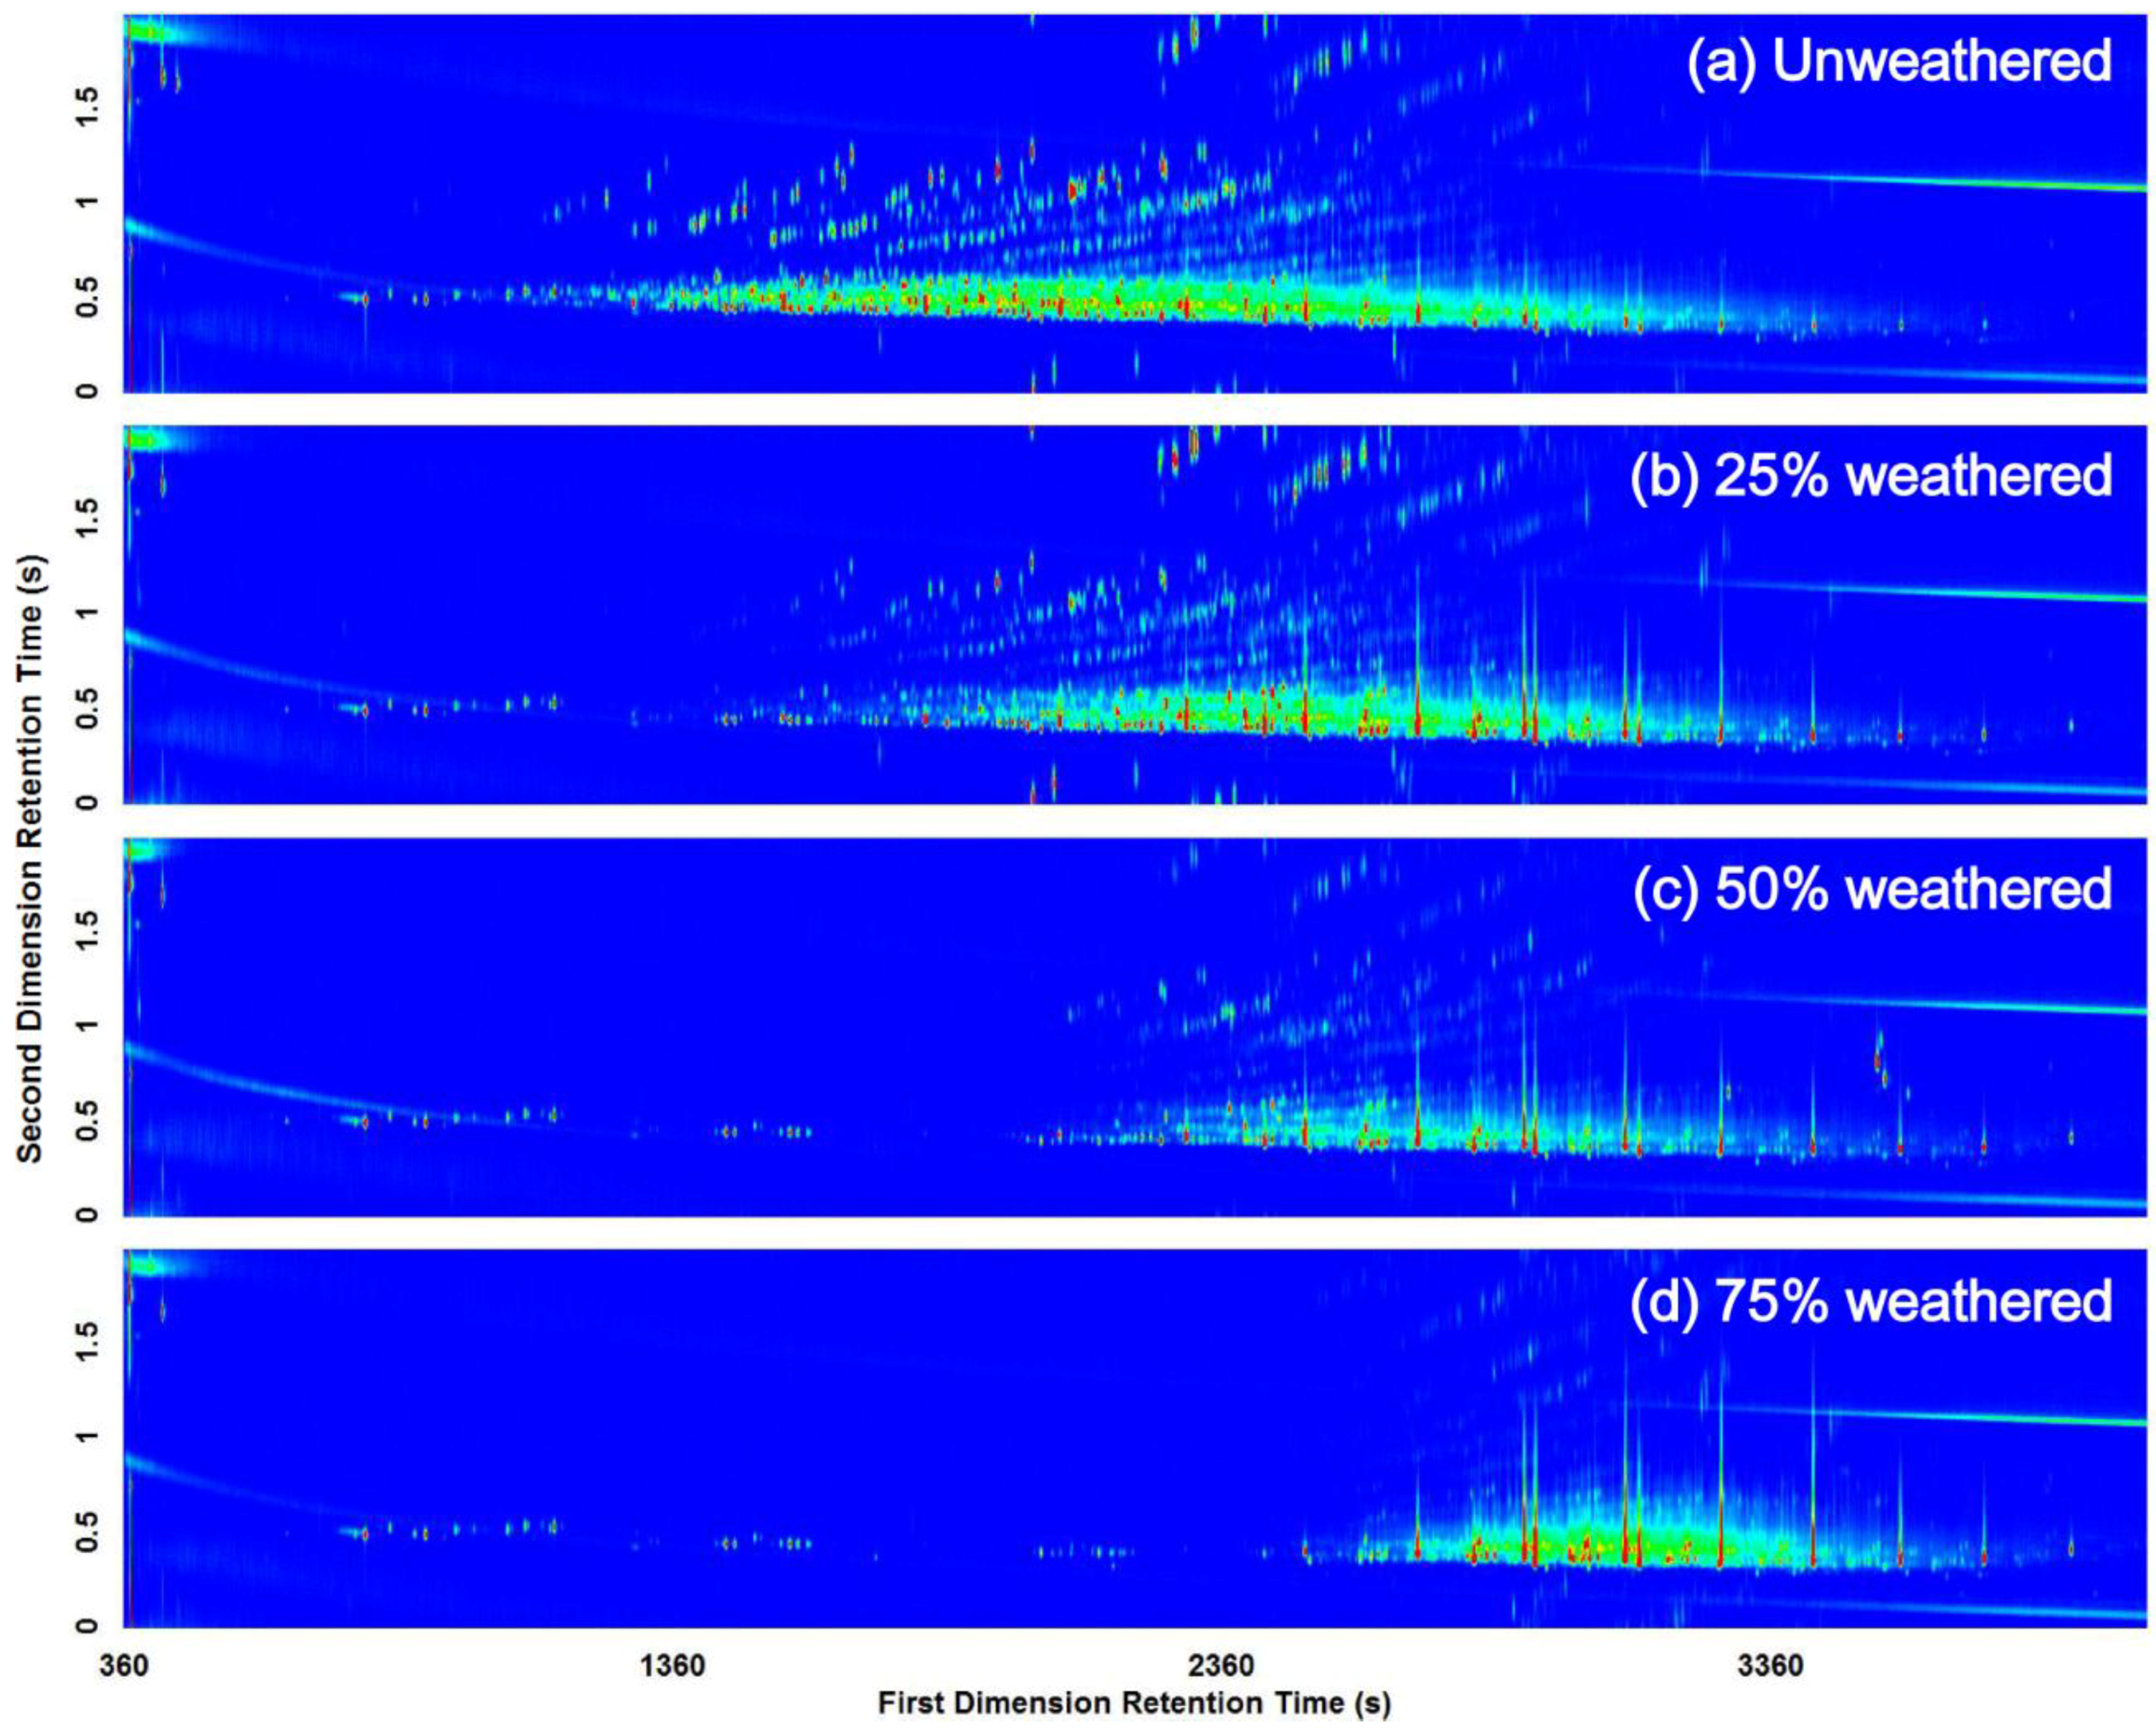
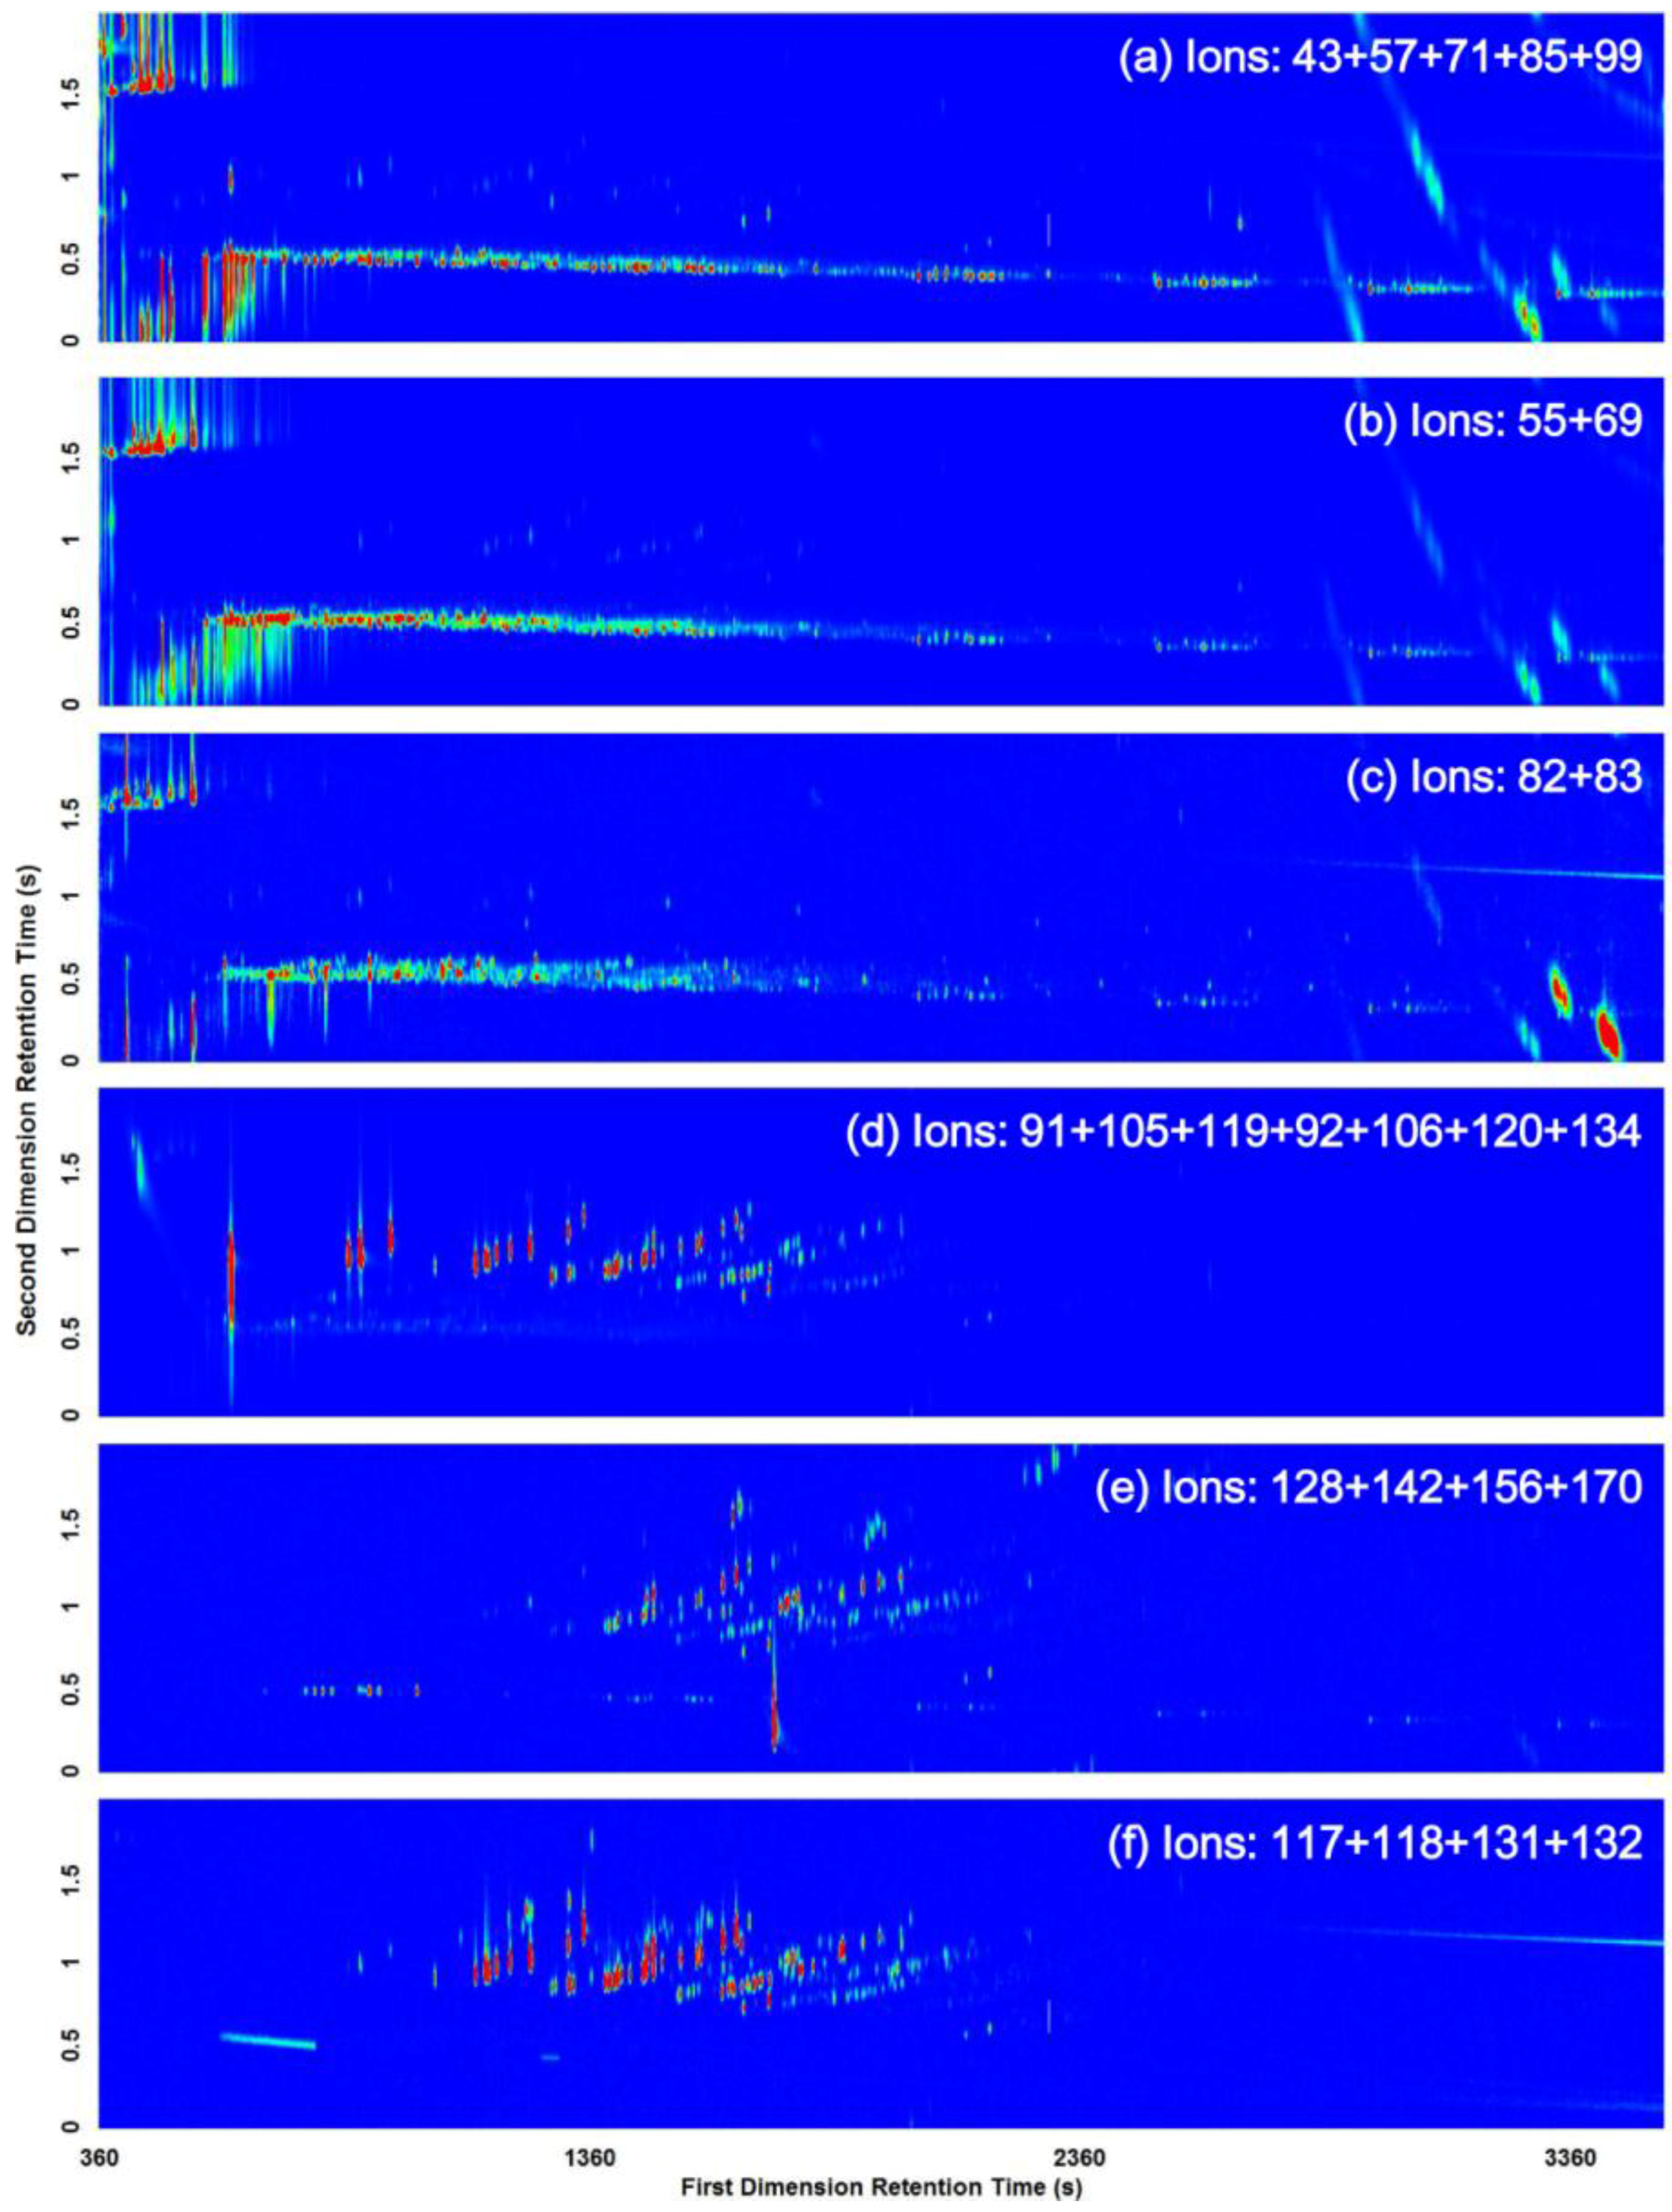
3.2. Visual Pattern Recognition

When interpreting chromatograms collected using 1D GC-qMS for the analysis of fire debris, it is standard practice for analysts to compare the questioned samples with reference ignitable liquids by visual pattern recognition [8]. Visual comparisons are typically made using TIC chromatograms. Additional data analysis may, however, be performed using extracted ion current (EIC) chromatograms which isolate and display the major ions characteristic of the most common chemical compound classes found in ignitable liquids (Table 1 [8]). By viewing the ions typical of each compound class individually, EIC chromatograms make it possible to reduce matrix interferences, aiding in pattern recognition. Similar to the EIC chromatograms generated using 1D GC-qMS, EIC chromatograms can be readily produced for data collected using GC×GC-TOFMS. According to ASTM E1618 [8], the criteria for the identification of gasoline includes the presence of alkanes, cycloalkanes, aromatics, alkylnaphthalenes and indanes. GC×GC-TOFMS EIC contour plots generated for these five chemical compound classes are displayed in Figure 7 for unweathered gasoline.
When visualizing the various EIC contour plots of unweathered gasoline (Figure 7), a pattern within the GC×GC-TOFMS contour plot begins to appear whereby structurally-related compounds (e.g., homologues or isomers) are found to elute with distinct patterns on the retention plane, resulting in an ordered chromatogram. Figure 8 displays the GC×GC-TOFMS TIC contour plot of unweathered gasoline with lines illustrating the ordered structure of the chromatogram created by the different compound classes detected within the sample. Similar chromatographic structure can also be recognized for the different compound classes present in the unweathered and weathered kerosene (Figure 4), mineral spirits (Figure 5) and diesel fuel (Figure 6) standards investigated. These ordered chromatograms produced by GC×GC are well-suited for the rapid classification of ignitable liquids [14], allowing patterns characteristic of common ignitable liquids to be more easily discerned using TIC chromatograms. Nevertheless, EIC contour plots can still be generated for GC×GC-TOFMS data in cases where background pyrolysis or combustion products arising from the debris matrix interfere with pattern recognition.

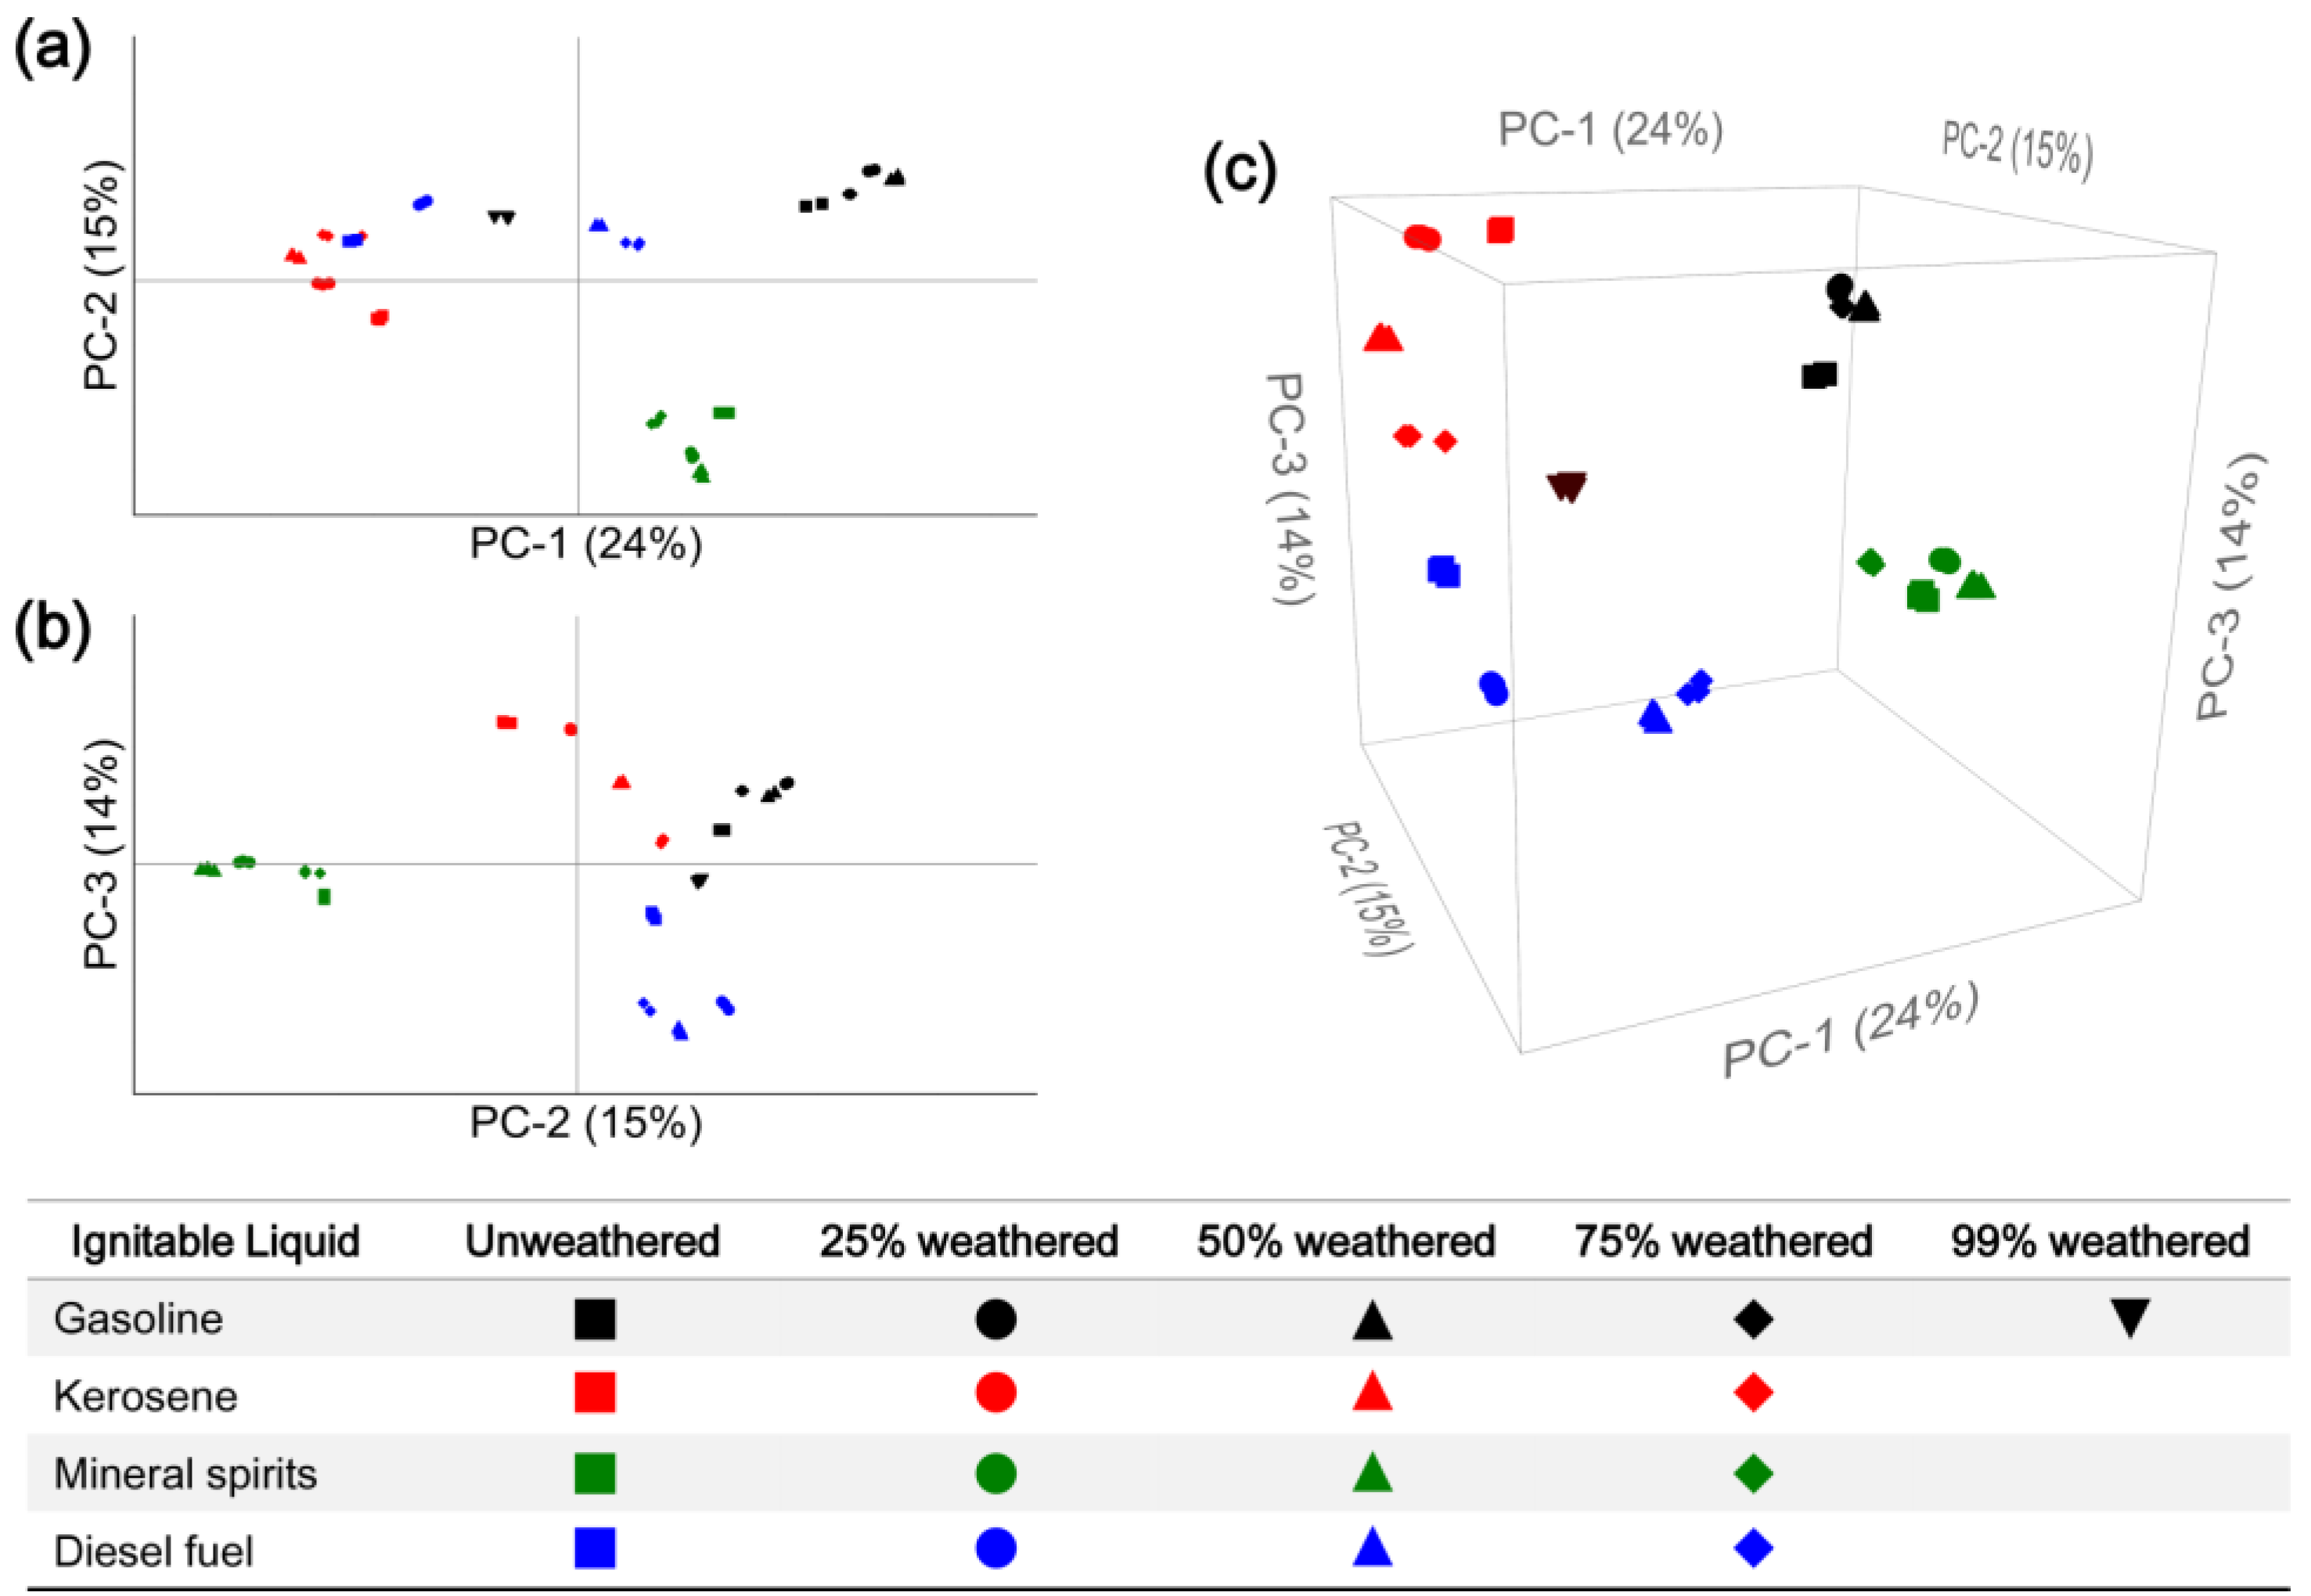
3.3. Computerized Pattern Recognition

Multivariate statistical techniques (e.g., principal component analysis) are typically performed to reduce the dimensionality of a dataset and to facilitate visualization of the multivariate structure of the data. The development and application of chemometric tools to assist in the interpretation of data collected from fire debris analysis has increased rapidly in recent years [10,13,25,26,39,40,41,42], driven significantly by the demand to simplify data interpretation and ultimately reduce the bottleneck associated with fire debris analysis. Computerized pattern recognition techniques are acceptable according to ASTM E1618 [8], provided that the results are verified visually by a human analyst. Here, PCA was performed to demonstrate the potential of multivariate statistical techniques for the future development of chemometric models capable of rapid, objective and automated classification of ignitable liquids detected in fire debris extracts. The Statistical Compare software feature (built directly into the ChromaTOF interface) was utilized for chromatographic alignment and the calculation of Fisher ratios. Fisher ratio filtering [43,44,45,46,47,48] (see Section 2.3 Data Processing) was performed to identify class distinguishing compounds for use in PCA.
Figure 9 displays the PCA scores plots generated using the pre-processed GC×GC-TOFMS peak area data for all analytes detected above Fcrit in the unweathered and weathered gasoline, kerosene, mineral spirits and diesel fuel standards investigated. The mineral spirits standards (containing mostly bulk aliphatics and cycloalkanes; Figure 5) were found to be the most distinct class of ignitable liquids investigated. Discrimination between the mineral spirits standards and the gasoline, kerosene and diesel fuel standards was observed along the second principal component axis (PC-2), which accounted for 15% of the variation within the dataset. Discrimination among the gasoline, kerosene, and diesel fuel standards was observed along the first and third principal component axes (PC-1 and PC-3, respectively), accounting for 24% and 14% of the variation in the dataset, respectively. Overall, all four ignitable liquids investigated could be differentiated using the first three principal components.
Future work will focus on the analysis of real fire debris samples with and without the addition of ignitable liquids. The ignitable liquid standards analyzed herein can be spiked onto real or simulated fire debris samples in the laboratory and used as potential training, optimization and validation set samples (i.e., known reference ignitable liquids with several successive stages of weathering) in the future development and evaluation of chemometric models for the classification of ignitable liquids in fire debris analysis. The development and use of such models would reduce analyst bias and provide a more objective interpretation of the results, a direction that is becoming increasingly important in the forensic science community. These methods also grant the analyst(s) the opportunity to apply classification models that could be used to calculate statistical probabilities for reporting in court cases.

4. Conclusions

The objective of this study, to develop a GC×GC-TOFMS system optimized to produce a near-theoretical maximum in peak capacity gain for the forensic analysis of ignitable liquids, was achieved. The presented system generated and preserved efficient separation in the first dimension with optimal stationary phase selectivity in the second dimension, providing improved resolution, enhanced sensitivity, increased peak detectability and an overall peak capacity gain of 9.3 (only ~17% below the system’s theoretical maximum of ~11.2). The system also generated ordered chromatograms, displaying distinct patterns of structurally-related compounds, well-suited for the rapid classification of ignitable liquids. The standards analyzed in this work can be used as known reference ignitable liquids (with several successive stages of evaporative weathering) for comparison with future fire debris samples to aid in sample interpretation. These reference ignitable liquids can also be used to verify the consistent performance of the chromatographic system. Future work will be directed at applying this system to the analysis of real fire debris samples, specifically involving burnt remains, including the evaluation of chemometric models for the rapid, objective and automated classification of ignitable liquids in fire debris extracts.

Acknowledgments

The authors wish to thank the University of Technology Sydney laboratory technical staff, Verena Taudte and Ronald Shimmon, for their ongoing support.

Author Contributions

Katie D. Nizio, Jack W. Cochran and Shari L. Forbes conceived and designed the experiments; Katie D. Nizio performed the experiments; Katie D. Nizio and Jack W. Cochran analyzed the data; Jack W. Cochran and Shari L. Forbes contributed reagents/materials/analysis tools; Katie D. Nizio wrote the paper; and Katie D. Nizio, Jack W. Cochran and Shari L. Forbes contributed to revisions of the paper.

Conflicts of Interest

The authors declare no conflict of interest.

Abbreviations

The following abbreviations are used in this manuscript:
1DFirst dimension
1DOne-dimensional
2DSecond dimension
2DTwo-dimensional
3DThree-dimensional
ASTMAmerican Society of Testing and Materials
dfFilm thickness
EICExtracted ion current
FcritCritical value
GC×GCComprehensive two-dimensional gas chromatography
GC-qMSGas chromatography–quadrupole mass spectrometry
GC-TOFMSGas chromatography–time-of-flight mass spectrometry
i.d.Inner diameter
kRetention factor
NISTNational Institute of Standards and Technology
NSWNew South Wales
PC-1First principal component
PC-2Second principal component
PC-3Third principal component
PCAPrincipal component analysis
PFTBAPerfluorotributylamine
SPMESolid phase microextraction
TICTotal ion current
TOFMSTime-of-flight mass spectrometry

References

  1. Drabsch, T. Arson, NSW Parliamentary Library, Briefing Paper No 2/03. Available online: http://www.parliament.nsw.gov.au/prod/parlment/publications.nsf/0/CA9A4BBDED3D32B3CA256ECF00071B74/$File/02-03.pdf (accessed on 21 April 2016).
  2. Hine, G.A. Fire scene investigation: An introduction for chemists. In Analysis and Interpretation of Fire Scene Evidence; Almirall, J.R., Furton, K.G., Eds.; CRC Press LLC: Boca Raton, FL, USA, 2004; pp. 35–70. [Google Scholar]
  3. ASTM E1386-15. Standard Practice for Separation of Ignitable Liquid Residues from Fire Debris Samples by Solvent Extraction. In Annual Book of ASTM Standards; ASTM International: West Conshohocken, PA, USA, 2015.
  4. ASTM E1388-12. Standard Practice for Sampling of Headspace Vapors from Fire Debris Samples. In Annual Book of ASTM Standards; ASTM International: West Conshohocken, PA, USA, 2012.
  5. ASTM E1413-13. Standard Practice for Separation of Ignitable Liquid Residues from Fire Debris Samples by Dynamic Headspace Concentration. In Annual Book of ASTM Standards; ASTM International: West Conshohocken, PA, USA, 2013.
  6. ASTM E1412-16. Standard Practice for Separation of Ignitable Liquid Residues from Fire Debris Samples by Passive Headspace Concentration With Activated Charcoal. In Annual Book of ASTM Standards; ASTM International: West Conshohocken, PA, USA, 2016.
  7. ASTM E2154-15a. Standard Practice for Separation and Concentration of Ignitable Liquid Residues from Fire Debris Samples by Passive Headspace Concentration with Solid Phase Microextraction (SPME). In Annual Book of ASTM Standards; ASTM International: West Conshohocken, PA, USA, 2015.
  8. ASTM E1618-14. Standard Test Method for Ignitable Liquid Residues in Extracts from Fire Debris Samples by Gas Chromatography-Mass Spectrometry. In Annual Book of ASTM Standards; ASTM International: West Conshohocken, PA, USA, 2014.
  9. Sandercock, P.M.L.; Du Pasquier, E. Chemical fingerprinting of gasoline. 2. Comparison of unevaporated and evaporated automotive gasoline samples. Forensic Sci. Int. 2004, 140, 43–59. [Google Scholar] [CrossRef] [PubMed]
  10. Zorzetti, B.M.; Shaver, J.M.; Harynuk, J.J. Estimation of the age of a weathered mixture of volatile organic compounds. Anal. Chim. Acta 2011, 694, 31–37. [Google Scholar] [CrossRef] [PubMed]
  11. Turner, D.A.; Goodpaster, J.V. The effects of microbial degradation on ignitable liquids. Anal. Bioanal. Chem. 2009, 394, 363–371. [Google Scholar] [CrossRef] [PubMed]
  12. Almirall, J.R.; Furton, K.G. Characterization of background and pyrolysis products that may interfere with the forensic analysis of fire debris. J. Anal. Appl. Pyrolysis 2004, 71, 51–67. [Google Scholar] [CrossRef]
  13. Sinkov, N.A.; Sandercock, P.M.L.; Harynuk, J.J. Chemometric classification of casework arson samples based on gasoline content. Forensic Sci. Int. 2014, 235, 24–31. [Google Scholar] [CrossRef] [PubMed]
  14. Frysinger, G.S.; Gaines, R.B. Forensic analysis of ignitable liquids in fire debris by comprehensive two-dimensional gas chromatography. J. Forensic Sci. 2002, 47, 471–482. [Google Scholar] [PubMed]
  15. Taylor, C.; Rosenhan, A.; Raines, J.; Rodriguez, J. An arson investigation by using comprehensive two-dimensional gas chromatography-quadrupole mass spectrometry. J. Forensic Res. 2012, 3, 169–179. [Google Scholar]
  16. Liu, Z.; Phillips, J.B. Comprehensive two-dimensional gas chromatography using an on-column thermal modulator interface. J. Chromatogr. Sci. 1991, 29, 227–231. [Google Scholar] [CrossRef]
  17. Von Mühlen, C.; Zini, C.A.; Caramão, E.B.; Marriott, P.J. Applications of comprehensive two-dimensional gas chromatography to the characterization of petrochemical and related samples. J. Chromatogr. A 2006, 1105, 39–50. [Google Scholar] [CrossRef] [PubMed]
  18. Adahchour, M.; Beens, J.; Vreuls, R.; Brinkman, U.A.T. Recent developments in comprehensive two-dimensional gas chromatography (GC×GC) III. Applications for petrochemicals and organohalogens. Trends Anal. Chem. 2006, 25, 726–741. [Google Scholar] [CrossRef]
  19. Nizio, K.D.; McGinitie, T.M.; Harynuk, J.J. Comprehensive multidimensional separations for the analysis of petroleum. J. Chromatogr. A 2012, 1255, 12–23. [Google Scholar] [CrossRef] [PubMed]
  20. Patterson, D.G.; Welch, S.M.; Turner, W.E.; Sjödin, A.; Focant, J.F. Cryogenic zone compression for the measurement of dioxins in human serum by isotope dilution at the attogram level using modulated gas chromatography coupled to high resolution magnetic sector mass spectrometry. J. Chromatogr. A 2011, 1218, 3274–3281. [Google Scholar] [CrossRef] [PubMed]
  21. Beens, J.; Blomberg, J.; Schoenmakers, P.J. Proper tuning of comprehensive two-dimensional gas chromatography (GC×GC) to optimize the separation of complex oil fractions. J. High Resolut. Chromatogr. 2000, 23, 182–188. [Google Scholar] [CrossRef]
  22. Korytár, P.; Leonards, P.E.G.; de Boer, J.; Brinkman, U.A.T. High-resolution separation of polychlorinated biphenyls by comprehensive two-dimensional gas chromatography. J. Chromatogr. A 2002, 958, 203–218. [Google Scholar] [CrossRef]
  23. Marriott, P.J.; Massil, T.; Hügel, H. Molecular structure retention relationships in comprehensive two-dimensional gas chromatography. J. Sep. Sci. 2004, 27, 1273–1284. [Google Scholar] [CrossRef] [PubMed]
  24. Stauffer, E.; Dolan, J.A.; Newman, R. Fire Debris Analysis; Academic Press: London, UK, 2008. [Google Scholar]
  25. Sampat, A.; Lopatka, M.; Sjerps, M.; Vivo-truyols, G.; Schoenmakers, P.; Asten, A. Van The forensic potential of comprehensive two-dimensional gas chromatography. Trends Anal. Chem. 2016, 80, 345–363. [Google Scholar] [CrossRef]
  26. Martín-Alberca, C.; Ortega-Ojeda, F.E.; García-Ruiz, C. Analytical tools for the analysis of fire debris. A review: 2008–2015. Anal. Chim. Acta 2016, 928, 1–19. [Google Scholar] [CrossRef] [PubMed]
  27. Dekeirsschieter, J.; Stefanuto, P.-H.; Brasseur, C.; Haubruge, E.; Focant, J.-F. Enhanced characterization of the smell of death by comprehensive two-dimensional gas chromatography-time-of-flight mass spectrometry (GC×GC-TOFMS). PLoS ONE 2012, 7. [Google Scholar] [CrossRef] [PubMed]
  28. Stefanuto, P.-H.; Perrault, K.; Stadler, S.; Pesesse, R.; Brokl, M.; Forbes, S.; Focant, J.-F. Reading cadaveric decomposition chemistry with a new pair of glasses. ChemPlusChem 2014, 79, 786–789. [Google Scholar] [CrossRef]
  29. Perrault, K.A.; Nizio, K.D.; Forbes, S.L. A comparison of one-dimensional and comprehensive two-dimensional gas chromatography for decomposition odour profiling using inter-year replicate field trials. Chromatographia 2015, 78, 1057–1070. [Google Scholar] [CrossRef]
  30. Frysinger, G. GC×GC—A new analytical tool for evironmental forensics. Environ. Forensics 2002, 3, 27–34. [Google Scholar]
  31. Muscalu, A.M.; Reiner, E.J.; Liss, S.N.; Chen, T.; Ladwig, G.; Morse, D. A routine accredited method for the analysis of polychlorinated biphenyls, organochlorine pesticides, chlorobenzenes and screening of other halogenated organics in soil, sediment and sludge by GC×GC-µECD. Anal. Bioanal. Chem. 2011, 401, 2403–2413. [Google Scholar] [CrossRef] [PubMed]
  32. Prebihalo, S.; Brockman, A.; Cochran, J.; Dorman, F.L. Determination of emerging contaminants in wastewater utilizing comprehensive two-dimensional gas-chromatography coupled with time-of-flight mass spectrometry. J. Chromatogr. A 2015, 1419, 109–115. [Google Scholar] [CrossRef] [PubMed]
  33. Klee, M.S.; Cochran, J.; Merrick, M.; Blumberg, L.M. Evaluation of conditions of comprehensive two-dimensional gas chromatography that yield a near-theoretical maximum in peak capacity gain. J. Chromatogr. A 2015, 1383, 151–159. [Google Scholar] [CrossRef] [PubMed]
  34. Blumberg, L.M. Theory of fast capillary gas chromatography—Part 3: Column performance vs. gas flow rate. J. High Resolut. Chromatogr. 1999, 22, 403–413. [Google Scholar] [CrossRef]
  35. Blumberg, L.M.; Klee, M.S. Optimal heating rate in gas chromatography. J. Microcolumn Sep. 2000, 12, 508–514. [Google Scholar] [CrossRef]
  36. Sandercock, P.M.; Du Pasquier, E. Chemical fingerprinting of unevaporated automotive gasoline samples. Forensic Sci. Int. 2003, 134, 1–10. [Google Scholar] [CrossRef]
  37. Giddings, J.C. Two-dimensional separations: concept and promise. Anal. Chem. 1984, 56, 1258A–1270A. [Google Scholar] [CrossRef] [PubMed]
  38. Górecki, T.; Harynuk, J.; Panić, O. The evolution of comprehensive two-dimensional gas chromatography (GC×GC). J. Sep. Sci. 2004, 27, 359–379. [Google Scholar] [CrossRef] [PubMed]
  39. Sinkov, N.A.; Johnston, B.M.; Sandercock, P.M.L.; Harynuk, J.J. Automated optimization and construction of chemometric models based on highly variable raw chromatographic data. Anal. Chim. Acta 2011, 697, 8–15. [Google Scholar] [CrossRef] [PubMed]
  40. Turner, D.A.; Goodpaster, J.V. Comparing the effects of weathering and microbial degradation on gasoline using principal components analysis. J. Forensic Sci. 2012, 57, 64–69. [Google Scholar] [CrossRef] [PubMed]
  41. Lopatka, M.; Sigman, M.E.; Sjerps, M.J.; Williams, M.R.; Vivó-Truyols, G. Class-conditional feature modeling for ignitable liquid classification with substantial substrate contribution in fire debris analysis. Forensic Sci. Int. 2015, 252, 177–186. [Google Scholar] [CrossRef] [PubMed]
  42. Monfreda, M.; Gregori, A. Differentiation of unevaporated gasoline samples according to their brands, by SPME-GC-MS and multivariate statistical analysis. J. Forensic Sci. 2011, 56, 372–380. [Google Scholar] [CrossRef] [PubMed]
  43. Pierce, K.M.; Hoggard, J.C.; Hope, J.L.; Rainey, P.M.; Hoofnagle, A.N.; Jack, R.M.; Wright, B.W.; Synovec, R.E.; Hospital, C.; Point, S.; et al. Fisher ratio method applied to third-order separation data to identify significant chemical components of metabolite extracts. Anal. Chem. 2006, 78, 5068–5075. [Google Scholar] [CrossRef] [PubMed]
  44. Mohler, R.E.; Dombek, K.M.; Hoggard, J.C.; Pierce, K.M.; Young, E.T.; Synovec, R.E. Comprehensive analysis of yeast metabolite GC×GC-TOFMS data: Combining discovery-mode and deconvolution chemometric software. Analyst 2007, 132, 756–767. [Google Scholar] [CrossRef] [PubMed]
  45. Beckstrom, A.C.; Humston, E.M.; Snyder, L.R.; Synovec, R.E.; Juul, S.E. Application of comprehensive two-dimensional gas chromatography with time-of-flight mass spectrometry method to identify potential biomarkers of perinatal asphyxia in a non-human primate model. J. Chromatogr. A 2011, 1218, 1899–1906. [Google Scholar] [CrossRef] [PubMed]
  46. Brokl, M.; Bishop, L.; Wright, C.G.; Liu, C.; McAdam, K.; Focant, J.-F. Multivariate analysis of mainstream tobacco smoke particulate phase by headspace solid-phase micro extraction coupled with comprehensive two-dimensional gas chromatography-time-of-flight mass spectrometry. J. Chromatogr. A 2014, 1370, 216–229. [Google Scholar] [CrossRef] [PubMed]
  47. Stefanuto, P.-H.; Perrault, K.A.; Lloyd, R.M.; Stuart, B.; Rai, T.; Forbes, S.L.; Focant, J.-F. Exploring new dimensions in cadaveric decomposition odour analysis. Anal. Methods 2015, 7, 2287–2294. [Google Scholar] [CrossRef]
  48. Nizio, K.D.; Perrault, K.A.; Troobnikoff, A.N.; Ueland, M.; Shoma, S.; Iredell, J.R.; Middleton, P.G.; Forbes, S.L. In vitro volatile organic compound profiling using GC×GC-TOFMS to differentiate bacteria associated with lung infections: a proof-of-concept study. J. Breath Res. 2016, 10. [Google Scholar] [CrossRef] [PubMed]
Figure 1. Total ion current (TIC) chromatograms for the E1618 Test Mixture collected using (a) one-dimensional (1D) gas chromatography–time-of-flight mass spectrometry (GC-TOFMS) and (b) comprehensive two-dimensional gas chromatography–time-of-flight mass spectrometry (GC×GC-TOFMS).
Separations 03 00026 g001
Figure 2. TIC chromatograms for unweathered kerosene collected using (a) 1D GC-TOFMS and (b) GC×GC-TOFMS (chromatogram displayed using a scale of 0%–20% of the normalized signal intensity to assist with chromatographic visualization of trace components).
Separations 03 00026 g002
Figure 3. GC×GC-TOFMS TIC contour plots of gasoline: (a) unweathered; (b) 25% weathered; (c) 50% weathered; (d) 75% weathered; and (e) 99% weathered. The chromatograms are displayed using a scale of 0%–20% of the normalized signal intensity to assist with chromatographic visualization of trace components.
Separations 03 00026 g003
Figure 4. GC×GC-TOFMS TIC contour plots of kerosene: (a) unweathered; (b) 25% weathered; (c) 50% weathered; and (d) 75% weathered. The chromatograms are displayed using a scale of 0%–20% of the normalized signal intensity to assist with chromatographic visualization of trace components.
Separations 03 00026 g004
Figure 5. GC×GC-TOFMS TIC contour plots of mineral spirits: (a) unweathered; (b) 25% weathered; (c) 50% weathered; and (d) 75% weathered. The chromatograms are displayed using a scale of 0%–20% of the normalized signal intensity to assist with chromatographic visualization of trace components.
Separations 03 00026 g005
Figure 6. GC×GC-TOFMS TIC contour plots of diesel fuel: (a) unweathered; (b) 25% weathered; (c) 50% weathered; and (d) 75% weathered. The chromatograms are displayed using a scale of 0%–20% of the normalized signal intensity to assist with chromatographic visualization of trace components.
Separations 03 00026 g006
Figure 7. GC×GC-TOFMS extracted ion current (EIC) contour plots of unweathered gasoline: (a) ions: 43+57+71+85+99 (alkanes); (b) ions: 55+69 (cycloalkanes); (c) ions: 82+83 (n-alkylcyclohexanes); (d) ions: 91+105+119+92+106+120+134 (alkylbenzenes); (e) ions: 128+142+156+170 (alkylnaphthalenes); and (f) ions: 117+118+131+132 (indanes). The chromatograms are displayed using a scale of 0%–20% of the normalized signal intensity to assist with chromatographic visualization of trace components.
Separations 03 00026 g007
Figure 8. GC×GC-TOFMS TIC contour plot of unweathered gasoline illustrating the ordered structure of the chromatogram. The chromatogram is displayed using a scale of 0%–20% of the normalized signal intensity to assist with chromatographic visualization of trace components.
Separations 03 00026 g008
Figure 9. Principal component analysis (PCA) using pre-processed GC×GC-TOFMS peak area data for analytes detected in unweathered and weathered gasoline (black symbols), kerosene (red symbols), mineral spirits (green symbols) and diesel fuel (blue symbols) standards: (a) scores plot of PC-1 and PC-2; (b) scores plot of PC-2 and PC-3; and (c) three-dimensional (3D) scores plot of PC-1, PC-2 and PC-3.
Separations 03 00026 g009
Table 1. Major ions characteristic of common ignitable liquid chemical compound classes [8].
Compound Classm/z
Alkanes43, 57, 71, 85, 99
Cycloalkanes and alkenes55, 69
n-Alkylcyclohexanes82, 83
Aromatics (i.e., alkylbenzenes)91, 105, 119, 92, 106, 120, 134
Alkylnaphthalenes128, 142, 156, 170
Indanes117, 118, 131, 132
Alkylstyrenes104, 117, 118, 132, 146
Alkylanthracenes178, 192, 206
Alkylbiphenyls/acenaphthenes154, 168, 182, 196
Monoterpenes93, 136
Ketones43, 58, 72, 86
Alcohols31, 45

