Article

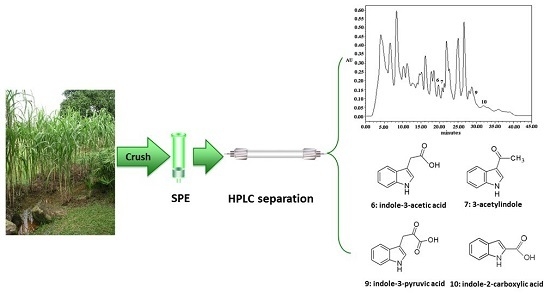
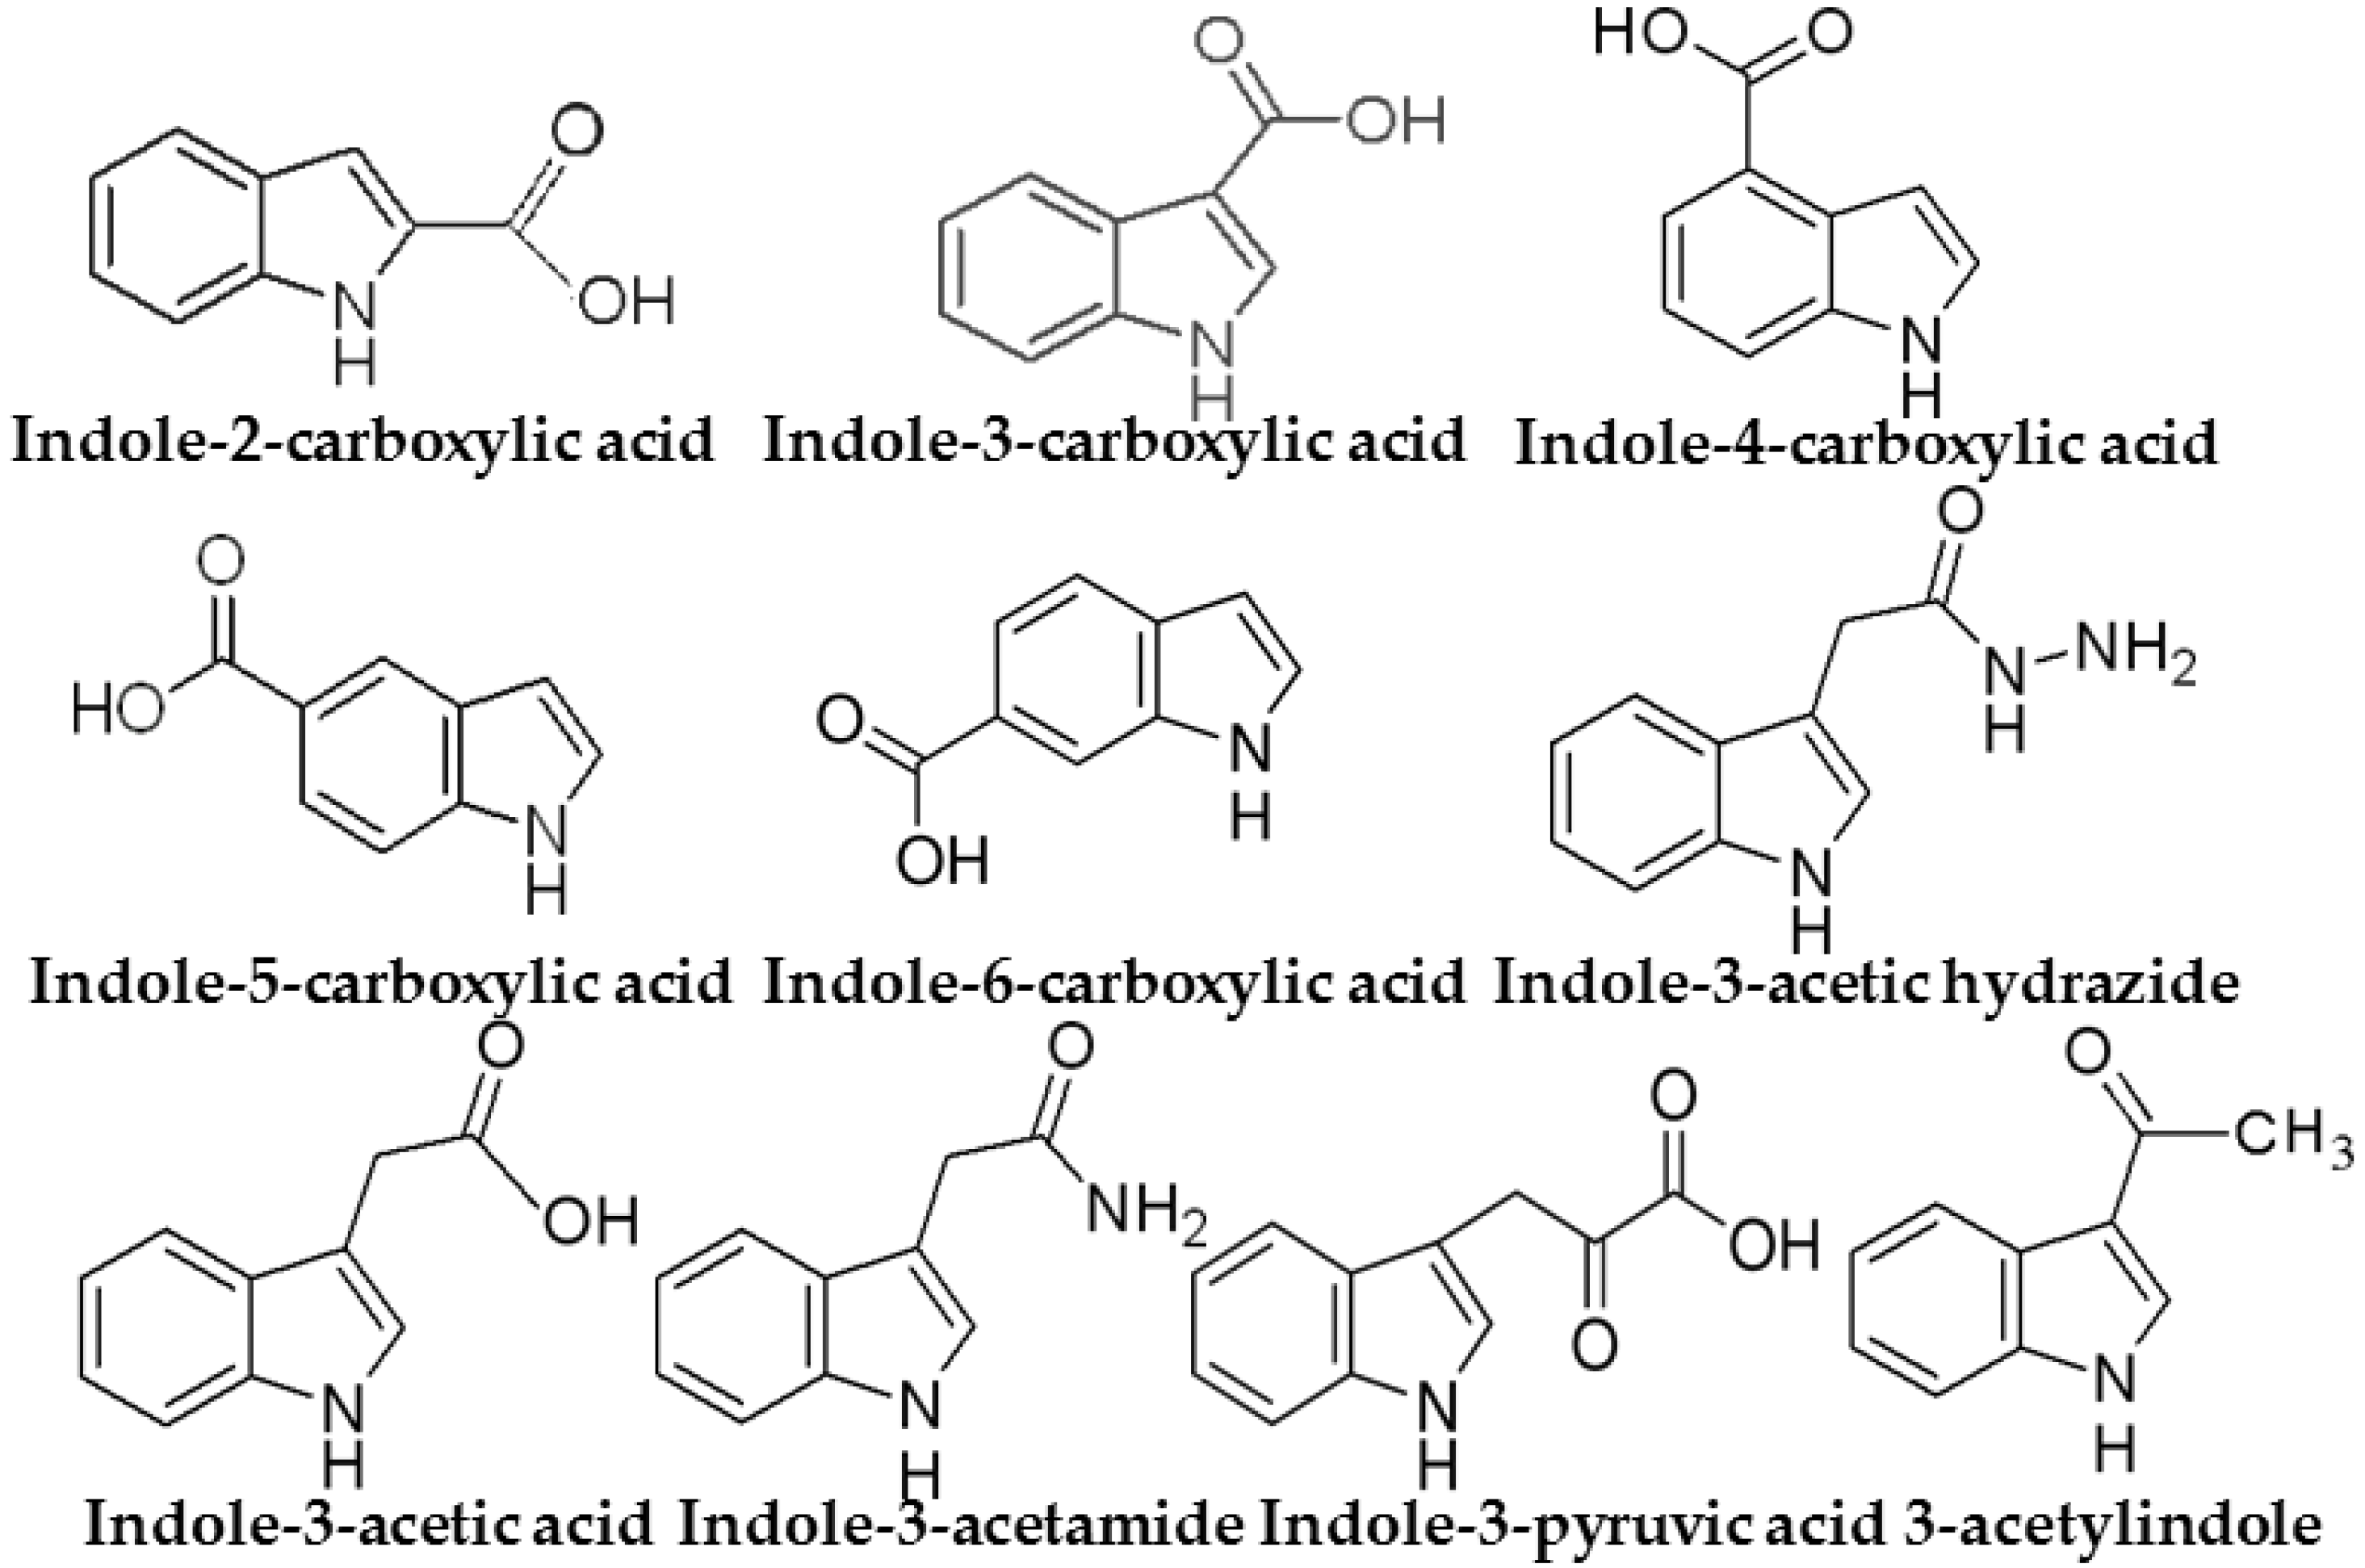
Analyses of Indole Compounds in Sugar Cane (Saccharum officinarum L.) Juice by High Performance Liquid Chromatography and Liquid Chromatography-Mass Spectrometry after Solid-Phase Extraction

1
ARC Centre for Mine Site Restoration, School of Biological Sciences, University of Western Australia, 35 Stirling Highway, Crawley, Perth 6009, Western Australia, Australia
2
Residues and Resource Reclamation Centre, Nanyang Environment and Water Research Institute, Nanyang Technological University, 1 Cleantech Loop, Singapore 637141, Singapore
3
Advanced Environmental Biotechnology Centre, Nanyang Environment and Water Research Institute, Nanyang Technological University, 1 Cleantech Loop, Singapore 637141, Singapore
4
Natural Sciences and Science Education Academic Group, Nanyang Technological University, 1 Nanyang Walk, Singapore 637616, Singapore
*
Author to whom correspondence should be addressed.
Separations 2017, 4(1), 7; https://doi.org/10.3390/separations4010007
Submission received: 31 December 2016 / Revised: 28 February 2017 / Accepted: 7 March 2017 / Published: 15 March 2017

Abstract

:
Simultaneous quantitative analysis of 10 indole compounds, including indole-3-acetic acid (IAA, one of the most important naturally occurring auxins) and some of its metabolites, by high performance liquid chromatography (HPLC) and liquid chromatography-mass spectrometry (LC-MS) after solid-phase extraction (SPE) was reported for the first time. The analysis was carried out using a reverse phase HPLC gradient elution, with an aqueous mobile phase (containing 0.1% formic acid) modified by methanol. Furthermore, a novel SPE procedure was developed for the pre-concentration and purification of indole compounds using C18 SPE cartridges. The combination of SPE, HPLC, and LC-MS was applied to screen for the indole compounds present in sugar cane (Saccharum officinarum L.) juice, a refreshing beverage with various health benefits. Finally, four indole compounds were successfully detected and quantified in sugar cane juice by HPLC, which were further unequivocally confirmed by LC-MS/MS experiments operating in the multiple reaction monitoring (MRM) mode.

Graphical Abstract

1. Introduction

Sugar cane (Saccharum officinarum L.), a widely distributed crop in the world, has many economic dimensions, especially for the sugar industry, in many tropical and subtropical countries [1]. In many countries where sugar cane is cultivated, general population like to drink sugar cane juice as a delicious, refreshing, and popular beverage. Past research works have revealed several interesting biochemical properties of sugar cane, e.g., certain phenolic analytes and flavonoids in sugar cane were considered to have certain antioxidant activity [1,2]. In addition, sugar cane juice contains sugar, vitamins, inorganic minerals and plant growth regulators (i.e., phytohormones). Therefore, sugar cane juice has also been used in the plant tissue culture industry [3], though not as widely used as coconut water [4,5]. For the tissue culture work performed in our group (unpublished data), sugar cane juice supplementation is able to support tissue culture growth. Thus, this work aims to provide some evidence on the phytohormone (e.g., auxin) composition of the sugar cane juice, as such work has not been previously reported. Characterization of phytohormone composition of sugar cane could promote its wider applications in the tissue culture industry.
Indole, an aromatic heterocyclic organic compound, is the potent basic pharmacodynamic nucleus that has been reported to possess a wide variety of biological and clinical properties [6]. All indole compounds have a bicyclic structure, consisting of a six-membered benzene ring fused to a five-membered nitrogen-containing pyrrole ring (Figure 1). The indole structure can be found in many organic compounds like tryptophan, tryptophan-containing proteins, alkaloids, pigments, etc. Some earlier studies reported that plant tissues contain many indole compounds [7], which included the most important phytohormone, i.e., auxin. Auxins play various important functions in plant growth and development, such as cell division, elongation, embryo formation, and they also function as ‘chemical signals’ among cells, tissues and organs. Indole-3-acetic acid (IAA) is the main active endogenous auxin in most plants [8]. IAA is bio-synthesized from the tryptophan or indole, via indole-3-pyruvic acid (IPA), indole-3-acetamide, indole-3-acetonitrile, etc. [8,9,10,11,12]. In addition, some other indole compounds have been reported to have beneficial effects in biomedical research involving human health: relief from insomnia, enhanced anticonvulsive activity of antiepileptic drugs, some antioxidant activity, as starting materials for some anti-inflammatory drugs, etc. [13,14,15,16,17,18,19,20,21]. For example, IPA is a potential drug used for treating anxiety and insomnia [13,14,15].
Considering the low concentrations of indole compounds in plant tissues, different sample preparation methods—mainly including liquid–liquid extraction (LLE) and solid phase extraction (SPE)—have been employed for preconcentration and purification of indole compounds [22,23,24]. Compared with LLE, SPE is a simpler, yet more effective and versatile method for different sample matrices.
Analyses of indoles or phytohormones (e.g., anxins) by gas chromatography (GC) and gas chromatography-mass spectrometry (GC-MS) had been previously reported [23,24,25,26,27]. Also, there were some reports on the analyses of indoles and/or phytohormones by capillary electrophoresis (CE) [28,29]. Compared with the other chromatographic procedures, high performance liquid chromatography (HPLC), and liquid chromatography-mass spectrometry (LC-MS) have several advantages: high efficiency coupled with high sample capacity; rapid speed of analysis; simplicity of sample recovery; ability to analyze non-derivatized samples, etc. Although HPLC and LC-MS have been successfully used to analyze some indoles or phytohormones [30,31,32,33,34,35], few of these studies attempted to simultaneously analyze and detect different kinds of indole compounds within a complex plant matrix using HPLC or LC-MS.
Current work proposes a simple and sensitive HPLC method for analyzing IAA, IPA, 5 indole carboxylic acid isomers, 3-acetylindole, and indole-3-acetamide in a single analysis. The developed methodology was used to screen for the presence of endogenous indole compounds in sugar cane juice after application of a new SPE method for pre-concentration and purification of indole compounds. The presence of four indole compounds, which included IAA, was further confirmed by LC-MS/MS assay based on its characteristic fragmentation pattern. With HPLC and LC-MS based methods, IAA, IPA, 3-acetylindole, and indole-2-carboxylic acid were successfully identified and quantified.

2. Materials and Methods

2.1. Reagents and Materials

All indole standards were purchased from Sigma-Aldrich (Steinheim, Germany) except IAA, which was obtained from PhytoTechnology Laboratories (Shawnee Mission, KS, USA). Figure 1 shows the chemical structures of the 10 indole compounds. All the standards were dissolved in methanol with the concentration ranging from 250 to 500 μM and stored at temperature 4 °C. Methanol and acetonitrile (HPLC grade) were purchased from Sigma-Aldrich (St. Louis, MO, USA). Formic acid (analytical reagent grade) was purchased from Merck (Darmstadt, Germany). Filter paper (12.5 cm, No. 542, Whatman, Maidstone, Kent, England) was used to filter the sugar cane juice before SPE. Ultrapure water (Milford, MA, USA) was used throughout the analysis. The pH of the sample solution was adjusted to 3 by adding formic acid and monitored using a pH meter (CORNING 440, Corning Glass Works, Corning, NY, USA).

2.2. HPLC Instrumental Set-Up and Procedure

The analysis of indole compounds was performed using a high performance liquid chromatography system (Waters 2695 Separations Module, Waters, Milford MA, USA) linked simultaneously to a PDA system (PDA 2996 detector, Waters). Typically, the PDA system was operated at a detection wavelength of 280 nm. Data were processed by the accompanying system software (Millennium32 Software, Data Handling System for Windows, version 4.0).
The initial HPLC running condition was methanol–formic acid buffer (20:80, v/v). Solvent (A) consisted of 0.1% formic acid (w/v); and solvent (B) consisted of methanol. The flow rate was 0.3 mL·min−1 throughout the whole separation. Separations were performed using a C18 reverse-phase column (Zorbax SB-C18 100 Å, 3.5 μm, 2.1 mm×150 mm, Agilent Technologies, Palo Alto, CA, USA), at 30 °C. The injection volume of standards and purified sugar cane juice samples were 5 μL and 10 μL, respectively.

2.3. LC-MS/MS Conditions

LC (Model 1100 Series, Agilent Technologies) linked with LC/MSD Trap XCT (Agilent Technologies, Palo Alto, CA, USA) by an electrospray ionization (ESI) interface was used in scan mode for standards. The same C18 reverse-phase column and solvents as HPLC were employed with an injection volume of 5 μL. The column thermostat was set at 40 °C.
ESI-MS analysis was performed in the negative mode, and the ion trap was scanned at m/z 50–400 in full scan mode. The maximum accumulation time for the ion trap was set at 200 ms and the target count was set at 100,000. The actual accumulation time was controlled by ion charge control (ICC), which was used to prevent ion saturation in the ion trap. The nebulizer gas pressure, drying gas flow rate, drying gas temperature, and capillary voltage for the ESI source were set at 30 psi, 8 L·min−1, 350 °C, and 3500 V, respectively. Other instrument parameters were optimized for generating the highest signal intensities.
The multiple reaction monitoring (MRM) modes were used to monitor the transitions from the precursor ions to the most abundant product ions. MRM were performed in the smart mode with helium as collision gas. Table 1 showed the MRM transition results of different indole compounds. The data were processed using LC/MSD Chemstation software.

2.4. Retention of Indole Compounds on SPE Cartridges

The SPE experiments were conducted using C18 SPE cartridges (J.T. Baker, Phillipsburg, NJ, USA; 500 mg, 3 mL). In the preliminary experiments, standard solutions containing 10 indole compounds (2 µmol for each standard) dissolved in 100 mL acidified ultra-pure water (pH adjusted to 3 by formic acid) were extracted using SPE, which was previously conditioned with 2 mL methanol, 2 mL methanol-water solution (50:50, v/v), 2 mL methanol-water solution (30:70, v/v), and 2 mL acidified water (pH adjusted to 3 by formic acid) to obtain the optimum extraction conditions. Typically, the cartridge was washed with 5 mL acidified water (pH adjusted to 3 by formic acid), and then eluted with 5 mL methanol-water solution (80:20, v/v). The recovery of each indole standard was measured by HPLC method.

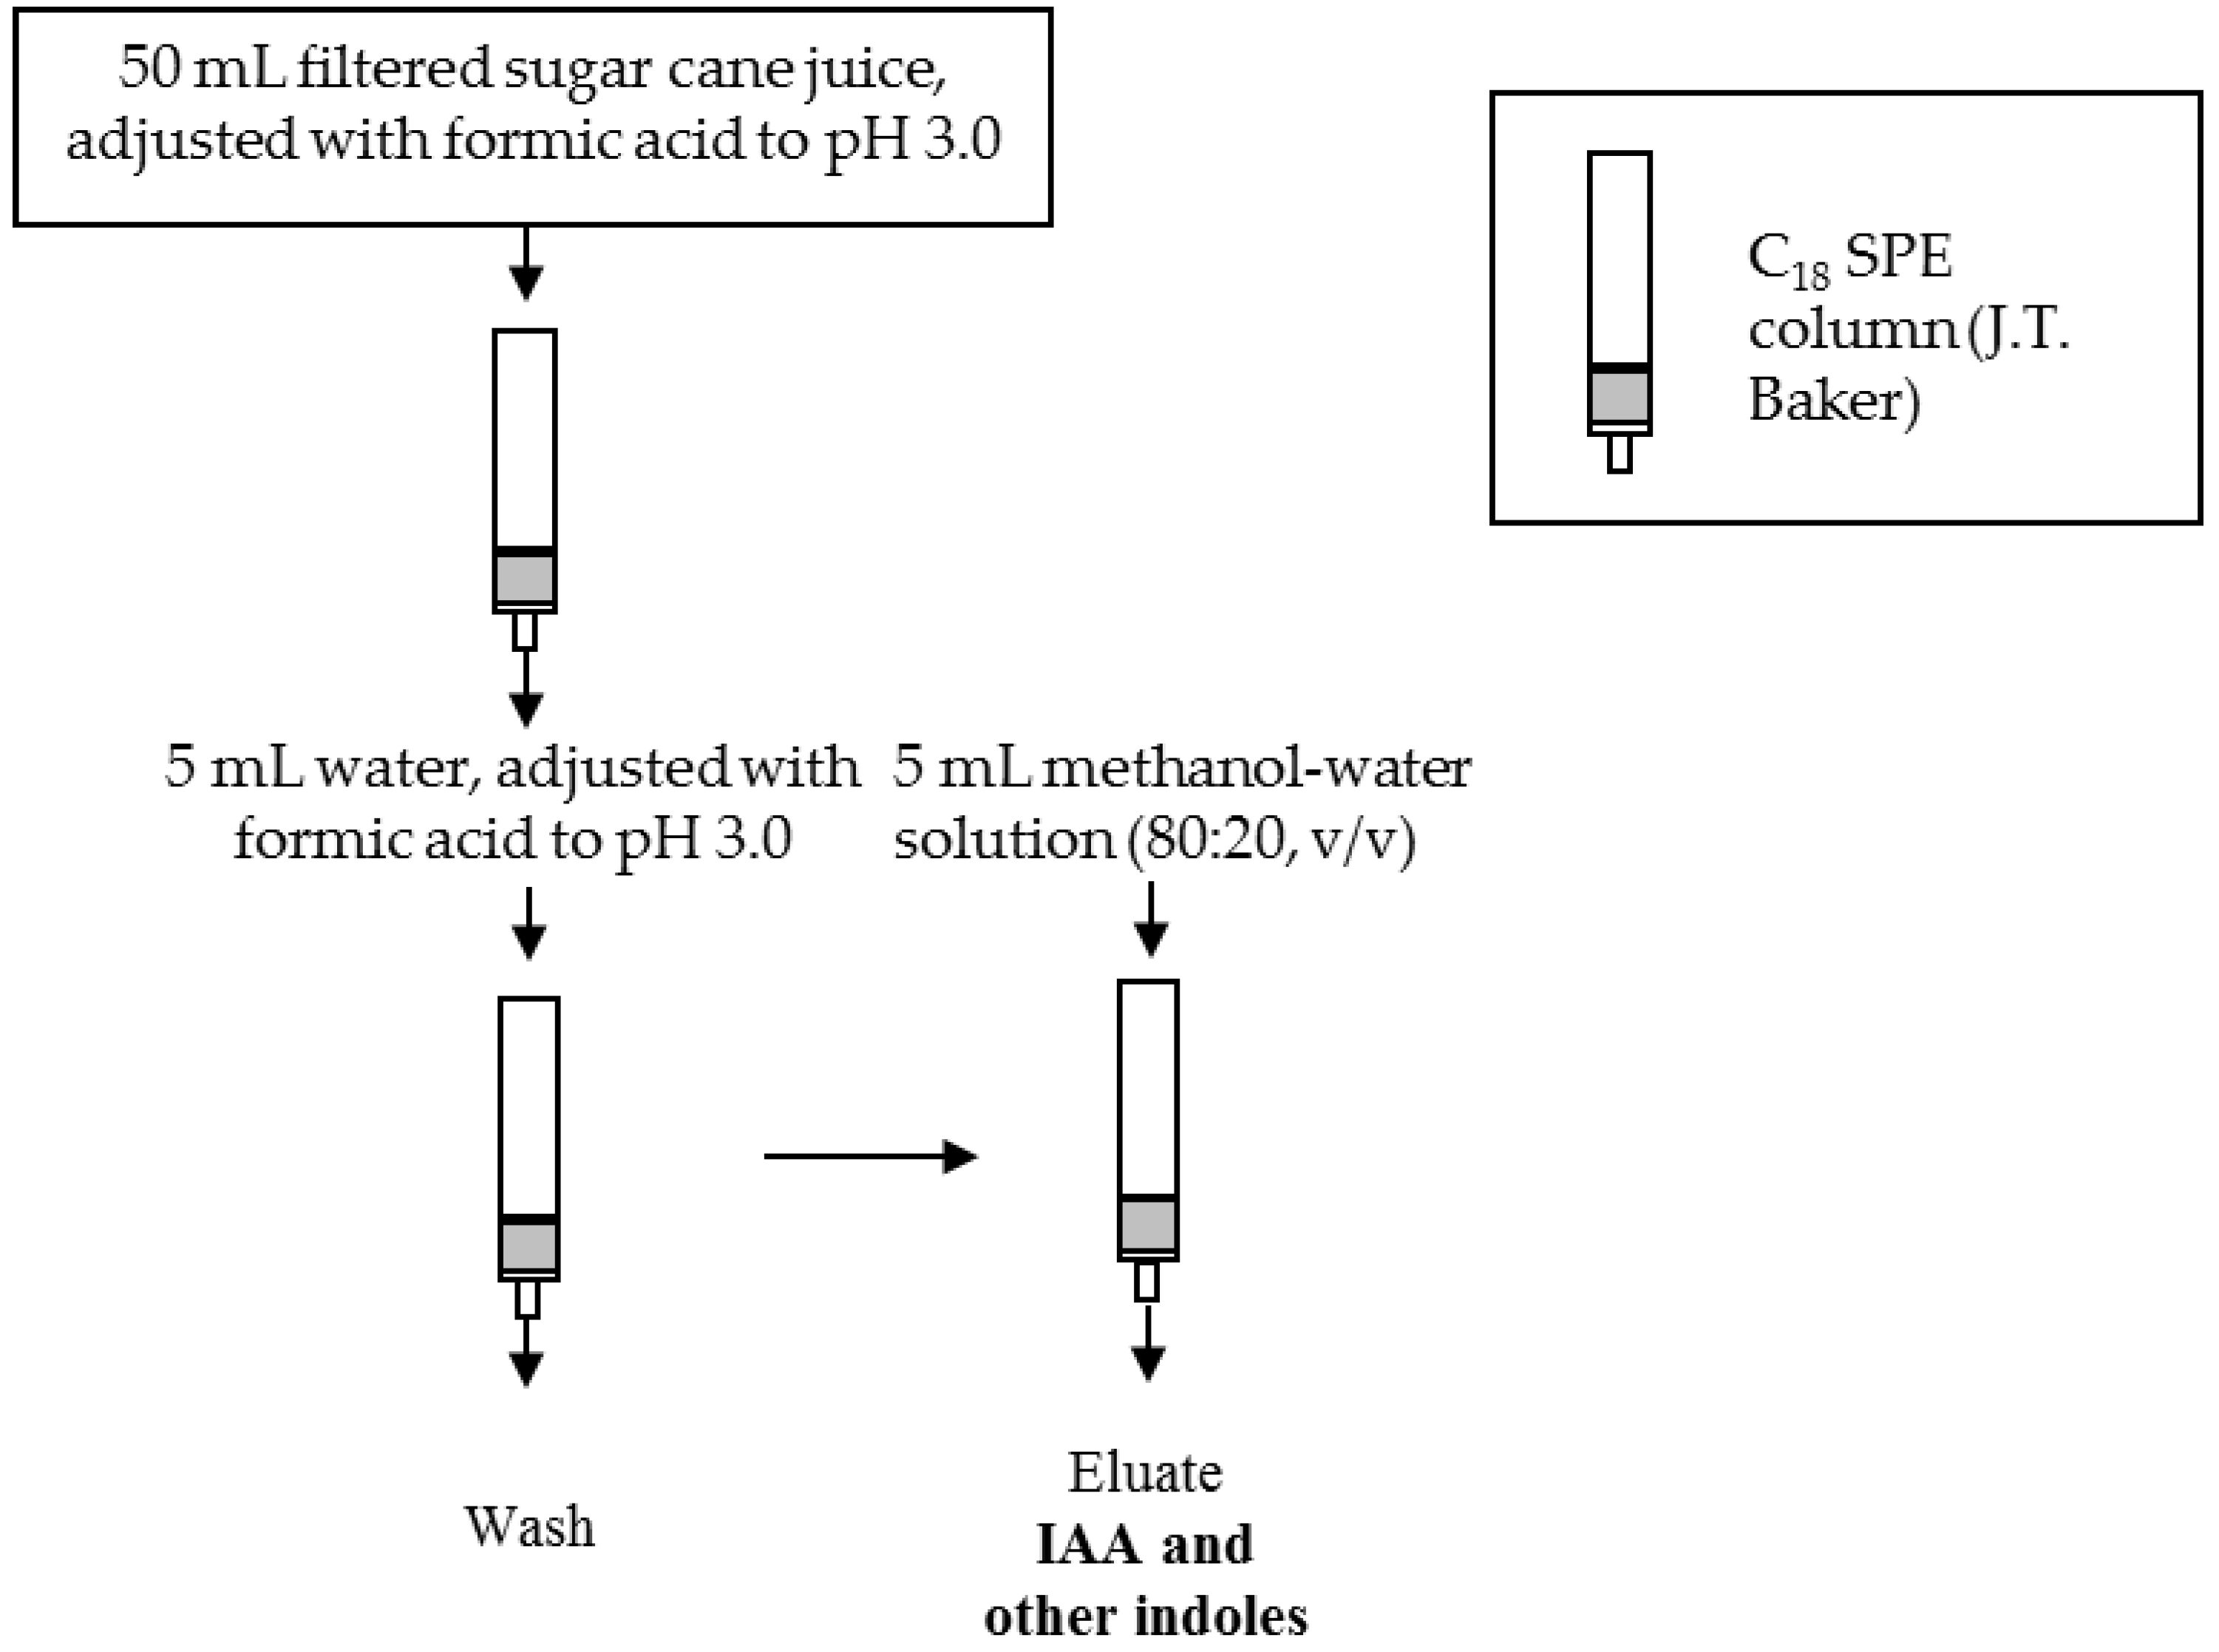
2.5. Sample Preparation

Sugar cane juice was crushed from fresh green sugar cane stems (Malaysia), and the analysis was performed within one week after harvest, since the quality of juice would change upon delayed extraction and storage [36]. Before further pre-concentration and purification, the pH of 500 mL sugar cane juice was adjusted to 3 by adding formic acid and filtered through filter paper (Whatman, 12.5 cm, No. 542) to remove the suspended matters. The optimum novel SPE procedure using C18 SPE cartridges (Section 2.4) was applied to pre-concentrate and purify the putative indole compounds. The SPE eluate was lyophilized to dryness, and the dried residue was reconstituted in 1 mL methanol. The collected samples were finally analyzed by HPLC and LC-MS.

2.6. Recovery Study of SPE Procedure

The extraction recoveries of 10 indole compounds using the C18 cartridges under optimum SPE conditions were also investigated. Unlabeled 10 indole standards (0.2 μmol each) were added to 50 mL sugar cane juice, and extracted according to the same sample preparation procedure. The spiked extracted sample was then subsequently analyzed using HPLC measurement.

3. Results and Discussion

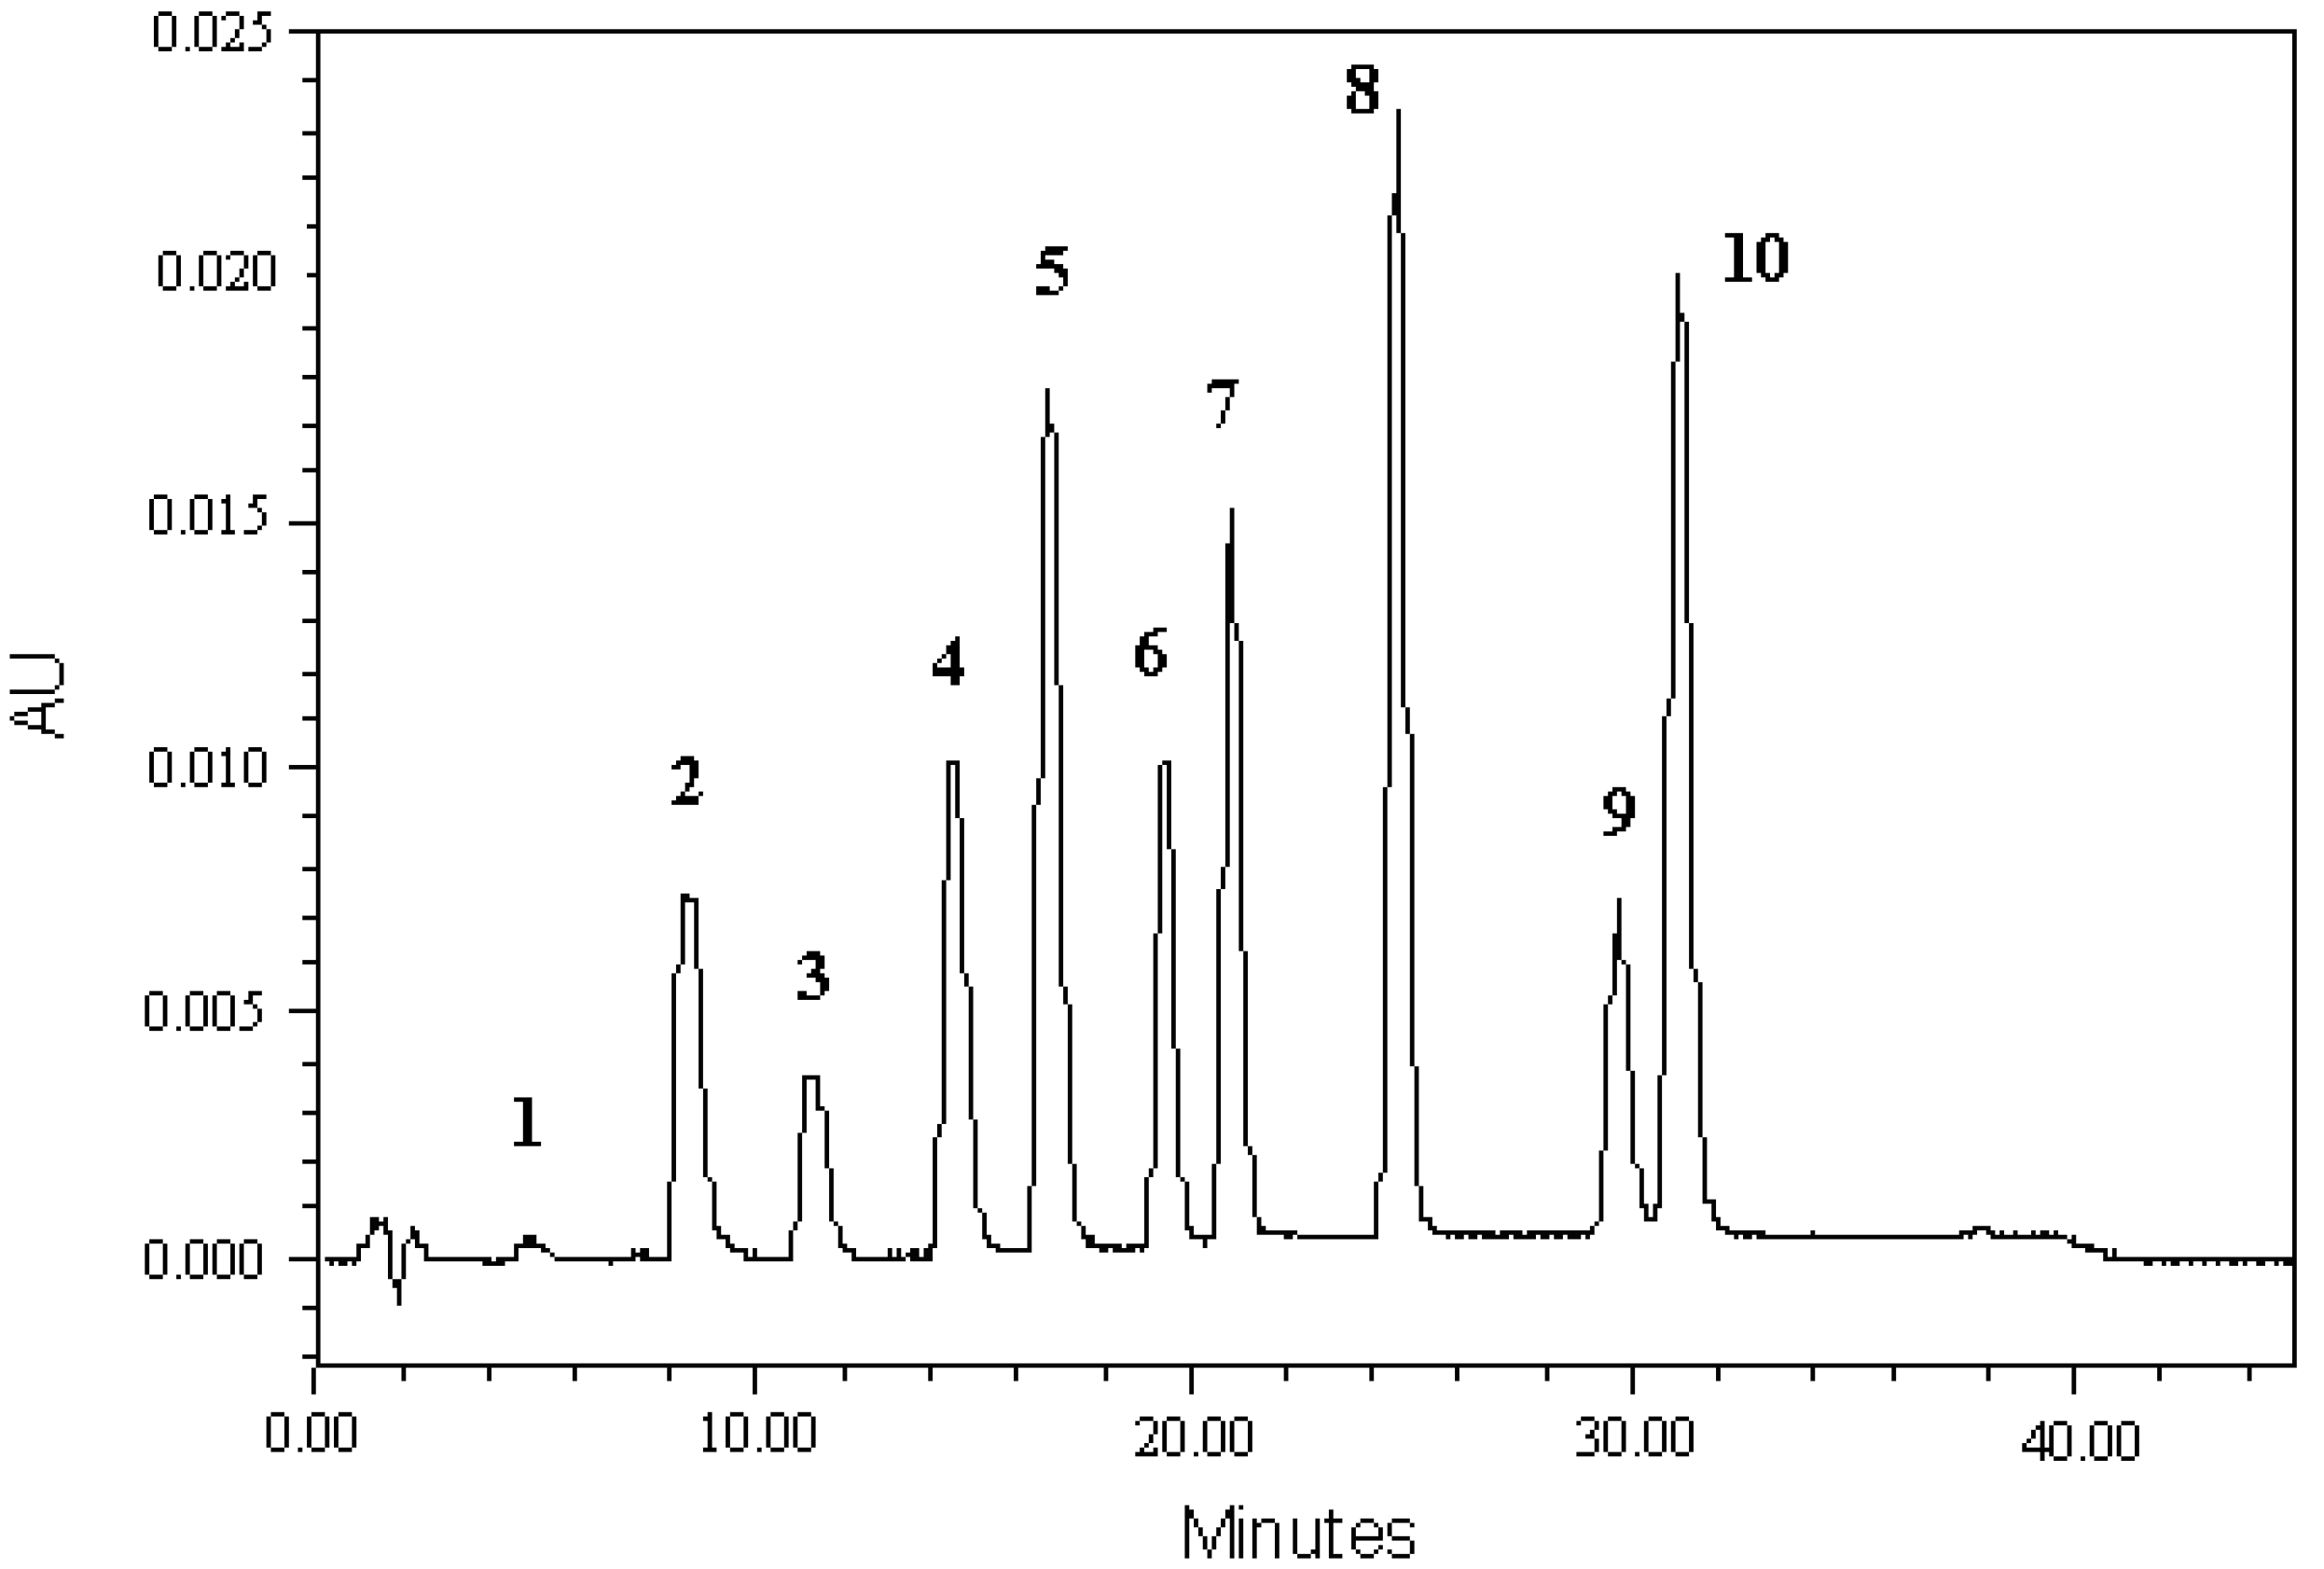
3.1. Development HPLC-PDA Method

Initially, different stationary phases (C18 and C8) and mobile phases (methanol and acetonitrile) were compared. As the column with C18 provided a better peak shape in most cases, it was used for further study. Even though methanol and acetonitrile provided similar results, methanol was selected for the further study due to the lower cost. Different gradient elution programs were tested to find the optimum separation conditions for the 10 indole compounds. With reference to the separation efficiency and a reasonable analytical time, the following gradient elution approach was eventually used as the preferred method: the column was initialized isocratically with methanol-formic acid buffer (20:80, v/v) for 5 min, then a linear gradient to methanol-formic acid buffer (30:70, v/v) in 15 min, which was later maintained isocratically for 15 min. Under the optimum separation conditions, all 10 compounds were successfully separated within 35 min. After each analysis, the column was washed with 95:5 (v/v) methanol-formic acid buffer for 5 min, and then formic acid buffer-methanol 90:10 (v/v) for ca. 30 min was used for re-equilibrated after this procedure.
Considering the difference UV absorbances of different indole compounds, 280 nm was chosen as the compromised optimum detecting wavelength with the programmable PDA system. Figure 2 showed the well resolved HPLC chromatogram of the 10 indole standard mixture under optimum conditions within 35 min. The HPLC–PDA method also allowed for the identification of the 10 indole compounds by comparing their retention times and the concomitant UV spectra with those of the respective standards.

3.2. Validation of the Method

Based on the optimum conditions, validation of the method was investigated by the relative standard deviations (RSDs) of retention time and peak area, linearity, and limits of quantification (LOQs). The reproducibility of the retention time and peak area of 10 indole compounds under optimum HPLC conditions was investigated by doing repeated injections (n = 6) of a mixture of the standards at a concentration of 50 µM. The RSDs of the retention time for all analytes were in the range of 0.08%–0.24%; the RSDs of peak area were in the range of 0.2%–6.0%. A linear correlation was found between the concentration and the peak area for all analytes in the range of 12.5–200 µM except indole-3-acetic hydrazide (25–200 µM); typically, R2 values were in the range of 0.989–0.999, which was good enough for analytical purpose. Based on a signal-to-noise ratio of 10, the LOQs were in the range of 0.08–1.72 µM. Three independent injections were carried out for each calibration point. All the response characteristics of the indole standards using HPLC analysis were summarized in Table 2.
Intra- and inter-day variations were chosen to further determine the precision of the HPLC method. The intra-day variation was determined by analyzing in triplicate the same standard mixtures dissolved in methanol solution for six times within one day. While for the inter-day variability test, the solution was examined in triplicate for three consecutive days and repeated one week later. The RSDs of the retention time (tR) and peak area (pa) were taken as the measure of precision (Table 3). These results are within the acceptable criteria for precision.

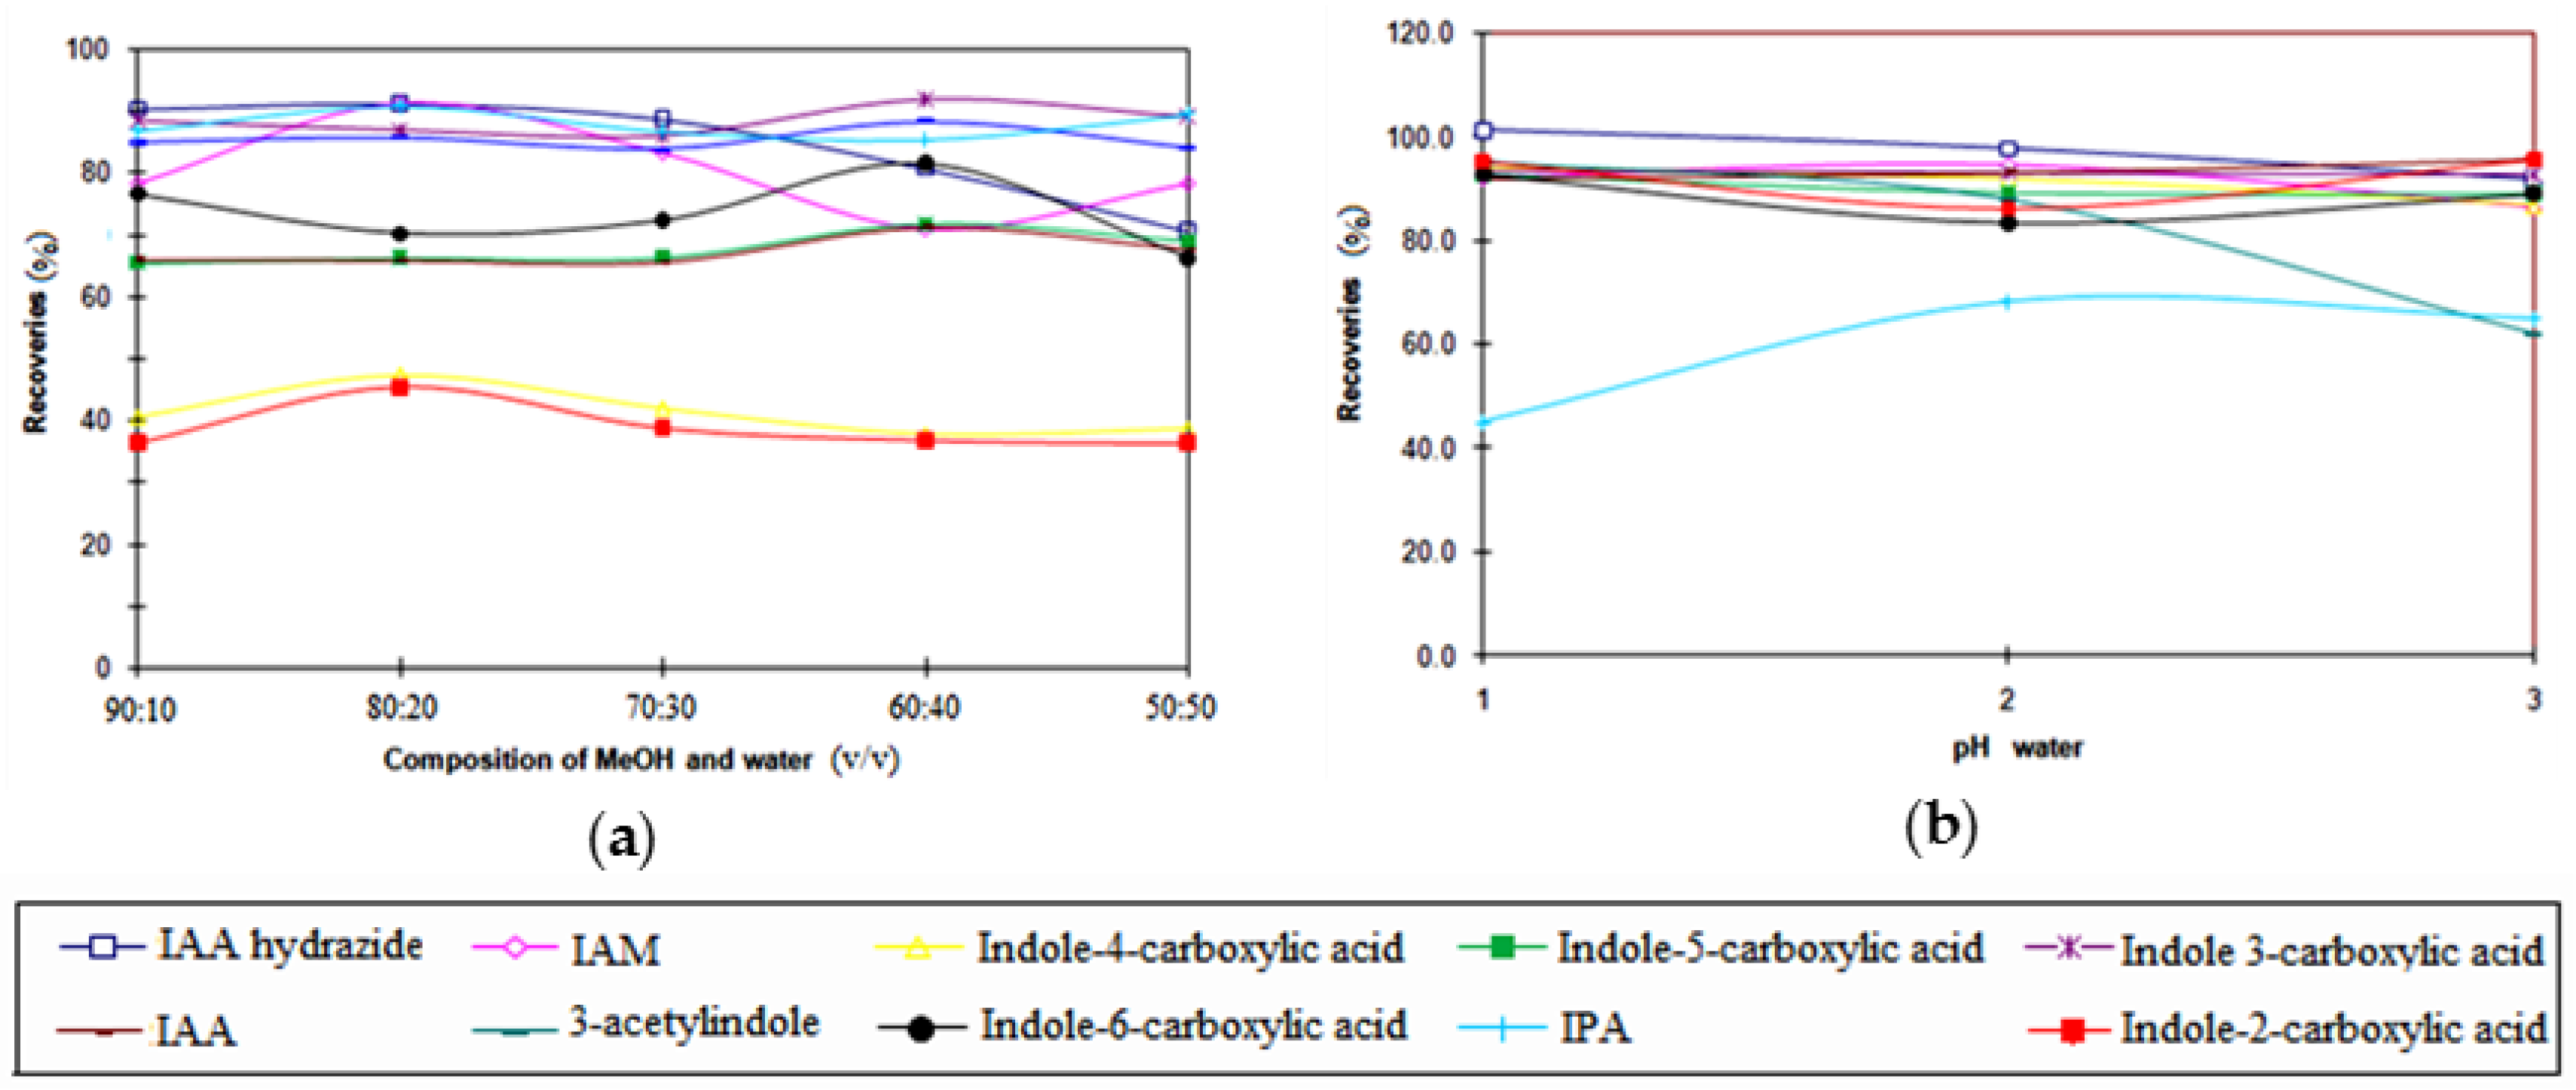
3.3. Optimization of the SPE Conditions

To develop a new method for measuring indole compounds, the C18 SPE cartridge was chosen since it provided good recovery performance in our previous phytohormone study which included a few indole compounds [37]. In the earlier work, the SPE was optimized to simultaneously pre-concentrate different classes of phytohormones in a single assay. The new SPE method developed was found to be useful for the analysis of the 10 indole compounds.
During the initial optimization process, ultrapure water was used without any pH adjustment in the conditioning and washing steps. Later, different compositions of methanol-water solution were used as the eluent solution (90:10, 80:20, 70:30, 60:40, 50:50, v/v). As shown in Figure 3a, 80:20 (v/v) methanol-water solution was finally selected as the compromised solution based on the recoveries of the 10 indole compounds. Typically, recoveries of the 10 indoles were in the range of 45%–91% under the optimized condition (80:20 (v/v) methanol-water). The effect of washing water solution pH on the recoveries of the 10 indole compounds was also investigated. The different pH values (2.5, 3, 3.5) of washing water solution were adjusted by formic acid. As shown in Figure 3b, when using ultrapure water (pH adjusted to 3 by formic acid) for conditioning and washing the cartridges, the recoveries of all indoles were from 68% to 98%, which were considered to be optimal extraction recovery rates.
The optimized C18 SPE method was able to pre-concentrate ca. indole compounds 500-fold, and this approach was later used to pre-concentrate and purify the putative indoles present naturally in sugar cane juice, prior to HPLC and LC-MS analyses. The schematic pre-concentration protocol based on the recoveries of indole standards in the washing and eluting solutions was presented in Figure 4.

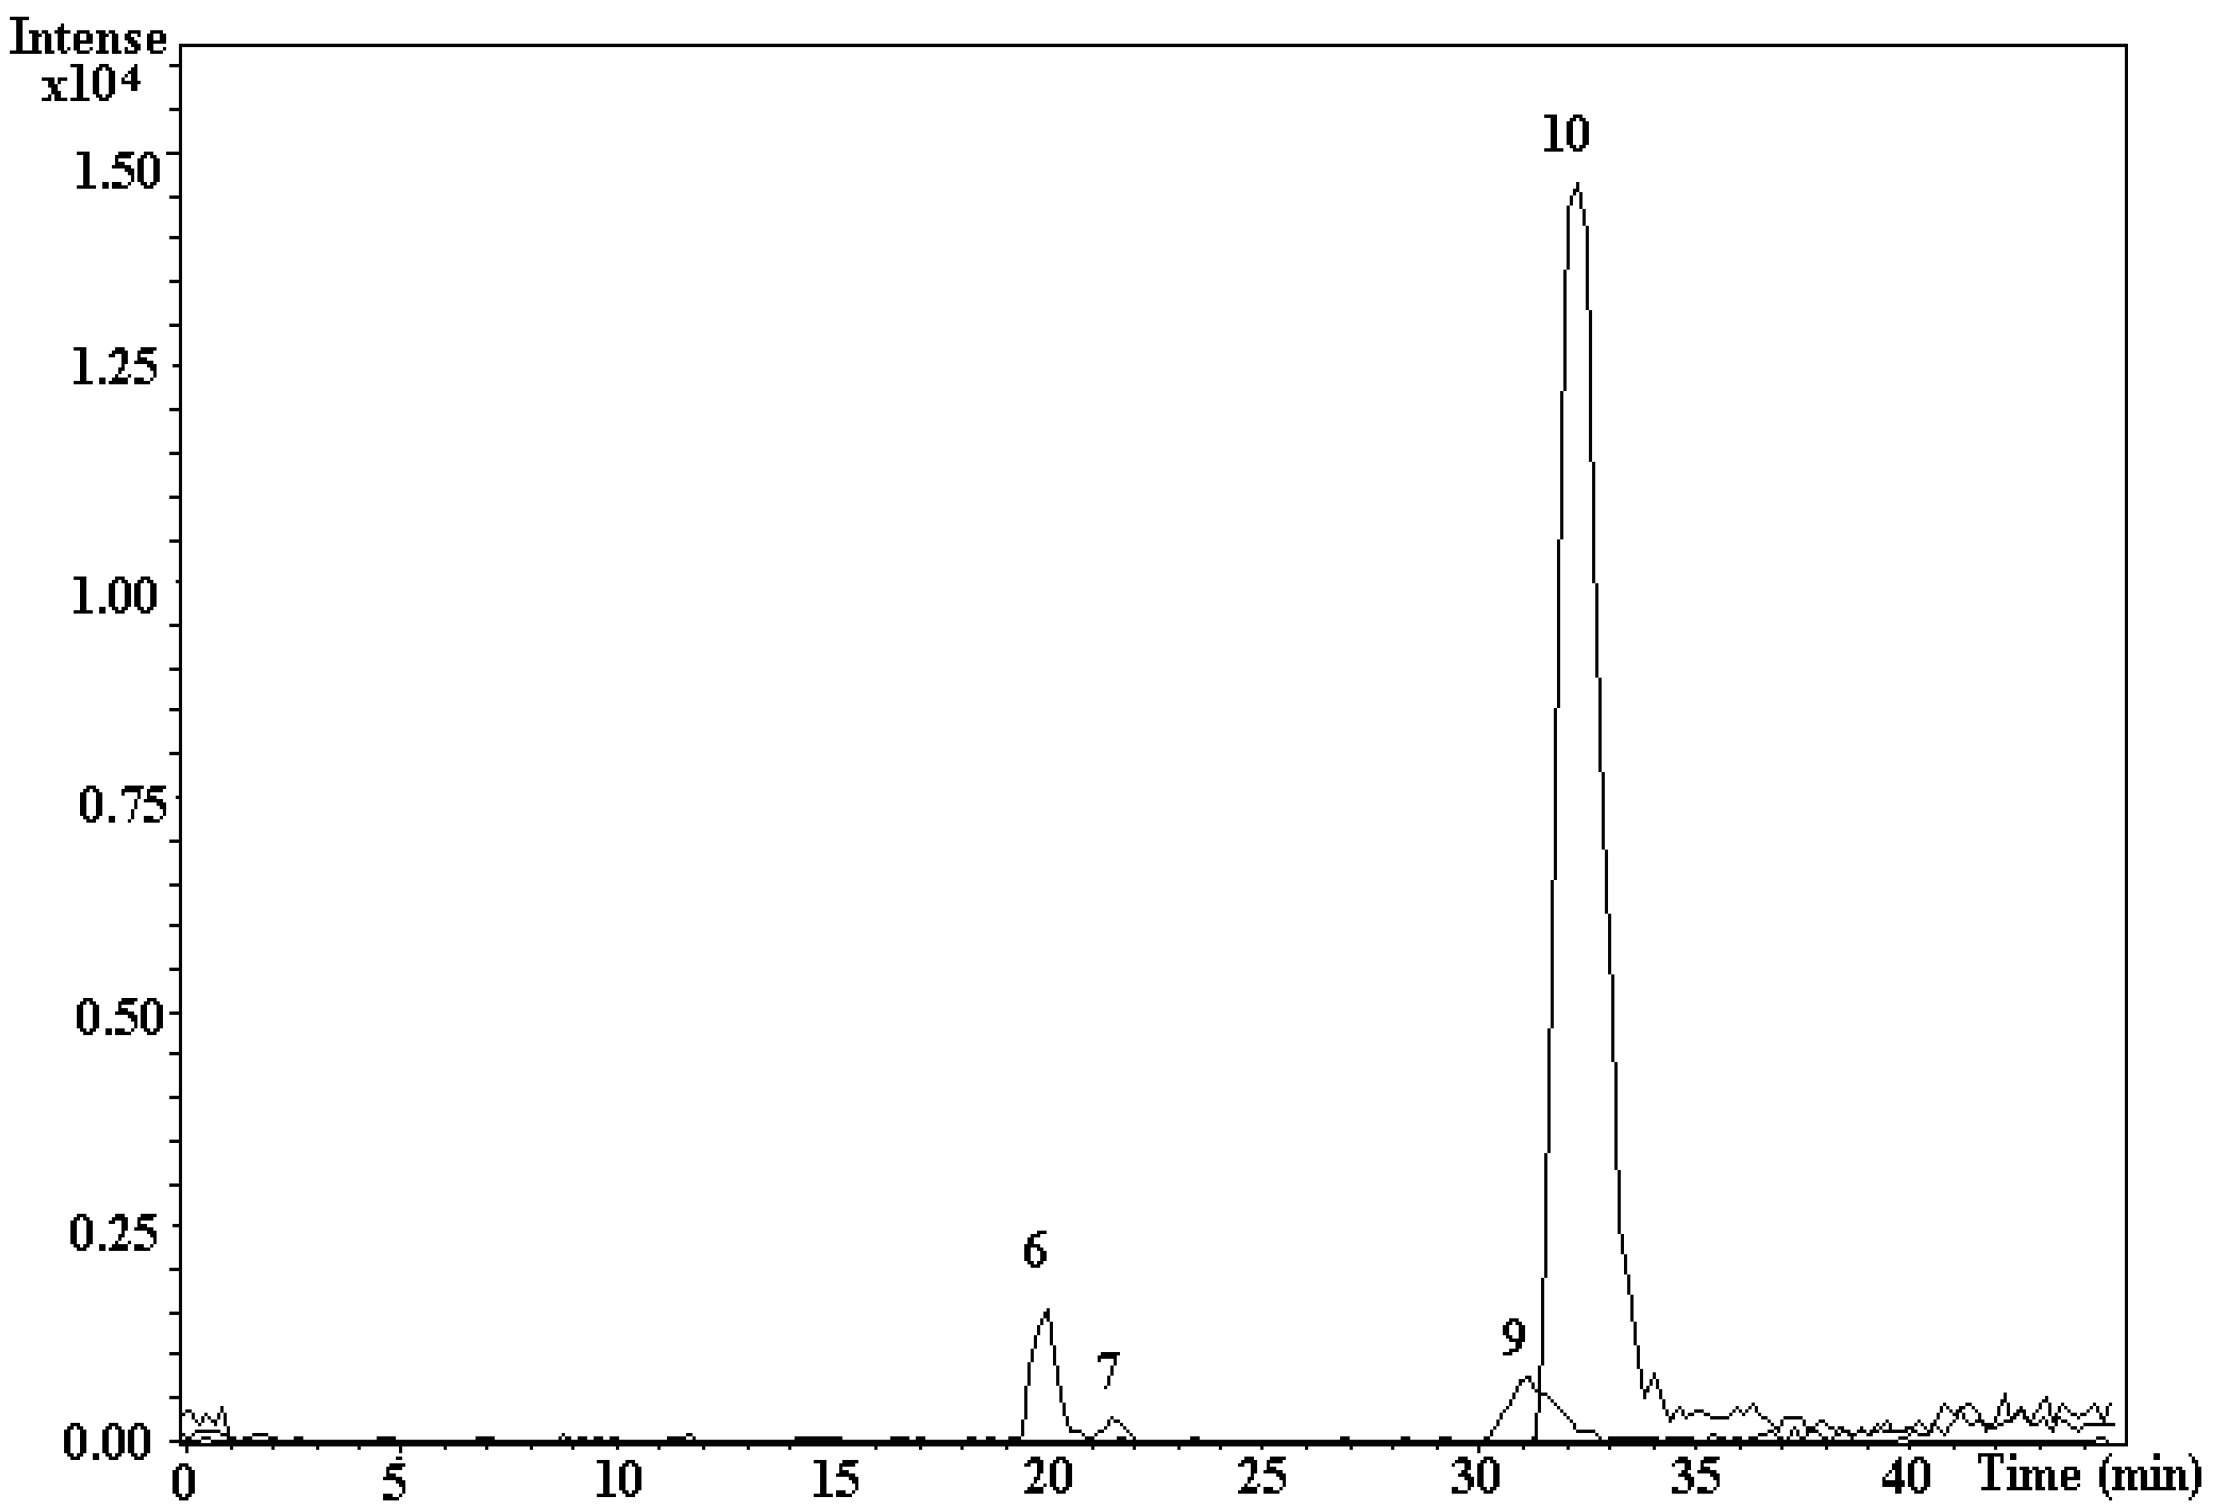
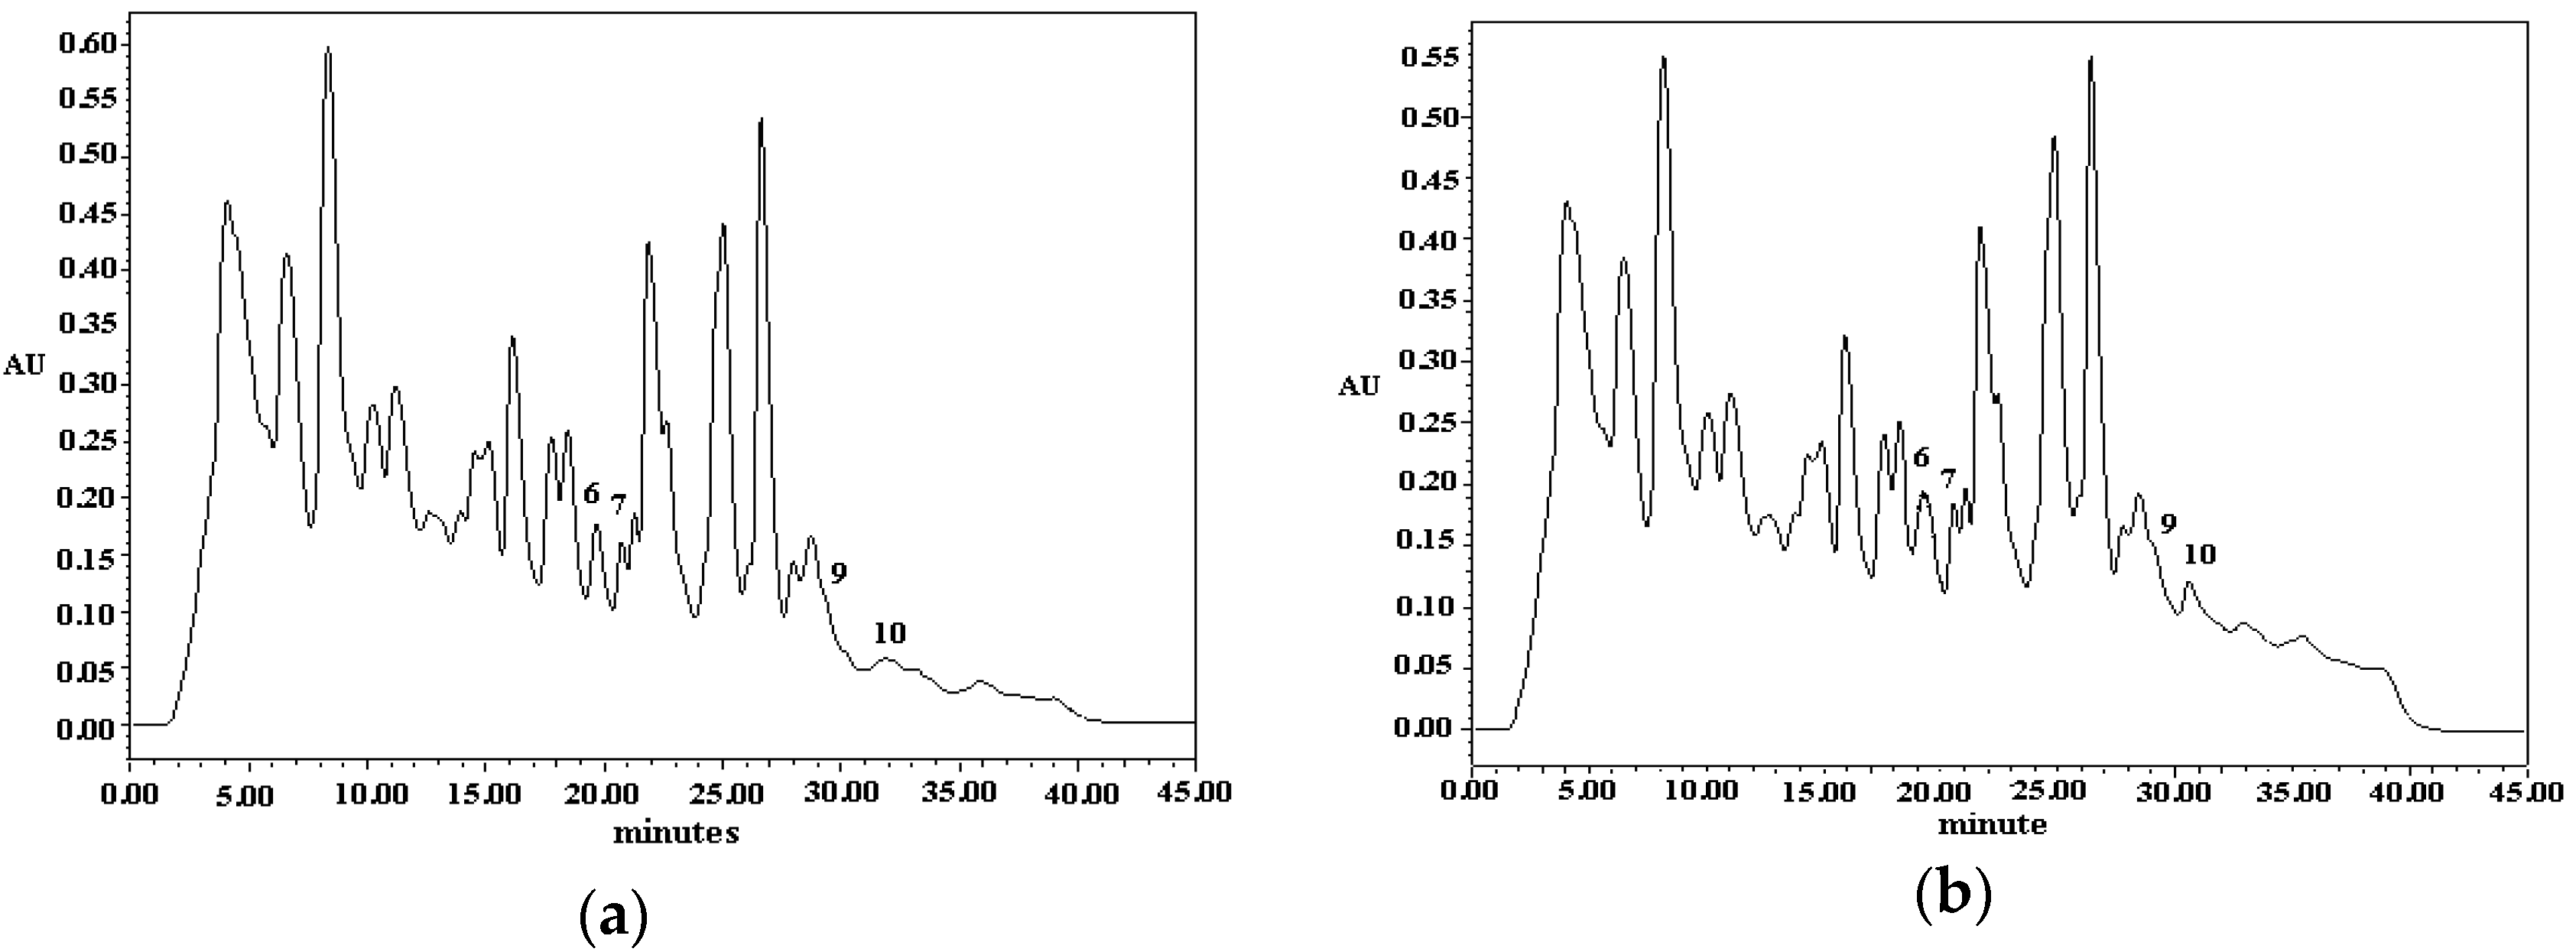
3.4. Analysis of Indole Compounds in Sugar Cane Juice Using HPLC

Under the optimum operating conditions, HPLC method was applied to determinate the various indole compounds present in the sugar cane juice. Typical chromatogram for the sample after SPE was shown in Figure 5a. On the bases of retention times as well as the results obtained by using the standard addition method (Figure 5b), the presence of IAA, 3-acetylindole, IPA, and indole-2-carboxylic acid in the sugar cane juice was successfully identified. The approximate concentrations of IAA, 3-acetylindole, IPA, and indole-2-carboxylic acid in the sugar cane juice, disregarding the loss during the extraction and purification steps, were shown in Table 4. Based on absolute concentration, the major indole compound in sugar cane juice is IAA, the most physiologically active auxin in plants [38]. Furthermore, indole-2-carboxylic acid was successfully identified among five positional isomers (indole-2-carboxylic acid, indole-3-carboxylic acid, indole-4-carboxylic acid, indole-5-carboxylic acid, and indole-6-carboxylic acid). Figure 5a showed possible interferences from the plant matrix during the analytical process. The identity of the analytes of interest for other future application(s), if detected near to the interfering matrix peak(s), could be independently confirmed by LC-MS/MS experiments.

3.5. LC-ESI-MS/MS Measurement

The main aim of the LC-MS/MS investigation was to further confirm the identities of the putative indole compounds found in sugar cane juice using HPLC analysis. The optimized HPLC separation condition was adopted for LC-MS/MS experiment.
Due to the potential high interferences in our HPLC results as shown in Figure 5, LC-MS/MS experiments were carried out to re-confirm the results of HPLC measurement. Based on the findings of four putative indoles using HPLC, IAA, 3-acetylindole, IPA, and indole-2-carboxylic acid were detected without significant interferences from the plant matrix using LC-MS/MS with MRM mode (Figure 6). The estimated concentrations of IAA, 3-acetylindole, IPA, and indole-2-carboxylic acid in the sugar cane juice were 1.14 μM, 4.1 × 10⁻¹ μM, 1.3 × 10⁻¹ μM, and 2.7 × 10⁻¹ μM, based on the LC-MS measurement, respectively, which were similar in the range with values obtained using the HPLC method. The slight variation of the results obtained by HPLC and LC-MS could be due to the impurity affecting the UV peaks, or partially due to the natural variation exhibited by different sugar cane batches. Thus, from the results obtained using the LC-MS/MS investigation, IAA and other three indole compounds were unequivocally found to be present in the sugar cane juice sample, based on retention times with LC analysis and their MRM mass transitions in the LC-MS measurement mode.

3.6. Recovery Study of SPE Procedure

We investigated on the recovery of the SPE procedure by comparing the difference of the obtained analyte concentration in extracted spiked sample (sugar cane juice sample with spiked indole standards) and the extracted blank sample (sugar cane juice sample without spiked indole standards) with the concentration of the spiked analytes in the same volume of blank solution, i.e., ultrapure water.
As estimated in Table 4, the recovery yields of the 10 different indole compounds ranged from 61% to 92%, which was considered reasonably high for a pre-concentration and sample clean-up procedure. Based on the recovery yields and the results of HPLC measurements, the estimated original concentrations of indoles in sugar cane juice were also given in Table 4.

4. Conclusions

This study reported the development and validation of new and relatively simple HPLC and LC-MS/MS methods for the simultaneous analysis of various indole compounds with high detection sensitivity. The separation of the 10 standards, including 5 isomers (indole-2-carboxylic acid, indole-3-carboxylic acid, indole-4-carboxylic acid, indole-5-carboxylic acid, and indole-6-carboxylic acid), was completed in 35 min with well-resolved peaks. Running time was decreased and the separation of different indole compounds was optimized by increasing the strength of the organic solvent. The optimum separation conditions developed in this project will be useful for future studies, as typical separation of different indole compounds including isomers and IAA, being one of the most important auxins in a single analysis was rarely, if not never, reported in the literature.
Furthermore, a new SPE method for the pre-concentration and purification of indole compounds was developed by using C18 SPE columns. The pH of water solution used for the washing step and the composition of eluent were also optimized to achieve higher recovery rates by reducing the effects of the interfering substances in the final extraction.
The effectiveness of the new pre-concentration SPE method and analytical HPLC method was evaluated by screening for the putative indole compounds in sugar cane juice. The presence of indole compounds in sugar cane juice, first detected by HPLC, was further confirmed independently by LC-MS/MS experiments. The results from the HPLC and LC-MS/MS indicated the presence of IAA, 3-acetyindole, IPA, and indole-2-carboxylica acid in sugar cane juice samples. This is also the first report of indole compounds in sugar cane juice. The detection of different indole compounds is valuable in plant science and biomedical science, due to the different important biological functions of these indole compounds. The presence of IAA in sugar cane juice can partially explain why sugar cane juice can be used as a growth supplement in plant tissue culture. The presence of IPA in sugar cane juice can partly confirm the relationship between IAA and IPA. In addition, as IPA has medically useful properties such as bringing relief from anxiety and insomnia [13,14,15,16], sugar cane juice may be a good beverage for people who suffer from sleep related problems. The presence of 3-acetylindole and indole-2-carboxylic acid may provide more potential usage of sugar cane juice besides being the main ingredient for the sugar industry. It is also plausible that some other indole compounds may be present in sugar cane juice, which we were unable to detect due to the current detection limits of current HPLC and LC-MS/MS methods.
Nevertheless, due to the important bioactivities driven by indole compounds, more work should be carried out on indole compounds naturally present in plants. Moving forward, UPLC-TOF-MS analytical approach can also be evaluated in order to develop shorter analytical duration, higher separation resolution, and higher sensitivity for the indole compounds [39]. Furthermore, the outstanding performances provided by core-shell particles column on a traditional HPLC instruments are comparable to those obtained with a costly UPLC instrumentation, making this novel column a promising tool for separation of indole compounds [40]. Also, sugar cane juice can be analyzed for the other bioactive compounds, such as other phytohormones.

Author Contributions

Jean Wan Hong Yong conceived and designed the experiments; Liya Ge set up the experiment and prepared manuscript; Wei San Wong analyzed the data; Zhen Ma performed some experiments; Swee Ngin Tan reviewed the data and revised the manuscript.

Conflicts of Interest

The authors declare no conflict of interest. The founding sponsors had no role in the design of the study; in the collection, analyses, or interpretation of data; in the writing of the manuscript; or in the decision to publish the results.

References

  1. Duarte-Almeida, J.M.; Novoa, A.V.; Linares, A.F.; Lajolo, F.M.; Genovese, M.I. Antioxidant activity of phenolics compounds from sugar cane (Saccharum officinarum L.) juice. Plant Food Hum. Nutr. 2006, 61, 187–192. [Google Scholar] [CrossRef] [PubMed]
  2. McGhie, T.K. Analysis of sugar cane flavonoids by capillary zone electrophoresis. J. Chromatogr. 1993, 634, 107–112. [Google Scholar] [CrossRef]
  3. Naik, G.R. Sugarcane Biotechnology; Agritech Publications: Shrub Oak, NY, USA, 2001. [Google Scholar]
  4. Arditti, J.; Ernst, R. Micropropagation of Orchids; John Wiley & Sons, Inc.: New York, NY, USA, 1993; pp. 47–48. [Google Scholar]
  5. Ang, S.L.P.; Yong, J.W.H. A protocol for in vitro germination and sustainable growth of two tropical mistletoes. Plant Cell Tissue Organ Cult. 2005, 80, 221–228. [Google Scholar] [CrossRef]
  6. Available online: http://en.wikipedia.org/wiki/Indole (accessed on 1 December 2016).
  7. Guerrero, J.R.; Garcia-Ruiz, P.; Sanchez-Bravo, J.; Acosta, J.M.; Arnao, M.B. Quantification of indole-3-acetic acid by LC with electrochemical detection in etiolated hypocotyls of Lupinus Albus. J. Liq. Chromatogr. Relat. Technol. 2001, 24, 3095–3104. [Google Scholar] [CrossRef]
  8. Davies, P.J. Plant Hormones: Biosynthesis, Signal Transduction, Action! Kluwer Academic Publishers: Norwell, MA, USA, 2004. [Google Scholar]
  9. Kende, H.; Zeevarrt, J.A.D. The five “classical” plant hormones. Plant Cell 1997, 9, 1197–1210. [Google Scholar] [CrossRef] [PubMed]
  10. Manulis, S.; Shafrir, H.; Epstein, E.; Lichter, A.; Barash, I. Biosynthesis of indole-3-acetic acid via the indole-3-acetamide pathway in Streptomyces spp. Microbiology 1994, 140, 1045–1050. [Google Scholar] [CrossRef] [PubMed]
  11. Yagi, K.; Matsumoto, T.; Chujo, T.; Nojiri, H.; Omori, T.; Minamisawa, K.; Nishiyama, M.; Yamane, H. Isolation and characterization of low-indole-3-acetic acid-producing mutants from Bradyrhizobium elkanii. Biosci. Biotechnol. Biochem. 2001, 65, 1265–1269. [Google Scholar] [CrossRef] [PubMed]
  12. Pollmann, S.; Neu, D.; Weiler, E. Molecular cloning and characterization of an amidase from Arabidopsis thaliana capable of converting indole-3-acetamide into the plant growth hormone, indole-3-acetic acid. Phytochemistry 2003, 62, 293–300. [Google Scholar] [CrossRef] [Green Version]
  13. Silvestri, R.; Mento, G.; Raffaele, M.; Luca, G.D.; Buttini, G.; Casella, C.; Tisano, A.; Domenico, P.D.; Rosa, A.D.; Perri, R.D. Indole-3-pyruvic acid as a possible hypnotic agent in insomniac subjects. J. Int. Med. Res. 1991, 19, 403–409. [Google Scholar] [CrossRef] [PubMed]
  14. Lapin, I.P.; Politi, V. Anxiolytic effect of indole-3-pyruvic acid (IPA) in mice. Pharmacol. Res. 1993, 28, 129–134. [Google Scholar] [CrossRef] [PubMed]
  15. Politi, V.; Deluca, G.; Gallai, V.; Puca, O.; Comin, M. Clinical experiences with the use of indole-3-pyruvic acid. Adv. Exp. Med. Biol. 1999, 467, 227–232. [Google Scholar] [PubMed]
  16. Bartolini, B.; Corniello, C.; Sella, A.; Somma, F.; Politi, V. The enol tautomer of indole-3-pyruvic acid as a biological switch in stress responses. Adv. Exp. Med. Biol. 2003, 527, 601–608. [Google Scholar] [PubMed]
  17. Kaminski, R.; Wolinska, E.; Gasior, M.; Kleinrok, Z.; Czuczwar, S.J. NMDA receptor glycine site antagonist (indole-2-carboxylic acid) enhances the anticonvulsive activity of antiepileptic drugs. Neurosci. Res. Commun. 1998, 22, 137–145. [Google Scholar] [CrossRef]
  18. Stetinova, V.; Smetanova, L.; Grossmann, V.; Anzenbacher, P. In vitro and in vivo assessment of the antioxidant activity of melatonin and related indole derivatives. Gen. Physiol. Biophys. 2002, 21, 153–162. [Google Scholar] [PubMed]
  19. Rajendra, N.G.; Aditi, S. Oxidation chemistry of indole-2-carboxylic acid: Mechanism and products formed in neutral aqueous solution. Electrochim. Acta 2004, 50, 2135–2143. [Google Scholar]
  20. Rani, P.; Srivastava, V.K.; Kumar, A. Synthesis and antiinflammatory activity of heterocyclic indole derivatives. Eur. J. Med. Chem. 2004, 39, 449–452. [Google Scholar] [CrossRef] [PubMed]
  21. Siatra-Papastaikoudi, T.; Tsotinis, A.; Raptopoulou, C.; Sambani, C.; Thomou, H. Synthesis of new alkylaminoalkyl thiosemicarbazones of 3-acetylindole and their effect on DNA synthesis and cell proliferation. Eur. J. Med. Chem. 1995, 30, 107–114. [Google Scholar] [CrossRef]
  22. Moussata, J.; Wang, Z.; Wang, J. Development and validation of an HPLC method for the simultaneous quantification of indole-3-carbinol acetate, indole-3-carbinol, and 3,3′-diindolylmethane in mouse plasma, liver, and kidney tissues. J. Chromatogr. B Anal. Technol. Biomed. Life Sci. 2014, 958, 1–9. [Google Scholar]
  23. Gomez, F.J.V.; Hernández, I.G.; Cerutti, S.; Silva, M.F. Solid phase extraction/cyclodextrin-modified micellar electrokinetic chromatography for the analysis of melatonin and related indole compounds in plants. Microchem. J. 2015, 123, 22–27. [Google Scholar] [CrossRef]
  24. Grunwald, C.; Lockard, R.G. Analysis of indole acid derivatives by gas chromatography using liquid phase OV-101. J. Chromatogr. A 1970, 52, 491–493. [Google Scholar] [CrossRef]
  25. Gallagher, C.A.; Hough, L.B.; Keefner, S.M.; Seyed-Mozaffari, A.; Archer, S.; Glick, S.D. Identification and quantification of the indole alkaloid ibogaine in biological samples by gas chromatography-mass spectrometry. Biochem. Pharmacol. 1995, 49, 73–79. [Google Scholar] [CrossRef]
  26. Müller, A.; Düchting, P.; Weiler, E. A multiplex GC-MS/MS technique for the sensitive and quantitative single-run analysis of acidic phytohormones and related compounds, and its application to Arabidopsis thaliana. Planta 2002, 216, 44–56. [Google Scholar] [CrossRef] [PubMed]
  27. Ludwig-Müller, J.; Georgiev, M.; Bley, T. Metabolite and hormonal status of hairy root cultures of Devil’s claw (Harpagophytum procumbens) in flasks and in a bubble column bioreactor. Process Biochem. 2008, 43, 15–23. [Google Scholar] [CrossRef]
  28. Tan, S.N.; Yong, J.W.H.; Ge, L. Analyses of phytohormones in coconut (Cocos Nucifera L.) water using capillary electrophoresis-tandem mass spectrometry. Chromatography 2014, 1, 211–226. [Google Scholar] [CrossRef]
  29. Fei, X.Q.; Li, C.; Yu, X.D.; Chen, H.Y. Determination of heterocyclic amines by capillary electrophoresis with UV-DAD detection using on-line preconcentration. J. Chromatogr. B 2007, 854, 224–229. [Google Scholar] [CrossRef] [PubMed]
  30. Graffeo, A.P.; Karger, B.L. Analysis for indole compounds in urine by high-performance liquid chromatography with fluorometric detection. Clin. Chem. 1976, 22, 184–187. [Google Scholar] [PubMed]
  31. Hanna, M.; Alicja, K.; Ksenia, P. Determination of indole-3-acetic acid in the Gulf of Gdańsk by high-performance liquid chromatography of its 4-methyl-7-methoxycoumarin derivative. J. Chromatogr. A 1997, 766, 261–266. [Google Scholar]
  32. Matsuda, F.; Miyazawa, H.; Wakasa, K.; Miyagawa, H. Quantification of indole-3-acetic acid and amino acid conjugates in rice by liquid chromatography-electrospray ionization-tandem mass spectrometry. Biosci. Biotechnol. Biochem. 2005, 69, 778–783. [Google Scholar] [CrossRef] [PubMed]
  33. Verheyden, K.; Noppe, H.; Aluwé, M.; Millet, S.; Bussche, J.V.; Brabander, H.F.D. Development and validation of a method for simultaneous analysis of the boar taint compounds indole, skatole and androstenone in pig fat using liquid chromatography-multiple mass spectrometry. J. Chromatogr. A 2007, 1174, 132–137. [Google Scholar] [CrossRef] [PubMed]
  34. Mattivi, F.; Vrhovsek, U.; Versini, G. Determination of indole-3-acetic acid, tryptophan and other indoles in must and wine by high-performance liquid chromatography with fluorescence detection. J. Chromatogr. A 1999, 855, 227–235. [Google Scholar] [CrossRef]
  35. Gerasimenko, I.; Sheludko, Y.; Unger, M.; Stöckigt, J. Development of an efficient system for the separation of indole alkaloids by high performance liquid chromatography and its applications. Phytochem. Anal. 2001, 12, 96–103. [Google Scholar] [CrossRef] [PubMed]
  36. Yusof, S.; Shian, L.S.; Osman, A. Changes in quality of sugar-cane juice upon delayed extraction and storage. Food Chem. 2000, 68, 395–401. [Google Scholar] [CrossRef]
  37. Ma, Z.; Ge, L.; Lee, A.S.Y.; Yong, J.W.H.; Tan, S.N.; Ong, E.S. Simultaneous analysis of different classes of phytohormones in coconut (Cocos nucifera L.) water using high-performance liquid chromatography and liquid chromatography-tandem mass spectrometry after solid-phase extraction. Anal. Chim. Acta 2008, 610, 274–281. [Google Scholar] [CrossRef] [PubMed]
  38. Frankenberger, W.T.; Arshad, M. (Eds.) Phytohormones in Soils: Microbial Production and Function; Marcel Dekker, Inc.: New York, NY, USA, 1995; pp. 17–136.
  39. Sun, J.; Baker, A.; Chen, P. Profiling the indole alkaloids in yohimbe bark with ultra-performance liquid chromatography coupled with ion mobility quadrupole time-of-flight mass spectrometry. Rapid Commun. Mass Spectrom. 2011, 25, 2591–2602. [Google Scholar] [CrossRef] [PubMed]
  40. Preti R. Core-shell columns in high-performance liquid chromatography: Food analysis applications. Int. J. Anal. Chem. 2016, 2016, 1–9. [Google Scholar] [CrossRef] [PubMed]
Figure 1. Chemical structures of the 10 indole compounds.
Separations 04 00007 g001
Figure 2. HPLC chromatogram of standard mixture of indole compounds (50 µM for each compound) at 280 nm. Peak identities: 1, indole-3-acetic hydrazide; 2, acetamide; 3, indole-4-carboxylic acid; 4, indole-5-carboxylic acid; 5, indole-3-carboxylic acid; 6, IAA; 7, 3-acetylindole; 8, indole-6-carboxylic acid; 9, indole-3-pyruvic acid; 10, indole-2-carboxylic acid. Note: Injection volume was 5 μL. HPLC running conditions were described in Section 2.2 and Section 3.1.
Separations 04 00007 g002
Figure 3. The effects of different methanol and water composition (a) in eluting solution, different pH values of water (b) used in conditioning and washing steps which were adjusted by formic acid, on the recoveries of indole compounds using C18 SPE columns.
Separations 04 00007 g003
Figure 4. Pre-concentration procedure for indoles in sugar cane juice by SPE C18 cartridge.
Separations 04 00007 g004
Figure 5. HPLC chromatograms of (a) sugar cane juice extracts; (b) spiked sugar cane juice extracts by IAA, 3-acetylindole, IPA and indole-2-carboxylic acid at 280 nm. Note: Injection volume was 10 μL. Sugar cane juice extracts were purified earlier using C18 SPE column (Section 2.5). HPLC running conditions and peak identities were the same as described in Figure 2.
Separations 04 00007 g005
Figure 6. MRM chromatograms of putative four indoles in sugar cane juice by LC-MS/MS method. The LC-MS running conditions were described in Section 2.3.
Separations 04 00007 g006
Table 1. MRM transition result of 10 indole compounds.
Indole CompoundsMRM Transition (m/z)
Indole-2-carboxylic acid160→115
Indole-3-carboxylic acid160→115
Indole-4-carboxylic acid160→115
Indole-5-carboxylic acid160→115
Indole-6-carboxylic acid160→115
Indole-3-acetic acid (IAA)173→129
Indole-3-acetic hydrazide188→115
Indole-3-acetamide (IAM)173→129
Indole-3-pyruvic acid (IPA)202→157
3-acetylindole158→115
Table 2. Response characteristics of indole compound standards using HPLC.
Indole CompoundsRetention Times aPeak Area aEquation of Calibration Curve bR2Linear Range (μM)LOQ (μM) c
Mean (min)RSD (%)Mean (μAu·s)RSD (%)
Indole-3-acetic hydrazide4.8270.1011,3626.0y = 31.8x + 9717.10.99825–2001.09
Indole-3-acetamide8.4320.08290,5510.4y = 6231.3x − 9126.40.99912.5–2000.08
Indole-4-carboxylic acid11.3310.15135,4911.5y = 2920.1x − 136710.98912.5–2001.64
Indole-5-carboxylic acid14.5740.17333,5760.7y = 7086.2x − 14788.30.99912.5–2001.50
Indole-3-carboxylic acid16.7230.18545,3070.6y = 11269.9x − 13352.60.99912.5–2001.34
Indole-3-acetic acid19.3580.19284,6000.3y = 5999.5x − 13144.30.99912.5–2001.15
3-acetylindole20.8670.18398,8481.0y = 8465.8x − 13598.70.99912.5–2001.49
Indole-6-carboxylic acid24.6590.24589,4921.7y = 12959x − 17287.80.99212.5–2001.48
Indole-3-pyruvic acid29.6370.22208,4082.8y = 5459.3x − 61613.20.99612.5–2001.72
Indole-2-carboxylic acid31.0440.21615,5290.2y = 13249.1x − 35713.80.99912.5–2000.11
a The data were measured with repeated injections (n = 6) of a mixture of indole standards at a concentration of 50 μM each; b In the calibration equation, x represents concentration of the analyte (μM) and y represents the peak area (μAu· s); c The LOQ were estimated based on S/N = 10.
Table 3. Precision of 10 indole compounds for retention time (tR) and peak area (pa) expressed as RSDs (%).
Indole CompoundsIntra-Day Variability aInter-Day Variability d
RSD (tR b %) RSD (pa c %)RSD (tR %)RSD (pa %)
Indole-3-acetic hydrazide0.106.00.127.1
Indole-3-acetamide0.080.40.091.3
Indole-4-carboxylic acid0.151.50.161.5
Indole-5-carboxylic acid0.170.70.192.1
Indole-3-carboxylic acid0.180.60.191.6
Indole-3-acetic acid0.190.30.200.9
3-acetylindole0.181.00.201.2
Indole-6-carboxylic acid0.241.70.251.9
Indole-3-pyruvic acid0.222.80.231.4
Indole-2-carboxylic acid0.210.20.230.8
a The intra-day variation was determined by analyzing in triplicate the same standard mixtures (50 µM for each indole compound) dissolved in methanol solution for six times within one day; b The retention time; c The peak area; d The inter-day variation was investigated by analyzing in triplicate the same standards mixtures (50 µM for each indole compound) for three consecutive days and repeated one week later.
Table 4. Estimated concentrations of 10 indoles in sugar cane juice, recoveries of 10 indoles for SPE procedure and estimated original concentrations of 10 indoles in sugar cane juice.
Indole CompoundsEstimated Concentrations (µM)Recovery (%)Estimated Original Concentrations (µM)
Indole-3-acetic hydraziden.d.92%Below 1.18
Indole-3-acetamiden.d.80%Below 0.10
Indole-4-carboxylic acidn.d.79%Below 2.08
Indole-5-carboxylic acidn.d.65%Below 2.31
Indole-3-carboxylic acidn.d.78%Below 1.72
Indole-3-acetic acid1.05 ± 0.2368%1.54 ± 0.34
3-acetylindole0.57 ± 0.1162%0.92 ± 0.18
Indole-6-carboxylic acidn.d.87%Below 1.70
Indole-3-pyruvic acid0.21 ± 0.0861%0.34 ± 0.13
Indole-2-carboxylic acid0.34 ± 0.1782%0.41 ± 0.21
n.d.: not detected.

