Article

Determination of the Three Main Components of the Grapevine Moth Pest Pheromone in Grape-Related Samples by Headspace-Gas Chromatography-Mass Spectrometry

by
María Del Carmen Alcudia-León
*,
Mónica Sánchez-Parra
,
Rafael Lucena
and
Soledad Cárdenas
Departamento de Química Analítica, Instituto de Química Fina y Nanoquímica IUIQFN, Universidad de Córdoba, Campus de Rabanales, Edificio Marie Curie (anexo), E-14071 Córdoba, Spain
*
Author to whom correspondence should be addressed.
Separations 2017, 4(4), 31; https://doi.org/10.3390/separations4040031
Submission received: 25 September 2017 / Revised: 22 October 2017 / Accepted: 24 October 2017 / Published: 27 October 2017
(This article belongs to the Special Issue Chromatographic Techniques for Food and Environmental Samples)

Abstract

:
The grapevine moth (Lobesia botrana) is the most significant pest of viticulture. This article reports the development of an analytical method that allows the instrumental determination of the three main pheromone components of the pest ((E,Z)-7,9-dodecadien-1-yl acetate, (E,Z)-7,9-dodecadien-1-ol and (Z)-9-dodecen-1-yl acetate) in grape-related samples (must, table grape and wine grape). The combination of headspace, gas chromatography and mass spectrometry provides limits of detection in the range of 60–420 ng/Kg and precision, expressed as a relative standard deviation, better than 8.5%. This analytical approach is rapid and simple and opens a door to the study of the pest incidence on the final products.

1. Introduction

The grapevine moth, Lobesia botrana Lepidoptera: Tortricidae, is the main grape pest in the Mediterranean basin [1]. Pest damage is mainly caused by larvae feeding on grapes, which leads to fungal colonization of wounds and fruit rot [2]. In Europe, the management of grape wine moth has relied primarily on the timing of conventional insecticides [3,4,5]. Pesticides in agriculture have a negative public perception as they increase the risk of environmental damage [6,7,8]. This has generated a demand for less harmful protection strategies as an alternative to traditional pest control [9].
Reliable monitoring systems and selective means of pest control are two prerequisites of integrated pest management. Insect pheromones have achieved a reputation in both areas. During the past few decades, sex pheromones and related attractants for hundreds of insect species, mostly of the order Lepidoptera, have been characterized. As a result of these studies, monitoring traps for numerous agricultural pests have been made available to growers and advisory services.
The main component of the grapevine moth sexual pheromone was identified as (E,Z)-7,9-dodecadien-1-yl acetate [10,11]. Two related compounds, (E,Z)-7,9-dodecadien-1-ol and (Z)-9-dodecen-1-yl acetate, were later discovered in the female sex pheromone gland and found to have a synergistic effect on the male catches [12]. These findings were crucial for the application of pheromone-based control and monitoring techniques. In fact, mating disruption is currently the most successful and widespread technique for controlling the moth in Europe. It is based on the use of a high concentration of the main component of the female pheromone to confuse the male and thus avoid mating [13]. In addition, sex pheromone-baited traps were developed for monitoring the L. botrana population, playing an important role in pest detection and treatment timing.
Pheromone determinations have been employed for different purposes [14,15,16] including the detection of insects [17]. In this sense, our research group has developed some analytical approaches for the detection of the major components of the Tuta absoluta pheromone in tomato, water and air [18,19] and the main component of the Bactrocera oleae pheromone in olives [20]. The same basic configuration is proposed in this article to identify the three components of the Lobesia botrana pheromone in grape-related samples. All of the variables involved in the extraction process have been considered in depth. Once optimized, the method was characterized in terms of linearity, sensitivity and precision, being finally applied to the identification and quantification of the three main components of the pheromone in grape samples and must. To the best of our knowledge, this is the first analytical methodology that achieves the instrumental determination of the presence of the pheromone components of grapevine moth pest in grape-related samples.

2. Materials and Methods

2.1. Reagents and Samples

All chemicals used were of analytical grade or better (purity > 99%). Major components of sex pheromone of grapevine moth (Lobesia botrana): (E,Z)-7,9-dodecadien-1-ol (component A), (E,Z)-7,9-dodecadien-1-yl acetate (component B) and (Z)-9-dodecen-1-yl acetate (component C), were purchased from Sociedad Española de Desarrollos Químicos, S.L. (Barcelona, Spain). Stock standard solutions of each analyte were prepared in methanol (Scharlab, Barcelona, Spain) at a concentration of 5 g/L and stored at 4 °C. A working solution containing the three components of pheromone was daily prepared by dilution of the stocks with methanol.
Different samples, including table grapes, wine grapes and must were considered in this study. All the samples were purchased at local markets. Grapes used for making white (“Moscatel” variety) and red (“Cabernet sauvignom” variety) wines in Córdoba (Andalusia, Spain) were included in this study. Unwashed fresh grape samples (stored at 4 °C) were ground and homogenized using a blender (UltraTurraz) for 2 min at ambient temperature. The treated sample was then placed in 100 mL vials and frozen at −18 °C until its analysis.

2.2. HS-GC-MS Analysis

Headspace analyses were performed on a MPS2 32-space headspace autosampler (Gerstel, Mülhein, and der Ruhr, Germany) including a robotic arm and an oven. An automated injector fitted with a 2.5 mL gastight HS-syringe (heated at 80 °C) was used for the introduction of 2.5 mL of homogenized headspace from the vial into the HP6890 gas chromatograph (Agilent, Palo Alto, CA, USA) equipped with an HP5973 mass spectrometric detector based on a quadrupole analyzer and an electron multiplier detector. System control and data acquisition were achieved with an HP1701CA MS ChemStation software.
The gas chromatograph was equipped with an HP5MS fused silica capillary column (30 m × 0.25 mm i.d.) coated with 5% phenylmethyl-polysiloxane (film thickness 0.25 μm; Agilent, Palo Alto, CA, USA). The column oven was initially held at 40 °C for 2 min, raised to 200 °C at a rate of 10 °C/min and finally raised to 300 °C at 50 °C/min and maintained for 2 min. The mass spectrometer detector operated in selection monitoring mode recording the following m/z fragment-ions in a single window: 67, 68 and 79. Electron impact ionization (70 eV) was used for analytes fragmentation. The injector, MS source, and quadrupole temperatures were kept at 270, 230, and 150 °C, respectively. The peak areas were used for quantification of the individual analytes.

2.3. Analytical Procedure

Aliquots of 6 g of ground samples (grapes or must) were accurately weighed in 10 mL headspace vials and 0.6 g of NaCl were added. Then, the vials were hermetically sealed with a silicone septum and placed into the autosampler. The robotic arm took each vial from the tray and transferred it into the oven where samples were heated at 80 °C for 30 min under mechanical stirring (750 rpm) to ensure the equilibration of the analytes between the two phases. Then, 2.5 mL of the gaseous phase were sampled by the gas-tight syringe (heated at 80 °C) and injected into the gas chromatograph/mass spectrometer, where the separation and identification/quantification of the analytes took place.

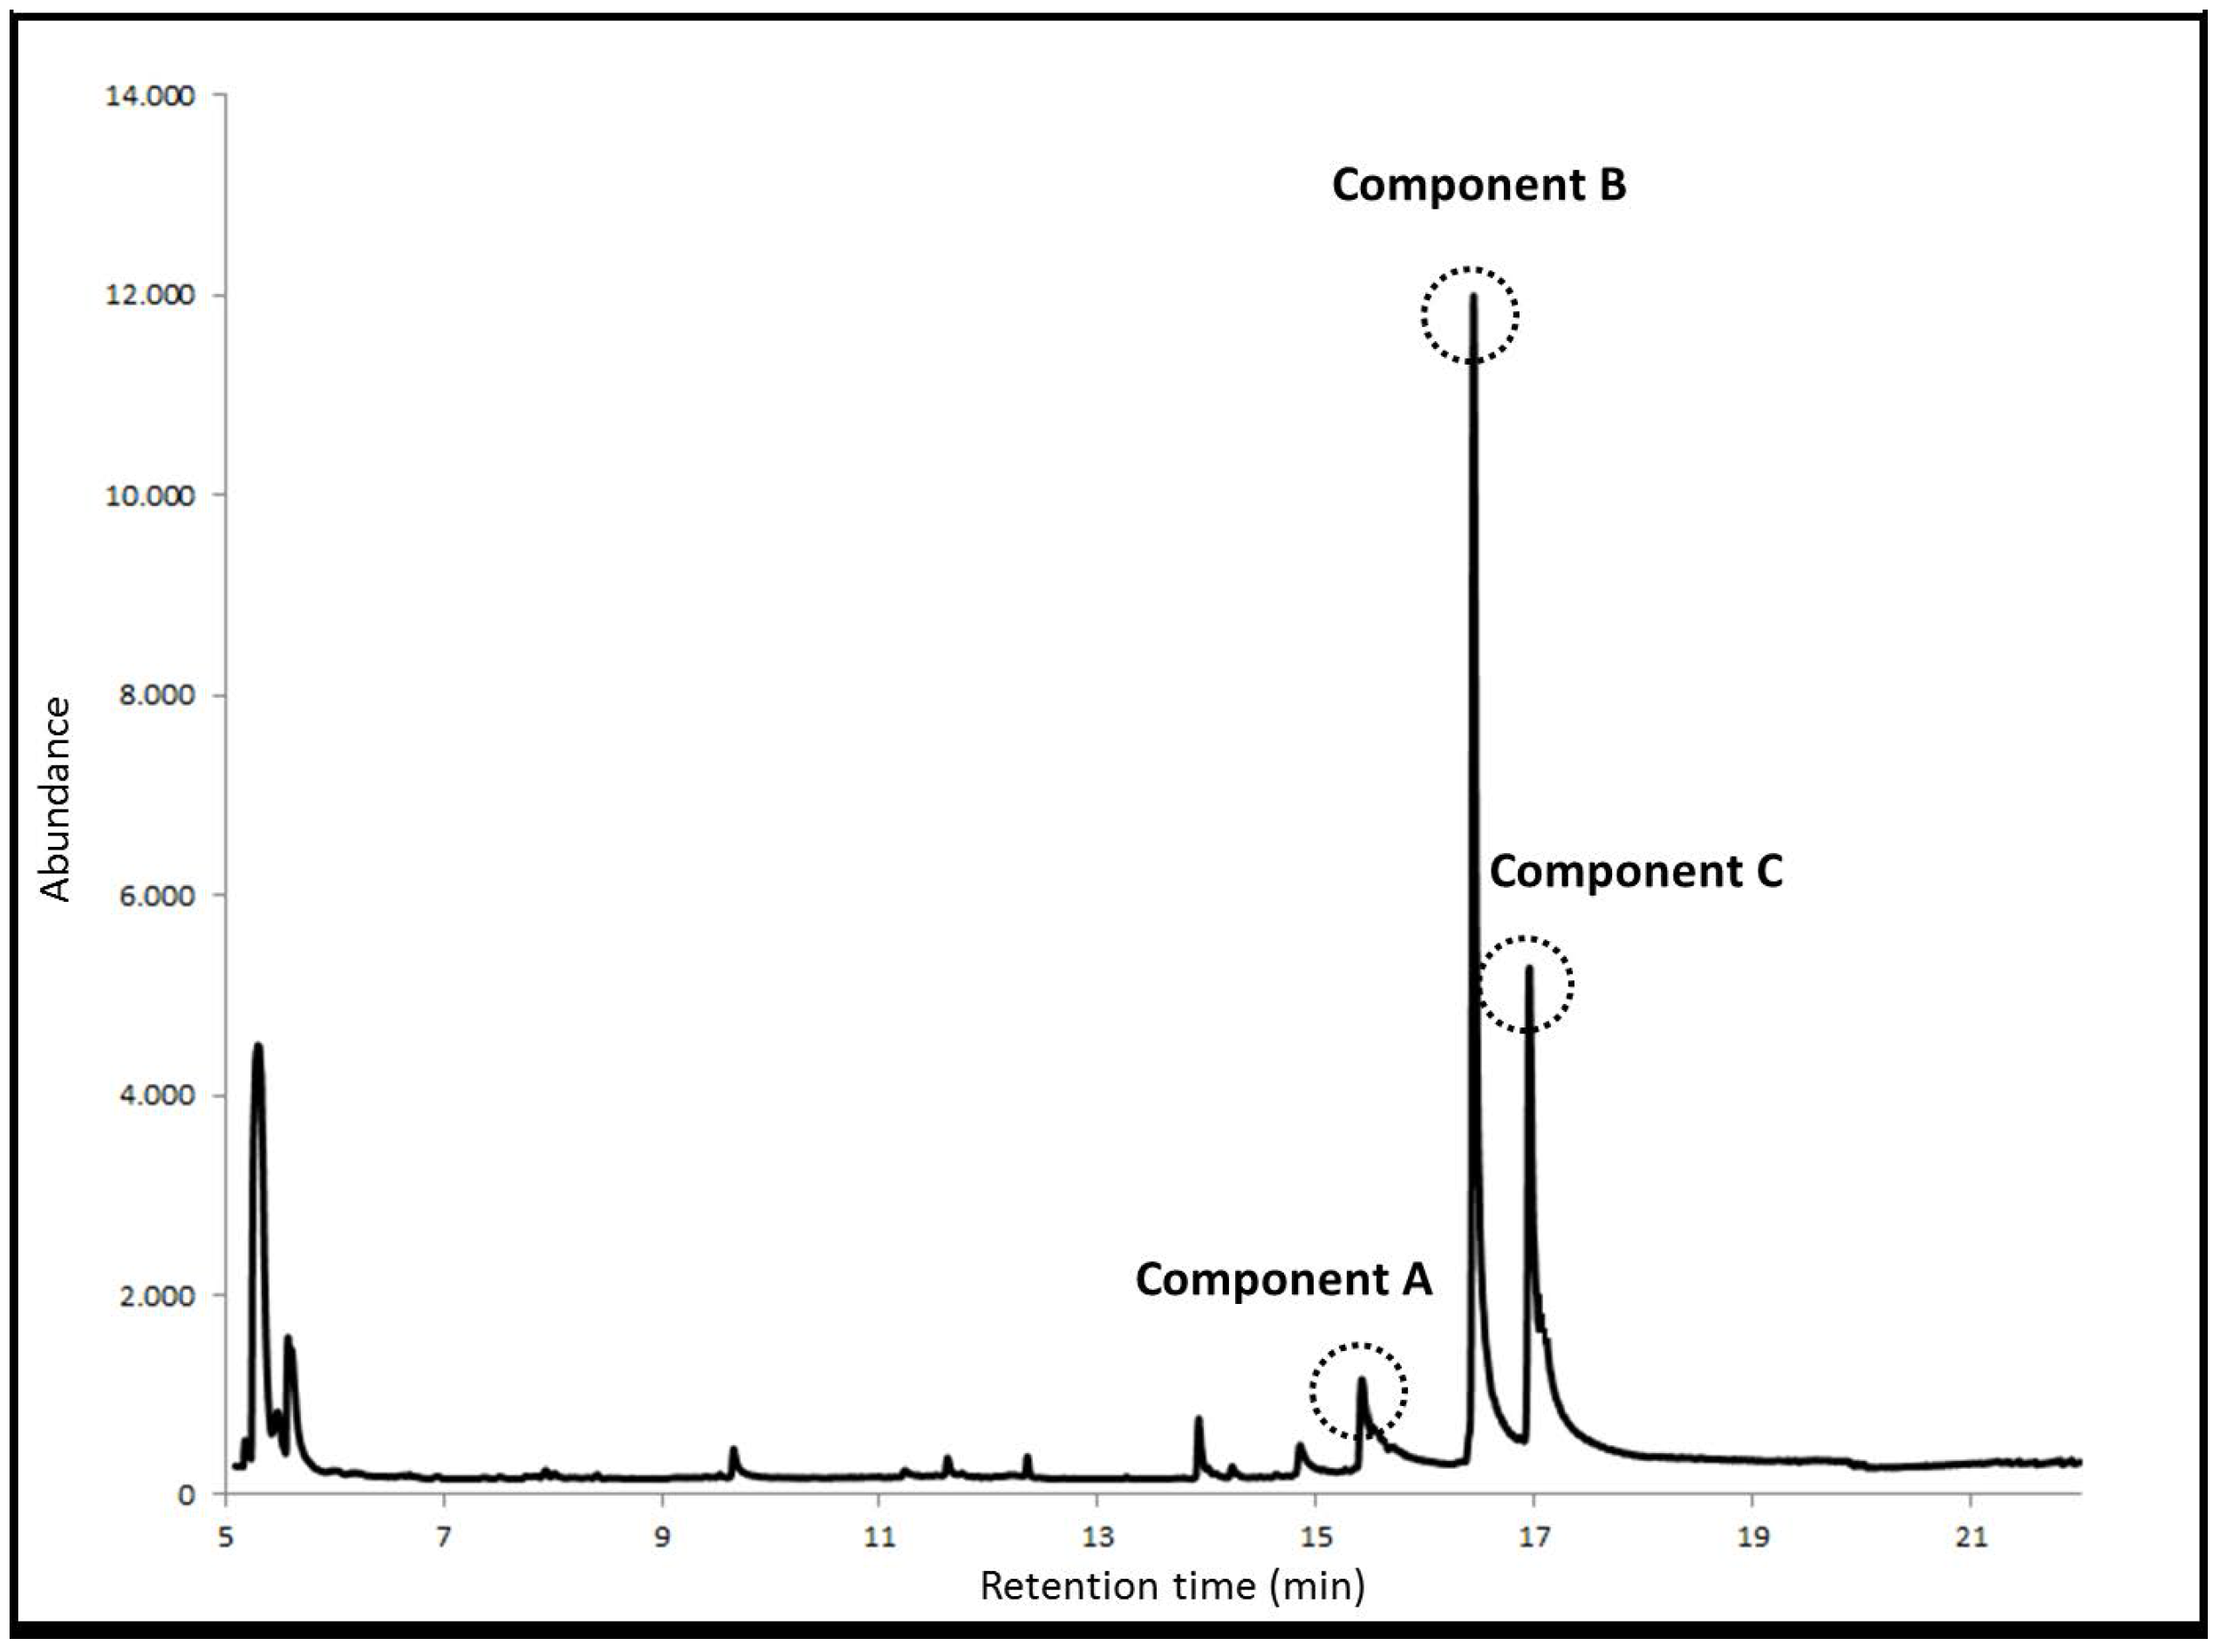
3. Results and Discussion

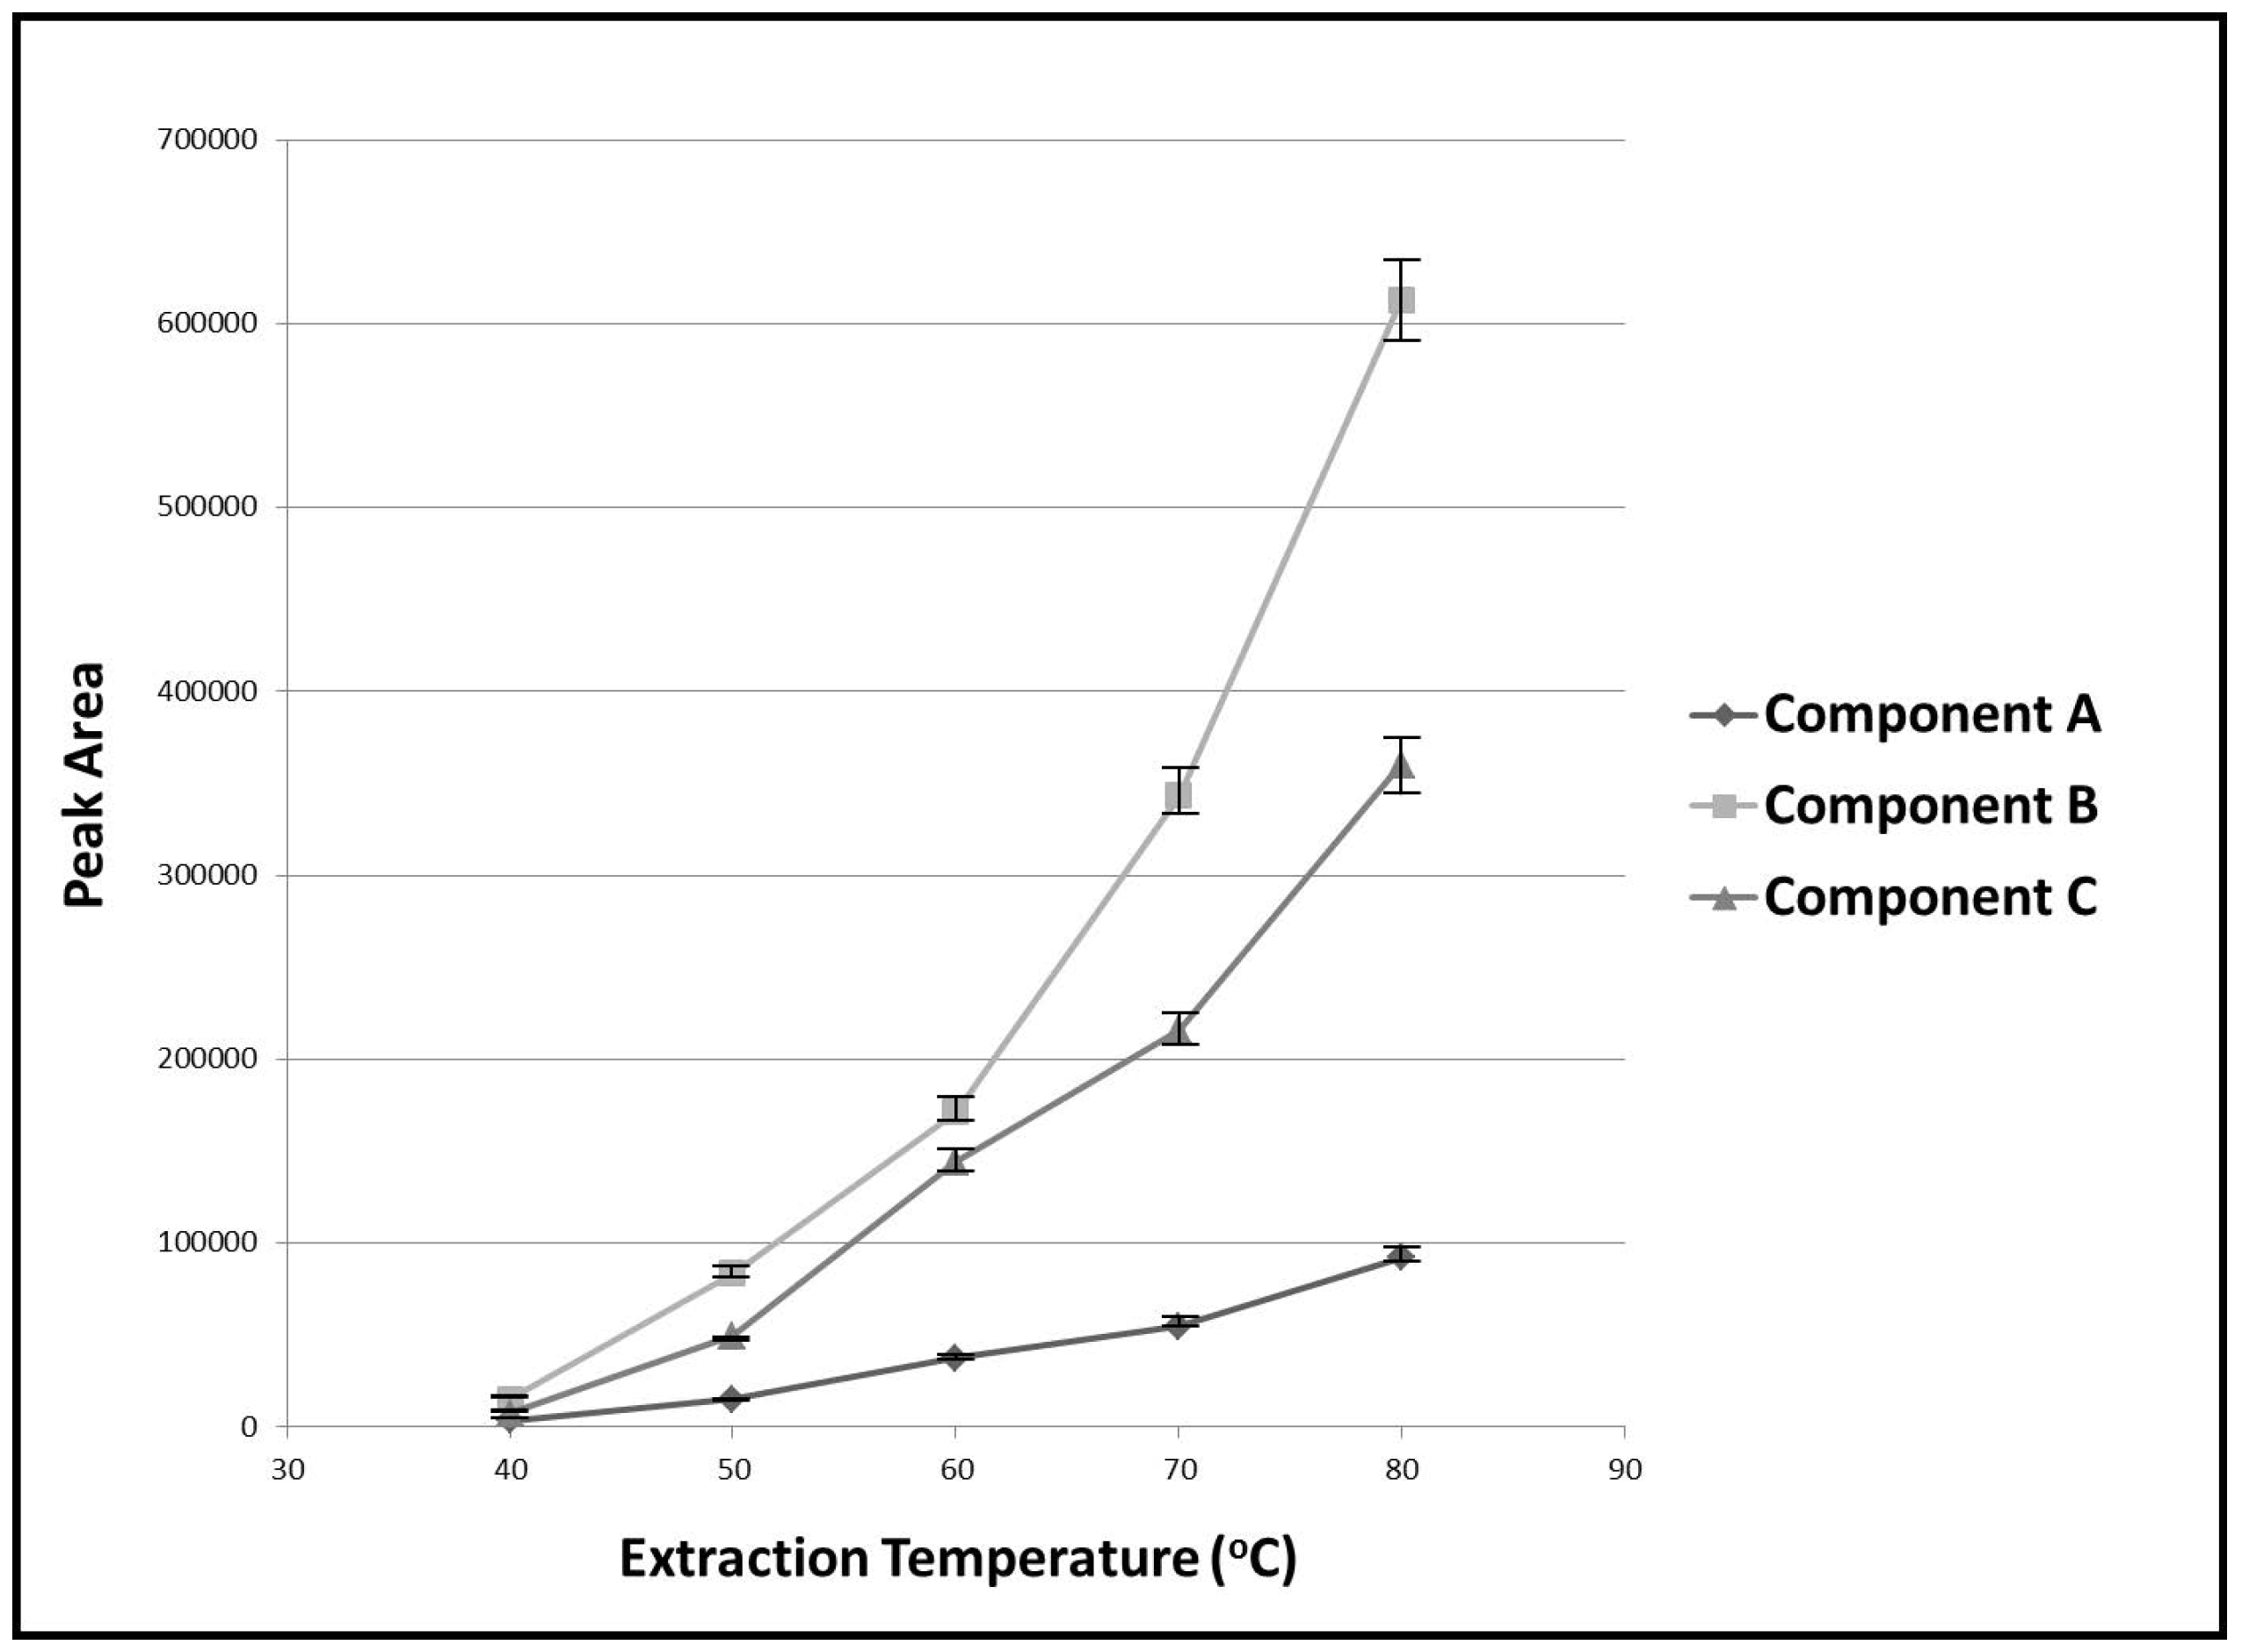
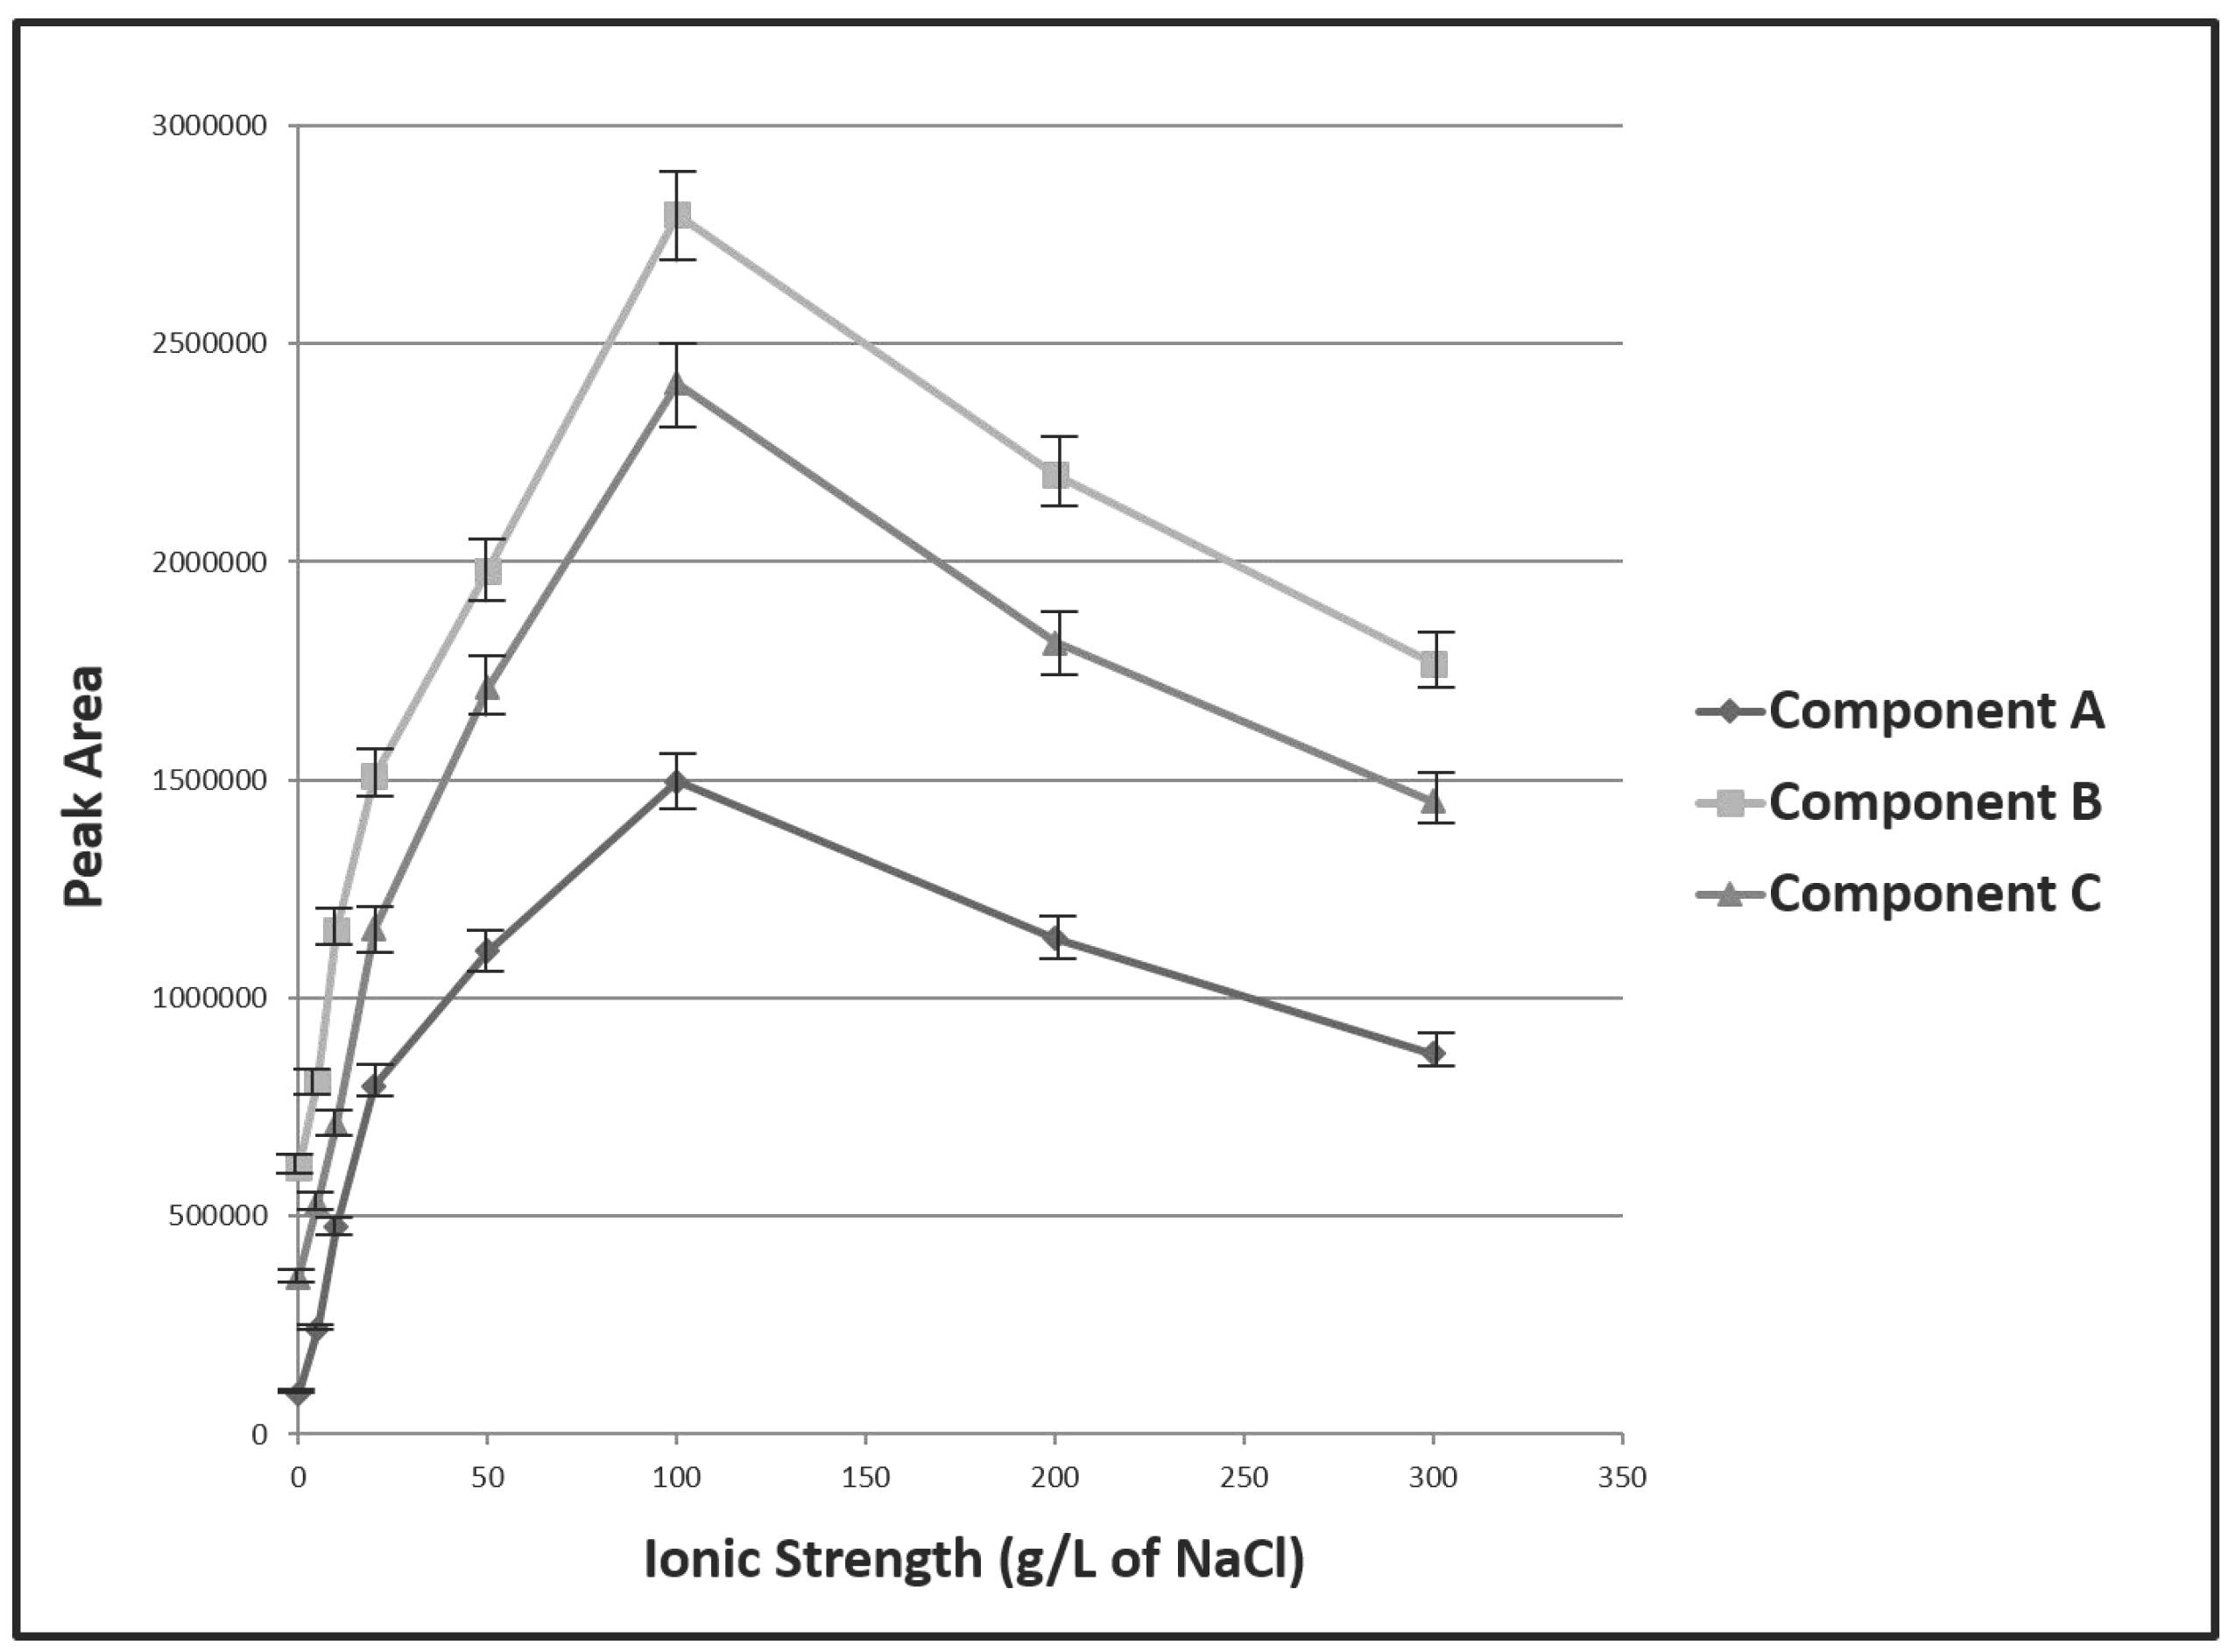
3.1. Optimization of Experimental Variables

The aim of this study was to develop a simple, highly efficient and sensitive analytical method for the determination of three grapevine moth pheromone components in grape-related samples. The optimization of the method was done using grape samples spiked with the three components at an individual concentration of 10 μg/Kg. Different variables, which are summarized in Table 1, may affect the efficiency of the extraction procedure and therefore their effects were considered in depth. Table 1 also reflects their initial and optimum values as well as the interval studied. The optimization was performed under a univariate approach.
In order to study the effect of the temperature on the extraction efficiency, the oven of the headspace module was maintained at different temperatures, namely: 40, 50, 60, 70 and 80 °C. This interval was selected based on the distribution equilibrium of the three analytes between the sample and the vial headspace. The analytical signal increases for the three components with the temperature, as shown in Figure 1. However, temperatures over 80 °C were not assayed in order to avoid excessive vial pressures when samples with high water content are analyzed. An optimal extraction temperature of 80 °C was chosen.
The effect of the headspace volume injected in the gas chromatograph was evaluated in the range from 0.5 mL to 2.5 mL. As expected, the peak areas of the analytes increased with the injected volume. The highest peak area, which had a negligible negative effect on the chromatographic resolution, was obtained for 2.5 mL.
The partition coefficient of the analytes between the liquid and the headspace is affected by the ionic strength. In fact, this variable may present two contradictory effects. On the one hand, it can decrease the solubility of the target analytes in water, by the so-called salting-out effect, favoring their transference to the gas phase. On the other hand, ionic strength may increase the viscosity of the sample solution, negatively affecting the transference kinetics. The effect of salt addition on the extraction efficiency of the three analytes from the grape sample was investigated by adding sodium chloride (selected as model electrolyte) to the sample in the range 0–300 g/Kg. The results are shown in Figure 2 and indicated that the extraction of all the analytes is positively affected at lower ionic strength (indicating a prevalence of the salting out effect) whereas at higher concentration (over 100 g/Kg) a decrease in the signals was observed (possibly due to the second effect). Attending to the results, 100 g/Kg of sodium chloride was selected as the optimum value for further studies.
The sample amount defines the total quantity of analytes present in the vial and the headspace volume. The effect of the sample amount was evaluated at six different levels (0.5, 1, 2.5, 5, 6 and 7 g). The signals for the analytes increased (data not shown) up to 6 g remaining almost constant for higher amounts. Therefore, 6 g was selected as the best value.
Headspace analysis is not an exhaustive procedure because there is a distribution equilibrium of the analytes between the sample and its headspace. Therefore, the incubation time was studied between 2 min and 140 min. The results showed that the signals exhibited a remarkable increase in the range of 2 min to 30 min, reaching a steady-state over this value. Thus, 30 min was selected as the incubation time. This time does not have a great influence on the overall sample throughput since several samples can by extracted simultaneously.

3.2. Analytical Figures of Merit

The analytical performance of the proposed method was studied in order to evaluate its usefulness for the quantitative analysis of the three components of the pheromone in grape samples. The figures of merit are summarized in Table 2. The calibration curves were constructed by analyzing blank grape samples spiked with analytes at different concentrations. Each concentration level was analyzed in triplicate, following the optimized procedure. The method was characterized on the basis of its linearity, sensitivity and precision.
The sensitivity of the method was estimated by means of the limits of detection (LOD), calculated for a signal-to-noise ratio (S/N) equal to three, based on the calibration graph parameters. They ranged from 0.06 μg/Kg ((E,Z)-7,9-dodecadien-1-yl-acetate) to 0.42 μg/Kg ((E,Z)-7,9-dodecadien-1-ol). Limits of quantification (LOQ), calculated for a S/N ratio equal to 10, were in the interval of 0.21–1.39 μg/Kg. The linearity was maintained up to 1000 μg/Kg for the three components. The repeatability of the method, expressed in terms of relative standard deviation (RSD, %), was lower than 8.5% (Table 2) calculated from 11 replicate analyses of a blank grape sample spiked with the analytes at a concentration of 1.5 μg/Kg.
Finally, a recovery study was carried out in blank table grape samples spiked with the analytes at a concentration of 1.5 μg/Kg. The samples were left to stand 24 h after spiking to allow potential interaction between the analyte and the sample matrix. The relative recoveries were calculated comparing the spiking level with the concentration obtained after the analysis of the spiked samples. The recovery values ranged from 87 ± 7 to 96 ± 7 which indicates a good accuracy level.

3.3. Analysis of Grape Samples

Once optimized and analytically characterized, the proposed method was applied to the determination of the grapevine moth pheromone components in grape-related samples (six samples of table grapes, two must and two wine grapes). Samples were analyzed in triplicate using three independent aliquots. The analytes were not detected in the six table grape samples as was expected. However, must and wine grape samples resulted to be positive and the results are presented in Table 3.
By way of example, Figure 3 shows the chromatogram obtained for the analysis of Moscatel grape sample, where the three components of the pheromone were detected and quantified. In must samples, only Component B was determined.

4. Conclusions

In this paper, a HS-GC-MS method for the determination of three components of the Lobesia botrana pheromone in grape-related samples is proposed. Lobesia botrana is an important pest, which can potentially damage crops throughout the growing season. The proposed methodology is completely automated and therefore it can be employed in routine analysis, allowing the determination of the pheromone components at a lower concentration, with precision better than 8.5% in the to ng/Kg level. The usefulness of the proposed approach has been demonstrated by analyzing grape-related samples.
Nonetheless, the proposed method is not able to determine the origin of the pheromone since these molecules can have a natural (pest) or synthetic (trap lure and/or mating disruptant) origin. The potential use of this method for the early detection of the pest would require further studies with a multidisciplinary (chemical and entomological) perspective.

Acknowledgments

Financial support from Spanish Ministry of Science and Innovation (CTQ2014-52939R) is gratefully acknowledged.

Author Contributions

María del Carmen Alcudia-León, Rafael Lucena and Soledad Cárdenas conceived and designed the experiments; María del Carmen Alcudia-León and Mónica Sánchez-Parra performed the experiments; María del Carmen Alcudia-León and Rafael Lucena analyzed the data; María del Carmen Alcudia-León, Rafael Lucena and Soledad Cárdenas wrote the paper.

Conflicts of Interest

The authors declare no conflict of interest.

References

  1. Savopoulou-Soultani, M.; Stavridis, D.G.; Tzanakakes, M.E. Development and reproduction on Lobesia botrana on vine and olive inflorescences. Entomol. Hell. 1990, 8, 29–35. [Google Scholar]
  2. Vacas, S.; Alfaro, C.; Zarzo, M.; Navarro-Llopis, V.; Primo, J. Effect of sex pheromone emission on the attraction of Lobesia botrana. Etomol. Exp. Appl. 2011, 139, 250–257. [Google Scholar] [CrossRef]
  3. Caffarelli, V.; Vita, G. Heat accumulation for timing grapevine moth control measures. Bull. SROP 1988, 11, 24–26. [Google Scholar]
  4. Oliva, J.; Navarro, S.; Navarro, G.; Camara, M.A.; Baarba, A. Integrated control of grape berry moth (Lobesia botrana), powdery mildew (Uncinula necátor), downy ildew (Plasmopara vitícola) and grapevine sour rot (Acetobacter spp.). Crop Prot. 1999, 18, 581–587. [Google Scholar] [CrossRef]
  5. Boselli, M.; Scannavini, M. Lotta alla tignoletta della vite in Emilia-Romagna. Inf. Agrar. 2001, 19, 97–100. [Google Scholar]
  6. Pimentel, D. Environmental and Economic Cost of the Application of Pesticides Primarily in the United States. In Integrated Pest Management: Innovation-Development Process; Peshin, R., Dhawan, A., Eds.; Springer: Amsterdam, The Netherlands, 2009; pp. 89–111. [Google Scholar]
  7. McNeil, J.N.; Cotnoir, P.A.; Leroux, T.; Laprade, R.; Schwartz, J.L. A Canadian national survey on the public perception of biological control. Biocontrol 2010, 55, 445–454. [Google Scholar] [CrossRef]
  8. Gonzalez-Rodriguez, R.M.; Rial-Otero, R.; Cancho-Grande, B.; Gonzalez-Barreiro, C.; Simal-Gandara, J. A review on the fate of pesticides during the processes within the food-production chain. Crit. Rev. Food Sci. 2011, 51, 99–114. [Google Scholar] [CrossRef] [PubMed]
  9. Witzgall, P.; Kirsch, P.; Cork, A. Sex pheromones and their impact in pest management. J. Chem. Ecol. 2010, 36, 80–100. [Google Scholar] [CrossRef] [PubMed]
  10. Roelofs, W.L.; Kochansky, J.; Cardé, R.T.; Arn, H.; Rauscher, S. Sex attractant of the grape vine moth, Lobesia botrana. Mitt. Schweiz. Entomol. Ges. 1973, 46, 71–73. [Google Scholar]
  11. Buser, H.R.; Rauscher, S.; Arn, H. Sex pheromone of Lobesia botrana: (E,Z)-7,9-Dodecadienyl acetate in the female grape vine moth. Z. Naturforschung C 1974, 29, 781–783. [Google Scholar]
  12. Arn, H.; Rauscher, S.; Guerin, P.; Buser, H.R. Sex pheromone blends of three tortricid pests in European vineyards. Agric. Ecosyst. Environ. 1988, 21, 111–117. [Google Scholar] [CrossRef]
  13. Gordon, D.; Zahavi, T.; Anshelevich, L.; Harel, M.; Ovadia, S.; Dunkelblum, E.; Harari, A.R. Mating disruption of Lobesia botrana (Lepidoptera: Tortricidae): Effect of pheromone formulations and concentration. J. Econ. Entomol. 2005, 98, 135–142. [Google Scholar] [CrossRef] [PubMed]
  14. Stewart, M.; Baker, C.F.; Cooney, T. A rapid, sensitive, and selective method for quantitation of lamprey migratory pheromones in river water. J. Chem. Ecol. 2011, 31, 1203–1207. [Google Scholar] [CrossRef] [PubMed]
  15. Galvan, T.L.; Kells, S.; Hutchison, W.D. Determination of 3-Alkyl-2-methoxypyrazines in Lady Beetle-Infested Wine by Solid-Phase Microextraction Headspace Sampling. J. Agric. Food Chem. 2008, 56, 1065–1071. [Google Scholar] [CrossRef] [PubMed]
  16. Cudjoe, E.; Wiederkehr, T.B.; Brindle, I.D. Headspace gas chromatography-mass spectrometry: A fast approach to the identification and determination of 2-akyl-3-methoxyperazinepheromones in ladybugs. Analyst 2005, 130, 152–155. [Google Scholar] [CrossRef] [PubMed]
  17. Eom, Y.; Risticebic, S.; Pawliszyn, J. Simultaneous sampling and analysis of indoor air infested with Cimex lectularius L. (Hemiptera: Cimicidae) by solid phase microextraction, thin film microextraction and needle trap device. Anal. Chim. Acta 2012, 716, 2–10. [Google Scholar] [CrossRef] [PubMed]
  18. Alcudia-León, M.C.; Lucena, R.; Cárdenas, S.; Valcárcel, M. Determination of Tuta absoluta pheromones in water and tomato samples by headspace-gas chromatography-mass spectrometry. Anal. Bioanal. Chem. 2015, 407, 795–802. [Google Scholar] [CrossRef] [PubMed]
  19. Alcudia-León, M.C.; Lucena, R.; Cárdenas, S.; Valcárcel, M.; Kabir, A.; Furton, K.G. Integrated sampling and analysis unit for the determination of sexual pheromones in environmental air using fabric phase sorptive extraction and headspace-gas chromatography-mass spectrometry. J. Chromatogr. A 2017, 1488, 17–25. [Google Scholar] [CrossRef] [PubMed]
  20. Alcudia-León, M.C.; Cärdenas, S.; Valcárcel, M.; Lucena, R. Green detection of the olive fruit fly pest by the direct determination of its sexual pheromone. Anal. Methods 2015, 7, 7228–7233. [Google Scholar] [CrossRef]
Figure 1. Effect of the extraction temperature on the analysis of the target analytes in grape samples.
Separations 04 00031 g001
Figure 2. Effect of the ionic strength on the analysis of the target analytes in grape samples.
Separations 04 00031 g002
Figure 3. Chromatogram of a Moscatel wine grape sample. Components: (E,Z)-7,9-dodecadien-1-ol (A), (E,Z)-7,9-dodecadien-1-yl acetate (B) and (Z)-9-dodecen-1-yl acetate (C).
Separations 04 00031 g003
Table 1. List of the variable involved HS-GC-MS determination of the three sexual pheromone components.
VariableInitial ValueInterval StudiedOptimal Value
Extraction temperature (°C) 40–8080
Headspace injected volume (mL)10.5–2.52.5
Ionic strength (g/Kg of NaCl)00–300100
Sample amount (g)2.50.5–76
Extraction time (min)152–14030
Table 2. Figures of merit of the proposed method for the determination of the target compounds in grape samples.
AnalyteLOD aLOQ bLinear Range cRSD d
Component A0.421.39LOQ-10008.5
Component B0.060.21LOQ-10007.2
Component C0.170.55LOQ-10007.9
a LOD, limit of detection in μg/kg. b LOQ, limit of quantification in μg/kg. c Linear Range in μg/kg.d RSD; relative standard deviation expressed in percentage (n = 11).
Table 3. Analysis of different grape samples collected in Córdoba and must samples purchased at local market.
AnalyteWhite Wine Grape a
(Moscatel)
Red Wine Grape a
(Carbenet Sauvignon)
White Must aRed Must a
Component A5.2 ± 0.44.5 ± 0.4Not DetectedNot Detected
Component B64 ± 582 ± 694 ± 7122 ± 9
Component C21 ± 229 ± 2Not DetectedNot Detected
a Concentration (μg/Kg) ± SD (n = 3).

