Experimental Investigation of the Productivity of a Wet Separation Process of Traditional and Bio-Plastics
by
Monica Moroni
1,*, 
Emanuela Lupo
1,
Valerio Della Pelle
2,
Alessandra Pomponi
2 and
Floriana La Marca
2 1
Department of Civil, Constructional and Environmental Engineering (DICEA), Sapienza University of Rome, via Eudossiana, 18, 00184 Rome, Italy
2
Department of Chemical Engineering Materials Environment (DICMA), Sapienza University of Rome, via Eudossiana, 18, 00184 Rome, Italy
*
Author to whom correspondence should be addressed.
Separations 2018, 5(2), 26; https://doi.org/10.3390/separations5020026
Submission received: 9 November 2017
/
Revised: 5 December 2017
/
Accepted: 16 April 2018
/
Published: 2 May 2018
(This article belongs to the Special Issue Investigation New Technology for Separation of Plastic Wastes)
Abstract
:The separation process within a mechanical recycling plant plays a major role in the context of the production of high-quality secondary raw materials and the reduction of extensive waste disposal in landfills. Traditional plants for plastic separation employ dry or wet processes that rely on the different physical properties among the polymers. The hydraulic separator is a device employing a wet technology for particle separation. It allows the separation of two-polymer mixtures into two products, one collected within the instrument and the other one expelled through its outlet ducts. Apparatus performance were analyzed as a function of fluid and solid flow rates, flow patterns developing within the apparatus, in addition to the density, shape, and size of the polymers. For the hydraulic configurations tested, a two-way coupling takes place where the fluid exerts an influence on the plastic particles and the opposite occurs too. The interaction between the solid and liquid phases determines whether a certain polymer settles within the device or is expelled from the apparatus. Tests carried out with samples of increasing volumes of solid particles demonstrate that there are no significant differences in the apparatus effectiveness as far as a two-way interaction takes place. Almost pure concentrates of Polyethylene Terephthalate (PET), Polyvinyl Chloride (PVC), and Polycarbonate (PC) can be obtained from a mixture of traditional polymers. Tests conducted on Polylactic Acid (PLA) and Mater-Bi® samples showed that the hydraulic separator can be effectively employed to separate bio-plastics from conventional plastics with remarkable grade and recovery.
1. Introduction
In 2015, with continuous growth over more than 50 years, the global production of traditional plastic has amounted to 322 million tons, with an increase of 40% compared to 2005 [1]. The European production represents 18% of the world’s total production. In 2017, plastics production is expected to continue on a positive trend. In 2014, 25.8 million metric tonnes of post-consumer plastics waste ended up in the official waste streams. 69.2% was recovered through recycling and energy recovery processes while 30.8% ended up in landfills. In 2015, within the different plastic applications, plastic packaging reached the highest recycling rate with 39.5%, representing more than 80% of the total recycled quantities [1]. In 2014, landfilling was still the 1st option in many European Union countries. In general, countries with a landfill ban, such as, Switzerland, Austria, and Germany, to name but a few, achieved higher recycling rates [1].
Recycling may be accomplished using chemical or mechanical processes. Chemical recycling is driven by thermal (e.g., pyrolysis) or chemical (selective solvents) processes that essentially break down the original polymer chains and molecules [2]. Mechanical recycling is achieved via several treatment steps, usually consisting of cutting and shredding to obtain suitable size and shape for further processing; separation in dry conditions to eliminate impurities such as paper, dust, and other non-plastic materials; polymer separation, which is the key process in separating different polymers; and milling to homogenize polymer particle size. Further steps such as washing/drying, agglutination, extrusion, are designed to prepare the end-product according to market standards [3]. Mechanical recycling may profitably be employed to produce high-quality products to substitute virgin polymers, thus reducing environmental impact and resource depletion [4].
Nowadays the most common techniques employed in mechanical recycling plants to separate plastics are based on optical, fluorescent and infrared properties [5,6], electrostatic forces [7,8], flotation by hydrophilic character [9,10], thermal treatment [11], and density differences [12]. All processes present drawbacks related to cost, performance and environmental hazards such as the influence of moisture, surface status, and low feeding speed of particles in electrostatic separation; the need for an additive in separation by flotation and density; the wide range of density values for the same typology of plastic materials makes the choice of the density for sink and float separation challenging.
The market value of recycled plastics is considerably affected by their purity, degree of decontamination, and homogeneity [13], which are strictly related to the effectiveness of the mechanical recycling process, in particular the polymer separation step. In this regard, it is worth noting that one option currently adopted to reduce the impact of plastic products is the use of bio-plastics, mainly in the food sector. Therefore, the incorrect disposal of products made of bio-plastics together with traditional plastic products may likely occur. This issue has to be taken into account in the stage of designing and setting up the treatment steps in a recycling plant to avoid ‘polluting’ the traditional plastic waste stream with bio-plastics.
This work describes the separation process taking place in a hydraulic channel, hereinafter called the hydraulic separator, which makes it possible to recover homogeneous plastic fractions complying with the most restrictive standards in the secondary raw materials market. The device is suitable for the separation of polymers with a density higher than 1000 kg/m3 and employs plain water without chemical additives. As shown by [3,13], the separation process within the device relies on the difference of the polymers’ density and on the characteristic flow pattern developing within the instrument. To quantify the efficacy of the apparatus, the most widely used traditional (Polyethylene Terephthalate (PET), Polyvinyl Chloride (PVC) and Polycarbonate (PC)) and bio-plastics (Polylactic Acid (PLA) and Mater-Bi®) were selected and the capability of the hydraulic process to separate the different polymers as virgin granules, urban waste, and regenerated materials was investigated.
This contribution complements the experimental activity on the separation process of [3,13]. In fact, several original elements are described in this manuscript: (1) a detailed investigation of the coupling regime among the solid phase and the liquid phase, which is mandatory to understand the separation mechanisms taking place within the device and optimize its performance; (2) the evaluation of the influence of the solid phase volume fraction (defined as the ratio of the solid phase volume and the total volume of the solid-liquid mixture) on the hydraulic separator efficacy; (3) the investigation of samples of bio-plastics in addition to traditional plastics to account for the possible presence of materials realized with bio-plastics in recycling plants. For evaluating the effectiveness of the hydraulic separator and studying the influence of the solid volume fraction, mono-material and multi-material tests have been performed with samples of 12.42 × 10⁻⁶ m3 solid volume, which is double the tested volume of previous tests [13]. The comparison of separation tests conducted with both solid volumes and analogous hydraulic configurations makes it possible to infer the effect of the solid volume on the separation efficacy. The investigation of the apparatus performance in separating biodegradable plastics and traditional plastics is of particular relevance because bio-plastics play the role of contaminants in traditional plastic streams, compromising the possibility of a successful separation of the plastic stream into products that may be employed to produce secondary raw materials.
Apart from Section 1, this paper is organized as follows: Section 2 describes the experimental apparatus and the polymers employed for the experimental tests; Section 3 describes the investigation of the two-phase flow interaction and presents the results of mono-material and multi-material separation tests; the paper ends with a concluding section.
2. Materials and Methods
2.1. Experimental Apparatus
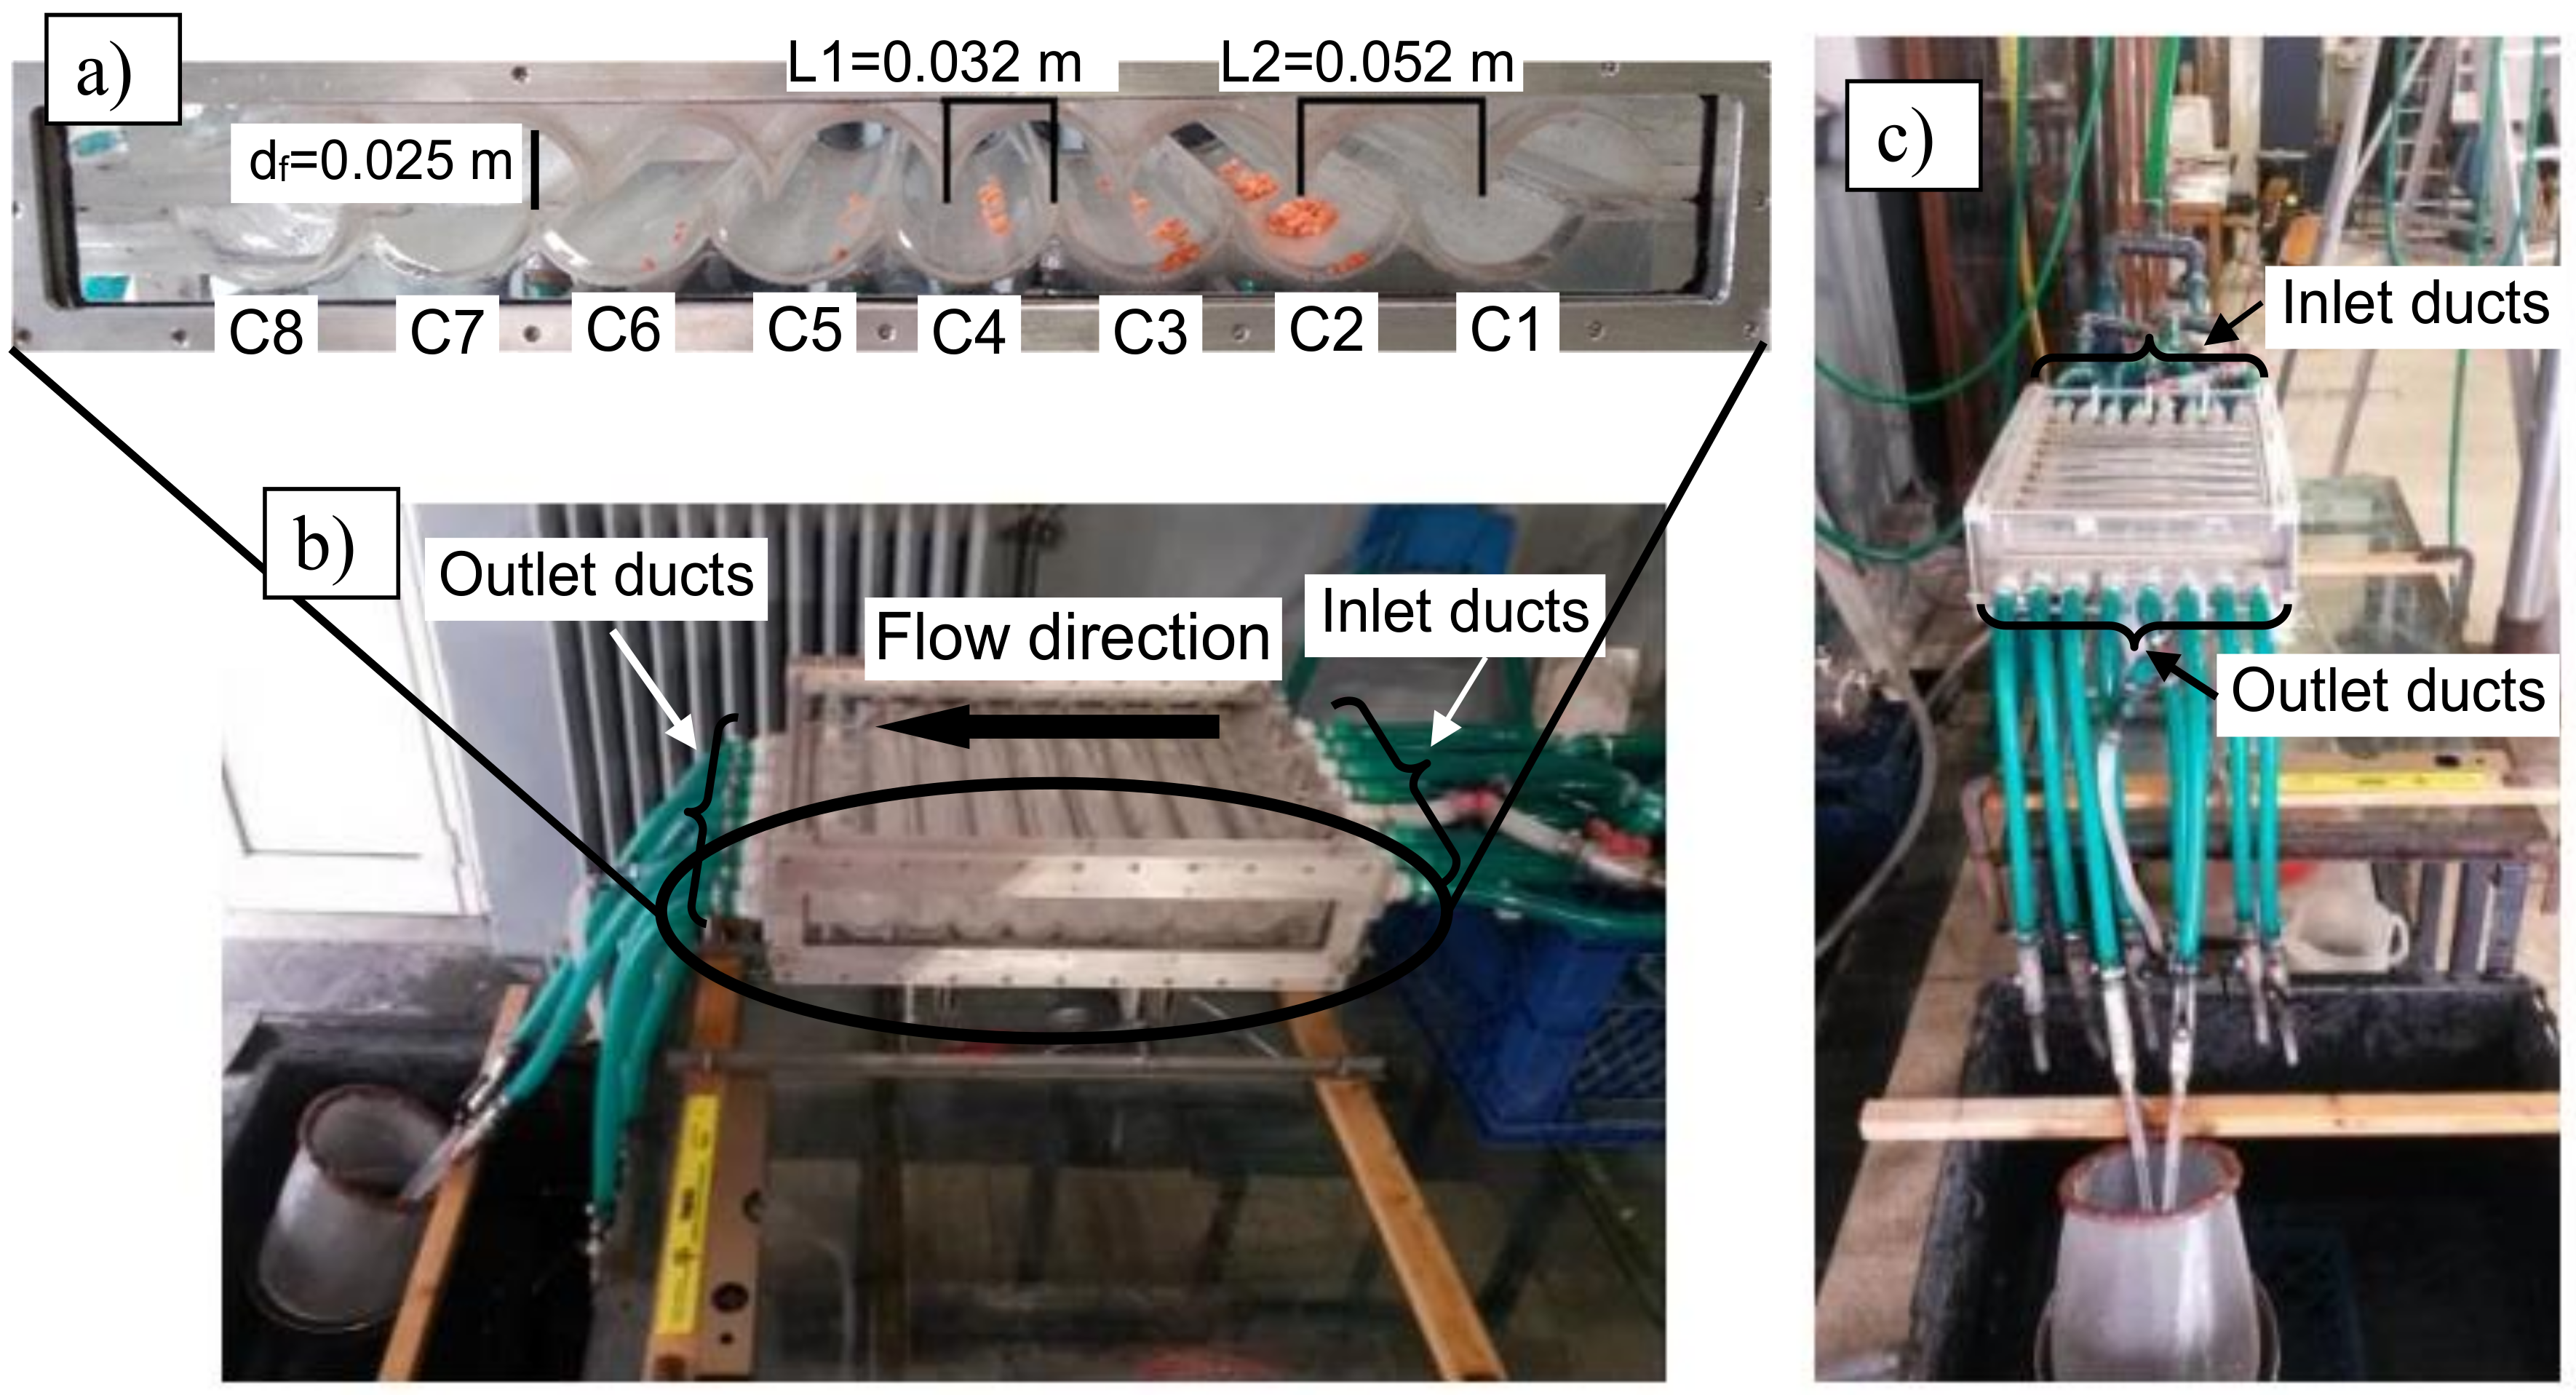
A synthetic scheme of the experimental facility is reported in [3]. The hydraulic separator is a channel with a characteristic shape realized by combining two rigid transparent Plexiglas walls. Each wall consists of 8 half-cylinders, which form 8 inner parallel chambers with axis orthogonal to the flow main direction. The chambers are labeled according to their position along the flow direction (Cn, with n = 1, ..., 8). Figure 1a shows the longitudinal section of the instrument and most relevant measures. A collecting duct is present at the bottom of each chamber. It allows the extraction of the material settled in each chamber at the end of the separation process. The collecting ducts are provided with taps to be disconnected from the flow circulation during the tests.
Water is the working fluid. It is fed through eight inlet ducts (Ii, with i = 1, ..., 8) located along the first chamber, with axes normal to the semi-cylindrical tube axes, as Figure 1b shows. The device is also equipped with eight outlet ducts (Figure 1c) placed in the last chamber, in a symmetrical position with respect to the inlet ducts. The outlet ducts are provided with taps, to be eventually disconnected from the flow circulation. The number of opened outlet ducts affects the flow rate inside the separator and therefore the performance of the instrument.
The shape of the chambers may be changed by shifting the upper profile with respect to the lower one. This allows the set-up and investigation of different inner geometries (and consequently different organizations of the flow within the device), conferring a remarkable flexibility to the apparatus. In [13] two different apparatus configurations, hereinafter ASYM (standing for asymmetrical) and SYM (standing for symmetrical) configurations, have been tested. In configuration ASYM (Figure 1a), the ratio between lengths L2 and L1 is roughly equal to 1.6, while it is roughly equal to 2 in configuration SYM. In this contribution, the experimental tests were conducted for configuration ASYM, which has turned out to be the most effective in plastic separation [13].
The separator is placed on a table set at 0.8 m above the ground. A metallic structure makes it possible to tilt the instrument to facilitate the collection of the material settled.
The reproducibility of the experimental tests was ensured by carefully verifying the constancy of the flow rate during each test. For this purpose, the apparatus was filled via a semi-close circuit. A variable height tank, hereinafter called primary tank, was connected to all eight inlet ducts and the water level within the tank was controlled through an overflow exit. The plastic samples were introduced within the separator via a proper supply tank of 0.014 m3 volume connected to the inlet duct I4. A pump made it possible to transfer water collected from the outlet ducts into the primary tank.
2.2. Tested Plastic Samples
Polymers employed to test the efficacy of the device are both traditional plastics (PET, PC and PVC) and bio-plastics (PLA and Mater-Bi®). To guarantee the entrance of the samples within the device, only polymers with density larger than water were tested. For each polymer, samples of material at different stages of a product life cycle were selected, i.e., primary raw or virgin (V) materials, waste (W), and secondary raw or regenerated (R) materials. The virgin plastic particles represent the primary raw materials used for the manufacture of products. Those samples are constituted by particles of nearly spherical or cylindrical shape with rather regular and homogeneous sizes. Urban plastic waste samples were collected from many sources. To simulate the feeding conditions of a real recycling plant, in which the polymer separation step is carried out after the waste size reduction, each waste sample was washed, purified from impurities and then shredded by a knife mill to obtain irregularly shaped flakes or pieces. This in turn allowed the investigation of the effect of the particle shape on the apparatus separation efficacy. Lastly, secondary raw (regenerated) plastics were provided by two Italian plants for plastic recovery and recycling (“Rigenera S.r.l.”—Terni; “Montello S.p.a.”—Montello (BG)). They represent the secondary raw materials used for the production of new goods and products.
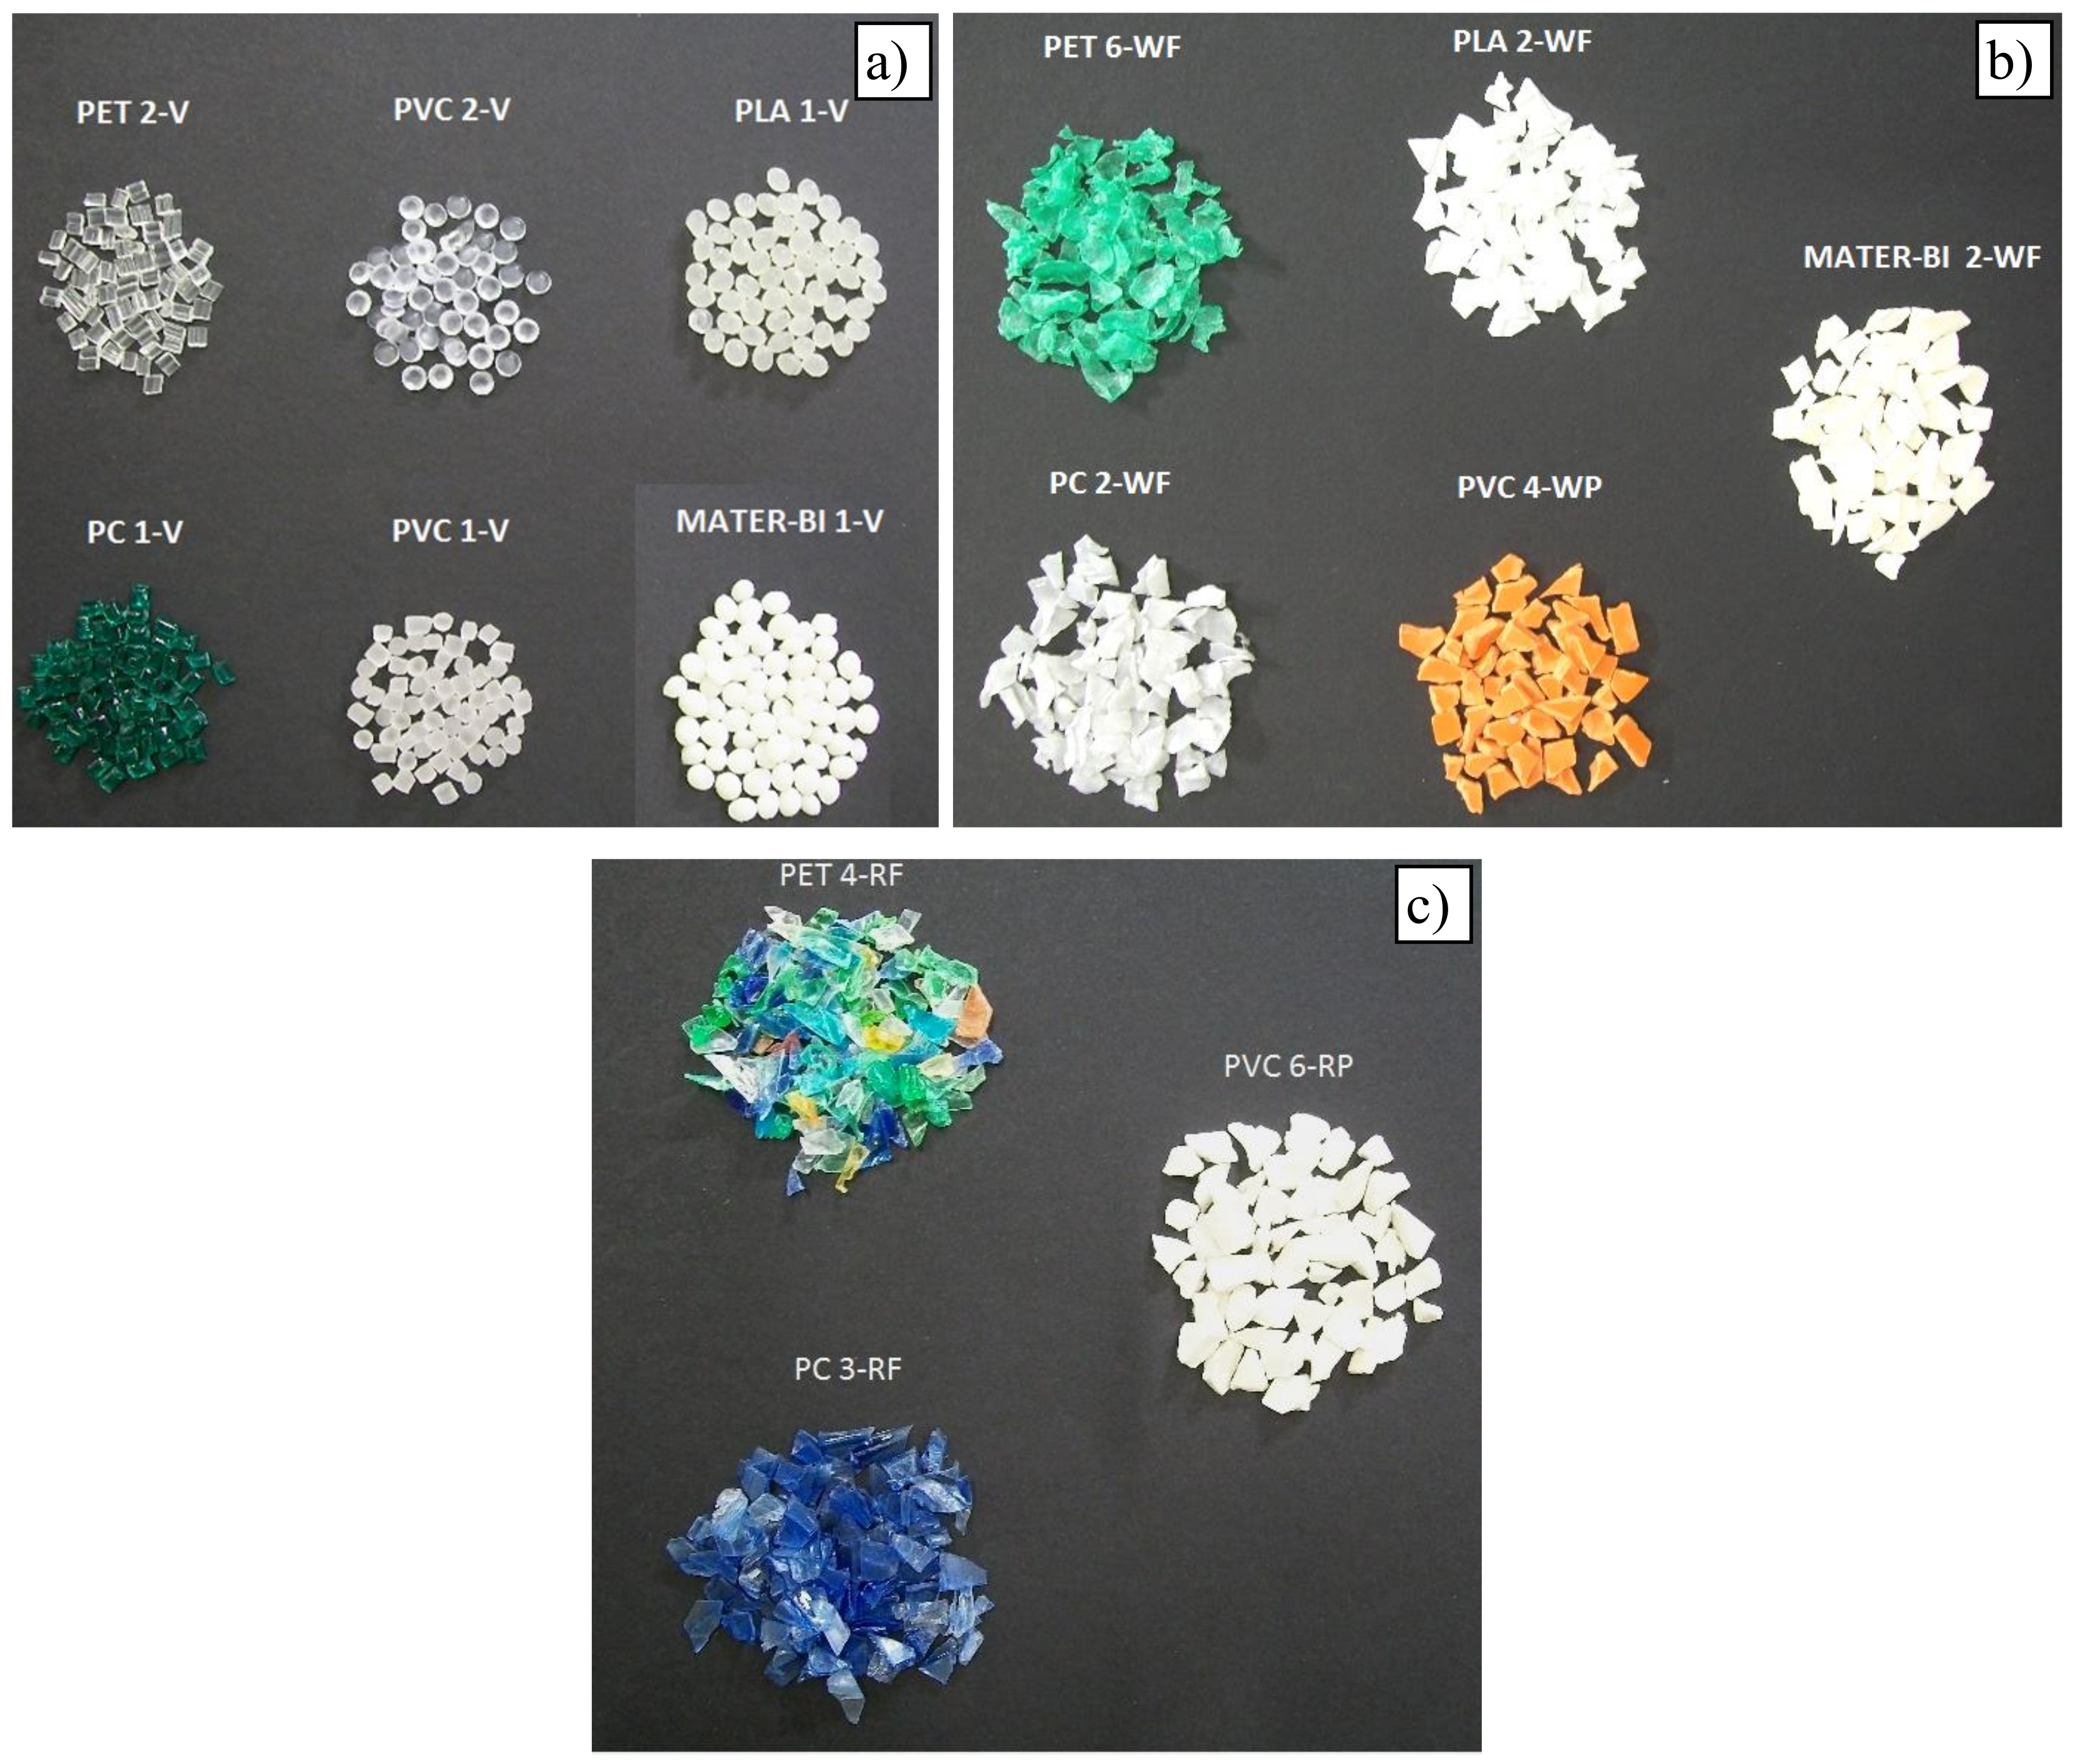
The samples tested within the apparatus are identified with the name of the polymer, a sequential number used to distinguish different samples of the same polymer, the letters V, W or R indicating the phase of the life cycle (virgin, waste or regenerated materials respectively), the letters G, F or P indicating the particle shape (granules, flakes or pieces respectively). Four samples of traditional plastics (PC 1-V, PET 2-V, PVC 1-V, PVC 2-V) and 2 samples of bio-plastics (PLA 1-V, MATER-BI 1-V) were selected as virgin materials (Figure 2a); 3 samples of traditional plastics (PC 2-WF, PET 6-WF, PVC 4-WP) and 2 samples of bio-plastics (PLA 2-WF, MATER-BI 2-WF) were selected as waste materials (Figure 2b); 3 samples of traditional plastics (PC 3-RF, PET 4-RF, PVC 6-RF) were selected as regenerated materials (Figure 2c).
Two size classes were chosen to indicate the particle dimensions (d is the size):
- -
- size class I: 2.00 × 10⁻³ m < d < 3.36 × 10⁻³ m
- -
- size class II: 3.36 × 10⁻³ m < d < 4.76 × 10⁻³ m
These size classes were selected to verify the influence of the particle size on the separation process. The size class II represents an upper limit for plastic particle sizes that can be treated within the hydraulic separator. Size class I was tested to verify if the reduction of the particle dimension determines an increase in the apparatus performance. Furthermore, the size classes selected are consistent with the particle size in recycling industrial plants.
Traditional and bio-plastics samples used in this work are resumed in Table 1, which describes origin, shape, density, and size class.
Sample Shape Factors
Special attention was devoted to the determination of the particle shape factor and the equivalent spherical particle dimension, i.e., the particle characteristic dimension. Those parameters are crucial to infer the sample behavior in separation tests.
It is worth noting that due to its definition, the particle characteristic dimension does not refer to any specific size of particle. For this reason, it may differ from the size class dimensions associated to the particles determined through standard sieves.
The shape factor is defined as the ratio between the surface area of the equivalent sphere enclosing the same volume and the average surface area of the particle. Different methods were used to calculate the shape factor according to the shape of the particles.
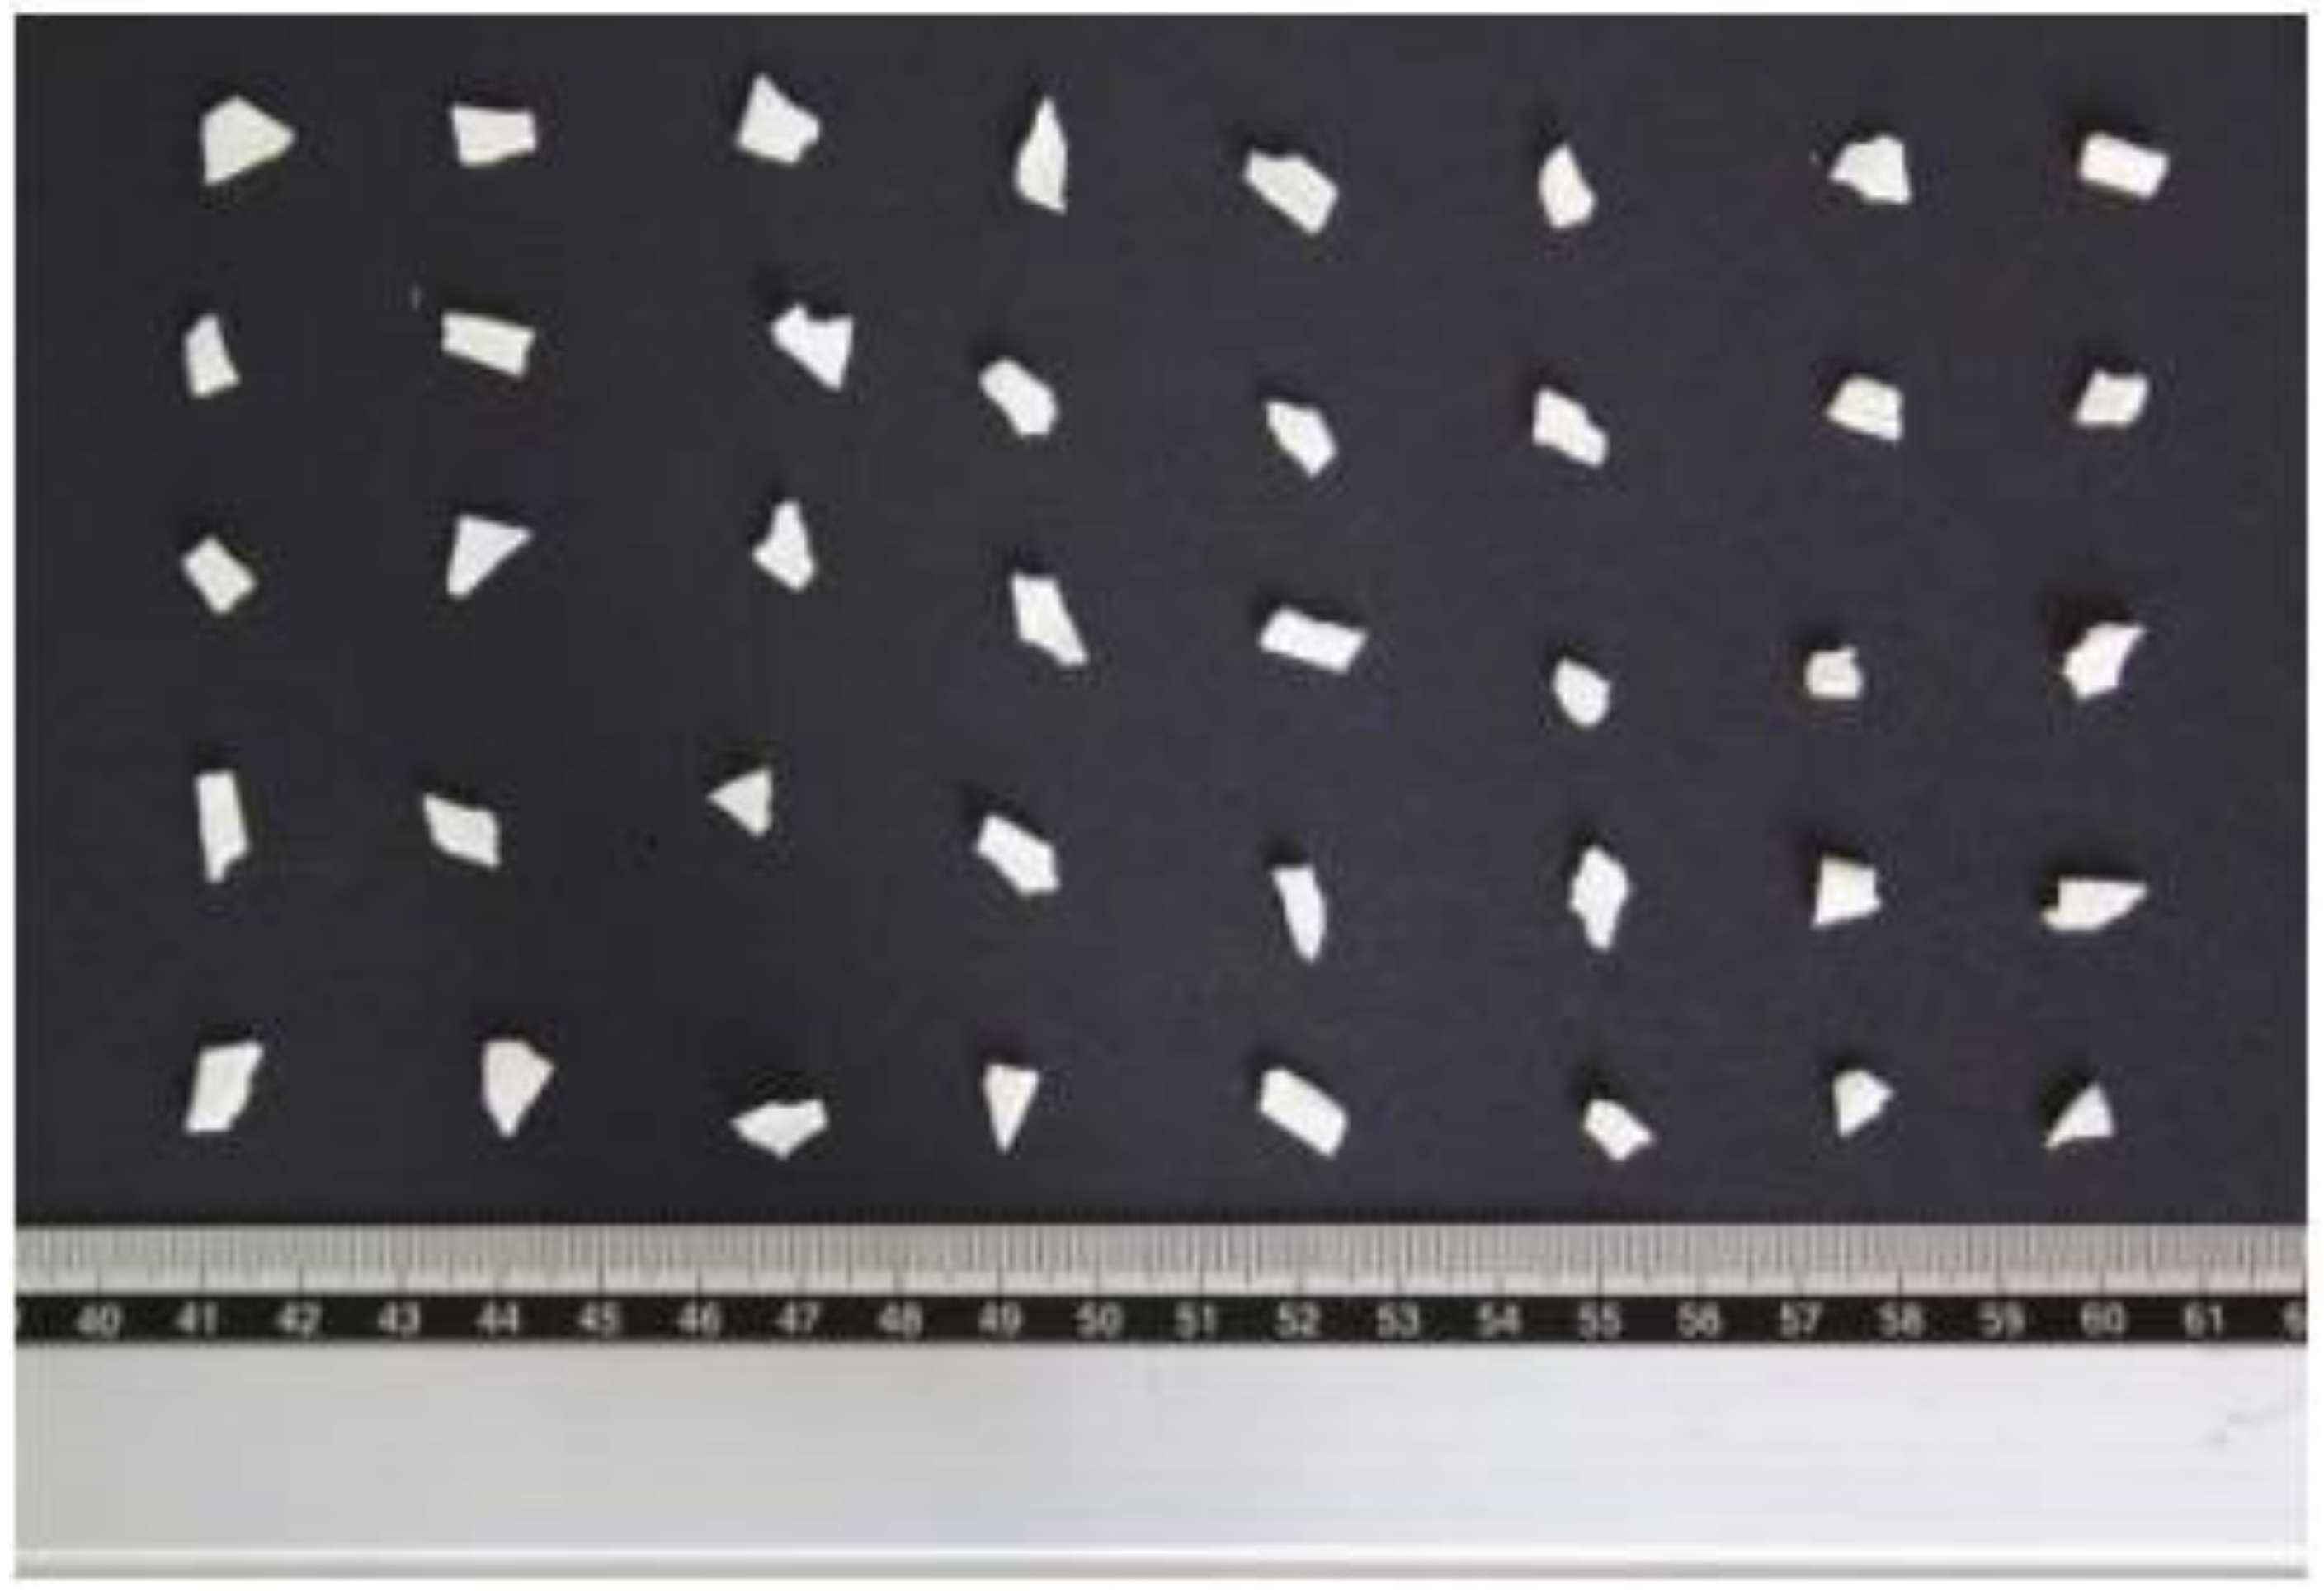
Due to their regular shape, virgin polymers were assimilated to known geometries, i.e., half-spheres and elliptical cylinders. Volume and surface of the particles were determined by measuring their geometric features and then combined in known formulas. Particles in flakes or pieces present an irregular shape with an almost constant dimension in one direction, a constant thickness, and different dimensions in the other two directions. Ten particles per sample were used to measure the thickness through the use of a caliper and the values obtained were then averaged to obtain the characteristic thickness of each sample. The size of the particles along the other two directions were obtained by placing a consistent number of particles on a black background and acquiring pictures with a Canon EOS 550D camera as Figure 3 shows for MATER-BI 2-WF particles belonging to size class II. A ruler was inserted in the scene to derive the pixel/cm ratio. Pictures were analyzed via image analysis. The procedure prescribes masking lighter elements (plastic particles) in the image via the application of a binarization procedure.
This procedure is successful because the light elements and the black background are clearly discernible. Each particle was then isolated and both the face perimeter and area were determined. The following step was the computation of the average surface and volume of the particles. The diameter of the equivalent sphere was inferred from the average volume and employed to evaluate the surface area of the equivalent sphere. Finally, the shape factor was calculated. Table 2 shows the characteristic dimension and shape factor of traditional and bio-plastic particles.
2.3. Separation Tests
Separation tests were conducted on mono- and multi- material samples. The purpose of mono-material tests is to provide useful information on the plastic behavior within the hydraulic separator as a function of the hydraulic configuration, i.e., tank height and number of opened outlet ducts. The result of a test consists of two products: the fraction settled within the apparatus chambers and the fraction expelled from the separator. We will refer to both of them as concentrated fractions. According to its property (shape, size, and density) and separator operating conditions, each sample may (i) settle within the separator chambers, (ii) be expelled from the apparatus or (iii) partially settle and partially be expelled. The mono-material separation tests were carried out with three different heights of the primary tank: 1.0 m, 1.5 m, and 2.0 m (respect to the inlet ducts centers) and with 2, 3, and 4 opened outlet ducts for a total of nine hydraulic configurations or cases.
Operatively, a volume of 12.42 × 10⁻⁶ m3 of solid material was introduced within the separator during each test, through duct I4. In the previous investigations [3,13], a volume of 6.21 × 10⁻⁶ m3 of solid material was used. As highlighted in the introduction, tests presented in this contribution make it possible to determine the influence of the solid volume fraction on the separation efficacy. All tests employed a procedure consisting of the following steps: (1) weighting and wetting of the sample; (2) adjustment of the primary tank height; (3) closure of the taps connected to the eight collecting ducts; (4) water supply through all 8 inlet ducts until complete saturation of the separator; (5) aperture of the outlet ducts; (6) feeding of sample particle through inlet duct I4; (7) test execution, collecting the material expelled from the outlet ducts; (8) end of the water supply; (9) recovery of the material settled via the collecting ducts; (10) drying of the material recovered prior to weighing. The duration of each experiment was approximately 240 s; 180 s being the time required for the particles to be introduced through I4 and the remaining 60 s the time required to test the permanence of the particles in the different chambers. To evaluate the amount of plastic particles settled in each chamber and expelled from the apparatus, plastics have been recovered separately, properly dried, and weighed.
The purpose of multi-material tests is to evaluate the effectiveness of the experimental apparatus in a realistic separation process. The choice of the materials to be tested and the hydraulic configurations was made on the basis of the results of the mono-material tests. Each sample was obtained by combining two different plastic typologies in given percentages. Of the polymers composing the mixture, in general one typology is the useful material. Therefore, the purpose of the test is to obtain the useful material and separate it from the remaining one. After each multi-material separation test, the useful material settled within the device and expelled from the apparatus is collected and weighed. In order to compare the results of the separation tests and to quantify the effectiveness of the separation process, two quantities were computed, grade and recovery, which are defined as follows:
- -
- the grade is equal to the ratio between the weight of recovered useful material and the weight of total recovered material, expressed as a percentage; it provides an indication of the purity of the recovered material;
- -
- the recovery is equal to the ratio between the weight of the recovered useful material and the weight of the useful fraction in the sample, expressed as a percentage; it provides an indication of the amount of useful material separated out of the total useful material introduced.
The separation process is optimal when grade and recovery are equal to 100%.
3. Results and Discussion
3.1. Two-Phase Flow Characterization
To understand the coupling regime between the solid phase and the fluid phase, it is essential to calculate the characteristic parameters of the fluid and solid phases.
First, we present the fluid phase characteristic parameters (Table 3). Nine hydraulic configurations (or cases) were obtained by combining tank height and number of opened outlet ducts. The Reynolds number, Re, was computed as follows: Re = Q/(Wtdf)df/ν (where Q is the flow rate, Wt = 0.45 m the channel width, df = 2.5 × 10⁻² m the channel passage height (Figure 1a) and ν the kinematic viscosity of water). Re increases with the flow rate and ranges between 1950 and 3400. Re values suggest the flow regime within the separator is in the transitional regime, approaching the turbulent regime.
The characteristic time of the fluid phase is defined as τf = df/Uf (where Uf = Q/(Wtdf) is the fluid characteristic velocity). It decreases as the flow rate increases. Its maximum value (0.32 s) is obtained for the lowest flow rate (case #1), while the minimum value (0.18 s) for the largest one (case # 9).
The characteristic parameters of the solid phase are the solid phase volume fraction, αs, the particle Reynolds number, Rep, and the solid phase relaxation time, τs.
The solid phase volume fraction, defined as the ratio of the total volume of the dispersed phase and the total volume of the mixture [14], is equal to 5.2 × 10⁻⁵.
For all cases, Rep = dp|Up − Uf|/ν (where dp is the particle characteristic dimension, Up and Uf the particle and fluid velocity respectively) results as being to the order of 102–103 (see Table 4 for samples belonging to the size class I and Table 5 for samples belonging to the size class II).
The solid phase relaxation time τs = ρsdp2/(18 μf) (where ρs is the solid phase density, μ the dynamic viscosity and f = (1 + 1/6 Rep2/3) a drag coefficient) is the time a solid particle employs to respond to changes of the fluid phase velocity. The relaxation time is strongly influenced by the particle size. In fact, larger particles take longer to respond to changes of the fluid velocity, while smaller particles respond quicker (Table 4 and Table 5).
According to [14], the coupling regime among solid particles with Rep to the order of 103 in a mixture with a solid phase volume fraction to the order of 10−5 is expected to be two-way. Hence, a reciprocal influence between the phases does exist. A further important parameter to define the coupling regime between the two phases is the Stokes number (St), defined as St = τp/τf, where τp is the particle relaxation time and τf the flow field characteristic time [15]. St was computed only for those cases where the characteristic time of the fluid phase assumes extreme values, i.e., for case #1 when the characteristic time of the fluid phase assumes its maximum value and for case #9 when it assumes the minimum value. Stokes numbers are reported in Table 6 for samples belonging to the size class I and Table 7 for samples belonging to the size class II. The Stokes number is smaller than 1 for all the cases investigated signifying that the solid phase relaxation time is smaller than the characteristic time of the fluid phase. Being the difference between the velocity of the solid and fluid phases small, the coupling among the two phases is large.
3.2. Mono-Material Separation Tests
Mono-material tests shown in this contribution were conducted employing samples of 12.42 × 10⁻⁶ m3 solid volume. The results obtained are observed against tests conducted with samples of 6.21 × 10⁻⁶ m3 solid volume [13] (Figure 4, Figure 5 and Figure 6). Since the fluid flow rate was kept constant, the comparison makes it possible to evaluate the effectiveness of the hydraulic separator as a function of the solid volume fraction treated within the device. Increasing the solid phase volume treated within the device and keeping unchanged the fluid flow rate, the solid phase volume fraction αs increases from 2.6 × 10⁻⁵ to 5.2 × 10⁻⁵. As already stated in Section 3.1, for αs to the order of 10−5 and particle Reynolds number to the order of 103, a two-way coupling among the phases takes place. Two-way coupling presupposes that there is a mutual influence between the two phases, i.e., a reciprocal exchange of forces. Those forces, usually referred to as two-way coupling forces, are directly proportional to the solid phase volume fraction and to the difference between the velocity of the fluid and solid phases and inversely proportional to the squared solid particles diameter. It is worth noting that tests were repeated more than one time to verify reproducibility of the results.
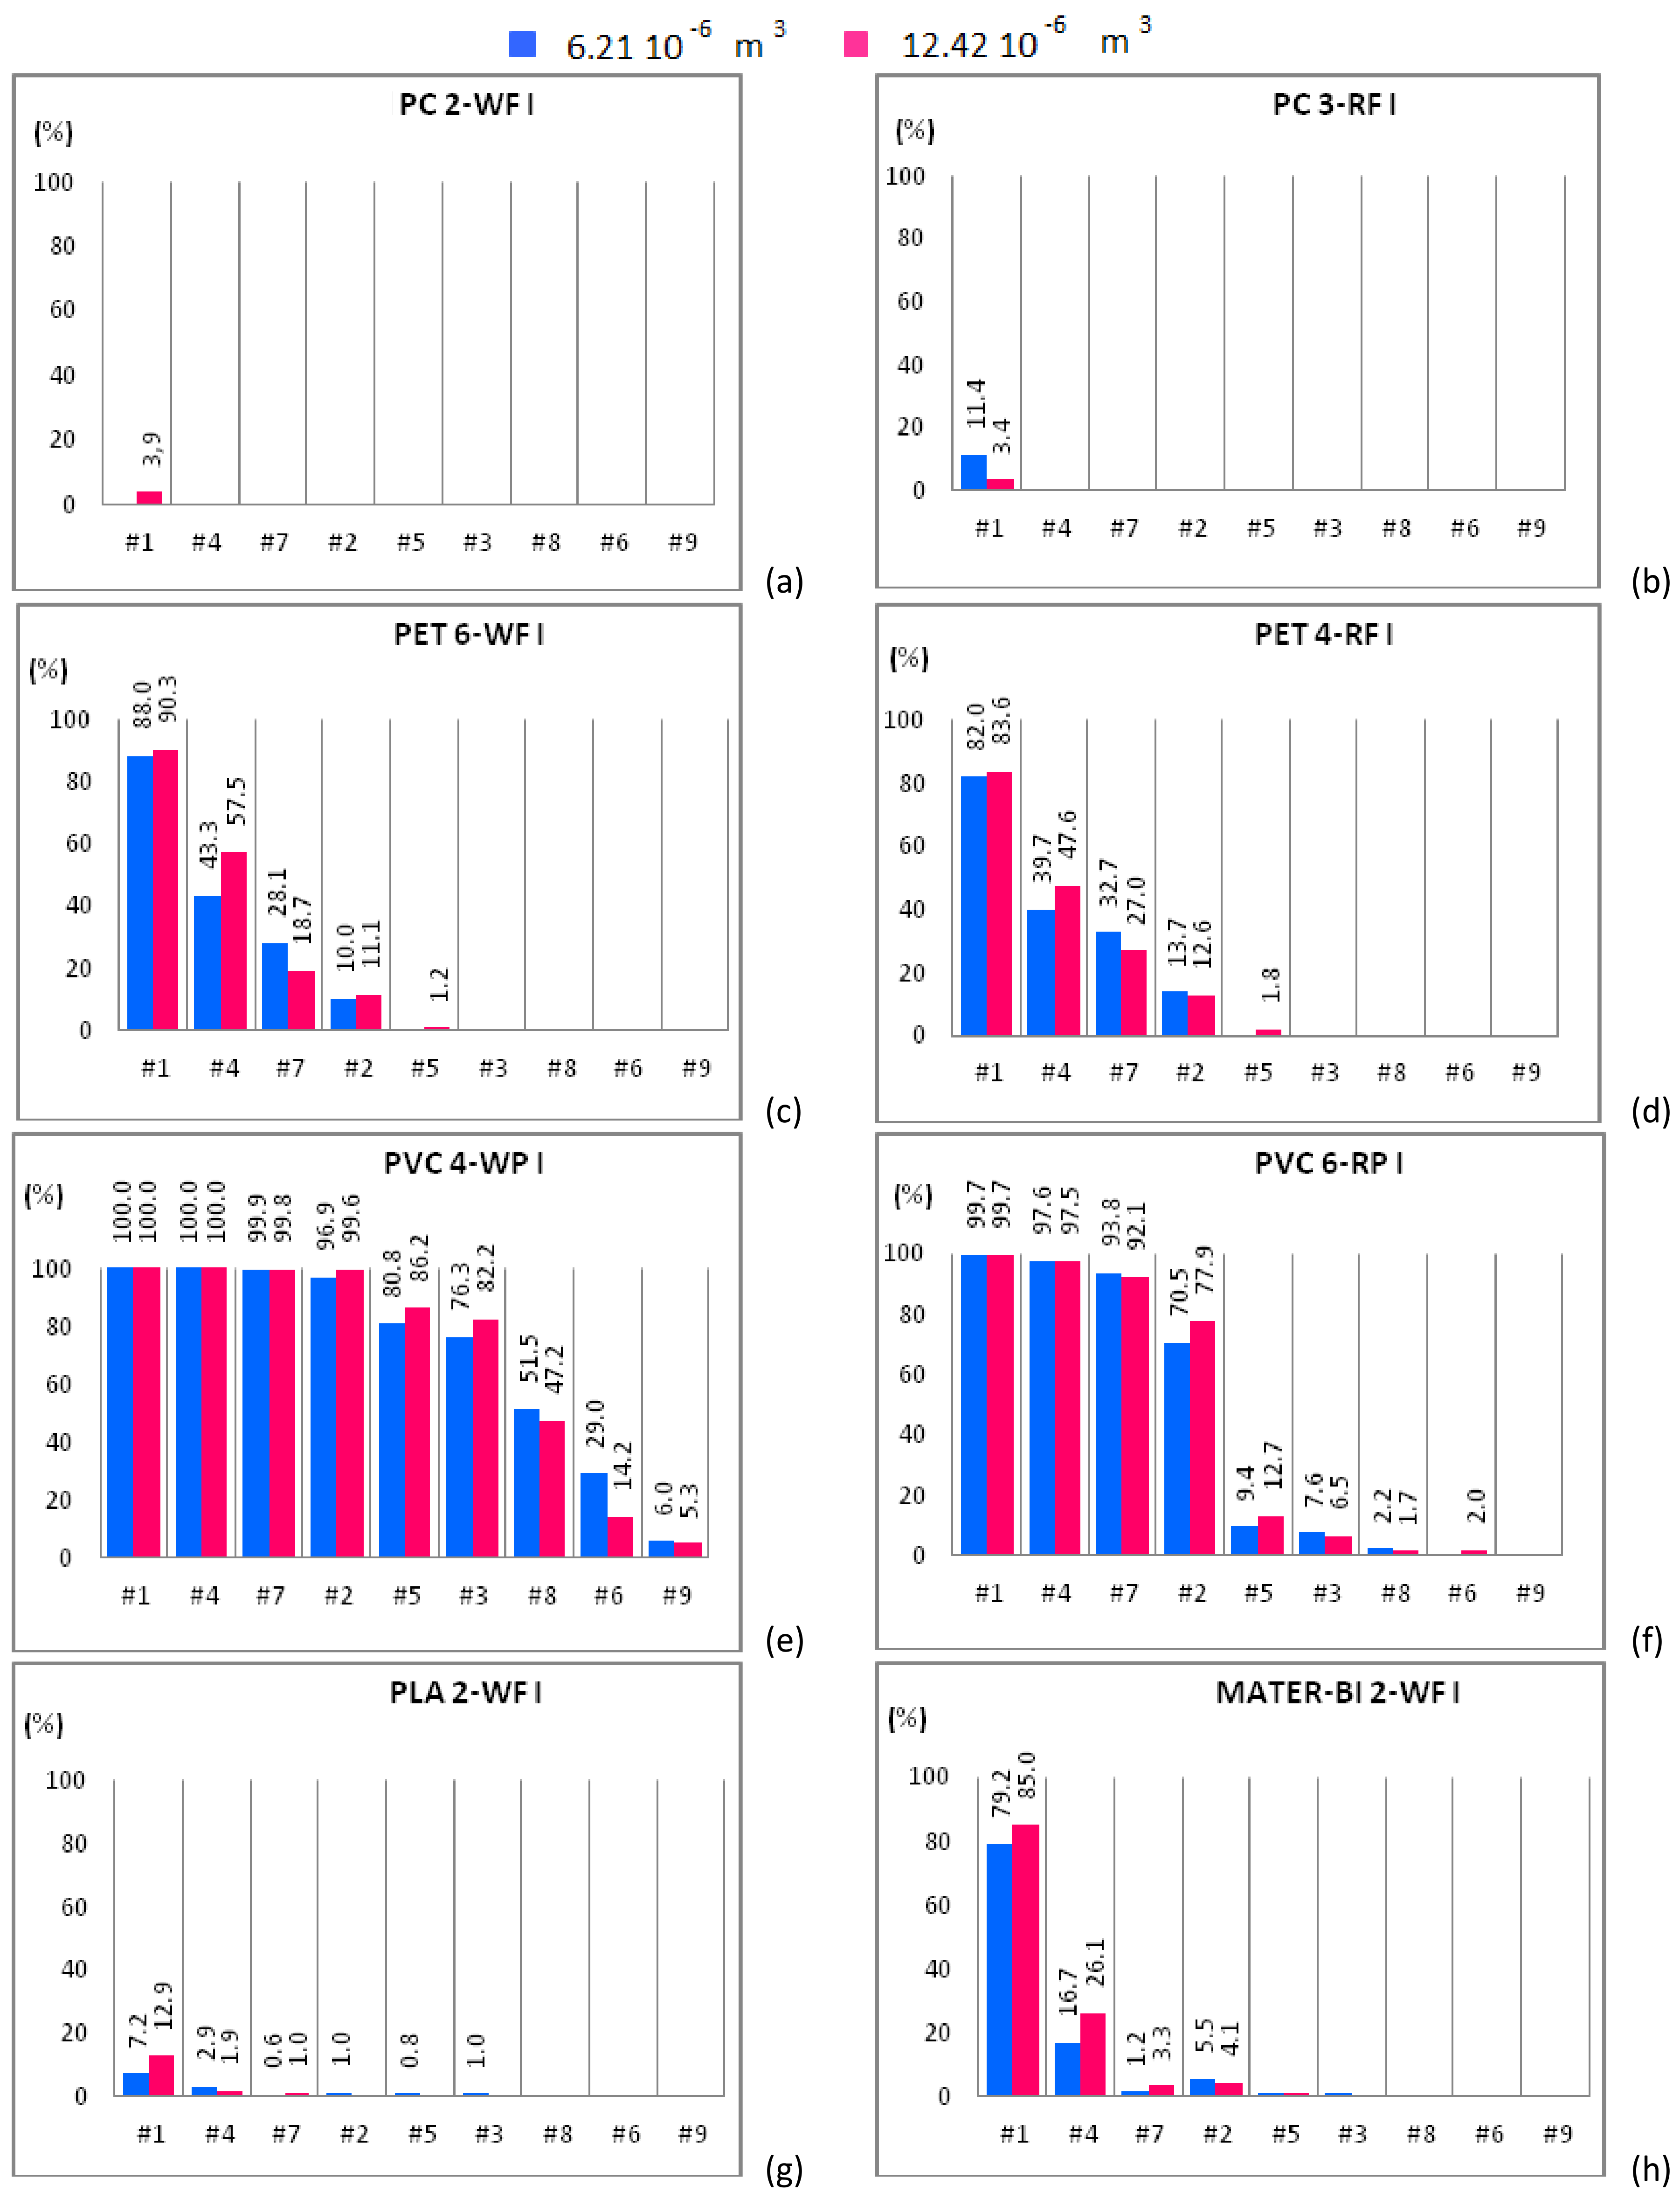
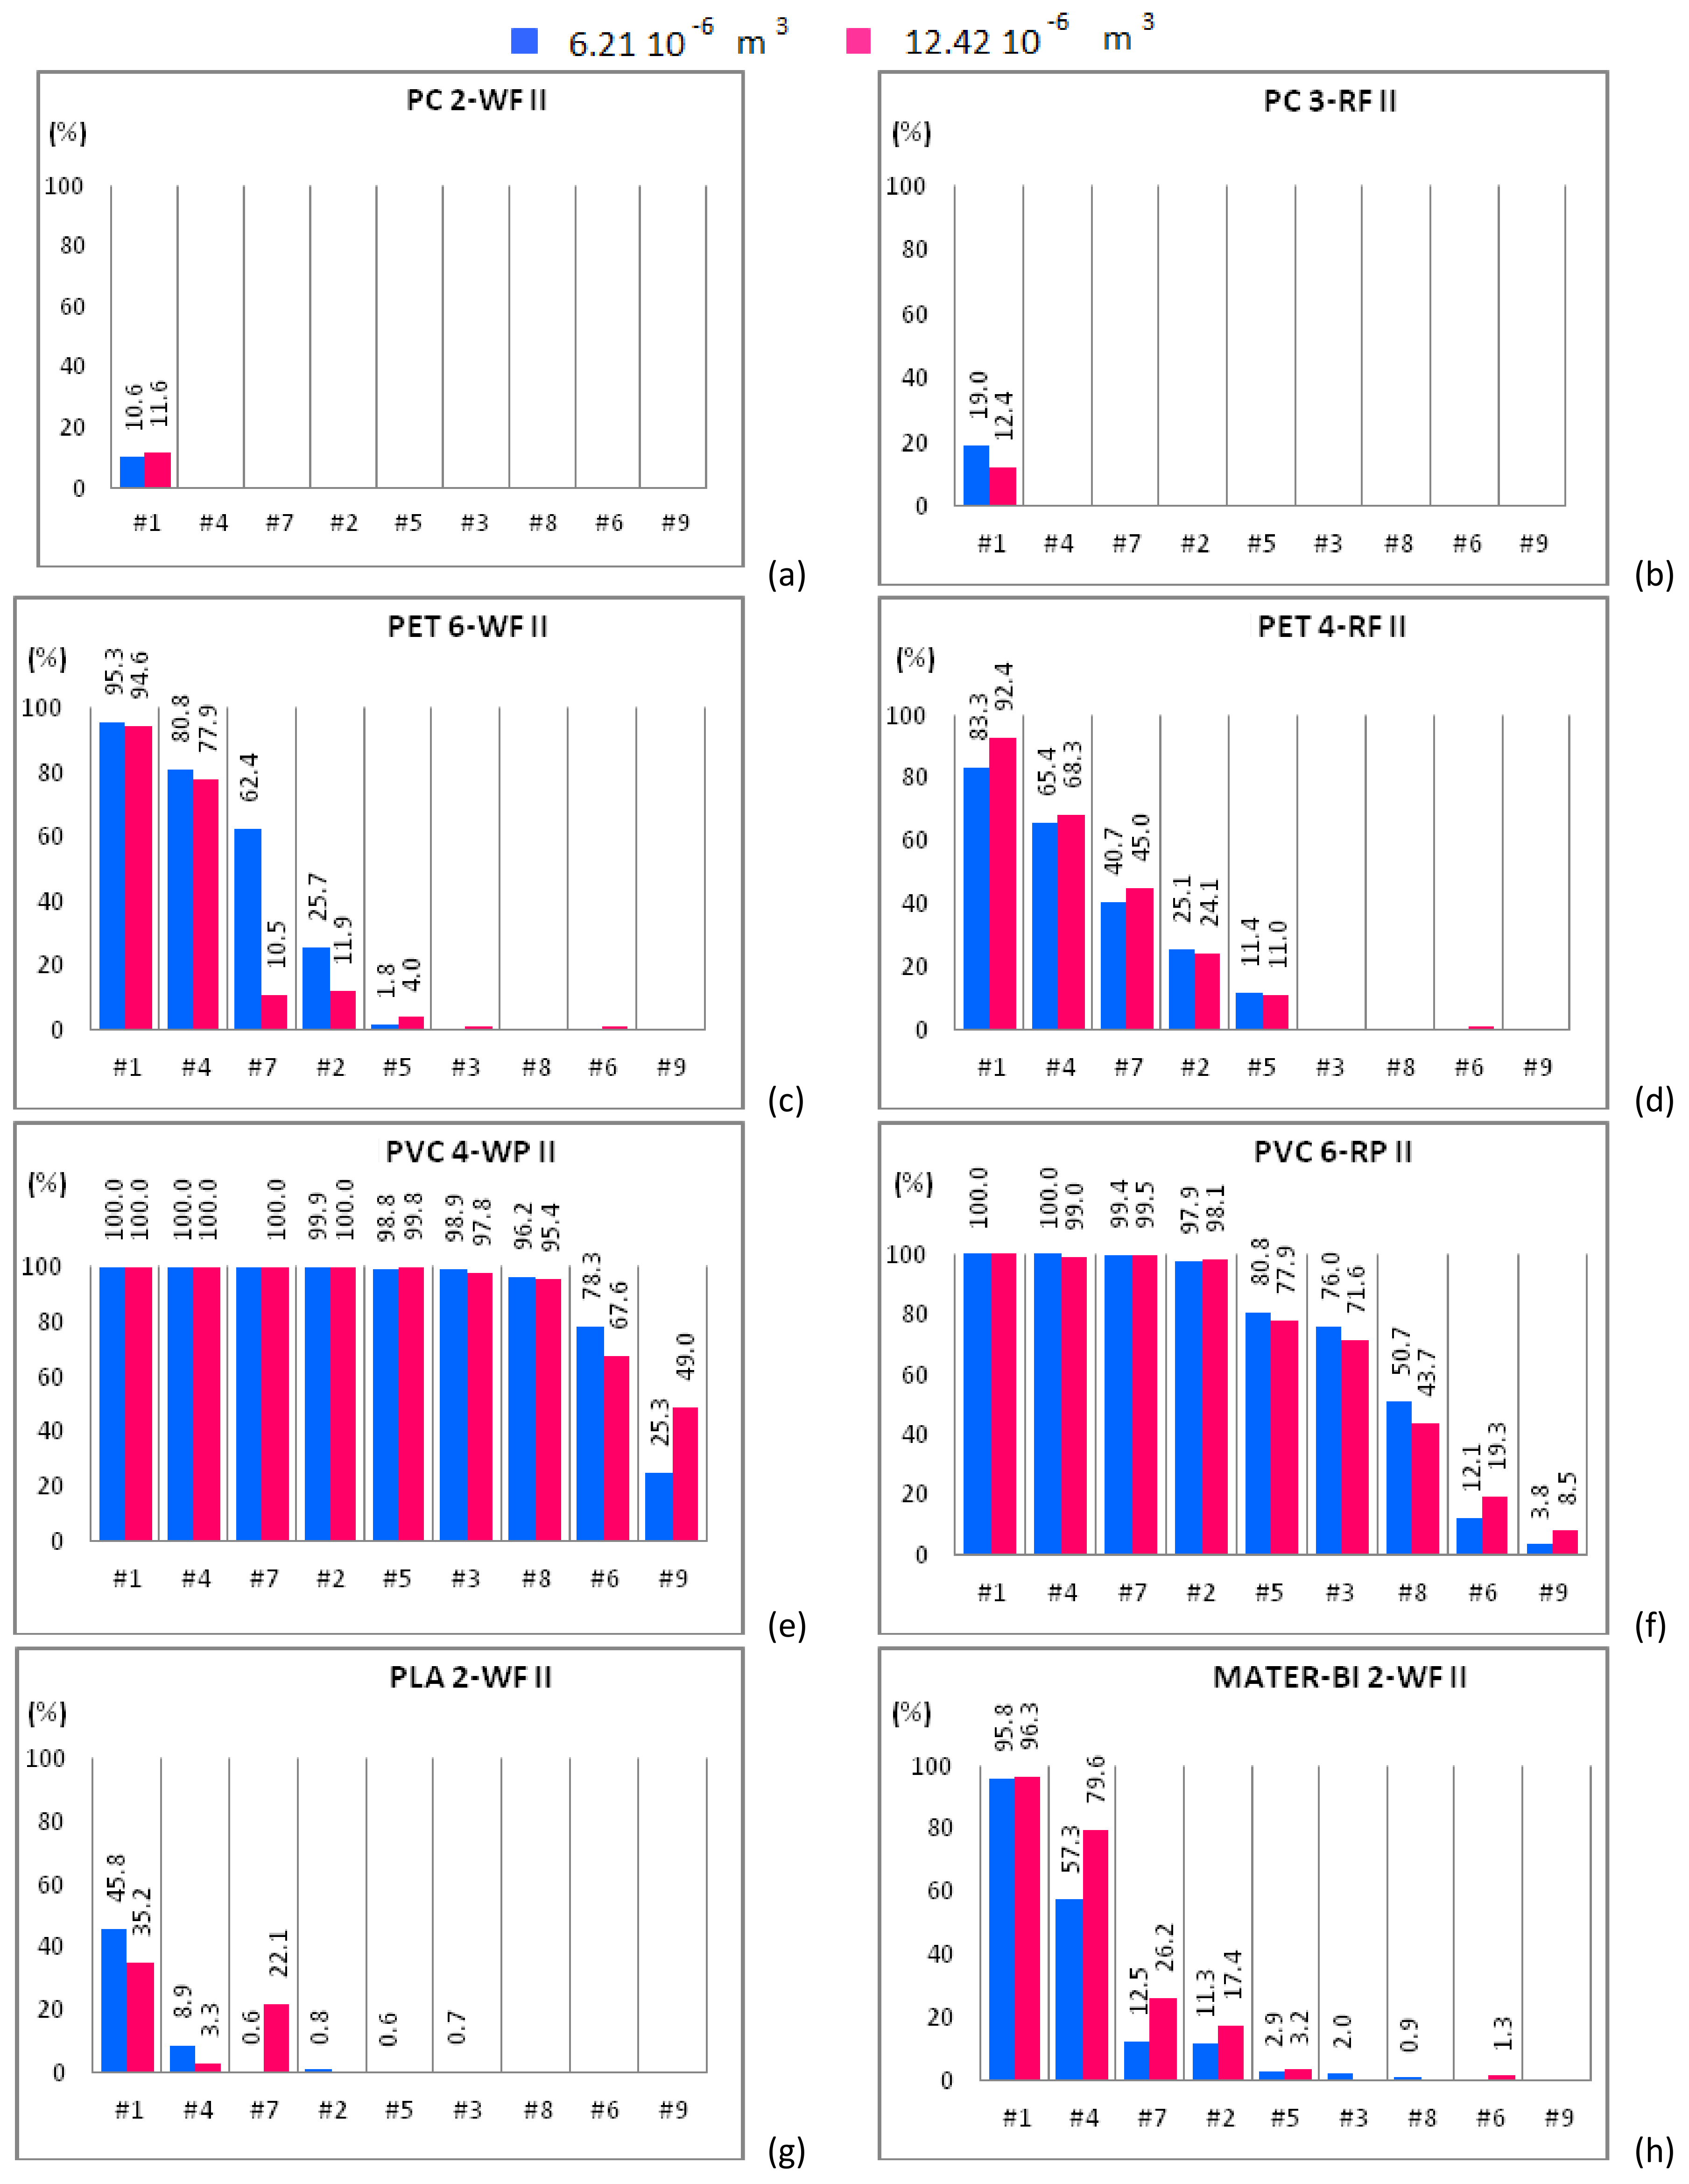
The sedimentation efficacy, η, defined as the ratio between the amount of material settled within the apparatus and the material treated within the separator, makes it possible to understand whether and how the increase of the solid phase volume fraction, i.e., the two-way coupling forces, influences the separation efficacy. Each plot of Figure 4, Figure 5 and Figure 6 shows η of the plastic sample for both solid volumes, i.e., 6.21 × 10⁻⁶ m3 (blue bars) and 12.42 × 10⁻⁶ m3 (red bars). Additionally, η is plotted for increasing fluid flow rate.
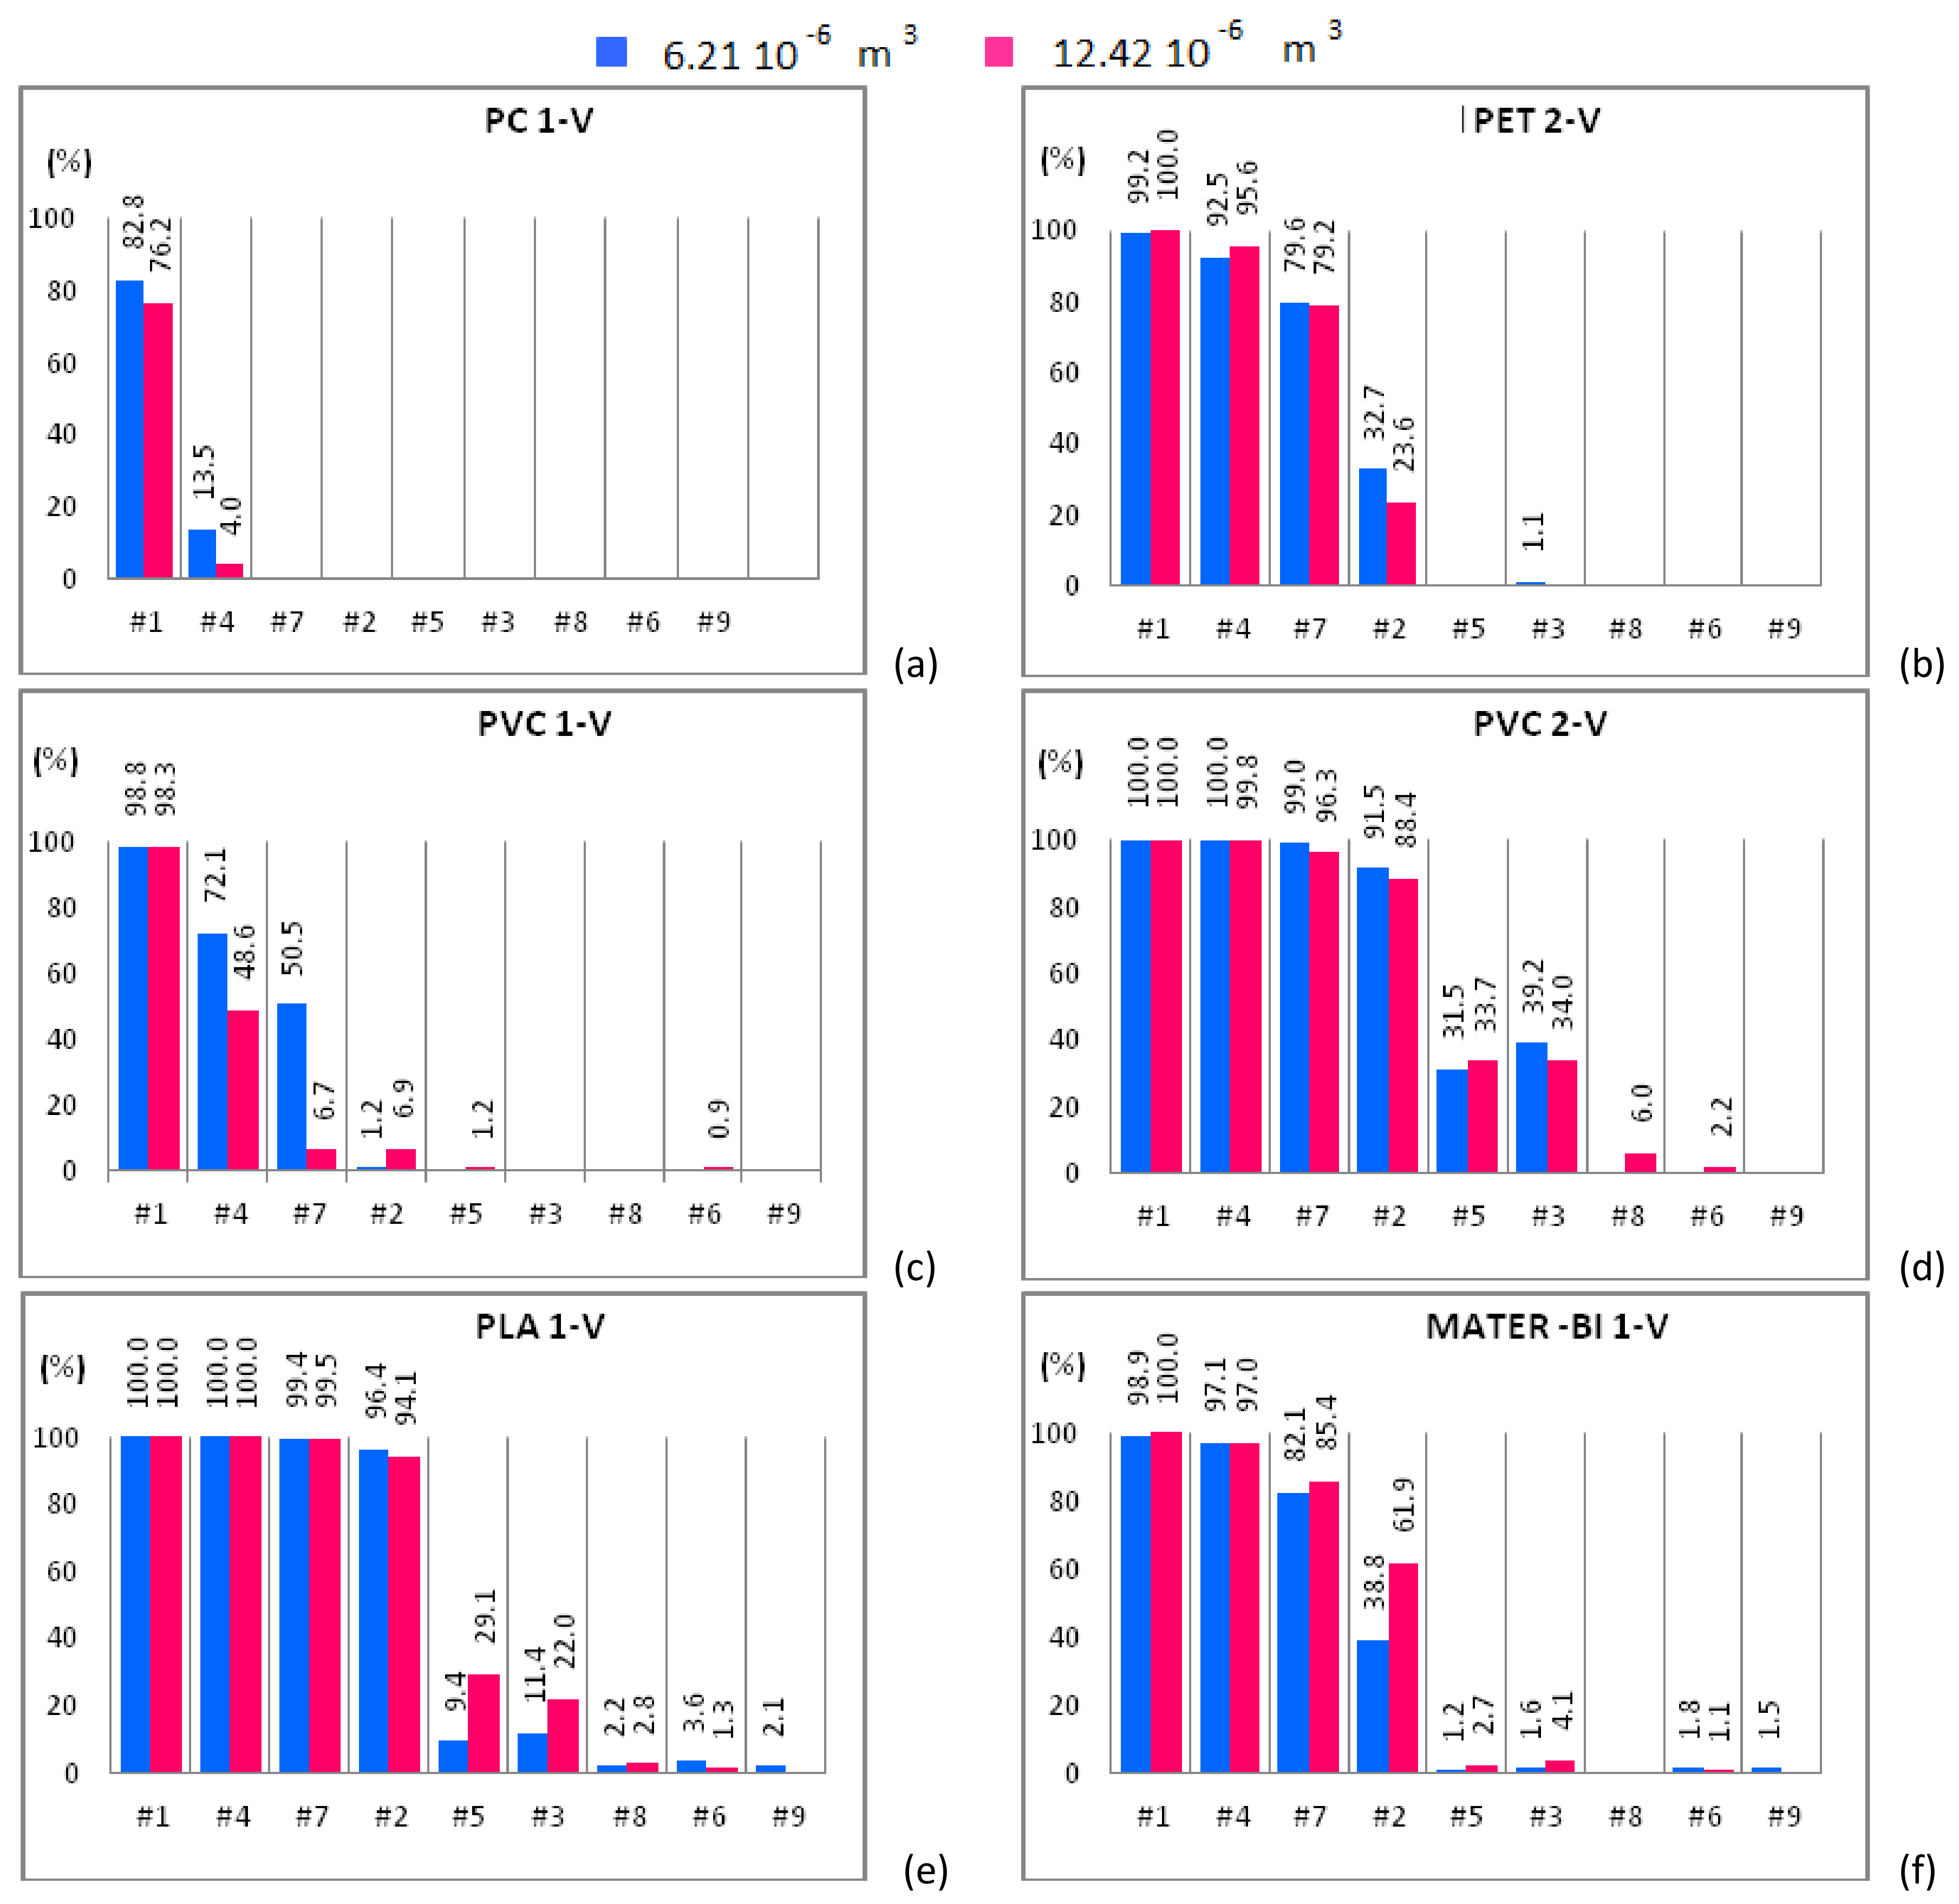
Figure 4a shows that PC 2-WF, belonging to the size class I, is completely expelled from the apparatus except for case #1 and 12.42 × 10⁻⁶ m3 of solid particles input to the device, being in this case roughly 5% the amount of material that settles in the separator chambers. PC 2-WF, belonging to the size class II, behaves as the PC 2-WF that belongs to size class I (Figure 5a) and is completely expelled from the apparatus in all cases except case #1. For this sample, the amount of polymer settled within the device slightly increases, doubling the volume of the sample. For the same fluid flow rate (case #1) and both solid volume fractions, a higher sedimentation efficacy is observed for the samples with solid particles belonging to the larger size class. Samples of PC 3-RF, belonging to both size classes, are completely expelled from the experimental apparatus for all hydraulic configurations but for case #1. For case #1, the test conducted with a solid volume of 6.21 × 10⁻⁶ m3 of PC 3-RF belonging to the size class I (Figure 4b) shows that the polymer settles in a higher percentage (11.4%) than in the other case (3.4%). The analogous behavior was observed for PC 3-RF belonging to the size class II with different percentages, 19% instead of 12.4% (Figure 5b). Then, PC 3-RF shows a different behavior respect to PC 2-WF since increasing the concentration of solid material, the percentage of material settling within the apparatus decreases. The different behavior of PC samples is related to the shape of the particles, which influences the sedimentation efficacy. PC 2-WF particles have a flat surface and a very jagged perimeter while PC 3-RF particles have a flat, more regular surface. PC 1-V is completely expelled from the separator for all cases except for cases #1 and #4 (Figure 6a). In both of these cases, by increasing the volume of solid particles, sedimentation is disadvantaged. Therefore, due to their regular shape, the behavior of PC 1-V granules is more similar to PC 3-RF than to PC 2-WF.
PET 6-WF belonging to the size class I (Figure 4c) is completely expelled from the apparatus for flow rates larger than 1.08 L/s (case #3). For case #1 and 6.21 × 10⁻⁶ m3 of solid volume treated within the device, 88% of the polymer settles within the separator chambers, whereas 90.3% of the solid volume settles after doubling the sample. A similar behavior was observed for case #4, when 43.3% and 57.5% of material settles within the apparatus when 6.21 × 10⁻⁶ m3 and 12.42 × 10⁻⁶ m3 of solid volume are treated within the device respectively. For case #7, the opposite behavior is observed. In fact, the percentage of material settling within the apparatus decreases (from 28.1% to 18.7%) as the amount of material treated within the apparatus is doubled. For case #2, the percentage of material settling within the apparatus is almost the same regardless of the volume treated within the apparatus. Insignificant or null quantities of polymer settle within the apparatus for case #5 and both solid volumes. For case #1, roughly 95% of PET 6-WF belonging to size class II settles within the hydraulic channel regardless of the volume treated within the apparatus (Figure 5c). For case #4, the test carried out with 6.21 × 10⁻⁶ m3 of solid phase volume shows a larger percentage of polymer settling within the apparatus (80.8%) than the other test. Analogously, by increasing the flow rate (case #7), the percentage of material settling within the apparatus is larger (62.4% instead of 10.5%) for a smaller amount of solid volume treated within the apparatus. Also, for case #2, when 6.21 × 10⁻⁶ m3 of solid volume is treated within the device, the percentage of material settling within the apparatus is larger than in the other case, i.e., 25.7% instead of 11.9%. Further increasing the flow rate, an opposite behavior is observed, i.e., a larger percentage of material settles when a larger amount of material is treated within the apparatus. For the two solid volumes treated within the apparatus and for the hydraulic configuration denoted case #1, roughly the same percentage of PET 4-RF belonging to the size class I settles (82% and 83.6%; Figure 4d). For case #4, a smaller percentage of the sample settles within the apparatus when smaller quantities of polymer are treated within the device (39.7% rather than 47.6%). The opposite behavior is observed for case #7. In this case, a smaller percentage of sample was collected in the separator chambers when 6.21 × 10⁻⁶ m3 of solid volume was treated within the device (32.7% rather than 27%). For case #2, roughly the same percentage of material settles for both solid volumes investigated. The behavior of PET 4-RF belonging to the size class II is analogous to the one described for the material belonging to the lower size class (Figure 5d). The PET sample of virgin material (PET 2-V) behaves similarly to waste or regenerated PET samples (Figure 6b). For case #1 and both solid volumes treated within the apparatus, the polymer completely settles. For case #4, for tests employing 6.21 × 10⁻⁶ m3 of solid volume, 92% of the sample settles whereas, doubling the solid volume treated within the device, 95% of plastic material remains within the apparatus. For case #7, a similar percentage of material settles for both the solid volumes. For case #2, the amount of material settling within the device seems to depend on the solid volume treated. In this case, 32.7% and 23.6% of polymer can be collected within the device for 6.21 × 10⁻⁶ m3 and 12.42 × 10⁻⁶ m3 solid volume samples respectively. The polymer is completely expelled from the apparatus for cases #5, #3, #8, #6, and #9 and both solid volumes. All PET samples show that for a low fluid phase velocity, the increase of the solid volume fraction determines the increase of the sedimentation efficacy. In fact, increasing the volume of solid particles treated within the device, the fluid phase slows down and the sedimentation processes is favored. For large flow rates, the fluid phase velocity increases as well as drag effects on the particles. Then those particles reach the outlet ducts in larger amounts determining a reduction of the sedimentation efficacy.
PVC 4-WP belonging to the size class I (Figure 4e) completely settles within the device for low values of the fluid flow rate (cases #1, #4, #7). For case #2, more than 43% of polymer settles for both solid volumes. For cases #5 and #3, tests conducted treating 6.21 × 10⁻⁶ m3 of solid particles show a lower percentage of material settling within the device with respect to tests with 12.42 × 10⁻⁶ m3 of solid particles (Figure 4e). Instead, for cases #8, #6, and #9, a larger percentage of solid particles settle within the device for the 6.21 × 10⁻⁶ m3 volume tests than for the 12.42 × 10⁻⁶ m3 volume ones. For cases #1, #4, #7, and #2, PVC 4-WP belonging to the size class II (Figure 5e) completely settles within the device. For cases #3 and #8, the percentage of material settling within the device is higher than 95% and slightly larger when a lower amount of polymer is treated within the device. For case #6, 78% of the sample settles within the device when 6.21 × 10⁻⁶ m3 of solid particles are treated while 67% of the polymer can be collected in the separator chambers when the solid volume is doubled. For case #9, the larger is the amount of polymer treated within the device, the higher is the percentage of material settling within the device (49% instead of 25%). For cases #1, #4, and #7, the same percentage of PVC 6-RP belonging to the size class I (Figure 4f) settles in the separator chambers for both solid volumes treated within the device. For cases #2 and #5, a higher percentage of polymer settles within the device for the test with the larger amount of solid volume (77.9% instead of 70.5% and 12.7% instead of 9.4%). For cases #3 and #8, the opposite occurs. For case #9, the polymer is completely expelled from the device. For cases #1, #4, #7 and #2, PVC 6-RP belonging to the size class II (Figure 5f) almost completely settles in the device. For cases #5, #3 and #8, the percentage of material settling within the device is higher for the tests conducted with samples of smaller volume. The opposite behavior was observed for cases #6 and #9. For case #1, PVC 1-V almost completely settles in the separator chambers for both volumes treated within the device (Figure 6c). For cases #4 and #7, a remarkable difference between the percentages of material that settles within the chambers as a function of the amount of material treated within the device was observed. In fact, the tests conducted inserting 6.21 × 10⁻⁶ m3 of solid particles show a significantly higher percentage of settled material with respect to the tests where the amount of treated material was doubled. For cases #2 and #5, an opposite behavior was observed. In fact, as the fluid flow rate increases, a higher percentage of material settles within the separator chambers when 12.42 × 10⁻⁶ m3 rather than 6.21 × 10⁻⁶ m3 of solid particles are treated within the device. For low flow rates, PVC 2-V completely settles in the separator chambers for both volumes treated within the device (Figure 6d). For cases #7 and #2, a slightly larger percentage of solid particles settles within the chambers in the tests with 6.21 × 10⁻⁶ m3 of polymer treated within the device. The opposite occurs for cases #5, #8, and #6. Therefore, for low values of the flow rate (lower than 1 L/s), no remarkable differences in the percentage of PVC sample settling within the device were observed for both solid volumes investigated. For slightly larger values of the flow rate, between 1 L/s and 1.13 L/s, the increase in the amount of solid material introduced into the separator results in a reduction of the sedimentation efficacy, since the interaction between the solid and the fluid phases is more effective and the fluid phase tends to drag the solid particles towards the outlet ducts. For values of the flow rate larger than 1.13 L/s, increasing the amount of material treated within the device, a higher percentage of solid particles tend to settle within the apparatus.
For case #1, a small percentage of PLA 2-WF belonging to the size class I (Figure 4g) settles in the separator chambers in the test with 6.21 × 10⁻⁶ m3 of polymer treated within the device. The increase of the solid volume determines the increase of the sedimentation efficacy. The bio-plastics is almost completely expelled from the apparatus for flow rates larger than 0.84 L/s. For cases #1 and #4, a remarkable percentage of PLA 2-WF belonging to the size class II settles in the separator chambers when a lower amount of polymer is treated within the device (45.8% instead of 35.2% and 8.9% instead of 3.3% respectively). An opposite behavior was observed for case #7, being the percentage of settled material equal to 22.1% when 12.42 × 10⁻⁶ m3 of bio-plastics are treated within the device and almost equal to 0% for half volume. For cases #1, #4 and #7, PLA 1-V (Figure 6e) completely settles within the separator chambers. For case #2, the percentage of PLA 1-V settling in the separator is remarkable for both volumes (roughly 96%). For cases #5, #3, and #8, a smaller percentage of bio-polymer settles for the smaller solid volume case (6.21 × 10⁻⁶ m3). The sample is completely expelled from the apparatus for flow rates larger than 1.24 L/s.
For case #1, the larger is the amount of MATER-BI 2-WF belonging to the size class I treated within the device, the larger is the percentage of settled material (85% instead of 79.2%; Figure 4h). A similar behavior was observed for cases #4 and #7 (26.1% instead of 16.7% and 3.3% instead of 1.2% respectively). Instead, the opposite behavior was observed for case #2. For case #1, MATER-BI 2-WF belonging to the size class II settles in analogous percentages for both volumes of material treated within the device (Figure 5h). Increasing the flow rate (cases #4, #7 and #2), larger percentages of MATER-BI 2-WF belonging to the size class II settle in the separator chambers when 12.42 × 10⁻⁶ m3 of solid volume are treated within the device rather than 6.21 × 10⁻⁶ m3. For cases #1 and #4, a considerable percentage of MATER–BI 1-V (Figure 6f) settles in the separator chambers for both solid volumes treated within the device. For cases #7 and #2, the sedimentation efficacy is remarkable (higher than 17%) and larger when larger amounts of bio-polymer are treated. The sedimentation efficacy is lower than 4% for flow rates larger than 1.08 L/s.
3.3. Multi-Material Separation Tests
Multi-material tests were conducted with mixtures of traditional plastics, i.e., PET-PVC, PET-PC and PVC-PC, and mixtures of traditional and bio-plastics, i.e., PET-PLA. Both grade and recovery were computed because the separation process may be considered effective if both quantities are remarkable, i.e., the useful phase is not contaminated by the other material and a considerable amount of useful fraction is recovered from the initial sample.
The results of multi-material separation tests conducted with mixtures of traditional plastics of volume equal to 12.42 × 10⁻⁶ m3 are similar to the ones described in [13]. Also increasing the volume of the sample, the content of the useful phase has always been improved no matter its initial concentration in the mixture and the polymer separation is generally enhanced for particles of larger size and it is not influenced by the shape of the particles. More specifically, for plastic particles belonging to size class II, an almost pure concentrate of PET was obtained from a mixture of 85% PET and 15% PC (PET grade and recovery in the product equal to 97.8% and 64.17% respectively) and a mixture of 85% PET and 15% PVC (PET grade and recovery in the product equal to 98.2% and 100.0% respectively). It was further demonstrated that almost pure concentrates of PVC and PC can be produced from mixtures of 85% PVC and 15% PC (PVC grade and recovery in the product equal to 98.9% and 100.0% respectively) and 85% PC and 15% PVC (PC grade and recovery in the product equal to 100% and 94.7% respectively).
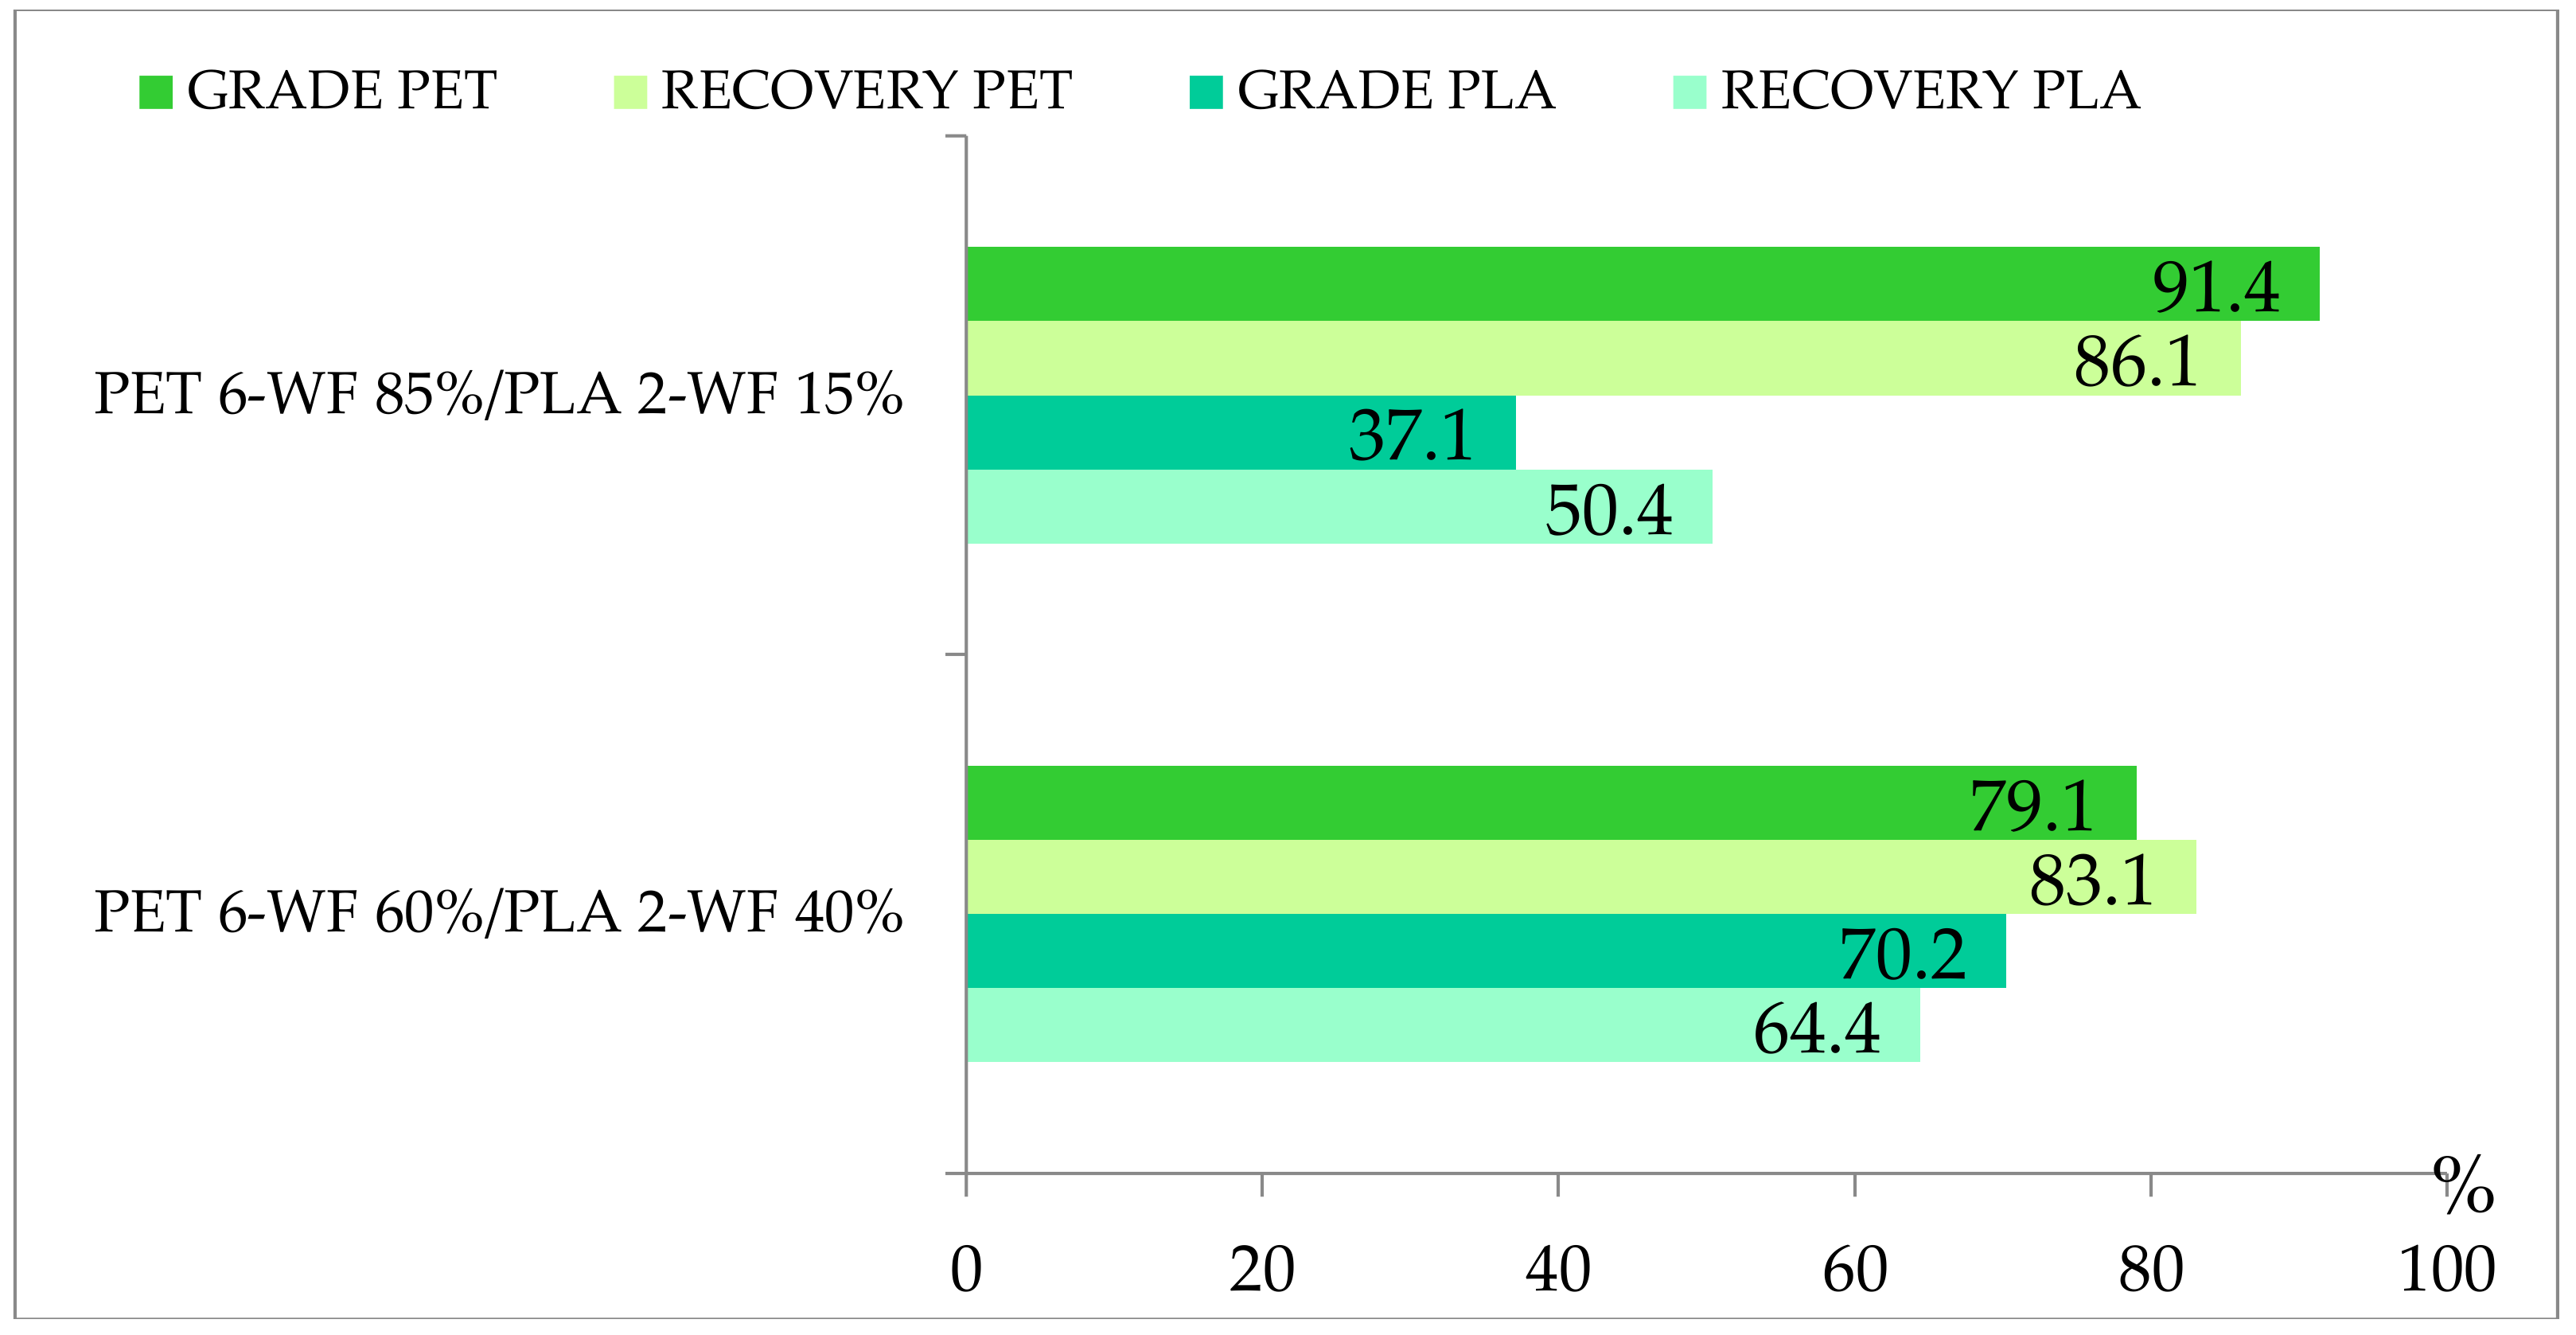
Multi-material tests conducted on mixtures of PET and PLA of 12.42 × 10⁻⁶ m3 volume have never been presented and will be described next. The motivation for these tests was the attempt to understand if the hydraulic separator is suitable to separate bio-plastic waste materials that may enter a mechanical recycling process and act as pollutant of the traditional polymers to be recovered. Mixtures of PET 6-WF and PLA 2-WF belonging to size class I were employed. Tests with PET 4-RF were not conducted because its characteristics are very similar to PET 6-WF. Mono-material separation tests showed that for case #1 PET mostly settles within the separator chambers, while PLA is mainly expelled. Multi-material tests were conducted using mixtures of 85% PET and 15% PLA and 60% PET and 40% PLA because the percentage of PLA expected in the plastic waste stream is lower than the percentage of PET. Figure 7 shows the remarkable grade of PET (91.4%) obtained for case #1 and mixture with 85% PET and 15% PLA. PET grade slightly decreases (79%) when the percentage of PET in the sample decreases. The recovery of PET is remarkably consistent no matter its initial concentration (86.0% and 83.0%).
4. Conclusions
In this contribution, separation tests made it possible to evaluate the efficacy of the hydraulic separator for the separation of various traditional and bio-polymers. The mono-material tests carried out with solid material samples of 6.21 × 10⁻⁶ m3 and 12.42 × 10⁻⁶ m3 demonstrate that, at specific hydraulic configurations, there are no significant differences in the percentage of settled material within the experimental apparatus. This implies the possibility to treat a greater amount of solid material in the same amount of time. It is worth noting that with respect to the tests conducted with 6.21 × 10⁻⁶ m3 of solid material, tests with 12.42 × 10⁻⁶ m3 of solid phase demonstrated that as long as the particle sedimentation velocity is comparable to the fluid phase velocity, the solid particles tend to settle to a lesser extent. Conversely, when the fluid phase velocity is greater than the sedimentation velocity of the particles, the opposite behavior was observed. In fact, a greater percentage of material settles in the 12.42 × 10⁻⁶ m3 volume tests, mainly for regular shape samples. The different behavior is related to the increased turbulence that develops within the apparatus as the fluid flow increases, which results in an enhanced solid-fluid interaction. Increasing the size of the solid particles, the force exerted by the solid phase on the fluid phase increases and a higher percentage of solid material ends up settling.
Multi-material tests carried out with a solid volume of 12.42 × 10⁻⁶ m3 confirm the possibility of separating one polymer from a mixture consisting of two polymers with different physical characteristics. The comparison of multi-material separation tests conducted with solid samples of 6.12 × 10⁻⁶ m3 [13] and 12.42 × 10⁻⁶ m3 shows that no significant variations of the separation efficacy occur. Thus, even by increasing the solid volume treated per unit time, the hydraulic separator is suitable to recover high-quality products.
Mono-material tests conducted on PLA samples showed that the hydraulic separator can be effectively employed to separate the bio-polymer. Multi-material separation tests were performed using 85% PET and 15% PLA and 60% PET and 40% PLA samples: samples with a lower amount of bio-plastics with respect to the amount of the traditional polymer. Those tests produced an almost pure concentrate of PET with remarkable grade and recovery.
Author Contributions
M.M., F.L.M. and E.L. conceived and designed the experiments; E.L., A.P. and V.D.P. performed the experiments; M.M., E.L., A.P. and V.D.P. analyzed the data; M.M. wrote the paper.
Conflicts of Interest
The authors declare no conflict of interest.
References
- PlasticsEurope. Plastics—the Facts 2016. An Analysis of European Latest Plastics Production, Demand and Waste Data; PlasticsEurope: Frankfurt am Main, Germany, 2016. [Google Scholar]
- Anuar Sharuddin, S.D.; Abnisa, F.; Wan Daud, W.M.A.; Aroua, M.K. A review on pyrolysis of plastic wastes. Energy Convers. Manag. 2016. [Google Scholar] [CrossRef]
- Moroni, M.; Lupo, E.; La Marca, F. Hydraulic separation of plastic wastes: Analysis of liquid-solid interaction. Waste Manag. 2017, 66, 13–22. [Google Scholar] [CrossRef] [PubMed]
- Hopewell, J.; Dvorak, R.; Kosior, E. Plastics recycling: Challenges and opportunities. Philos. Trans. R. Soc. B 2009, 364, 2115–2126. [Google Scholar] [CrossRef] [PubMed]
- Bezati, F.; Froelich, D.; Massardier, V.; Maris, E. Addition of X-ray fluorescent tracers into polymers, new technology for automatic sorting of plastics: Proposal for selecting some relevant tracers. Resour. Conserv. Recycl. 2011, 55, 1214–1221. [Google Scholar] [CrossRef]
- Luciani, V.; Bonifazi, G.; Rem, P.; Serranti, S. Upgrading of PVC rich wastes by magnetic density separation and hyperspectral imaging quality control. Waste Manag. 2015, 45, 118–125. [Google Scholar] [CrossRef] [PubMed]
- Park, C.H.; Jeon, H.S.; Park, J.K. PVC removal from mixed plastics by triboelectrostatic separation. J. Hazard. Mater. 2017, 144, 470–476. [Google Scholar] [CrossRef] [PubMed]
- Wu, G.; Li, J.; Xu, Z. Triboelectrostatic separation for granular plastic waste recycling: A review. Waste Manag. 2013, 33, 585–597. [Google Scholar] [CrossRef] [PubMed]
- Wang, C.; Wang, H.; Fu, J.; Zhang, L.; Luo, C.; Liu, Y. Flotation separation of polyvinyl chloride and polyethylene terephthalate plastics combined with surface modification for recycling. Waste Manag. 2015, 45, 112–117. [Google Scholar] [CrossRef] [PubMed]
- Mallampati, S.R.; Lee, B.H.; Mitoma, Y.; Simion, C. Selective sequential separation of ABS/HIPS and PVC from automobile and electronic waste shredder residue by hybrid nano-Fe/Ca/CaO assisted ozonisation process. Waste Manag. 2017, 60, 428–438. [Google Scholar] [CrossRef] [PubMed]
- Thanh Truc, N.T.; Lee, C.-H.; Lee, B.-K.; Mallampati, S.R. Surface hydrophilization of acrylonitrile butadiene styrene by the mild heat treatment for its selective separation to recycling. Sep. Purif. Technol. 2017, 173, 226–232. [Google Scholar] [CrossRef]
- Yuan, H.; Fu, S.; Tan, W.; He, J.; Wu, K. Study on the hydrocyclonic separation of waste plastics with different density. Waste Manag. 2015, 45, 108–111. [Google Scholar] [CrossRef] [PubMed]
- Lupo, E.; Moroni, M.; La Marca, F.; Fulco, S.; Pinzi, V. Investigation on an innovative technology for wet separation of plastic wastes. Waste Manag. 2016, 51, 3–12. [Google Scholar] [CrossRef] [PubMed]
- Crowe, C.T. Multiphase Flow Handbook; Taylor & Francis Group, LLC: Boca Raton, FL, USA, 2006. [Google Scholar]
- Di Giacinto, M.; Sabetta, F.; Piva, R. Two-Way coupling effects in dilute gas-particle flows. J. Fluid Eng. 1982, 104, 304–311. [Google Scholar] [CrossRef]
Figure 1.
Picture of the hydraulic separation channel with inlet and outlet ducts.

Figure 2.
Images of (a) virgin granules, (b) waste samples in pieces and flakes and (c) regenerated materials.
Figure 2.
Images of (a) virgin granules, (b) waste samples in pieces and flakes and (c) regenerated materials.

Figure 3.
Picture used to compute the shape factor of MATER-BI 2-WF particles belonging to size class II.
Figure 3.
Picture used to compute the shape factor of MATER-BI 2-WF particles belonging to size class II.

Figure 4.
Mono-material separation test results expressed in terms of sedimentation efficacy for waste and regenerated samples belonging to size class I shown for increasing flow rates. Samples of 6.21 × 10⁻⁶ m3 (blue bars) and 12.42 × 10⁻⁶ m3 (red bars) are plotted in the same graph. (a) PC 2-WF; (b) PC 3-RF; (c) PET 6-WF; (d) PET 4-RF; (e) PVC 4-WP; (f) PVC 6-RP; (g) PLA 2-WF and (h) MATER-BI 2-WF samples.

Figure 5.
Mono-material separation test results expressed in terms of sedimentation efficacy for waste and regenerated samples belonging to size class II shown for increasing flow rates. Samples of 6.21 × 10⁻⁶ m3 (blue bars) and 12.42 × 10⁻⁶ m3 (red bars) are plotted in the same graph. (a) PC 2-WF; (b) PC 3-RF; (c) PET 6-WF; (d) PET 4-RF; (e) PVC 4-WP; (f) PVC 6-RP; (g) PLA 2-WF and (h) MATER-BI 2-WF samples

Figure 6.
Mono-material separation test results expressed in terms of sedimentation efficacy for virgin material samples shown for increasing flow rates. Samples of 6.21 × 10⁻⁶ m3 (blue bars) and 12.42 × 10⁻⁶ m3 (red bars) are plotted in the same graph. (a) PC 1-V; (b) PET 2-V; (c) PVC 1-V; (d) PVC 2-V; (e) PLA 1-V and (f) MATER-BI 1-V samples

Figure 7.
Grade and recovery of Polyethylene Terephthalate (PET) and Polylactic Acid (PLA) for multi-material tests of PET 6-WF/PLA 3-WF, hydraulic configuration case #1.
Figure 7.
Grade and recovery of Polyethylene Terephthalate (PET) and Polylactic Acid (PLA) for multi-material tests of PET 6-WF/PLA 3-WF, hydraulic configuration case #1.


Table 1.
Polymer sample characteristics: life cycle stage (virgin (V), waste (W), regenerated (R)), shape (granular (G), flake (F), piece (P)), density, size class.
Table 1.
Polymer sample characteristics: life cycle stage (virgin (V), waste (W), regenerated (R)), shape (granular (G), flake (F), piece (P)), density, size class.
| Name | Life Cycle Stage | Shape | Density (kg/m3) | Size Class |
|---|---|---|---|---|
| PC 1-V | Virgin material | Granules | 1180 | II |
| PC 2-WF | Waste | Flakes | 1210 | I, II |
| PC 3-RF | Regenerated material | Flakes | 1200 | I, II |
| PET 2-V | Virgin material | Granules | 1310 | I |
| PET 6-WF | Waste | Flakes | 1350 | I, II |
| PET 4-RF | Regenerated material | Flakes | 1330 | I, II |
| PVC 1-V | Virgin material | Granules | 1190 | I |
| PVC 2-V | Virgin material | Granules | 1300 | II |
| PVC 4-WP | Waste | Pieces | 1610 | I, II |
| PVC 6-RP | Regenerated material | Pieces | 1440 | I, II |
| PLA 1-V | Virgin material | Granules | 1240 | II |
| PLA 2-WF | Waste | Flakes | 1220 | I,II |
| MATER-BI 1-V | Virgin material | Granules | 1250 | II |
| MATER-BI 2-WF | Waste | Flakes | 1230 | I,II |
Table 2.
Characteristic dimension and shape factor of traditional and bio-plastic particles.
| Name | Particle Characteristic Dimension (10−3 m) | Shape Factor |
|---|---|---|
| PC 1-V | 3.17 | 0.85 |
| PC 2-WF | 2.33 | 0.43 |
| 2.78 | 0.36 | |
| PC 3-RF | 2.98 | 0.53 |
| 3.59 | 0.51 | |
| PET 2-V | 2.64 | 0.83 |
| PET 6-WF | 3.31 | 0.60 |
| 3.93 | 0.49 | |
| PET 4-RF | 2.91 | 0.44 |
| 3.88 | 0.51 | |
| PVC 1-V | 3.05 | 0.87 |
| PVC 2-V | 3.19 | 0.84 |
| PVC 4-WP | 3.39 | 0.81 |
| 4.41 | 0.74 | |
| PVC 6-RP | 3.50 | 0.75 |
| 5.04 | 0.78 | |
| PLA 1-V | 3.95 | 0.99 |
| PLA 2-WF | 1.99 | 0.34 |
| 2.63 | 0.29 | |
| MATER-BI 1-V | 3.94 | 0.95 |
| MATER-BI 2-WF | 3.26 | 0.65 |
| 4.10 | 0.58 |
Table 3.
Flow rate, characteristic velocity, Reynolds number, and characteristic time of the fluid phase for the cases investigated.
Table 3.
Flow rate, characteristic velocity, Reynolds number, and characteristic time of the fluid phase for the cases investigated.
| Case | Flow Rate (L/s) | Fluid Phase Characteristic Velocity (m/s) | Reynolds Number | Fluid Phase Characteristic Time (s) |
|---|---|---|---|---|
| #1 | 0.72 | 0.078 | 1950 | 0.32 |
| #4 | 0.84 | 0.084 | 2100 | 0.30 |
| #7 | 0.92 | 0.095 | 2375 | 0.26 |
| #2 | 0.92 | 0.100 | 2500 | 0.25 |
| #5 | 1.08 | 0.110 | 2750 | 0.23 |
| #3 | 1.08 | 0.112 | 2800 | 0.22 |
| #8 | 1.22 | 0.123 | 3075 | 0.20 |
| #6 | 1.24 | 0.130 | 3250 | 0.19 |
| #9 | 1.36 | 0.136 | 3400 | 0.18 |
Table 4.
Particle sedimentation velocity and relaxation time, particle Reynolds number for samples belonging to the size class I.
Table 4.
Particle sedimentation velocity and relaxation time, particle Reynolds number for samples belonging to the size class I.
| Name | Particle Sedimentation Velocity (m/s) | Particle Reynolds Number | Particle Relaxation Time (s) |
|---|---|---|---|
| PC 2-WF | 0.08 | 187 | 0.06 |
| PC 3-RF | 0.09 | 264 | 0.08 |
| PET 2-V | 0.10 | 274 | 0.06 |
| PET 6-WF | 0.12 | 396 | 0.08 |
| PET 4-RF | 0.12 | 338 | 0.07 |
| PVC 1-V | 0.09 | 266 | 0.08 |
| PVC 4-WP | 0.17 | 560 | 0.08 |
| PVC 6-RP | 0.14 | 498 | 0.09 |
| PLA 2-WF | 0.08 | 151 | 0.05 |
| MATER-BI 2-WF | 0.10 | 323 | 0.08 |
Table 5.
Particle sedimentation velocity and relaxation time, particle Reynolds number for samples belonging to the size class II.
Table 5.
Particle sedimentation velocity and relaxation time, particle Reynolds number for samples belonging to the size class II.
| Name | Particle Sedimentation Velocity (m/s) | Particle Reynolds Number | Particle Relaxation Time (s) |
|---|---|---|---|
| PC 1-V | 0.09 | 274 | 0.08 |
| PC 2-WF | 0.09 | 244 | 0.07 |
| PC 3-RF | 0.10 | 348 | 0.09 |
| PET 6-WF | 0.13 | 512 | 0.10 |
| PET 4-RF | 0.13 | 519 | 0.10 |
| PVC 2-V | 0.11 | 357 | 0.08 |
| PVC 4-WP | 0.19 | 830 | 0.11 |
| PVC 6-RP | 0.17 | 859 | 0.13 |
| PLA 1-V | 0.11 | 441 | 0.10 |
| PLA 2-WF | 0.09 | 229 | 0.07 |
| MATER-BI 1-V | 0.11 | 448 | 0.10 |
| MATER-BI 2-WF | 0.11 | 456 | 0.11 |
Table 6.
Stokes number for samples belonging to the size class I.
| Name | St | |
|---|---|---|
| Case #1 | Case #9 | |
| PC 2-WF | 0.173 | 0.316 |
| PC 3-RF | 0.230 | 0.420 |
| PET 2-V | 0.193 | 0.352 |
| PET 6-WF | 0.247 | 0.451 |
| PET 4-RF | 0.214 | 0.391 |
| PVC 1-V | 0.238 | 0.434 |
| PVC 4-WP | 0.255 | 0.466 |
| PVC 6-RP | 0.261 | 0.476 |
| PLA 2-WF | 0.143 | 0.261 |
| MATER-BI 2-WF | 0.250 | 0.457 |
Table 7.
Stokes number for samples belonging to the size class II.
| Name | St | |
|---|---|---|
| Case #1 | Case #9 | |
| PC 1-V | 0.250 | 0.456 |
| PC 2-WF | 0.212 | 0.387 |
| PC 3-RF | 0.283 | 0.517 |
| PET 6-WF | 0.298 | 0.544 |
| PET 4RF | 0.294 | 0.535 |
| PVC 2-V | 0.239 | 0.435 |
| PVC 4-WP | 0.338 | 0.617 |
| PVC 6-RP | 0.386 | 0.703 |
| PLA 1-V | 0.308 | 0.562 |
| PLA 2-WF | 0.197 | 0.360 |
| MATER-BI 1-V | 0.306 | 0.558 |
| MATER-BI 2-WF | 0.322 | 0.588 |
© 2018 by the authors. Licensee MDPI, Basel, Switzerland. This article is an open access article distributed under the terms and conditions of the Creative Commons Attribution (CC BY) license (http://creativecommons.org/licenses/by/4.0/).
Share and Cite
MDPI and ACS Style
Moroni, M.; Lupo, E.; Pelle, V.D.; Pomponi, A.; Marca, F.L. Experimental Investigation of the Productivity of a Wet Separation Process of Traditional and Bio-Plastics. Separations 2018, 5, 26. https://doi.org/10.3390/separations5020026
AMA Style
Moroni M, Lupo E, Pelle VD, Pomponi A, Marca FL. Experimental Investigation of the Productivity of a Wet Separation Process of Traditional and Bio-Plastics. Separations. 2018; 5(2):26. https://doi.org/10.3390/separations5020026
Chicago/Turabian StyleMoroni, Monica, Emanuela Lupo, Valerio Della Pelle, Alessandra Pomponi, and Floriana La Marca. 2018. "Experimental Investigation of the Productivity of a Wet Separation Process of Traditional and Bio-Plastics" Separations 5, no. 2: 26. https://doi.org/10.3390/separations5020026
Note that from the first issue of 2016, this journal uses article numbers instead of page numbers. See further details here.