Methodology to Remove Strong Outliers of Non-Climacteric Melon Fruit Aroma at Harvest Obtained by HS-SPME GC-MS Analysis


1
Department of Agricultural and Food Engineering, Regional Campus of International Excellence “Campus Mare Nostrum” (CMN), Technical University of Cartagena (UPCT), Paseo Alfonso XIII, 48, ETSIA, E-30203 Cartagena, Murcia, Spain
2
Department of Applied Mathematics and Statistics, CMN, UPCT, Doctor Fleming s/n, ETSII, E-30202 Cartagena, Murcia, Spain
*
Author to whom correspondence should be addressed.
Separations 2018, 5(2), 30; https://doi.org/10.3390/separations5020030
Submission received: 28 December 2017
/
Revised: 5 May 2018
/
Accepted: 17 May 2018
/
Published: 1 June 2018
(This article belongs to the Special Issue Advances in Micro-Solid Phase Extraction)
Abstract
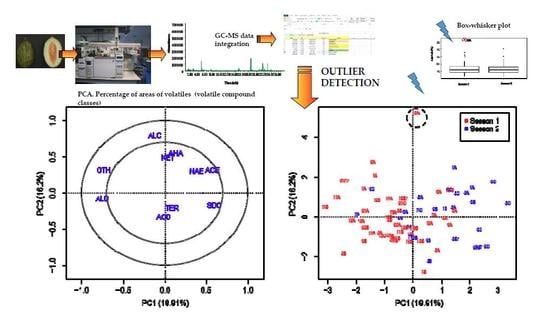
:A methodology for making consistent studies of outliers of non-climacteric melon volatile organic compounds at harvest is reported. The juice was squeezed from the fruit of the ‘Piel de sapo’ cultivar harvested during two consecutive seasons and the aroma volatiles were extracted by headspace solid phase microextraction and measured by gas chromatography coupled to mass-spectrometry. A deconvolution analysis was performed to obtain volatile organic compounds. For multivariate the reliable identification of outliers, compound classes were studied as a percentage of total area counts of the melon compounds identified in the chromatogram by principal component analysis and partial least-squares discriminant analysis, and then verified by correlation analysis, box-whisker plot, and formal tests for univariate outliers. Principal component analysis was the key methodology for selecting outliers in variables that mostly did not follow a normal distribution. The presence of an excess in terms of relative percentage of area and the diversity of minor compounds such as alcohols, terpenes, acids, among others, are usually a sign of anomalous data that can be considered outliers in the aroma of this non-climacteric cultivar. This multivariate approach removed outliers, but kept the variability of aroma among the samples of every cultivar.
1. Introduction
Variability among fruits in the analysis of volatile aroma compounds (VOCs) of non-climacteric melons is usually a problem due to the differential effect of fruit maturity, and the complex interaction between genotype and environment found for other quality attributes [1]. There is even variability among the years in which the fruits of each cultivar or breeding line are harvested because of difficulties in harvesting melons in the same stage of maturity, particularly in non-climacteric types. These visual indices, such as the skin color in contact with the soil, are affected by differences in the environment depending on the season.
Studies of the aroma of the parental line ‘Piel de sapo’ have demonstrated the inter-season variability and the lower aromatic potential compared with other climacteric varieties and, to a lesser extent, compared with almost non-climacteric or hybrid isogenic lines of the same type [2,3,4,5,6,7]. This pattern is typical of the inodorus cultivars studied by other authors [8,9]. Although certain data considered anomalous for this reference parental are usually discarded, no one methodology has been described for making the decision to remove outliers in a consistent way across years or seasons, although statistical tools, such as Grubbs’ test for a single outlier based on the assumption of normality, are available [10]. However, this type of test is designed to detect the presence of only one outlier, which is why some authors have proposed tests for multiple outliers (e.g., Iglewicz and Hoaglin’s two sided and robust test), or outlier high dimensional data analysis [11,12], the latter also applicable to fruit aromas which are composed of many individual chemical compounds.
In previous studies we tested different multivariate and univariate statistical methods for the data analysis of VOCs and other quality traits [2,3,5,6,13], also considering “zero” type data, when the VOC variable should be considered consistent [5], or even the use of deconvolution to reduce this problem [6,7]. The groups of different compound classes are of interest for the potential discrimination of physiological behavior or for quantitative trait loci (QTL) mapping of VOCs [5,6]. In particular, principal component analysis (PCA) and partial least-squares discriminant analysis (PLS-DA) were applied to data for unsupervised and supervised dimension reduction, respectively. The projection of data in a lower dimension space is a useful technique for identifying outlier points based on the distance between the rest of the points.
The box-whisker plot, originally introduced by Tukey [14] as a tool in exploratory data analysis, has become one of the most widely used statistical graphs for the detection of univariate outliers. Outliers in a box-whisker plot are the data with distance to the box of at least 1.5 times the interquartile range (IQR) while, in the case of extreme outliers, the distance is at least three times the IQR.
Data classified as outliers using different criteria have been considered as strong outliers. The objective of the present work was to develop a methodology for the systematic observation of strong outliers in VOC analysis of samples in an integrated manner that allows some potentially anomalous data to be excluded in the determination of fruit aromas. This is particularly critical for QTL mapping and in the determination of QTL × environment effects because the variability could be higher than in other cases, particularly in plots in open fields for breeding purposes, and/or in fruit where the exact degree of maturity is difficult to assess due to biological variance, e.g., melon [15]. For this, the study was based on the same parental studied in two different seasons.
2. Materials and Methods
2.1. Plant Material and Experimental Design
The Spanish melon parental (Cucumis melo L., cv. T111, inodorus group) of the ‘Piel de sapo’ type (PS) was grown in Torre Pacheco (Murcia, Spain) in typical Mediterranean conditions [6] during two consecutive seasons (S1 and S2). The experimental plot consisted of six plants per replicate (three plants located in two adjacent rows) with n = 21 and n = 9 replicates in S1 and S2, respectively. Two to three fruits per replicate were harvested between 07:00 and 10:00 h in one week in each season according to previously-reported minimum and optimum harvest maturity indices for PS [6,15]. The most critical parameters for externally identifying full maturity at harvest in the field were a developed stem scar, followed by peduncle lignification, and the onset of a light yellow color in the skin surrounding the peduncle, a dull dark green skin color, and a minimum light yellow color in the skin in contact with the soil. The total soluble solids (TSS) content, which was regularly monitored, showed a maximum that depended on the season, and fruit with less than 10 °Brix were discarded. Flesh volatiles were analyzed in both seasons.
2.2. Flesh and Juice Sampling for Volatile AnalyFTWsis
Flesh cylinder samples (20 mm length × 15 mm diameter) were obtained from the equator of individual fruit using an apple core borer following the previously reported methodology [2,6]. Each replicate consisted of a single analysis of fruit (usually two different melons) per field replicate. Juice was squeezed from the cylinders with a Simplex Super cast aluminum manual juicer and filtered through a four-layer cheesecloth. After 3 min at 23 °C, the mixture (20 mL juice and 8 mL CaCl2 saturated solution, i.e., 71.4% v/v of juice) was poured into two 5 mL and one 15 mL sterile polypropylene vials, which were stored at −80 °C until analysis (after around two months). For the analysis, samples were thawed (about 15 min at 20 °C) and 2.32 mL of the mixture was poured into 10-mL vials. After adding 0.02 mL of the internal standard (a solution of 4.27 mg L−1 of 1-phenylethanol, CAS 98-85-1, in dichloromethane), the vials were capped hermetically (SU860101 silicone/PTFE 18 mm, 35 shore A, screw cap, Supelco, Bellefonte, PA, USA), and put into a thermostatted tray at 13 °C. Around 15 samples per day were analyzed in a random order.
2.3. Volatile Analysis: Headspace (HS) Formation, Solid-Phase Micro-Extraction (SPME), and Gas Chromatography-Mass Spectrometry (GC-MS) Analysis
Solid-phase microextraction was conducted after each season according to the indications of Amaro et al. [16] with slight modifications. A retention time-locking gas-chromatography mass-spectrometry method, using n-pentadecane (Sigma-Aldrich, Saint Louis, MO, USA; Merck KGaA, Darmstadt, Germany) as reference to block the method (at a retention time of 24.022 min), was used. Therefore, the column operated in constant pressure mode that slightly differed each year in order to keep the retention times constant. This methodology practically avoids the need for alignment [17], because differences in retention times among chromatograms were negligible.
Volatiles were extracted without stirring during 120 min at 35 °C in the heating tray of the gas chromatograph (6890N, Agilent Technologies, Wilmington, DE, USA) by using static HS-SPME. The fiber was 1 cm long and coated with 50/30 µm divinylbenzene/carboxen on polydimethylsiloxane (DVB/CAR/PDMS) (57329-U DVB/CarboxenTM/PDMS Stable FlexTM, Supelco, Bellefonte, PA, USA). This fiber is recommended for automatic holders and volatile and semi-volatile (C3–C20) analyses. The fiber (20 mm length and 20 gauge needle size) entered 22 mm into the vial headspace and remained for 30 min absorbing volatiles at 35 °C. The volatiles were desorbed from the SPME fiber into the GC injection port (mass spectrum detector transfer line heater) with a bake-out step of 3 min at 280 °C. The analyses were carried out with a MPS2 Gerstel Multipurpose sampler coupled to the GC-MS. The injection port was operated at 260 °C in splitless mode and subjected to a pressure of 13.4 psi adjustable for the retention time of n-pentadecane to be the same. The purge flow rate of the inlet was 40 mL·min−1 and the purge time was 2 min. The post-run column conditions were 10 min at 220 °C with a pressure of 26.2 psi. The fiber bake-out parameters were 15 min pre-bake-out time, 44 mm of injector penetration, and 1 min post-bake-out time. A solvent delay of 0.5 min was applied. The inlet liner used was a 2637505 SPME/direct (Supelco), 78.5 mm × 6.5 mm × 0.75 mm. Volatiles were separated on a 30 m × 0.25 mm i.d. × 0.25 µm thick capillary column (HP-5MS ultra inert, Agilent Technologies, Wilmington, NC, USA) that contained 5% phenyl-methyl silicone as a stationary phase. The carrier gas was helium (purity > 99.999%) with a flow rate of 1.5 mL·min−1. The initial oven temperature was 35 °C, followed by a ramp of 2 °C·min−1 up to 75 °C, and then at 50 °C·min−1 to reach a final temperature of 250 °C, which was held for 5 min. Oven equilibration time was 0.5 min. Mass spectra were obtained by electron ionization (EI) at 70 eV. The detector worked at 230 °C and in full-scan with data acquisition and ion mass captured between 40 and 450 amu (4 scan·s−1) during the run time (27.5 min).
2.4. Identification of Volatile Organic Compound and Data Calculations
The peaks were identified by a mass spectrometer (5973 Network Mass Selective Detector, Agilent Technologies) coupled to the GC, comparing the experimental spectra with those of NIST 11 MS library (National Institute of Standards and Technology, Gaithersburg, MD, USA). The chromatographic analysis data for the volatile compounds were automatically integrated using MSD ChemStation software (F.01 001 1903 2013, Agilent Technologies). To reduce the number of additional peaks that would need to be manually introduced in the subsequent deconvolution process, the automatic Chemstation parameters were set as follows: initial area reject 0; initial peak width 0.045; shoulder detection off; initial threshold 14.0. These preliminary data only served as a basis for manual integration, deconvolution, and individual reverification of the peaks based on deconvolution analysis using NIST 11 MS library and the automated mass spectral deconvolution and identification system AMDIS (version 2.7, 2011, National Institute of Standards and Technology, Gaithersburg, MD, USA). Data for the best deconvolution models were selected from those offered by automatic mass spectral deconvolution and identification system (AMDIS) according to the higher match quality index for the target compound (usually 2–3 models, and always less than five models per peak). After several trials with different options, the deconvolution settings of AMDIS were: component width equal to 16, two adjacent peak subtractions, low resolution, very high sensitivity, and low shape requirements. These parameters can be modified, especially to obtain the results for some flat peaks (i.e., some alkanes or poorly detectable compounds) that cannot always be confirmed with the above parameters: for example, by increasing the resolution to high.
Chemical compounds were verified by a comparison of linear retention indices (LRI) calculated with a homologous series of n-alkanes (C6–C20; Sigma-Aldrich) for the HP-5 MS UI column [18] and analyzed under the same conditions. Propane, butane, and pentane retention times were estimated based on previous analysis of several seasons. LRI were compared with the literature results compiled by NIST [19], although sometimes the LRI data were estimated from the non-polar retention index (n-alkane scale) offered by NIST MS Search 2.0. We also used a profile of melon VOC LRIs (more than 500 compounds) obtained in hundreds of previous analyses using cultivars of different types and the same methodology, and others with HP-5 MS columns [20] (Fernández-Trujillo et al., 2013). A coefficient of variation for LRI was calculated as follows:
The compounds accepted always showed CVLRI < 1% (usually less than 0.5%). The concentration of the individual aroma volatile compounds identified (expressed as ng·mL−1 of juice) was quantified from the relation between their areas and that of the internal standard (1-phenylethanol), obtained from the total chromatograms, using a response factor of 1 [6].
The IUPAC names of individual aroma volatiles were verified with the CAS number of the NIST database [19] in accordance with several databases [21,22].
The chemical volatile compounds were classified into eleven groups, according to Dos-Santos et al. (2013) [5]: volatile acids (ACD); acetate esters (ACE); alcohols (ALC); aldehydes (ALD); alkanes (AHA); ketones (KET); non-acetate esters (NAE); sulfur-derived compounds (SDC); terpenes (TER); others (OTH). Unidentified (NID) compounds which did not demonstrate a clear comparison with the NIST11 database were not included in the main analysis. Each fruit was classified by the number of replicates (21 in season 1, and nine in season 2) and a letter (A, B, C or D), and sometimes by adding the letter “r”, indicating re-analysis of the same individual fruit sample.
We tested the following six variables calculated automatically by using a Microsoft® Excel 2013 worksheet programmed for this purpose and the calculations of the LRI and CVLRI:
- −
- Total area counts (match quality or similarity index MQ > 50).
- −
- Percentage of total area counts of identified compound classes (only classified compounds excluding unidentified and exogenous, with MQ > 50).
- −
- Percentage of total area counts of the whole chromatogram (including compound classes classified as exogenous, with MQ > 50, but not unidentified compounds).
- −
- Total area counts (without MQ criteria).
- −
- Percentage of total area counts of compound classes, including exogenous and unidentified compounds.
- −
- Percentage of total area counts (total area of the chromatogram, without MQ criteria; including exogenous and unidentified ones).
The first and fourth variables expressed in area counts were also examined after normalization of the compound class variables to the response of the internal standard (1-phenylethanol) by multiplying the areas by the corresponding factor calculated for each season, as follows:
The two former percentage variables showed similar levels. Additionally, the last two percentage variables calculated without MQ criteria showed similar results, and lower levels than the first two percentage variables calculated with the constraint of MQ.
Data of individual fruit aroma analysis computed in Microsoft® Excel were aligned using software specifically developed for this purpose in one of our projects (unpublished). The former software aligned compounds based on names of chemical compounds generated by the NIST library, and CAS numbers were used for further verification and, particularly, to avoid mistakes. Unidentified compounds (NID) were also aligned based on names automatically generated using the concatenate function of Microsoft® Excel with its respective retention time of two decimals (Unidentified (x)). A pseudo CAS number of unidentified compounds was also generated per compounds using its respective x RT and its y linear retention index (LRI) as follows: (NIDxLRIy). This information served for further manual verification in order to identify potential target unidentified compounds for future research. Two Dell® Precision WorkStations (M6800 and M4400, both with 16 Gb of RAM) were required to perform these processes.
2.5. Total Soluble Solids
Total soluble solids content were determined using a digital refractometer (Pocket, Atago PAL-1, Tokyo, Japan). The mean of each replicate plus SE are reported.
2.6. Statistical Analysis and Outlier Identification
Exploratory data analysis consisted of a normal probability plot and box-whisker plot analysis of the six variables obtained for the compound classes of aroma volatiles of both seasons separately, followed by principal component analysis and partial least-squares discriminant analysis applied to the scaled and mean-centered data. For each univariate variable, the Grubbs’ test for outlier identification was performed when normality assumption was not rejected according to the Shapiro-Wilk test (p ≤ 0.05) [23]. Correlation analysis was also carried out for each pair of variables within each type of the former six. Classical and robust 97.5% confidence ellipses of the data were calculated. The robust method used 50% of the observations for MCD (minimum covariance determinant) estimations.
All statistical analyses were performed using the free R software (R Core Team 2017), the FactoMineR library for the principal component analysis [24], and the caret library [25] for the PLS-DA analysis. Grubbs’ test and correlation analysis form part of the outliers and mvoutlier packages of R, respectively [26,27].
The first step in the procedure to detect strong outliers consisted of checking PCA and PLS-DA output and marking the potential candidates, then verifying the candidates by correlation analysis, box-whisker plots, and Grubb’s test when available. Additionally, dispersion graphs of different quality traits (e.g., TSS vs. the variables of the different VOC compound classes in percentage), served for the final decision on outlier classification and to study their potential origin.
3. Results
In a previous examination of the data by PCA, there were several mistakes because of a malfunction in our alignment program (two samples) and a sample with many acetate esters and sulfur-derived compounds that were also unique in fruit VOC of both seasons (Supplementary Materials Figure S1).
In general, the Grubbs’ test only allowed detection of a few outliers because the normality assumption was rejected for most of the variables according to the Shapiro-Wilk test at a significance level p ≤ 0.05 (data not shown).
3.1. Chemical Compounds Classes Based on Total Areas
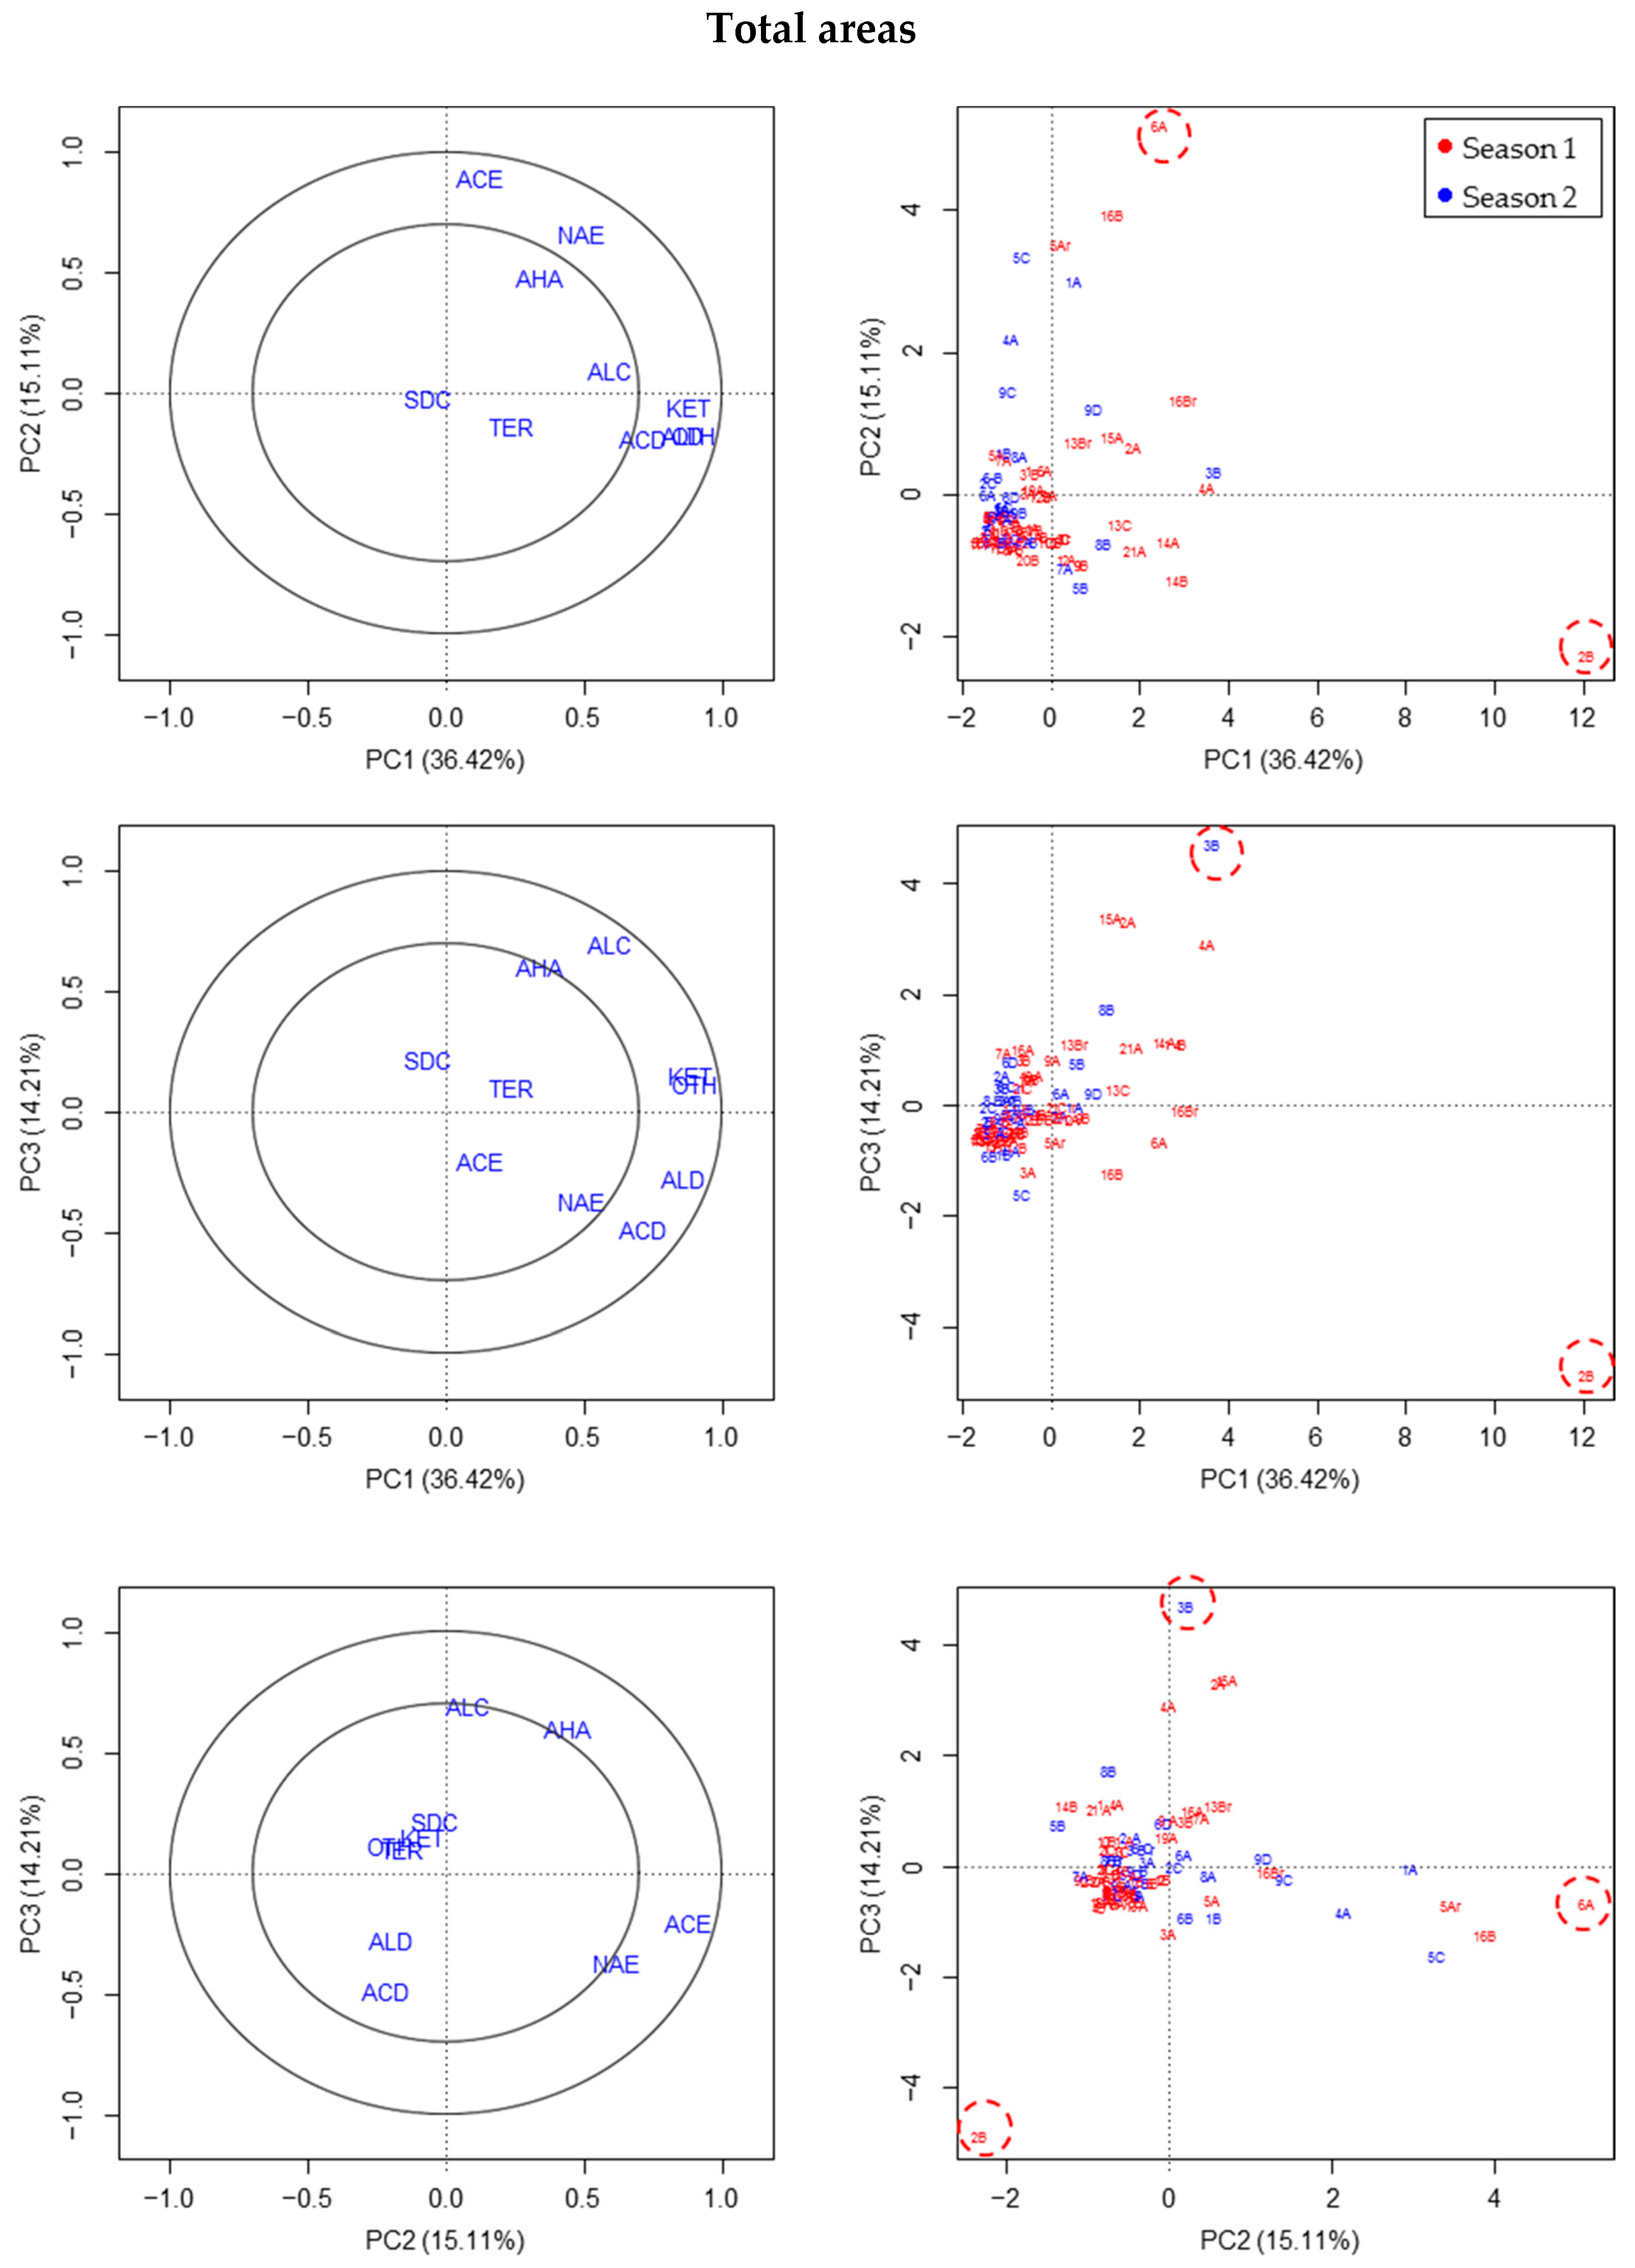
All these data were studied visually taking into account in each fruit sample the other samples of the same or different season. The results for the three groups of variables representing the total areas of the chromatograms (with or without the MQ criteria, with or without normalizing the areas to the internal standard) were similar, and judged by PCA. Finally, the outliers considered with this type of variables were the fruits 2B and 6A (S1), and, to a lesser extent 3B (S2) (Figure 1; Supplementary Materials Figure S2A).
The outliers observed by using PLS-DA were the same and also 16B (S1) and 2A (S2), and, to a lesser extent, 5B or 6D (S2), because these two were only identified in the case of one of the variables of the total area considered without applying the normalization of areas to the internal standard (Supplementary Materials Figure S2).
From an observation of the figures and association outlier-centroid of each group of VOC compound class (centroids on the left of each figure for PCA and on the right for PLS-DA; Figure 1; Supplementary Materials Figure S2), the main reasons identifying the outliers in the first season was the excess of acetate esters (6A (S1), 16B (S1)) and aldehydes, ketones, and others in 2B (S1). In the second season, fruit 2A (S2) and 6D (S2) were considered outliers due to the excess of sulfur-derived compounds, and 5B (S2) due to the unusually high relative abundance and diversity of terpenes.
The main problem with the total area variables was that they did not consider the differences among different fruit analyses that are usually corrected when percentages or total areas are used, sometimes by using internal standards, and this is the reason for verifying the proposed outliers with the variables in percentages.
3.2. Chemical Compound Classes Based on Percentages of Sum of Areas
The results of the four groups of variables representing percentages of different compound classes based on different total areas of the chromatograms were similar. The reason is that MQ values increased when deconvolution was used, and so the percentages proposed with MQ are not altered much by this limitation.
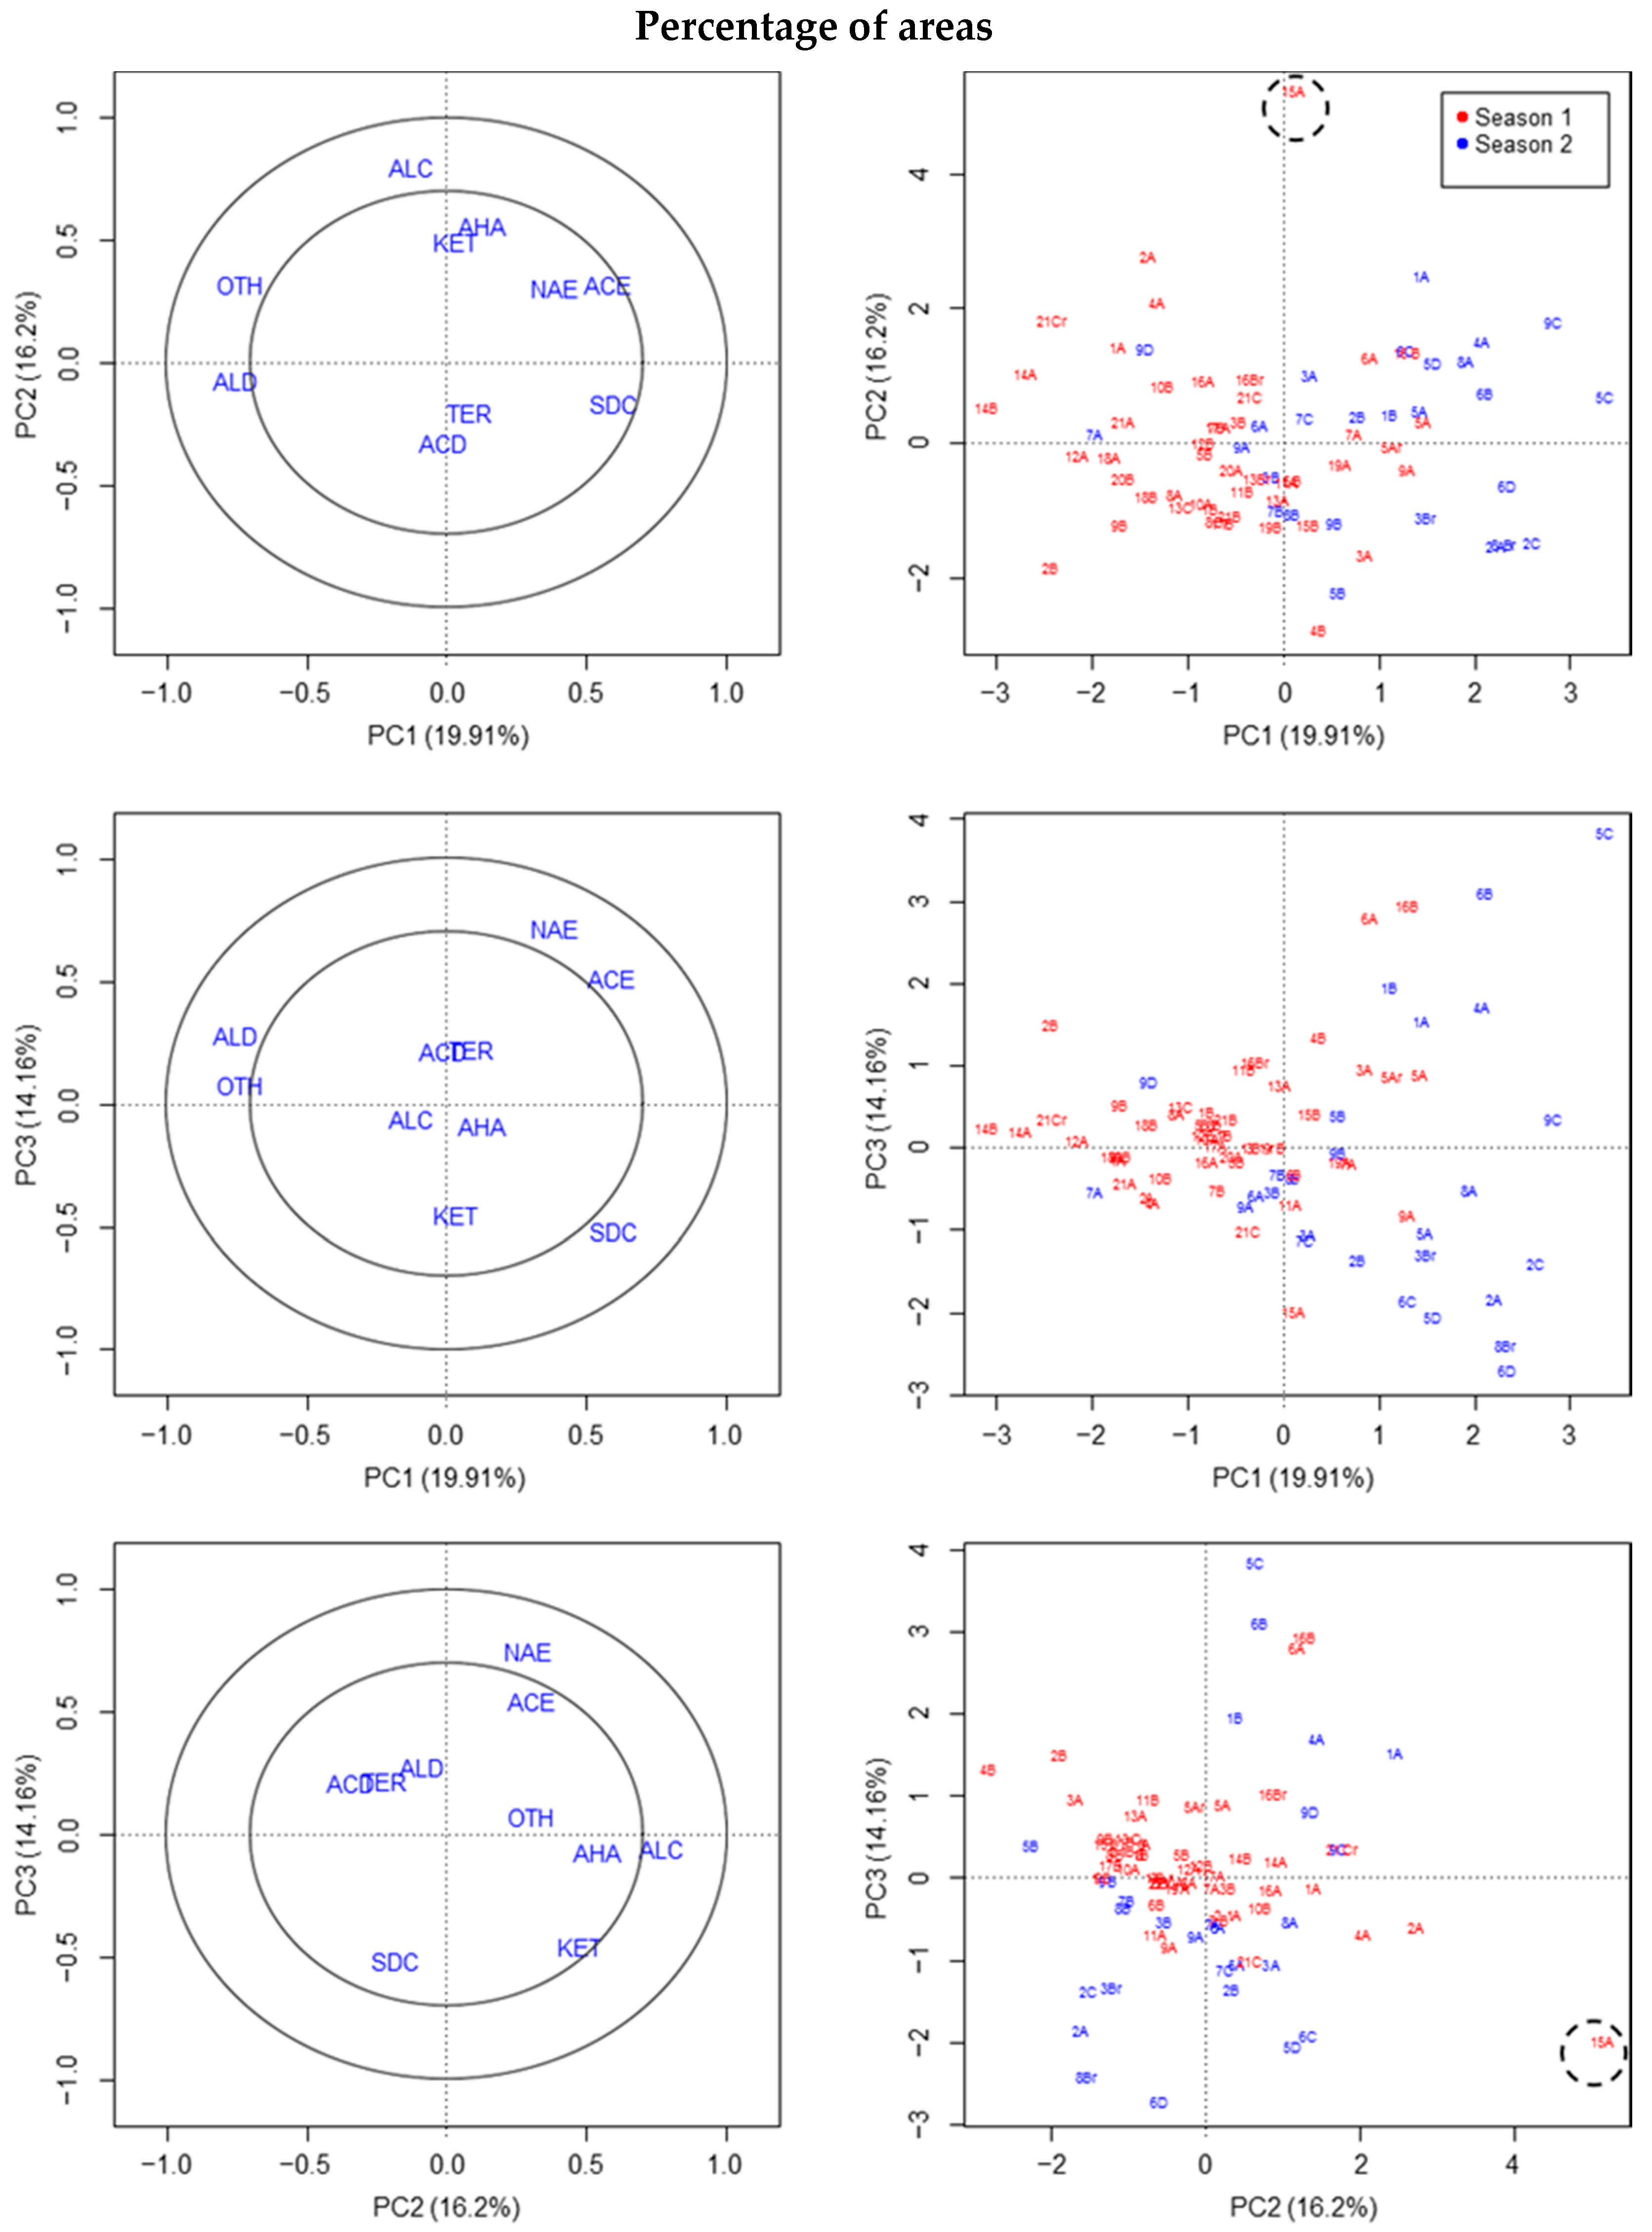
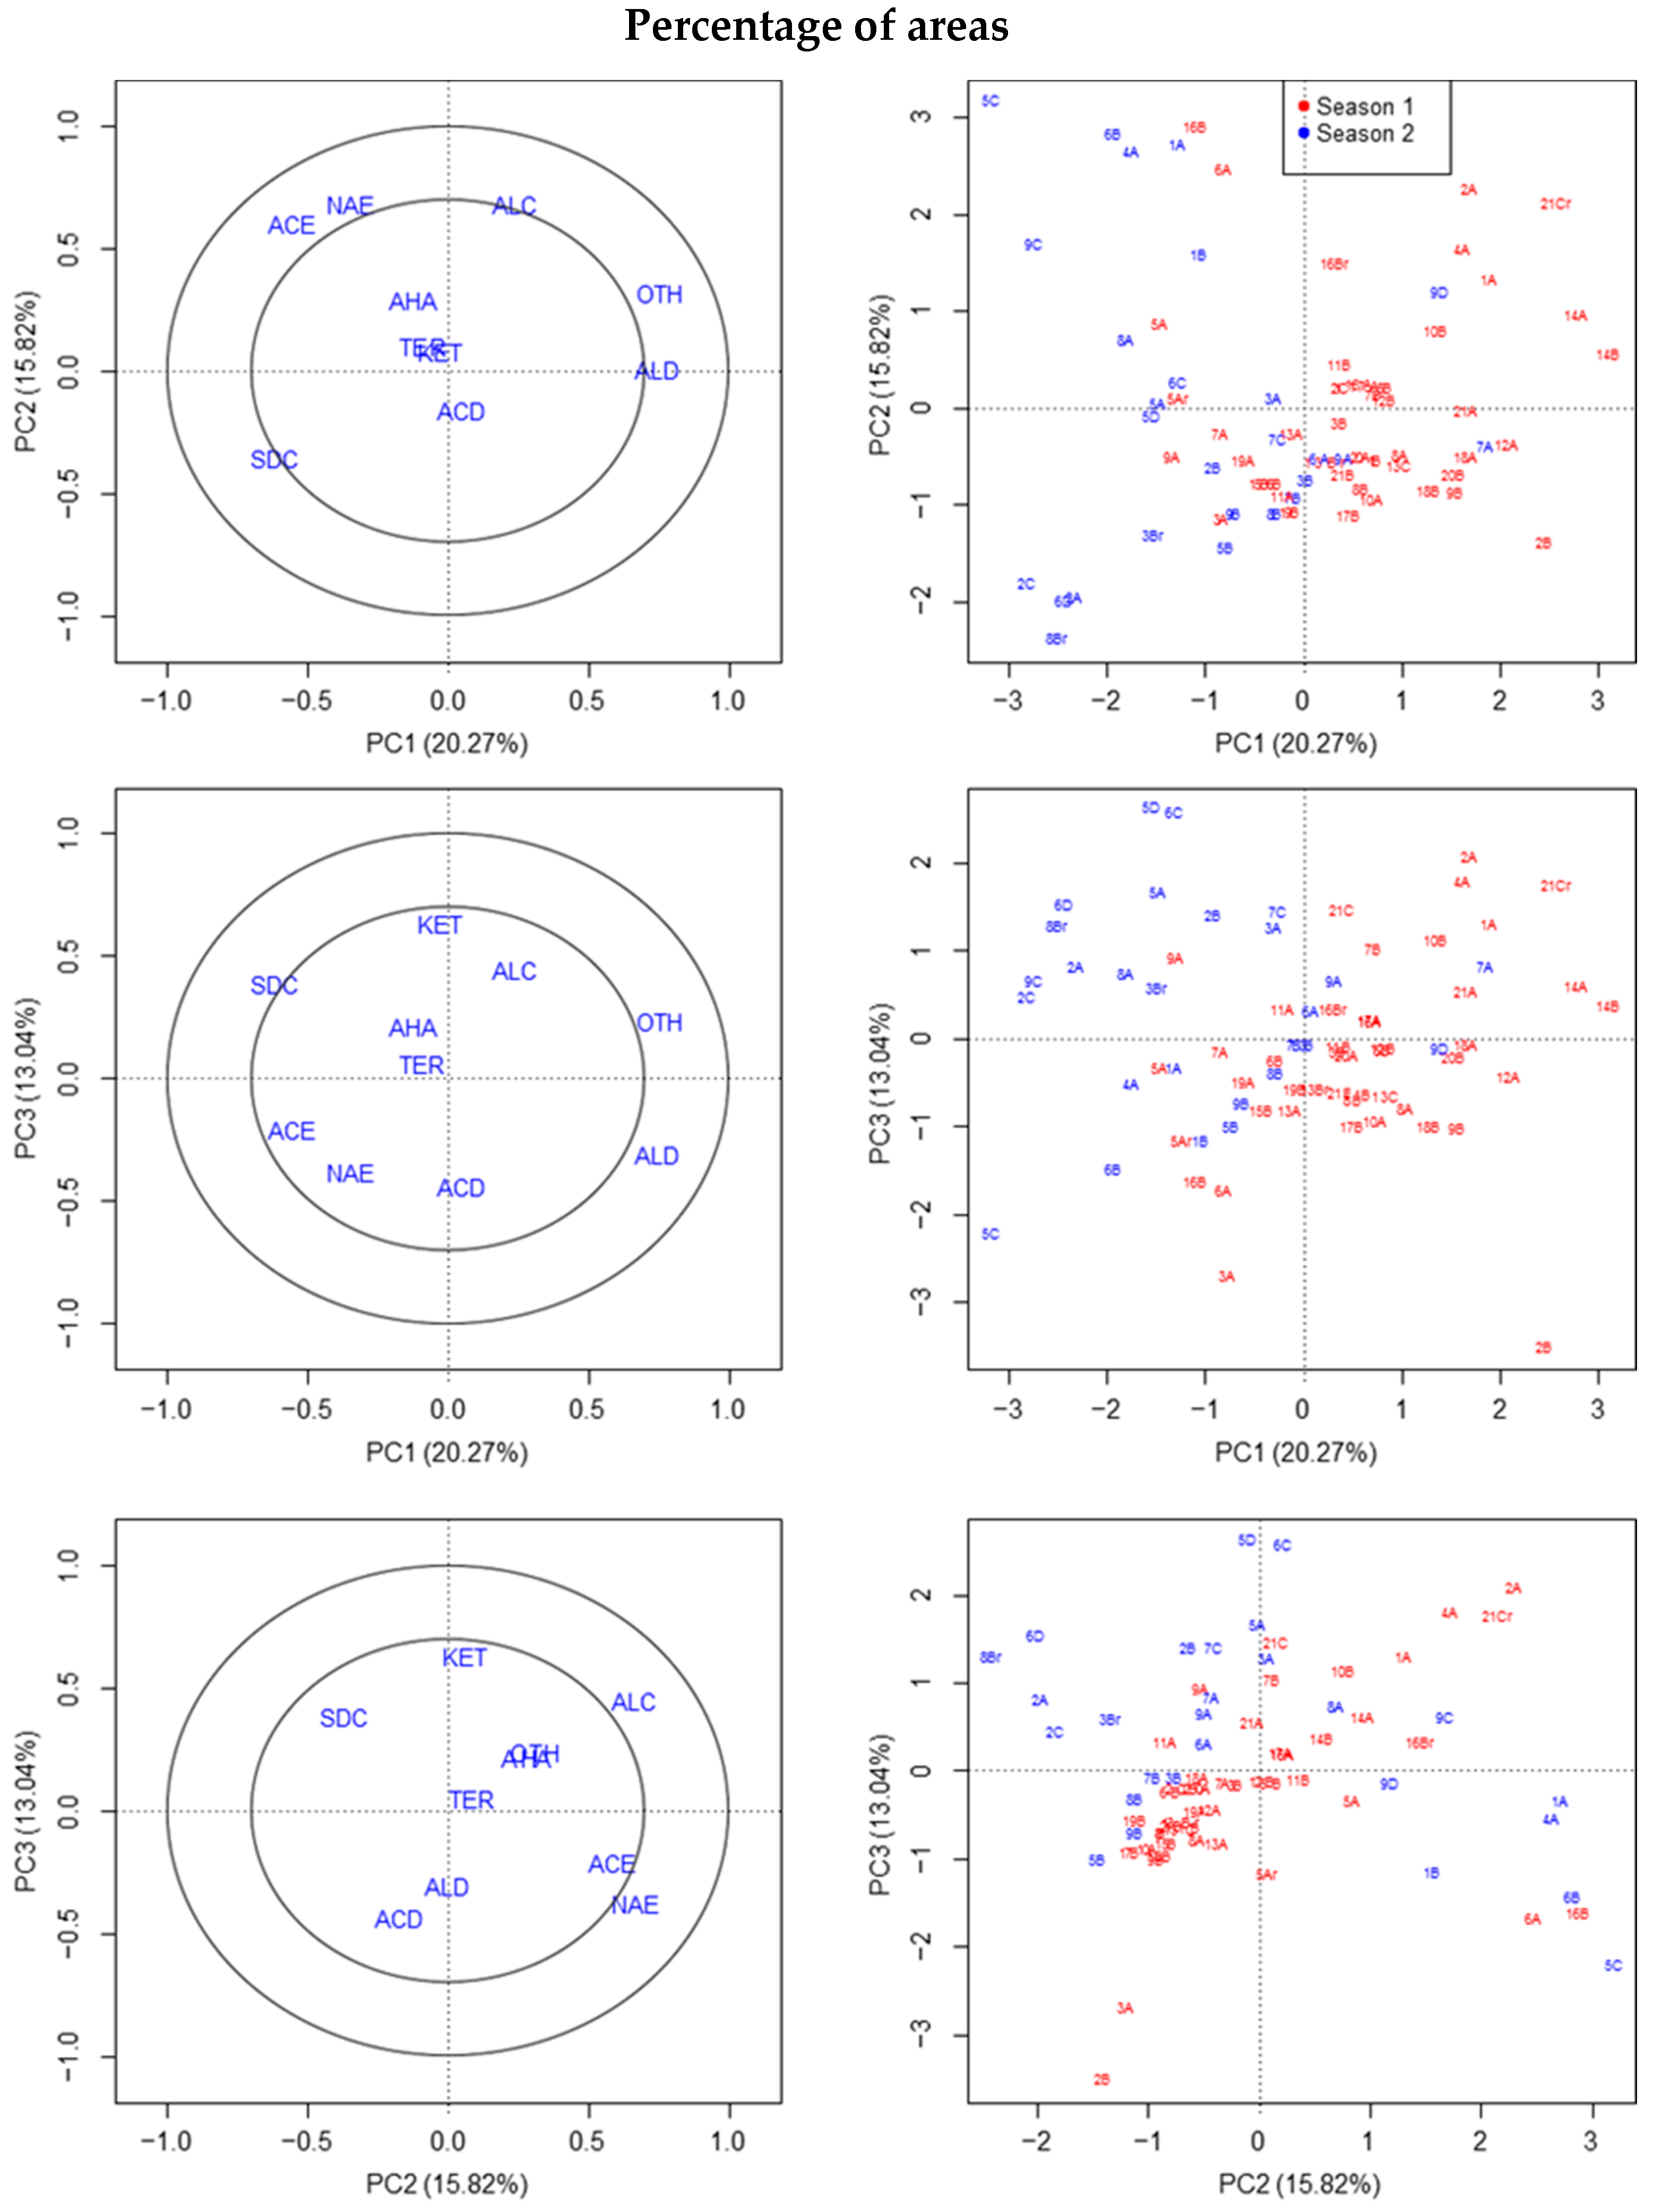
Essentially, one outlier was detected in the VOCs of fruit 15A (S1) by using PCA and PLS-DA, due to the high proportion of alcohols, while no outliers were detected in S2 (Figure 2). Additionally, fruit 4B (S1) could be an outlier as judged by PLS-DA, due to the greater proportion of terpenes and/or acids than in other fruit (Supplementary Materials Figure S2). Certain differences between seasons were detected by PCA or the PLS-DA of percentages (e.g., in the graph of the first two axes; Figure 2 and Supplementary Materials Figure S3). The fruit classified as outliers in the previous section by reference to the area in absolute values were not classified as outliers using PCA, but using variables of compound classes based on percentages of the sum of the areas.
In the last of the percentage variables (without MQ criteria and including total area), fruit 5A (S1) was also considered as outlier (only by PLS-DA) due to a slightly higher proportion of acids, acetate esters and/or alkanes (data not shown). This datum was not finally considered as a strong outlier.
3.3. Box-Whisker Plots of Both Types of Variables
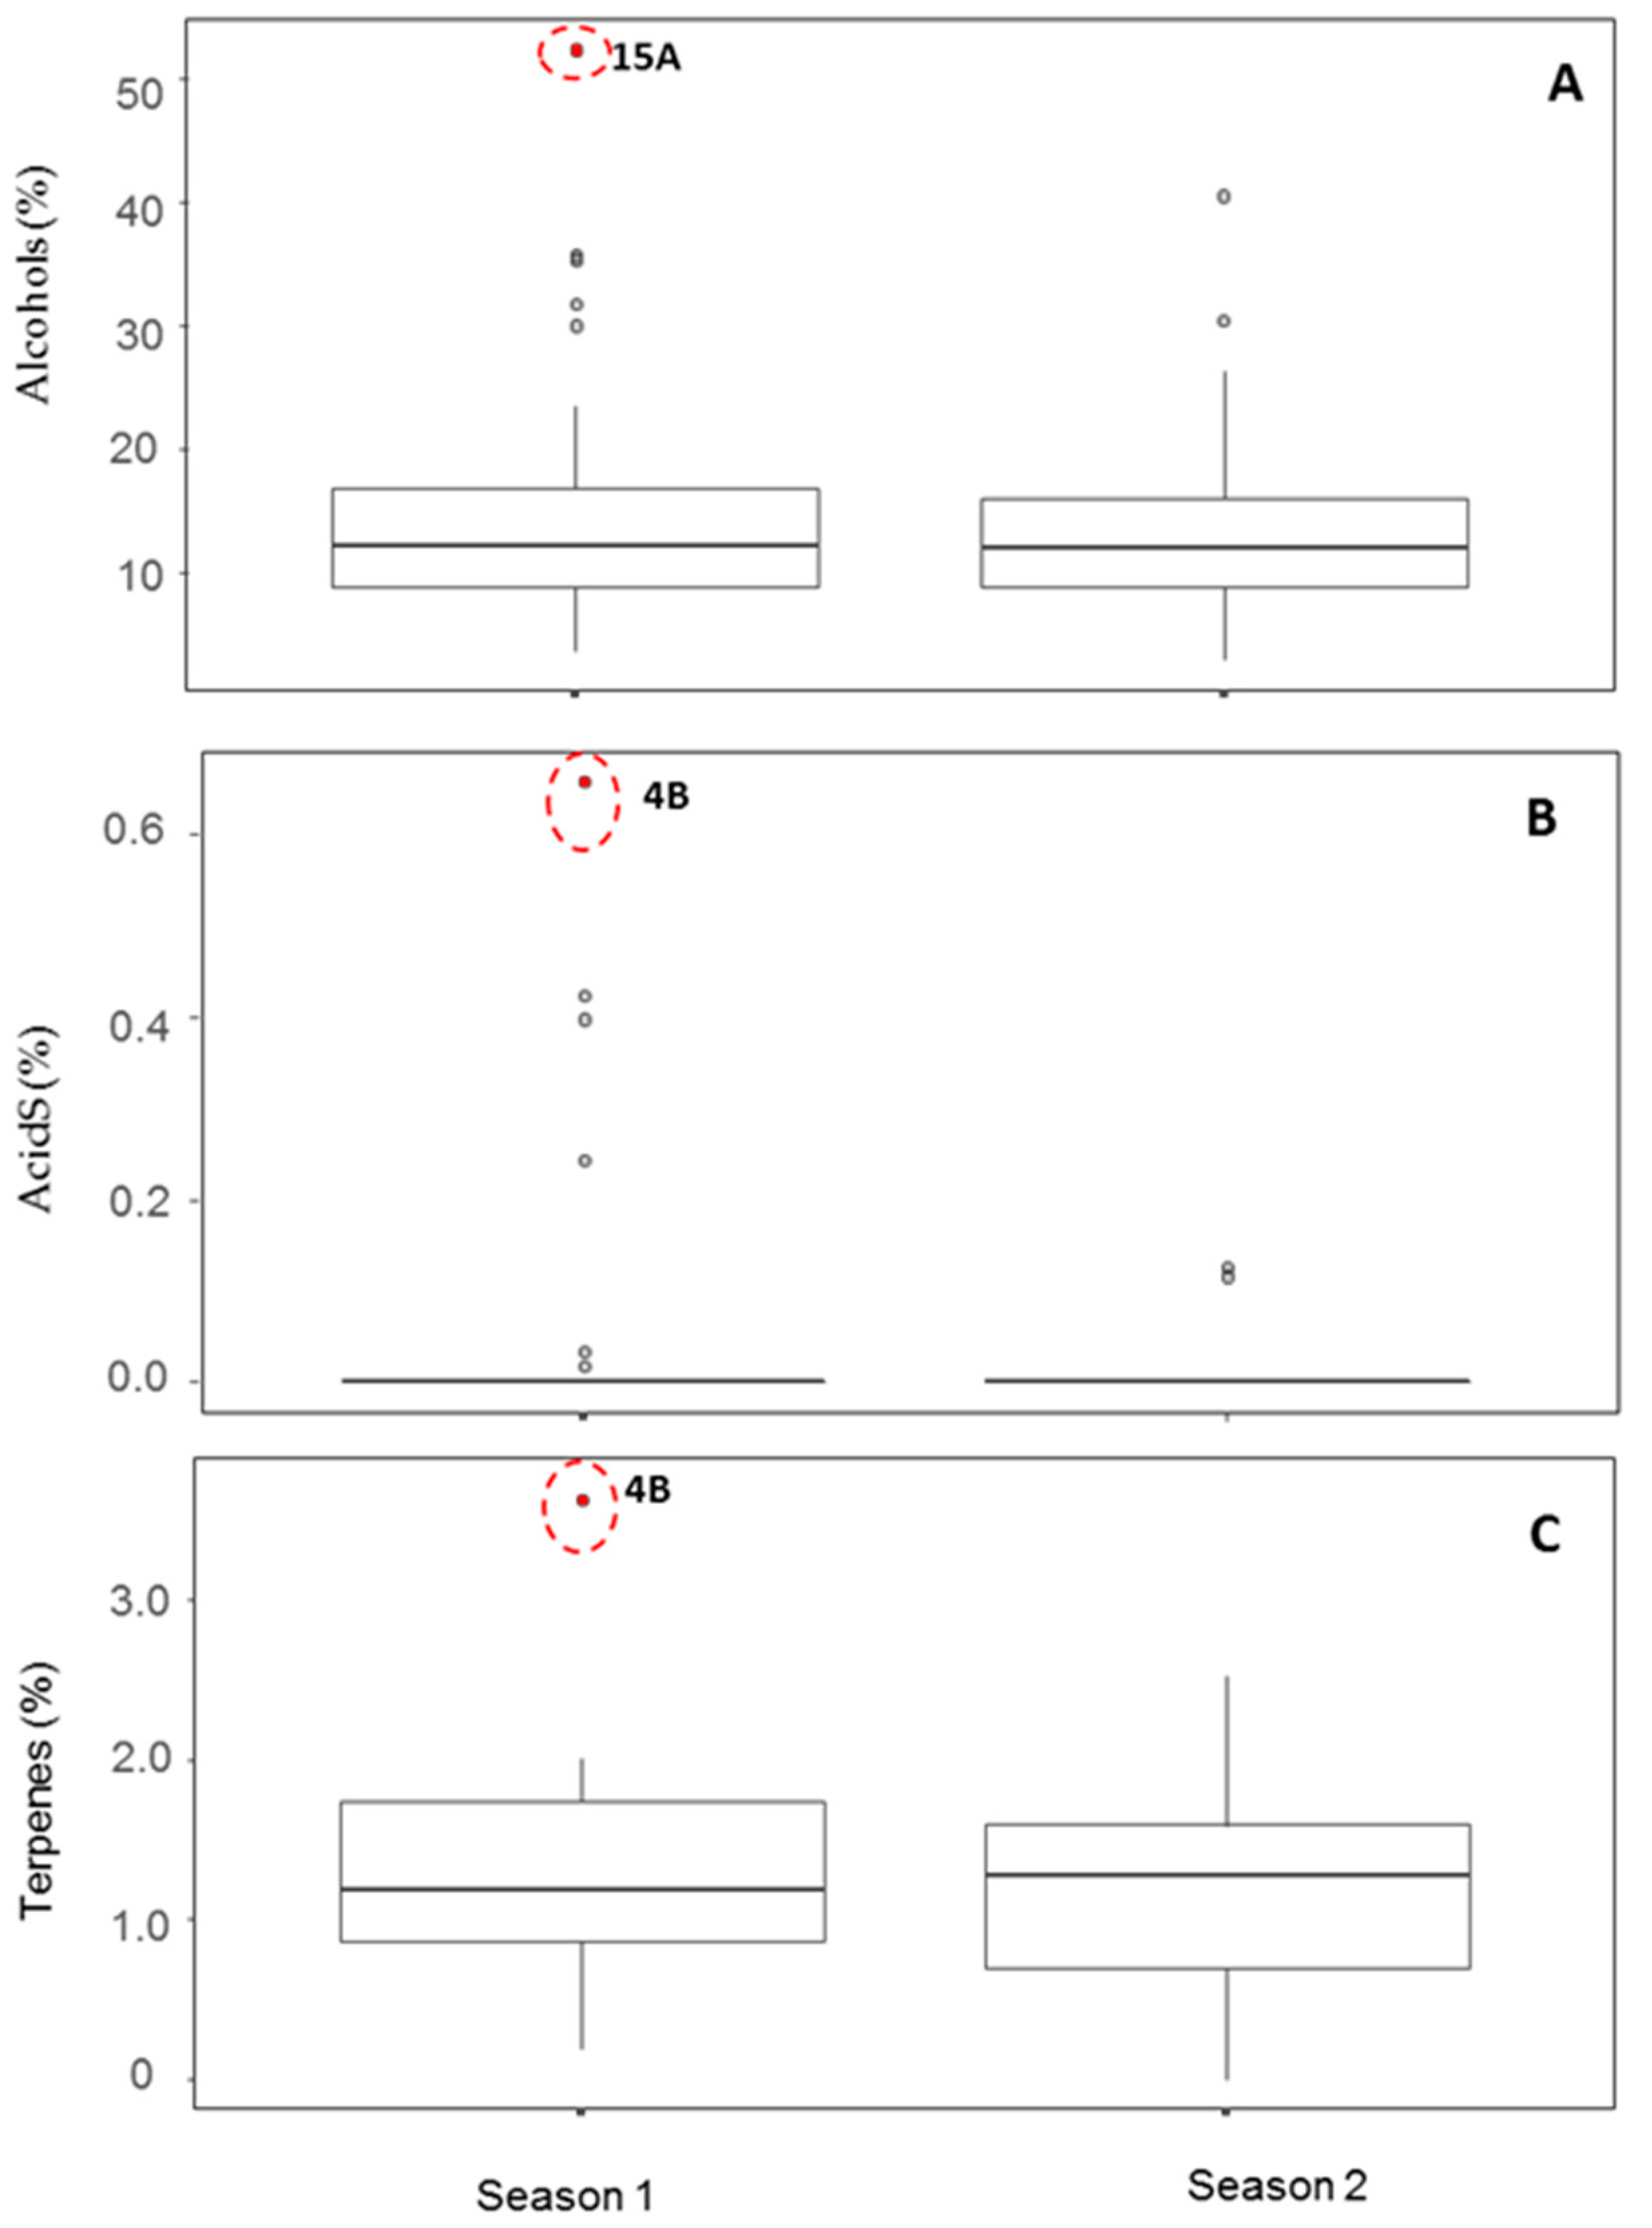
A high number of outliers were detected by box-whisker plots based on the lack of normality in most of the variables of the compound classes tested, irrespective of the type of variable considered. The two fruits proposed as strong outlier candidates (15A and 4B of S1) were reassessed by means of box-whisker plots. The outlier of sample 15A (S1) was due to its high relative levels of alcohols, and, after removing this fruit, both variables showed similar behavior in the box-whisker plot (Figure 3A). This was also the case for acids and/or terpenes when the outlier of fruit 4B (S1) was removed (Figure 3B,C). Both outliers were relatively isolated from the rest of S1 and S2 fruits according to the above multivariate analyses and, therefore, can be classified as strong outliers.
3.4. Correlation Analysis among Variables
This type of analysis produced many apparent outliers in each correlation pair (Supplementary Materials Figure S4), but the strong outliers (15A and 4B of S1) also appeared in graphs when alcohols and terpene variables appeared as percentages (Figure 4; Supplementary Materials Figure S4A,C,D).
3.5. Total Soluble Solids
Considering all the fruit after discarding outliers, the TSS means ± SD were significantly higher (Tukey test, p = 0.001) in season 2 (12.0 ± 0.2 °Brix; n = 9) compared with season 1 (9.7 ± 0.3 °Brix; n = 21), and the same was true (and with similar values) when they were not removed (data not shown). The TSS did not correlate with any of the variables referring to the total levels of compounds (in area or percentage), although this parameter could be useful for identifying some outliers. The same lack of correlation was found with other quality traits, such as the ratio between TSS and titratable acidity, among others (data not shown).
3.6. PCA of VOCs as Percentage after Removal of Outliers
The removal of strong outliers did not influence the loss of replicates of the experiment because at least one or two extra fruit can be used to calculate the average per replicate. According to all the PCAs (Figure 5) and PLS-DA (Supplementary Materials Figure S5), they were able to discriminate between seasons. However, fruit 2B (S1) appeared to be an extra outlier (Figure 5).
Though the outliers reported are not associated with aldehydes, 2B (S1), a potential additional outlier showed a high relative concentration of hexanal or pentanal, and, to a lesser extent, nonanal, together with an unusual diversity of other aldehydes within one sample, but in lower proportions (butanal, heptanal, octanal, decanal, undecanal, dodecanal, tetradecanal, (2E,4E)-hepta-2,4-dienal, (2E,4E)-nona-2,4-dienal, (E)-hept-2-enal, etc.). Additionally, some of these aldehydes were only detected by deconvolution analysis.
3.7. Individual Aroma Volatiles
The individual aroma volatiles tentatively identified in more than 10% of the fruit analyzed were 126 compounds, irrespective of the season (data not shown). However, only 54 of them appeared in more than 50% of the fruit, and only 21 in more than in 90% of fruits with a similarity index above ninety (Table 1). Of the former, most were aldehydes (particularly hexanal), alcohols, sulfur-derived compounds and, to a lesser extent, other groups.
The levels of alcohols of the outlier 15A (S1) was 52.4% (percent of identified compounds with MQ > 50), mostly due to the high relative concentration of hexan-1-ol followed by pentan-1-ol (70% of the area counts of alcohols identified), but also to the presence of other alcohols.
The outlier of fruit 4B (S1) has terpene compounds such as alpha-pinene (4,7,7-trimethylbicyclo[3.1.1]hept-3-ene), or beta-pinene (7,7-dimethyl-4-methylidenebicyclo[3.1.1]heptane) or camphene (6,6-dimethyl-5-methylidenebicyclo[2.2.1]heptane), apart from the terpenoid camphor (1,7,7-trimethylbicyclo[2.2.1]heptan-2-one). The acid detected in 4B (S1) was tentatively identified as 2-phenylpropanoic acid.
Other fruit also at the limit of distribution have high relative concentrations of ketones due to 1-phenylethanone, or some ester (isobutyl acetate or phenylmethyl acetate, and, to a lesser extent, isopropyl acetate) or sulfur-derived esters (data not shown).
4. Discussion
Overall, the outliers detected from the total areas did not match with those detected by the percentages because of the potential variability in the analysis and intensity of aroma among fruits. Transformation of the percentages into logarithms of the variables of compound classes based on percentages is not advisable except for classification or prediction purposes. The PLS-DA of the total area (with or without normalization of each compound class to the response of the internal standard) gave a higher number of outliers compared with PCA (Supplementary Materials Figure S2 vs. Figure 1), while, in percentages, these differences were minimized. Outliers detected by box-whisker plots were also more frequent than in this case because the variables frequently could not be analyzed by assuming normality, as demonstrated by the Shapiro-Wilk test. This problem also meant that Grubb’s test could not be used in our case.
The main problem with applying Grubb’s test is that individual variables can only be used if they follow a normal distribution, thus losing the perspective of a multivariate analysis. Additionally, this test can only be applied to the two fruits with extreme distribution data [10]. However, more than one fruit could be considered as an outlier in one extreme, particularly if the variable does not follow a normal distribution.
An important point when two seasons are being compared is that the potential anomaly detected by the box-whisker plot should be in the same range (Figure 3), which probably explains why more outliers were not found in the multivariate statistical analysis compared with box-whisker plots.
The outliers detected by correlation analysis (Figure 4) were more than those finally considered as strong outliers. Removing all of them from certain variables of compound classes using this methodology or box-whisker plot would be problematic for considering the whole aroma of a fruit, and also incorrect from a multivariate point of view.
Variability in melon fruit VOCs could be associated with differences in physiological maturity, but also fruit sampling, particularly the start of the ripening process in the placental tissue containing the seeds [28,29] because fruit ripening enhances the presence of alcohols. Some of the alcohols, such as hexan-1-ol, are good substrates for alcohol acetyltransferases or AAT [30], and potential accumulation in some fruits can be a sign of a lack of activity of the enzyme compared with aromatic cultivars [31], or a fruit harvested in a stage when the activity of the enzyme is still low [30]. On the other hand, the presence of terpenes or acids is sometimes associated with skin tissue [32], though terpenes have been found at higher levels in PS than in other cultivars [33]. According to our experience and other authors, acids are rarely detected in pulp samples by the HS-SPME test [5,33], but, by using stir-bar sorptive extraction (SBSE), it is possible to detect them as a precursor of aromas in whole PS melons, and also in the pulp of climacteric cultivars [20,34] and in other juices [35].
Previous publications have applied PCA and PLS-DA to the classification of and comparison between VOCs of melon near-isogenic lines and the corresponding parental [5,6], the PLS-DA providing a better classification with fewer variables involved. For a metabolomics approach, PCA combined with multiblock hierarchical PCA has been used [36].
Another possibility in the formation of outliers is the onset of analytical artifacts during the process, for example, due to septum bleeding, or the saline solution used (always stored at 2 °C and prepared before each season). No artifacts were observed after a blank SPME of the saturated saline solution or water used to prepare the saline solution alone, in agreement with general recommendations [8,33].
From a physiological point of view, the higher the relative acetate ester concentration in flesh tissue, the more senescent the PS melon flesh [37]. This was the case with some samples when area counts were observed, but, in the percentage of total area counts, the outliers apparently disappeared. The esters, particularly isobutyl acetate or phenylmethyl acetate, and, to a lesser extent isopropyl acetate, are typical of climacteric cultivars [6]. Other compounds, such as methyl 2-methylpropanoate, or the sulfur-derived esters, which are very specific to some cultivars and more abundant in climacteric ones [38,39], can also help detect outliers. A few esters can develop with certain abundance in some non-climacteric cultivars synthetized by ethylene-independent pathways, [40], particularly in certain seasons [6]. The high level of these esters dramatically reduced the proportion of the aldehydes typical of non-climacteric cultivars and accessions based on total area counts [8,9,37].
Another factor of importance is whether esters were found in the sampling procedure, particularly in large experiments involving climacteric aromatic and non-climacteric non-aromatic cultivars or lines for breeding purposes [39]. In the case of non-climacteric cultivars, placental tissue or local over-mature tissue should be avoided [3,28,36].
Overall, variables in the percentages of total area counts, such as total level of acids, terpenes, or alcohols, increased during PS melon fruit ripening, while aldehydes decreased, although non-acetate esters, alcohols and aldehydes also slightly increased close to senescence [34,37]. The detection of the excess of some of these compounds within a sample of different fruit of one parental may help to provide more reliable control data for QTL mapping of this type of compound at harvest using near-isogenic lines [4,5].
Several strategies are feasible to reduce fruit sampling outliers, although improving the signal to noise ratio in GC-MS analysis is probably the best by using techniques such as dynamic headspace purge and trap methodology for extraction [41]. The additional validation of the results by SBSE GC-MS is another interesting strategy [34], but deconvolution would be essential for integration [35], particularly if full-scan analysis, instead of using quantification, monitoring one or two ions per VOC [38], was used.
Another suggestion for studying outliers using the proposed methodology is to group the compounds according to their metabolic pathways, taking into account their precursors [42]. Finally, the methodology proposed can be helpful in association studies of VOCs with aroma obtained by sensorial evaluation, particularly with small datasets in which outliers may or may not control what relationships are found, and some variables show collinearity [43].
5. Conclusions
We propose a method for detecting outliers using PCA, double-checked with box-whisker plots, using the VOC variables obtained as percentages of chemical compound classes based, for example, on the total area of identified compounds in a chromatogram with an MQ above 50 (without exogenous compounds). The differences with other variables based on percentages were irrelevant. An excess of compounds, such as alcohols, terpenes, acids, or others in fruit samples was typical of some outliers.
Supplementary Materials
The supplementary materials are available online at https://www.mdpi.com/2297-8739/5/2/30/s1.
Author Contributions
J.P.F.-T. conceived, designed, and performed the experiments; M.Z. contributed to the materials analysis tools; M.Z. and J.P.F.-T. integrated the chromatograms; M.C.B. statistically analyzed the data; and J.P.F.-T. and M.C.B. wrote the paper. All the authors discussed the data and corrected the paper.
Funding
Funds were provided by Fundación Séneca de la Región de Murcia-Spain (grant 11784/PI/09) and UE-FEDER and MINECO in Spain (AGL2010-20858).
Acknowledgments
We are grateful to IRTA-CRAG for the seeds, and to Plácido Varó and co-workers (CIFEA-Torre Pacheco, Consejería de Agricultura, Murcia) for crop management. We thank Laura Llanos, Yineth Piñeros, Paola Jiménez, Libia A. Chaparro, Javier M. Obando-Ulloa, Mohammad-Mahdi Jowkar, Mercedes Gutiérrez, Estanislao Cuadros, and Noelia Dos-Santos for sampling and VOC analysis, and María José Roca (SAIT-UPCT) and Pablo Castillo (Proquimur, Biomaster Group) for GC-MS assistance. Mohamed Zarid is indebted to the UE Erasmus Mundus program for a grant.
Conflicts of Interest
The authors declare no conflict of interest.
References
- Eduardo, I.; Arús, P.; Monforte, A.J.; Obando, J.; Fernández-Trujillo, J.P.; Martínez, J.A.; Alarcón, A.L.; Alvarez, J.M.; van der Knaap, E. Estimating the genetic architecture of fruit quality traits in melon using a genomic library of near- isogenic lines. J. Am. Soc. Hortic. Sci. 2007, 132, 80–89. [Google Scholar]
- Obando-Ulloa, J.M.; Moreno, E.; García-Mas, J.; Nicolai, B.; Lammertyn, J.; Monforte, A.J.; Fernández-Trujillo, J.P. Climacteric or non-climacteric behavior in melon fruit 1. Aroma volatiles. Postharvest Biol. Technol. 2008, 49, 27–37. [Google Scholar] [CrossRef]
- Obando-Ulloa, J.M.; Nicolai, B.; Lammertyn, J.; Bueso, M.C.; Monforte, A.J.; Fernández-Trujillo, J.P. Aroma volatiles associated with the senescence of climacteric or non-climacteric melon fruit. Postharvest Biol. Technol. 2009, 52, 146–155. [Google Scholar] [CrossRef]
- Obando-Ulloa, J.M.; Ruiz, J.; Monforte, A.J.; Fernández-Trujillo, J.P. Aroma profile of a collection of near-isogenic lines of melon. Food Chem. 2010, 118, 815–822. [Google Scholar] [CrossRef]
- Dos-Santos, N.; Bueso, M.C.; Fernández-Trujillo, J.P. Aroma volatiles as biomarkers of textural differences at harvest in non-climacteric near-isogenic lines of melon. Food Res. Int. 2013, 54, 1801–1812. [Google Scholar] [CrossRef]
- Chaparro-Torres, L.A.; Bueso, M.C.; Fernández-Trujillo, J.P. Aroma volatiles at harvest obtained by HSSPME/GC-MS and INDEX/MS-E-nose fingerprint discriminate climacteric behavior in melon fruit. J. Sci. Food Agric. 2016, 96, 2352–2365. [Google Scholar] [CrossRef] [PubMed]
- Canales, I.; Fernández-Trujillo, J.P.; Bueso, M.C.; Zarid, M. Volatile changes in non-climacteric melons with introgression in linkage group X at three stages of maturity. Acta Hortic. (ISHS) 2018, 1194, 351–356. [Google Scholar] [CrossRef]
- Verzera, A.; Dima, G.; Tripodi, G.; Ziino, M.; Lanza, C.M.; Mazzaglia, A. Fast quantitative determination of aroma volatile constituents in melon fruits by headspace solid–phase microextraction and gas chromatography mass spectrometry. Food Anal. Meth. 2011, 4, 141–149. [Google Scholar] [CrossRef]
- Verzera, A.; Dima, G.; Tripodi, G.; Condurso, C.; Crinò, P.; Romano, D.; Mazzaglia, A.; Lanza, C.M.; Restuccia, C.; Paratore, A. Aroma and sensory quality of honeydew melon fruits (Cucumis melo L. subsp. melo var. inodorus H. Jacq.) in relation to different rootstocks. Sci. Hortic. 2014, 169, 118–124. [Google Scholar] [CrossRef]
- Grubbs, F. Procedures for detecting outlying observations in samples. Technometrics 1969, 11, 1–21. [Google Scholar] [CrossRef]
- Aggarwal, C.C.; Yu, P.S. Outlier detection for high dimensional data. ACM Sigmoid Rec. 2001, 30, 37–46. [Google Scholar] [CrossRef]
- Ro, K.; Zou, C.; Wang, Z.; Yin, G. Outlier detection for high dimensional data. Biometrika 2015, 102, 589–599. [Google Scholar] [CrossRef]
- Fernández-Trujillo, J.P.; Obando-Ulloa, J.M.; Monforte, A.J.; Sanmartín, P.; Kessler, M.; Bueso, M.C. Métodos estadísticos multivariantes aplicables a estudios de calidad postcosecha del fruto de melón. In Proceedings of the Fifth Virtual Iberoamerican Congress on Quality Management in Laboratories, Congress V IBEROLAB, Madrid, Spain, 5 April 2009; Available online: http://www.iberolab.org/opencms/export/sites/IberolabV/comunicaciones/Comunicaciones/documentos_comunicaciones/Requisitos_Tecnicos_0003.pdf (accessed on 28 March 2018).
- Tukey, J.W. Exploratory Data Analysis; Addison-Wesley Pub. Co.: Boston, MA, USA, 1977; ISBN 0201076160. [Google Scholar]
- Tijskens, L.M.M.; Dos-Santos, N.; Jowkar, M.M.; Obando, J.; Moreno, E.; Schouten, R.E.; Monforte, A.J.; Fernández Trujillo, J.P. Postharvest firmness behaviour of near-isogenic lines of melon. Postharvest Biol. Technol. 2009, 51, 320–326. [Google Scholar] [CrossRef]
- Amaro, A.L.; Fundo, J.F.; Oliveira, A.; Beaulieu, J.C.; Fernández-Trujillo, J.P.; Almeida, D.P.F. 1-Methylcyclopropene effects on temporal changes of aroma volatiles and phytochemicals of fresh-cut cantaloupe. J. Sci. Food Agric. 2013, 93, 828–837. [Google Scholar] [CrossRef] [PubMed]
- Agilent Technologies, Retention Time Locking with the MSD Productivity ChemStation. Technical Overview 2008. Available online: http://www.chem.agilent.com/Library/technicaloverviews/Public/5989-8574EN.pdf (accessed on 28 March 2018).
- Van den Dool, H.; Kratz, P.D. A generalization of the retention index system including linear temperature programmed gas–liquid partition chromatography. J. Chromatogr. A 1963, 11, 463–471. [Google Scholar] [CrossRef]
- National Institute of Standards and Technology. U.S. Department of Commerce. NIST Chemistry WebBook, SRD 69. 2017. Available online: http://webbook.nist.gov/chemistry/cas-ser/ (accessed on 28 March 2018).
- Fernández-Trujillo, J.P.; Dos-Santos, N.; Martínez-Alcaraz, R.; Le Bleis, I. Non-destructive assessment of aroma volatiles from a climacteric near-isogenic line of melon obtained by headspace sorptive bar extraction. Foods 2013, 2, 401–414. [Google Scholar] [CrossRef] [PubMed]
- Chemindustry. Chemical Information Search. Available online: http://www.chemindustry.com/apps/chemicals (accessed on 28 March 2018).
- The Good Scent Co. Available online: http://www.thegoodscentscompany.com/search2.html (accessed on 28 March 2018).
- Shapiro, S.S.; Wilk, M.B. An analysis of variance test for complete samples. Biometrika 1965, 52, 591–611. [Google Scholar] [CrossRef]
- Le, S.; Josse, J.; Husson, F. FactoMineR: An R package for multivariate analysis. J. Stat. Softw. 2008, 25, 1–18. [Google Scholar] [CrossRef]
- Kuhn, M.; Wing, J.; Weston, S.; Williams, A.; Keefer, C.; Engelhardt, A.; Cooper, T.; Mayer, Z.; Kenkel, B.; The R Core Team; et al. Package ‘Caret’. Classification and Regression Training. R Package Version 6.0–78. 2016. Available online: http://CRAN.R-project.org/package=caret (accessed on 28 March 2018).
- Filzmoser, P.; Gschwandtner, M. Mvoutlier: Multivariate Outlier Detection Based on Robust Methods. R Package Version 2.0.8. 2017. Available online: https://CRAN.R-project.org/package=mvoutlier (accessed on 29 March 2018).
- Komsta, L. Outliers: Tests for Outliers. R Package Version 0.14. 2011. Available online: https://CRAN.R-project.org/package=outliers (accessed on 28 March 2018).
- Moing, A.; Aharoni, A.; Biais, B.; Rogachev, I.; Meir, S.; Brodsky, L.; Allwood, J.W.; Erban, A.; Dunn, W.B.; Kay, L.; et al. Extensive metabolic cross-talk in melon fruit revealed by spatial and developmental combinatorial metabolomics. New Phytol. 2011, 190, 683–696. [Google Scholar] [CrossRef] [PubMed] [Green Version]
- Nattaporn, W.; Pranee, A. Effect of pectinase on volatile and functional bioactive compounds in the flesh and placenta of ‘Sunlady’ cantaloupe. Intl. Food Res. J. 2011, 18, 819–827. [Google Scholar]
- Shalit, M.; Katzir, N.; Tadmor, Y.; Larkov, O.; Burger, Y.; Shalekhet, F.; Lastochkin, E.; Ravid, U.; Amar, O.; Edelstein, M.; et al. Acetyl-CoA: Alcohol acetyltransferase activity and aroma formation in ripening melon fruits. J. Agric. Food Chem. 2001, 49, 794–799. [Google Scholar] [CrossRef] [PubMed]
- Gonda, I.; Bar, E.; Portnoy, V.; Lev, S.; Burger, J.; Schaffer, A.A.; Tadmor, Y.; Gepstein, S.; Giovannoni, J.; Katzir, N.; et al. Branched-chain and aromatic amino acid catabolism into aroma volatiles in Cucumis melo L. fruit. J. Exp. Bot. 2010, 61, 1111–1123. [Google Scholar] [CrossRef] [PubMed]
- Portnoy, V.; Benyamini, Y.; Bar, E.; Harel-Beja, R.; Gepstein, S.; Giovannoni, J.J.; Schaffer, A.A.; Burger, J.; Tadmor, Y.; Lewinsohn, E.; et al. The molecular and biochemical basis for varietal variation in sesquiterpene content in melon (Cucumis melo L.) rinds. Plant Mol. Biol. 2008, 66, 647–661. [Google Scholar] [CrossRef] [PubMed]
- Condurso, C.; Verzera, A.; Dima, G.; Tripodi, G.; Crinò, P.; Paratore, A.; Romano, D. Effects of different rootstocks on aroma volatile compounds and carotenoid content of melon fruits. Sci. Hortic. 2012, 148, 9–16. [Google Scholar] [CrossRef]
- Fernández-Trujillo, J.P.; Fernández-Talavera, M.; Ruiz-León, M.T.; Roca, M.J.; Dos-Santos, N. Aroma volatiles during whole melon ripening in a climacteric near-isogenic line and its inbred non-climacteric parents. Acta Hortic. (ISHS) 2012, 934, 951–958. [Google Scholar] [CrossRef]
- Barba, C.; Thomas-Danguin, T.; Guichard, E. Comparison of stir bar sorptive extraction in the liquid and vapour phases, solvent-assisted flavour evaporation and headspace solid-phase microextraction for the (non)-targeted analysis of volatiles in fruit juice. LWT-Food Sci. Technol. 2017, 85(Part B), 334–344. [Google Scholar] [CrossRef]
- Biais, B.; Allwood, J.W.; Deborde, C.; Xu, Y.; Maucourt, M.; Beauvoit, B.; Dunn, W.B.; Jacob, D.; Goodacre, R.; Rolin, D.; et al. 1H NMR, GC-EI-TOFMS, and data set correlation for fruit metabolomics: Application to spatial metabolite analysis in melon. Anal. Chem. 2009, 81, 2884–2894. [Google Scholar] [CrossRef] [PubMed]
- Escudero, A.A.; Zarid, M.; Bueso, M.C.; Fernández-Trujillo, J.P. Aroma volatiles during non-climacteric melon ripening and potential association with flesh firmness. Acta Hortic. (ISHS) 2018, 1194, 363–366. [Google Scholar] [CrossRef]
- Gonda, I.; Lev, S.; Bar, E.; Sikron, N.; Portnoy, V.; Davidovich-Rikanati, R.; Burger, J.; Schaffer, A.A.; Tadmor, Y.; Giovannonni, J.J.; et al. Catabolism of L–methionine in the formation of sulfur and other volatiles in melon (Cucumis melo L.) fruit. Plant J. 2013, 74, 458–472. [Google Scholar] [CrossRef] [PubMed]
- Esteras, C.; Rambla, J.L.; Sánchez, G.; López-Gresa, M.P.; González-Mas, M.C.; Fernández-Trujillo, J.P.; Bellés, J.M.; Granell, A.; Picó, M.B. Fruit flesh volatile and carotenoid profile analysis within the Cucumis melo L. species reveals unexploited variability for future genetic breeding. J. Sci. Food Agric. 2018, 98. in press. [Google Scholar] [CrossRef] [PubMed]
- Oh, S.; Lim, B.S.; Hong, S.J.; Lee, S.K. Aroma volatile changes of netted muskmelon (Cucumis melo L.) fruit during developmental stages. Hortic. Environ. Biotechnol. 2011, 52, 590–595. [Google Scholar] [CrossRef]
- Fredes, A.; Sales, C.; Barreda, M.; Valcárcel, M.; Roselló, S.; Beltrán, J. Quantification of prominent volatile compounds responsible for muskmelon and watermelon aroma by purge and trap extraction followed by gas chromatography-mass spectrometry determination. Food Chem. 2016, 190, 689–700. [Google Scholar] [CrossRef] [PubMed]
- Wüst, M. Smell of stress: Identification of induced biochemical pathways affecting the volatile composition and flavor quality of crops. J. Agric. Food Chem. 2018, 66, 3616–3618. [Google Scholar] [CrossRef] [PubMed]
- Chambers, E.; Koppel, K. Associations of volatile compounds with sensory aroma and flavor: The complex nature of flavor. Molecules 2013, 18, 4887–4905. [Google Scholar] [CrossRef] [PubMed]
Figure 1.
Correlation (left) and score (right) plots of the first three components of the PCA (with 67.82% of variance explained) applied to compound classes of aroma variable based on total areas (only compounds with match quality >50 without exogenous compounds), obtained in two seasons. The areas of compound classes were normalized to the response of the internal standard (1-phenylethanol) for each season. ACE, acetate ester; NAE, non-acetate ester; ALD, aldehyde; ALC, alcohols, KET, ketones; SDC, sulfur derived-compounds; TER, terpenes; AHA, alkanes and aliphatic compounds; OTH, other compounds. Circles represent r2 = 50% and 100% variability explained by the components. Potential outliers are marked by dashed red line.

Figure 2.
Correlation (left) and score (right) plots of the first three components of the PCA (with 50.27% of explained variance) applied to compound classes of aroma variable of percentages of different compound classes based on total area counts of such compounds with match quality >50, and without exogenous compounds, obtained in two seasons. ACE, acetate ester; NAE, non-acetate ester; ALD, aldehyde; ALC, alcohols, KET, ketones; SDC, sulfur derived-compounds; TER, terpenes; AHA, alkanes and aliphatic compounds; OTH, other compounds. Circles represent r2 = 50% and 100% variability explained by the components. Potential outliers are marked by dashed black line.

Figure 3.
Box whisker-plot of three variables of compound classes (in percentage of area counts of the melon compound identified with match quality >50 and without exogenous compounds). (A) Alcohols; (B) acids; and (C) terpenes. Bold red circles indicate the selected outliers (with the fruit code beside this circle).

Figure 4.
Correlation analysis of alcohol (ALC) and terpene (TER) percentages based on total areas of the melon compounds identified with match quality > 50, and without exogenous compounds). Classical and robust 97.5% confidence ellipses of the data (blue and red, respectively). The robust method used 50% of the observations for minimum covariance determinant (MCD) estimations. The strong outliers labeled are the fruits 4B and 15A from season 1.

Figure 5.
Correlation (left) and score (right) plots of the first three components of the PCA (with 49.13% of explained variance) applied to variables of different volatile organic compound classes based on percentages of total areas (only compounds with match quality >50) and without exogenous compounds included, obtained in two seasons, after removing the two fruit with outliers of season 1. ACE, acetate ester; NAE, non-acetate ester; ALD, aldehyde; ALC, alcohols, KET, ketones; SDC, sulfur derived-compounds; TER, terpenes; AHA, alkanes and aliphatic compounds; OTH, other compounds. Circles represent r2 = 50% and 100% variability explained by the components.


Table 1.
Main volatile organic compounds extracted by headspace solid phase microextraction, measured by gas-chromatography coupled to mass spectrometry and tentatively identified by deconvolution analysis versus NIST11 database. Chemical compound were identified in more than 90% of the melon fruit samples analyzed (outliers excluded from the calculations) in order of retention time. The column used was an HP-5MS UI.
| RT Mean | Chemical Abstract Service | Volatile Organic Compound | Linear Retention Index Calculated | Match Quality Mean |
|---|---|---|---|---|
| (Min) | Name | (IUPAC Name) | (ud) | (%) |
| 1.279 | 000074-93-1 | Methanethiol | <400 | 92 |
| 3.572 | 000624-92-0 | Methyldisulfanylmethane | 737 | 94 |
| 4.143 | 000071-41-0 | Pentan-1-ol | 763 | 88 |
| 4.949 | 000066-25-1 | Hexanal | 799 | 92 |
| 7.581 | 000111-27-3 | Hexan-1-ol | 867 | 90 |
| 8.974 | 000111-71-7 | Heptanal | 902 | 91 |
| 11.951 | 000100-52-7 | Benzaldehyde | 954 | 83 |
| 12.427 | 003658-80-8 | Methylsulfanyldisulfanylmethane | 962 | 88 |
| 14.814 | 000124-13-0 | Octanal | 1004 | 89 |
| 16.607 | 000104-76-7 | 2-ethylhexan-1-ol | 1033 | 86 |
| 18.709 | 000098-86-2 | 1-phenylethanone | 1067 | 92 |
| 20.146 | 000617-94-7 | 2-phenylpropan-2-ol | 1091 | 81 |
| 20.814 | 000124-19-6 | Nonanal | 1107 | 94 |
| 20.916 | 004621-04-9 | 4-Isopropylcyclohexanol (isomer) | 1114 | 75 |
| 21.433 | 000464-49-3 | 1,7,7-trimethylbicyclo[2.2.1]heptan-2-one | 1151 | 95 |
| 21.629 | 010340-23-5 | (Z)-non-3-en-1-ol | 1165 | 81 |
| 22.015 | 000098-19-1 | 1-tert-butyl-3,5-dimethylbenzene | 1193 | 72 |
| 22.112 | 000112-40-3 | Dodecane | 1200 | 82 |
| 22.177 | 000112-31-2 | Decanal | 1208 | 92 |
| 22.911 | 71186-24-8 | (6Z)-6-[(E)-but-2-enylidene]-1,5,5-trimethylcyclohexene | 1305 | 59 |
| 23.463 | 000629-59-4 | Tetradecane | 1400 | 65 |
© 2018 by the authors. Licensee MDPI, Basel, Switzerland. This article is an open access article distributed under the terms and conditions of the Creative Commons Attribution (CC BY) license (http://creativecommons.org/licenses/by/4.0/).
Share and Cite
MDPI and ACS Style
Fernández-Trujillo, J.P.; Zarid, M.; Bueso, M.C. Methodology to Remove Strong Outliers of Non-Climacteric Melon Fruit Aroma at Harvest Obtained by HS-SPME GC-MS Analysis. Separations 2018, 5, 30. https://doi.org/10.3390/separations5020030
AMA Style
Fernández-Trujillo JP, Zarid M, Bueso MC. Methodology to Remove Strong Outliers of Non-Climacteric Melon Fruit Aroma at Harvest Obtained by HS-SPME GC-MS Analysis. Separations. 2018; 5(2):30. https://doi.org/10.3390/separations5020030
Chicago/Turabian StyleFernández-Trujillo, Juan Pablo, Mohamed Zarid, and María Carmen Bueso. 2018. "Methodology to Remove Strong Outliers of Non-Climacteric Melon Fruit Aroma at Harvest Obtained by HS-SPME GC-MS Analysis" Separations 5, no. 2: 30. https://doi.org/10.3390/separations5020030
Note that from the first issue of 2016, this journal uses article numbers instead of page numbers. See further details here.