A Comparative Study of Neural Networks and ANFIS for Forecasting Attendance Rate of Soccer Games


1
Department of Business Administration, Adiyaman University, 02040 Adiyaman, Turkey
2
Department of Industrial Engineering, Cukurova University, 01330 Adana, Turkey
*
Author to whom correspondence should be addressed.
Math. Comput. Appl. 2017, 22(4), 43; https://doi.org/10.3390/mca22040043
Submission received: 17 October 2017
/
Revised: 30 October 2017
/
Accepted: 30 October 2017
/
Published: 1 November 2017
Abstract
:The main purpose of this study was to develop and apply a neural network (NN) approach and an adaptive neuro-fuzzy inference system (ANFIS) model for forecasting the attendance rates at soccer games. The models were designed based on the characteristics of the problem. Past real data was used. Training data was used for training the models, and the testing data was used for evaluating the performance of the forecasting models. The obtained forecasting results were compared to the actual data and to each other. To evaluate the performance of the models, two statistical indicators, Mean Absolute Deviation (MAD) and mean absolute percent error (MAPE), were used. Based on the results, the proposed neural network approach and the ANFIS model were shown to be effective in forecasting attendance at soccer games. The neural network approach performed better than the ANFIS model. The main contribution of this study is to introduce two effective techniques for estimating attendance at sports games. This is the first attempt to use an ANFIS model for that purpose.
1. Introduction
Sports attendance has attracted substantial attention in the fields of sports economics and marketing. Team managers, regulators, and sporting league administrators use demand information when making decisions [1]. Additionally, as a promising pricing strategy, dynamic ticket pricing models require effective demand forecasting. Therefore, understanding sports demand and its determinants is important, as is accurately forecasting the demand.
Research about sports demand is important for sports economics. Therefore, an abundance of studies exist about attendance at sports games or demand for sports games. The majority of these studies are econometric studies whose goal was to reveal determinants of the demand. Some of the studies are as follows: García and Rodríguez [2] analyzed data from seasons 1992–1993 to 1995–1996 of the Spanish Football League to estimate an attendance equation. Weather conditions, day of the game, and quality of both home and away teams were found to be significant factors affecting demand. Forrest and Simmons [3] found that home team performance had a greater impact on attendance than away team performance, as Bruggink and Eaton [4] and Rascher [5] found for Major League Baseball. Hart et al. [6] constructed a model to estimate the attendance for four English First Division clubs. The geographical distance between the stadiums of home and away teams was considered a significant factor. This factor allowed the local derby effect on attendance. In addition, highly ranked away teams attracted more spectators. Dobson and Goddard [7] analyzed disaggregated game attendance data for the English Football League to investigate the attendance determinants. The geographical distance between away and home teams and the league ranking of the home team were considered significant variables. The number of points earned by home and away teams from their previous five games was a significant factor affecting attendance. In summary, many studies have examined the factors affecting attendance of soccer games.
The name and number of factors may differ depending on the scope of the study. Various determinants, such as weather, day of a game, time of a game, and performance of teams, affect the demand of sports games [8]. These may differ based on the sport being played. For example, rainy weather has a negative effect on cricket game demand [9]. However, the temperature may not significantly impact attendance of soccer games [10]. Additionally, the demand for a baseball game may be prominently affected by the pitcher that is playing [11]. However, this situation may be different for other sports disciplines. The lack of a star player may not be that impactful on attendance of the game [1]. Overall, by evaluating the literature, the ground distance between home and away teams [1,12,13], day of the game [14,15], and performance of the home team and performance of the away team [3,4,5] were chosen as the determining factors to forecast the attendance rate in this study.
Forecasting the demand can be achieved in different ways. Causal methods like econometric models [16], time series methods [17], qualitative methods like market research, and artificial intelligence methods like fuzzy logic [18] have been used for demand forecasting. This study aimed to contribute to the literature by introducing a unique and competitive adaptive neuro-fuzzy inference system (ANFIS)-based model for estimating the attendance rate at soccer games. The model is not limited to soccer games, since it can be applied to other sports disciplines by making a few modifications.
Different types of neural networks (NN) have been used in many areas. Since the neurological network models by McCulloch and Pitts [19], hundreds of different models have been developed that are considered neural networks. Neural network studies in sports are used for predicting a game’s winner or the winning rate of a team, sports results, and success for different sports disciplines. Huang and Chang [20] designed a neural network model based on multi-layer perception (MLP) with a back-propagation learning rule to predict the game’s winning rate for home and away teams. The 2006 World Cup data was used for that purpose and a prediction accuracy of 76.9% was achieved. Purucker [21] examined the use of neural networks to predict the winner in the National Football League. Maszczyk et al. [22] compared the accuracy of regression and artificial neural network models in estimating sports results, using the data from a group of 116 javelin throwers. Based on the results, the neural network model provided better estimates for sports results than regression models. Rotshtein et al. [23] benefited from neural networks for predicting football game results. Fuzzy logic, a neural network, and a genetic algorithm were combined for that purpose. Loeffelholz et al. [24] designed neural networks to estimate the success of basketball teams in the National Basketball Association (NBA). The data from 620 NBA games were analyzed and used for training neural networks. A prediction accuracy of 74.33% was achieved, on average, compared to the 68.67% prediction accuracy of experts. Condon et al. [25] developed neural network and OLS linear regression models to predict the success of countries at the Summer Olympic Games. The data from the 1996 Summer Games was used. According to the comparisons of the model results, the best neural network model provided better results than the best regression model. Additionally, neural network models were applied to the selection process of players or talents. McCullagh [26] designed a neural network approach for the selection of players in the annual Australian Football League (AFL) National Draft. According to the results, the neural network model had the ability to help recruiting managers in the talent identification process. Maszczyk et al. [27] used neural networks in a selection process of javelin throwers. Based on the experiments, they determined neural network models provide valuable assistance in the recruiting process of javelin throwers. Strnad et al. [28] also used neural networks to estimate soccer match attendance and found that neural networks performed better than the traditional regression model. Different from their study, Levenberg-Marquardt was chosen as the most effective training function in this study. Additionally, the performance of the away team was considered as a determining factor. Lastly, the performance of neural networks was compared to the ANFIS that was used for the first time for that purpose in this study.
Neural networks, by using a supervised learning approach, learn from training data, and adjust weights to reduce the error between the actual data and the forecasting result produced by the model [26]. Since the feed-forward neural network models are adaptable extensions to the standard regression models, they are an alternative for use in prediction and exploratory analysis with larger data sets [29]. Neural networks can be an alternative to linear regression or time-series analysis [30]. Neural networks have been used in sports areas, and have produced better results than regression models [22,25].
The ANFIS model is proposed for predicting the attendance at soccer games. The ANFIS combines the advantages of both artificial neural networks and fuzzy inference systems. The ANFIS has some advantages, including the ability to capture the nonlinear structure of a process, adaptation capability, and rapid learning capacity. The ANFIS has been applied to many areas including economics [31], passenger demand forecasting [32], energy [33], and the environment [34]. However, it has been underused in sports, having only been used for simulated soccer agents [35].
The proposed models were trained by real data from soccer games. The attendance rates of soccer games were forecasted by considering the day of the game, the distance, and the performance of the home and away teams. These determinants were chosen after comprehensive research and interviewing with experts. For example, one of the points supporting the performance of the away team as a determining factor is that Hart et al. [6] analyzed the effect of current league rankings of the home and away teams, and found that highly placed away teams attracted higher attendance.
2. Materials and Methods
2.1. Neural Networks
Neural networks, also called artificial neural networks, are an Artificial Intelligence technique that mimics human brain behavior [36]. Due to its learning and generalization capabilities, neural networks can be expressed as a mathematical representation of the human neural architecture [37]. In this study, the terms neural network and artificial neural network are used interchangeably. Neural networks have been used in different areas, such as sports, finance, space, energy, education, sales and marketing, human resources, and so on. They have been applied to problems of medical diagnosis [37], credit ratings [38], pattern recognition [39], predicting student performance [40], sales forecasting [41], staff scheduling [42], electrical load forecasting [43], and predicting sports results.
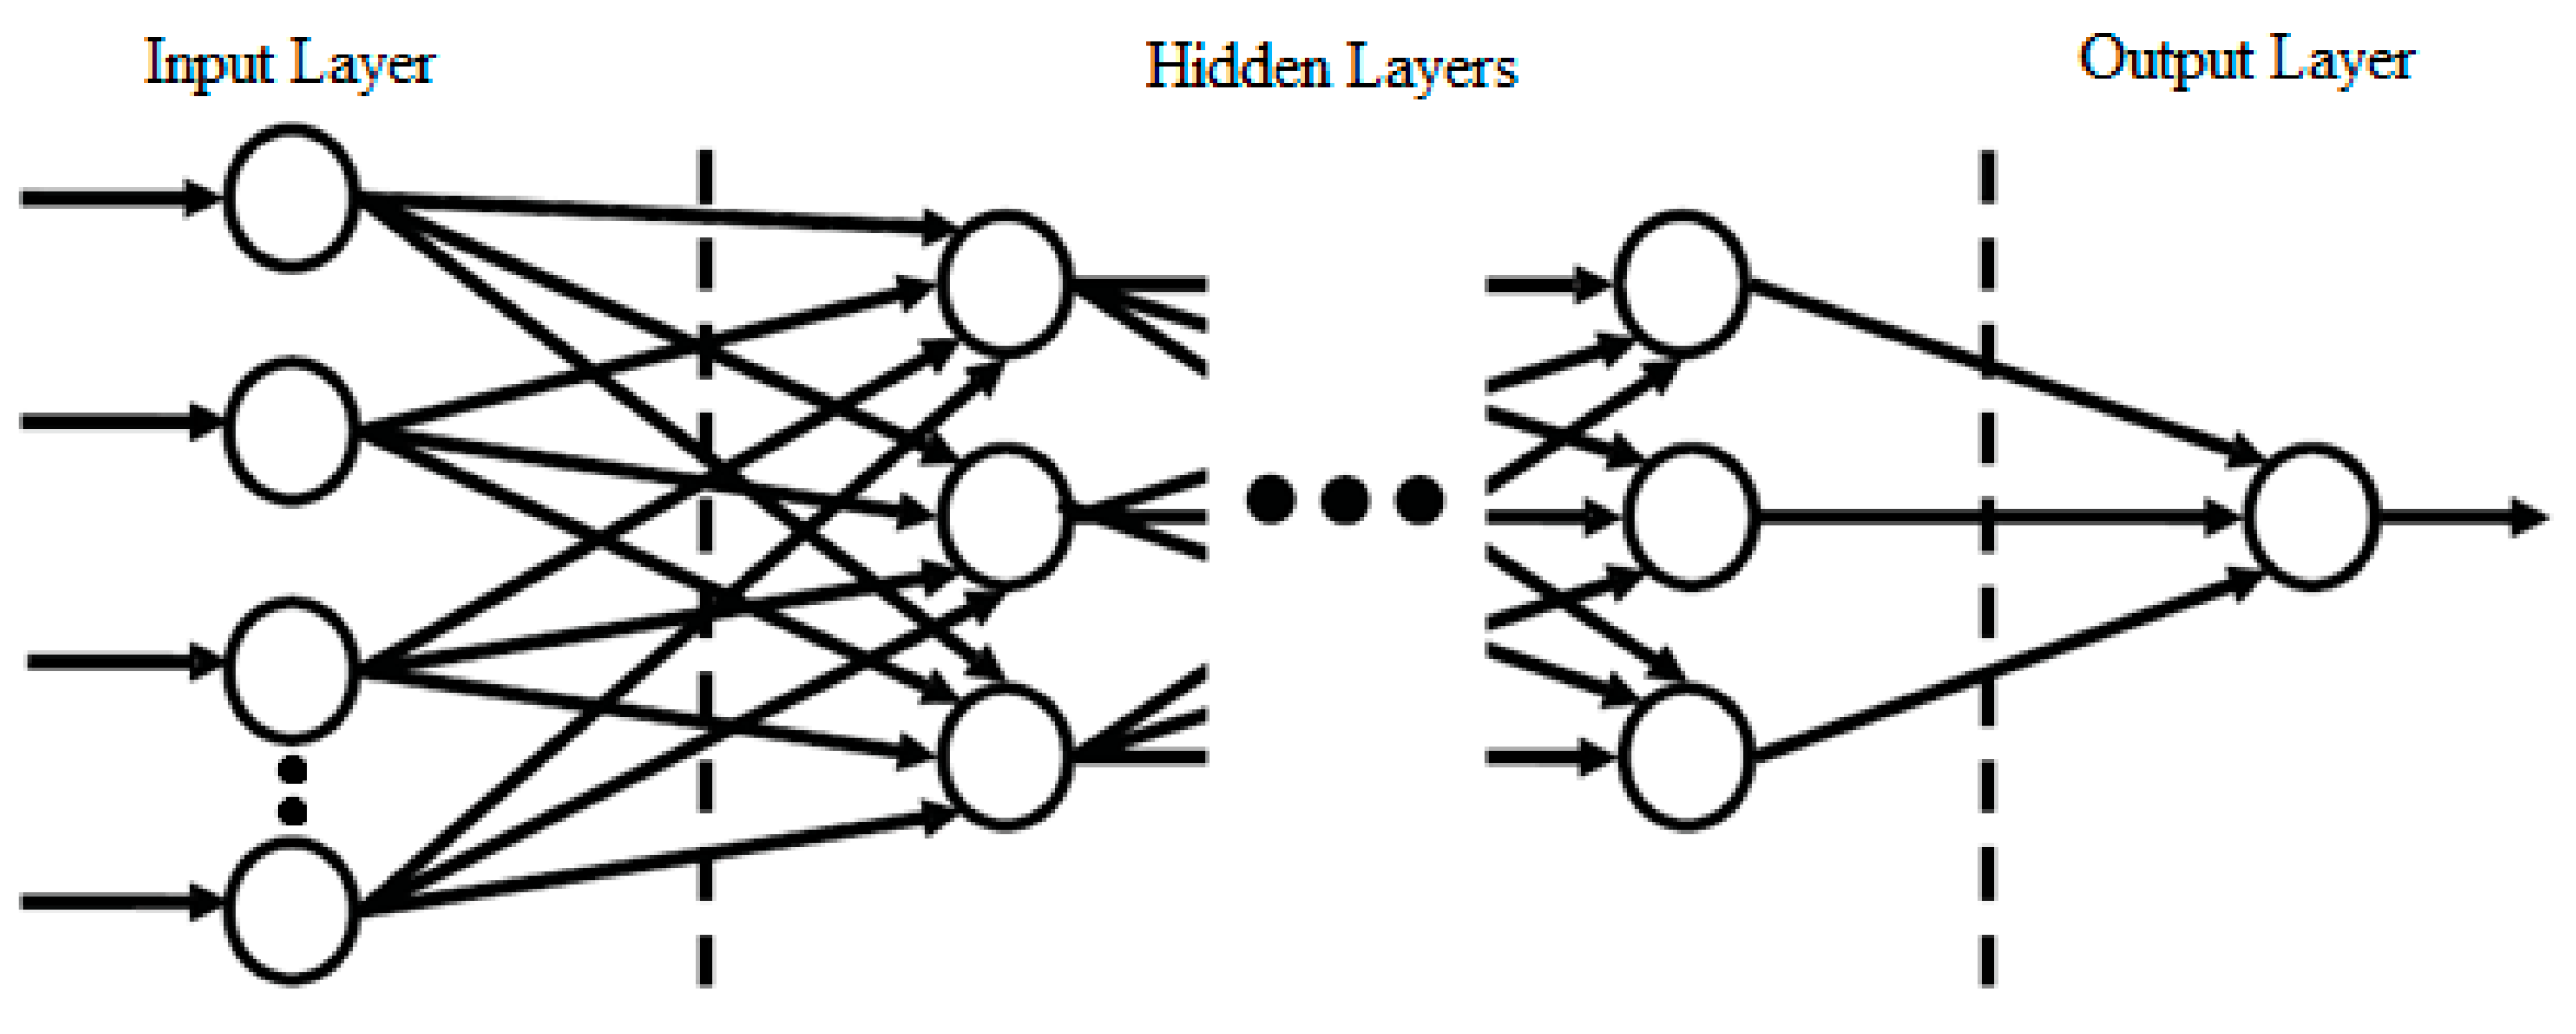
Wherever a relationship exists between explanatory variables (inputs) and explained variables (outputs), neural networks can be applied [27]. They are especially applicable where the input–output relationship is complex or unknown [22]. An artificial neural network includes three layers: input, hidden (invisible), and output. The input layer is expected to receive data from the external environment. The input data may be normalized to improve the results. The hidden layer, which is comprised of neurons, is expected to transform the input to a form that the output can use. The output layer is also comprised of neurons and is expected to produce and present the final outputs. Depending on how the neurons are interconnected, the composition of the layers, and the disposition of neurons, the main architecture of artificial neural networks can be classified as single layer feedforward neural network, multilayer feedforward network, recurrent network, or mesh network [44]. Multilayer Perceptron (MLP) is one of the main networks using the multilayer feedforward architecture. The general structure of MLP is shown in Figure 1.
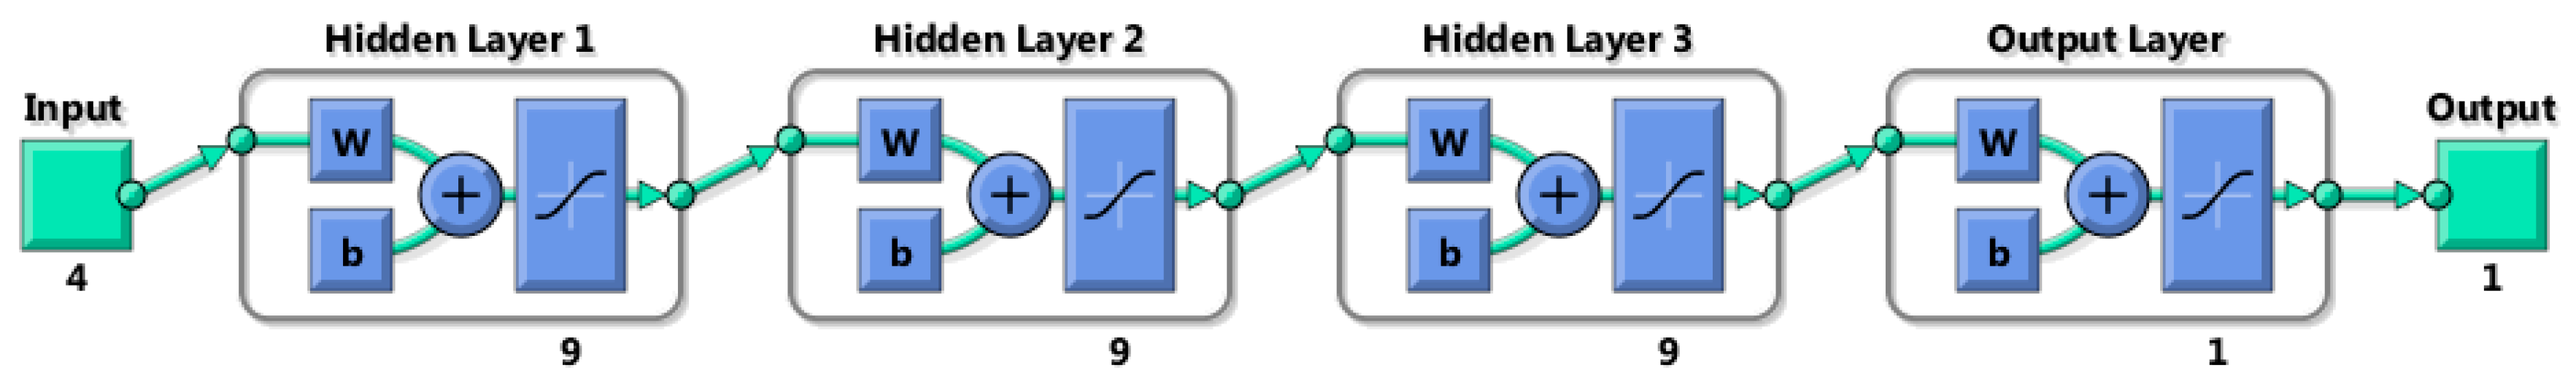
In this study, the network has three hidden layers with nine neurons each providing the optimal forecasting results. The structure of the proposed neural network model is shown in Figure 2.
There are some advantages of using artificial neural networks. First, they are data driven and do not require any restrictive assumptions on the form of the model. Second, they have the ability to generalize. After training by using real data, the NN responds to new data that has not been used in the training phase. Third, they have the ability to detect complex nonlinear relationships between dependent and independent variables [45].
No certain method exists to determine the most appropriate neural network structure prior to training, so the neural network model is generally designed through a trial and error procedure [46]. In other words, all possible neural network model structures are trained by using the training data set and tested by using the testing data set. The neural network model structure providing the best results, with the smallest error, is eventually selected.
Neural network architectures can be grouped into supervised and unsupervised networks. Supervised neural networks are trained to produce outputs by using sample inputs. They are well-suited for modeling and controlling dynamic systems, and predicting future events. Some of the supervised networks include feedforward, radial basis, and learning vector quantization. Feedforward networks are most commonly used for prediction and pattern recognition and include feedforward backpropagation, cascade feedforward backpropagation, and perception networks. Unsupervised neural networks, such as self-organizing maps, are able to adjust themselves to new inputs [47]. For the purpose of this study, the feedforward backpropagation network was chosen based on the properties of the problem and after experimenting with different network types.
Neural networks are retrained until the desired accuracy has been reached. Different training functions exist, and are chosen depending on the type of a problem. For example, Scaled Conjugate Gradient and Resilient Backpropagation are appropriate for training large networks and pattern recognition networks [48]. Levenberg-Marquardt is the fastest training function, being suitable for training small- and medium-sized networks. Being one of the most efficient algorithms, Levenberg-Marquardt is highly recommended for neural networks [49]. Considering the features of the problem in this study, Levenberg-Marquardt was chosen as the training function.
2.2. Adaptive Neuro-Fuzzy Inference System
ANFIS was introduced by Jang [50]. ANFIS is used for modeling, controlling, and parameter estimation in complex systems [51]. ANFIS is a combination of artificial neural network (ANN) and fuzzy inference system (FIS). Combining the ANN and fuzzy-set theory can provide advantages and overcome the disadvantages in both techniques. The ANFIS model can be trained without relying solely on expert knowledge sufficient for a fuzzy logic model. The ANFIS model has the advantage of having both numerical and linguistic knowledge. ANFIS also uses the ANN’s ability to classify data and identify patterns. Compared to the ANN, the ANFIS model is more transparent to the user and causes less memorization errors. Consequently, several advantages of the ANFIS exist, including its adaptation capability, nonlinear ability, and rapid learning capacity [32].
This approach is essentially a rule-based fuzzy logic model whose rules are developed during the training process of the model [52]. The training process is data-based. ANFIS constructs a fuzzy inference system (FIS) whose membership function parameters are derived from the training examples. The most commonly used fuzzy inference systems are Mamdani and Sugeno. The main difference between Mamdani and Sugeno is that the output membership functions of the Sugeno system are either linear or constant [53]. However, the output membership functions of the Mamdani system can be triangular, Gaussian, etc. In this study, the Sugeno-type fuzzy inference system was used, because the Sugeno-type system is more computationally efficient than the Mamdani type. The Mamdani type is more reliant on expert knowledge. However, the Sugeno type is trained by real data.
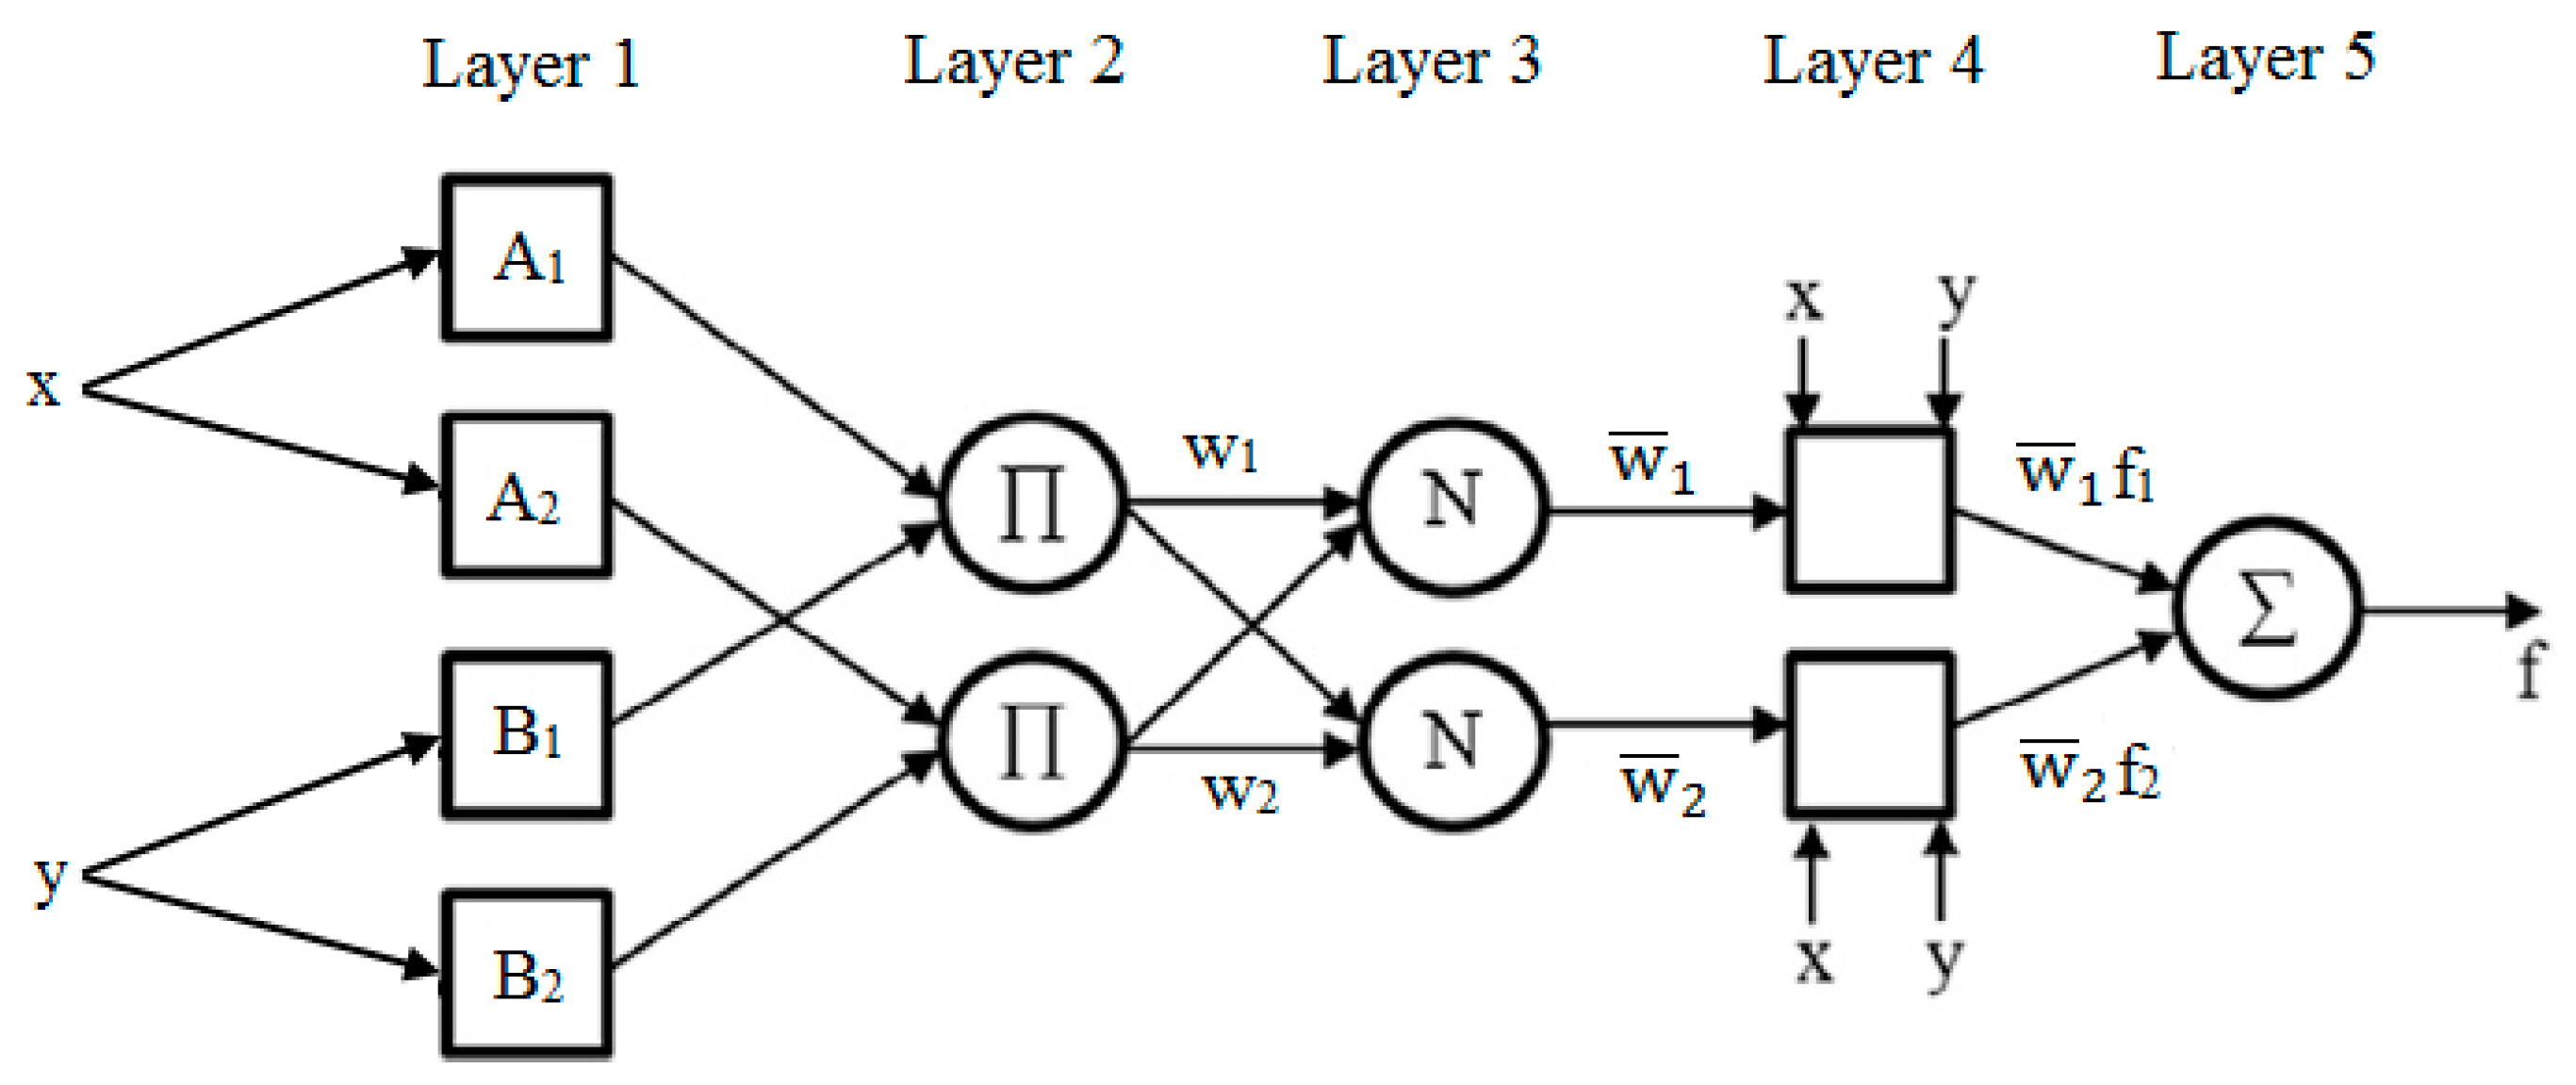
In order to explain the ANFIS architecture, we assumed that there are two inputs: x and y. Two fuzzy if–then rules for a first-order Sugeno fuzzy model can be expressed as follows:
where Ai and Bi are the fuzzy sets, fi is the output, and pi, qi, and ri are the design parameters that are determined during the training process. The ANFIS architecture used to implement the two rules is shown in Figure 3.
Rule 1: If x is A1 and y is B1, then f1 = p1x + q1y + r1,
Rule 2: If x is A2 and y is B2, then f2 = p2x + q2y + r2,
The structure of ANFIS includes five layers that can be explained as follows, where represents the output of the ith node and jth layer [54]:
Layer 1: In this layer, each node represents a node function:
where x is the input to the ith node. Ai is the linguistic label (cold, warm, etc.) characterized by proper membership functions. Some of the membership functions are triangular, trapezoidal, and Gaussian.
Layer 2: In this layer, each node calculates the firing strength of a rule by multiplication:
Layer 3: In this layer, firing strengths that were evaluated in the previous layer are normalized to distinguish between the firing strengths of each rule from the total firing strengths of total rules:
Layer 4: In this layer, node i calculates the contribution of ith rule to the overall output:
where is the output of Layer 3, and the parameter set is .
Layer 5: In this layer, the single node calculates the overall output as the total contribution from each rule:
The ANFIS has two learning algorithms, back-propagation and hybrid methods, which try to minimize the error between the observed and predicted data [55]. An effectively designed ANFIS is able to solve any nonlinear and complex problems with high precision [56]. In this study, an ANFIS was designed for estimating attendance at soccer games.
2.3. Methodology
This was the first attempt to use the ANFIS models for predicting the attendance rate at soccer games. The neural network and ANFIS are believed to be able to capture the relationships among the determinants of the attendance after training with real data.
In this study, designing the models occurred in several steps. First, the determinants of the demand of soccer games were analyzed in detail. The more accurate the selected determinants are, the more realistic the attendance forecasting will be. Second, the most effective determinants were chosen, and the required data was collected from different sources. Day of game, distance, and performance of home and away teams were selected as inputs after conducting comprehensive research in sports literature and interviews with sports managers. The first input represented the day of the week of the game. Days are represented by numbers from 1 to 7. Monday was represented by 1, Tuesday was 2, and so on. The second input was the ground distance in miles, between stadiums of both the home and away clubs. The third input was the performance of the home team. After collecting the needed data, some calculations were made. The points the home team had earned were divided by possible total points up until the game day in the season. The fourth input was the performance of the away team, which was calculated using the same method as the performance of the home team. The attendance rate was used as the output. Third, for use by the neural network and the ANFIS, the day of the game and distance input variables were standardized into the interval [0, 1]. This was achieved by dividing the value of the input by the maximum value of the input. This method is called “maximum linear standardization” [57]. The summary of this step is shown in Table 1.
Fourth, the network was created and configured using the MATLAB 2015b Neural Network tool. Considering the characteristics of the problem, the most suitable network type was selected after a trial and error procedure. After experimenting with different training functions, the most appropriate training function was chosen for the problem. The number of hidden layers and number of neurons were determined through trial and error. The properties of the proposed neural network are shown in Table 2. Fifth, the network was trained several times until the desired accuracy level was reached and the error minimized. The training data was used for training the neural network model, and the testing data was used for evaluating the performance of the forecasting model. In this study, five seasons’ data were used for training and one season’s data were used for testing.
Sixth, the ANFIS model was designed and trained by using the MATLAB 2015b ANFIS designer. The parameters were optimized after several trials. Finally, the model was validated. The properties of the proposed ANFIS model are shown in Table 3.
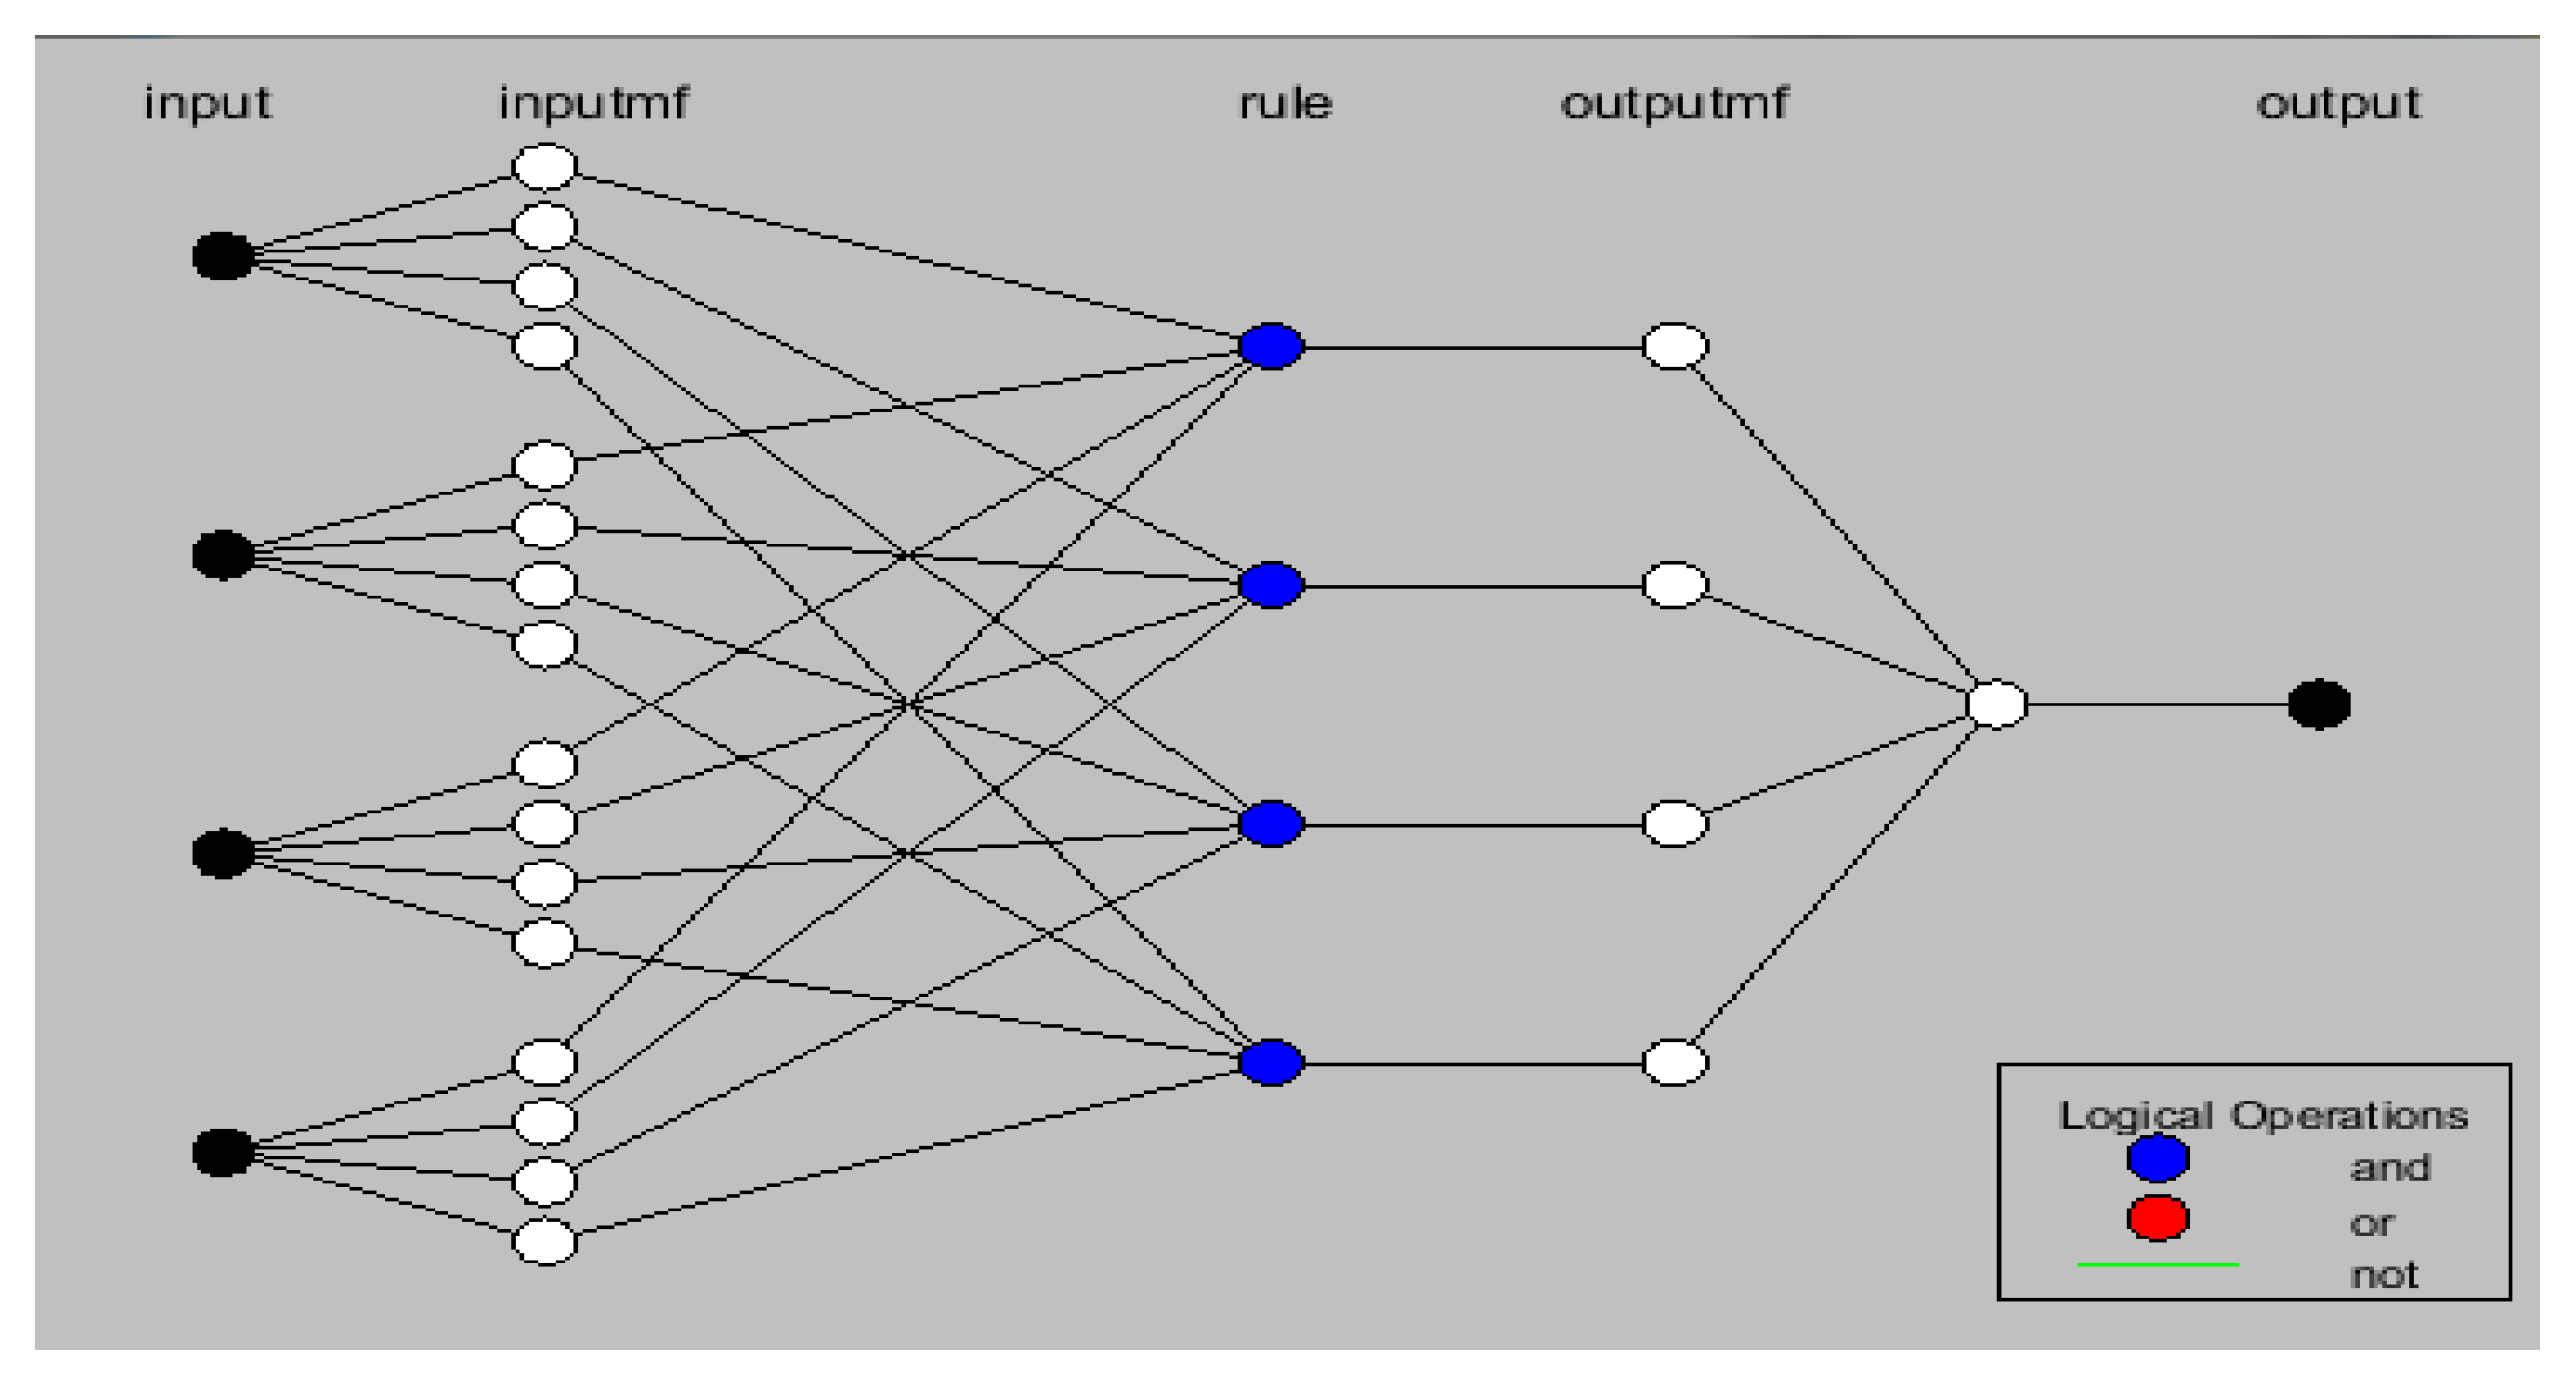
The structure of the proposed ANFIS model is shown in Figure 4.
3. Results and Discussion
The proposed neural network and ANFIS-based soccer attendance forecasting approaches were applied to the attendance data of FC Barcelona, a Spanish football club. Five seasons’ data, from the 2011–2012 and 2015–2016 seasons, were analyzed and used for forecasting the attendance rates for the 2016–2017 season. The required data for the day of games and performance of home team were collected from the club’s website, https://www.fcbarcelona.com. The required data for the performance of the away team were collected from the away teams’ websites. The data for distance were collected from the website https://www.distancecalculator.net. After collecting all required data, the needed calculations were made. The input data of distance and day of game were standardized for better results. For the neural network model, the five seasons’ data were used for training the model. After determining the properties of the network, the network was trained several times until reaching a certain accuracy level. Then, the input data for the 2016–2017 season were used for simulation to obtain the predicted attendance rates for this season. For the ANFIS model, the five seasons’ data were used for training the model. All obtained results from the two models were compared to the real data for the 2016–2017 season, as shown in Table 4.
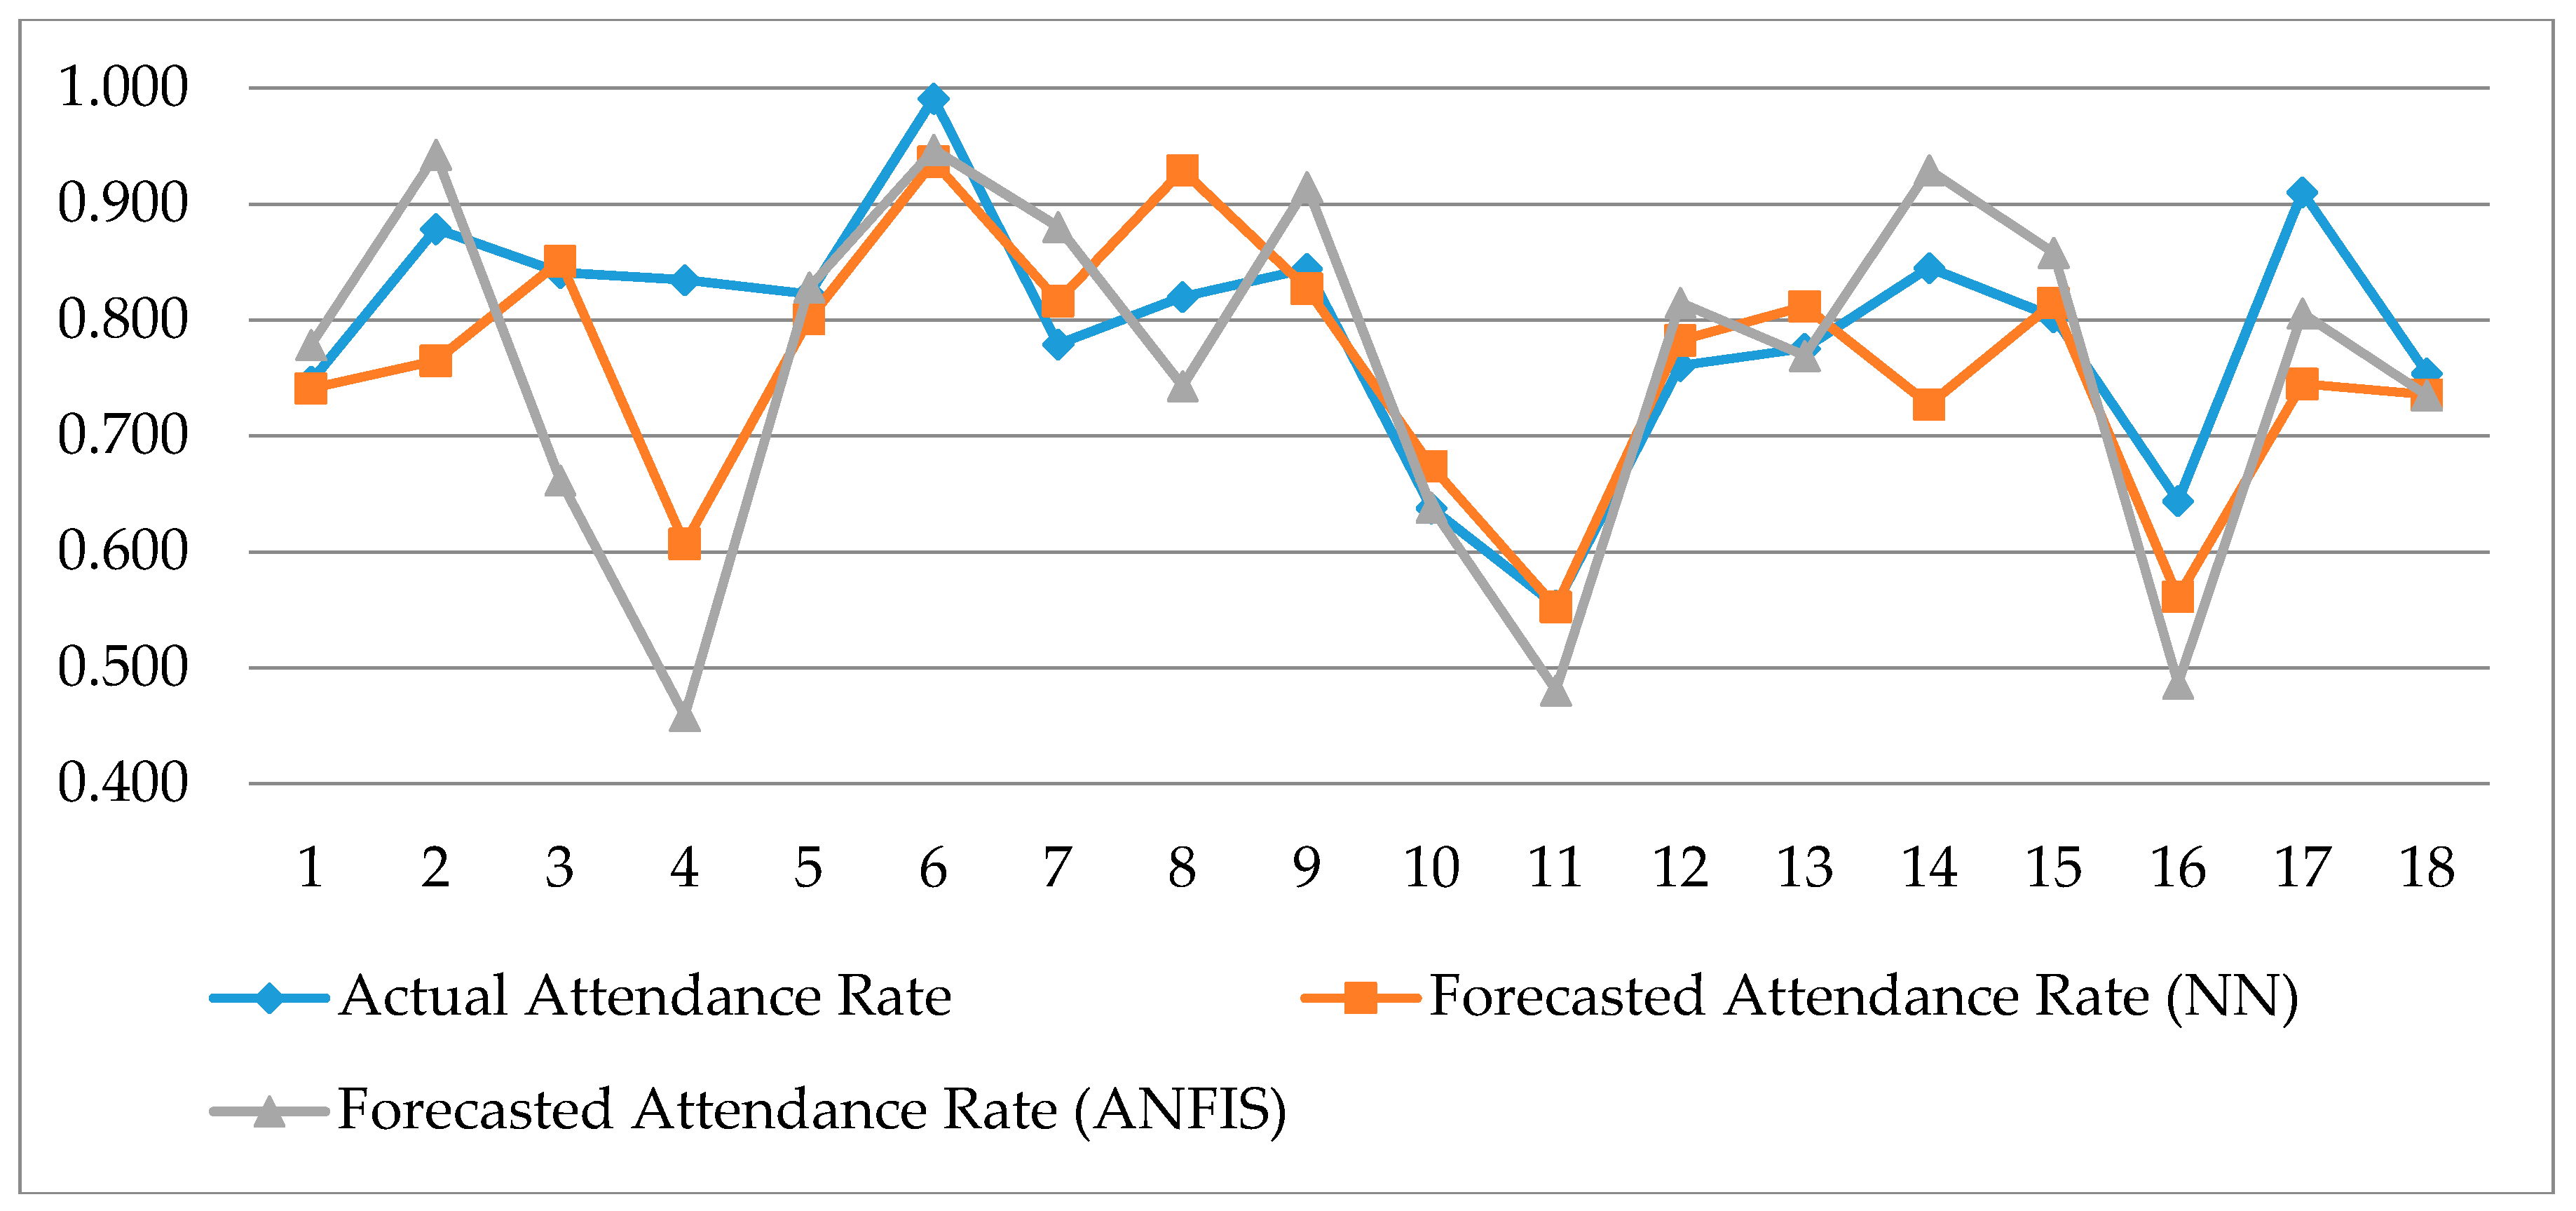
As seen in Table 4, the forecasted values are generally close to the actual data. However, some variation does exist. For instance, the NN model produced the closest values to the actual data in periods 1, 3, 5, 11, 12, 15, and 18. The ANFIS model produced the best estimates in periods 5, 10, 13, and 18. The comparisons of the estimates week-by-week are shown in Figure 5.
According to the results, we inferred that the proposed models produce effective and competitive results. In order to evaluate the performance of the models statistically, Mean Absolute Percent Error (MAPE) and Mean Absolute Deviation (MAD) were used as error measures. The formulae of MAPE and MAD are as follows:
where Ft is the expected value for period t, At is the actual value for period t, and n is the total number of periods. The smaller the value of MAPE, the better the forecasting results.
The calculated MAPE and MAD values are shown in Table 5. The MAD values of the NN and ANFIS models were 0.06 and 0.08, respectively. Likewise, the MAPE values were 0.07 and 0.1, respectively.
The MAPE and MAD values were generally under 10%. These values are in the acceptable range. However, the neural network model provided better results than the ANFIS model. Both the NN MAD and MAPE values were lower than those of the ANFIS model. Still, we concluded that both the proposed neural network and ANFIS-based approaches provided highly effective and competitive results. Both of these models could be used for predicting the attendance at soccer games as alternatives to the classical regression models.
4. Conclusions
Attendance information is used for decision makers in a variety of fields. Public policy makers, team owners and managers, and sports league administrators are unable to make correct evaluations about crucial issues without having demand information. Demand information may also be required for deciding on the right pricing models for the club. Therefore, understanding attendance and its determinants is important. Forecasting attendance is as important as understanding it. In this study, a unique neural network and an ANFIS model, based on attendance parameters, were developed for forecasting attendance rates at soccer games. Neural networks are capable of finding internal representations of interrelations within data. ANFIS has the advantages of both artificial neural networks and fuzzy inference systems. The success of both models can also be inferred by reviewing the results obtained in this study.
After completing comprehensive research and conducting interviews with experts, day of game, distance, and performance of home and away teams were used as input parameters. Based on the forecasting results, the selection and number of the inputs appeared to be appropriate. The output parameter was the attendance rate. Since the stadium of each soccer club has a different size, the attendance rate was preferred over attendance. We believe this increases the applicability of the model among different clubs. The actual data, from the 2011–2012 to the 2015–2016 seasons, of the soccer club were used for training and testing the models. The size of the data appeared sufficient for the purpose of this study. After ensuring a certain level of performance was reached, the 2016–2017 season’s data were simulated to obtain the forecasted attendance rates. The accuracy level of the predicted values was evaluated by comparison with past real data. The simulation results revealed that the neural network and ANFIS models were able to favorably forecast the attendance rate at soccer games. Both the MAPE and MAD values were within an acceptable range. Therefore, these models can be used by pricing models in addition to sports managers, administrators, and so on.
Even though some other forecasting techniques may be used for the same purpose, this approach is valuable. As this is the first time this method has been used, additional value is created and the proposed approaches provide competitive and effective results. Neural networks and ANFIS can be used as alternatives to linear regression or time-series analysis.
Future research could extend these findings by using a larger data set to examine if better predictions can be obtained. Likewise, the number of inputs in terms of attendance determinants may be increased for the same purpose.
Author Contributions
M.Ş. collected the data, M.Ş. and R.E. analyzed the data and designed the models; M.S. performed the experiments; M.S. wrote the paper.
Conflicts of Interest
The authors declare that there is no conflict of interest.
References
- Borland, J.; MacDonald, R. Demand for sport. Oxf. Rev. Econ. Policy 2003, 19, 478–502. [Google Scholar] [CrossRef]
- García, J.; Rodríguez, P. The determinants of football match attendance revisited: Empirical evidence from the Spanish football league. J. Sports Econ. 2002, 3, 18–38. [Google Scholar] [CrossRef]
- Forrest, D.; Simmons, R. Outcome uncertainty and attendance demand in sport: The case of English soccer. J. R. Stat. Soc. Ser. D 2002, 51, 229–241. [Google Scholar] [CrossRef]
- Bruggink, T.H.; Eaton, J.W. Rebuilding attendance in major league baseball: The demand for individual games, in baseball economics. In Baseball Economics: Current Research; Praeger: Westport, CT, USA, 1996; pp. 9–31. [Google Scholar]
- Rascher, D.A. A test of the optimal positive production network externality in major league baseball. In Sports Economics: Current Research; Elsevier: Amsterdam, The Netherlands, 1999. [Google Scholar]
- Hart, R.; Hutton, J.; Sharot, T. A statistical analysis of association football attendances. Appl. Stat. 1975, 24, 17–27. [Google Scholar] [CrossRef]
- Dobson, S.; Goddard, J. The demand for standing and seated viewing accommodation in the English football league. Appl. Econ. 1992, 24, 1155–1163. [Google Scholar] [CrossRef]
- Moe, W.W.; Fader, P.; Kahn, B. Buying tickets: Capturing the dynamic factors that drive consumer purchase decision for sporting events. Presented at the MIT Sloan Sports Analytics Conference, Boston, MA, USA, 4–5 March 2011. [Google Scholar]
- Schofield, J.A. The demand for cricket: The case of the John player league. Appl. Econ. 1983, 15, 283–296. [Google Scholar] [CrossRef]
- Bird, P.J.W.N. The demand for league football. Appl. Econ. 1982, 14, 637–649. [Google Scholar] [CrossRef]
- Nufer, G.; Fischer, J. Ticket pricing in European football-analysis and implications. Int. J. Hum. Mov. Sports Sci. 2013, 1, 49–60. [Google Scholar]
- Dobson, S.; Goddard, J. The Economics of Football; Cambridge University Press: Cambridge, UK, 2011. [Google Scholar]
- Peel, D.A.; Thomas, D.A. The demand for football: Some evidence on outcome uncertainty. Empir. Econ. 1992, 17, 323–331. [Google Scholar] [CrossRef]
- Buraimo, B.; Simmons, R. Do sports fans really value uncertainty of outcome? Evidence from the English premier league. Int. J. Sport Financ. 2008, 3, 146. [Google Scholar]
- Cox, A. Spectator demand, uncertainty of results, and public interest: Evidence from the English Premier League. J. Sports Econ. 2015. [Google Scholar] [CrossRef] [Green Version]
- Shen, S.; Fowkes, T.; Whiteing, T.; Johnson, D. Econometric modelling and forecasting of freight transport demand in Great Britain. In Proceedings of the European Transport Conference, Noordwijkerhout, Netherland, 5–7 October 2009. [Google Scholar]
- Matsumoto, M.; Ikeda, A. Examination of demand forecasting by time series analysis for auto parts remanufacturing. J. Remanuf. 2015, 5, 1. [Google Scholar] [CrossRef]
- Coşgun, Ö.; Ekinci, Y.; Yanık, S. Fuzzy rule-based demand forecasting for dynamic pricing of a maritime company. Knowl. Based Syst. 2014, 70, 88–96. [Google Scholar] [CrossRef]
- McCulloch, W.S.; Pitts, W. A logical calculus of the ideas immanent in nervous activity. Bull. Math. Biophys. 1943, 5, 115–133. [Google Scholar] [CrossRef]
- Huang, K.-Y.; Chang, W.-L. A neural network method for prediction of 2006 world cup football game. In Proceedings of the IEEE 2010 International Joint Conference on Neural Networks (IJCNN), Barcelona, Spain, 18–23 July 2010. [Google Scholar]
- Purucker, M. Neural networks quarterbacking-how different training methods perform in calling the games. IEEE Potentials 1996, 15, 9–15. [Google Scholar] [CrossRef]
- Maszczyk, A.; Roczniok, R.; Waśkiewicz, Z.; Czuba, M.; Mikołajec, K.; Zajac, A.; Stanula, A. Application of neural and regression models in sports results prediction. Procedia Soc. Behav. Sci. 2014, 117, 482–487. [Google Scholar] [CrossRef]
- Rotshtein, A.P.; Posner, M.; Rakityanskaya, A. Football predictions based on a fuzzy model with genetic and neural tuning. Cybern. Syst. Anal. 2005, 41, 619–630. [Google Scholar] [CrossRef]
- Loeffelholz, B.; Bednar, E.; Bauer, K.W. Predicting NBA games using neural networks. J. Quant. Anal. Sports 2009, 5. [Google Scholar] [CrossRef]
- Condon, E.M.; Golden, B.L.; Wasil, E.A. Predicting the success of nations at the Summer Olympics using neural networks. Comput. Oper. Res. 1999, 26, 1243–1265. [Google Scholar] [CrossRef]
- McCullagh, J. Data mining in sport: A neural network approach. Int. J. Sports Sci. Eng. 2010, 4, 131–138. [Google Scholar]
- Maszczyk, A.; Zając, A.; Ryguła, I. A neural network model approach to athlete selection. Sports Eng. 2011, 13, 83–93. [Google Scholar] [CrossRef]
- Strnad, D.; Nerat, A.; Kohek, Š. Neural network models for group behavior prediction: A case of soccer match attendance. Neural Comput. Appl. 2017, 28, 287–300. [Google Scholar] [CrossRef]
- Liestbl, K.; Andersen, P.K.; Andersen, U. Survival analysis and neural nets. Stat. Med. 1994, 13, 1189–1200. [Google Scholar] [CrossRef]
- Tu, J.V. Advantages and disadvantages of using artificial neural networks versus logistic regression for predicting medical outcomes. J. Clin. Epidemiol. 1996, 49, 1225–1231. [Google Scholar] [CrossRef]
- Lotfi, E.; Darini, M.; Karimi-T, M.R. Cost estimation using ANFIS. Eng. Econ. 2016, 61, 144–154. [Google Scholar] [CrossRef]
- Srisaeng, P.; Baxter, G.S.; Wild, G. An adaptive neuro-fuzzy inference system for forecasting Australia’s domestic low cost carrier passenger demand. Aviation 2015, 19, 150–163. [Google Scholar] [CrossRef]
- Panapakidis, I.P.; Dagoumas, A.S. Day-ahead natural gas demand forecasting based on the combination of wavelet transform and ANFIS/genetic algorithm/neural network model. Energy 2017, 118, 231–245. [Google Scholar] [CrossRef]
- Prasad, K.; Gorai, A.K.; Goyal, P. Development of ANFIS models for air quality forecasting and input optimization for reducing the computational cost and time. Atmos. Environ. 2016, 128, 246–262. [Google Scholar] [CrossRef]
- Zafarani, R.; Yazdchi, M.R.; Salehi, S.A.S. An ANFIS based method of agent behavior in simulated soccer agents. In Proceedings of the 17th IEEE International Conference on Tools with Artificial Intelligence (ICTAI 05), Hong Kong, China, 14–16 November 2005. [Google Scholar]
- Haykin, S. Neural Networks and Learning Machines; Pearson: Upper Saddle River, NJ, USA, 2009; Volume 3. [Google Scholar]
- Amato, F.; López, A.; MaríaPeña-Méndez, E.; Vaňhara, P.; Hampl, A.; Havel, J. Artificial Neural Networks in Medical Diagnosis; Elsevier: Amsterdam, The Netherlands, 2013. [Google Scholar]
- Hájek, P. Municipal credit rating modelling by neural networks. Decis. Support Syst. 2011, 51, 108–118. [Google Scholar] [CrossRef]
- Bishop, C.M. Neural Networks for Pattern Recognition; Oxford University Press: Oxford, UK, 1995. [Google Scholar]
- Van Heerden, B.; Aldrich, C.; Plessis, A.D. Predicting student performance using artificial neural network analysis. Med. Educ. 2008, 42, 516–517. [Google Scholar] [CrossRef] [PubMed]
- Thiesing, F.M.; Vornberger, O. Sales forecasting using neural networks. In Proceedings of the IEEE International Conference on Neural Networks, Houston, TX, USA, 12 June 1997. [Google Scholar]
- Hao, G.; Lai, K.; Tan, M. A neural network application in personnel scheduling. Ann. Oper. Res. 2004, 128, 65–90. [Google Scholar] [CrossRef]
- Park, D.C.; El-Sharkawi, M.A.; Marks, R.J.; Atlas, L.E.; Damborg, M.J. Electric load forecasting using an artificial neural network. IEEE Trans. Power Syst. 1991, 6, 442–449. [Google Scholar] [CrossRef]
- Da Silva, I.N.; Spatti, D.H.; Flauzino, R.A.; Liboni, L.H.B. Artificial Neural Network Architectures and Training Processes. In Artificial Neural Networks; Springer: Berlin, Germany, 2017; pp. 21–28. [Google Scholar]
- Dumitru, C.; Maria, V. Advantages and Disadvantages of Using Neural Networks for Predictions. Ovidius Univ. Ann. Ser. Econ. Sci. 2013, 13, 1. [Google Scholar]
- Tiwari, M.K.; Chatterjee, C. Development of an accurate and reliable hourly flood forecasting model using wavelet–bootstrap–ANN (WBANN) hybrid approach. J. Hydrol. 2010, 394, 458–470. [Google Scholar] [CrossRef]
- Mathworks. Network Architectures. Neural Network Toolbox, 2017. Available online: https://www.mathworks.com/products/neural-network/features.html#training-algorithms (accessed on 21 July 2017).
- Beale, M.H.; Hagan, M.T.; Demuth, H.B. Neural Network Toolbox™ User’s Guide; The Mathworks Inc.: Natick, MA, USA, 1992. [Google Scholar]
- Yu, H.; Wilamowski, B. Levenberg-Marquardt Training. In Intelligent Systems; CRC Press: Boca Raton, FL, USA, 2011; pp. 1–16. [Google Scholar]
- Jang, J.-S.R. Fuzzy Modeling Using Generalized Neural Networks and Kalman Filter Algorithm. In Proceedings of the AAAI’91 Proceedings of the Ninth National Conference on Artificial Intelligence, Anaheim, CA, USA, 14–19 July 1991. [Google Scholar]
- Amid, S.; Gundoshmian, T.M. Prediction of output energies for broiler production using linear regression, ANN (MLP, RBF), and ANFIS models. Environ. Prog. Sustain. Energy 2017, 36, 577–585. [Google Scholar] [CrossRef]
- Ghiasi, M.M.; Arabloo, M.; mohammadi, A.M. Application of ANFIS soft computing technique in modeling the CO2 capture with MEA, DEA, and TEA aqueous solutions. Int. J. Greenh. Gas Control 2016, 49, 47–54. [Google Scholar] [CrossRef]
- Arkhipov, M.; Krueger, E.; Kurtener, D. Evaluation of ecological conditions using bioindicators: Application of fuzzy modeling. In Proceedings of the International Conference on Computational Science and Its Applications, Perugia, Italy, 30 June–3 July 2008. [Google Scholar]
- Jang, J.-S.R. Input selection for ANFIS learning. In Proceedings of the Fifth IEEE International Conference on Fuzzy Systems, New Orleans, LA, USA, 11 September 1996. [Google Scholar]
- Yetilmezsoy, K.; Fingas, M.; Fieldhouse, B. An adaptive neuro-fuzzy approach for modeling of water-in-oil emulsion formation. Coll. Surf. A Physicochem. Eng. Asp. 2011, 389, 50–62. [Google Scholar] [CrossRef]
- Kamari, A.; Mohammadi, A.H.; Lee, M.; Bahadori, A. Decline curve based models for predicting natural gas well performance. Petroleum 2017, 3, 242–248. [Google Scholar] [CrossRef]
- Anysz, H.; Zbiciak, A.; Ibadov, N. The influence of input data standardization method on prediction accuracy of artificial neural networks. Procedia Eng. 2016, 153, 66–70. [Google Scholar] [CrossRef]
Figure 1.
Multilayer Perceptron (MLP) network architecture.

Figure 2.
The proposed four-layer neural network model.

Figure 3.
The architecture of the adaptive neuro-fuzzy inference system (ANFIS) model with two inputs, one output, and two rules.
Figure 3.
The architecture of the adaptive neuro-fuzzy inference system (ANFIS) model with two inputs, one output, and two rules.

Figure 4.
The structure of the proposed ANFIS model.

Figure 5.
The comparisons of actual and forecasted attendance rates.


Table 1.
Input parameters and their features.
| No. | Input | Interval | Explanation |
|---|---|---|---|
| 1 | Day of Game | 0–1 | Day of the game is represented as numbers from 1 to 7. 1 represents Monday, 2 represents Tuesday, etc. |
| 2 | Distance | 0–1 | The ground distance between the stadiums of the home and away teams. |
| 3 | Performance of Home Team | 0–1 | The performance of the home team is measured as the ratio of points that the home team has earned to possible total points to the game day. |
| 4 | Performance of Away Team | 0–1 | The performance of the away team is measured as the ratio of points that the away team has earned to possible total points to the game day. |
Table 2.
The properties of the proposed neural network.
| Network Type | Feed-Forward Backpropagation |
|---|---|
| Number of layers | 4 |
| Neurons | Input: 4 |
| Hidden: 9, 9, 9 | |
| Output: 1 | |
| Number of iterations | 1000 |
| Training algorithm | Levenberg-Marquardt |
| Data division | Random |
Table 3.
Specifications of the developed adaptive neuro-fuzzy inference system (ANFIS) model.
| Parameter | Description/Value |
|---|---|
| Structure of FIS | Sugeno |
| Initial FIS for training | genfis2 (Subtractive clustering) |
| Range of influence | 0.85 |
| Squash factor | 1 |
| Accept ratio | 0.5 |
| Reject ratio | 0.15 |
| Number of inputs | 4 |
| Number of outputs | 1 |
| Number of input membership functions | 4, 4, 4, 4 |
| Optimization method | Hybrid |
| Training epoch number | 50 |
Table 4.
Comparisons of actual and forecasted attendance rates.
| No. | Actual Attendance Rate | Forecasted Attendance Rate (NN) | Forecasted Attendance Rate (ANFIS) |
|---|---|---|---|
| 1 | 0.747 | 0.741 | 0.779 |
| 2 | 0.879 | 0.765 | 0.943 |
| 3 | 0.841 | 0.851 | 0.662 |
| 4 | 0.835 | 0.607 | 0.459 |
| 5 | 0.823 | 0.801 | 0.828 |
| 6 | 0.991 | 0.937 | 0.947 |
| 7 | 0.779 | 0.817 | 0.881 |
| 8 | 0.820 | 0.929 | 0.743 |
| 9 | 0.844 | 0.827 | 0.915 |
| 10 | 0.638 | 0.674 | 0.639 |
| 11 | 0.554 | 0.553 | 0.481 |
| 12 | 0.761 | 0.783 | 0.815 |
| 13 | 0.776 | 0.812 | 0.769 |
| 14 | 0.845 | 0.727 | 0.930 |
| 15 | 0.803 | 0.815 | 0.858 |
| 16 | 0.644 | 0.562 | 0.487 |
| 17 | 0.911 | 0.745 | 0.806 |
| 18 | 0.754 | 0.736 | 0.735 |
Table 5.
Error measures of the forecasting results.
| Error Measures | NN | ANFIS |
|---|---|---|
| Mean Absolute Deviation (MAD) | 0.06 | 0.08 |
| Mean Absolute Percent Error (MAPE) | 0.07 | 0.1 |
© 2017 by the authors. Licensee MDPI, Basel, Switzerland. This article is an open access article distributed under the terms and conditions of the Creative Commons Attribution (CC BY) license (http://creativecommons.org/licenses/by/4.0/).
Share and Cite
MDPI and ACS Style
Şahin, M.; Erol, R. A Comparative Study of Neural Networks and ANFIS for Forecasting Attendance Rate of Soccer Games. Math. Comput. Appl. 2017, 22, 43. https://doi.org/10.3390/mca22040043
AMA Style
Şahin M, Erol R. A Comparative Study of Neural Networks and ANFIS for Forecasting Attendance Rate of Soccer Games. Mathematical and Computational Applications. 2017; 22(4):43. https://doi.org/10.3390/mca22040043
Chicago/Turabian StyleŞahin, Mehmet, and Rızvan Erol. 2017. "A Comparative Study of Neural Networks and ANFIS for Forecasting Attendance Rate of Soccer Games" Mathematical and Computational Applications 22, no. 4: 43. https://doi.org/10.3390/mca22040043