Photostress Testing Device for Diagnosing Retinal Disease

Abstract
:
1. Introduction
2. Experimental Section
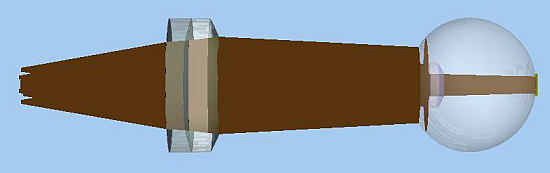
2.1. Components of the Photostress Testing Device

2.2. Model of Photostress Testing Device in Optical Engineering Software
2.2.1. General Model
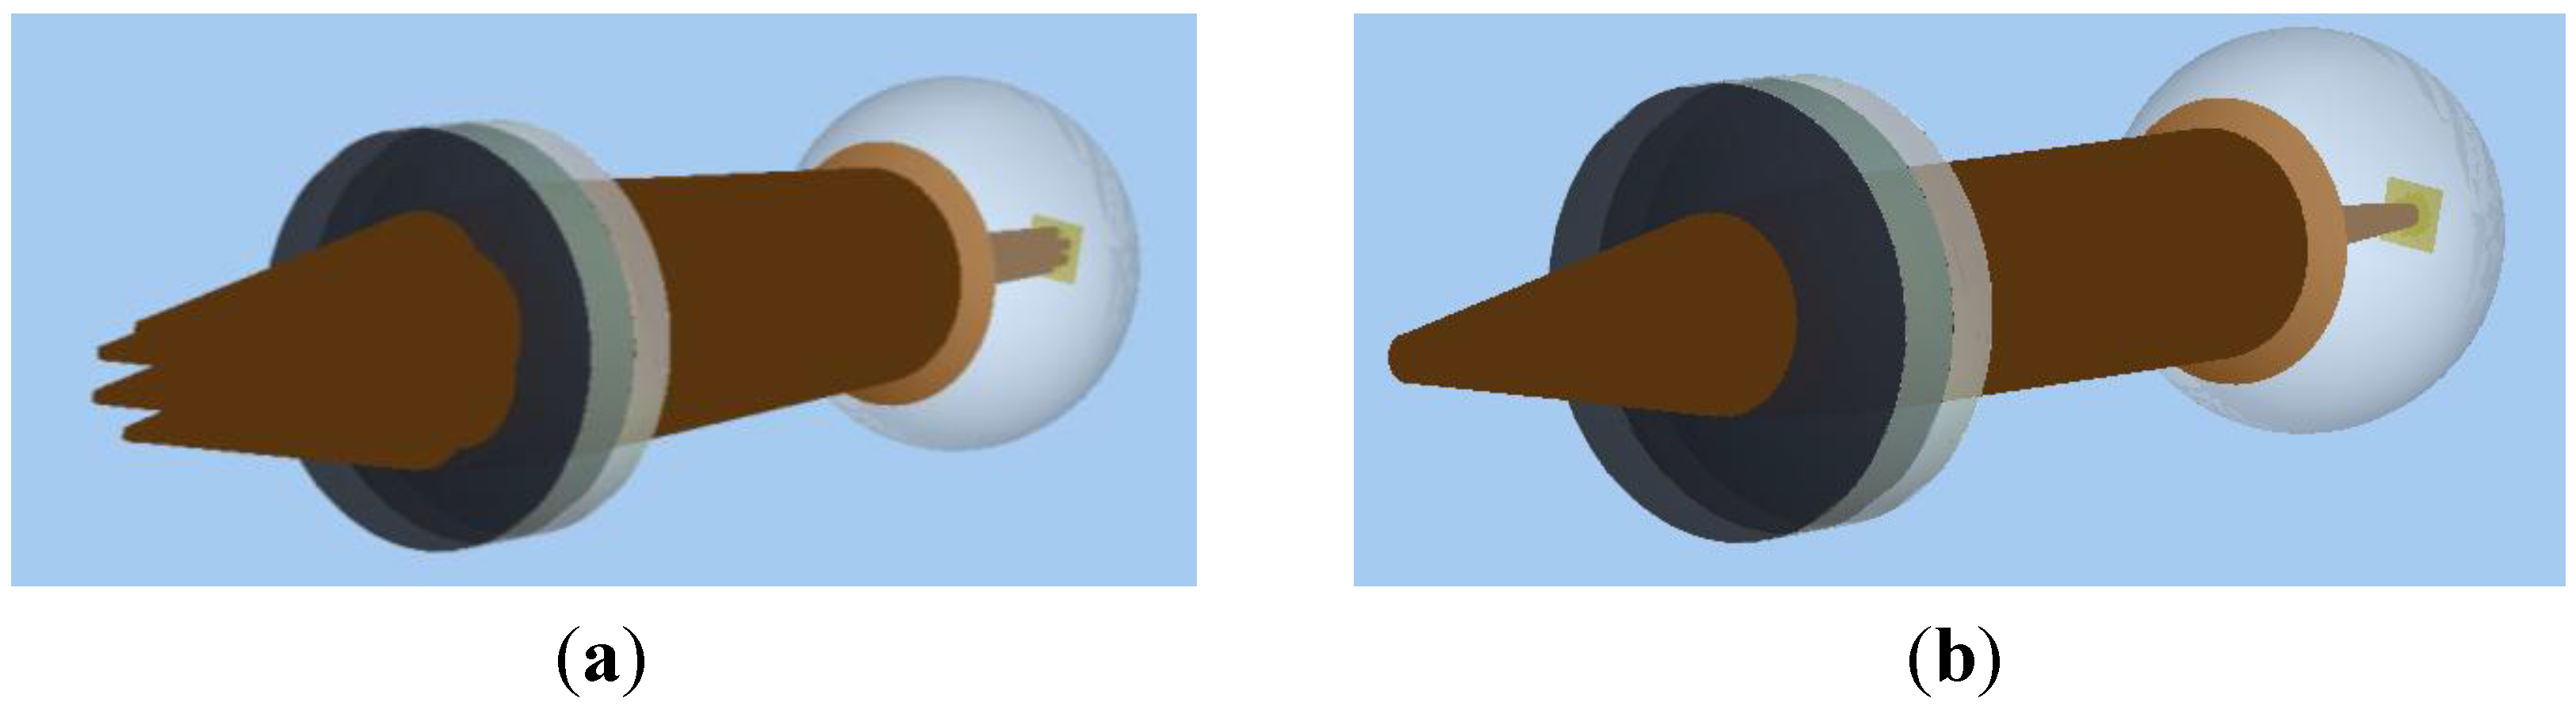
2.2.2. Source Model

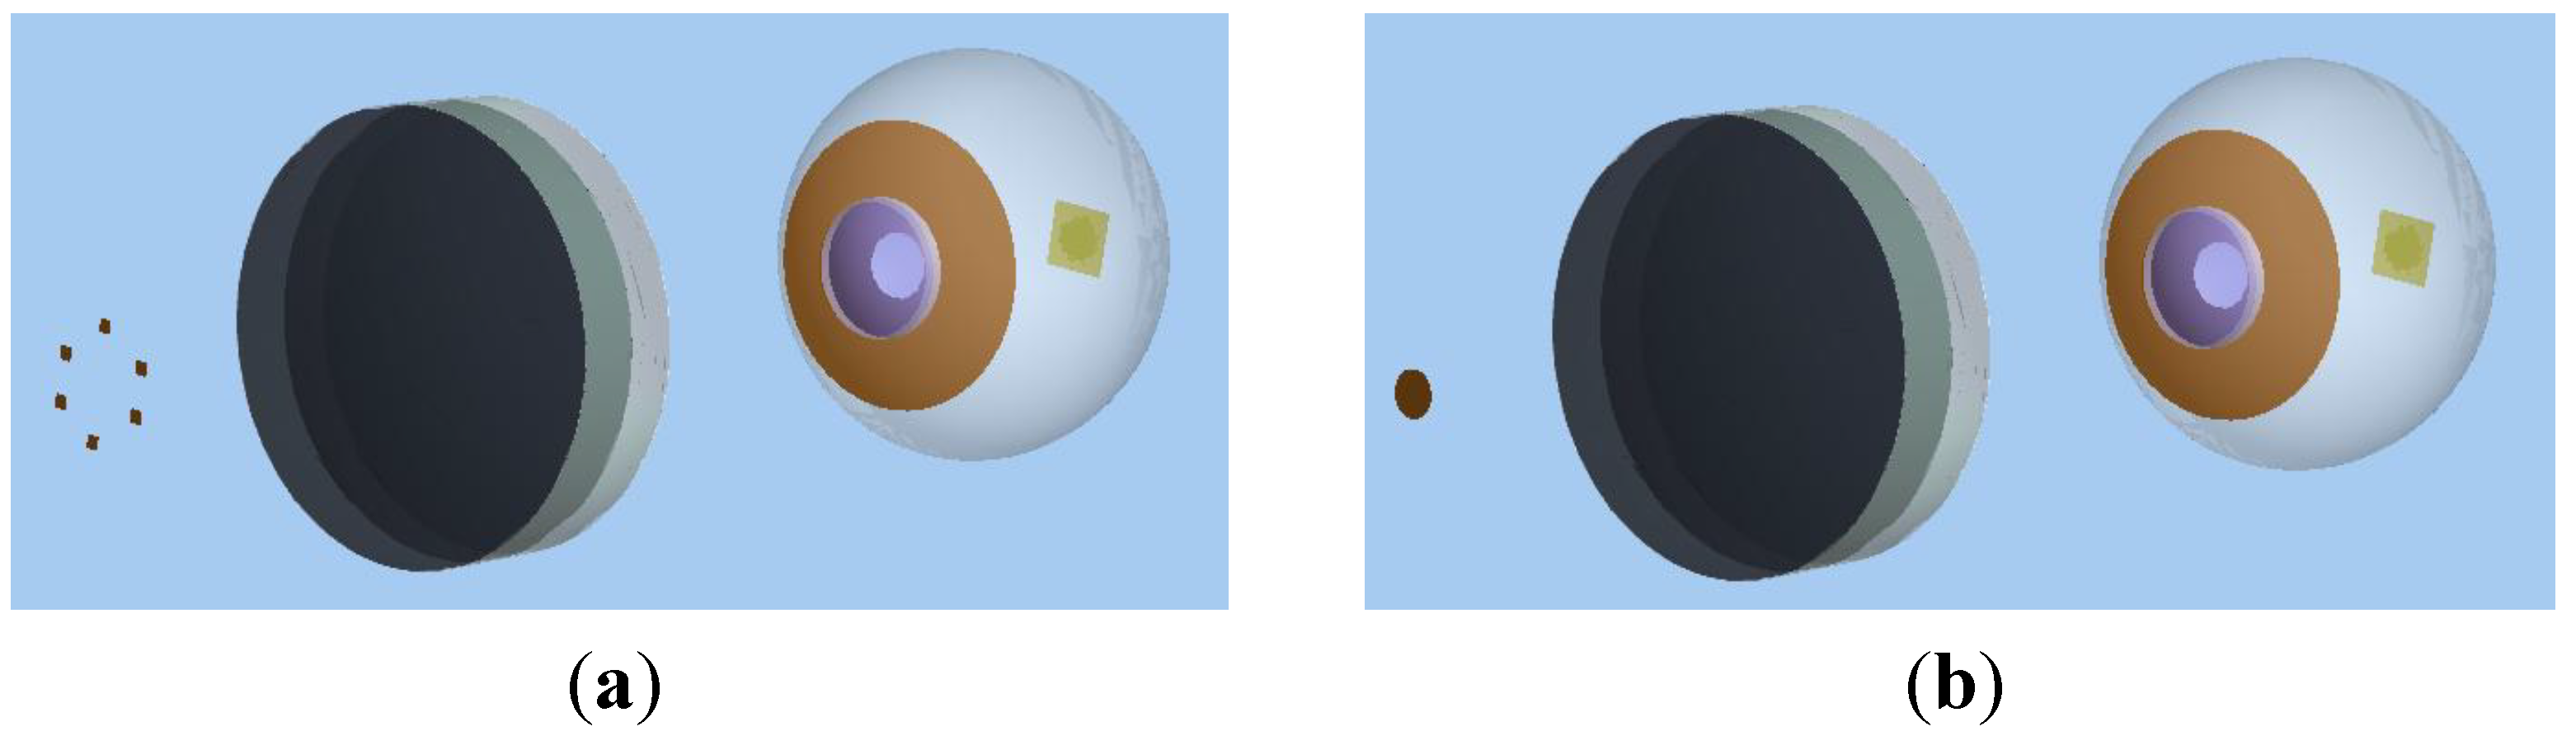
2.2.3. Lens Model
2.2.4. Arizona Eye Model
2.2.5. Analysis Surface


3. Results and Discussion
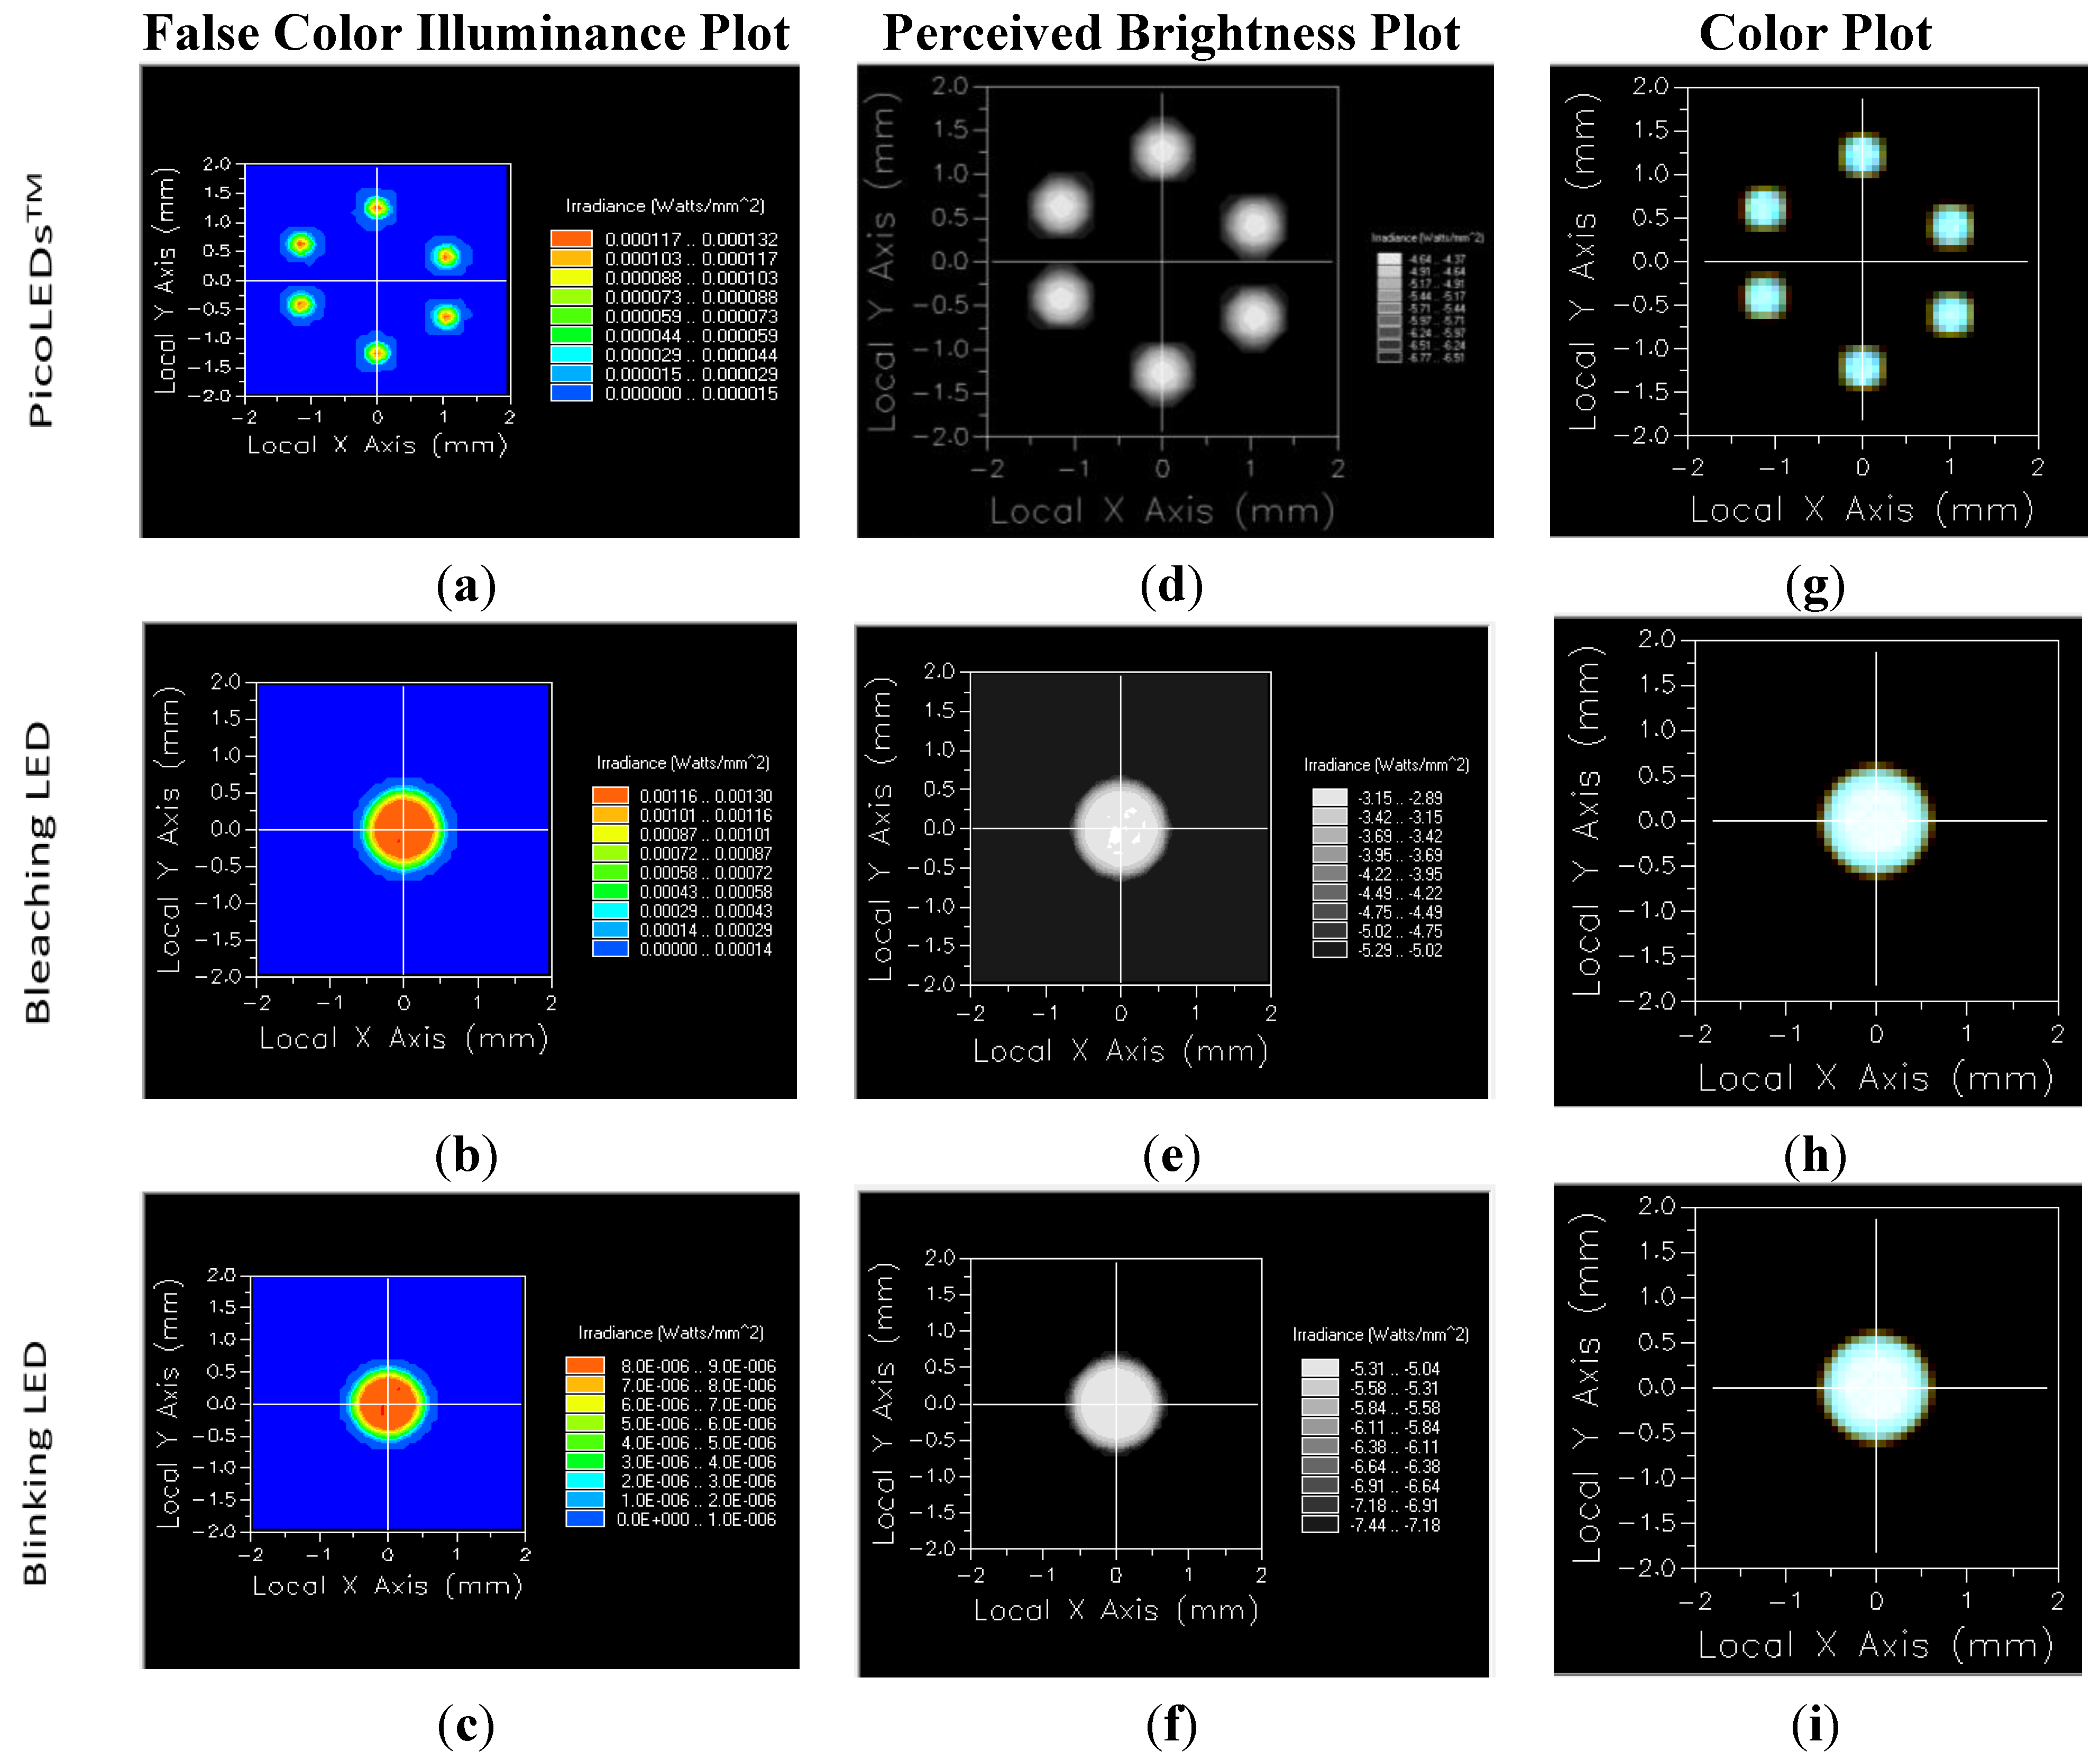
3.1. Analysis of Photostress Tester in Illumination Software

3.2. Comparison of Software Analysis to Experimental Results
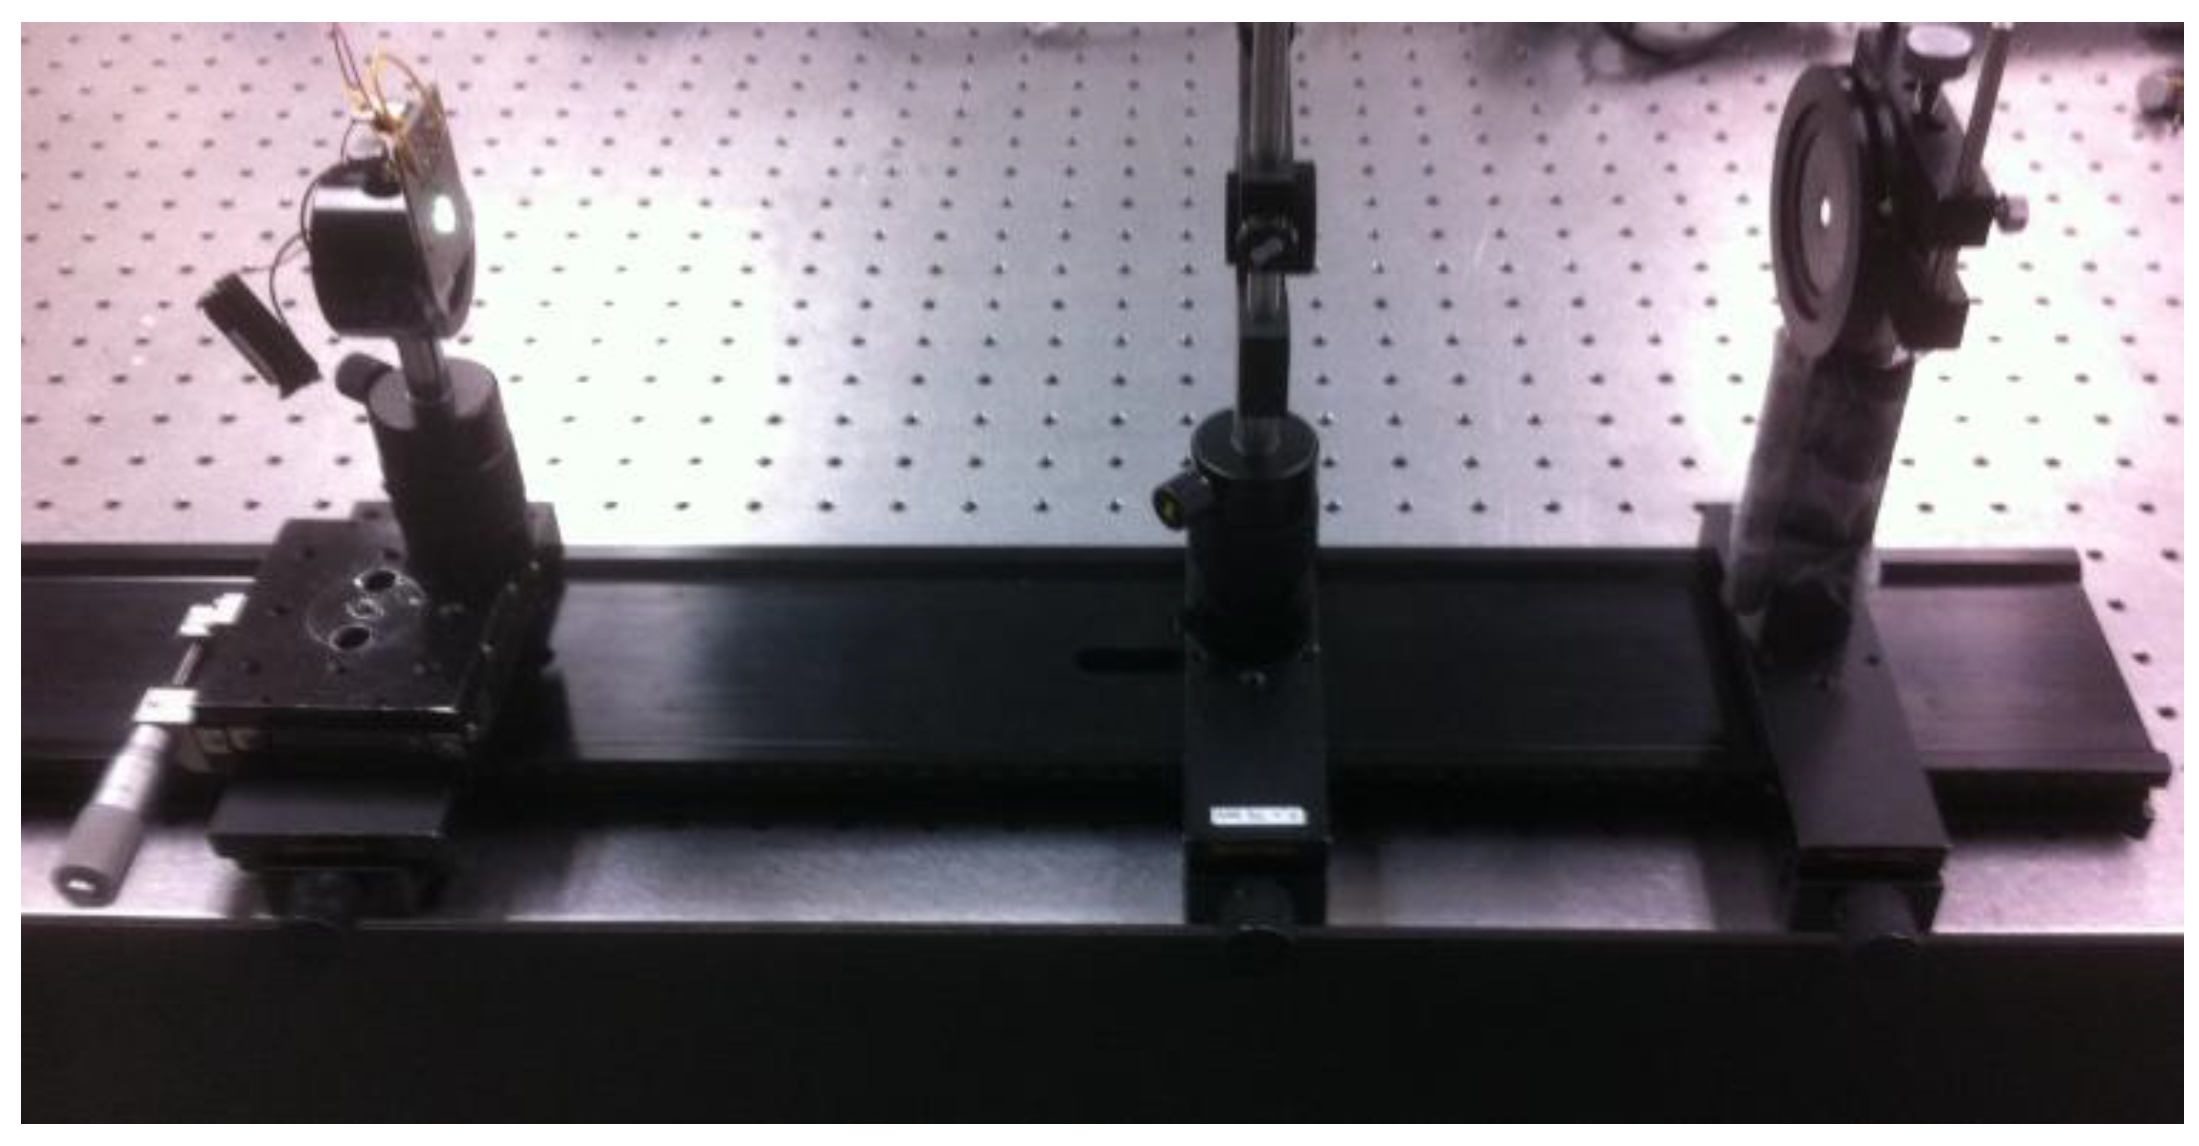
3.2.1. Setup

3.2.2. Experiment
3.2.3. Results

| Translation (mm) | Illuminance Ev (lux) | Spot Size (mm) |
|---|---|---|
| −8 | 3106.7 | 1.5 |
| 0 | 2622.9 | 1.5 |
| 8 | 2003.2 | 1.5 |
4. Conclusions
Acknowledgments
Author Contributions
Conflicts of Interest
References
- Messenio, D.; Marano, G.; Gerosa, S.; Iannelli, F.; Biganzoli, E.M. The influence of age on the recovery of the ERG photostress test. Doc. Ophthalmol. 2013, 126, 87–97. [Google Scholar]
- Margrain, T.H.; Thomson, D. Sources of variability in the clinical photostress test. Ophthalmic Physiol. 2002, 22, 61–67. [Google Scholar]
- Jacobs, R.J.; Lacey, A. The macular photostress test. Aust. J. Optom. 1983, 66, 147–150. [Google Scholar]
- Sykes, S.M.; Robinson, W.G.; Waxler, M.; Kuwabara, T. Damage to the monkey retina by broad-spectrum fluorescenet light. Investig. Ophthalmol. Vis. Sci. 1981, 20, 425–434. [Google Scholar]
- Taub, M.B. The photostress test as a guide to etiology. J. Am. Optom. Assoc. 2007, 78, 570–571. [Google Scholar]
- Koshel, J. Lecture 2-Sampling & Lit-Appearance Modeling. OPTICS X85 Illumination Engineering; University of Arizona College of Optical Sciences: Tucson, AZ, USA, 2012. [Google Scholar]
- 13.8. Eye Intensity Response, Contrast Sensitivity. Eye Intensity Response, Contrast Sensitivity. Available online: http://www.telescope-optics.net/eye_intensity_response.htm (accessed on 22 April 2012).
- Schwiegerling, J. Field Guide to Visual and Ophthalmic Optics; SPIE: Bellingham, WA, USA, 2004. [Google Scholar]
© 2014 by the authors; licensee MDPI, Basel, Switzerland. This article is an open access article distributed under the terms and conditions of the Creative Commons Attribution license (http://creativecommons.org/licenses/by/3.0/).
Share and Cite
Swan, E.; Schwiegerling, J.; Peyman, G.; Enikov, E. Photostress Testing Device for Diagnosing Retinal Disease. Photonics 2014, 1, 211-219. https://doi.org/10.3390/photonics1030211
Swan E, Schwiegerling J, Peyman G, Enikov E. Photostress Testing Device for Diagnosing Retinal Disease. Photonics. 2014; 1(3):211-219. https://doi.org/10.3390/photonics1030211
Chicago/Turabian StyleSwan, Elizabeth, Jim Schwiegerling, Gholam Peyman, and Eniko Enikov. 2014. "Photostress Testing Device for Diagnosing Retinal Disease" Photonics 1, no. 3: 211-219. https://doi.org/10.3390/photonics1030211