Review

Basic Technology and Clinical Applications of the Updated Model of Laser Speckle Flowgraphy to Ocular Diseases

Nakano Eye Clinic of Kyoto Medical Co-operative, 2, Jurakumawari-Higashimachi, Nakagyo-ku, Kyoto 604-8404, Japan
Photonics 2014, 1(3), 220-234; https://doi.org/10.3390/photonics1030220
Submission received: 20 July 2014 / Revised: 7 August 2014 / Accepted: 7 August 2014 / Published: 12 August 2014
(This article belongs to the Special Issue Optics and Technologies for Ophthalmology and Visual Science)

Abstract

:
Laser speckle flowgraphy (LSFG) allows for quantitative estimation of blood flow in the optic nerve head (ONH), choroid and retina, utilizing the laser speckle phenomenon. The basic technology and clinical applications of LSFG-NAVI, the updated model of LSFG, are summarized in this review. For developing a commercial version of LSFG, the special area sensor was replaced by the ordinary charge-coupled device camera. In LSFG-NAVI, the mean blur rate (MBR) has been introduced as a new parameter. Compared to the original LSFG model, LSFG-NAVI demonstrates a better spatial resolution of the blood flow map of human ocular fundus. The observation area is 24 times larger than the original system. The analysis software can separately calculate MBRs in the blood vessels and tissues (capillaries) of an entire ONH and the measurements have good reproducibility. The absolute values of MBR in the ONH have been shown to linearly correlate with the capillary blood flow. The Analysis of MBR pulse waveform provides parameters including skew, blowout score, blowout time, rising and falling rates, flow acceleration index, acceleration time index, and resistivity index for comparing different eyes. Recently, there have been an increasing number of reports on the clinical applications of LSFG-NAVI to ocular diseases, including glaucoma, retinal and choroidal diseases.

Graphical Abstract

1. Introduction

Laser speckle flowgraphy (LSFG) allows for the quantitative estimation of blood flow in the optic nerve head (ONH), choroid and retina in vivo, utilizing the laser speckle phenomenon. Compared to other laser-based techniques (i.e., laser Doppler velocimetry and flowmetry), the LSFG measurement covers a much larger field and enables two-dimensional observation of the overall hemodynamic condition of the tissue.
The updated model of LSFG, LSFG-NAVI (Softcare Co., Ltd., Fukuoka, Japan), was approved as a medical apparatus by the Japanese Pharmaceuticals and Medical Devices Agency in 2008. In this review, the basic technology and clinical applications of LSFG-NAVI to ocular diseases will be discussed.

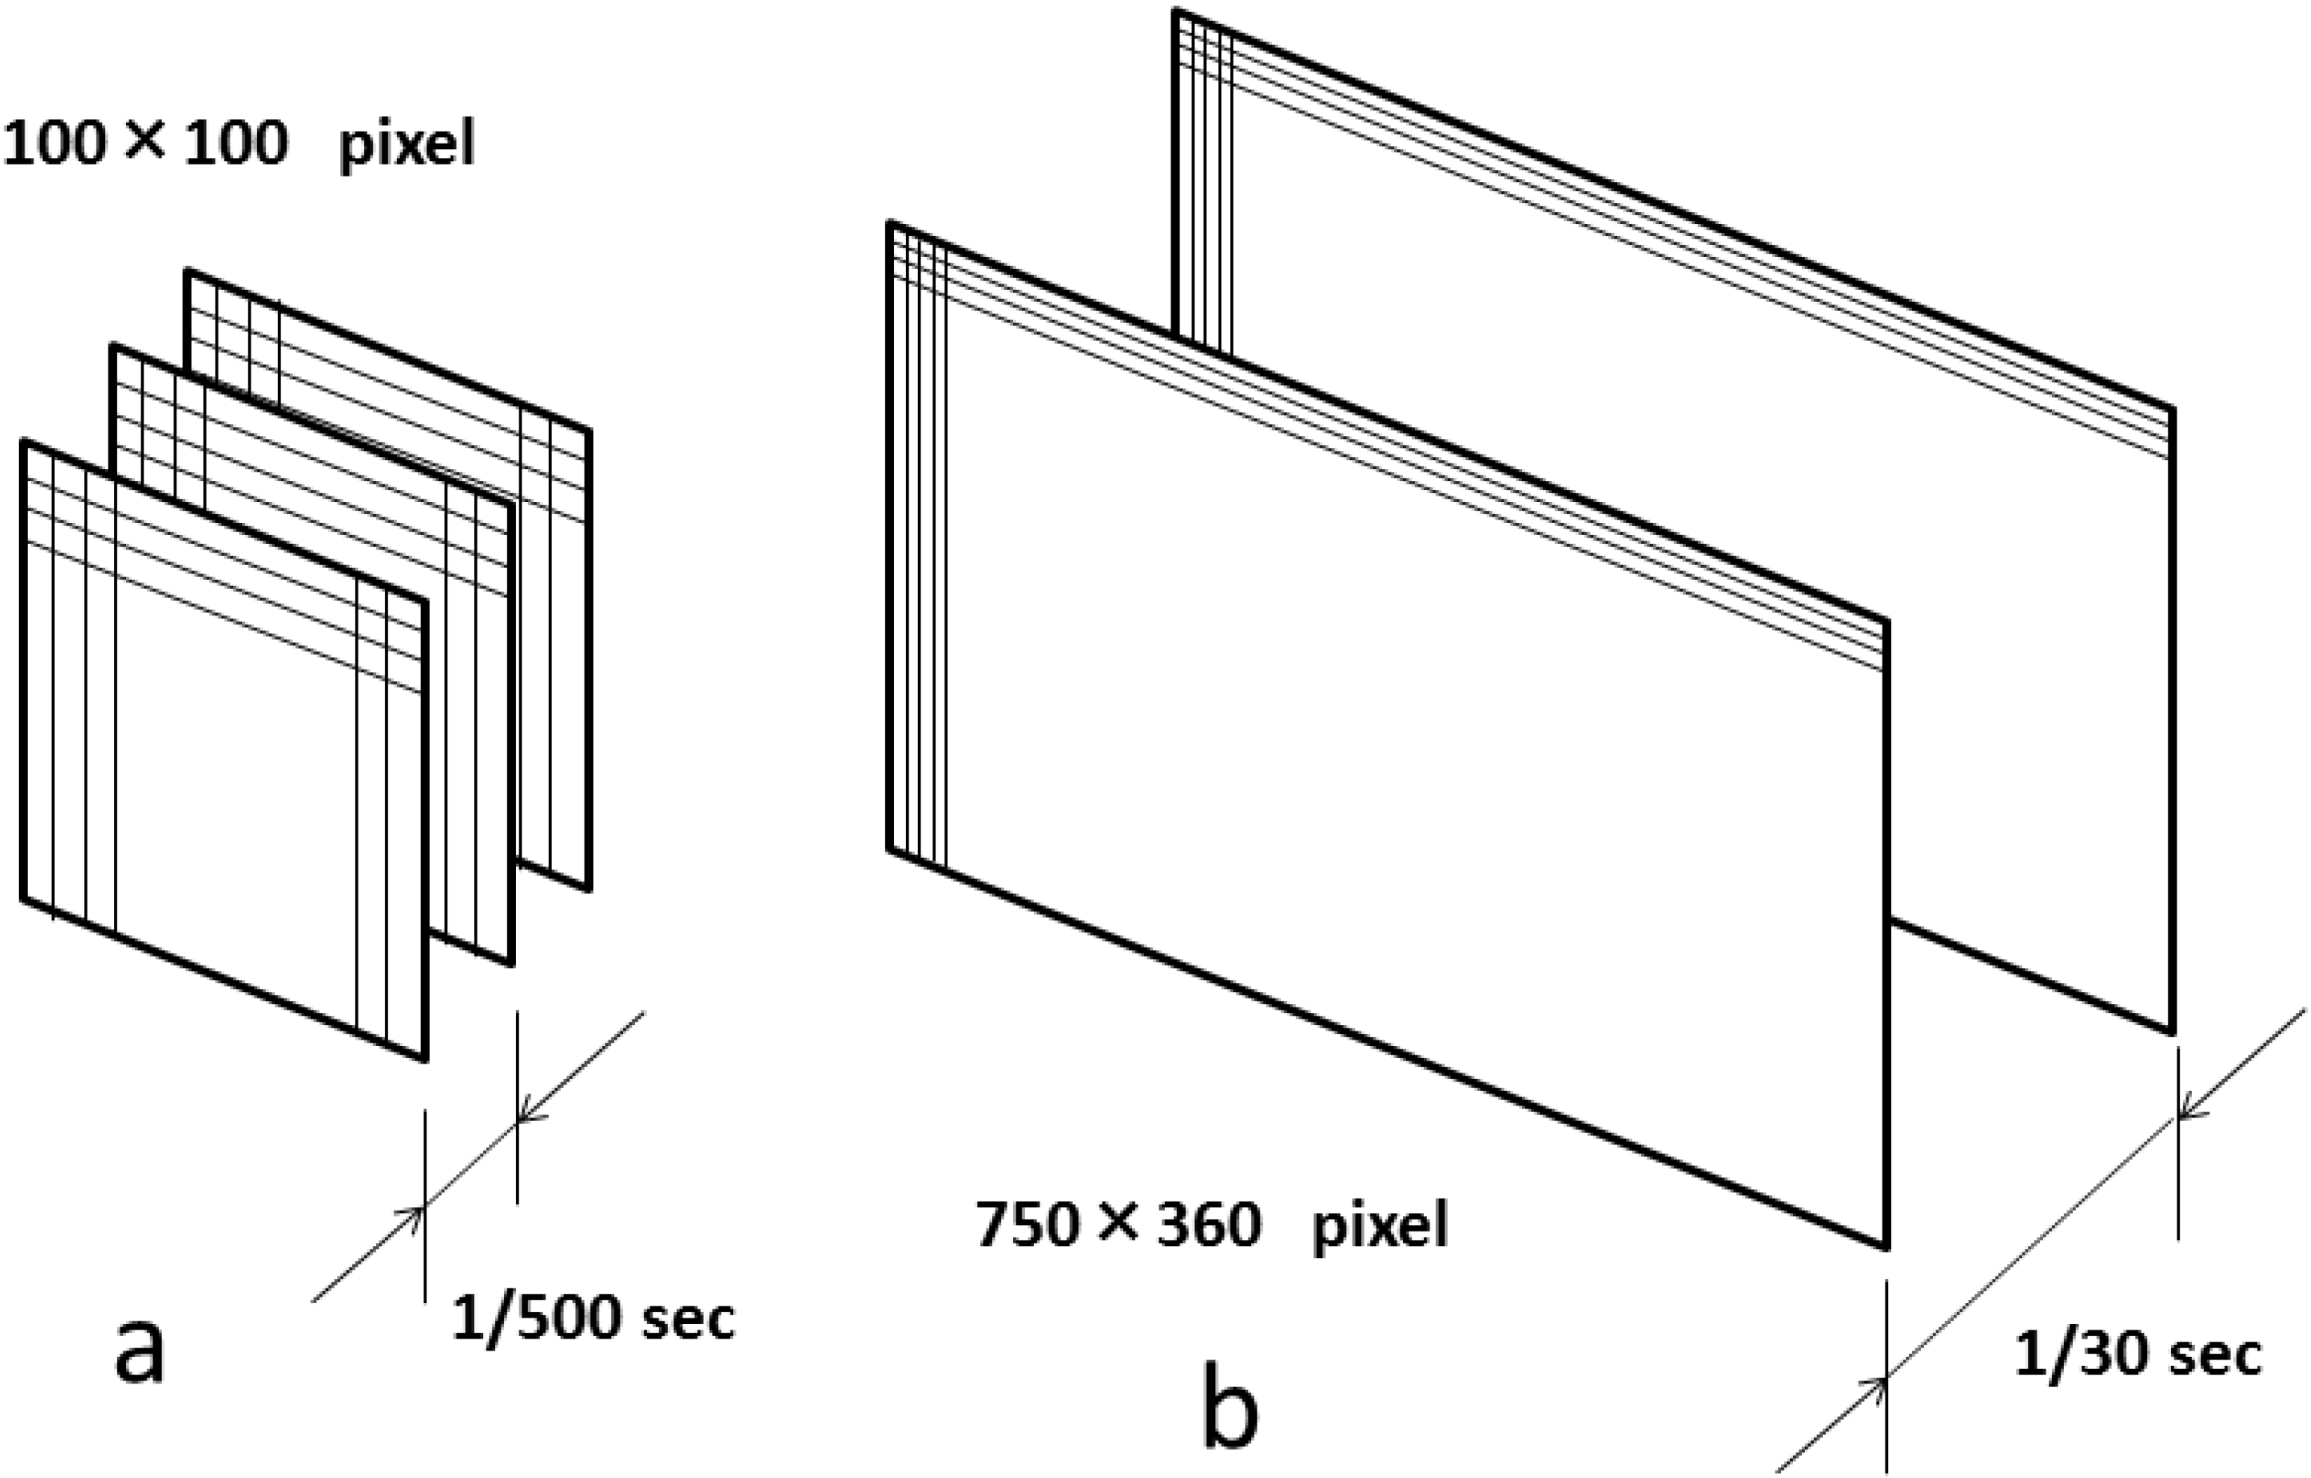
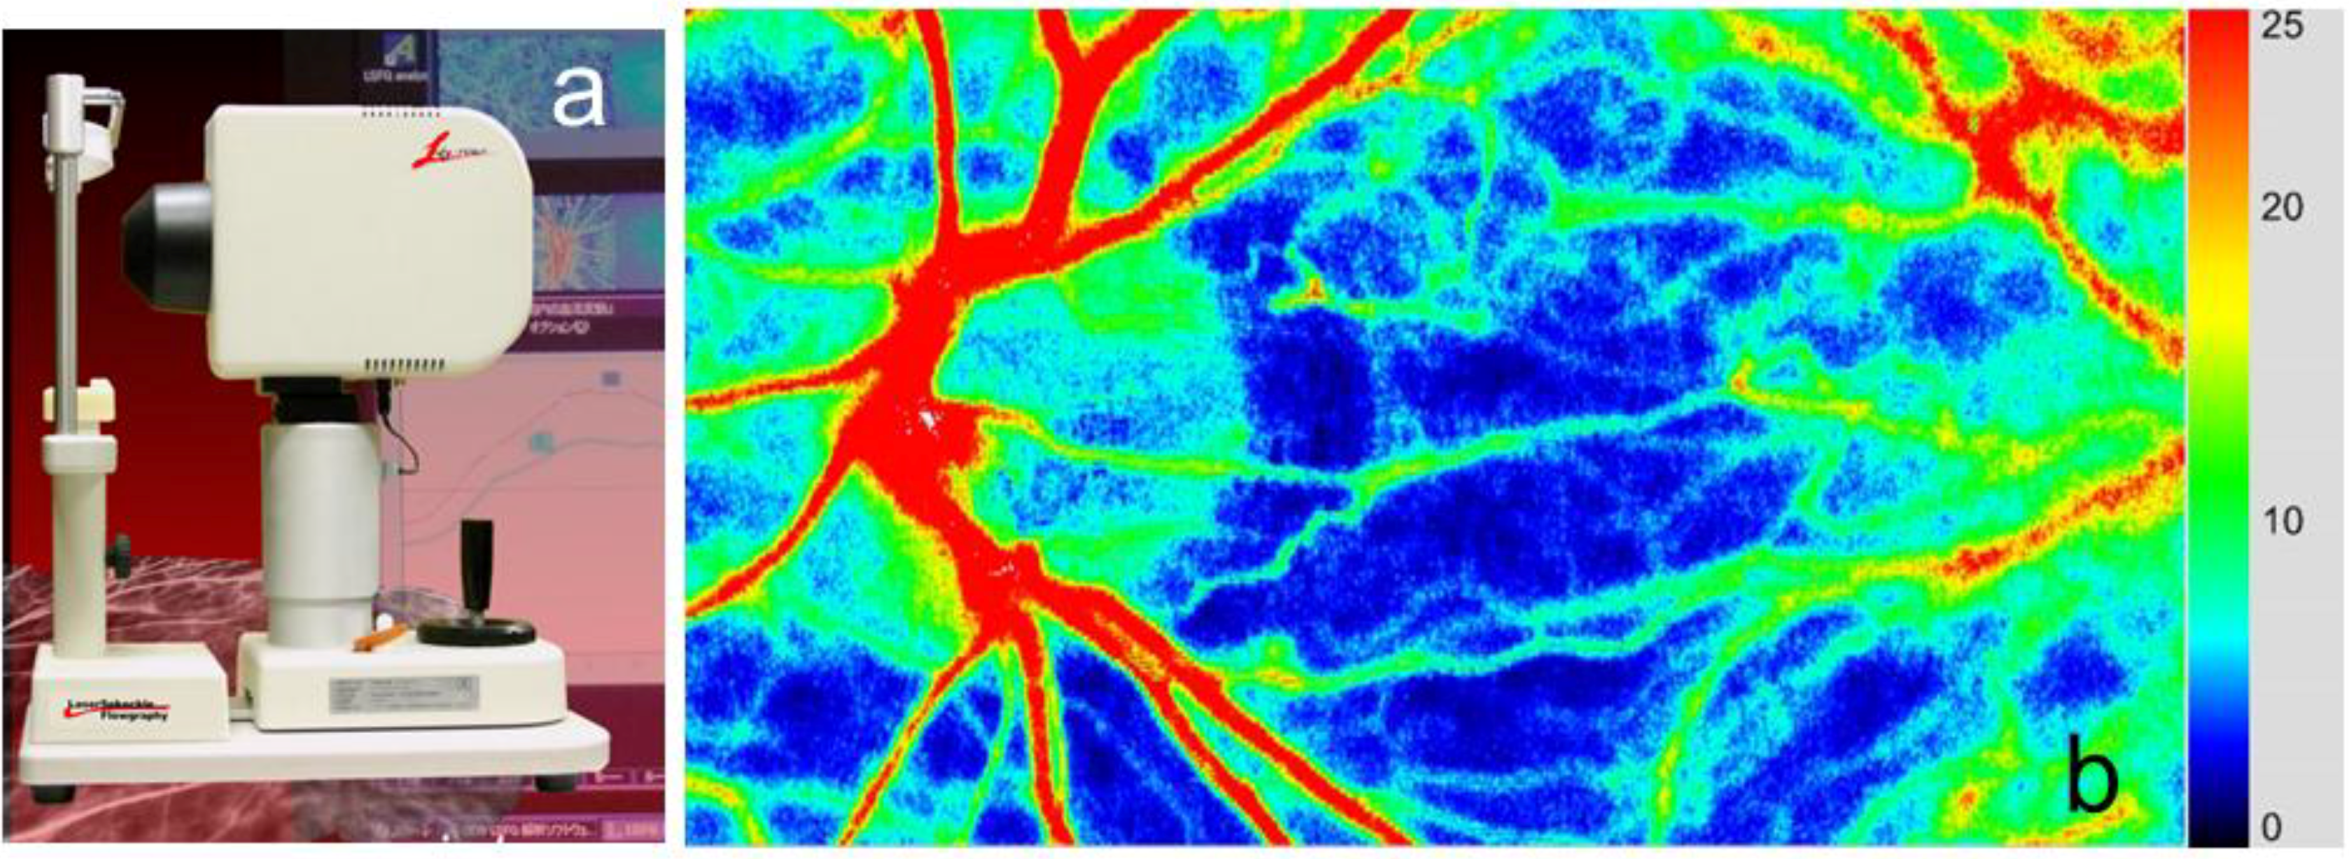
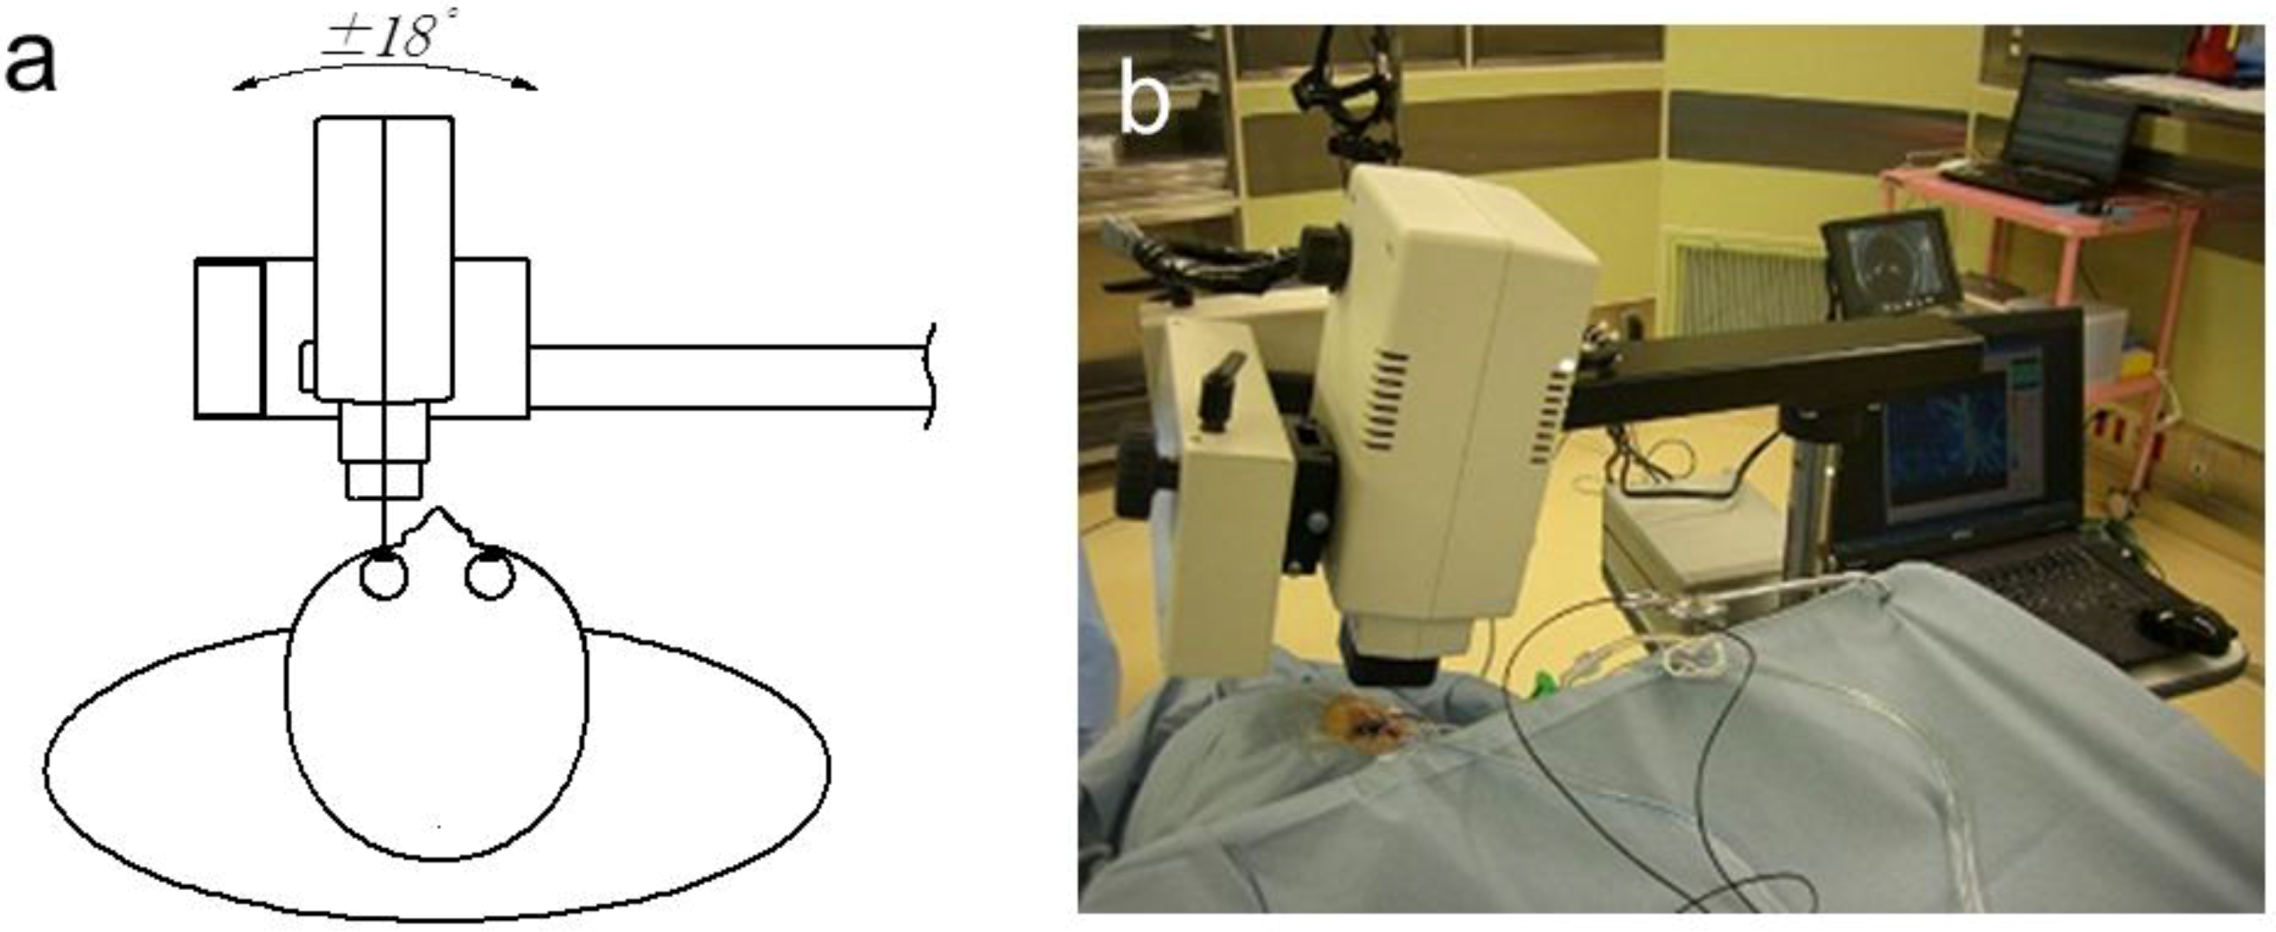
2. Basic Technology of LSFG-NAVI

The laser speckle phenomenon is an interference event when coherent light sources such as lasers are scattered by a diffusing surface, e.g., the ocular fundus. The speckle pattern, which appears under the illuminati on of laser irradiation, can be described statistically. In accordance with the movement of blood cellsin the tissue, the structure of the speckle pattern varies rapidly depending on the blood flow velocity. Fercher and Briers [1] presented pictures of the velocity distribution of blood cells in the retina by means of laser speckle photography for the first time. However, their method allowed only for semi-quantitative estimation of the retinal circulation, not for analysis of changes over time. Later, the LSFG system was developed for a non-contact, two-dimensional and quantitative analysis of ocular blood flow in living eyes [2,3,4]. The details of this original LSFG system were described previously [5,6]. Briefly, the normalized blur (NB), which is an approximate reciprocal of speckle contrast, represents an index of the blood velocity. The square blur rate (SBR), which is proportional to the square of NB, was used as another index for quantitative estimation of blood velocity. Theoretically, SBR gives a more exact measurement. The SBR is calculated by the following equation:
SBRn,m,t = <In,m,t> 2/<| In,m,t − <In,m,t>|>2
≈ <In,m,t>2/< (In,m,t − <In,m,t>) 2>
= <In,m,t>2/(<I2n,m,t> − <In,m,t>2)
where In,m,t is the intensity detected at the (n, m)th pixel point, which is integrated over time (t ~ t + Δt). The bracket < … > denotes the ensemble average over 32 frames of the integrated speckle patterns.
In the original LSFG system, a special type of area sensor with a fast scanning rate (BASIS/test version, Canon, 500 frames/s) was used. For developing a commercial LSFG system, it is profitable to replace the special area sensor with a commercially available image sensor. Thus, the new method was studied to analyze the blur rate of the speckle field detected by an ordinary charge-coupled device (CCD) camera. The sampling rate and area of the original area sensor and the new CCD camera are schematically shown in Figure 1. The blood flow map by this new method is of much better quality than the original LSFG system. The details of this new method were also described elsewhere [7]. Briefly, we calculate a new parameter, the mean blur rate (MBR) defined as
MBRn,m,t = (Mn,m,t/Dn,m,t)2 = M2n,m,t/D2n,m,t
Here, Mn,m,t/26 corresponds to the mean intensity for 26 pairs of pixels, then Mn,m,t equals 2<In,m,t>, while Dn,m,t/26 corresponds to the mean difference between pairs of the central point and the surrounding 26 pixels; D2n,m,t is approximately 2(<I2n,m,t> − <In,m,t>2). We can then approximate MBRn,m,t as
MBRn,m,t ≈ 22 <In,m,t>2/2 (<I2n,m,t> – <In,m,t>2)
= 2 {<In,m,t>2/(<I2n,m,t> − <In,m,t>2)} = 2 SBRn,m,t
Figure 1. Comparison of the sampling rate and area of the area sensor used in the original laser speckle flowgraphy (LSFG) system (a) and the charge-coupled device (CCD) camera used in the LSFG-NAVI system (b).
Photonics 01 00220 g001
The new parameter MBR is approximately proportional to SBR. The new LSFG system has demonstrated a better spatial resolution of the blood flow map of the human fundus than the original system so that some thin vessels as well as the choroidal network have become visible. The observation area has been expanded to 6 × 3.8 mm square, which is 24 times larger than the original LSFG system. Despite the different scanning intervals, the time resolution is nearly the same as the original system with 30 maps/s. Consequently, the CCD camera can successfully replace the special area sensor used in the original system. The block diagram and appearance of the updated model of LSFG, LSFG-NAVI, and an example of the color map obtained by this device are shown in Figure 2 and Figure 3. Additionally, the LSFG-NAVI-OPE model was developed recently for ocular blood flow measurement in subjects in a supine position [8]. Schema and the photograph of this device are shown in Figure 4.
Figure 2. Block diagram of the LSFG-NAVI system. USB: universal serial bus, PC: personal computer, LCD: liquid crystal display.
Photonics 01 00220 g002
Figure 3. Appearance of the LSFG-NAVI device (a) and an example of its color map (b).
Photonics 01 00220 g003
Figure 4. The schematic view (a) and photograph (b) of the recently developed LSFG-NAVI-OPE device, which is a modification of the LSFG-NAVI.
Photonics 01 00220 g004

3. Application of LSFG-NAVI to Basic and Clinical Research

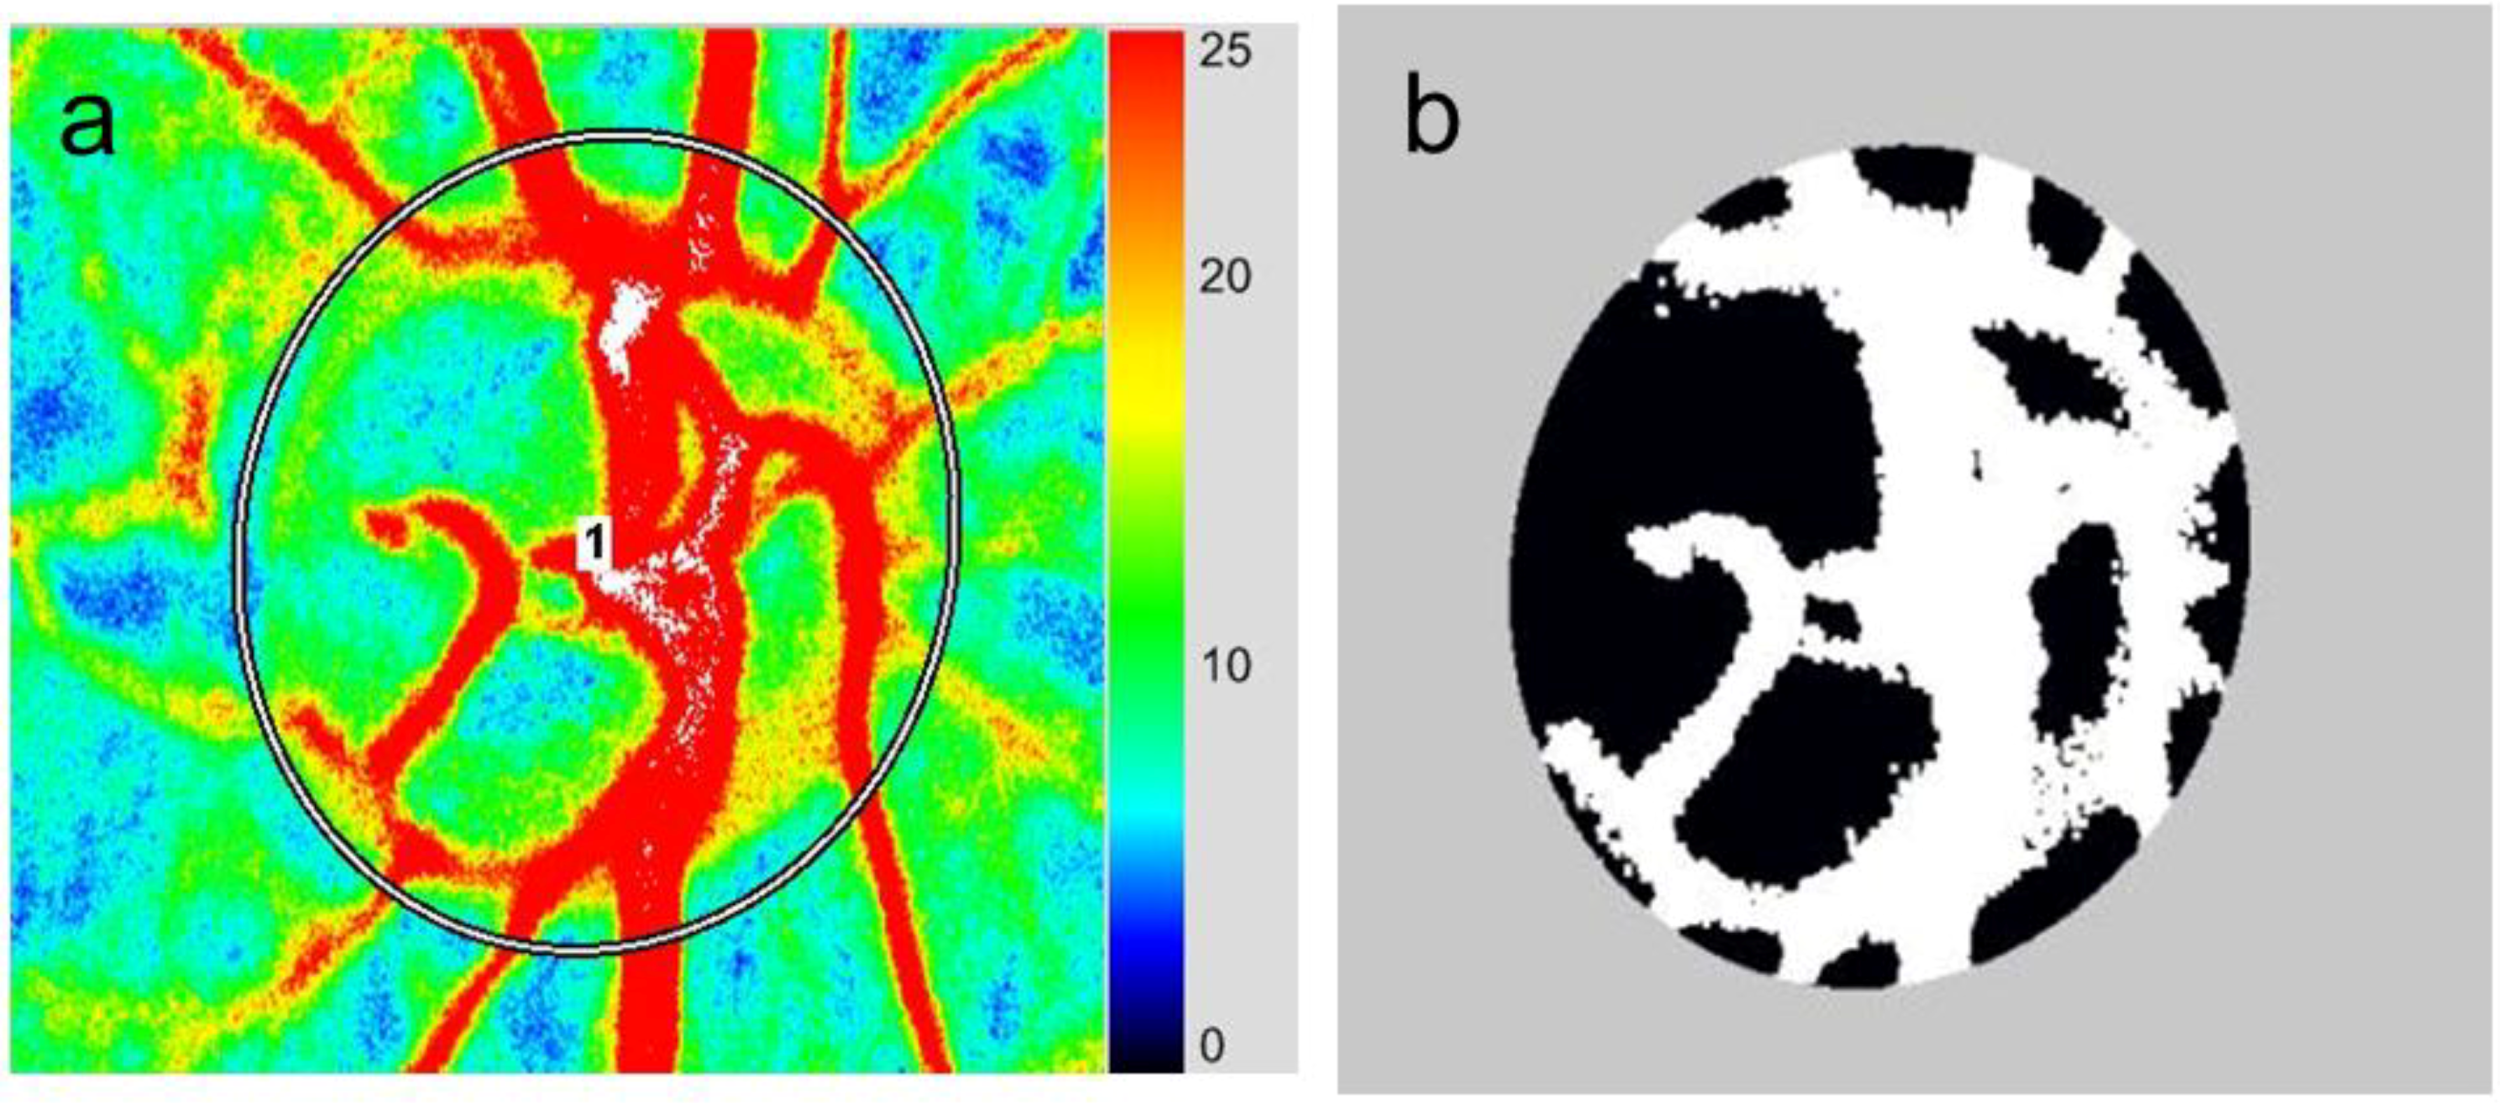
3.1. Specific Parameters in LSFG-NAVI

Three parameters of the MBR in the ONH are calculated by the LSFG Analyzer software (Softcare Co., Ltd., Figure 5). After the margin of the ONH is identified using a round band, the software segments out the vessels using the automated definitive threshold and analyzes the mean MBRs throughout the ONH (MA), the mean MBRs of the ONH vessels (MV), and the mean MBRs of the ONH tissue (MT). The reproducibility was reported to be favorable in not only normal subjects but also glaucoma patients [9]. Using this segmentation, area ratio of blood stream (ARBS), which is equal to the percentage of retinal vessel area within the ONH, has been proposed to be investigated.
Furthermore, the LSFG Analyzer software has allowed analysis of the MBR pulse waveform as the results of cardiac cycles. The parameters obtained from this analysis include fluctuation, skew, blowout score (BOS), blowout time (BOT), rising rate, falling rate, flow acceleration index (FAI), acceleration time index (ATI), and resistivity index (RI), which can all be compared between different eyes. The calculation of some of these parameters was described in detail elsewhere [10]. Brief explanation of them will be provided here.
Figure 5. Assessment of blood flow within the optic nerve head (ONH). (a) The margin of the ONH is identified using a round band according to the color photograph of the fundus. (b) The software segments out the retinal vessels using the automated definitive threshold and analyzes the mean blur rates (MBRs) throughout the ONH, within the ONH vessels (shown in white), and within the ONH tissue (shown in black).
Photonics 01 00220 g005
Fluctuation is a parameter indicating the instability of the blood flow, which is proportional to the mean fluctuation of MBR divided by the average MBR in a waveform (Figure 6a). Skew quantifies the asymmetry of the waveform distribution, varying with the bias of the waveform shape. Specifically, the skew equals zero if the waveform is completely symmetrical, while the skew becomes positive or negative if the waveform is distributed leftward or rightward of the center point of the waveform, respectively (Figure 6b).
BOS indicates the blood flow volume maintained in the vessel during each heartbeat (Figure 6c). BOT is an indicator that represents the time of the wave maintaining more than half of the mean of maximum and minimum MBR during a beat (Figure 6d). A high BOT indicates that blood flow is maintained at a high level for a long time during each heartbeat to ensure the peripheral tissue is supplied with sufficient blood.
Rising rate and falling rate are derived from the increasing and decreasing sections in the MBR beat waveform, respectively. Rising rate is defined as the ratio of the area under curve (S1) to the entire area (Sall) before the peak (Figure 6e). Falling rate is the equivalent ratio after the peak, i.e., the ratio of S2 to Sall (Figure 6f). Moreover, FAI is calculated from the maximum change among all frames (1/30 s) in a rising curve (Figure 6g), and ATI is derived from a ratio of the time before reaching the peak to a whole heartbeat (Figure 6h). Finally, RI is calculated by dividing the difference of the maximum and minimum MBR by the maximum MBR (Figure 6i).
Figure 6. Schematic explanations of the parameters obtained from waveform analysis: (a) fluctuation, (b) skew, (c) blowout score (BOS), (d) blowout time (BOT), (e) rising rate, (f) falling rate, (g) flow acceleration index (FAI), (h) acceleration time index (ATI), and (i) resistivity index (RI).
Photonics 01 00220 g006
In addition, the relative flow volume (RFV) is a new parameter that has been proposed for assessment of retinal blood flow in the superficial layer of the retina (Figure 7a). Its accuracy and reproducibility were recently verified [11]. All of the retinal vessels around the ONH can be distinguished semi-automatically with the specific software (Figure 7b). The total retinal flow indexes of arteries and veins can be calculated separately.

3.2. Application of LSFG-NAVI to Basic Research

The results of our recent study have suggested that absolute values of MBR in the ONH correlate with capillary blood flow (CBF) and linearly change with CBF, indicating the quantifiability of absolute values of MBR at least under certain conditions: there are no large topographical or color differences of the ONH induced by individuality or diseases, which affect the absorption and reflection of the laser beam [12].
Figure 7. (a) Determination of Retinal flow volume (RFV). The MBRthreshold is the threshold between MBR values in the retinal vessels and the background choroid; f(x) is the distribution function of MBR in a cross-sectional area of the blood vessel; the width of the function at MBRthreshold is represented by m and n. The RFV in the retina is calculated by subtracting choroidal MBR from the overall MBR. (b) Blood vessels around the ONH are classified into “artery” (red) and “vein” (blue) semi-automatically by the Total retinal arteries and veins analysis (TRAVA) software. We can reclassify manually if there is any misjudgment by TRAVA. Based on this classification, total retinal flow indexes of arteries and veins will be calculated separately.
Photonics 01 00220 g007
A study showed that a rapid ocular perfusion pressure decrease, which is induced by a sudden IOP step increase, evoked a transient and reproducible dynamic autoregulation response in the ONH of non-human primates measured with LSFG-NAVI [13]. The influence of posture changes on ocular blood flow was also investigated using LSFG-NAVI [14]. The results suggested that the ONH and choroidal circulation have significantly different hemodynamics during posture changes in healthy volunteers.
Recently, it has been reported that BOT is highly and negatively correlated with age and may be a good indicator of early atherosclerotic change [15,16] as well as organ damages such as kidney dysfunction [17]. Another study reported that MBR and BOS in the ONH as well as in the macula have a negative correlation with age, and they may serve as indexes for fundus pathology including age-related arterial sclerosis [18]. More recently, a significant age correlation with the falling rate and skew was also detected; the falling rate and skew may be a candidate biomarker for age-dependent microcirculation [10].

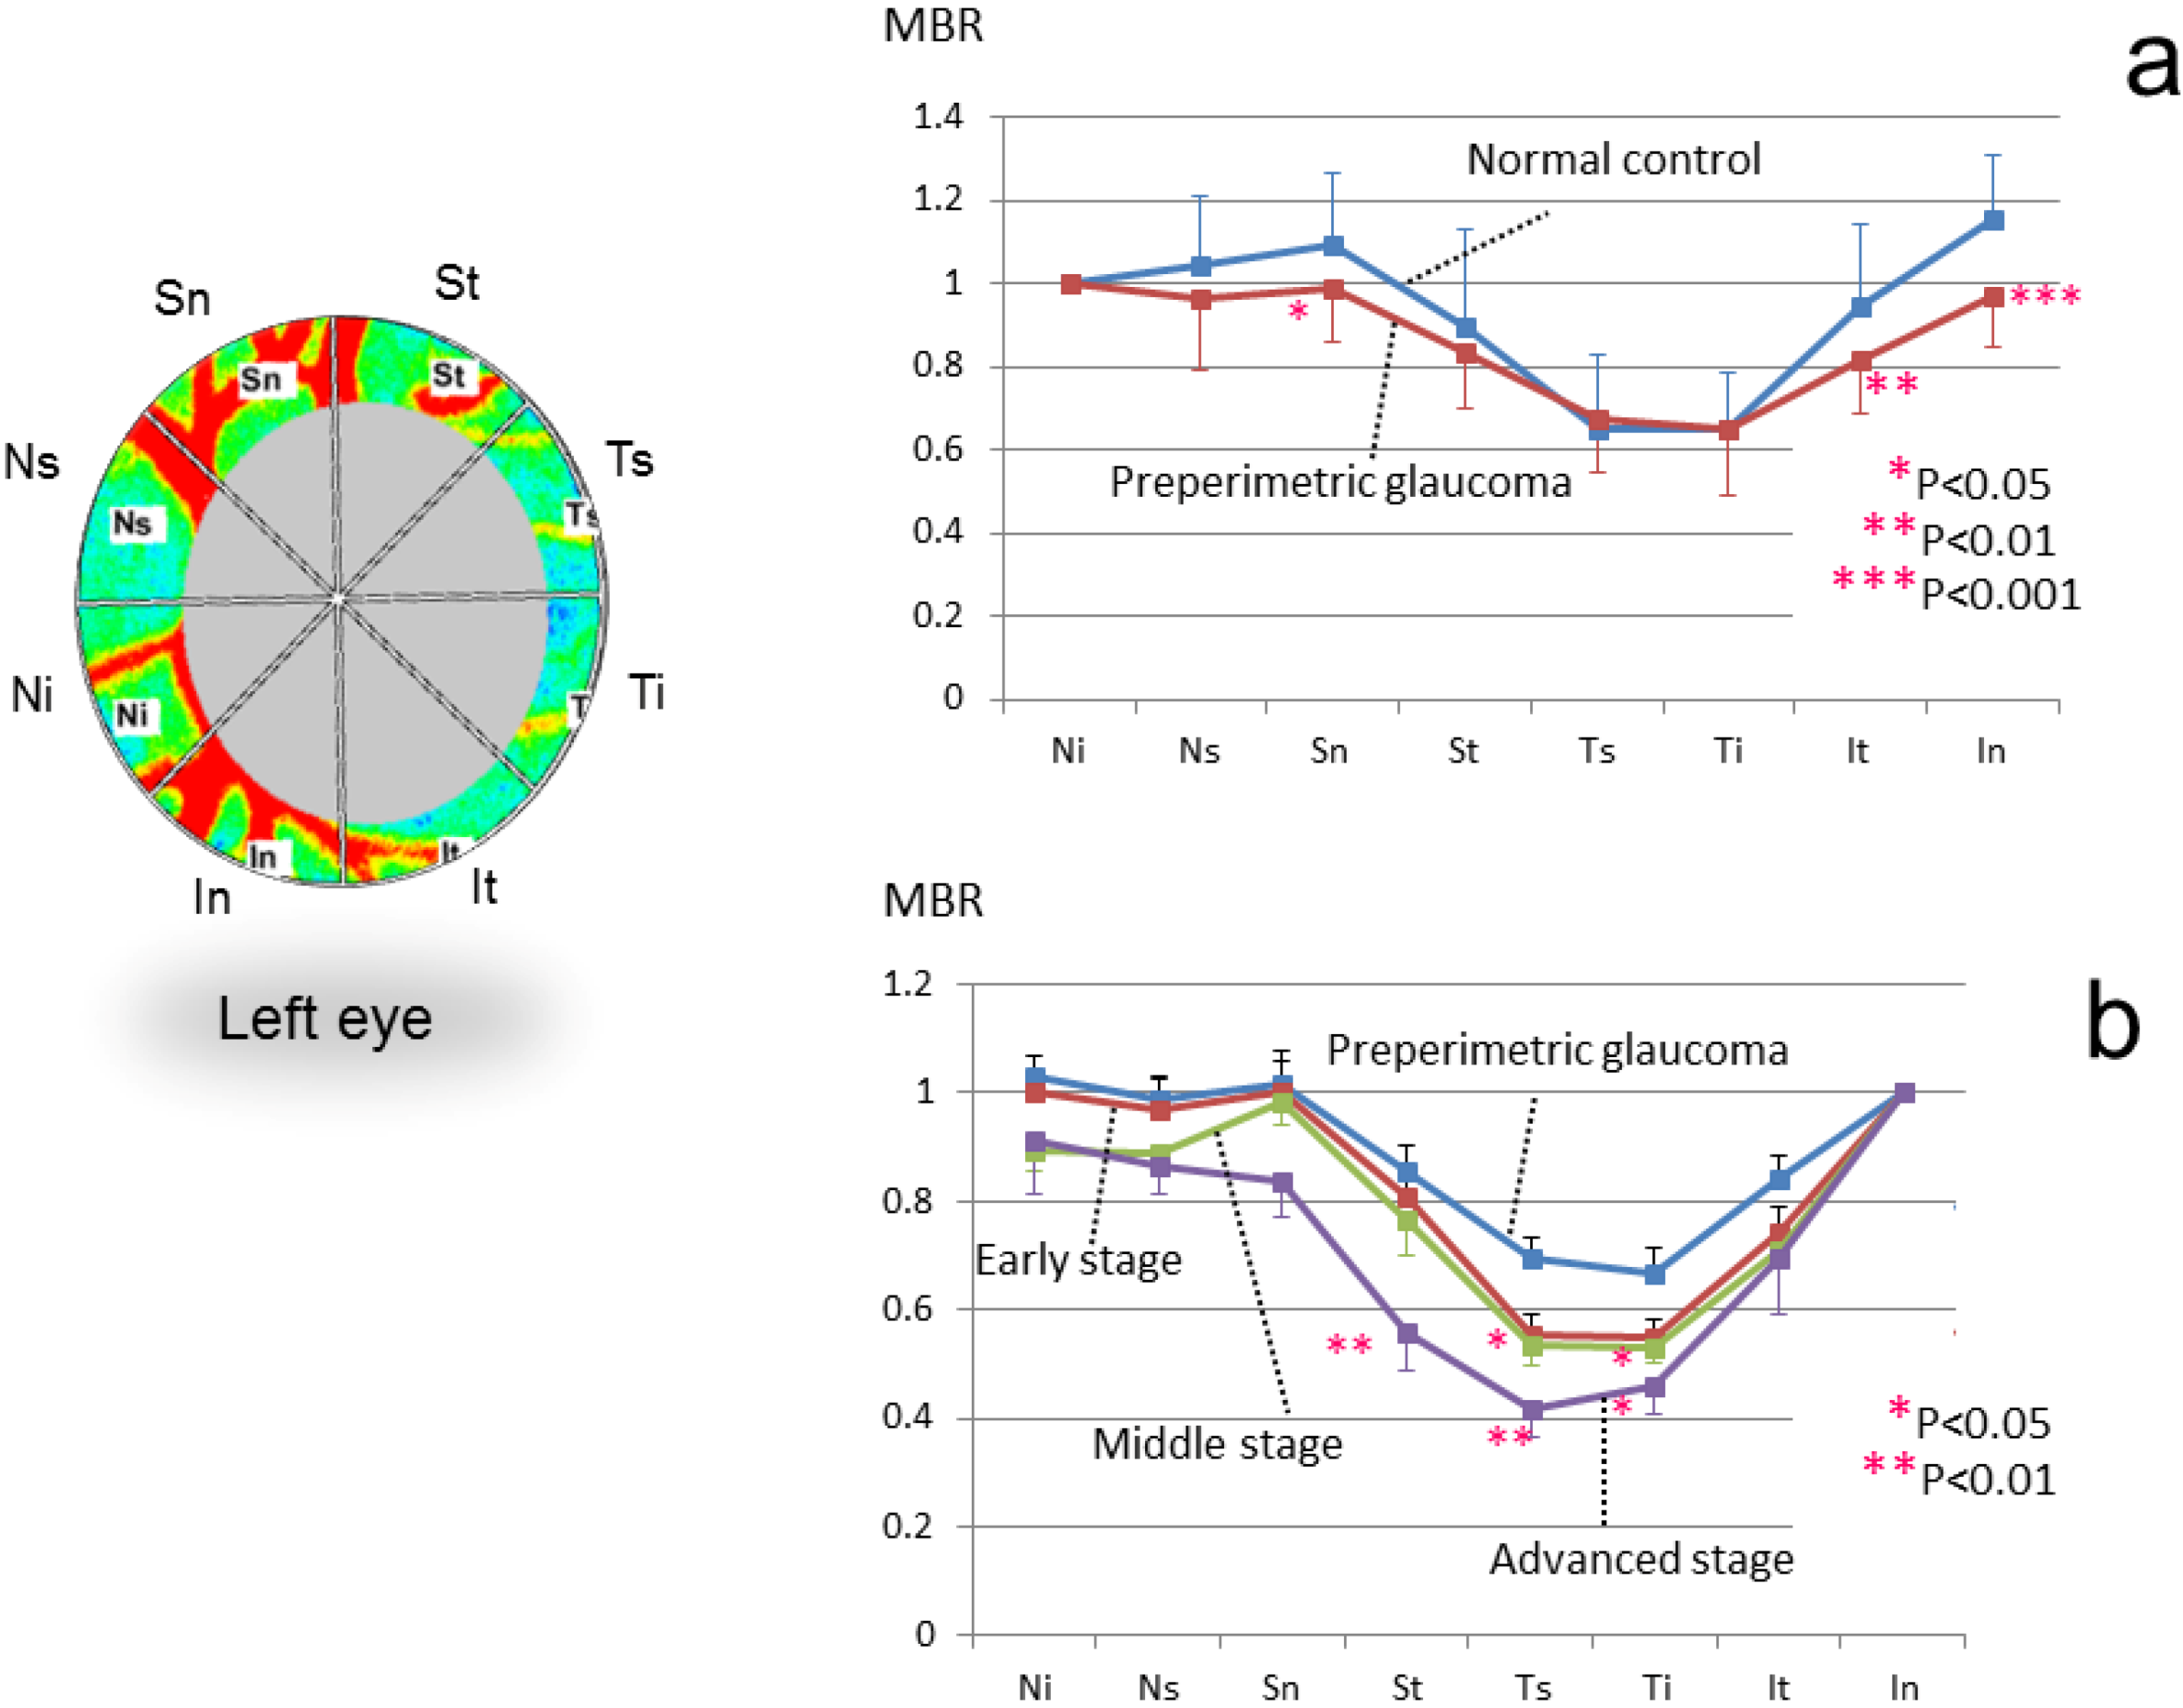
3.3. Application of LSFG-NAVI to Glaucoma and Other Optic Nerve Diseases

It was demonstrated that chronic IOP elevation caused a significant decrease in the ONH blood flow in the experimental glaucoma model of non-human primates using the LSFG-NAVI model [19]. Moreover, the same research group reported longitudinal hemodynamic changes within the ONH in the experimental glaucoma model [20]. According to their data, the ONH blood flow increased during the earliest stage, followed by a linear decrease that correlated with retinal nerve fiber layer defect.
Figure 8. Sectorial analysis of the ONH rim blood flow in patients within each stage of glaucoma. Comparisons between preperimetric glaucoma and normal control (a); within each stage of glaucoma (b).
Photonics 01 00220 g008
There have been several reports regarding clinical studies on the ONH blood flow in patients with glaucoma. We have found that the blood flow of the temporal rim decreased more as the glaucoma stage progressed [21] (Figure 8). In another report, the blood flow in the myopic ONH was compared between the glaucoma and control groups [22]. The average MBR in the entire ONH was significantly lower in the glaucoma group than that in the control group. The same research group reported that the ONH blood flow, especially in tissue area, was significantly correlated with the average peripapillary retinal nerve fiber layer thickness and mean deviation in glaucoma patients with general enlargement disc [23]. The correlation between the ONH microcirculation measured with LSFG-NAVI and fluorescein angiography, and their correlation between the Humphrey mean deviation (MD) have also been indicated [24]. We have reported that skew and BOT showed significant relationships with the MD values and that BOT and falling rate showed significant correlations with the MD slope in focal ischemic type, as assigned to the ONH appearance [25]. Another study suggested that skew was significantly lower and ATI was significantly higher in patients with normal tension glaucoma (NTG) compared to the control values [14].
Some studies reported effects of anti-glaucoma eye drops on the ONH blood flow in glaucoma patients [26,27,28,29]. Figure 9 shows a representative change of the ONH blood flow in NTG induced by a calcium antagonist.
Figure 9. A representative change of the ONH blood flow in NTG patient induced by taking a calcium antagonist, nilvadipine: pretreatment (a), 1 month (b) and 6 months (c) after the treatment started (MBR of the rectangular region at the rim was 5.4, 6.8, and 8.1, respectively).
Photonics 01 00220 g009
Regarding other optic nerve diseases, it has been reported that LSFG-NAVI could also be useful in differentiating between superior segmental optic hypoplasia and NTG [30], as well as between nonarteritic ischemic optic neuropathy and anterior optic neuritis [31].

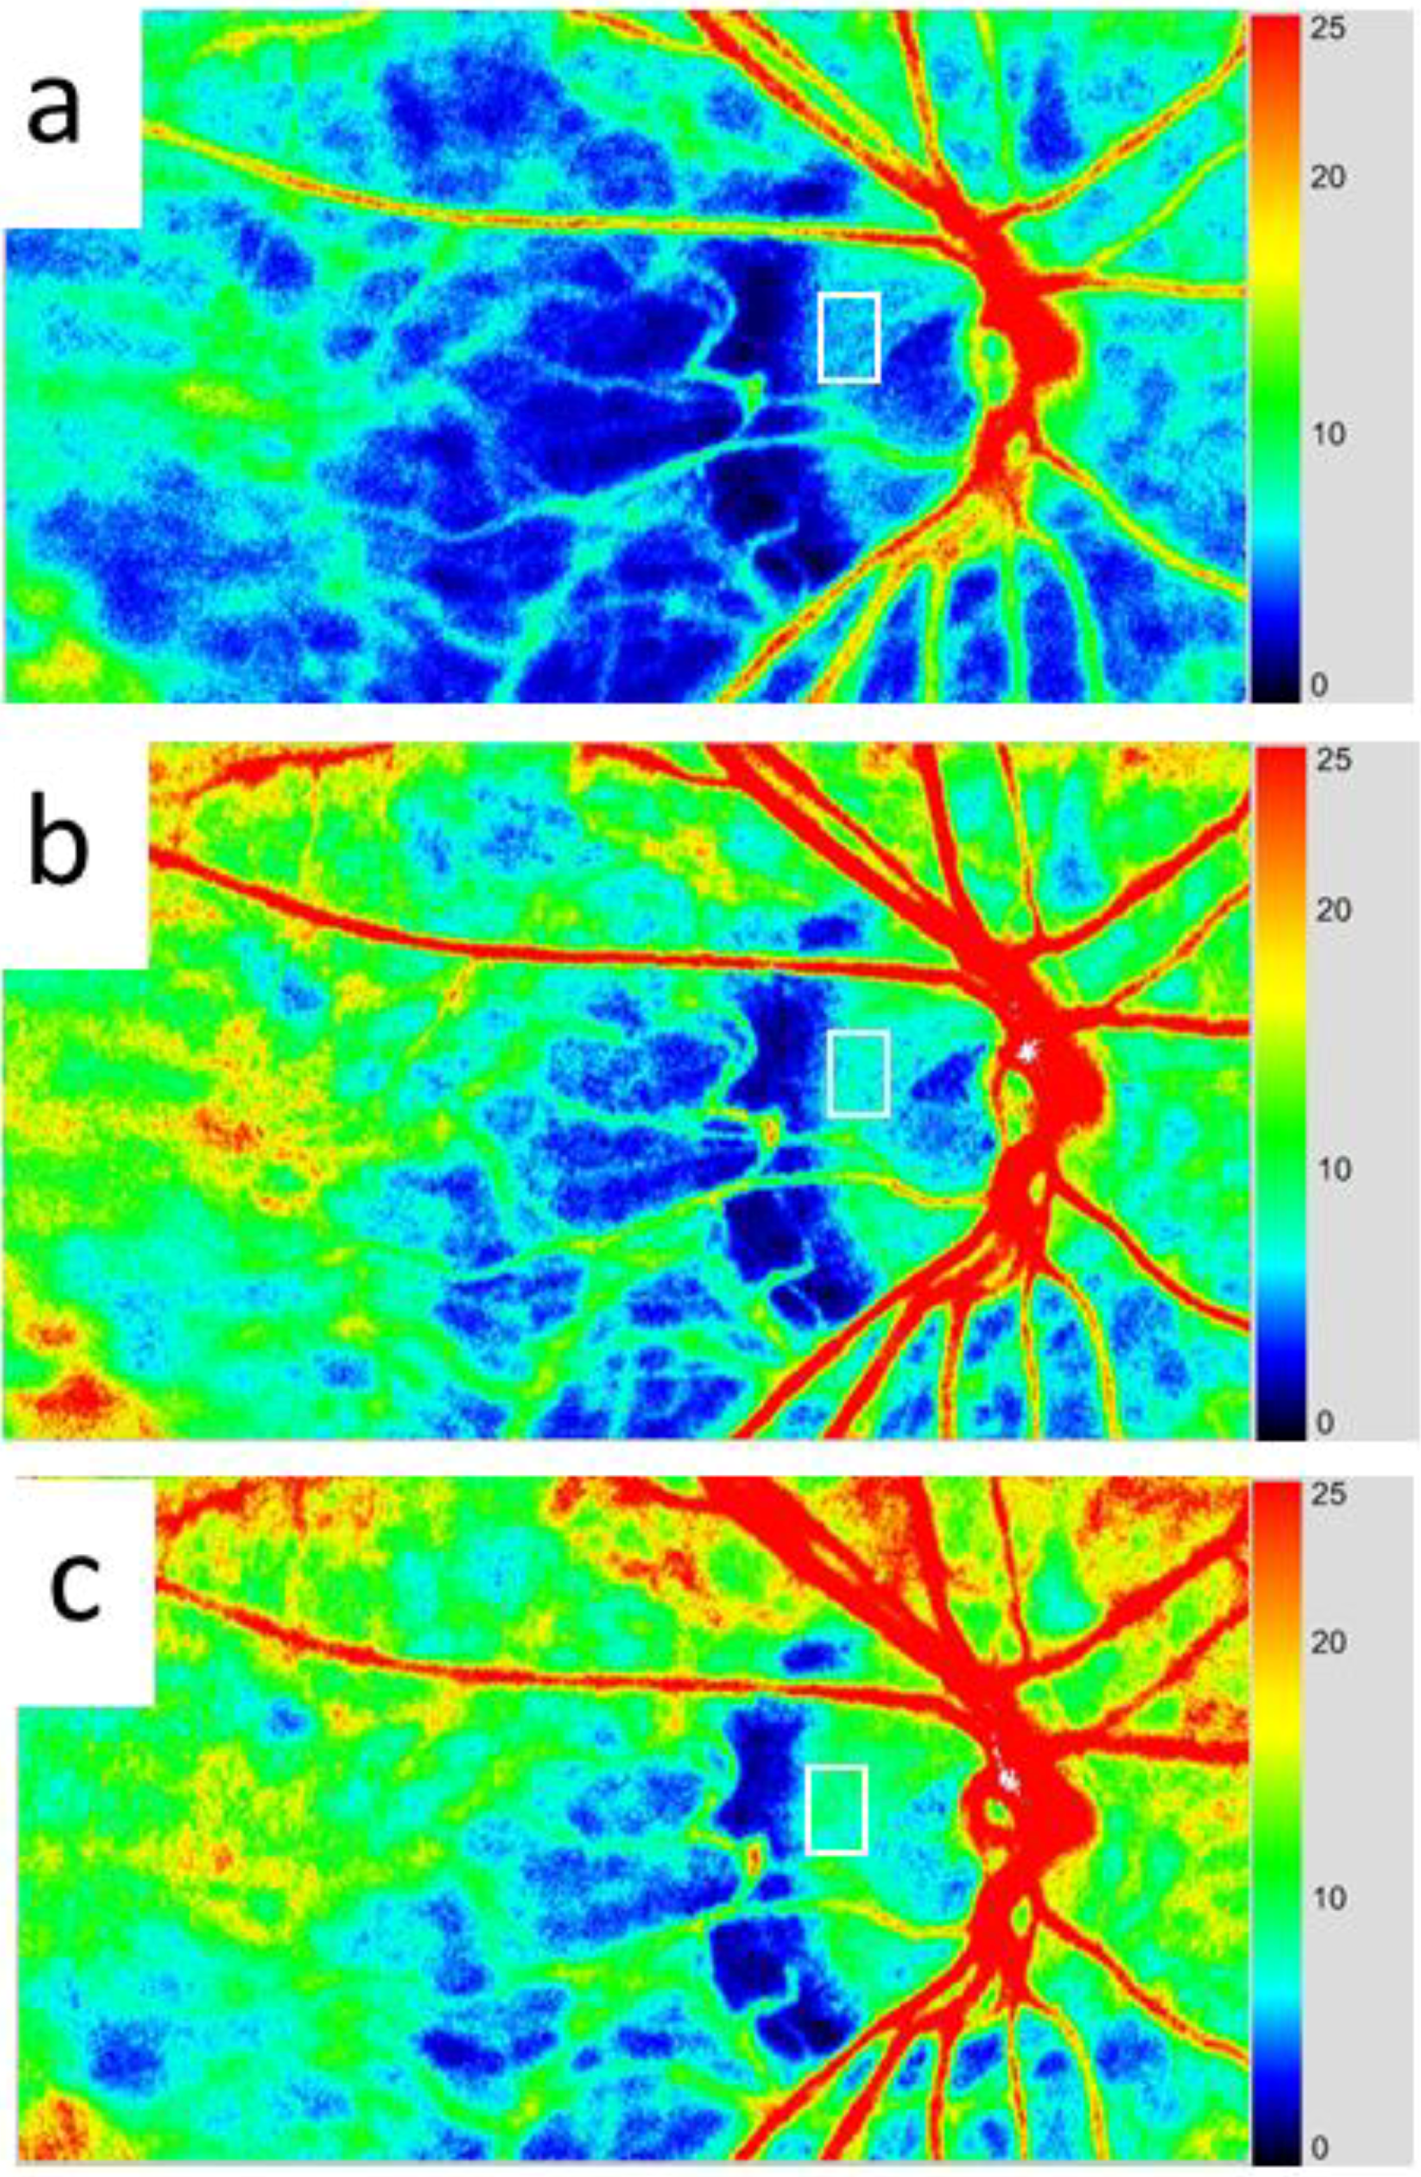
3.4. Application of LSFG-NAVI to Retinal and Choroidal Diseases

The study using an experimental branch retinal artery occlusion suggested that the hemodynamic pattern observed in LSFG is mainly originated from choroid (approximately 92% of the sum of the choroidal and retinal circulation) [32]. Although this study was carried out by the previous model of LSFG, the result might be applicable also to LSFG-NAVI.
There have been several studies on the applications of LSFG-NAVI to retinal and choroidal diseases: polypoidal choroidal vasculopathy [33], Vogt-Koyanagi-Harada disease [34], central retinal vein occlusion [35], diabetic retinopathy [36], acute macular neuroretinopathy [37], acute central serous chorioretinopathy [38], acute zonal occult outer retinopathy [39], punctate inner choroidopathy [40], and so on.
Some reports also suggested that the LSFG-NAVI model is useful for evaluating medical and surgical therapies for retinal and choroidal diseases, such as corticosteroids [34,37], anti-vascular endothelial growth factor therapy [36,41,42], other agents [43,44], and vitrectomy [8,45].

4. Conclusions

The LSFG-NAVI model has been developed as a commercial device for measuring the ocular blood flow. This system uses a new index for blood flow, MBR, which correlates with the absolute blood flow. Analysis of the MBR pulse waveform provides specific parameters regarding the blood flow, which can be used for comparing different eyes. Recently, there have been increasing reports that LSFG-NAVI can be efficiently applied to ocular diseases including glaucoma, retinal and choroidal diseases.

Conflicts of Interest

The author declares no conflicts of interest.

References

  1. Fercher, A.F.; Briers, J.D. Flow visualization by means of single-exposure speckle photography. Opt. Commun. 1981, 37, 326–330. [Google Scholar] [CrossRef]
  2. Tamaki, Y.; Araie, M.; Kawamoto, E.; Fujii, H. Non-contact, two-dimensional measurement of retinal microcirculation using laser speckle phenomenon. Investig. Ophthalmol. Vis. Res. 1994, 35, 3825–3834. [Google Scholar]
  3. Tamaki, Y.; Araie, M.; Kawamoto, E.; Eguchi, S.; Fujii, H. Non-contact, two-dimensional measurement of tissue circulation in choroid and optic nerve head using laser speckle phenomenon. Exp. Eye Res. 1995, 60, 373–384. [Google Scholar] [CrossRef]
  4. Tamaki, Y.; Araie, M.; Tomita, K.; Nagahara, M.; Tomidokoro, A.; Fujii, H. Real-time measurement of human optic nerve head and choroid circulation, using the laser speckle phenomenon. Jpn. J. Ophthalmol. 1997, 41, 49–54. [Google Scholar] [CrossRef]
  5. Fujii, H. Laser speckle blood flowgraphy. In Medical Diagnostic Techniques and Procedures; Narosa Publishing House: New Delhi, India; London, UK, 2000; pp. 216–224. [Google Scholar]
  6. Sugiyama, T.; Araie, M.; Riva, C.E.; Schmetterer, L.; Orgul, S. Use of laser speckle flowgraphy in ocular blood flow research. Acta Ophthalmol. 2010, 88, 723–729. [Google Scholar] [CrossRef]
  7. Konishi, N.; Tokimoto, Y.; Kohra, K.; Fujii, H. New laser speckle flowgraphy system using CCD camera. Opt. Rev. 2002, 9, 163–169. [Google Scholar] [CrossRef]
  8. Ubuka, M.; Sugiyama, T.; Onoda, Y.; Shiba, T.; Hori, Y.; Maeno, T. Changes in the blood flow of the optic nerve head induced by different concentrations of epinephrine in intravitreal infusion during vitreous surgery. Investig. Ophthalmol. Vis. Sci. 2014, 55, 1625–1629. [Google Scholar] [CrossRef]
  9. Aizawa, N.; Yokoyama, Y.; Chiba, N.; Omodaka, K.; Yasuda, M.; Otomo, T.; Nakamura, M.; Fuse, N.; Nakazawa, T. Reproducibility of retinal circulation measurements obtained using laser speckle flowgraphy-NAVIin patients with glaucoma. Clin. Ophthalmol. 2011, 5, 1171–1176. [Google Scholar]
  10. Tsuda, S.; Kunikata, H.; Shimura, M.; Aizawa, N.; Omodaka, K.; Shiga, Y.; Yasuda, M.; Yokoyama, Y.; Nakazawa, T. Pulse-wave analysis of normal population using laser speckle flowgraphy. Curr. Eye Res. 2014, in press. [Google Scholar]
  11. Shiga, Y.; Asano, T; Kunikata, H.; Nitta, F.; Sato, H.; Nakazawa, T.; Shimura, M. Relative flow volume, a novel blood flow index in the human retina derived from laser speckle flowgraphy. Investig. Ophthalmol. Vis. Sci. 2014, 55, 3899–3904. [Google Scholar] [CrossRef]
  12. Takahashi, H.; Sugiyama, T.; Tokushige, H.; Maeno, T.; Nakazawa, T.; Ikeda, T.; Araie, M. Comparison of CCD-equipped laser speckle flowgraphy with hydrogen gas clearance method in the measurement of optic nerve head microcirculation in rabbits. Exp. Eye Res. 2013, 108, 10–15. [Google Scholar] [CrossRef]
  13. Liang, Y.; Fortune, B.; Cull, G.; Cioffi, G.A.; Wang, L. Quantification of dynamic blood flow autoregulation in optic nerve head of rhesus monkeys. Exp. Eye Res. 2010, 90, 203–209. [Google Scholar]
  14. Shiga, Y.; Omodaka, K.; Kunikata, H.; Ryu, M.; Yokoyama, Y.; Tsuda, S.; Asano, T.; Maekawa, S.; Maruyama, K.; Nakazawa, T. Waveform analysis of ocular blood flow and the early detection of normal tension glaucoma. Investig. Ophthalmol. Vis. Sci. 2013, 54, 7699–7706. [Google Scholar] [CrossRef]
  15. Shiba, T.; Takahashi, M.; Hori, Y.; Maeno, T.; Shirai, K. Optic nerve head circulation determined by pulse wave analysis is significantly correlated with cardio ankle vascular index, left ventricular diastolic function, and age. J. Atheroscler. Thromb. 2012, 19, 999–1005. [Google Scholar]
  16. Shiba, T.; Takahashi, M.; Hori, Y.; Maeno, T. Pulse-wave analysis of optic nerve head circulation is significantly correlated with brachial-ankle pulse-wave velocity, carotid intima-media thickness, and age. Graefes Arch. Clin. Exp. Ophthalmol. 2012, 250, 1275–1281. [Google Scholar] [CrossRef]
  17. Shiba, T.; Takahashi, M.; Maeno, T. Pulse-wave analysis of optic nerve head circulation is significantly correlated with kidney function in patients with and without chronic kidney disease. J. Ophthalmol. 2014, 2014, 291687. [Google Scholar]
  18. Tamura, A.; Kogure, A.; Watanabe, G.; Kishi, S.; Hori, S. Association between age and chorioretinal hemodynamics in normal volunteers examined with laser speckle flowgraphy. J. Jpn. Ophthalmol. Soc. 2013, 117, 110–116. [Google Scholar]
  19. Wang, L.; Cull, G.A.; Piper, C.; Burgoyne, C.F.; Fortune, B. Anterior and posterior optic nerve head blood flow in nonhuman primate experimental glaucoma model measured by laser speckle imaging technique and Microsphere Method. Investig. Ophthalmol. Vis. Sci. 2012, 53, 8303–8309. [Google Scholar] [CrossRef]
  20. Cull, G.; Burgoyne, C.F.; Fortune, B.; Wang, L. Longitudinal hemodynamic changes within the optic nerve head in experimental glaucoma. Investig. Ophthalmol. Vis. Sci. 2013, 54, 4271–4277. [Google Scholar] [CrossRef]
  21. Shibata, M.; Sugiyama, T.; Kojima, S.; Ueki, M.; Ikeda, T. Sectorial analysis of optic nerve head rim blood flow using laser speckle flowgraphy. J. Eye 2010, 27, 1279–1285. [Google Scholar]
  22. Yokoyama, Y.; Aizawa, N.; Chiba, N.; Omodaka, K.; Nakamura, M.; Otomo, T.; Yokokura, S.; Fuse, N.; Nakazawa, T. Significant correlations between optic nerve head microcirculation and visual field defects and nerve fiber layer loss in glaucoma patients with myopic glaucomatous disk. Clin. Ophthalmol. 2011, 5, 1721–1727. [Google Scholar]
  23. Chiba, N.; Omodaka, K.; Yokoyama, Y.; Aizawa, N.; Tsuda, S.; Yasuda, M.; Otomo, T.; Yokokura, S.; Fuse, N.; Nakazawa, T. Association between optic nerve blood flow and objective examinations in glaucoma patients with generalized enlargement disc type. Clin. Ophthalmol. 2011, 5, 1549–1556. [Google Scholar]
  24. Aizawa, N.; Kunikata, H.; Yokoyama, Y.; Nakazawa, T. Correlation between optic disc microcirculation in glaucoma measured with laser speckle flowgraphy and fluorescein angiography, and the correlation with mean deviation. Clin. Exp. Ophthalmol. 2013, 42, 293–294. [Google Scholar]
  25. Sugiyama, T.; Shibata, M.; Kojima, S.; Ueki, M.; Ikeda, T. Analysis of waveforms obtained from periodic change in optic nerve head blood flow of glaucoma patients using laser speckle flowgraphy-NAVI™. J. Eye 2012, 29, 984–987. [Google Scholar]
  26. Shibata, M.; Sugiyama, T.; Kojima, S.; Ueki, M.; Ikeda, T. Optic nerve head blood flow changes induced by long-acting beta-blocker addition to latanoprost in primary open-angle glaucoma. J. Eye 2011, 28, 1017–1021. [Google Scholar]
  27. Sugiyama, T.; Shibata, M.; Kojima, S.; Ueki, M.; Ikeda, T. Changes in microcirculation in the optic nerve head following topical tafluprost in eyes with primary open-angle glaucoma. Jpn. J. Clin. Ophthalmol. 2011, 65, 475–479. [Google Scholar]
  28. Tsuda, S.; Yokoyama, Y.; Chiba, N.; Aizawa, N.; Shiga, Y.; Yasuda, M.; Yokokura, S.; Otomo, T.; Fuse, N.; Nakazawa, T. Effect of topical tafluprost on optic nerve head blood flow in patients with myopic disc type. J. Glaucoma 2013, 22, 398–403. [Google Scholar] [CrossRef]
  29. Kojima, S.; Sugiyama, T.; Shibata, M.; Ueki, M.; Komoto, R.; Ikeda, T. Changes in visual field, morphology and microcirculation of the optic nerve head after instillation of tafluprost for one year. Jpn. J. Clin. Ophthalmol. 2014, 68, 895–902. [Google Scholar]
  30. Aizawa, N.; Kunikata, H.; Omodaka, K.; Nakazawa, T. Optic disc microcirculation in superior segmental optic hypoplasia assessed with laser speckle flowgraphy. Clin. Exp. Ophthalmol. 2014. [Google Scholar] [CrossRef]
  31. Maekubo, T.; Chuman, H.; Nao-I, N. Laser speckle flowgraphy for differentiating between nonarteritic ischemic optic neuropathy and anterior optic neuritis. Jpn. J. Ophthalmol. 2013, 57, 385–390. [Google Scholar] [CrossRef]
  32. Isono, H.; Kishi, S.; Kimura, Y.; Hagiwara, N.; Konishi, N.; Fujii, H. Observation of choroidal circulation using index of erythrocytic velocity. Arch. Ophthalmol. 2003, 121, 225–231. [Google Scholar] [CrossRef]
  33. Watanabe, G.; Fujii, H.; Kishi, S. Imaging of choroidal hemodynamics in eyes with polypoidal choroidal vasculopathy using laser speckle phenomenon. Jpn. J. Ophthalmol. 2008, 52, 175–181. [Google Scholar] [CrossRef]
  34. Hirose, S.; Saito, W.; Yoshida, K.; Saito, M.; Dong, Z.; Namba, K.; Satoh, H.; Ohno, S. Elevated choroidal blood flow velocity during systemic corticosteroid therapy in Vogt-Koyanagi-Harada disease. Acta Ophthalmol. 2008, 86, 902–907. [Google Scholar]
  35. Maeda, K.; Ishikawa, F.; Ohguro, H. Ocular blood flow levels and visual prognosis in a patient with nonischemic type central retinal vein occlusion. Clin. Ophthalmol. 2009, 3, 489–491. [Google Scholar] [CrossRef]
  36. Enaida, H.; Okamoto, K.; Fujii, H.; Ishibashi, T. LSFG findings of proliferative diabetic retinopathy after intravitreal injection of bevacizumab. Ophthalmic Surg. Lasers Imaging 2010, 41, e1–e3. [Google Scholar]
  37. Hashimoto, Y.; Saito, W.; Mori, S.; Saito, M.; Ishida, S. Increased macular choroidal blood flow velocity during systemic corticosteroid therapy in a patient with acute macular neuroretinopathy. Clin. Ophthalmol. 2012, 6, 1645–1649. [Google Scholar]
  38. Saito, M.; Saito, W.; Hashimoto, Y.; Yoshizawa, C.; Fujiya, A.; Noda, K.; Ishida, S. Macular choroidal blood flow velocity decreases with regression of acute central serous chorioretinopathy. Br. J. Ophthalmol. 2013, 97, 775–780. [Google Scholar] [CrossRef]
  39. Saito, M.; Saito, W.; Hashimoto, Y.; Yoshizawa, C.; Shinmei, Y.; Noda, K.; Ishida, S. Correlation between decreased choroidal blood flow velocity and the pathogenesis of acute zonal occult outer retinopathy. Clin. Exp. Ophthalmol. 2014, 42, 139–150. [Google Scholar]
  40. Hirooka, K.; Saito, W.; Hashimoto, Y.; Saito, M.; Ishida, S. Increased macular choroidal blood flow velocity and decreased choroidal thickness with regression of punctate inner choroidopathy. BMC Ophthalmol. 2014, 14, 73. [Google Scholar] [CrossRef]
  41. Nitta, F.; Kunikata, H.; Aizawa, N.; Omodaka, K.; Shiga, Y.; Yasuda, M.; Nakazawa, T. The effect of intravitreal bevacizumab on ocular blood flow in diabetic retinopathy and branch retinal vein occlusion as measured by laser speckle flowgraphy. Clin. Ophthalmol. 2014, 8, 1119–1127. [Google Scholar]
  42. Matsumoto, M.; Suzuma, K.; Fukazawa, Y.; Yamada, Y.; Tsuiki, E.; Fujikawa, A.; Kitaoka, T. Retinal blood flow levels measured by Laser Speckle Flowgraphy in patients who received intravitreal bevacizumab injection for macular edema secondary to central retinal vein occlusion. Retinal Cases Brief Rep. 2014, 8, 1–87. [Google Scholar] [CrossRef]
  43. Saito, M.; Yoshida, K.; Saito, W.; Fujiya, A.; Ohgami, K.; Kitaichi, N.; Tsukahara, H.; Ishida, S.; Ohno, S. Astaxanthin increases choroidal blood flow velocity. Graefes Arch. Clin. Exp. Ophthalmol. 2012, 250, 239–245. [Google Scholar] [CrossRef]
  44. Akiyama, M.; Ikeda, Y.; Yoshida, N.; Notomi, S.; Murakami, Y.; Hisatomi, T.; Enaida, H.; Ishibashi, T. Therapeutic efficacy of topical unoprostone isopropyl in retinitis pigmentosa. Acta Ophthalmol. 2014, 92, e229–e234. [Google Scholar] [CrossRef]
  45. Okamoto, M.; Matsuura, T.; Ogata, N. Ocular blood flow before, during, and after vitrectomy determined by laser speckle flowgraphy. Ophthalmic Surg. Lasers Imaging Retin. 2014, 45, 118–124. [Google Scholar]

