1. Introduction
Reflectance spectroscopy [
1,
2] is simple to setup, and the machinery is relatively low cost. Reflectance spectroscopy instrumented by using single-fiber probe, which is generally referred to as single-fiber reflectance spectroscopy (SfRS) [
3,
4,
5,
6], delivers light to a turbid medium and detects the light returning to the collection aperture of the same fiber after the photons have experienced some scattering/attenuation events in the medium. The use of fiber-optic probes of small tip profiles has allowed measurement of biological tissue through the lumen of small needles for interstitial or percutaneous probing to assist fine-needle aspiration procedures [
7,
8] and laser-based treatment protocols [
9,
10]. Fiber-probing that can be administered through the instrument channels of endoscopes has also shown the promise of assessing the deterioration of microvasculature in superficial tissue, like the wall of bladder [
11].
The setup of SfRS (or reflectance spectroscopy using a small tip-profile) being simple, the return of spectroscopic information renders the evaluation of absorbing [
5,
6,
7,
8] or fluorescing [
12,
13,
14,
15] chromophores, assessment of changes in tissue scattering [
9,
10] and further analysis of sizing information of the scattering particles [
16,
17] within the interrogated medium. To quantitate the measurement by SfRS as the endpoint is to estimate tissue optical properties based on the measurements, it is imperative to have a working model of the dependence of SfRS signal intensity (which is spectrally resolved) upon tissue optical properties (also spectrally resolved). Such a model process also facilitates cross-system validations by the ability to reproduce or cross-exam absolute signals for the same set of measurands (tissue optical properties) across different SfRS systems. Some earlier studies have examined the fiber-optical aspect of the SfRS signal, necessitating removing the internal specular reflections from the collected signal [
18] and accounting for the collection efficiency of a single fiber [
19] as being limited by the numerical aperture. The relationship between SfRS intensity and optical properties was initially studied by Moffit and Prahl [
3]; that yielded qualitative estimates of the dependence of the SfRS signal upon the optical properties of the medium. Recently, a series of studies, based on extensive Monte Carlo (MC) simulations and experimental validations, have quantitated the effect of optical properties on SfRS measurement [
20,
21,
22,
23,
24,
25,
26]. Among these studies, Kanick
et al. investigated the dependence of the effective photon path length, as well as sampling depth [
20,
21] on the optical properties of the sampled medium. Kanick
et al. and Gamm
et al. further studied the relationship between SfRS signal intensity and the scattering properties of the medium [
22,
23]. As is expected, the scattering phase function [
27,
28,
29] influences the SfRS signal intensity [
22,
23,
24,
25,
26], because the photons to be collected by the single-fiber probe are scattered at or near the point-of-entry; but when the effect of the phase function is lumped into the reduced scattering coefficient
, the SfRS is accurately quantitated with respect to a dimensionless reduced scattering term
, where
is the diameter of the probing fiber. Specifically, the MC and experimental measurements have confirmed that steady-state SfRS intensity increases monotonically
versus
until approximately
> 10, when approaching an asymptotic limit [
22,
23]. The dependence of steady-state SfRS intensity upon the reduced scattering coefficient
and absorption coefficient
has been formulated [
22,
23,
24,
25,
26] to a set of semi-empirical equations:
where
to
are fitted constants, some having a dependence on the scattering phase function of the medium, and
is determined by the acceptance angle of the fiber and the refractive index of the medium. This set of equations essentially decomposes the SfRS signal into the product of three contributing factors: (1) a reduced scattering-dependent term
that accounts for the ratio of photons remitting from the medium and crossing the area of the fiber facet over the total number of photons launched into the medium, which will be referred to as the “ratio-of-remission” and abbreviated as RoR in this work; (2) a reduced scattering-dependent term
that represents the collection efficiency of the fiber due to the limited numerical aperture; and (3) an absorption-dependent term
that is responsible for the attenuation of photons in the medium due exclusively to absorption and that is modeled using the modified Beer–Lambert law over an effective path length of
, which is, however, mainly determined by the reduced scattering of the medium.
It is noted that the dimensionless reduced scattering term
appearing in the set of Equations (1)–(4) is a measure of the relative scale of the size of the probing fiber with respect to the transport scattering path length of the light in the medium. Intuitively, therefore, the bigger the fiber with respect to the transport scattering path length of the medium, the more scattered light the fiber will collect. The increased collection of the scattered light by the fiber will, however, approach a limit, when the scattering of the medium reaches the condition that the backscattering event occurs at positions very close to the fiber facet, making only the portion of the scattered light that is within the numerical aperture of the fiber collectable. Apparently, an increase of the absorption coefficient
of the medium will reduce the light collected by the single-fiber probe. In establishing the set of semi-empirical Equations (1)–(4), the effect of the numerical aperture of the fiber on the collection of the scattering photons is taken care of by the
term, leaving the
term to exclusively account for the relative scale of the fiber diameter with respect to the reduced scattering path length. The empirical formula for
has proven accurate and convenient for characterizing SfRS signal intensity in a variety of applications [
7,
8,
24,
25,
26], with the need to only adjust the a few constants according to the scattering phase function, if known. Given that
, shown in Equation (2), is formulated empirically, other forms of
that are quantitatively very close to the one shown in Equation (2) shall not be excluded in evaluating Equation (1). A more fundamental plausibility pertinent to
is whether the
term can be developed analytically, not empirically.
An accurate analytical model of how the tissue optical properties affect
shall originate from the radiative transfer equation [
29,
30] that employs the scattering coefficient
and takes into account the anisotropy
of the scattering [
31,
32,
33,
34,
35,
36,
37]. The successful use of the reduced scattering coefficient
in the semi-empirical modeling of the RoR term
, however, suggests that the global pattern of
may be reached analytically by direct utilization of
. When many events of anisotropic scattering happening at a shorter scattering path length of
contribute to the detected photon fluence, the combined effect could be equalized to a lesser number of isotropic scattering events happening at a much longer path length of
, as is the underlining motivation for introducing
into describing the light propagation in the presence of scattering.
This work aims at developing an analytical pathway that may arrive at the quantitative pattern (but not necessarily the exact formulae) of the RoR that is displayed by Equation (2). The derivation will be illustrated in four cases, corresponding to in-medium or surface-based SfRS measurements by using straight-polished or angle-polished fiber. The angle-polished fiber is frequently used in experimental SfRS as a result of the need to abate excessive specular reflection from the fiber-tissue interface that impairs measurement from the medium of interest. The analysis shown in this work provides insight to the difference of SfRS intensities between two different geometries of probing the tissue, probing interstitially and probing by surface-contact of the medium. The effect of the geometry of probing the tissue-medium by the single fiber probe, i.e., interstitial or contact-based, on SfRS intensity has to the authors’ knowledge not been attended previously. It is demonstrated that the analytically computed SfRS corresponding to a 15° angle-polished fiber in a semi-infinite medium geometry over the range of
agrees with the previously reported experimental results performed in a surface-probing configuration, for a medium that presented a Henyey–Greenstein (HG) scattering phase function with an anisotropy factor of 0.8. In cases of medium scattering light anisotropically, we will discuss how the analytical treatment may be furthered to account for the scattering anisotropy.
2. Analytic Development
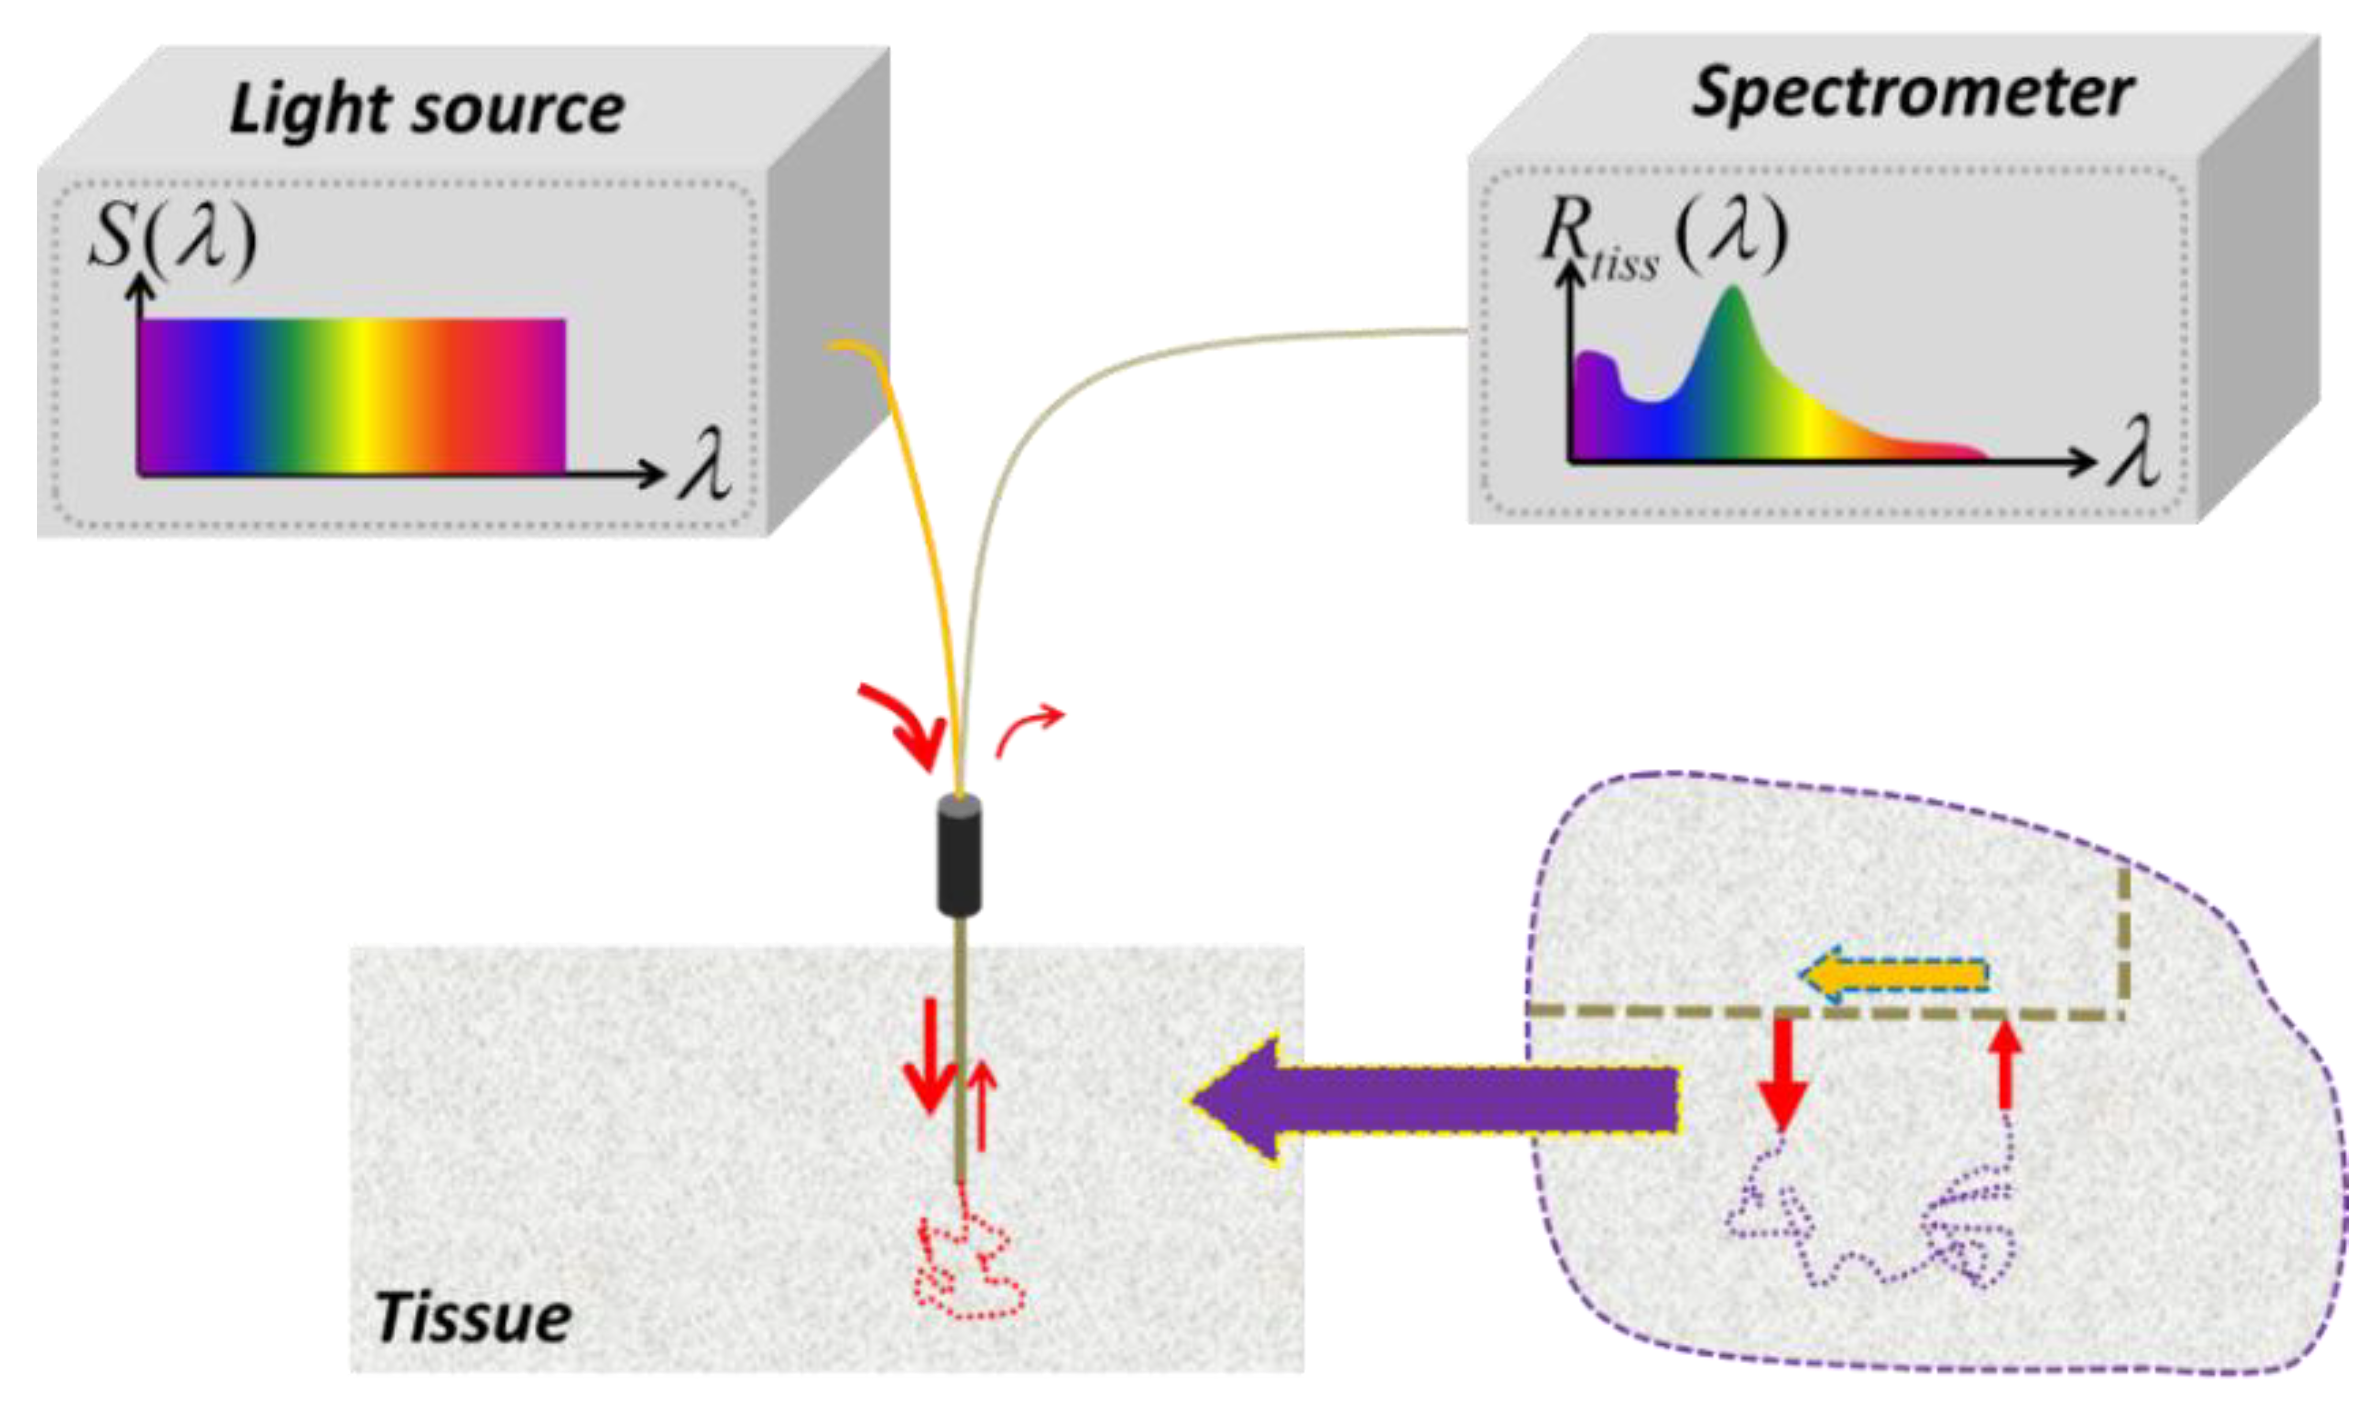
An ideal light source for SfRS has a uniform intensity profile across the broad spectrum of interest, as is schematically illustrated in
Figure 1. With such a light source, what is measured out of the single probing fiber represents exclusively the spectrally-resolved tissue reflectivity
that was formulated semi-empirically in Equation (1). To derive the
of
, we refer to the inset in
Figure 1 for a hypothetical examination of the path of a single photon in the medium between leaving the fiber and reaching the fiber after experiencing scattering events. By treating the light launched by the fiber to the tissue as originating from a spatially impulsive source, using the same fiber to deliver light to tissue and to collect light from tissue can be assimilated to either of the following two configurations, as long as the collection of one photon is concerned: (1) a dual-fiber configuration with a photon of interest being launched by a delivery fiber then collected by another fiber and letting the distance between the delivery and collection fibers approaching the size of the single-fiber probe; and (2) a single-fiber dual-point configuration, wherein the photon of interest is launched into the medium at the center point of the fiber facet, then collected by the same fiber at an off-center point of the fiber facet, as revealed by the hypothetical “magnified” view of the inset. Although either of these two approximations could possibly facilitate analysis of
, the second one hypothesizing single-fiber dual-points will be shown in this work in expressing
as a function of
and the fiber dimensional parameters (fiber diameter and polishing angle of the fiber tip). The analytical evaluation will be conducted in an infinite geometry and a semi-infinite geometry of the medium. Distinguishing between the two geometries is necessary, because when the fiber probe is placed in contact with the surface of the medium, as in cases of MC or the associated experiments [
21,
22,
23], the tissue to the photon propagation is a half-space with a planar boundary that essentially conforms to a semi-infinite medium geometry. When the fiber probe is inserted into the medium, such as in cases for fine-needle aspiration procedures [
7,
8] or laser-based treatment protocols [
9,
10], the tissue to the photon propagation is more suitable to be described by an infinite-medium geometry than a half-space or semi-infinite geometry. Note that the effect of the limited numerical aperture of the fiber to the collection of photon flux has been separately accounted for in
by
. Consequently the
term stands for the ratio of photons remitting from the medium and crossing the area of the fiber facet over the total number of photons launched into the medium, but not the ratio of photons collected by the fiber over the total number of photons launched into the medium, as the latter has to involve the numerical aperture, which is addressed by
. The different refractive indices of the fiber and the tissue across the tissue-fiber interface, however, will cause part of the photon flux at the fiber-tissue interface to be bounced back to the tissue; the amount of photons returning to the tissue is readily modeled by Fresnel reflection as is shown in the following derivations of
.
We consider the tissue to be modeled for steady-state RoR to have the following homogeneous and wavelength-dependent optical properties (for convenience, these properties are presented without the argument of wavelength
in their respective symbols): absorption coefficient
, reduced scattering coefficient
, diffusion coefficient
and effective attenuation coefficient
.
Figure 1.
An ideal light source for single-fiber reflectance spectroscopy (SfRS) has a uniform intensity profile across the broad spectrum of interest. With such a light source, what is measured out of the light collected from the single probing fiber represents exclusively the tissue reflectivity as a function of wavelength, with which the optical properties, including absorption and reduced scattering coefficients of localized bulk tissue, may be recovered. The inset enclosed by the dashed circle indicates that the single-fiber configuration can be approximated by a dual-fiber configuration in its limites case or a dual-path configuration: (1) a dual-fiber configuration with separate delivery and collection fibers, by letting the distance between the delivery and collection fibers approaching the size of the fiber; (2) a single-fiber dual-point configuration, wherein the points of light delivery and light collection are different, but both are located at the facet of the fiber tip. Either of these two treatments would facilitate analytical evaluation with the assumption of photon-diffusion principles.
![Photonics 01 00565 g001]()
2.1. Ratio-of-Remission Associated with Steady-State Probing in an Infinite Tissue Geometry Using a Straight-Polished Fiber
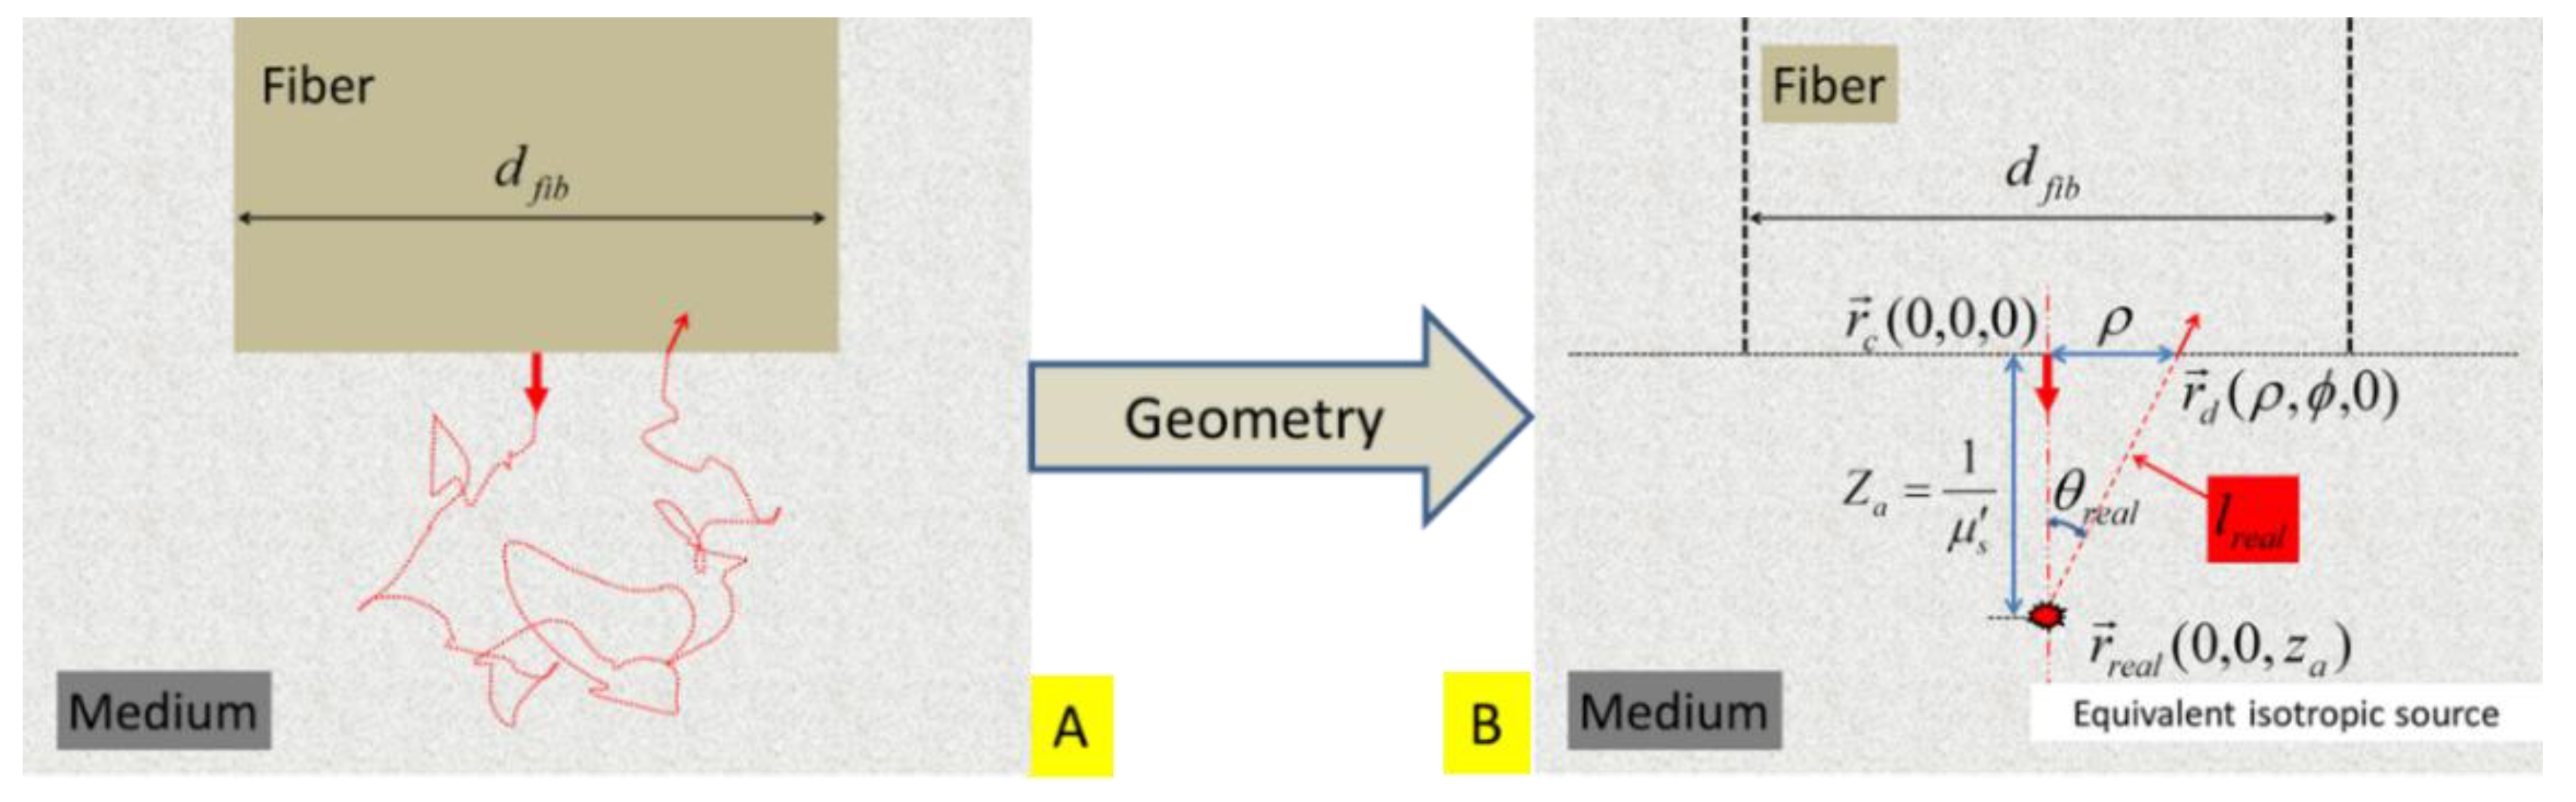
The single-fiber dual-point configuration to represent SfRS by using a straight-polished fiber embedded in the tissue is schematically illustrated in
Figure 2A. The associated path of a single photon trajectory is hypothesized in
Figure 2B. Under cylindrical coordinates of
, the following symbols and notations are introduced:
The center of the fiber facet is located at
. A point at the fiber facet is
, at which the position-specific photon fluence rate and flux are evaluated.
The light that is initially directionally-launched into the medium along the direction of the fiber axis is represented by an equivalent isotropic point source, with the same intensity of the incident light, that is located at
, where
[
38]. Note that the positive direction of the z-axis points away from the fiber or downward hereinafter through
Figure 3,
Figure 4 and
Figure 5.
The distance between the equivalent isotropic point source
and the detector point
is
. The acute angle formed by the line of
with respect to the axis of the fiber is
.
The radius of the fiber is denoted as
, or
, for convenience.
The refractive indices of the fiber and tissue are
and
, respectively. Generally
.
Figure 2.
(A) Schematic of an idealized geometry for placing a fiber with a diameter of
and a straight-polished tip within a turbid medium. The same fiber is used for launching light into and collecting light from the medium. A dual-point configuration approximates the light leaving and returning to the fiber. (B) The light that is initially directionally-launched into the medium is represented by an equivalent isotropic source that is located at
, where
. The distance between the equivalent source
and a detector point
is
. The acute angle formed by the line of
with respect to the axis of the fiber is
.
For a light of unit intensity that is launched into the medium at the center of the fiber facet, the photon fluence rate evaluated at
as a result of the equivalent isotropic point source of unity intensity at
is:
The photon flux evaluated at
is proportional to the spatial gradient of the photon fluence rate as the following:
where
is the unit vector pointing from
to
. The components of the photon flux that are parallel to the fiber facet will not contribute to the signal collected by the fiber, and only the axial component along the
direction will have the chance to cross the fiber facet. The photon flux at the medium side and reaching the fiber facet at point
in a direction normal to the fiber facet is:
The ratio of this normal component of photon flux that is transmitted across the fiber facet will be determined by the Fresnel formula of
, where
. The resulting photon flux at point
that is normal to and crosses the fiber facet is:
The total remission over the dimension of the fiber is then obtained by integrating
over the total area of the fiber facet as:
Note that
, then
, so Equation (9) changes to:
By expanding the exponential functions in Equation (10) up to the first order term in their respective Taylor series, the absorption dependence is removed to give the following RoR that is associated with the use of a straight-polished fiber in an infinite domain of tissue medium:
2.2. Ratio-of-Remission Associated with Steady-State Probing in a Semi-Infinite Tissue Geometry Using a Straight-Polished Fiber
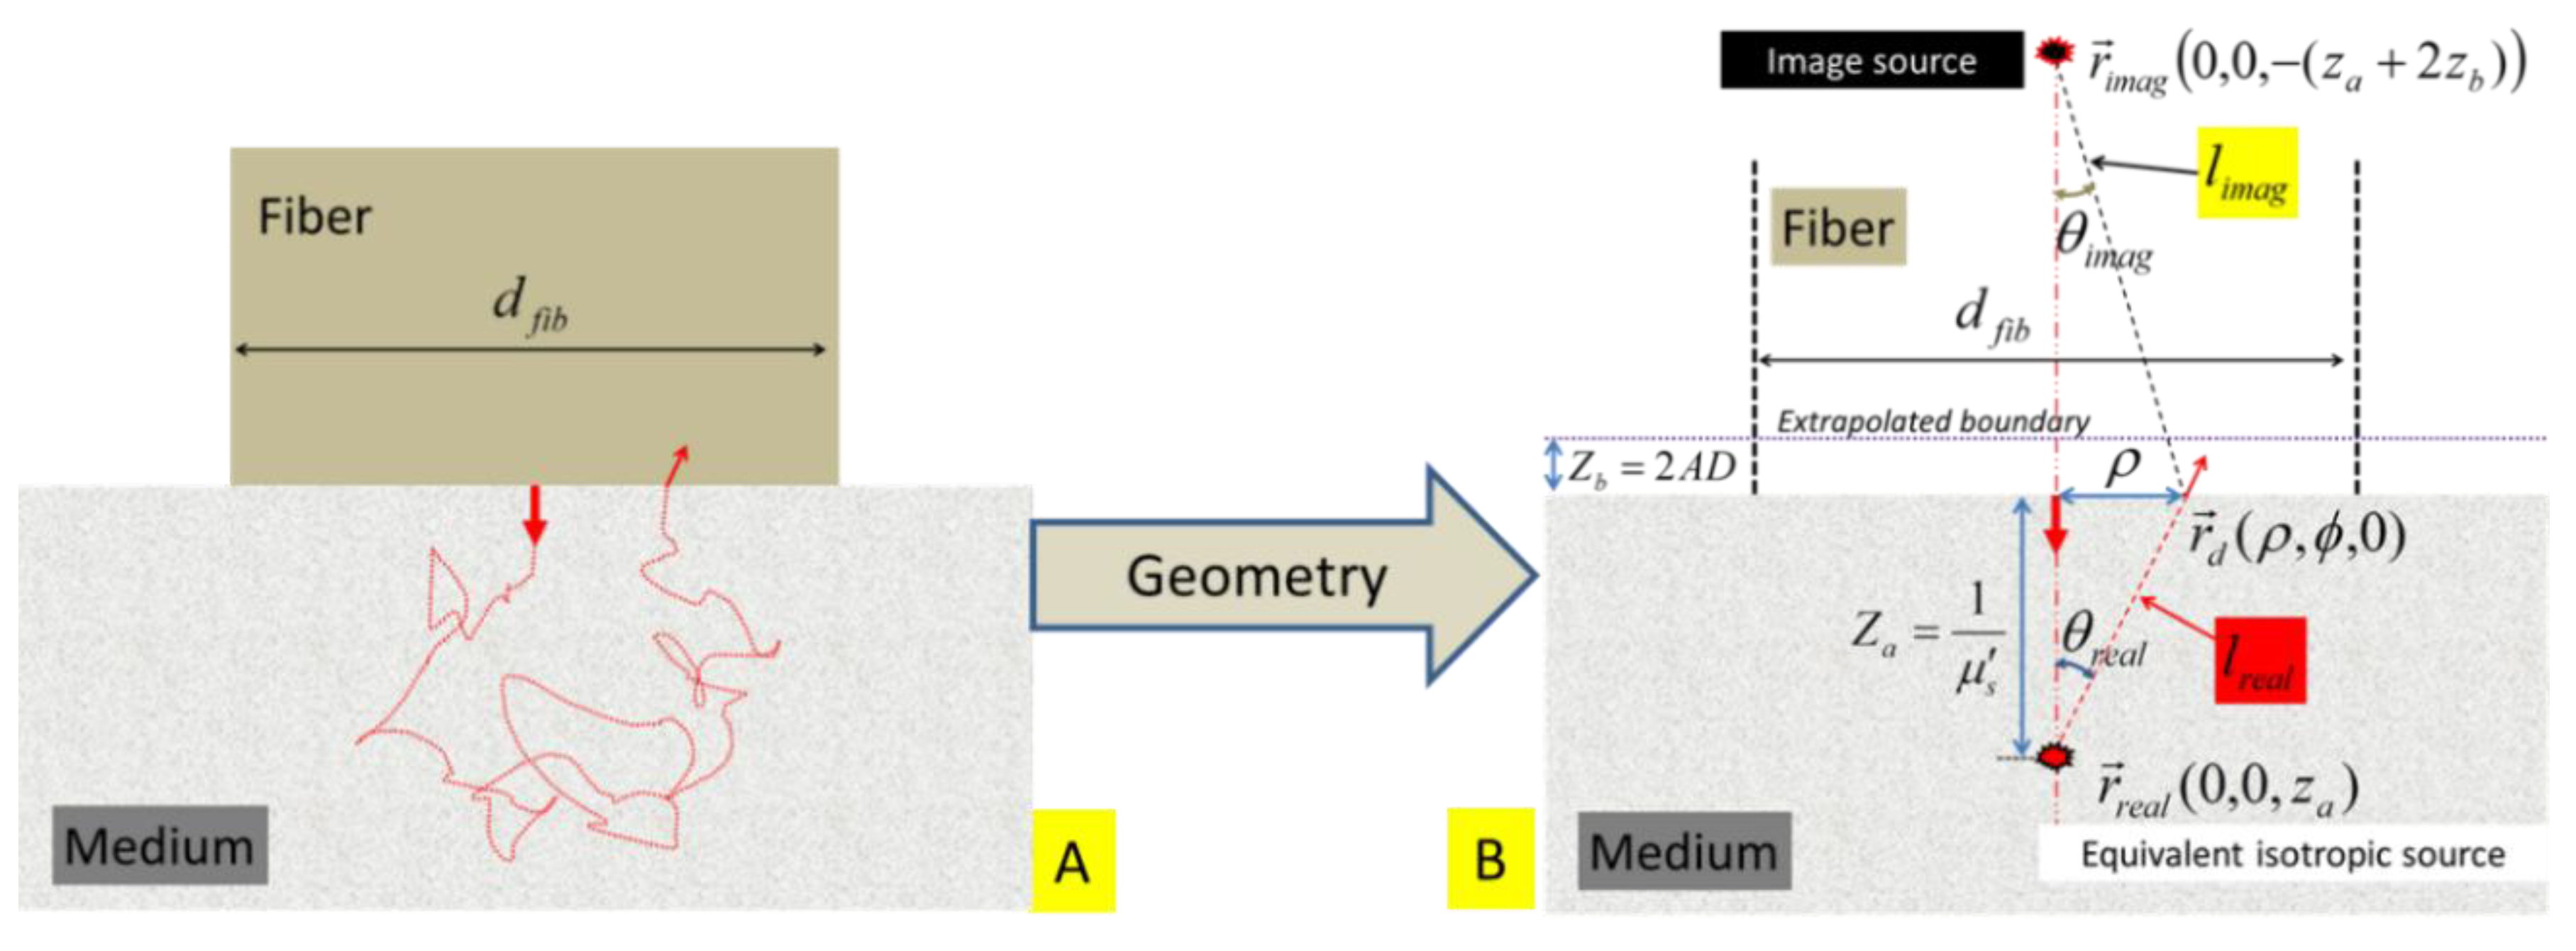
The single-fiber dual-point configuration to represent a straight-polished fiber in contact with the surface of a half-plane tissue is schematically illustrated in
Figure 3A. The associated path of a single photon trajectory, now in a semi-infinite medium geometry, is hypothesized in
Figure 3B. The symbols introduced in
Section 2.1 are used here whenever applicable. Additional symbols/entities in association with the semi-infinite geometry are given in the following section:
Figure 3.
(A) Schematic of an idealized geometry for placing a fiber with a diameter of
and a straight-polished tip at the surface of a turbid medium. The same fiber is used for launching light into and collecting light from the medium. A dual-point configuration approximates the light leaving and returning to the fiber. (B) The light that is initially directionally-launched into the medium is represented by an equivalent isotropic source that is located at
. The distance between the equivalent source
and a detector point
is
, and the acute angle formed by the line of
with respect to the axis of the fiber is
. An “extrapolated” boundary is located at
away from the physical boundary of the medium. The image of the source
with respect to the “extrapolated” boundary is located at
. The distance between the image source
and the detector point
is
. The acute angle formed by the line of
w.r.t the axis of the fiber is
.
![Photonics 01 00565 g003]()
The air-tissue interface is a semi-infinite planar boundary to the photon propagation. The boundary effect to the photon propagation in the medium can be accounted for by introducing an “extrapolated boundary” [
38,
39,
40,
41] on which the photon fluence rate is set zero.
The “extrapolated boundary” is located at a distance of
from the air-tissue interface, with
,
and
, where
is the refractive index of the air.
The equivalent isotropic point source is located at
. The image of the isotropic point source
with respect to the extrapolated boundary is located at
. The “image” source has the opposite intensity of the “real” source at
.
The distance between the “real” source
and the detector point
is
. The acute angle formed by the line of
with the axis of the fiber is
. The distance between the “image” source
and
is
. The acute angle formed by the line of
with the axis of the fiber is
.
The steady-state photon fluence rate at
is:
The photon flux at
is:
As only the axial component of the photon flux along the
direction will cross the fiber facet, the photon flux at the medium side and normal to the fiber facet at
is:
Then, the total remission crossing the dimension of the fiber facet is:
Note that setting
to infinity in Equation (15) arrives at the total diffuse reflectance from a semi-infinite boundary, which was previously derived in [
39] as Equation (20), scaled by
, as is shown in the following equation:
By expanding the exponential functions in Equation (15) up to the first order term in their respective Taylor series, the absorption dependence is removed to give the following RoR that is associated with the use of a straight-polished fiber in a semi-infinite domain of tissue medium:
2.3. Ratio-of-Remission Associated with Steady-State Probing in an Infinite Tissue Geometry Using an Angle-Polished Fiber
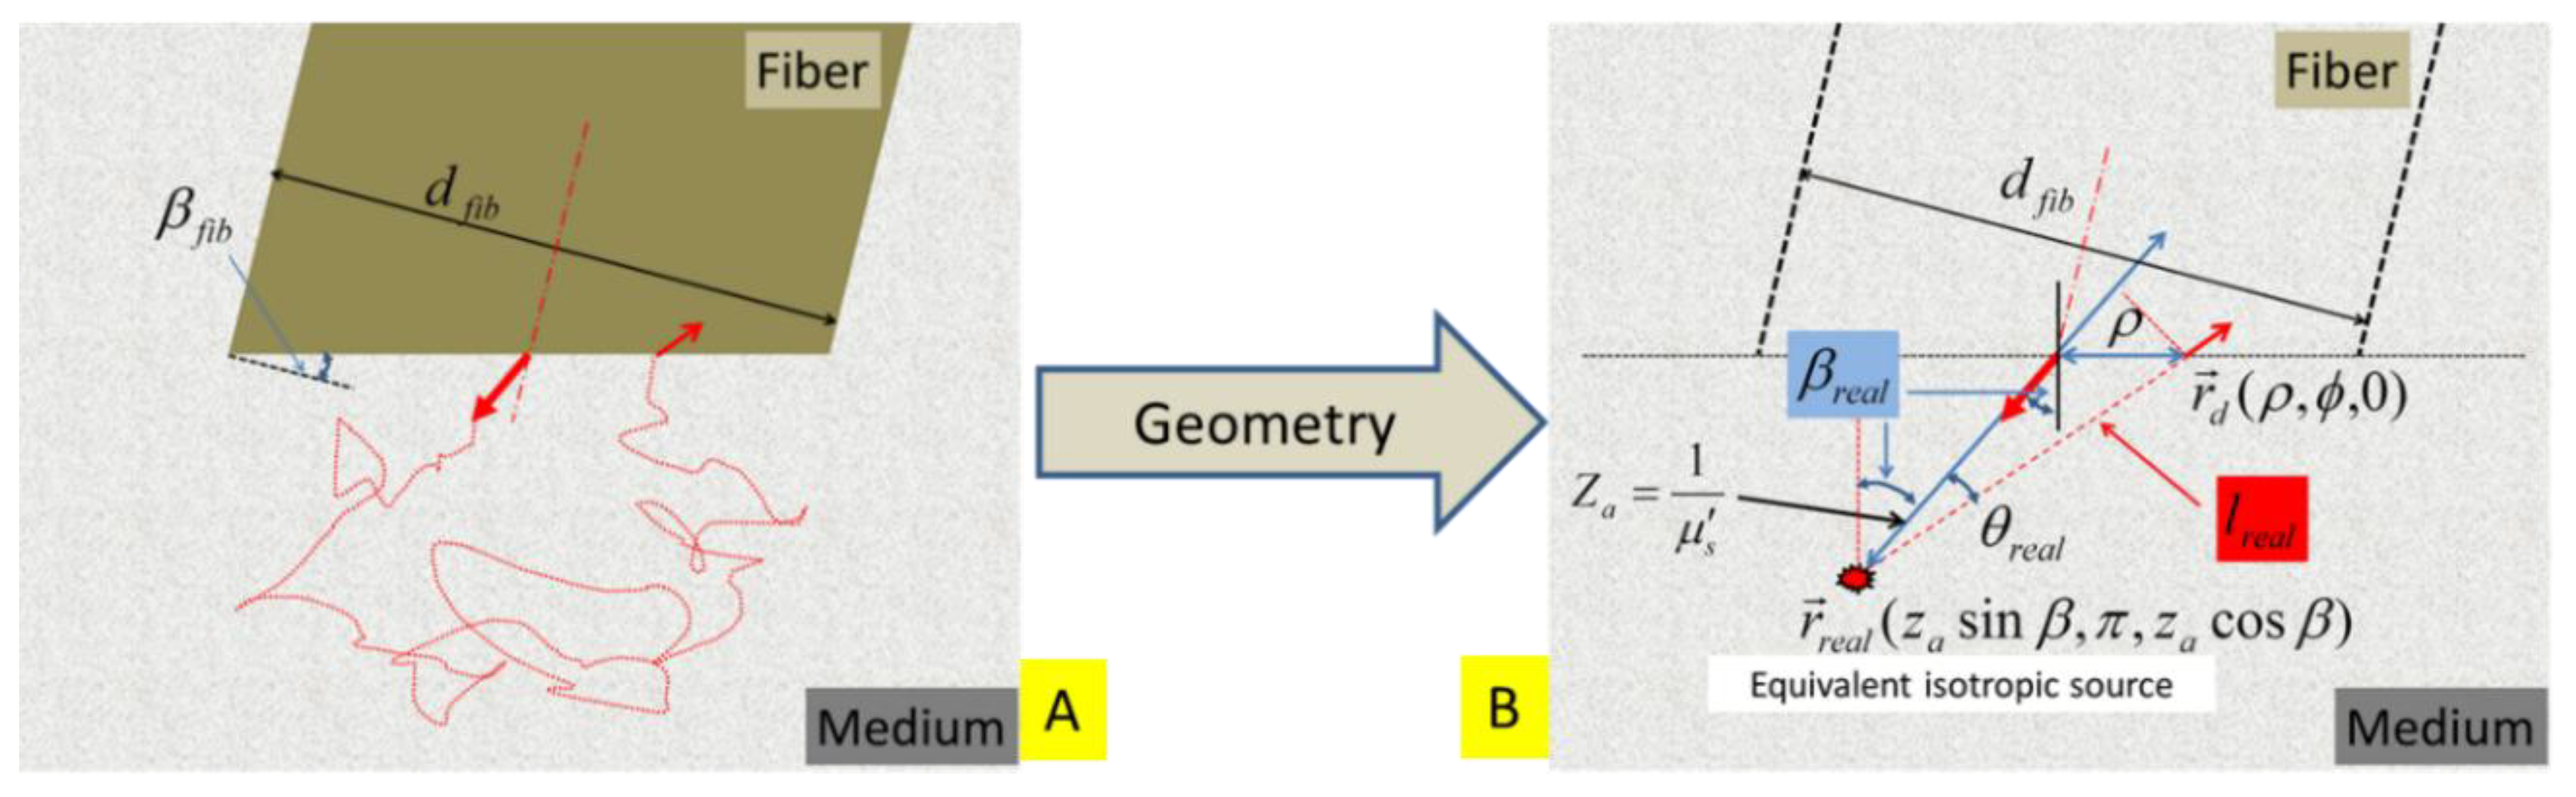
We consider the case of interstitial SfRS tissue probing using a fiber with the tip polished at an angle
, as conceptually illustrated in
Figure 4A. The single-fiber dual-point treatment to the photon trajectory, as is shown in
Figure 2B, needs to be modified to that shown in
Figure 4B. The symbols introduced in
Section 2.1 are used here whenever applicable. Additional symbols/entities in association with the angled fiber facet are given in the following section.
Figure 4.
(A) Schematic of an idealized geometry for placing a fiber with a diameter of
and an angle-polished tip within a turbid medium. The same fiber is used for launching light into and collecting light from the medium. A dual-point configuration approximates the light leaving and returning to the fiber. (B) The light that is directionally-launched into the medium along the fiber axis within the fiber refracts to an off-axis direction in the medium. As a result, the equivalent isotropic point source is located at an off-axis position of
, where
. The distance between the equivalent point source
and a detector point
is
.
The on-axis light leaves the fiber facet at an angle of
. The equivalent isotropic point source is located at
.
The distance between the equivalent isotropic point source
and the detector point
is
.
The steady-state remission crossing the fiber facet is found by following the approaches of
Section 2.1 and after some algebraic derivations to be:
As the angle of the fiber polishing
approaches zero, the RoR represented by Equation (18) expectedly reaches the one in Equation (10) that corresponds to the RoR of a straight-polished fiber. By expanding the exponential functions of Equation (17) up to the first order term in their respective Taylor series, the absorption dependence is removed to give the following RoR that is associated with the use of an angle-polished fiber in an infinite domain of tissue medium:
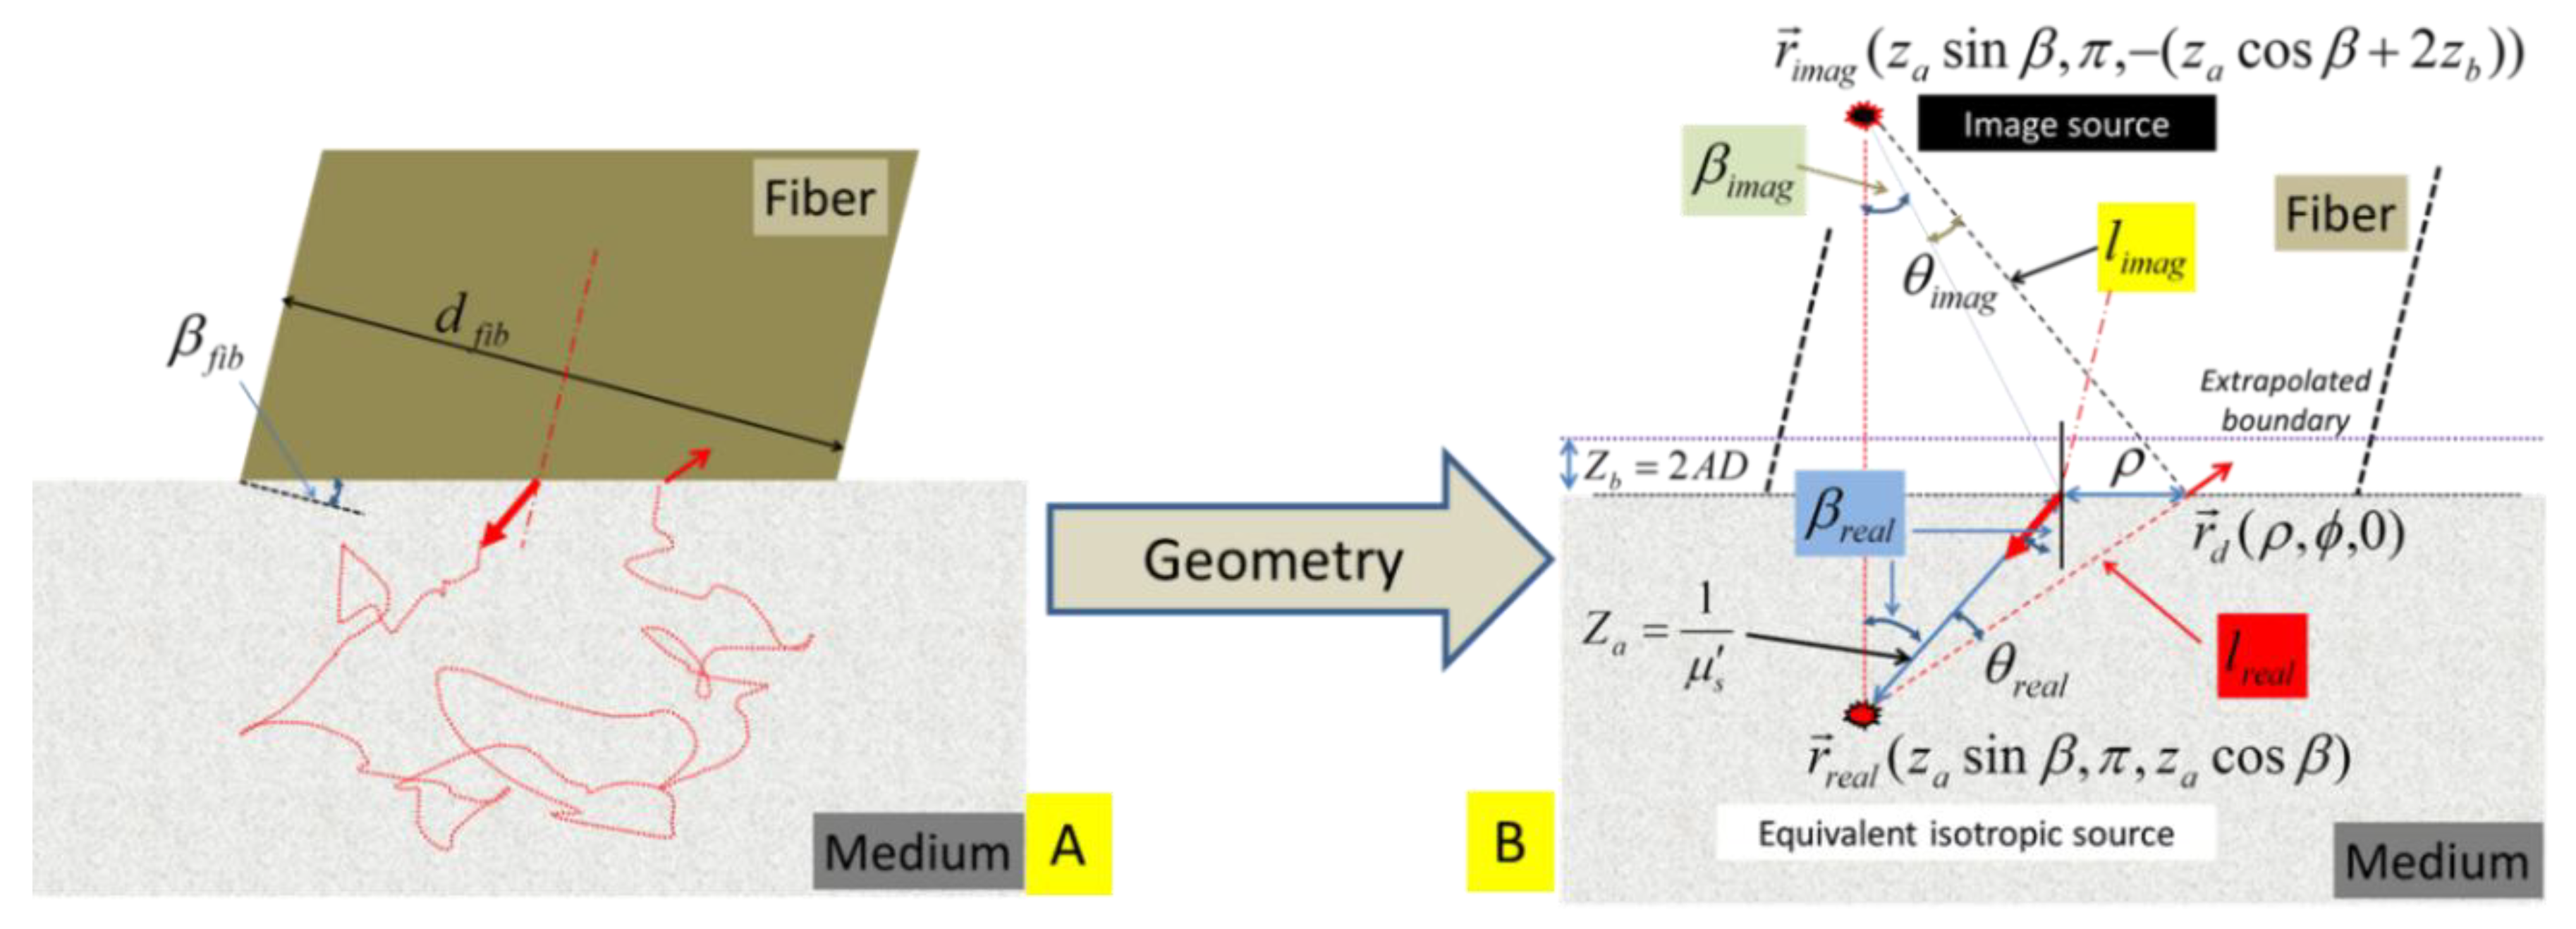
2.4. Ratio-of-Remission Associated with Steady-State Probing in a Semi-Infinite Tissue Geometry Using an Angle-Polished Fiber
We consider the case of surface SfRS tissue probing using a fiber with the tip polished at an angle
as conceptually illustrated in
Figure 5A. The single-fiber dual-point treatment to the photon trajectory in a semi-infinite tissue medium as is shown in
Figure 3B needs to be modified to that shown in
Figure 5B. The symbols introduced in
Section 2.2 are used here whenever applicable. Additional symbols/entities in association with the angled fiber facet are given in the following section.
The equivalent isotropic point source is located at
. The image of the isotropic point source with respect to the extrapolated boundary is located at
.
The distance between the “real” point source
and
is
. The distance between the image source and the detector point
is
, where
.
Figure 5.
(A) Schematic of an idealized geometry for placing a fiber with a diameter of
and an angle-polished tip at the surface of a turbid medium. The same fiber is used for launching light into and collecting light from the medium. A dual-point configuration approximates the light leaving and returning to the fiber. (B) The light that is directionally-launched into the medium along the fiber axis within the fiber refracts to the off-axis direction in the medium. As a result, the equivalent isotropic source is located at
. The distance between the equivalent source
and a detector point
is
. An “extrapolated” boundary is located at
, away from the physical boundary of the medium. The image of the source
w.r.t the “extrapolated” boundary is located at
. The distance between the image source
and the detector point
is
.
![Photonics 01 00565 g005]()
The steady-state remission crossing the fiber facet is found to be:
As the angle of the fiber polishing
approaches zero, the RoR represented by Equation (20) for the semi-infinite domain of medium geometry expectedly reaches the one in Equation (15) that corresponds to the RoR of a straight-polished fiber in the same domain. By expanding the exponential functions in Equation (18) up to the first order term in their respective Taylor series, the absorption dependence is removed to give the following RoR that is associated with the use of an angle-polished fiber in a semi-infinite domain of tissue medium:
3. Numerical Evaluation
By replacing
with
and
with
in the set of Equations (11), (17), (19), and (21), the RoR becomes a function of the dimensionless reduced scattering coefficient
, as represented, respectively, in the following for the four cases of probing the tissue with a single fiber:
The fiber with a straight-polished tip is inserted into the medium to form an infinite domain.
The fiber with an angle-polished tip is inserted into the medium to form an infinite domain.
The fiber with a straight-polished tip is placed in contact with the surface of the medium to form a semi-infinite domain.
The fiber with an angle-polished tip is placed in contact with the surface of the medium to form a semi-infinite domain.
The four cases of analytically-derived RoRs as represented by the set of Equation (19) are evaluated in
Figure 6 in comparison to the semi-empirical model of the RoR of Equation (2) over a range of
. The parameters for the semi-empirical RoR are chosen as p1 = 6.82, p2 = 0.969, p3 = 1.55, corresponding to those fitted for an HG scattering phase function with
g = 0.8 [
22]. Fitted parameters corresponding to the HG scattering phase function with other values of
g (0.5, 0.7, 0.9) and a modified HG scattering phase function of
g = 0.9 are tested. The chosen set of parameters associated with the HG phase function of
g = 0.8 leads to the closest patterns between estimation by the empirical equation and estimation by the one specific equation that corresponds to surface probing of the medium using angle-polished fiber (
i.e., 25). The red solid line pointed by two arrows corresponds to the “previous semi-empirical” model developed based upon MC studies and experimental measurements from a scattering medium, as specified by Equation (2). The two other solid lines correspond to using a straight-polished fiber in either in-medium probing or surface-probing configurations. The dashed line corresponds to using a 15° angle-polished fiber in an in-medium probing configuration, and the dotted line a surface-probing configuration.
Figure 6.
(A) Comparisons of analytically-derived ratios-of-remission (RoRs) corresponding to surface-probing or interstitial-probing using a straight- or angle-polished fiber probe, against semi-empirical RoR corresponding to an Henyey–Greenstein (HG) scattering phase function with g = 0.8. (B) The zoomed-up view of the plots enclosed by the dashed rectangle, as shown in (A). The red solid line with two arrows pointing at it corresponds to the “previous semi-empirical” model developed based on MC studies and experimental measurements from a scattering medium. The two other solid lines correspond to using a straight-polished fiber in either in-medium probing or surface-probing configurations. The dashed line corresponds to using a 15° angle-polished fiber in in-medium probing configuration, and the dotted line is the surface-probing configuration. The values corresponding to in-medium probing and surface-probing with the fiber of the same tip geometry merge at smaller values of the dimensionless reduced scattering coefficient. The values correspond to a straight-polished fiber and a 15° angle-polished fiber in the same condition of fiber placement with the medium converging at higher values of the dimensionless reduced scattering coefficient.
![Photonics 01 00565 g006]()
4. Discussion
Several observations can be made from
Figure 6, wherein the plot corresponding to the semi-empirical RoR is marked as the solid red line with the two long line-arrows point at it. Firstly, all of the four analytically-derived RoRs show a pattern of monotonic increase
versus
until approximately
> 10, when approaching an asymptotic limit for high dimensionless, reduced scattering values. Secondly, the surface-probing RoR and interstitial-probing RoR are indistinguishable (at the scale shown) at relatively low dimensionless, reduced scattering values of
< 1, but differ significantly at high dimensionless, reduced scattering values of
> 10. At high dimensionless, reduced scattering values, the surface-probing RoR can be as high as twice f the interstitial-probing RoR. The existence of the medium boundary in the surface-probing configuration will cause some photons reaching the boundary to be back-reflected into the medium, adding to the total number of scattering occurring within the medium domain in the vicinity of the probing fiber. The net effect is the essential increase of the number of photons to be scattered into the probing-fiber in surface-probing configuration when comparing to in-medium probing configuration for otherwise identical medium optical properties. Thirdly, the RoR using angle-polished fiber and RoR using straight-polished fiber are indistinguishable (at the scale shown) at high dimensionless, reduced scattering values of
> 10, but differ significantly at relatively low dimensionless, reduced scattering values of
< 1. At low dimensionless, reduced scattering values, the RoR using angle-polished fiber can be significantly higher than the RoR using straight-polished fiber. The increased remission associated with using 15° angle-polished fiber compared to using straight-polished fiber has been suggested to relate to the increased fiber face, as the 15° angle-polished fiber has an elliptical cross-section that is about 3% larger than the circular cross-section [
22]. We note that as the angle-polished fiber pulls the effective isotropic source closer in depth to the fiber face, the remission obtained by an angle-polished fiber will increase beyond the increase rendered by the bigger fiber face of an elliptical cross-section compared to a circular cross-section of a straight-fiber. Lastly, the analytically-derived RoR corresponding to surface-probing using a 15° angle-polished fiber nearly coincides with the semi-empirical RoR corresponding to an HG scattering phase function with
g = 0.8.
The observation of the agreement between analytical RoR of surface-probing using a 15° angle-polished fiber and semi-empirical RoR corresponding to an HG scattering phase function with g = 0.8 is particularly interesting. It is noted that the experimental reports in [
21] that validated the empirical RoR were performed at a semi-infinite surface-probing geometry that was in accordance with the geometry of the MC [
42]. It is therefore not surprising that it is the RoR derived from surface-probing, not interstitial-probing, medium geometry that shall agree with the semi-empirical results over the range of
> 10.
Given the agreements between the analytically-derived RoR, with the semi-empirical one notwithstanding, the current analytical treatment is based on isotropic scattering, thereby being incapable of modeling the effect of anisotropic scattering phase function on the remission of photons, particularly in the position near the point-of-entry, as is the case of SfRS. Vitkin
et al. [
43] recently introduced a method to accurately model photon diffusion near the point-of-entry in anisotropically scattering media. Their approach decomposes the diffuse reflectance associated with a semi-infinite medium-boundary to one part resulting from diffusion approximation and a new part derived for correcting the anisotropic phase function. The phase function-dependent term of the photon fluence rate at a position of
) can be derived from [
43] as:
where
p is the actual phase function. It is straightforward to anticipate that incorporating Equation (20) into the analytical approach presented in this work to account for the anisotropic portion of the scattering may result in an analytically-originated formulation of the RoR that responds to the difference in the scattering phase function and anisotropy factor. It is, however, noteworthy to argue that Equation (20) was derived in association with a semi-infinite medium geometry in [
43]. It is therefore speculated that a term like Equation (2) that accounts for the anisotropic scattering would have the boundary effect built-in. Once such a boundary-effect term is identified, the contribution to the remission in different SfRS configurations by anisotropic scattering can be isolated according to the analytical procedures demonstrated in this work to possibly reach a set of closed-form solutions. On the other hand, the analytical procedures explored in this work in the condition of isotropic medium scattering are extendable to SfRS in time-of-flight measurements and the fluorescence domain, which may be reported in future publications.


