Article

Liquid Carbon Reflectivity at 19 nm

by
Riccardo Mincigrucci
1,2,*,
Erika Giangrisostomi
2,3,
Emiliano Principi
2,
Andrea Battistoni
2,3,
Filippo Bencivenga
2,
Riccardo Cucini
2,
Alessandro Gessini
2,
Maria Grazia Izzo
2 and
Claudio Masciovecchio
2
1
Dipartimento di Fisica e Geologia, Università degli Studi di Perugia, Via A. Pascoli, 06123 Perugia, Italy
2
Elettra-Sincrotrone Trieste, SS 14 - km 163.5, 34149 Basovizza, Trieste, Italy
3
Dipartimento di Fisica, Università degli studi di Trieste, via A. Valerio 2, I-34127 Trieste, Italy
*
Author to whom correspondence should be addressed.
Photonics 2015, 2(1), 50-56; https://doi.org/10.3390/photonics2010050
Submission received: 15 December 2014 / Accepted: 5 January 2015 / Published: 9 January 2015
(This article belongs to the Special Issue Extreme UV Lasers: Technologies and Applications)

Abstract

:
We hereby report on a pump-probe reflectivity experiment conducted on amorphous carbon, using a 780 nm laser as a pump and a 19 nm FEL emission as probe. Measurements were performed at 50 degrees with respect to the surface normal to have an un-pumped reflectivity higher than 0.5%. A sub-10 fs time synchronization error could be obtained exploiting the nearly jitter-free capabilities of FERMI. EUV FEL-based experiments open the way to study the behaviour of a liquid carbon phase being unaffected by plasma screening.

1. Introduction

The phase diagram [1] of liquid carbon and in particular the existence of two liquid phases are debated [2,3,4] mostly because of the experimental difficulties to obtain such an elusive state. The liquid phase can be reached only at temperatures of ~5000 K, well above that tolerable by any vessel. Moreover, when heated at room pressure, carbon is inclined to directly sublimate. Such difficulties demand an ultra-fast technique able to generate and probe such short living liquid state. In the past, pump-probe experiments have been carried out on different carbon samples using probe energies in the 1–5 eV range [5]. Due to the small region of wavelengths explored and to plasma screening effects, these experiments were not conclusive on the nature of such a state. In literature is discussed [3,6] the possible existence of two liquid phases with different electrical properties. To well characterize the conductivity of liquid carbon, a broadband reflectivity investigation in the EUV region could be conducted. Photons with energies exceeding the carbon plasmon energy 27–33.8 eV [7] can penetrate the plasma itself thus being sensible to the bulk of a sample. Moreover, a broadband reflectivity study, by the exploitation of the Kramers-Kronig relations [8], can give access to the complex dielectric function and so, ultimately, to the electrical conductivity of the material [9]. Finally, a time resolved pump-probe technique allows to study the evolution of such properties in the time domain. This is beyond the aim of this paper. Here we present a test pump-probe measurement conducted on amorphous carbon (a-carbon), using a Free Electron Laser (FEL) source at 19 nm as probe and a 780 nm laser as pump. The experimental set-up is as well presented. A broadband time-resolved study, mandatory for a deeper comprehension of the liquid phase, would be our next step.

2. Experimental Section

The experiment was conducted in a pump-probe scheme at a photon energy of the probe well above the carbon plasmon energy of 27–33.8 eV [7]. It was performed at the end station EIS-TIMEX, at the FERMI FEL, which operates in the wavelength range of 4–100 nm. FERMI and EIS-TIMEX can represent a privileged tool for such kind of experiments thanks to the offered tunability in the EUV regime and pump-probe capabilities. It is worth stressing that FERMI allows conducting nearly jitter-free pump-probe experiments. Contrary to the other FEL facilities (SLAC, XFEL, SCSS, FLASH), FERMI is a seeded source. The seeding procedure has two major advantages for our purpose: it permits to continuously tune the FEL wavelength and to have an excellent temporal synchronization between the pump and probe pulses. A common master oscillator triggers the generation of the electron bunch, the acceleration of the bunch itself and the generation of an Infra Red (IR) pulse in a Ti:sapphire amplifier. A fraction of this IR pulse passes trough an Optical Parametric Amplifier rendering a tunable UV pulse that is used to seed the FEL generation process [10,11]. An other portion of the IR laser pulse is transported to the end stations through a dedicated optical path. In this way the FEL and the IR laser pulses to be used in pump-probe experiments are intrinsically synchronized [12].

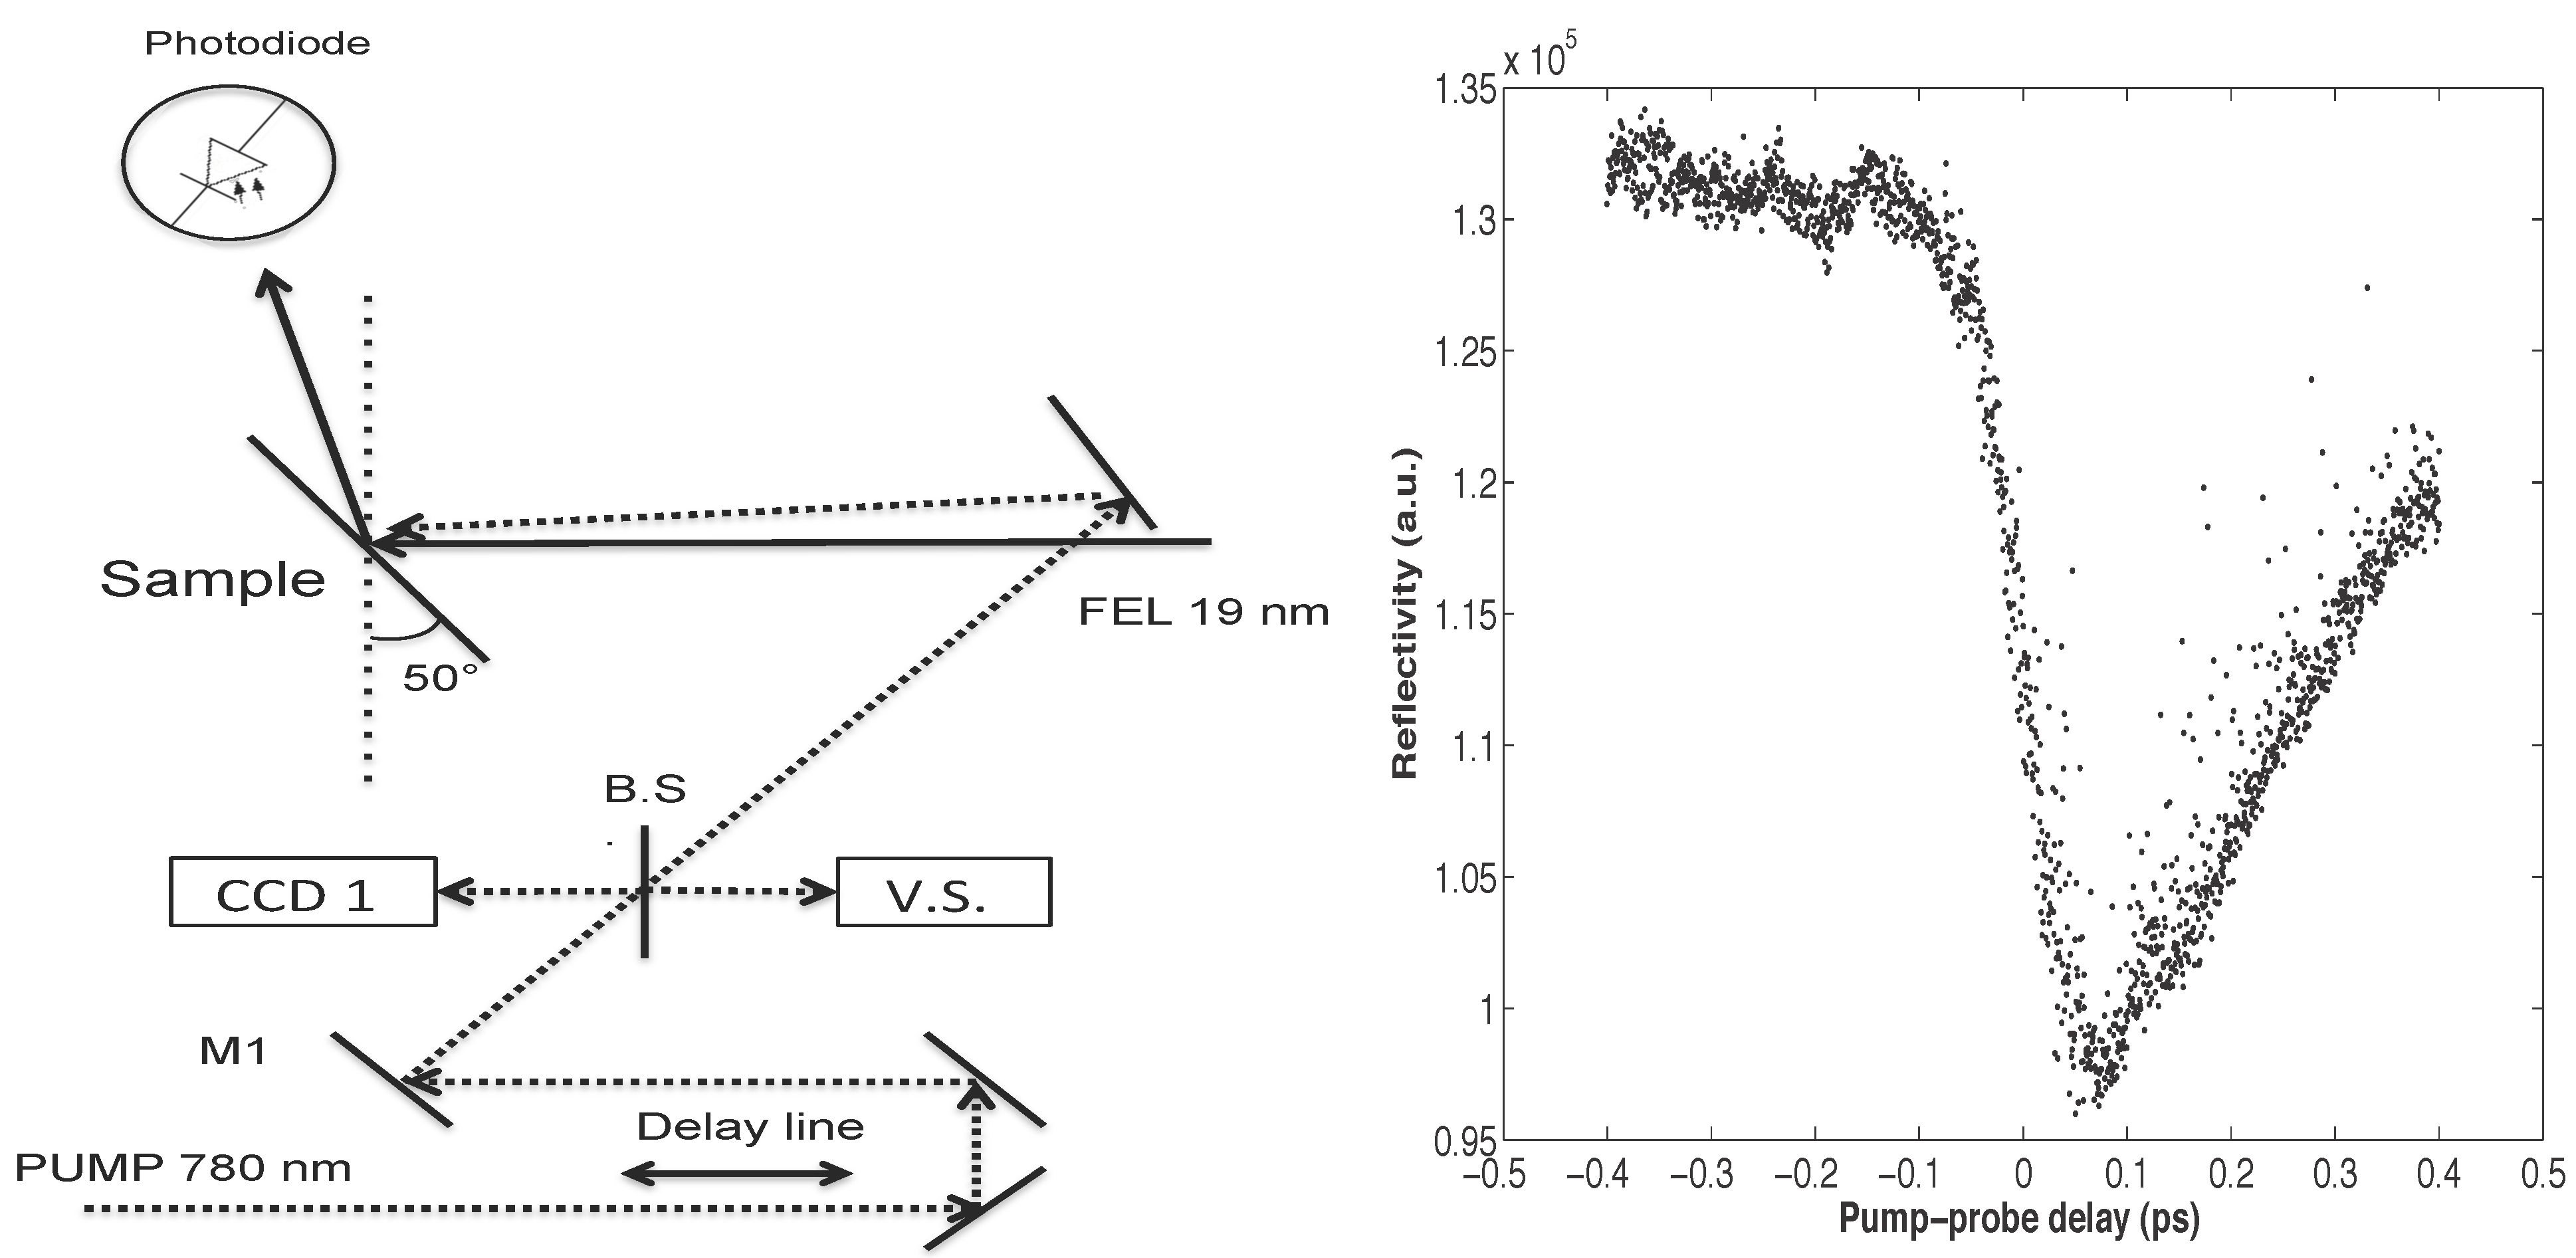
2.1. Experimental Apparatus

The experimental apparatus is shown in Figure 1.
Figure 1. Sketch of the experimental set-up (left panel) with a-carbon tilted of 50 degree with respect to the Free Electron Laser (FEL) beam at 19 nm. The pump laser impinges on the sample roughly collinear to FEL. The beam splitter (B.S.) is used to stabilize the pump laser position thanks to the feedback in the virtual sample (V.S.). CCD 1 is used for the temporal superposition, see text for details. Right panel shows the reflectivity change in Si 3 N 4 .
Photonics 02 00050 g001
The sample is a layer of a-carbon (70 nm thickness), deposited on a thick substrate of silicon with 1 nm roughness. The height and width of the sample are respectively 3 and 10 cm. The experiment was conducted with the sample normal rotated at 50 degrees with respect to the FEL beam at 19 nm in order to have a reflectivity higher than 0.5%. The FEL beam was focussed by a gold coated ellipsoidal mirror to a Gaussian spot of 90 μ m full width half maximum (FWHM). The reflectivity was measured using an AXUV photodiode by Opto Diode Corp., screened by 100 nm of aluminum to filter out the 780 nm pump radiation. In this configuration the overall transport efficiency of the a-carbon plus aluminum filter is expected to be 5 × 10 - 8 [13]. The pump pulse, focussed to a spot of 100 μ m FWHM, was spatially overlapped to the FEL pulse on a Yttrium Aluminum Garnet doped with Cerium, (YAG:Ce, 500 μ m of nominal thickness manufactured by Crytur ) screen defining a fixed point ( X s ) in the laboratory frame. The YAG:Ce screen was used to measure the dimensions of the spots, looking directly to fluorescence emission with a calibrated Questar QM-100 microscope. The microscope was regulated to see at focus only the fixed point X s . The temporal overlapping was conducted placing a Si 3 N 4 crystal in X s and tilted to back reflect the IR laser pulse. A Basler Scout CCD ( CCD1, Figure 1, left panel) recorded the IR laser pulse reflectivity of the FEL-pumped crystal as a function of the delay between the two pulses [12]. The time at which the reflectivity change reaches one half of the total drop (30% of the un-pumped reflectivity [12]), has been defined has the time of temporal overlapping T s between the two pulses (Figure 1, right panel). After the spatial/temporal overlapping has been defined, the a-carbon was moved to X s and the IR laser intensity raised to 43 μ J , high enough to induce a clear visible damage of the surface. The IR laser intensity fluctuations were below 5% RMS [11]. Small corrections to the spatial superposition were done rising the FEL intensity over 1 μ J and looking at the damage craters of both the FEL and of the IR laser beams. After this check, the FEL intensity was decreased of the 25% inserting in the FEL path a 200 nm—thick aluminum filter. The wider pump pulse spot and the fine superposition ensure the probing of an homogeneous excited sample. The pulse duration are of 100 fs for the IR laser and of 62 fs for the FEL. The measurement was conducted as function of the delay between the two pulses. The spatial stability of the pump pulse was ensured by a piezo driven feedback: a CCD checks the pump beam position in a virtual sample and shot-by-shot compensates by tip-tilting M1 (see Figure 1, left panel). For each delay we recorded the un-pumped, pumped, and post-shot (t = ) reflectivities. After each pump-probe sequence the sample was automatically moved of 150 ± 5 μ m , to a fresh position. The positioning in X s was verified and corrected shot-by-shot looking at the microscope image, ensuring the spatio-temporal overlap. Sample deviation from flatness has been corrected with the same procedure. The pump-probe sequence defined above was repeated 5 times for each delay, to have a minimum of statistics. The reflectivity values as well as other relevant machine parameters (FEL intensity, delay between the two pulses, FEL spectrum) were recorded by the FERMI real time infrastructure [14].

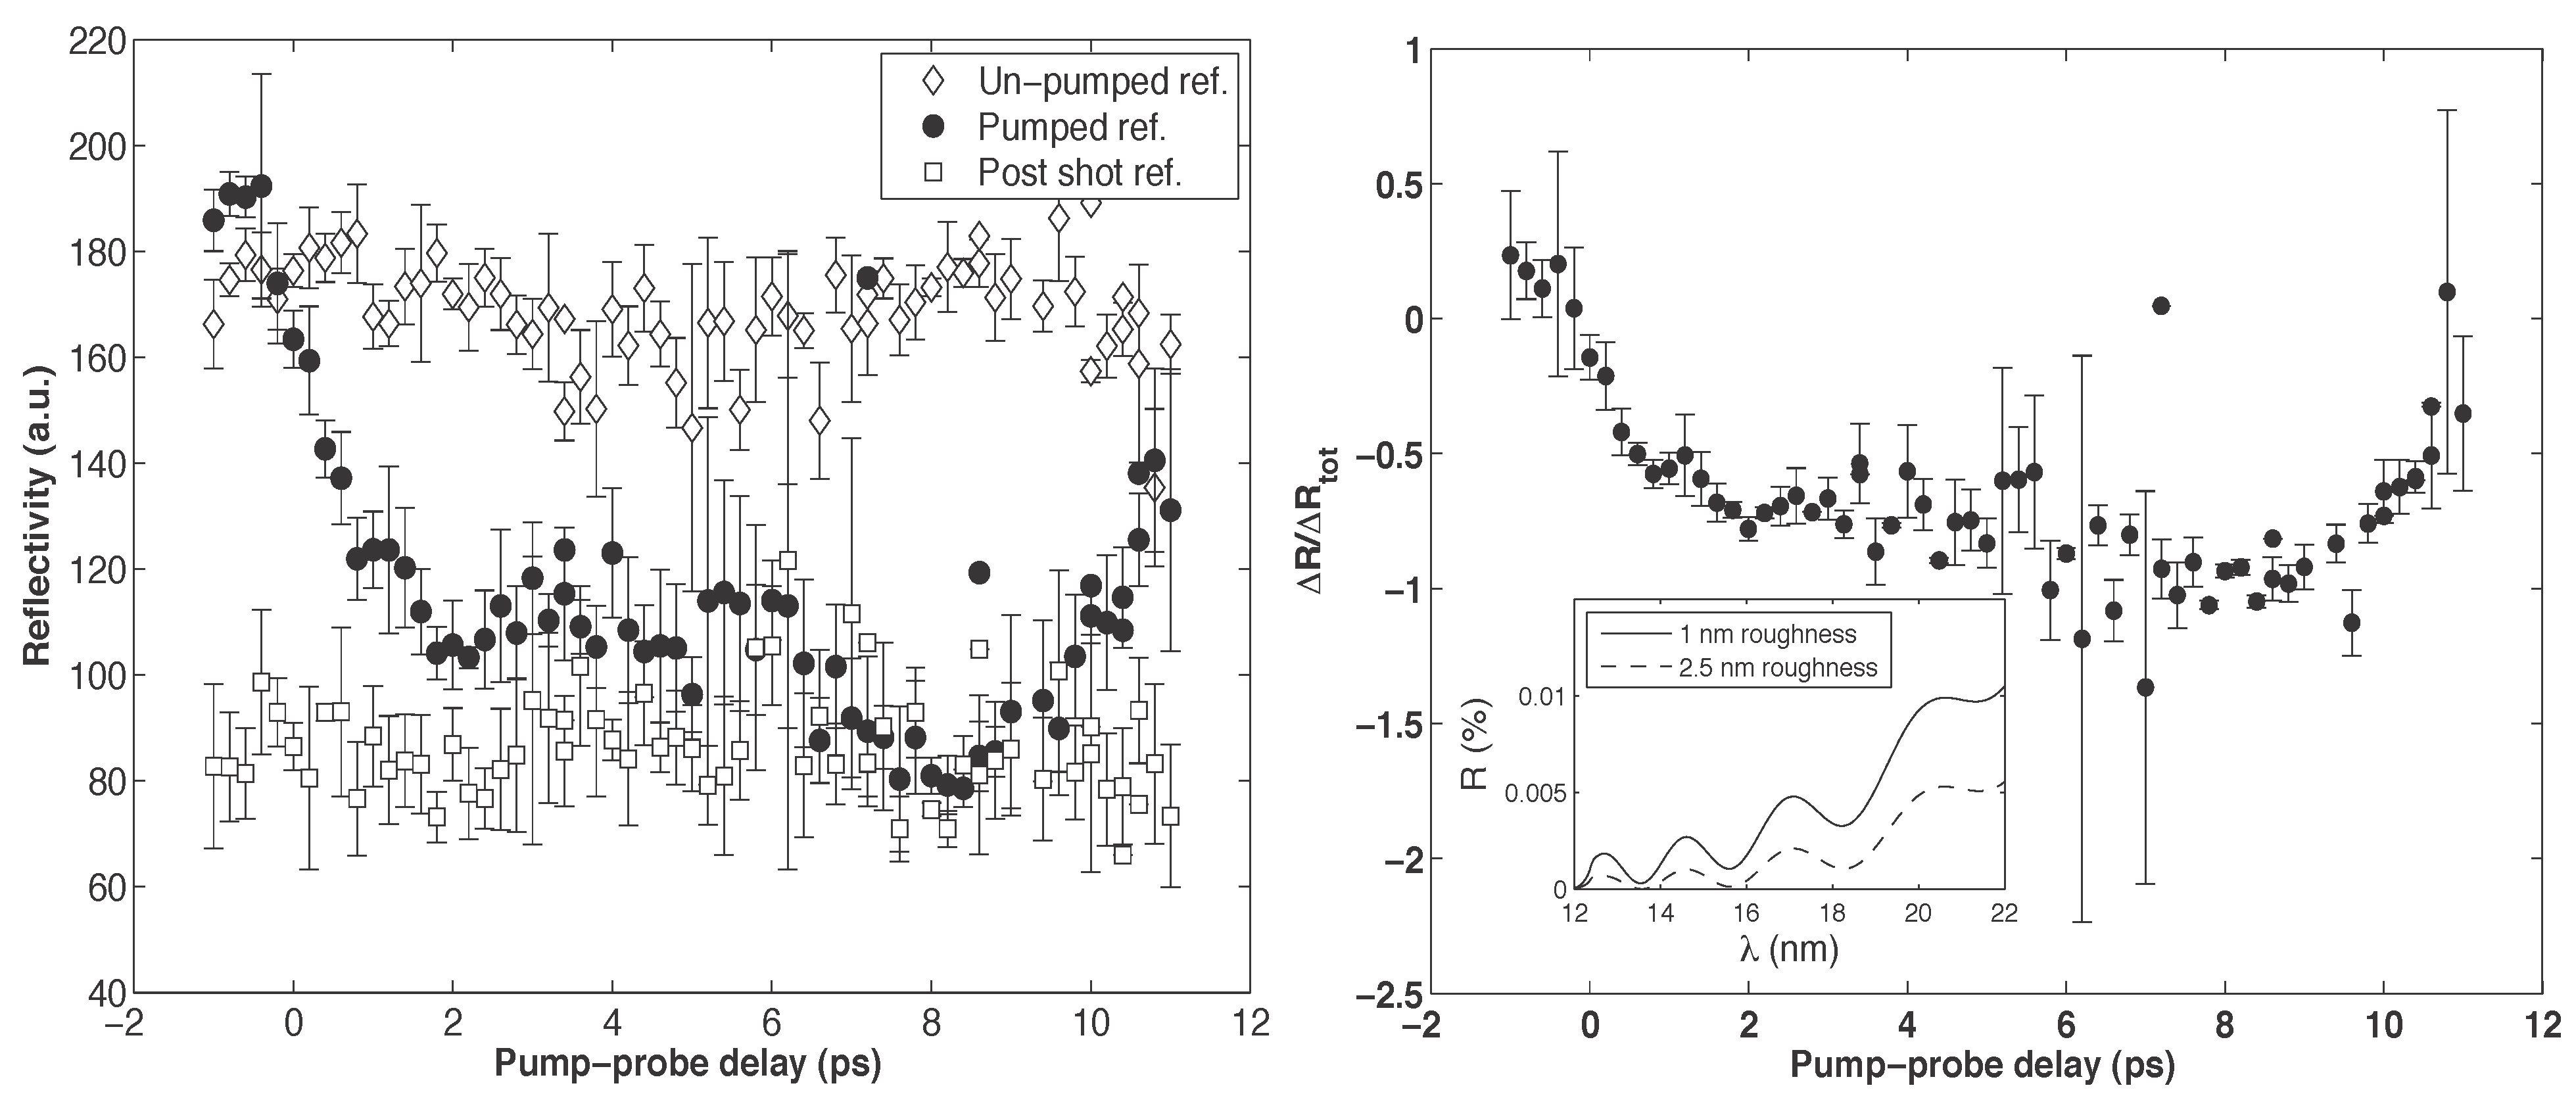
3. Results and Discussion

The experimental points reported in Figure 2 result from binning data relative to a same pump-probe delay. Before binning each reflectivity point was normalized to the proper FEL intensity. The reported errors are one standard deviation. The plasma emission contribution to the error bars has been neglected. The un-pumped reflectivity and the post-shot one should ideally be unaffected by the delay change. In practice the un-pumped reflectivity estimates the change of reflectivity due the sample surface impurities and roughness, while the post-shot reflectivity reflects the changes due to the substrate heterogeneities. The superposition of the pumped series with the un-pumped one (negative delays) and with the post-shot (4–8 ps) ensures that any contribution due to the un-screened pump pulse adds equally to the three series. This contribution is eliminated in the normalization process explained below. The pumped series (solid circles) shows a clear change in reflectivity. The post-shot reflectivity (open squares, Figure 2) shows a constant trend with a value of the 60% inferior to the un-pumped series. The used IR fluence of 0.43 μ J /cm 2 , is well above the reported damage threshold for a diamond like carbon film of 0.16 μ J /cm 2 [15] and suggests an ablation of carbon layer from the substrate. This is confirmed also by the visual inspection of the sample. In Figure 2 right panel we show the relative change in reflectivity with respect to the un-pumped value ( Δ R ) normalized to the total change of reflectivity ( Δ R tot ). This procedure is useful to compensate for the sample heterogeneities and for a bias given by a residual fraction of the pump pulse that can reach the detector. The decrease that occurs in the 0–2 ps range can be explained with an increased roughness of the carbon surface due to the structural increased disorder during melting (Figure 2, inset in the right panel). The small reflectivity bump/oscillation in the 2–6 ps range (Figure 2 left panel), can be attributed to dishomogeneities in the sample since a similar trend can be recognized in the un-pumped reflectivity. In fact, a normalization to the total change of reflectivity Δ R tot (Figure 2 right panel), i.e., the difference between the un-pumped and the post-shot value, compensate to some extent for this effect. The errors have been calculated propagating the uncertainties. The negative sign underlines the decrease of reflectivity with respect to the un-pumped value. No clear structures or trend could be evidenced in this time region due to small statistics. In the 8–11 ps range the reflectivity shows a recovery toward the un-pumped value. This is compatible with an attenuation of the structural disorder due to the atomic system cooling.
Figure 2. Measured reflectivity in arbitrary unit (left panel) of the a-carbon, before the pump-pulse (open diamond), with a delay after the pump-pulse (black circles) and at t = (open squares). Right panel shows the temporal trend of the percentage reflectivity change between the pumped and un-pumped series normalized to the total reflectivity change of the sample. The inset in the right panel shows the change of reflectivity due to an increased surface roughness.
Photonics 02 00050 g002

4. Conclusions

Similar experiments were already conducted in literature [2,16,17,18] being not conclusive due to plasma mirror effect and to the short range of wavelengths explored. The study of the reflectivity of liquid carbon in the EUV region is unaffected by those issues and suggests the FEL reflectivity measurements as a promising technique to reach a deeper comprehension on the liquid carbon phase. The sensibility to the structural variations in the few ps range can bring to the observations of metastable phases, as the low density liquid phase is. To exploit the Kramers-Kronig relations, the reflectivity at all frequencies should be known. This is of course unfeasible, so the reflectivity measurement has to be conducted in a range that permits to extrapolate the reflectivity behaviour. The 284 (K edge)–27 (plasmon energy) eV range, represents a good starting point. Beye et al. [19], using a different approach, demonstrated the existence of a liquid-liquid transition in silicon using a 0.2% precision. A similar level of accuracy is needed to evidence the presence of structures, related to the different phases in the time dependent reflectivity, while the structural disorder increase during melting can be used to explain the reflectivity decrease in the 0–2 ps range. A better statistics should also clarify the existence of the bump/oscillation in the 2–6 ps range. The reflectivity recovery should be investigated and confirmed expanding the delay range, since ultimately the reflectivity value should tend to the post-shot one. No clear conclusion can be stated due to the high uncertainties of the measurement. In light of these considerations, this work represents a proof of principle of the measurement feasibility.

Author Contributions

R.M. prepared the manuscript, R.M., F.B., E.P. and E.G. discussed the data, R.M., E.G., E.P. and A.G. prepared the experimental set-up, R.M. and E.G. conducted the experiment, all the authors discussed the data analysis and revised the manuscript.

Conflicts of Interest

The authors declare no conflict of interest.

References

  1. Bundy, F.P.; Bassett, W.A.; Weathers, M.S.; Hemley, R.J.; Mao, H.K.; Goncharov, A.F. The pressure-temperature phase and transformation diagram for carbon; updated through 1994. Carbon 1996, 34, 141–153. [Google Scholar] [CrossRef]
  2. Savvatimskiy, A.I. Measuremnts of the melting point of graphite and the properties of liquid carbon (a review for 1963–2003). Carbon 2005, 43, 1115–1142. [Google Scholar] [CrossRef]
  3. Togaya, M. Pressure dependence of the melting temperature of graphite and the electrical resistivity of liquid carbon. Phys. Rev. Lett. 1997, 79, 2474–1477. [Google Scholar] [CrossRef]
  4. Galli, G.; Martin, R.M.; Car, R.; Parriniello, M. Ab initio calculation of properties of carbon in the amorphous and liquid state. Phys. Rev. B 1990, 42, 7470–7482. [Google Scholar] [CrossRef]
  5. Reitze, D.H.; Ahn, A.; Downer, M.C. Optical properties of liquid carbon measured by femtosecond spectroscopy. Phys. Rev. B 1992, 45, 2677–2693. [Google Scholar] [CrossRef]
  6. Togaya, M. Electrical Property Changes of Liquid Carbon under High Pressures. J. Phys. Conf. Ser. 2010, 215, 012081. [Google Scholar] [CrossRef]
  7. Calliari, L.; Fanchenko, S.; Filippi, M. Plasmon features in electron energy loss spectra from carbon materials. Carbon 2007, 45, 1410–1418. [Google Scholar] [CrossRef]
  8. Ashcroft, N.W.; Mermin, N.D. Solis State Physics; Winston, Holt Rinehart, Ed.; Saunders College: Philadelphia, Pennsylvania, USA, 1976; pp. 776–779. [Google Scholar]
  9. Dresselhaus, R.S. Solid State Physics Part II Optical Properties of Solids. Available online: http://web.mit.edu/course/6/6.732/www/6.732-pt2.pdf (accessed on 5 January 2015).
  10. Allaria, E.; Appio, R.; Badano, L.; Barletta, W.A.; Bassanese, S.; Biedron, S.G.; Borga, A.; Busetto, E.; Castronovo, D.; Cinquegrana, P.; et al. Highly coherent and stable pulses from the FERMI seeded free-electron laser in extreme ultraviolet. Nat. Photonics 2012, 6, 699–704. [Google Scholar] [CrossRef]
  11. Free Electron Laser for Multidisciplinary Investigations. Available online: https://www.elettra.trieste.it/FERMI/index.php?n=Main.CDRdocument (accessed on 5 January 2015).
  12. Danailov, M.B.; Bencivenga, F.; Capotondi, F.; Casolari, F.; Cinquegrana, P.; Demidovich, A.; Giangrisostomi, E.; Kiskinova, M.P.; Kurdi, G.; Manfredda, M.; et al. Towards jitter-free pump-probe measurements at seeded free electron laser facilities. Opt. Express 2014, 22, 12869–12879. [Google Scholar] [CrossRef] [PubMed]
  13. RefractiveIndex.INFO Refractive index database. Available online: http://refractiveindex.info/?shelf=main&book=C&page=Hagemann (accessed on 5 January 2015).
  14. Borghes, R.; Chenda, V.; Curri, A.; Kourousias, G.; Lonza, M.; Prica, M.; Pugliese, R. A common software framework for FEL data acquisition and experiment management at FERMI. In Proceedings of ICALEPCS2013, San Francisco, CA, USA, 6–11 October 2013.
  15. Dumitru, G.; Romano, V.; Weber, H.P.; Pimenov, S.; Kononenko, T.; Sentis, M.; Hermann, J.; Bruneau, S. Femtosecond laser ablation of diamond-like carbon films. Appl. Surf. Sci. 2004, 222, 226–233. [Google Scholar] [CrossRef]
  16. Tosin, P.; Lüthy, W.; Weber, H.P. Liquid carbon observed with reflection measurements on CVD-diamond under UV pulsed-laser irradiation. App. Surf. Sci. 1996, 96–98, 384–386. [Google Scholar]
  17. Johnson, S.L.; Heimann, P.A.; MacPhee, A.G.; Lindenberg, A.M.; Monteiro, O.R.; Chang, Z.; Lee, R.W.; Falcone, R.W. Bonding in Liquid Carbon Studied by Time-Resolved X-Ray Absorption Spectroscopy. Phys. Rev. Lett. 2005, 94, 057407. [Google Scholar] [CrossRef] [PubMed]
  18. Downer, M.C.; Ahn, H.; Reitze, D.H.; Wanh, X.Y. Dielectric Function and Electrical Resistivity of Liquid Carbon Determined by Femtosecond Spectroscopy. Int. J. Thermophys. 1993, 14, 361–370. [Google Scholar] [CrossRef]
  19. Beye, M.; Sorgenfrei, F.; Schlotter, W.F.; Wurt, W.; Föhlisch, A. The liquid-liquid phase transition in silicon revealed by snapshots of valence electrons. PNAS 2010, 107, 16772–16776. [Google Scholar] [CrossRef] [PubMed]
  20. Heremans, J.; Olk, C.H.; Eelsey, G.L.; Steinbeck, J.; Dresselhaus, G. Observation of metallic conductivity in liquid carbon. Phys. Rev. Lett. 1988, 60, 452–455. [Google Scholar] [CrossRef] [PubMed]
  21. Reitze, D.H.; Wang, X.; Ahn, H.; Downer, M.C. Femtosecond laser melting of graphite. Phys. Rev. B Rapid Commun. 1989, 40, 11986–11989. [Google Scholar] [CrossRef]
  22. llamas-Jansa, I.; Jäger, C.; Mutschke, H.; Henning, Th. Far-ultraviolet to near-infrared optical properties of carbon nanoparticles produced by pulsed-laser pyrolysis of hydrocarbons and their relation with structural variations. Carbon 2007, 45, 1542–1557. [Google Scholar] [CrossRef]
  23. Larruquert, J.I.; Keski-Kuha, R.A.M. Reflectance measurements and optical constants in the extreme ultraviolet of thin films of ion-beam-deposited carbon. Opt. Commun. 2000, 183, 437–443. [Google Scholar] [CrossRef]

