Article

Multi-Scale Simulation for Transient Absorption Spectroscopy under Intense Few-Cycle Pulse Laser

Kansai Photon Science Institute, National Institutes for Quantum and Radiological Science and Technology, Kyoto 619-0215, Japan
Photonics 2016, 3(4), 63; https://doi.org/10.3390/photonics3040063
Submission received: 30 September 2016 / Revised: 2 December 2016 / Accepted: 5 December 2016 / Published: 7 December 2016
(This article belongs to the Special Issue Ultrafast Photonics and Attosecond Sciences)

Abstract

:
Numerical pump-probe simulations for the sub-cycle transient spectroscopy of thin film diamond under intense few cycle pulse laser field is reported. The electron dynamics is calculated by the time-dependent Kohn-Sham equation. Simultaneously, the propagation of electromagnetic field is calculated by the Maxwell equation. Our result shows that the modulation of the reflectivity, transmission, and absorption around the optical gap do not coincide with the field amplitude of the pump laser. The phase shift of the modulation with respect to the pump field depends on the pump intensity and probe frequency. The modulation of the reflectivity is sensitive to the choice of the exchange-correlation potential, and dynamical effect of the mean-field in meta-GGA potential.

1. Introduction

In the last two decades, advances in laser sciences and technologies have resulted in the availability of intense coherent light with different characteristics. Ultra-short laser pulses can be as short as a few tens of an attosecond [1], forming the new field of attosecond science [2]. Intense laser pulses of mid-infrared (MIR), and THz frequencies have also recently become available [3,4]. By employing these extreme sources of coherent light, it is possible to investigate the optical response of materials in real time with a resolution much lower than an optical cycle [2,5,6,7,8,9].
The dielectric function ε ( ω ) is the most fundamental quantity which characterizes the optical properties of matter. The ε ( ω ) observed in ultra-fast pump-probe experiments can be considered as a probe time ( T p )-dependent function ε ( T p , ω ) . The modulation of ε ( ω ) in the presence of electromagnetic fields has also been the subject of investigation for many years. The change under a static electric field is known as the Franz-Keldysh effect (FKE) [10,11,12,13,14,15,16,17], and under an alternating electric field is known as the dynamical FKE (DFKE) [18,19,20,21,22,23].
Novelli et al. [8] reported the subcycle modulation of transmittance of GaAs for the first time under intense THz pulse. In previous work, we determined the sub-cycle change of the optical propertiescite, i.e., time-resolved DFKE (Tr-DFKE), which corresponds to the beat and quantum path interference between the different dressed states [24,25]. In particular, this ultra-fast change exhibits an interesting phase shift that depends on the field intensity and probe frequency. By using this phenomenon, we can produce an ultra-fast modulator of light or an ultra-fast optical switch. Recently, the Tr-DFKE has been observed by Lucchini et al. [26] in thin film polycrystalline diamond on an attosecond time scale. Similar effects have also been reported for the excitonic state in GaAs quantum well [27].
In the case of the continuous wave (CW) pump laser, Tr-DFKE can be analytically understood from the general dressed state picture, as we reported [24,25]. However, for a few-cycle laser pulse, numerical simulation is indispensable because the dressed state is not a good picture. With regards to the experiment, the effects of the propagation of pump and probe lasers is also important in material. For higher frequency region, Tr-DFKE in polycrystalline diamond was reported [26]. Far above the band gap, diamond has low transmission and includes the interaction between some conduction bands. Below the band gap, Tr-DFKE is expected to be more efficient for application owing to large transmission. However, since the dispersion of the dielectric function is intense around the band gap, the probe pulse may be chirped in material, resulting in longer the pulse duration and low time-resolution.
In this work, we present the density-functional multi-scale calculation for the Tr-DFKE under an intense few-cycle laser around the band gap energy region employing the time-dependent density-functional theory (TDDFT), and the Maxwell equation. We solve the Maxwell equation simultaneously, using a finite-difference time-domain (FDTD) approach, and time-dependent Kohn-Sham (TDKS) equation to reproduce the propagation of the laser field in material, including electron dynamics for thin-film diamond.

2. Materials and Methods

The theory and its implementation used in the present calculation have been described elsewhere [28,29,30,31], so we describe it only briefly here. The laser pulse that enters from the vacuum and attenuates in the medium varies on a scale of micrometers, while the electron dynamics take place in a subnanometer scale. To overcome these conflicting spatial scales, we have developed a multiscale implementation introducing two coordinate systems: macroscopic coordinate X for the laser pulse propagation, and the microscopic coordinate r for local electron dynamics. The laser pulse is described by the vector potential A X ( t ) which satisfies
1 c 2 2 A X ( t ) t 2 2 A X ( t ) X 2 = 4 π e 2 c J X ( t ) .
At each point X we consider lattice-periodic electron dynamics driven by the electric field E X ( t ) = 1 c d A X ( t ) / d t . These are described by the electron orbitals ψ i , X ( r , t ) which satisfy the time-dependent Kohn-Sham equation
i t ψ i , X ( r , t ) = 1 2 m i r + e c A X ( t ) 2 ϕ X ( r , t ) + μ x c , X ( r , t ) ψ i , X ( r , t ) ,
where the potential ϕ X ( r , t ) , which includes Hartree and ionic contributions, and the exchange-correlation potential μ x c , X ( r , t ) , are periodic in the lattice. The electric current J X ( t ) is provided from the electron orbitals as
J X ( t ) = e m V V d r i Re ψ i , X * p + e c A X ( t ) ψ i , X + J X , N L ( t ) ,
where V is a volume of the unit cell. J X , N L ( t ) is the current caused by non-locality of the pseudopotential.
We solve Equations (1)–(3) simultaneously as an initial value problem where the incident laser pulse is prepared in a vacuum region in front of the surface, while all Kohn-Sham orbitals are set to their ground state. The reproduction of the direct band gap is important for reasonable description of the optical properties. In general, the band gap is underestimated in conventional local-density approximation (LDA) [32]. In this work we used a modified Becke-Johnson exchange potential (mBJ) [33] as given by Reference [34] (Equations (2)–(4)), with a LDA correlation potential [32] in the adiabatic approximation. mBJ potential depends on the density ρ ( r , t ) = i | ψ ( r , t ) | 2 , the gradient of the density ρ ( r , t ) , and the kinetic energy density τ ( r , t ) = i | ψ i ( r , t ) | 2 , which improves the band gap. We have fixed the mBJ potential to gauge-invariant by changing τ ( r , t ) to
τ ( r , t ) j X 2 ( r , t ) / ρ ( r , t ) ,
where
j X ( r , t ) = e m i Re ψ i , X * p + e c A X ( t ) ψ i , X + j X , N L ( r , t )
is the current density. The calculated optical band gap by the mBJ is 6 eV, which is improved from that by the LDA (5.5 eV) [24,28], and close to the experimental value (7 eV).
We approximate the time-evolution operator by its Taylor series expansion up to 4th order
e i H K S Δ t n = 1 4 1 n ! i H K S Δ t n ,
where H K S is the Kohn-Sham Hamiltonian in Equation (2) and Δ t is the time step. The Laplacian in Equation (2) is evaluated by the nine-point difference formula.
Our multiscale calculation uses a one-dimensional grid with spacing of 100 atomic units (a.u.) for propagation of the laser electromagnetic fields. We assumed the thin film target with a thickness of 53 nm (1000 a.u.). At each grid point, we calculated electron dynamics using an atomic-scale cubic unit cell containing eight carbon atoms which are discretized into Cartesian grids of 24 3 . We discretize the Bloch momentum space into 16 3 k points. The dynamics of the 32 valence electrons were treated explicitly; the effects of the core electrons were taken into account by pseudopotentials [35,36]. Both electromagnetic fields and electrons were evolved with a common time step of Δ t = 0.02 a.u.
The incident pump laser field in vacuum, E i n , P ( X , t ) , is described by
E i n , P ( X , t ) = E 0 , P sin 2 π t X T P cos ( ω P t X ) 0 < t X < T P 0 T p < t X < T e ,
where E 0 is the electric field amplitude at peak, ω P is the laser frequency, and t X = t X / c describes the space-time dependence of the field. The pulse length T P is set to be 16.1 fs, and the computation is terminated at T e = 26.6 fs
E i n , p ( X , t ) = E 0 , p cos ( ω p t X ) e ( t X T p ) 2 / D p 2 ,
where D p defines the pulse duration and is set to 0.7 fs. The laser frequencies ω P and ω p are 0.6 eV and 6 eV respectively.
The transmission (T) and reflectivity (R) at wavenumber K can be determined from the spectrum of the transmitted and reflected probe pulse
T = d X m a x d X E p ( X , t = T e ) e i K X X m i n 0 d X E i n , p ( X , t = 0 ) e i K X ,
and
R = X m i n 0 d X E p ( X , t = T e ) e i K X X m i n 0 d X E i n , p ( X , t = 0 ) e i K X ,
respectively. Here E p ( X , t = T e ) is the probe field at the end of the time-evolution, and d is the thickness of the film. We defined the surface position of target as X = 0 . The absorption ( A b ) is determined from T and R
A b = 1 ( T + R ) .

3. Numerical Results and Discussion

Figure 1 shows the typical simulation for the pump-probe experiment. We set the pump intensity to be 1 × 10 11 W/cm 2 . We define the time-delay as the relative time between the peak of pump and probe pulse, and the time-delay in Figure 1 is 0.3 fs. The negative time means that the probe pulse arrives the surface before the pump pulse. The relative time between pump and probe pulse is not changed at t = 26.6 fs (Figure 1b). This result indicates that the thickness of the diamond film was sufficiently small. The probe pulse becomes longer than original pulse and transmitted pulse because it included the reflected pulse at the rear surface.
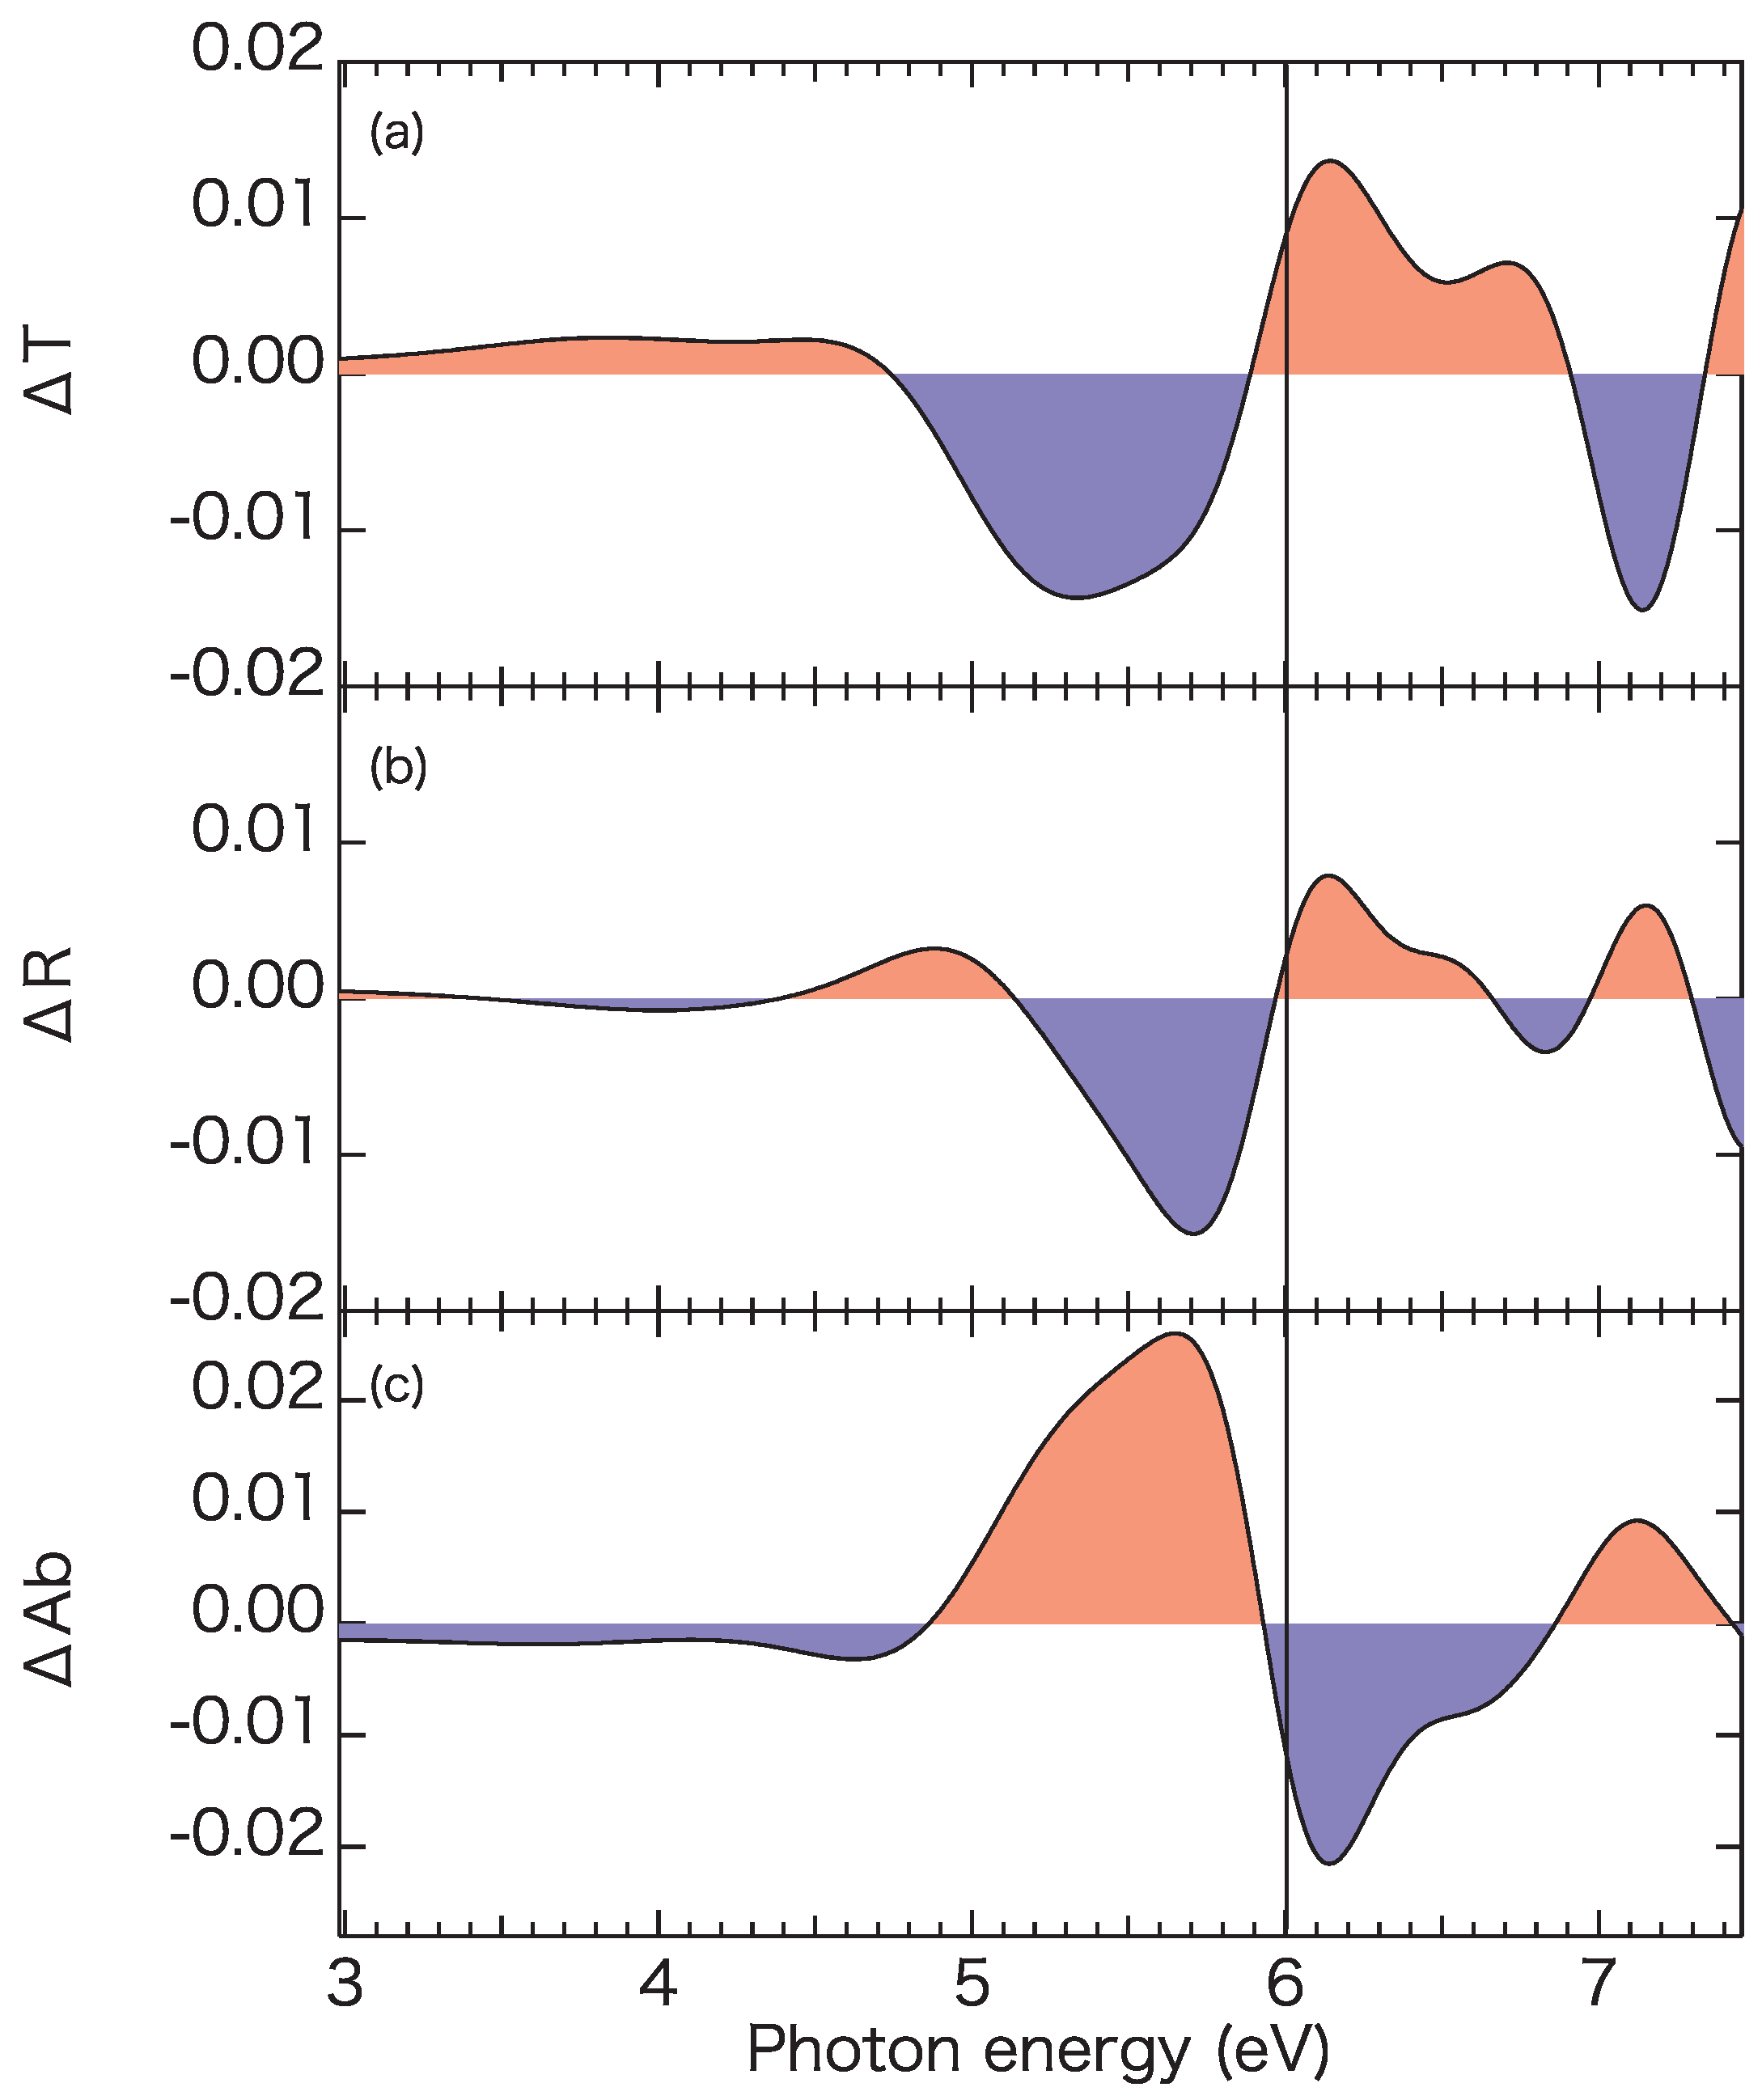
Figure 2 shows the calculated change of the (a) transmission ( Δ T ), (b) reflectivity ( Δ R ), and (c) absorption ( Δ A b ) from the simulation shown in Figure 1. Δ T and Δ R decrease just below the band gap (4.8 ∼ 5.9 eV) which indicates an increase of the Δ A b (Figure 2c). Δ T shows positive and Δ A b shows negative values below 4.8 eV. In the static FKE, the absorption below the band gap shows positive value, which is the tunneling assisted photoabsorption [12]. The negative value in Δ A b indicates photo-emission. According to previous theoretical work, DFKE can be understood via the response of the dressed states [24]. The response of the dressed states includes all optical paths, i.e. high harmonic generation (HHG), multi-photon absorption (MPA), and differential frequency generation (DFG), etc. HHG and DFG are photoemission process, which make the negative value in absorption below the band gap. The positive value of R in FKE below the band gap indicates that the MPI process or tunneling process is the dominant for adiabatic response.
Δ T shows large positive value just above the band gap. This transparency can be attributed to the blue shift of the band gap by the ponderomotive energy, U p = e 2 E P 2 / 4 μ ω P 2 , where E P is the electric field in the diamond and μ is the reduced mass.
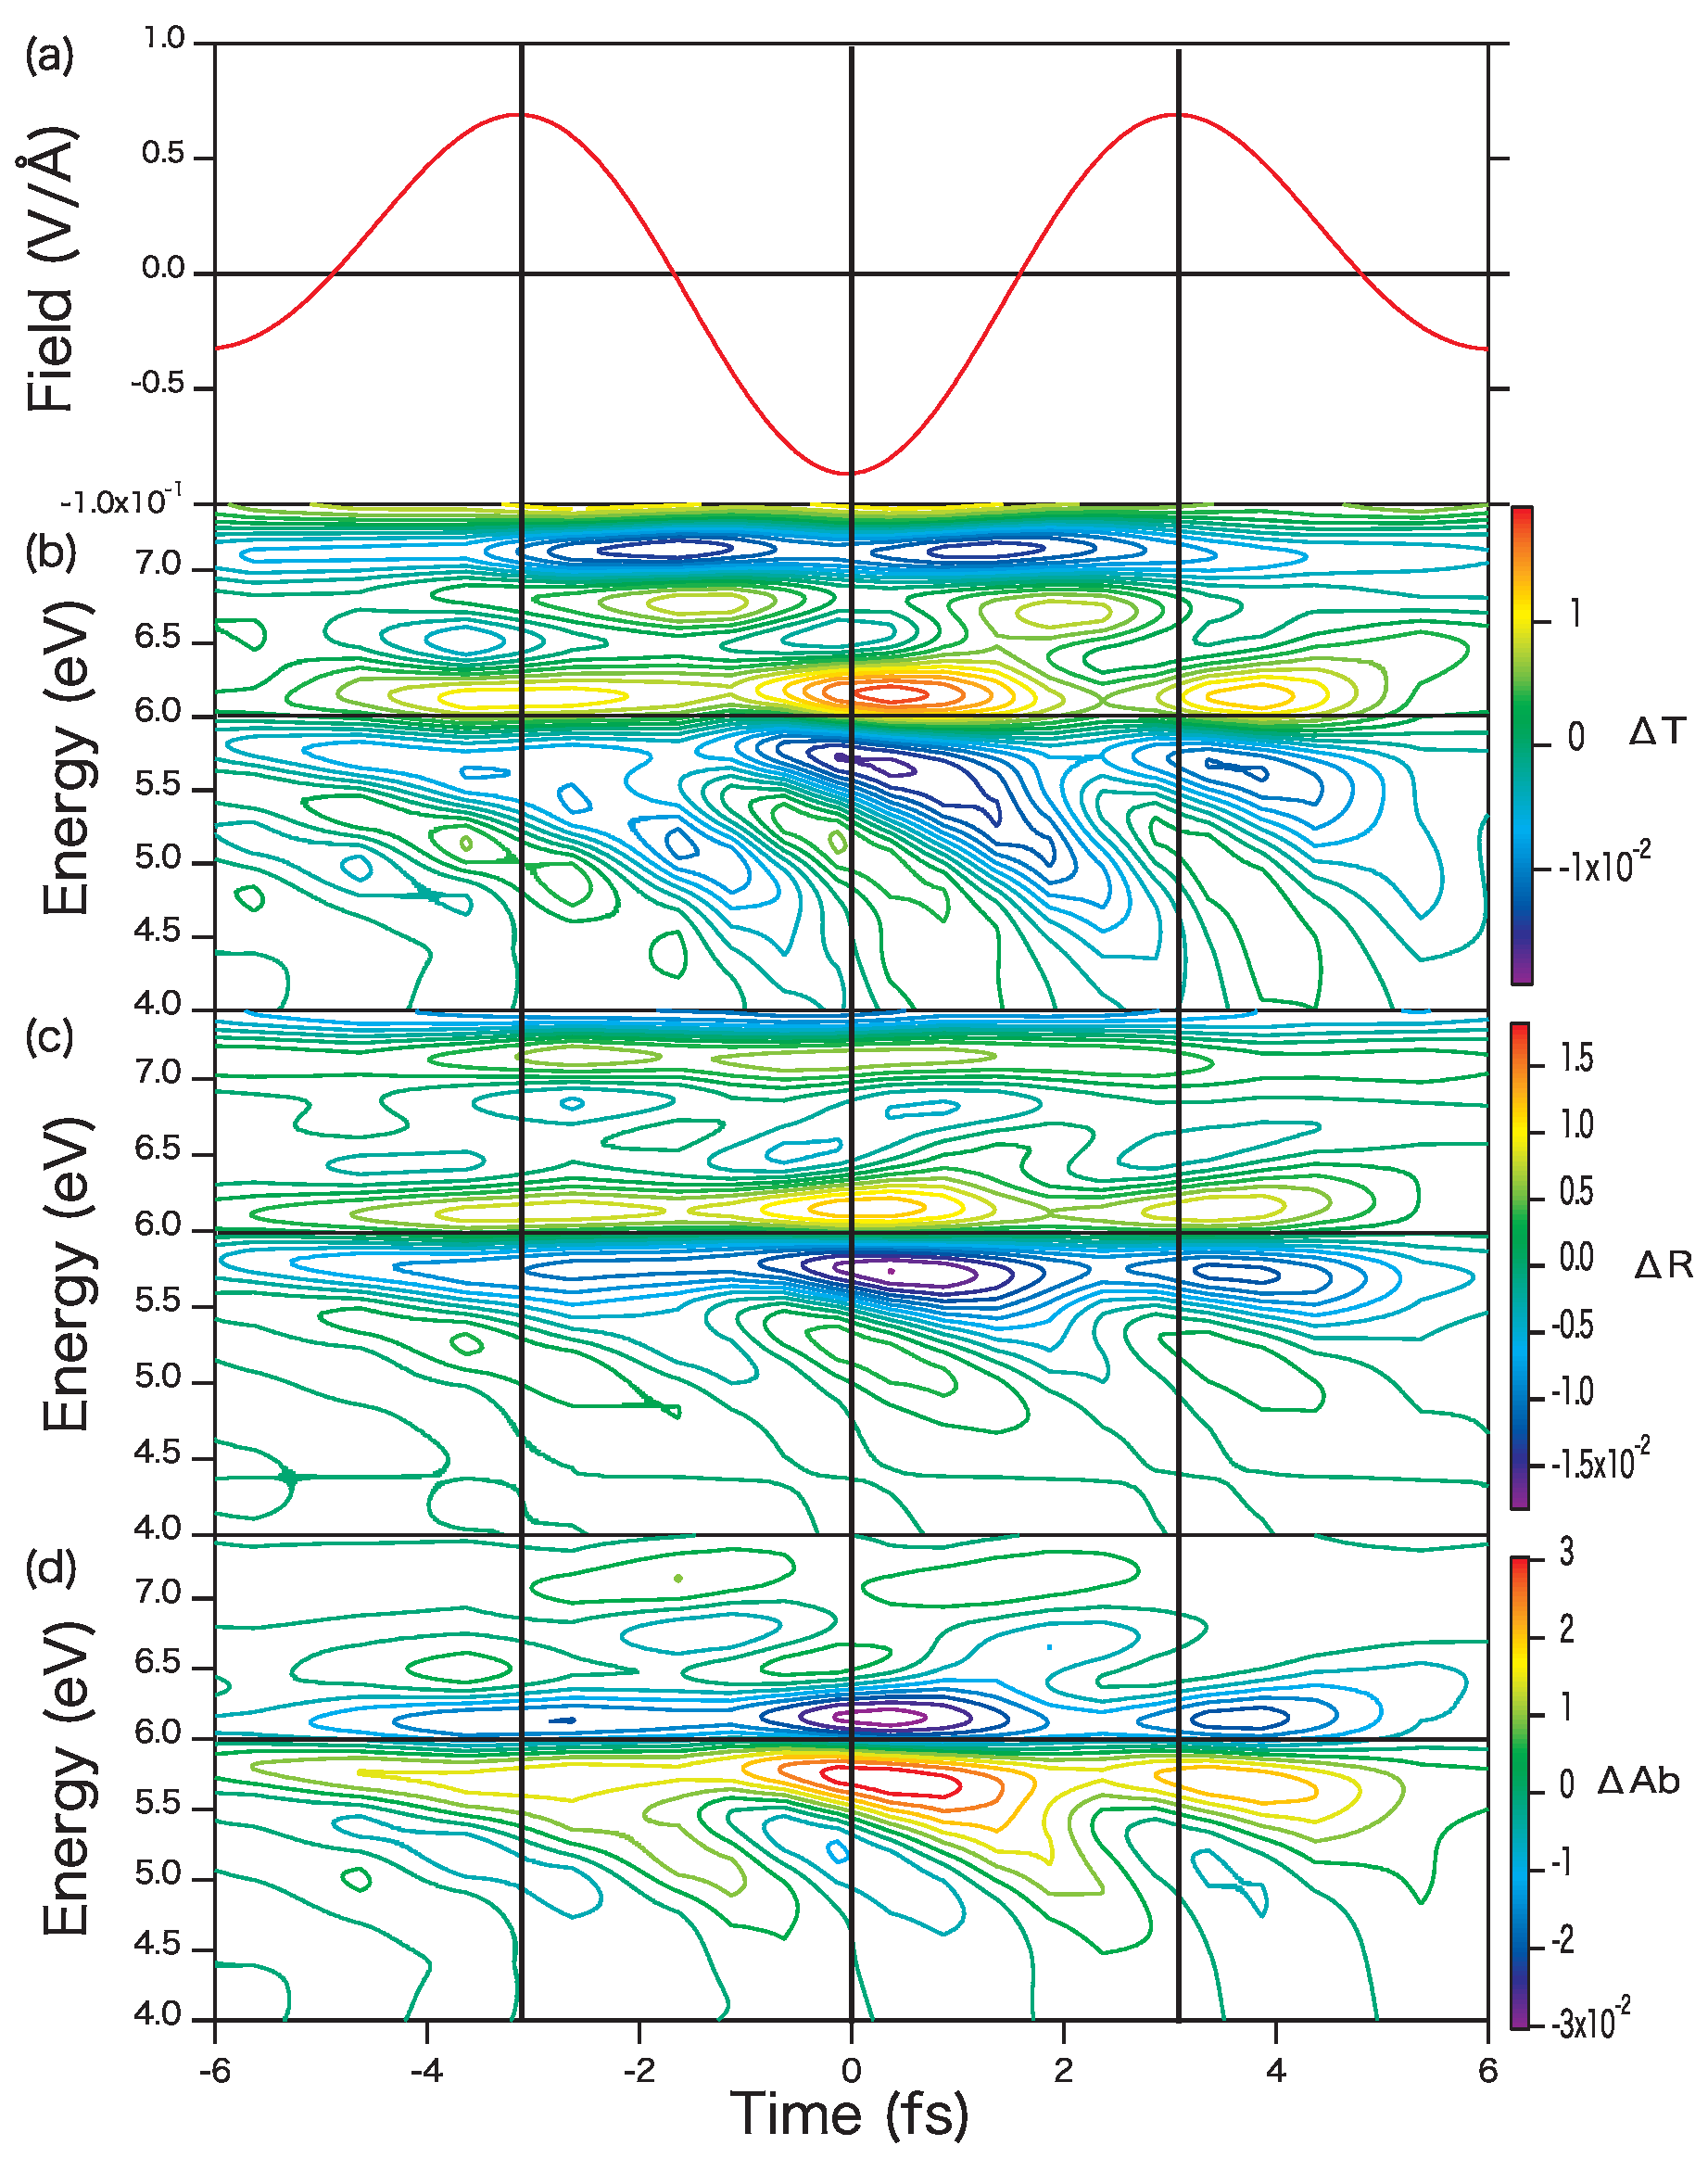
The time-resolved DFKE is shown in Figure 3 as a function of the probe time and the energy. The time is defined as the relative time delay between the peak of the pump pulse and the probe pulses. Figure 3a shows the pump field E i n , P at the surface. Since the dispersion of the dielectric function of diamond is intense around the band gap, the probe pulse should be chirped during the propagation which deteriorates the time-resolution. However, numerical result show clear time-dependence with respect to the phase of the pump laser. This result indicates that the assumed thickness of the thin film (53 nm) is sufficient to observe the Tr-DFKE. All optical properties peak at the peak of the pump laser field, T p = 0 . On the other hand, the peaks shift forward as the photon energy decreases and increases. This behavior is similar to the case of CW pump laser [24].
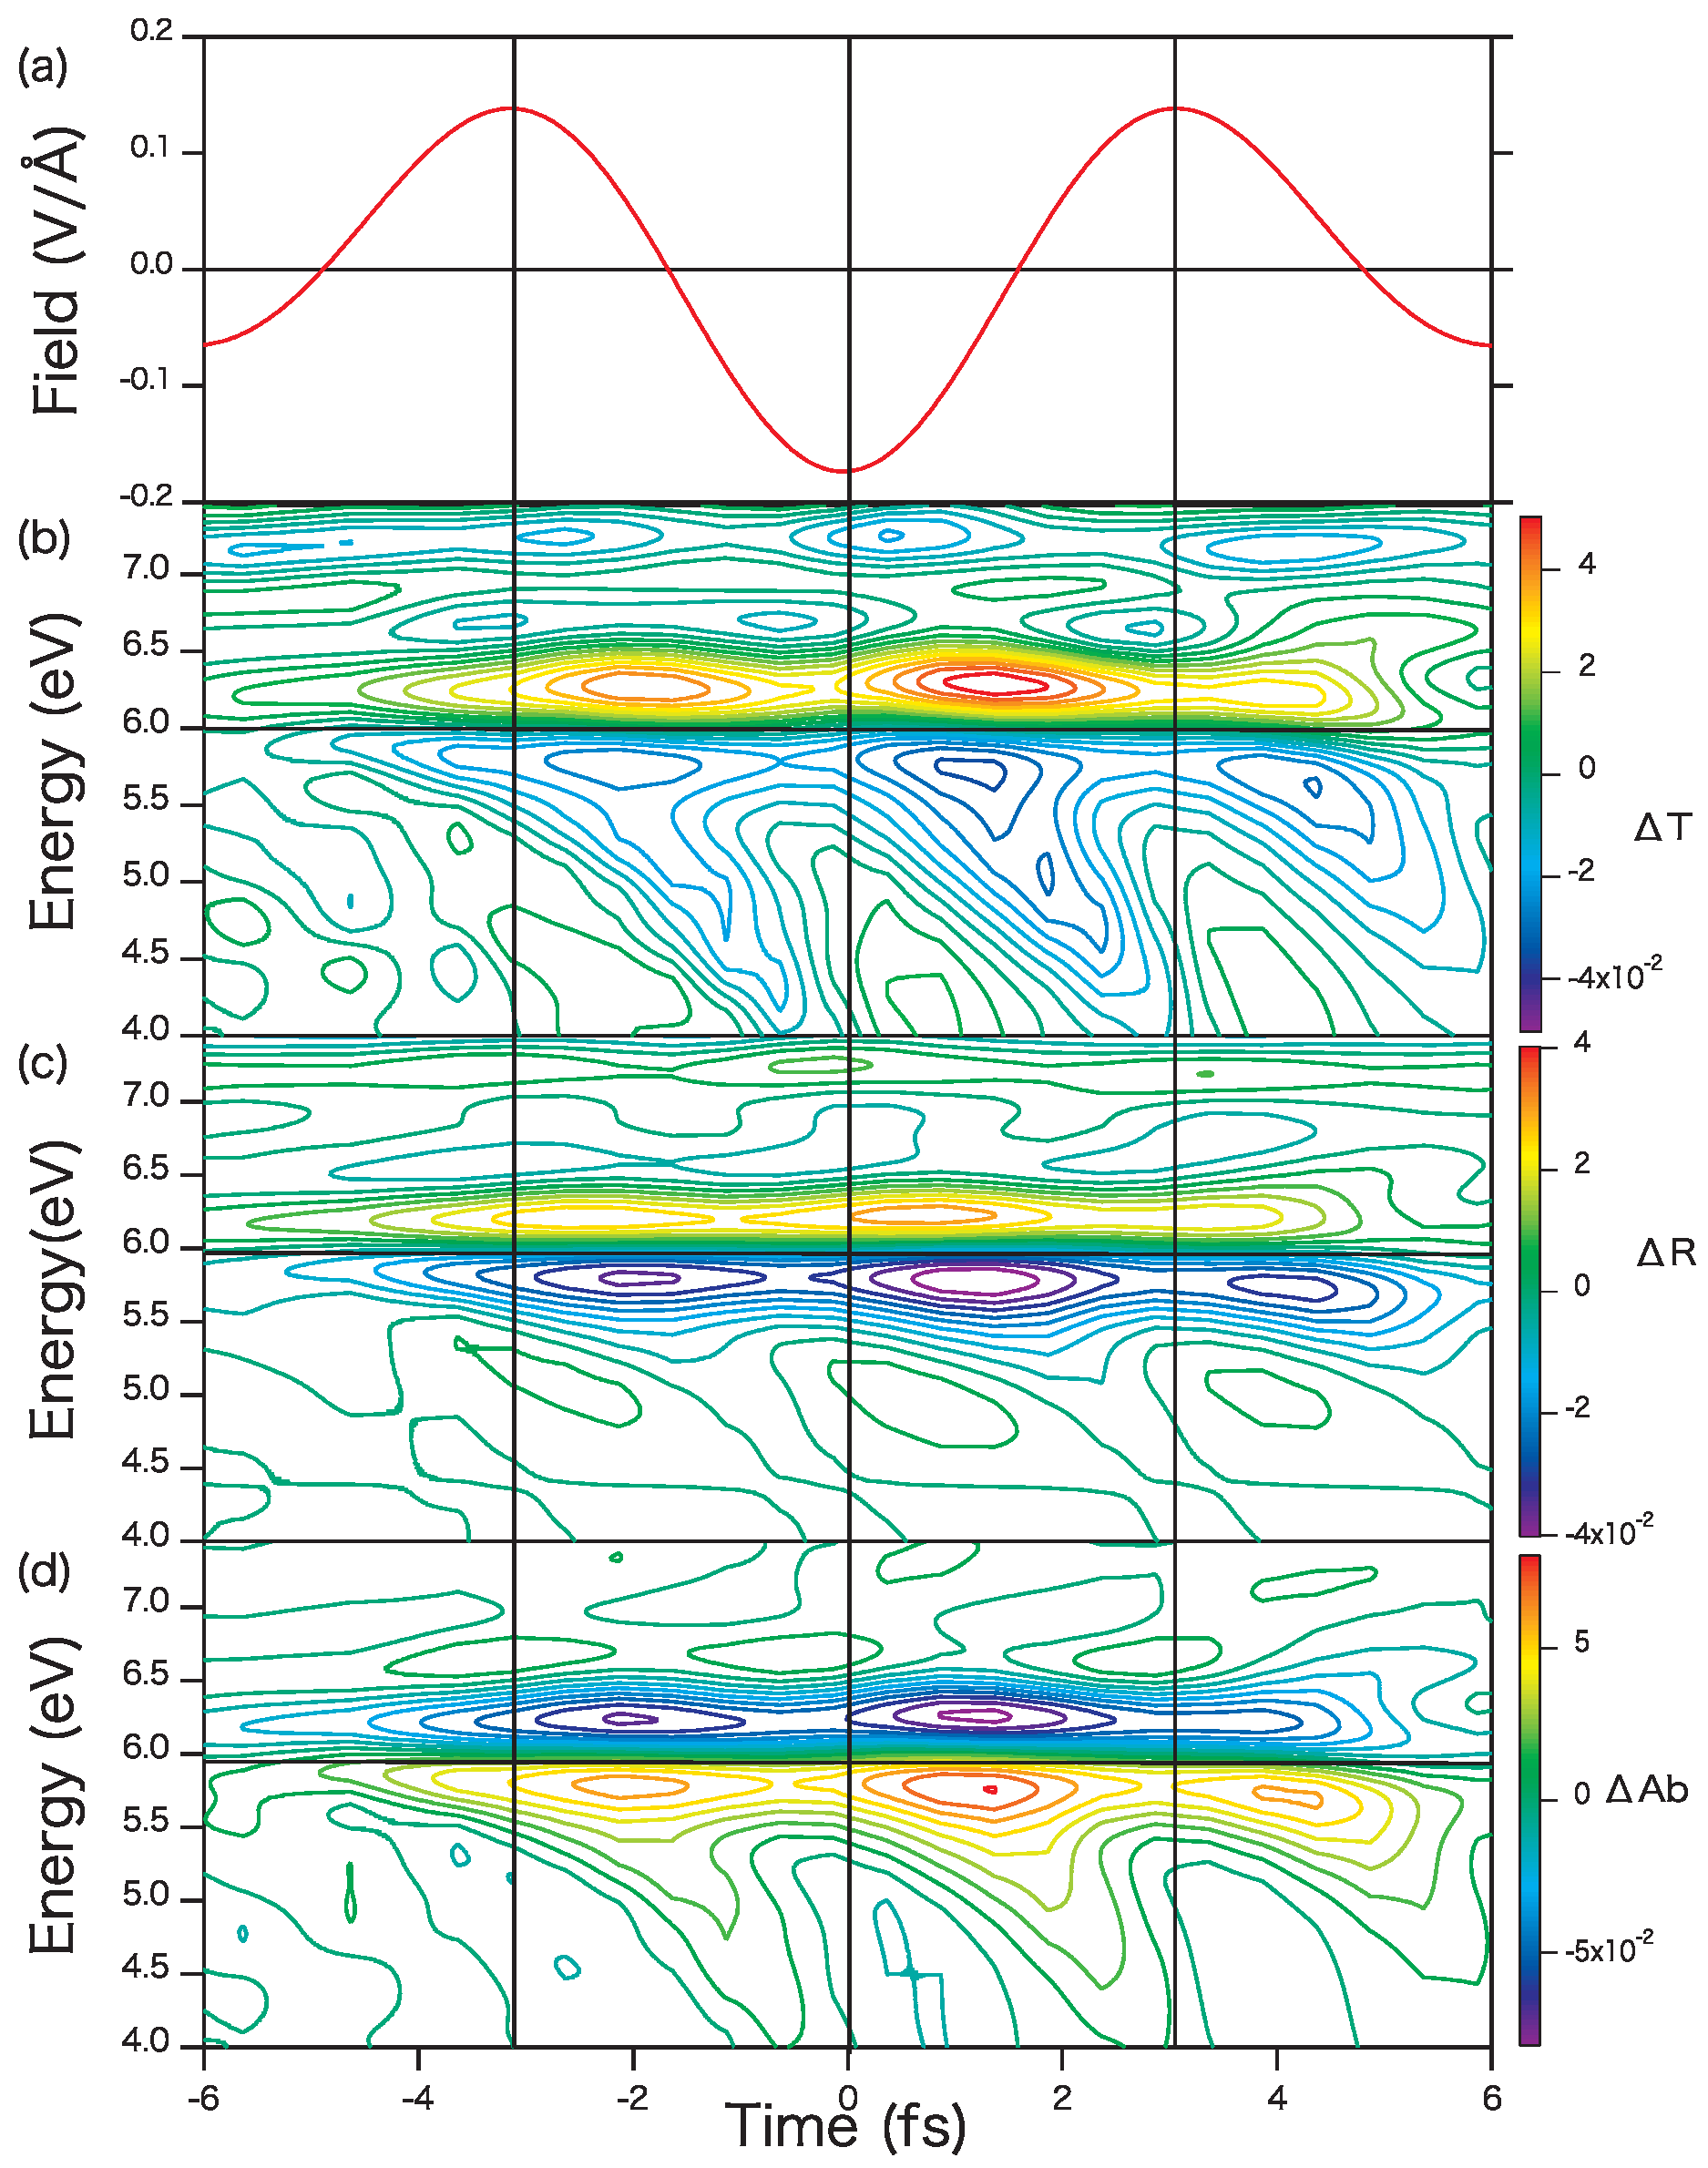
Figure 4 shows the case of a more intense pump laser ( 4 × 10 11 W/cm 2 ). The most intense Tr-DFKE signal shifts backward about 1 fs with respect to the peak intensity of the pump pulse laser. In the case of the CW pump laser, it is unclear which field amplitude defines the intensity of Tr-DFKE signal. Figure 3 and Figure 4 indicate that the nearest peak of laser field is important for Tr-DFKE. Probe frequency dependence becomes weak compared to the case of 1 × 10 11 W/cm 2 , shown in Figure 3. This frequency dependent phase shift may access the adiabatic response in extremely intense cases as we reported in our earlier work [24].
The parameter γ = U p / ω P [8,20,24] is typical parameter to evaluate the adiabaticity of the process. For γ 1 ( γ 1 ), the process is adiabatic (diabatic), and the optical response should corresponds to FKE (multiphoton absorption). In the case of γ 1 , DFKE is considered as the dominant process. In this work, γ is 0.16 for 1 × 10 11 W/cm 2 , and 0.64 for 4 × 10 11 W/cm 2 with μ = 0.25 m. Therefore, our results can be considered as the DFKE.
Since the Tr-DFKE is the non-perturbative effect, the dynamics of the mean field, which corresponds to the change of the band structure, is important subject. Figure 5 shows the difference between time-dependent mean-field and the independent particle (IP) model at time-delay of 0.3 fs. The thick-solid lines represent the time-dependent mean field, and the thick-dashed lines represent the IP model with mBJ potential. The IP model shows overestimation for all observables. In particular, Δ R with IP model shows the peak shift about 0.1 eV. These results indicate that the time-dependence of the mean-field is important and the interpretation by the wave function with initial state has less meaning with mBJ potential.
The thin-solid and -dashed lines represent the case of the LDA [32] with time-dependent mean-field and IP model respectively. Since LDA shows under estimation in band gap (5.5 eV for diamond), the Tr-DFKE signal also shifted about 0.5 eV with respect to the mBJ. For all observables, LDA shows large modulation compare to the mBJ. In the case of reflectivity, exchange-correlation potential dependence is significant above the band gap. In contrast to the mBJ potential, the IP model with LDA potential shows the same result or slightly underestimation compare the time-dependent mean-field. The significant difference between mBJ and LDA potential is the components depending on the τ = i | ψ i | 2 and the ρ . These semi-nonlocal and dynamical effect in exchange-correlation potential affect the time-dependent wave function significantly compare to conventional LDA.

4. Conclusions

We present a multi-scale density-functional calculation for a pump-probe experiment on the thin-film diamond. Our results show ultrafast, sub-cycle change of the transmission, reflectivity, and absorption around the optical band gap, where the dispersion of the dielectric function is intense. The sub-cycle change in the optical properties under few-cycle pulses corresponds to the Tr-DFKE, which is understood to be response of the dressed states. Although Tr-DFKE signal has the peaks with the peak of the electric field in the case; 1 × 10 11 W/cm 2 , the signal shifts backwards for the more intense case; 4 × 10 11 W/cm 2 . On the other hand, frequency dependence in Tr-DFKE signal accesses adiabatic response as the pump laser intensity increases.
The dependence on the exchange-correlation potential in Tr-DFKE is significant in the modulation of reflectivity. We also find that the time-dependent mean-field is important for mBJ potential.

Acknowledgments

This work is supported by a JSPS KAKENHI (Grants No. 15H03674). Numerical calculations were performed on the supercomputer SGI ICE X at the Japan Atomic Energy Agency (JAEA).

Conflicts of Interest

The author declares no conflict of interest.

References

  1. Zhao, K.; Zhang, Q.; Chini, M.; Wu, Y.; Wang, X.; Chang, Z. Tailoring a 67 attosecond pulse through advantageous phase-mismatch. Opt. Lett. 2012, 37, 3891–3893. [Google Scholar] [CrossRef] [PubMed]
  2. Hentschel, M.; Kienberger, R.; Spielmann, C.; Reider, G.A.; Milosevic, N.; Brabec, T.; Corkum, P.; Heinzmann, U.; Drescher, M.; Krausz, F. Attosecond metrogy. Nature 2001, 414, 509–513. [Google Scholar] [CrossRef] [PubMed]
  3. Hirori, H.; Doi, A.; Blanchard, F.; Tanaka, K. Single-cycle terahertz pulses with amplitudes exceeding 1 MV/cm generated by optical rectification in LiNbO3. Appl. Phys. Lett. 2011, 98, 091106. [Google Scholar] [CrossRef]
  4. Chin, H.A.; Calderon, G.O.; Kono, J. Extreme Midinfrared Nonlinear Optics in Semiconductors. Phys. Rev. Lett. 2001, 86, 3292–3295. [Google Scholar] [CrossRef] [PubMed]
  5. Hirori, H.; Shinokita, K.; Shirai, M.; Tani, S.; Kadoya, Y.; Tanaka, K. Extraordinary carrier multiplication gated by a picosecond electric field pulse. Nat. Commun. 2011, 2, 594. [Google Scholar] [CrossRef] [PubMed] [Green Version]
  6. Schiffrin, A.; Paasch-Colberg, T.; Karpowicz, N.; Apalkov, V.; Gerster, D.; Mühlbrandt, S.; Korbman, M.; Reichert, J.; Schultze, M.; Holzner, S.; et al. Optical-filed-induced current in dielectrics. Nature 2013, 493, 70–73. [Google Scholar] [CrossRef] [PubMed]
  7. Schultze, M.; Bothschafter, E.M.; Sommer, A.; Holzner, S.; Schweinberger, W.; Fiess, M.; Hofstetter, M.; Kienberger, R.; Apalkov, V.; Yakovlev, V.S.; et al. Controlling dielectrics with the electric field of light. Nature 2013, 493, 75–82. [Google Scholar] [CrossRef] [PubMed]
  8. Nobelli, F.; Fausti, D.; Giusti, F.; Parmigiani, F.; Hoffmann, M. Mixed regime of light-matter interaction revealed by phase sensitive measurements of the dynamical Franz-Keldysh effect. Sci. Rep. 2013, 3, 1227. [Google Scholar]
  9. Schultze, M.; Ramasesha, K.; Pemmaraju, C.D.; Sato, S.A.; Whitmore, D.; Gandman, A.; Prell, J.S.; Borja, L.J.; Prendergast, D.; Yabana, K.; et al. Attosecond band-gap dynamics in silicon. Science 2014, 346, 1348–1352. [Google Scholar] [CrossRef] [PubMed]
  10. Franz, W. Einfluß eines elektrischen Feldes auf eine optische Absorptionskante. Z. Naturforsch. A 1958, 13, 484–489. [Google Scholar] [CrossRef]
  11. Keldysh, V.L. Behaviour of Non-Metallic Crystals in Strong Electric Fields. Sov. Phys. JETP 1958, 6, 763–770. [Google Scholar]
  12. Tharmalingam, K. Optical Absorption in the Presence of a Uniform Field. Phys. Rev. 1963, 130, 2204–2206. [Google Scholar] [CrossRef]
  13. Seraphin, O.B.; Hess, B.R. Franz-Keldysh Effect above the Fundamental Edge in Germanium. Phys. Rev. Lett. 1965, 14, 138–140. [Google Scholar] [CrossRef]
  14. Nahory, E.R.; Shay, L.J. Reflectance Modulation by the Surface Field in GaAs. Phys. Rev. Lett. 1968, 21, 1569–1571. [Google Scholar] [CrossRef]
  15. Shen, H.; Dutta, M. Franz-Keldysh oscillations in modulation spectroscopy. J. Appl. Phys. 1995, 78, 2151–2176. [Google Scholar] [CrossRef]
  16. Wahlstrand, K.J.; Sipe, E.J. Independent-particle theory of the Franz-Keldysh effect including interband coupling: Application to calculation of electroabsorption in GaAs. Phys. Rev. B 2010, 82, 075206. [Google Scholar] [CrossRef]
  17. Duque-Gomez, F.; Sipe, E.J. The Franz-Keldysh effect revisited: Electroabsorption including interband coupling and excitonic effects. J. Phys. Chem. Solids 2015, 76, 138–152. [Google Scholar] [CrossRef]
  18. Yacoby, Y. High-frequency Franz-Keldysh Effect. Phys. Rev. 1968, 169, 610–619. [Google Scholar] [CrossRef]
  19. Jauho, A.P.; Johnsen, K. Dynamical Franz-Keldysh effect. Phys. Rev. Lett. 1996, 76, 4576–4579. [Google Scholar] [CrossRef] [PubMed] [Green Version]
  20. Nordstrom, B.K.; Johnsen, K.; Allen, S.J.; Jauho, A.-P.; Birnir, B.; Kono, J.; Noda, T.; Akiyama, H.; Sakaki, H. Excitonic Dynamical Franz-Keldysh Effect. Phys. Rev. Lett. 1998, 81, 457–460. [Google Scholar] [CrossRef] [Green Version]
  21. Srivastava, A.; Srivastava, R.; Wang, J.; Kono, J. Laser-Induced Above-Band-Gap Transparency in GaAs. Phys. Rev. Lett. 2004, 93, 157401. [Google Scholar] [CrossRef] [PubMed]
  22. Mizumoto, Y.; Kayanuma, Y.; Srivastava, A.; Kono, J.; Chin, H.A. Dressed-band theory for semiconductors in a high-intensity infrared laser field. Phys. Rev. B 2006, 74, 045216. [Google Scholar] [CrossRef]
  23. Ghimire, S.; DiChiara, D.A.; Sistrunk, E.; Szafruga, B.U.; Agostini, P.; DiMauro, F.L.; Reis, A.D. Redshift in the Optical Absorption of ZnO Single Crystals in the Presence of an Intense Midinfrared Laser Field. Phys. Rev. Lett. 2011, 107, 167407. [Google Scholar] [CrossRef] [PubMed]
  24. Otobe, T.; Shinohara, Y.; Sato, A.S.; Yabana, K. Femtosecond time-resolved dynamical Franz-Keldysh effect. Phys. Rev. B 2016, 93, 045124. [Google Scholar] [CrossRef]
  25. Otobe, T. Time-resolved dynamical Franz-Keldysh effect produced by an elliptically polarized laser. Phys. Rev. B 2016, 94, 165152. [Google Scholar] [CrossRef]
  26. Lucchini, M.; Sato, A.S.; Ludwig, A.; Herrmann, J.; Volkov, M.; Kasmi, L.; Shinohara, Y.; Yabana, K.; Gallmann, L.; Keller, U. Attosecond dynamical Franz-Keldsh effect in polycrystalline diamond. Science 2016, 353, 916–919. [Google Scholar] [CrossRef] [PubMed]
  27. Hirori, H.; Uchida, K.; Tanaka, K.; Otobe, T.; Mochizuki, T.; Kim, C.; Yoshita, M.; Akiyama, H.; Pfeiffer, L.N.; West, K.W. Time-resolved observation of dynamical Franz-Keldysh effect under coherent multi-cycle terahertz pulses. In Proceedings of the JSAP-OSA Joint Symposia 2015, Nagoya, Japan, 13–16 September 2015.
  28. Otobe, T.; Yamagiwa, M.; Iwata, J.-I.; Yabana, K.; Nakatsukasa, T.; Bertsch, F.G. First-principles electron dynamics simulation for optical breakdown of dielectrics under an intense laser field. Phys. Rev. B 2008, 77, 165104. [Google Scholar] [CrossRef]
  29. Bertsch, F.G.; Iwata, J.-I.; Rubio, A.; Yabana, K. Real-space, real-time method for the dielectric function. Phys. Rev. B 2000, 62, 7998–8002. [Google Scholar] [CrossRef]
  30. Yabana, K.; Sugiyama, T.; Shinohara, Y.; Otobe, T.; Bertsch, F.G. Time-dependent density functional theory for strong electromagnetic field in crystalline solids. Phys. Rev. B 2012, 85, 045134. [Google Scholar] [CrossRef]
  31. Sato, A.S.; Yabana, K.; Shinohara, Y.; Otobe, T.; Lee, K.-M.; Bertsch, F.G. Time-dependent density functional theory of high-intensity short-pulse laser irradiation on insulators. Phys. Rev. B 2015, 92, 205413. [Google Scholar] [CrossRef]
  32. Perdew, P.J.; Wang, Y. Accurate and simple analytic representation of the electron-gas correlation energy. Phys. Rev. B 1992, 45, 13244–13249. [Google Scholar] [CrossRef]
  33. Becke, D.A.; Johnson, R.E. A simple effective potential for exchange. J. Chem. Phys. 2006, 124, 221101. [Google Scholar] [CrossRef] [PubMed]
  34. Tran, F.; Blaha, P. Accurate Band Gaps of Semiconductors and Insulators with a Semilocal Exchange-Correlation Potential. Phys. Rev. Lett. 2009, 102, 226401. [Google Scholar] [CrossRef] [PubMed]
  35. Troullier, N.; Martins, L.J. Efficient pseudopotentials for plane-wave calculations. Phys. Rev. B 1991, 43, 1993–2006. [Google Scholar] [CrossRef]
  36. Kleinman, L.; Bylander, M.D. Efficacious Form for Model Pseudopotentials. Phys. Rev. Lett. 1982, 48, 1425–1428. [Google Scholar] [CrossRef]
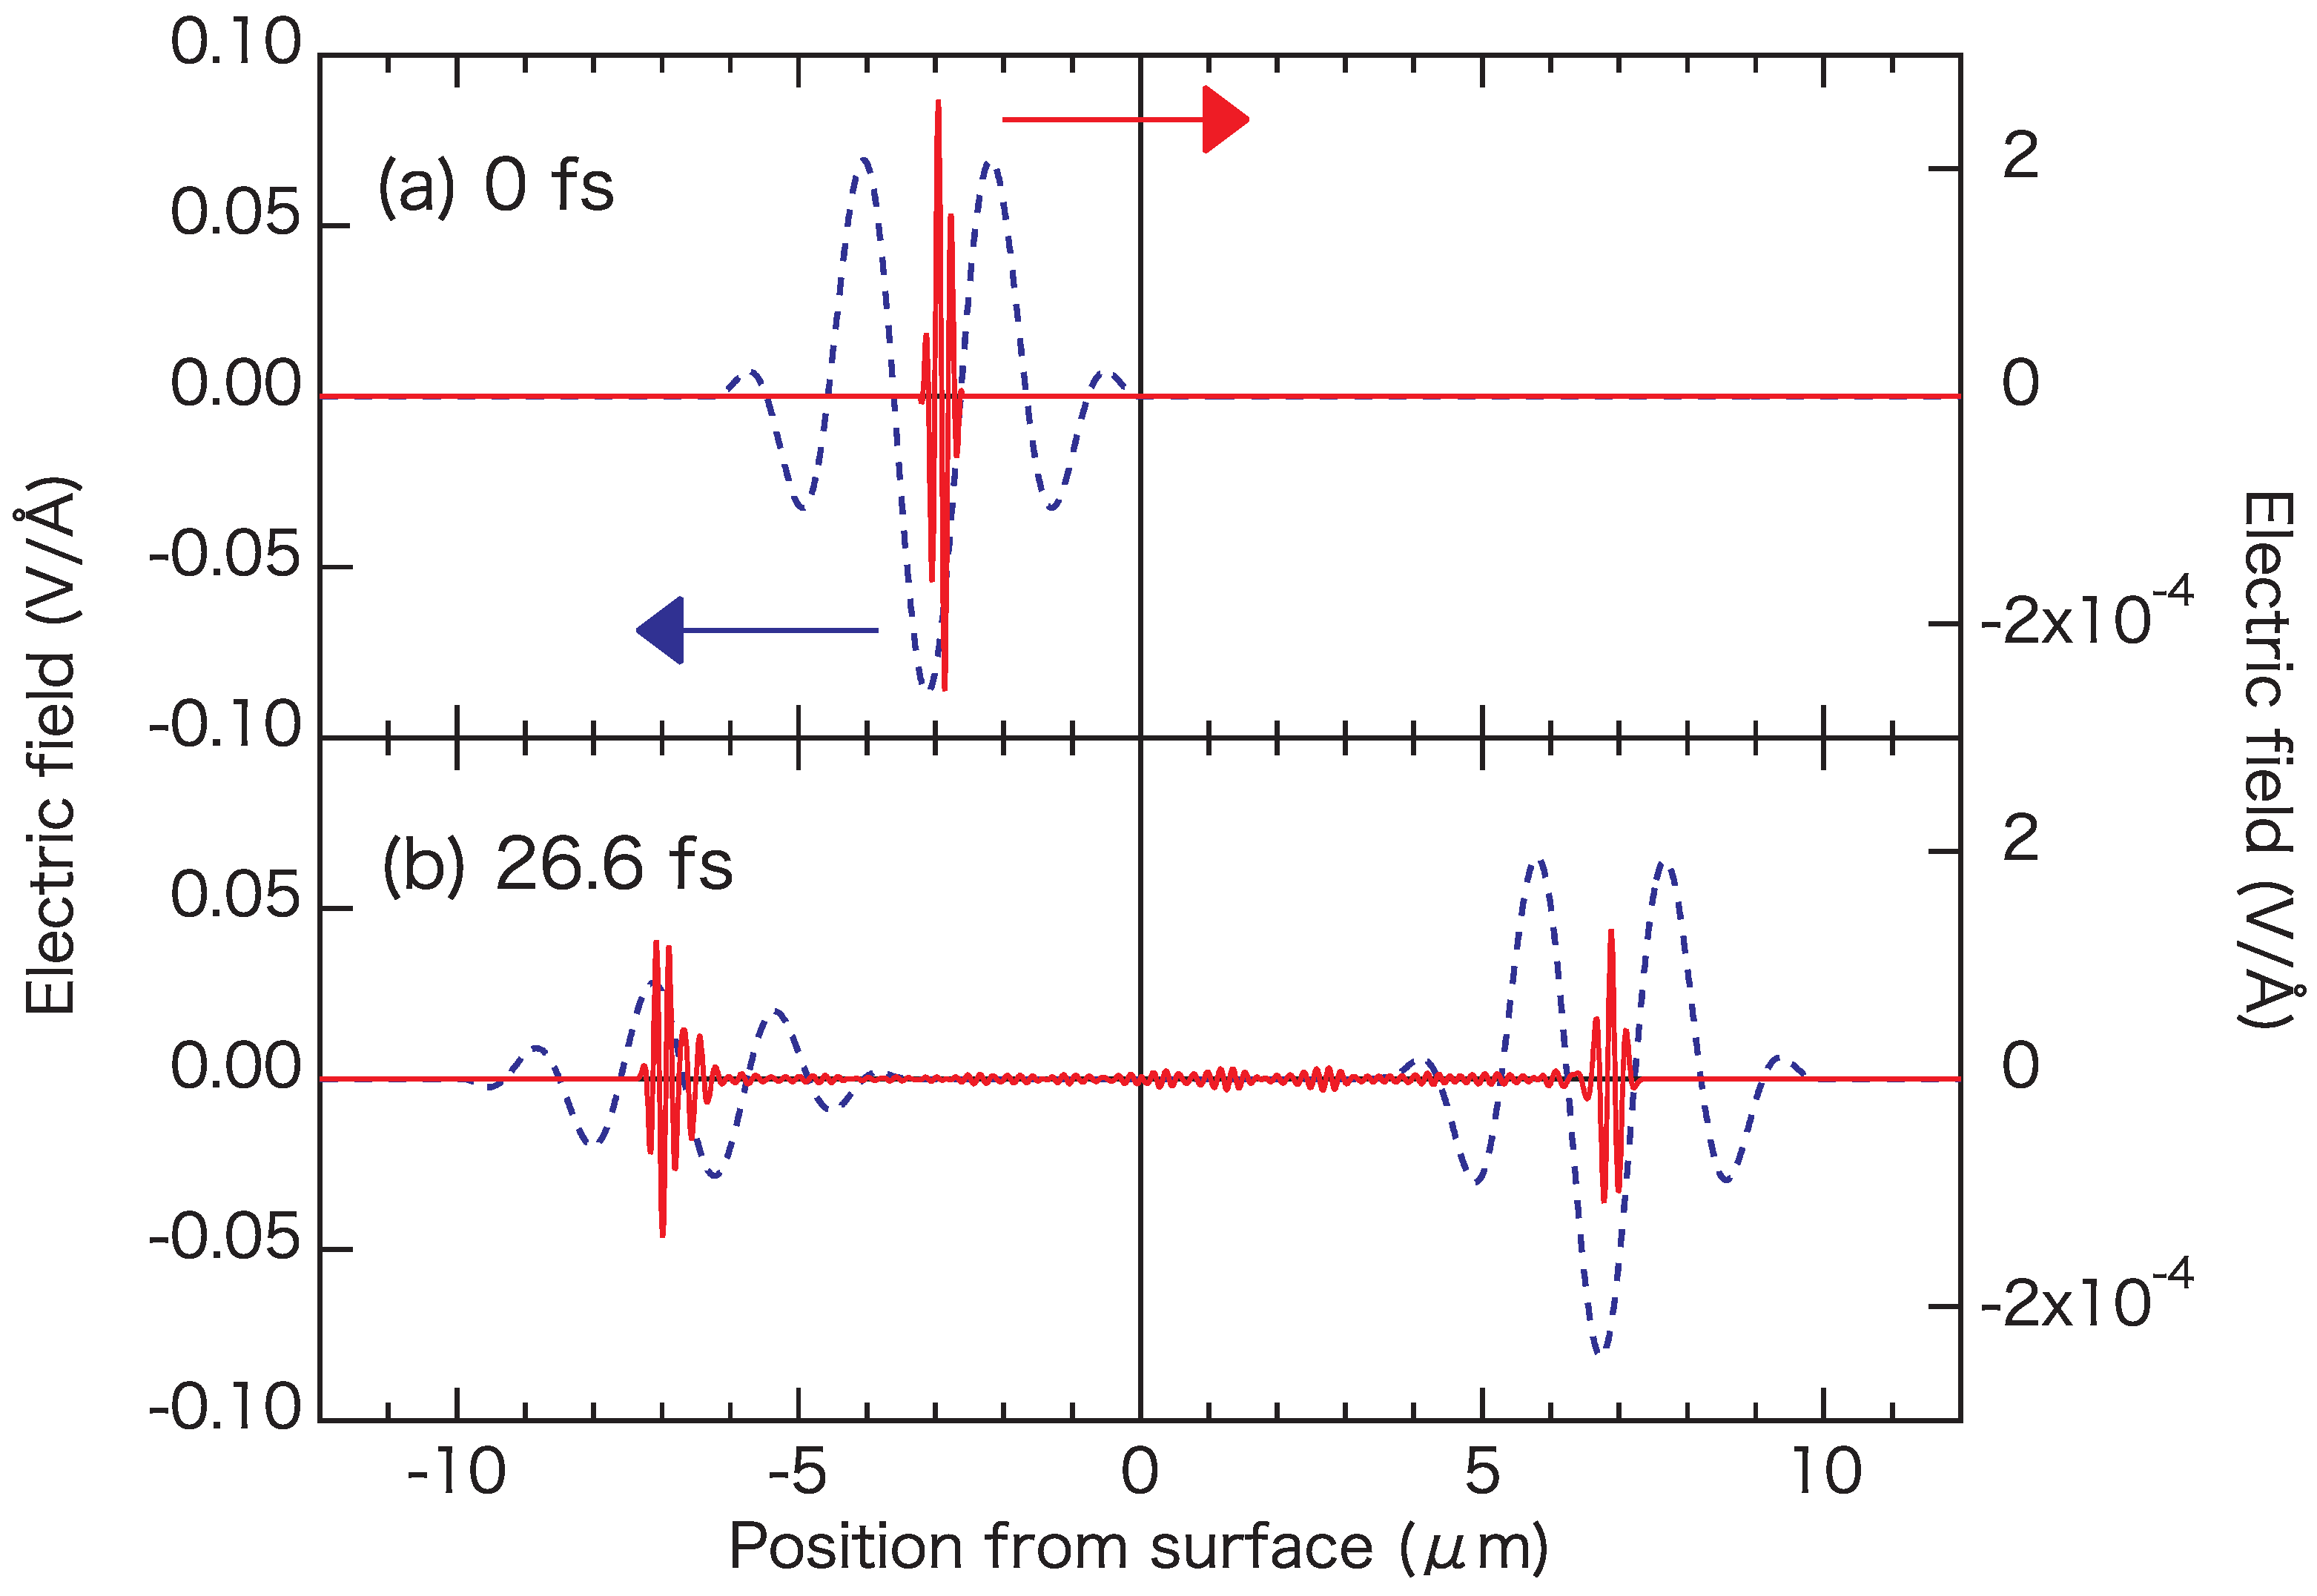
Figure 1. The laser field of the pump (blue-dashed line) and probe (red-solid line) as the function of the position from the surface. (a) Incidental laser fields at time 0 fs. (b) Transmitted and reflected laser fields at time 26.6 fs.
Photonics 03 00063 g001
Figure 2. Change of the (a) transmission, (b) reflectivity, and (c) absorption of the probe pulse. Positive value (negative value) filled by red (blue). The vertical solid line presents the optical band gap.
Photonics 03 00063 g002
Figure 3. The laser field amplitude is shown in (a). Time-energy map of the (b) Δ T , (c) Δ R , and (d) Δ R under the pump laser intensity of 1 × 10 11 W/cm 2 . The time 0 is set to the peak of the laser intensity at diamond surface. The vertical solid lines present the peak of the field amplitude.
Photonics 03 00063 g003
Figure 4. The laser field amplitude is shown in (a). Time-energy map of the (b) Δ T , (c) Δ R , and (d) Δ A b under the pump laser intensity of 4 × 10 11 W/cm 2 . The time 0 is set to the peak of the laser intensity at diamond surface.
Photonics 03 00063 g004
Figure 5. Exchange-correlation potential dependence on Tr-DFKE for (a) Δ T , (b) Δ R , and (c) Δ A b . The pump-probe time-delay is same as Figure 1. Thick solid lines represent the mBJ potential and thin solid lines represent the LDA potential. Dashed lines represent the independent particle model. The vertical thick (thin) solid lines indicate the calculated optical band gap by mBJ (LDA) potential.
Photonics 03 00063 g005