Article

Nonlinear Diffuse fs-Pulse Reflectometry of Harmonic Upconversion Nanoparticles

1
School of Physics, Osnabrueck University, Barbarastr. 7, 49076 Osnabrueck, Germany
2
Department of Electrical Engineering and Information Technology, South Westphalia University of Applied Sciences, Haldener Str. 182, 58095 Hagen, Germany
3
Wigner Research Centre for Physics, Institute for Solid State Physics and Optics, Hungarian Academy of Sciences, Konkoly-Thege u. 29-33, 1121 Budapest, Hungary
*
Author to whom correspondence should be addressed.
Photonics 2017, 4(1), 11; https://doi.org/10.3390/photonics4010011
Submission received: 14 December 2016 / Revised: 10 February 2017 / Accepted: 16 February 2017 / Published: 19 February 2017
(This article belongs to the Special Issue Ultrafast Photonics and Attosecond Sciences)

Abstract

:
Nonlinear diffuse femtosecond-pulse reflectometry is introduced as a powerful experimental tool for the unambiguous characterization of polar and non-polar point symmetry groups of harmonic upconversion nanoparticles. Using intense ultrashort 40 femtosecond laser pulses and an appropriate figure of merit (FOM), second and third harmonic emission serve for the structural characterization of polar Yb-doped lithium niobate and non-polar titanium dioxide nanoparticles. The tool is capable of differentiating these two samples by FOM values that differ by up to 13 orders of magnitude. The general applicability to harmonic upconversion nanoparticles over a broad range of intensities and wavelength spectrum, is discussed.

1. Introduction

The class of upconversion nanoparticles (UCNP) comprises nanoscopic crystals that are capable of converting two or more photons into a single one with higher photon energy, thus enabling light emission with large anti-Stokes shift with respect to the pump beam frequency. The most prominent examples are upconversion nanocrystals [1], where light emission is achieved via sequential absorption to intermediate states [2] featuring sharp emission spectra and long-lived excited states. These exceptional properties have already led to a diversity of applications and a strong focus in the realm of bioapplications such as imaging, sensing, and cancer therapy [3,4,5,6,7,8].
A new type of UCNPs—so-called harmonic upconversion nanoparticles—increasingly attract attention in recent years in material sciences in the framework of the search for UCNPs with novel properties and the exploitation of these properties for emerging applications. In harmonic UCNPs, the underlying mechanism for light emission is based on a (quasi-)instantaneous emission by means of the nonlinear optical principle of frequency conversion [9]. Thereby, emission throughout the visible and near-infrared spectral range can be realized using the same nanoparticle by simply tuning the photon energy of the pump only. The possibility of even generating deep-ultraviolet light may potentially revolutionize bioapplications, particularly in the field of optogenetics [10,11,12]. In order to clearly mark the difference to fluorescent mechanisms, the term “harmonic nanoparticles” is also frequently used [13,14]. However, since all of the aforementioned optical processes yield an increase of emitted frequencies compared to those of incident waves, we will henceforth categorize them as “harmonic UCNP”.
Accompanying this rapid development in material sciences, there is a need for an accurate characterization of harmonic UCNPs by means of appropriate spectroscopic tools capable of detecting respective nonlinear harmonic fingerprints. The first and most important step in material development is the verification of the nonlinear optical conversion mechanism, which is directly dependent on the structural feature of the as-synthesized nanoparticle sample. In particular, the mechanism of harmonic generation is highly sensitive to the presence of a polar or non-polar structural phase, so harmonic light emission can serve as a sensitive tool for structural characterization. For bulk crystals, appropriate tools were developed in the 1960s, and are successfully and widely applied in the framework of crystal growth with micro- and nanocrystalline materials. As a matter of fact, second harmonic generation (SHG)—where two pump photons are upconverted to a single photon—has been developed as an important complementary tool to XRD, especially if the structural analysis by the latter yields ambiguous results [15,16]. In the small particle limit, however, present techniques may encounter difficulties due to diminishing nonlinear harmonic efficiencies [17], especially for higher harmonics beyond the second order, thereby enforcing intensities in the P W / m 2 -region. Combined with pulse durations of Q-switched lasers on the order of (1–10) ns, exposure leads to optothermal breakdown exceeding the damage threshold by several orders of magnitude [18], thus causing particles to melt, conglomerate, or become ablated.
A possible solution is to use pulse durations well below the nano- and even picosecond region [18]—in particular, femtosecond (fs) pulses, which are the current state-of-the-art . Nevertheless, the interaction of light pulses with nanocrystalline materials in a liquid solution as proposed for ns-setups [19] differs fundamentally for ultrashort lasers due to the particular properties of fs-pulse–matter interaction. For instance, pulse broadening via group velocity dispersion (GVD) may reduce the peak intensity and therefore the harmonic signal’s intensity as well. Similar detriments stem from white light generation, harmonic generation, and multiphoton absorption from surrounding liquids, cuvettes, or cover slips. Still, these drawbacks may be circumvented in such transmittive setups [19,20] through various procedures; for example, GVD may be reduced through chirp compensation. In order to increase the overall nonlinear signal, though, large quantities ( 1 m g ) of material are required, thereby favoring investigation on dry powders.
In the present paper, we propose a novel tool for the analysis of harmonic UCNP-powders that is able to overcome these disadvantages and focuses on the (quasi-)instantaneous upconversion through harmonic generation by means of nonlinear diffuse fs-pulse reflectometry. The tool is based on the concept of diffuse reflectometry, particularly with respect to the sample preparation. Using a tunable 40 femtosecond laser light source, it is shown that second and third harmonic signals can be obtained at high signal-to-noise ratios. The respective signals in turn are used to define a figure of merit that allows for the unambiguous assignment of the polar or nonpolar phase, respectively. Further discussion is devoted to the error susceptibility of such a figure of merit. The applicability and reliability of the introduced tool is demonstrated with a comparison of polar Yb-doped lithium niobate and non-polar titanium dioxide as an example. The results are discussed with respect to the impact of intensity and wavelength range, thus highlighting the general significance of harmonic upconversion nanoparticles.

2. Fundamentals

2.1. Nonlinear Optics

Upconversion in nonlinear optical materials is commonly described through the coupled-wave theory, considering photon energy and momentum conservation E ph up = E ph ( i ) and k ph up = k ph ( i ) , respectively, with the summation carried out over the photon index i. Within the dipole approximation, expansion of the electric polarization P in a Taylor-series with respect to the electric field E yields
P ( E ) = P lin ( E ) + P NL ( E ) = ε 0 χ ( 1 ) E + n = 2 χ ( n ) E n ,
with the susceptibilities χ ( n ) . The solution of the nonlinear coupled-wave equations aims at the description of the conversion efficiency η, which is the ratio of generated intensities to incoming intensities. According to Equation (1), it is mainly dependent on the susceptibility tensors χ ( n ) , whose even-orders—depending on the internal point symmetry group (PSG)—may vanish in the dipole approximation. A direct consequence is that centrosymmetric media do not exhibit significant even-order nonlinear effects (i.e., SHG), which are only weakly contributed by the symmetry-break at the crystal’s surface [21,22,23]. This signal break-down is the starting point of the unambiguous structural characterization as implemented in our introduced tool.
In case of bulk SHG, the nonlinear coupled-wave equations can be solved analytically under the non-depleting pump and slowly varying envelope approximations, yielding the well-known SHG-intensity I 2 ω as a function of the fundamental intensity I ω [24]:
I 2 ω χ ( 2 ) ( 2 ω ; ω , ω ) 2 l 2 n 2 ω n ω 2 λ ω 2 I ω 2 × sinc 2 Δ k l / 2 .
Here, l is the interaction-length through the medium, n ω , 2 ω are the refractive indexes for fundamental (ω) and SHG ( 2 ω ) wave, and λ ω is the wavelength of the fundamental beam. The phase-mismatch is taken into account through Δ k .
An extension of the coupled-wave equations gives rise to third harmonic generation (THG), whose intensity follows the relation [25]:
I 3 ω direct χ ( 3 ) ( 3 ω ; ω , ω , ω ) 2 l 2 n 3 ω n ω 3 λ ω 2 I ω 3 .
It should be noted that the THG phase-mismatch Δ k = k 3 ω - 3 k ω has already been neglected as will be motivated by the end of this section. An alternative to the direct third harmonic generation can be achieved in polar media through cascaded second-order processes where SHG is sum-frequency mixed with the remainder of the pump wave [25,26,27]:
I 3 ω casc χ ( 2 ) ( 2 ω ; ω , ω ) 2 · χ ( 2 ) ( 3 ω ; 2 ω , ω ) 2 l 2 I ω 3 .
In contrast to even-order susceptibilities, the χ ( 3 ) -tensor will always contain nonzero elements, regardless of its PSG. This way, THG should be attainable from any material, yielding a third harmonic intensity I 3 ω = I 3 ω direct + I 3 ω casc , whereas the detection of the opposite to an appreciable degree—that is, SHG in inversion symmetric materials—is strongly suppressed.
Introducing nanopowders in lieu of macroscopic bulk crystals allows significant simplificiations to Equations (2)–(4). Due to the statistical orientation of individual nanocrystals, angular relations as dictated through the nonlinear susceptibility-tensors will be averaged out, resulting in angle-independent scalar values for χ ( n ) . On the other hand, the phase-mismatch Δ k may be neglected due to the particles’ dimensions with the interaction length l 0 , thus rendering sinc-terms approximately unity.

2.2. Introducing a Figure of Merit

Based on the strong relation between second harmonic signal and PSG, we introduce a figure of merit (FOM) composed of the measured signals S n ω of SHG and THG in order to evaluate the crystal’s polarity. This value is defined through the integrated spectral intensity distribution I n ω ( E ph ) recorded at the harmonic peak ( n = 2 for SHG, n = 3 for THG) after baseline-correction. In other words, I n ω ( E ph ) is the emission spectrum of the n-th harmonic generation recorded by a spectrometer, whereas S n ω is its integral.
Furthermore, it proves beneficial to introduce a figure of merit as the ratio between the SHG signal S 2 ω and its THG counterpart S 3 ω , in the following, termed “harmonic ratio”:
f R = S 2 ω 3 S 3 ω 2 ,
which yields a helpful indicator whether a material is polar or not. For nonpolar media, THG emission generated from the volume can be expected to exceed the surface-produced SHG by several orders of magnitude as a result of a higher number of dipoles involved in the former compared to the latter ( f R 1 ). In the opposite case where χ ( 2 ) does not diminish, SHG emission is predicted to be larger than or at least on the order of THG intensity, and therefore f R 1 .
It is necessary to highlight the action of f R in more detail. In particular, it must be noted that this figure of merit inherently favors SHG over THG by a small margin, which can be typically neglected. This is the result of different peak widths of the harmonics and their respective exponents. More precisely, THG is broader than SHG on an energy scale. At ideal conditions where both peaks are perfectly Gaussian, the ratio between the peak widths of SHG and THG is 2 : 3 . In case both peaks are equally tall with a peak spectral intensity A, the harmonic ratio would be f R 1 . 0036 s A , with s being an arbitrary value describing the peak width. Regardless of the exact values for A and s, such a scenario already hints towards a polar response of the medium, but because A is a value that is typically specified in counts of the detection unit (thus well above unity), f R 1 as well.
In terms of detection units, absolute values of f R are largely dependent on the evaluation of the measured signal. As shown in the previous paragraph, a sample may be falsely classified if the peak-counts are poorly chosen. Taking Gaussian spectral distributions into account with peak widths FWHM 2 ω = 2 s and FWHM 3 ω = 3 s (FWHM: full width at half maximum), Equation (5) becomes
f R = 2 π 9 ln 2 × s × A 2 ω 3 A 3 ω 2 .
Clearly, even when the linear ratio between the peak intensities A 2 ω / A 3 ω remains constant (i.e., ( N A 2 ω ) / ( N A 3 ω ) = const . ), f R will not, and instead scale with N, thereby being dependent on the absolute number of counts or an equivalent set of data. For clarity, this issue is displayed on the left of Figure 1. Likewise, variation of the fundamental pulse’s spectral width s caused by nonlinear processes such as self- or cross-phase modulation, four-wave mixing, Raman shifting, etc., affects f R in a similar fashion, as shown on the right side of Figure 1.
Due to the different slopes between equal linear ratios and f R , one might assume arising ambiguities. Mathematically, this possibility might be valid; however, from a physical point of view, this is rather unlikely. Typical spectrometers often possess a dynamic range of 2 16 values, as opposed to the approximately 2 67 values displayed in Figure 1 (left), thereby greatly reducing the likelihood of an intersection. Secondly, polar and nonpolar samples exhibit vastly different spectral characteristics with similarly large A 2 ω / A 3 ω -ratios, thereby reducing the chance of a false classification even further.
The third parameter that can vary in Equation (6) is the peak width s. Clearly, with rising peak widths, f R also increases, which makes exact comparisons with two different excitation sources difficult. Under normal circumstances, though, the experimental setup is unlikely to notably change, especially with regard to the pump laser. For a single system, s is therefore not expected to fluctuate significantly, thereby greatly reducing the parameter space depicted in Figure 1 (right). The cusp at ( 1 , 1 ) results from the different exponents of the two peak values A 2 ω and A 3 ω , where the larger of the two is set to unity. This is why scaling a spectrum according to the larger peak of the nonlinear signal returns adverse results, especially in a fundamental intensity-dependent scan. Again, at ordinary experimental conditions, one peak typically outweighs the other throughout a large regime, except in certain specific scenarios [28] where the low-intensity-limit should be preferred.

3. Sample Preparation, Linear Optical Analysis, and Nonlinear Setup

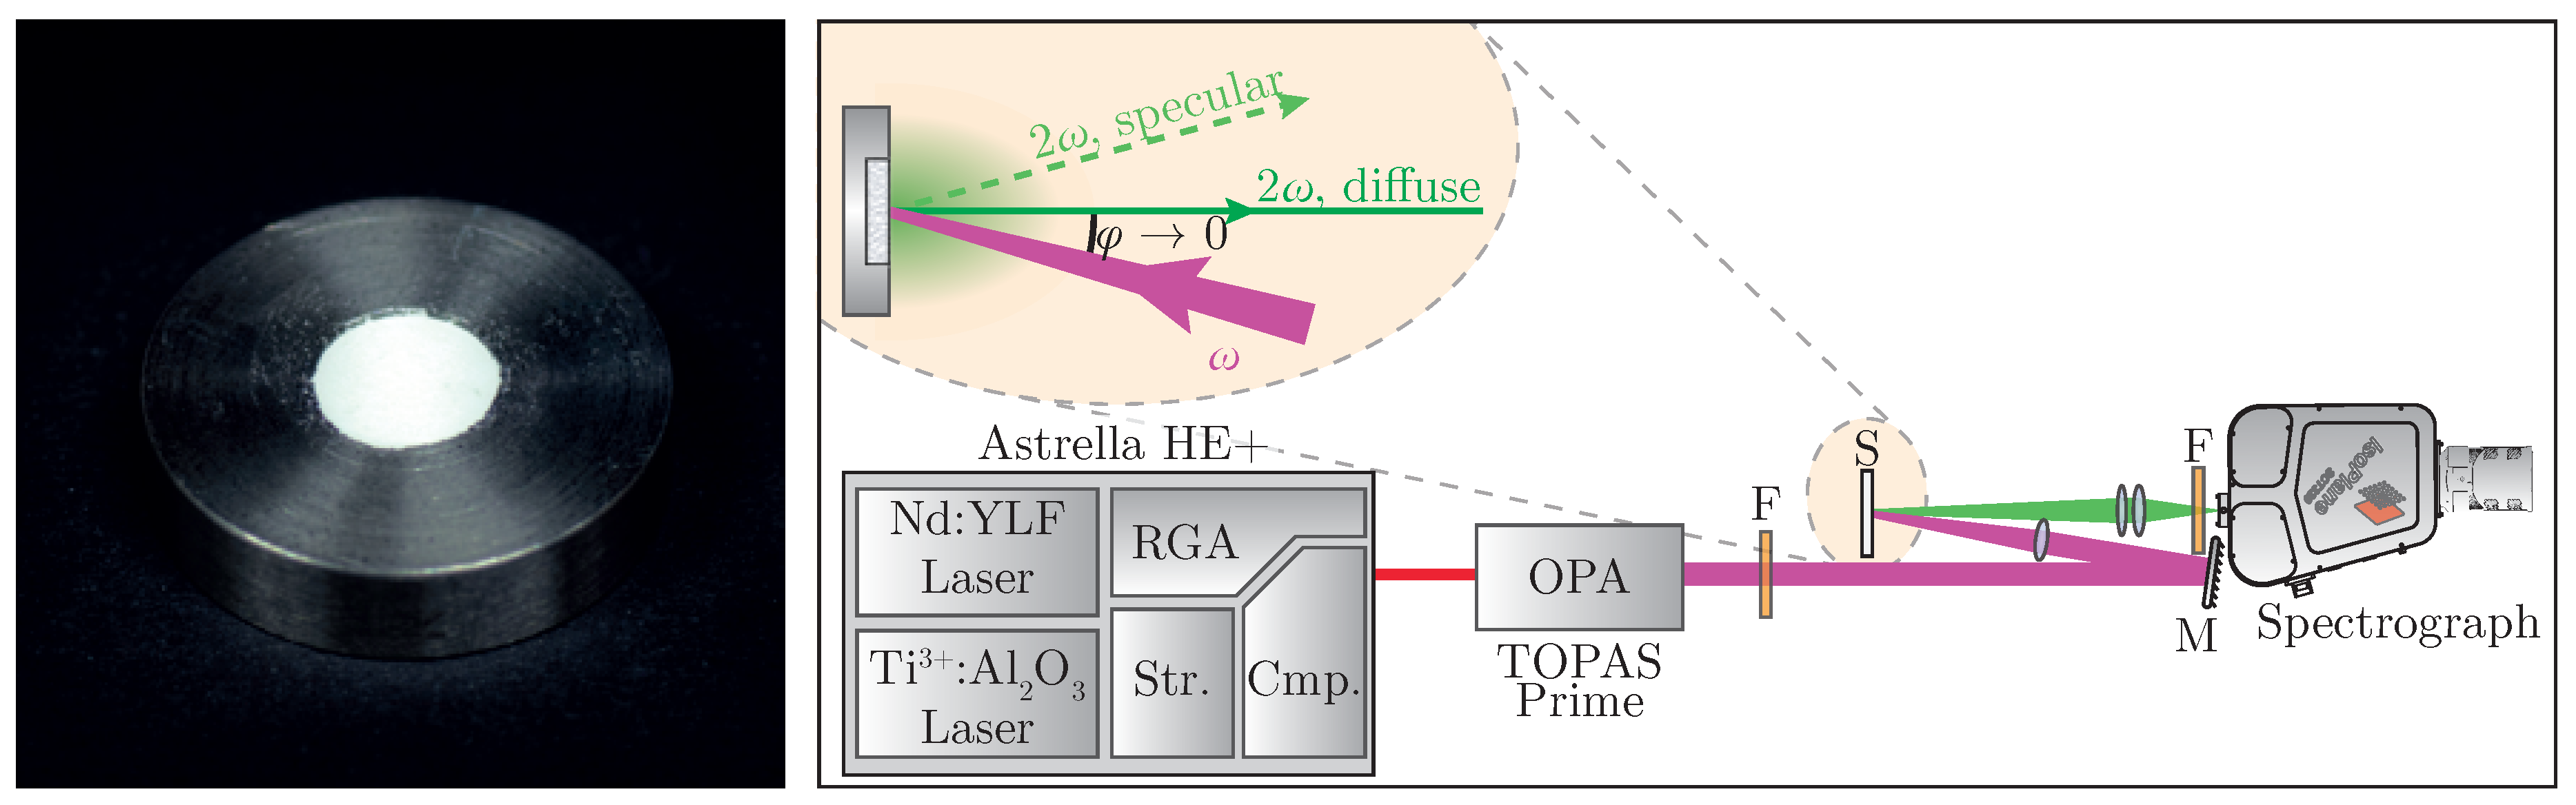
Sample preparation follows standard work flows known from linear optical diffuse reflectance spectroscopy; i.e., tight compression of the powder [29]. The nanopowder is placed in a steel sample plate (see Figure 2 (left)) and pressed with a planar tappet that is being struck with a hammer. Afterwards, additional material is added until a solid pellet can be obtained. In order to minimize specular reflexes, it is recommended to place a dried sheet of paper between tappet and powder during compression [30].
For characterization, two crystallographically different nanopowders have been chosen; namely, LiNbO 3 :Yb and TiO 2 (anatase phase). The former belongs to the PSG 3 m, and is strongly polar [31,32,33], whereas the latter belongs to 4/mm [33,34] and is therefore inversion symmetric. The main part of both samples’ size distributions is located at d = ( 300 ± 100 ) nm; this way, size-related effects may be neglected.
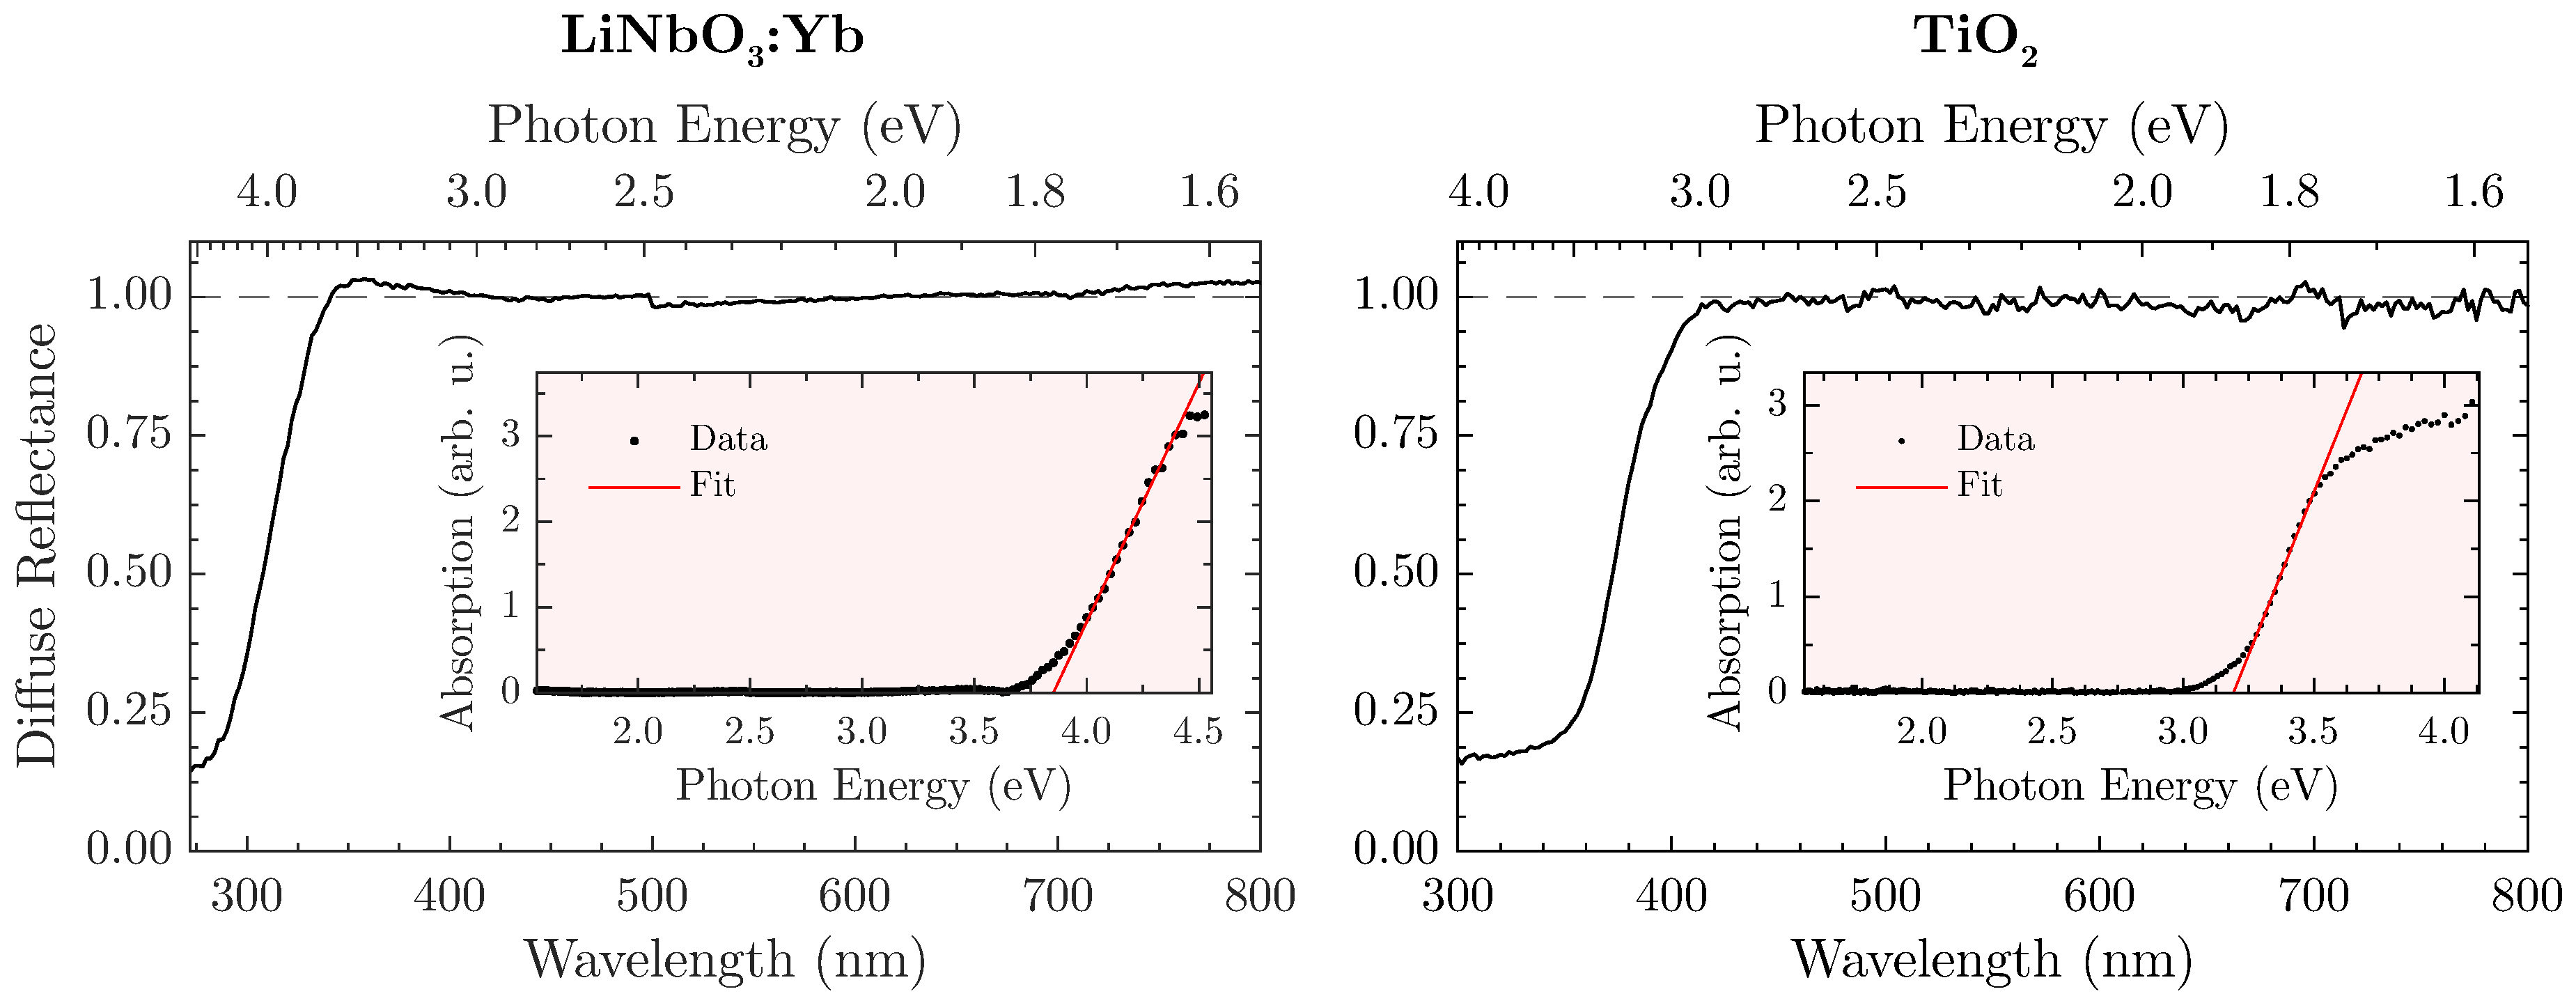
In order to define the spectral validity for the proposed method, a prior determination of the sample’s band gap in a steady-state optical remission setup (FLS980, Edinburgh Instruments, Livingston, UK) seems expedient. As a white standard, the aluminium oxide ZWSK F2000 (Imerys Fused Minerals, Villach, Austria) has been chosen, so that the diffuse reflectance R is given by the ratio of the sample’s against the white standard’s remission. The absorption spectrum is subsequently calculated from the Kubelka-Munk relation F ( R ) [35,36]. Here, we assume an indirect allowed electronic transition, thereby defining the absorption (in arbitrary units) as α = ( F ( R ) h ν ) 1 / 2 with respect to the incident photon energy h ν [37]. Lastly, the band gap is extracted from the corresponding Tauc plot [38,39]. Figure 3 displays the diffuse reflectance spectra and matching Tauc plots for both LiNbO 3 :Yb- (left) and TiO 2 -nanopowder (right).
The naturally white appearance of the samples (e.g., LiNbO 3 :Yb is shown in Figure 2 (left)) is underlined by the measurements and offers a similar—if not better—reflectance to the white standard throughout the visible spectral range. However, a harsh drop-off of R towards the UV-region can be observed that is attributed to the absorption of radiation. In this case, the band gap amounts to E g = ( 3 . 85 ± 0 . 01 ) eV or λ g = ( 322 ± 1 ) nm. However, a safe estimate for an upper bound would be λ g 345 nm for the LiNbO 3 :Yb-nanopowder so that absorption becomes irrelevant. Similar measurements with the TiO 2 -nanopowder as shown in Figure 3 (right) lead to an energy gap of E g = ( 3 . 19 ± 0 . 01 ) eV or λ g = ( 388 ± 1 ) nm, and consequently to an upper bound of λ g 415 nm. For THG-measurements, these values should be used as a lower wavelength-limit where f R can still be reliably determined.
A specific experimental setup for nonlinear optical characterization of the sample is presented in Figure 2 (right). A regeneratively amplified and spectrally tunable femtosecond laser system (Astrella HE+ and TOPAS Prime, Coherent) is used to achieve high peak intensities necessary for harmonic generation. The excitation wavelength can be tuned all over the regime of λ ω = (800–2000) n m with a pulse length of τ 40 fs. The fundamental beam is loosely focused onto the sample at a low angle, with the focus point being behind the sample in order to suppress third harmonic generation from air [40]. Intensity modulation can be achieved by placing an additional polarizing filter into the beam. Diffusely backscattered harmonic radiation is then collected perpendicular to the surface while avoiding the gathering of any specularly reflected light. The collected signal is spectrally filtered and detected—in our case, by a combination of a spectrograph and a back-illuminated air-cooled CCD-camera (IsoPlane SCT320 and PIXIS 2k, Princeton Instruments, Trenton, NJ, USA).

4. Harmonic Results

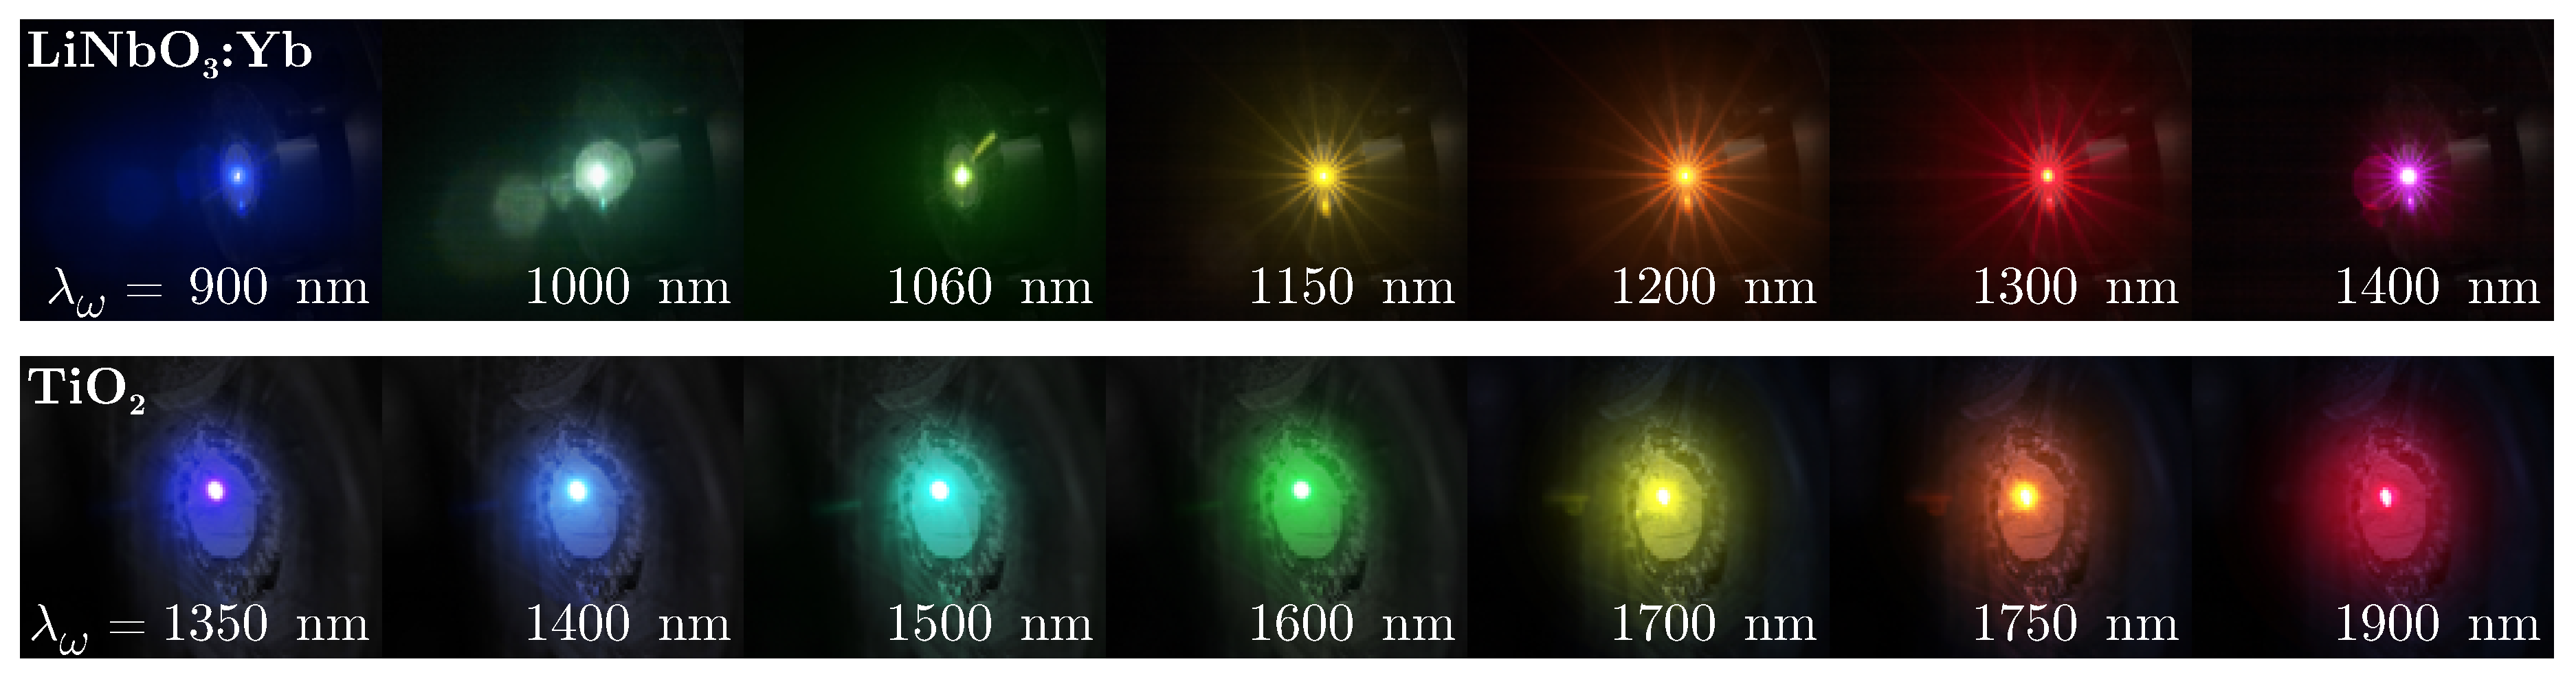
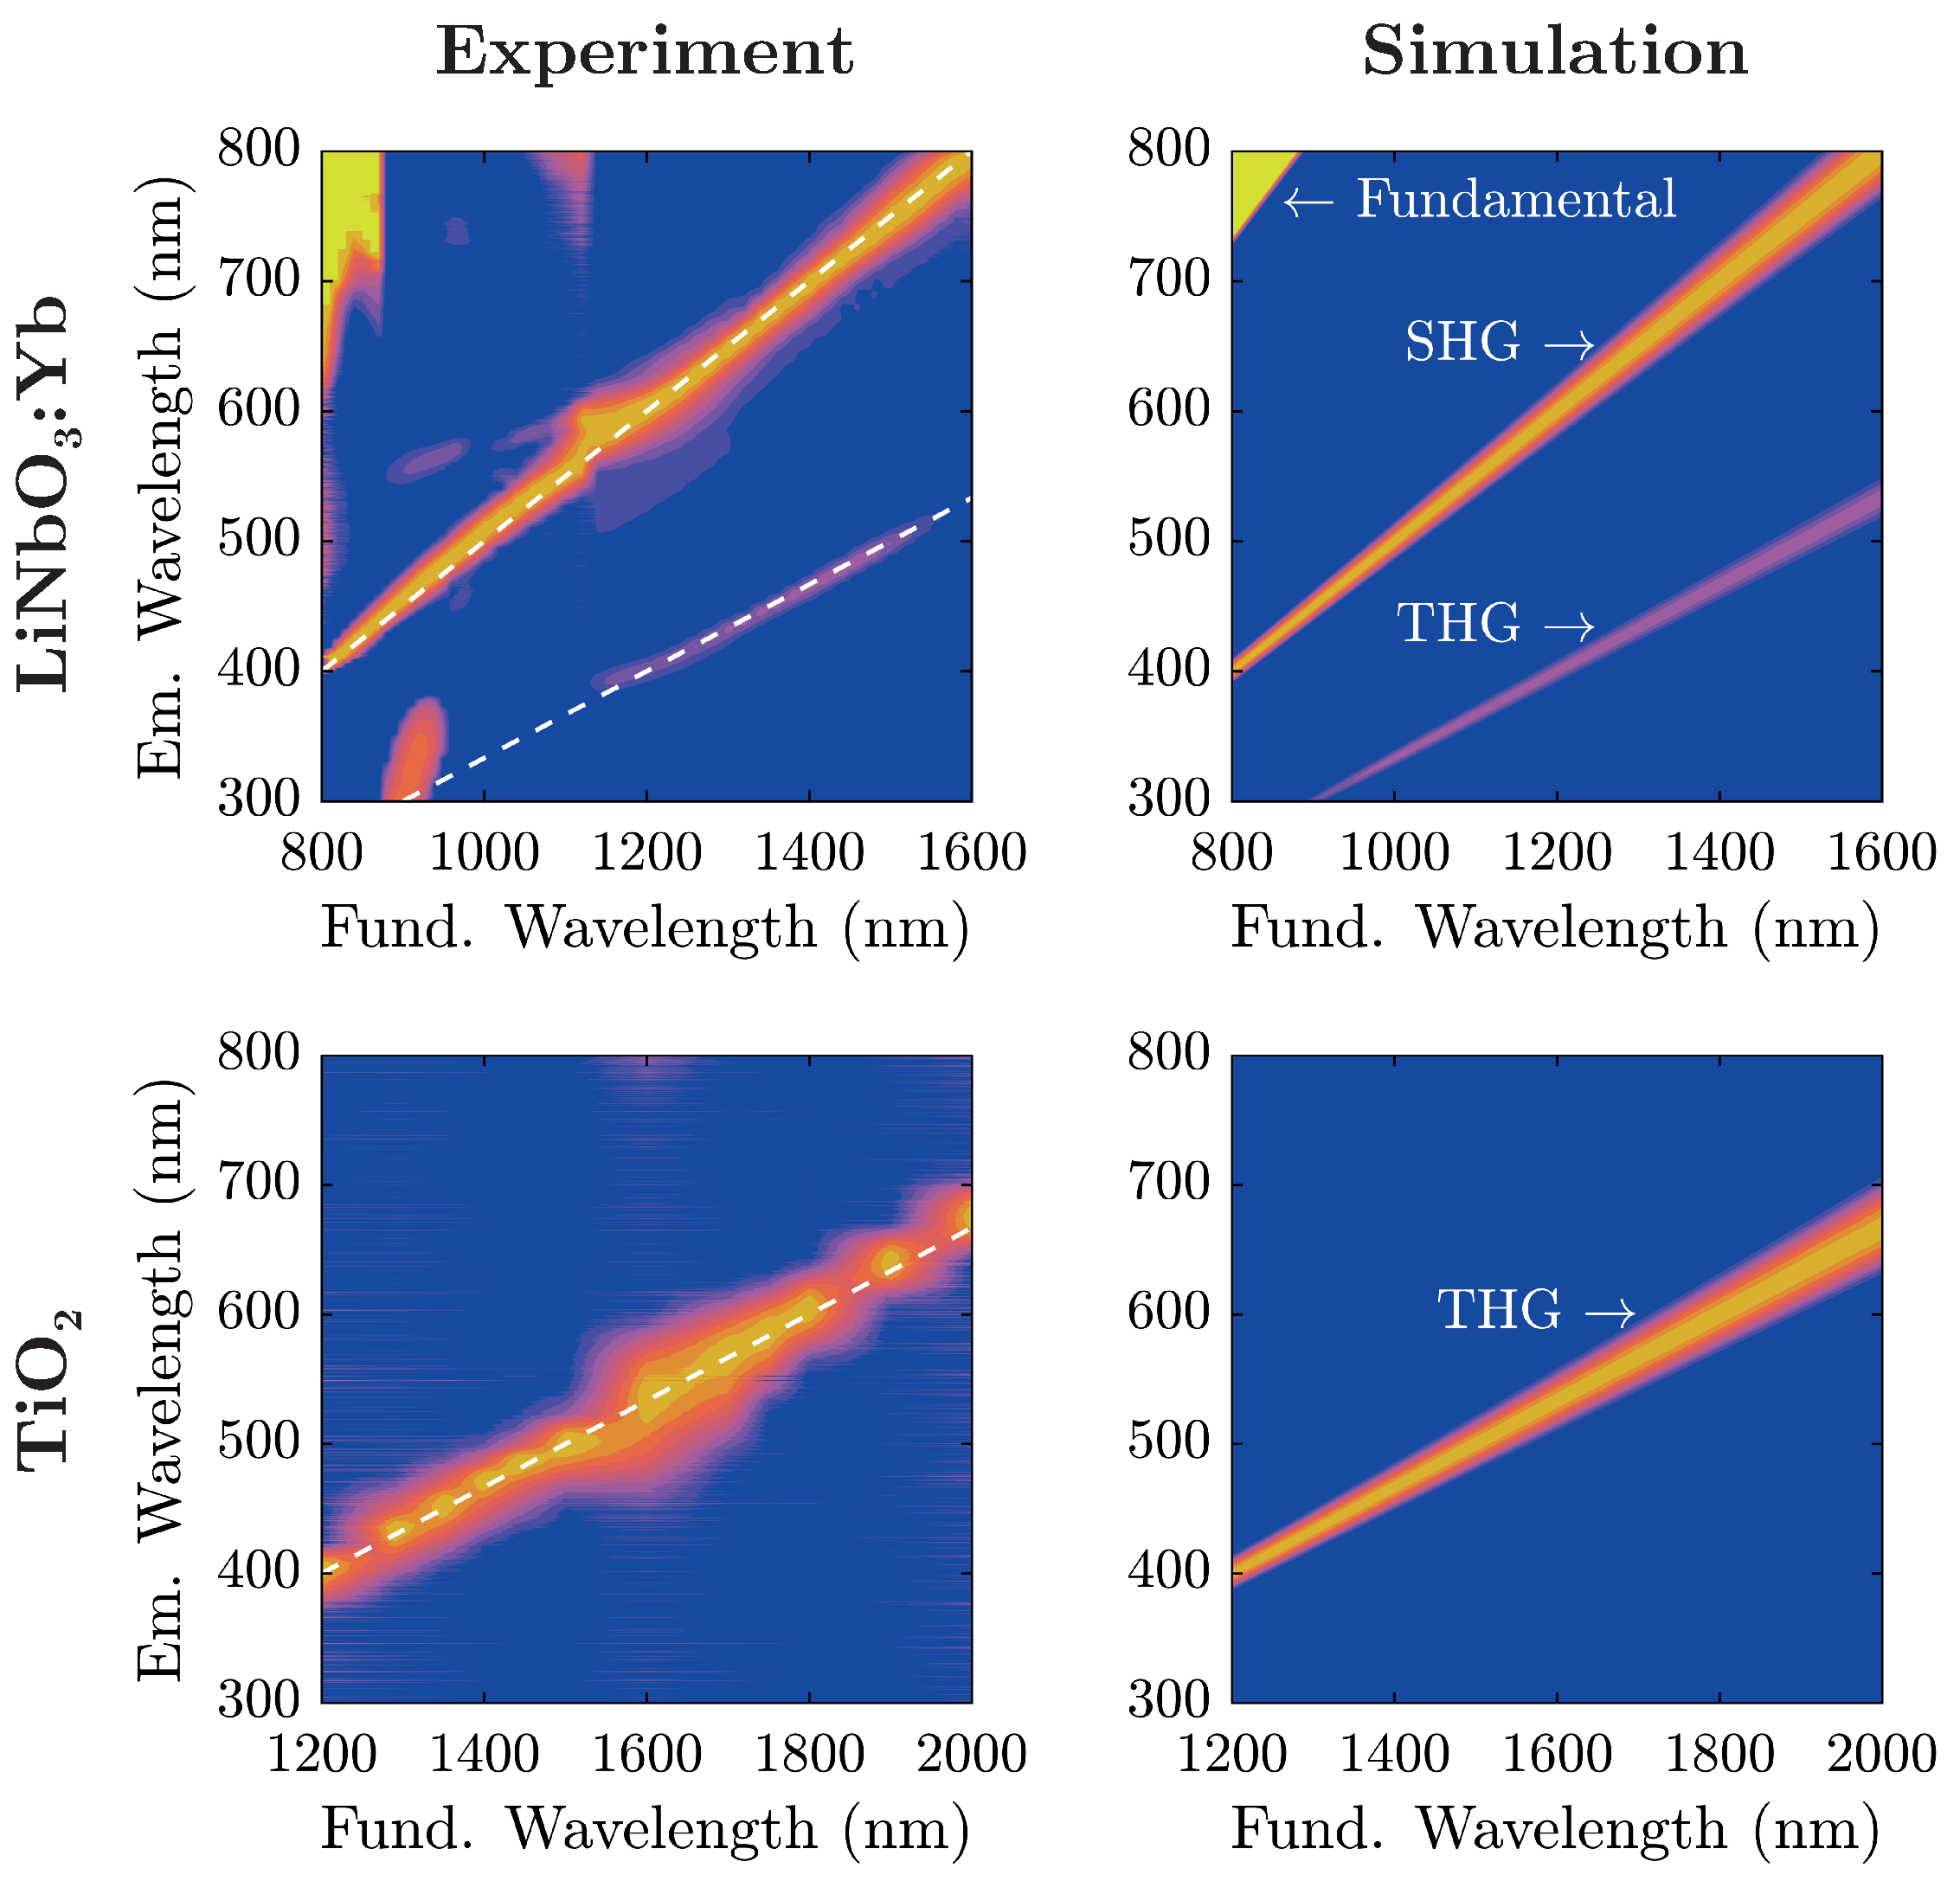
Initial proofs of principle are carried out by successive irradiation of the nanopowders with varying fundamental wavelengths for visual inspection. Results are presented in Figure 4, with the excitation wavelength shown at the bottom of each photograph.
Evidently, the two samples show similar spectral characteristics at a first glance with the TiO 2 -nanopowder sample exhibiting a color shift of emitted radiation in comparison to LiNbO 3 :Yb-nanopowder at equal excitation wavelengths. In fact, coming from shorter fundamental wavelengths, TiO 2 -nanopowder shows no visible radiation to the naked eye up to λ ω 1200 nm when blue light gradually emerges and with further increase of λ ω traverses the entire visible spectrum from blue to red. On the other hand, LiNbO 3 :Yb-nanopowder displays such characteristics twice; one in the same wavelength region, and another at significantly lower wavelengths (as low as λ ω 800 nm). The transition-zone between these two is located at λ ω 1400 nm, where the red emission gently gives way to blue light. For further examination, emission spectra have been collected for both samples and are shown in Figure 5 alongside theoretical considerations in terms of nonlinear harmonic emission characteristics.
For analysis, each recorded spectrum in Figure 5 has been baseline-corrected: spectra have been shifted on the intensity-scale such that the intensity is zero at wavelengths corresponding to no harmonic emission. For low fundamental wavelengths λ ω < 900 nm, the influence of the backscattered fundamental radiation can be seen. The additional lobe in the UV region excited at fundamental wavelengths around 900 n m stems from internal reflections inside the spectrograph, and does not correspond to an actual signal. A comparison with the simulated spectra shows that light emission in the visible range from the investigated nanopowders stems from nonlinear harmonic generation that—depending on the fundamental wavelength—can be attributed to either second or third harmonic generation.
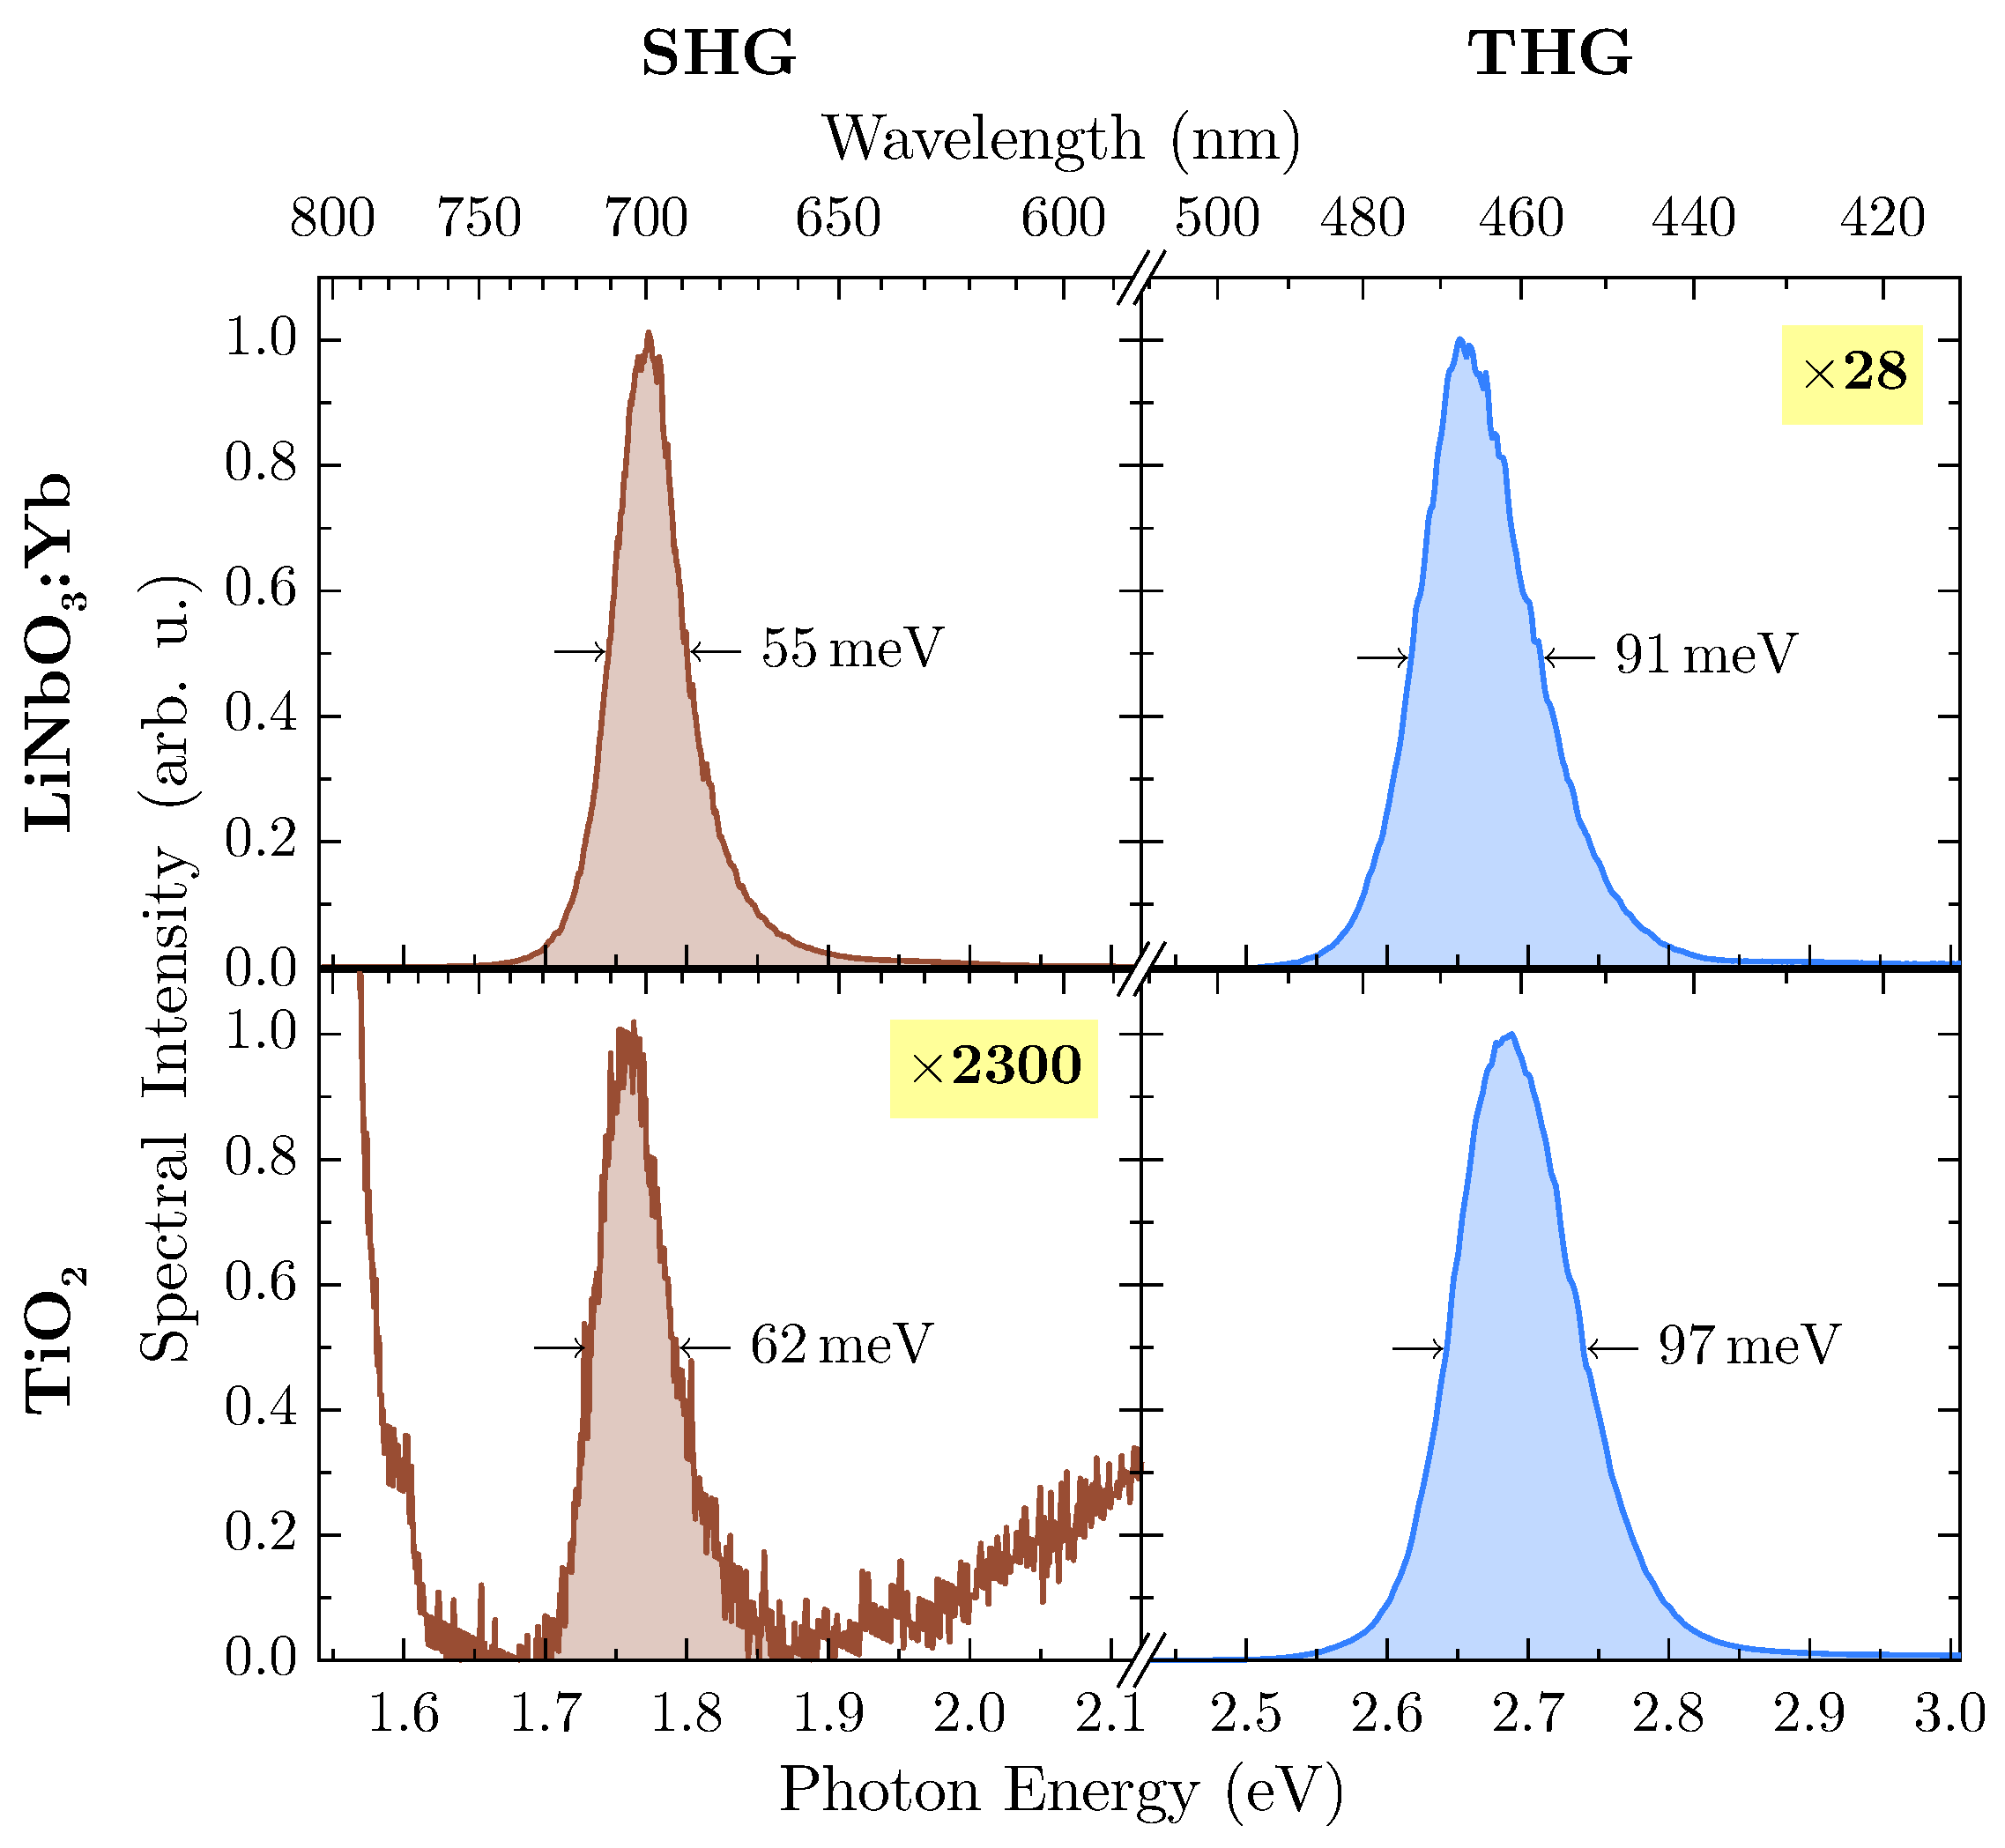
At an excitation wavelength of λ ω = 1400 nm, second and third harmonic radiation are inside the band gap of both materials so that subsequent absorption can be neglected. Undoubtedly, LiNbO 3 :Yb-nanopowder shows a significant amount of THG-intensity, so further investigation has been carried out at this wavelength. In Figure 6, harmonic emission peaks of both samples at this wavelength are shown in more detail.
With suitable magnification, the weaker harmonic emission can be detected from both samples, with TiO 2 offering SHG-intensity several orders of magnitude lower than THG while being located at the flank of the THG emission peak. For calculation of the integrated spectral intensity, this behavior has been accounted for by firstly subtracting a linear term from the SHG-peak modeling the THG-flank, thus rendering the influence of the latter to zero. With the more intense peak of each spectrum scaled to unity (as shown in Figure 6), data can be extracted for calculation of the harmonic ratio f R , which are presented in Table 1.
In case of LiNbO 3 :Yb-nanopowder, the harmonic ratio f R is well above unity, thus supporting the assumption of a polar medium. On the other hand, the TiO 2 -nanopowder exhibits only minor SHG emission, and THG dominates the harmonic spectrum by several orders of magnitude, thus resulting in f R 1 . This leads to the conclusion that measurements confirm the powder’s inversion symmetry.

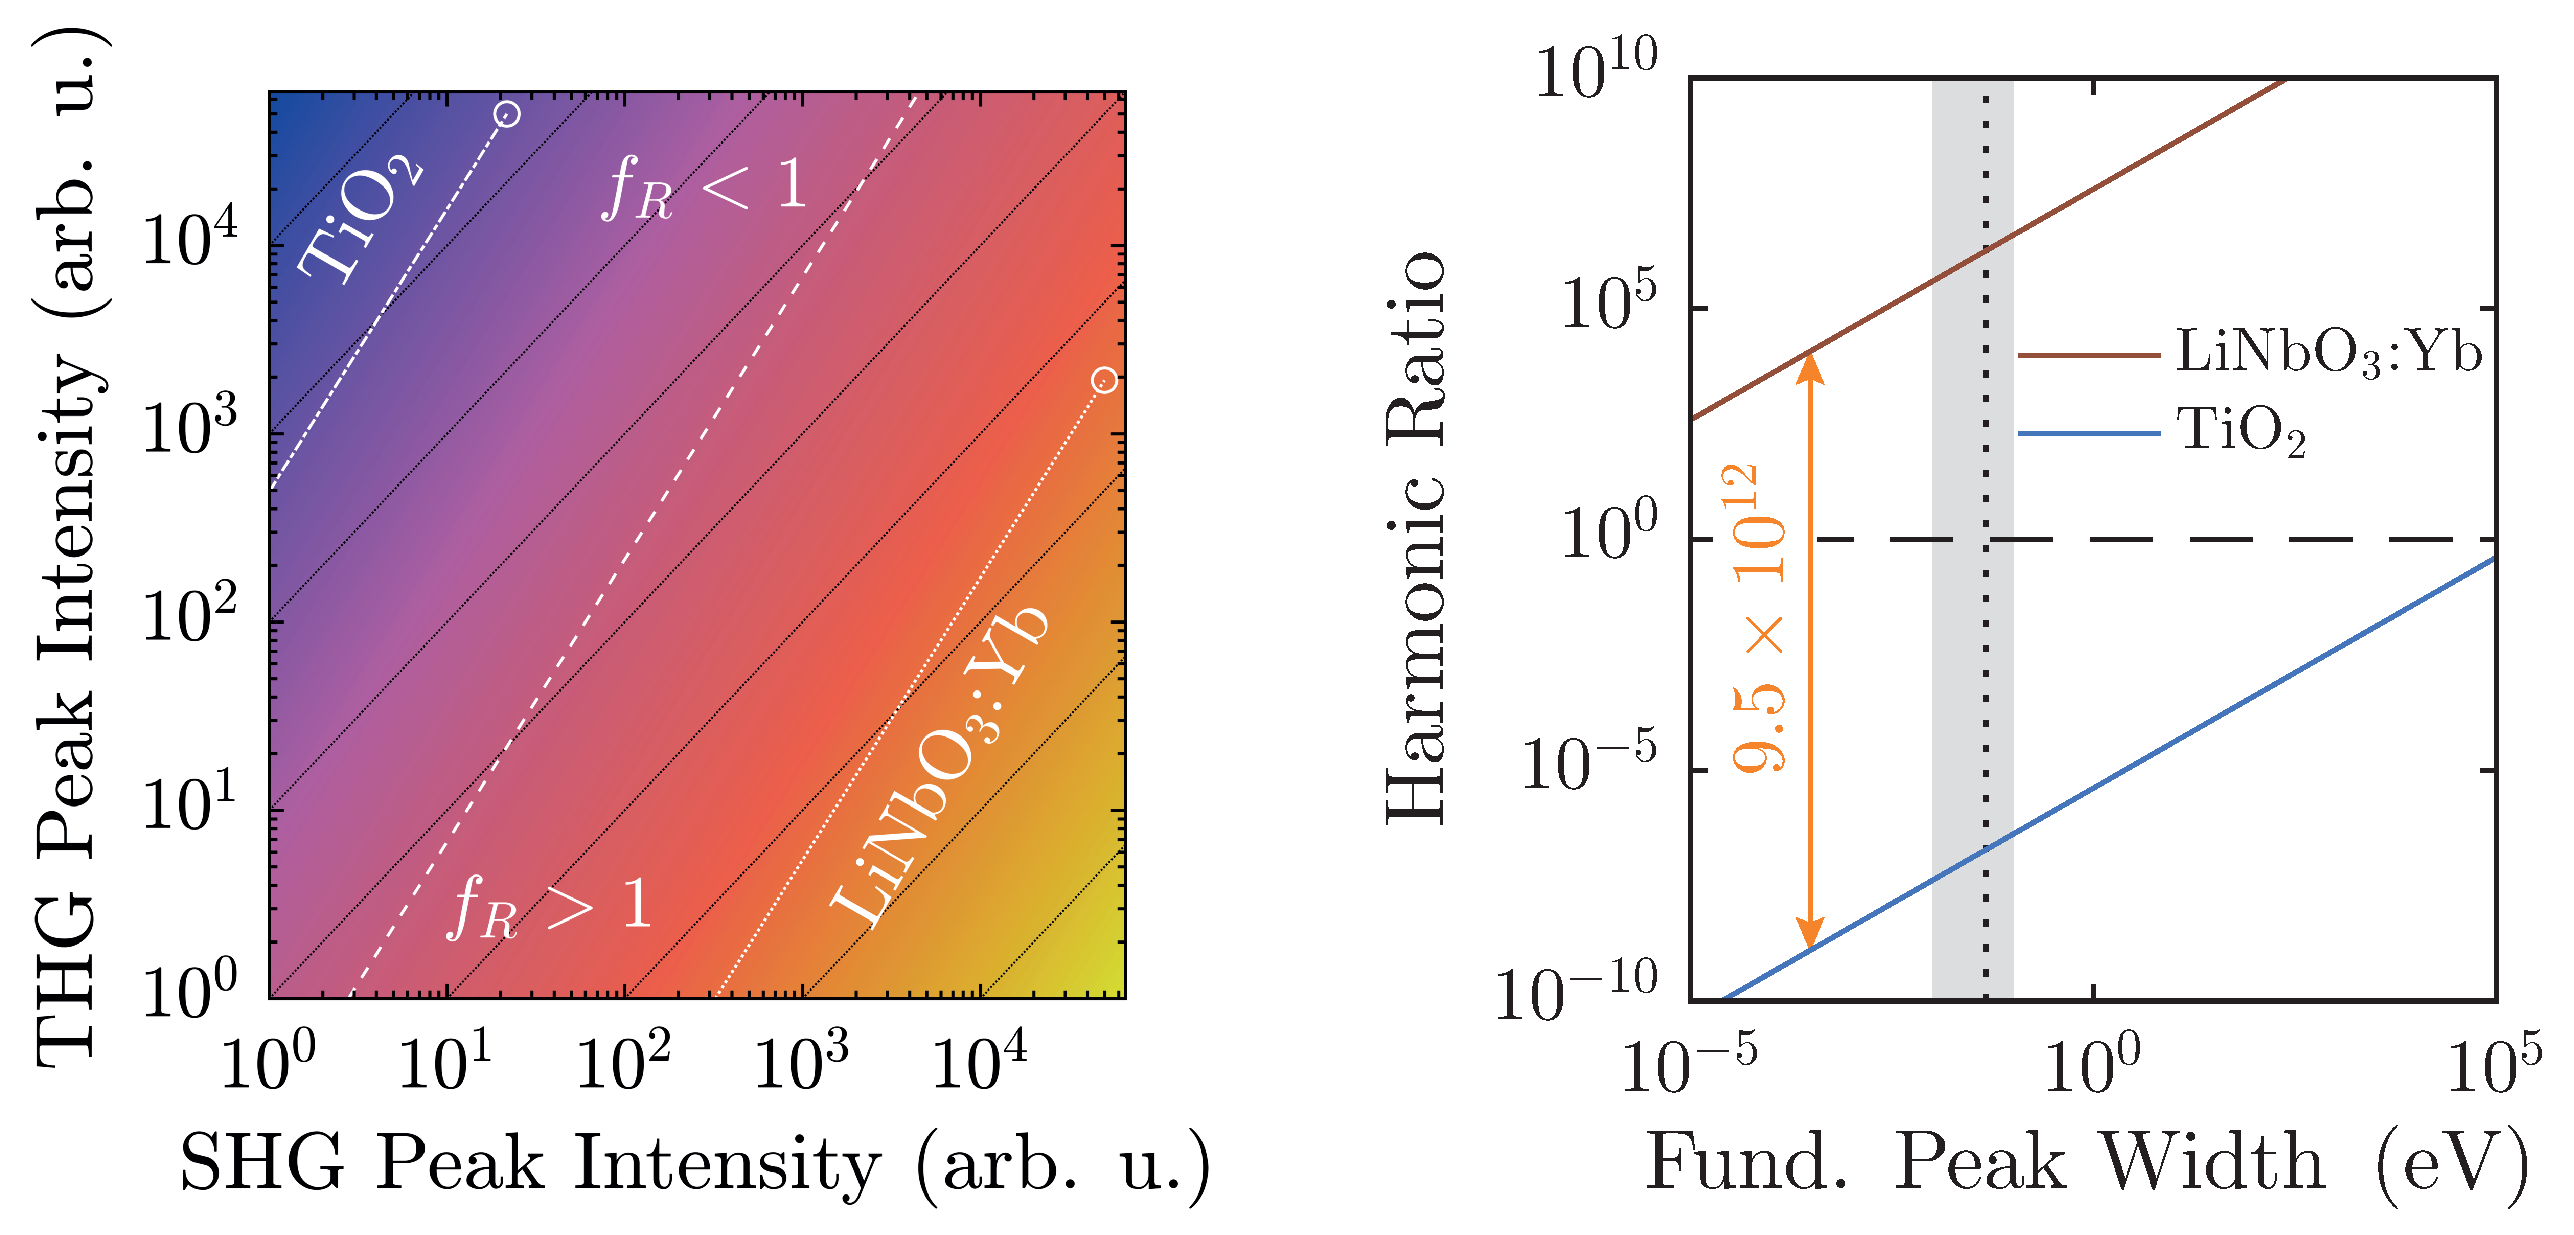
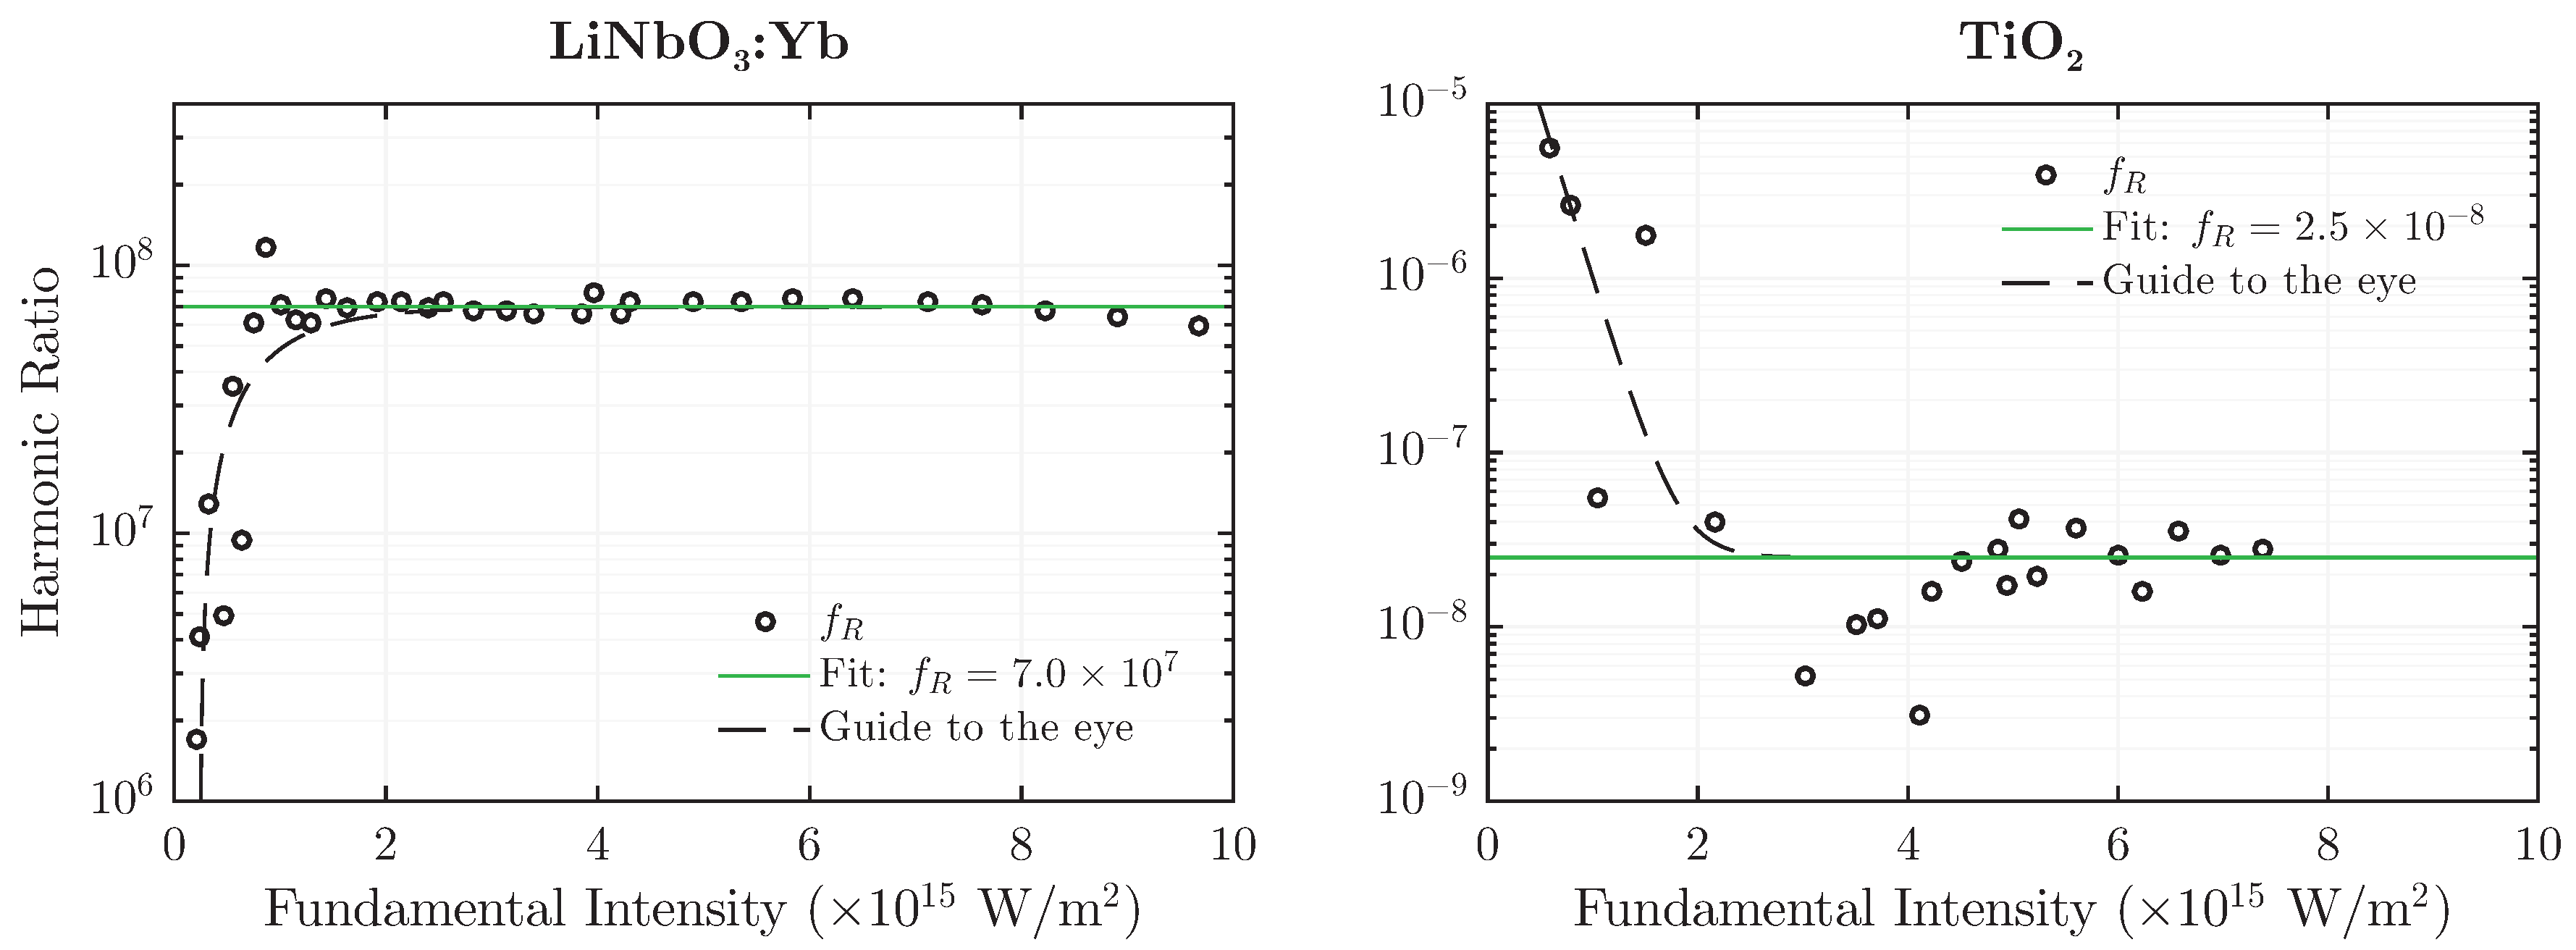
4.1. Intensity (In-)Dependence of the Harmonic Ratio

Due to the choice of exponents in Equation (5), the harmonic ratio is expected to be unaffected by intensity changes of the fundamental wave I ω . This functional (in-)dependence of f R on I ω is depicted in Figure 7 for both LiNbO 3 :Yb- and TiO 2 -nanopowder at a fundamental wavelength of λ ω = 1400 nm and λ ω = 1460 nm, respectively. The latter has been chosen for TiO 2 as a result of higher harmonic emission intensity, which is especially necessary for detection of the SHG-signal at lower fundamental intensities.
In contrast to results presented in Figure 6, data has not been scaled to unity, thereby altering the magnitude of f R . However, the overall result remains largely the same: f R is well above unity for the polar medium and several orders of magnitude below unity for the nonpolar one. Furthermore, the value remains constant over almost an order of magnitude of the fundamental intensity. Deviations from the uniformity can be observed in the low-intensity-regime, where the signal to noise-ratio drastically diminishes and thereby lets the weaker peak fade into a quasi-constant noise-background. This behavior is indicated in Figure 7 by the dashed guidelines. It should be noted that although the absolute values of f R have increased compared to the ones from Table 1, they are still separated from each other by over 13 decades; in fact, a separation factor on the order of 1015 is achieved.

5. Discussion

The results give strong evidence that our tool is appropriate to unambiguously distinguish between polar and nonpolar harmonic upconversion nanoparticles as exemplarily demonstrated for LiNbO 3 :Yb and TiO 2 . We note, however, that the absolute values of the harmonic ratio f R largely depend on the harmonic signals’ strengths, and thus on the specific experimental setup—in particular on the detection unit. Therefore, either spectroscopic calibration of the detection unit or the use of the same nonlinear optical setup throughout a systematic study as shown in this article is recommended. We further note the importance of the specific units involved in the calculation of f R , especially in the context of comparability with other setups and materials. For this purpose, f R is to be determined from the spectral intensity detected by the photometer (in counts) as a function of the photon energy (in eV).
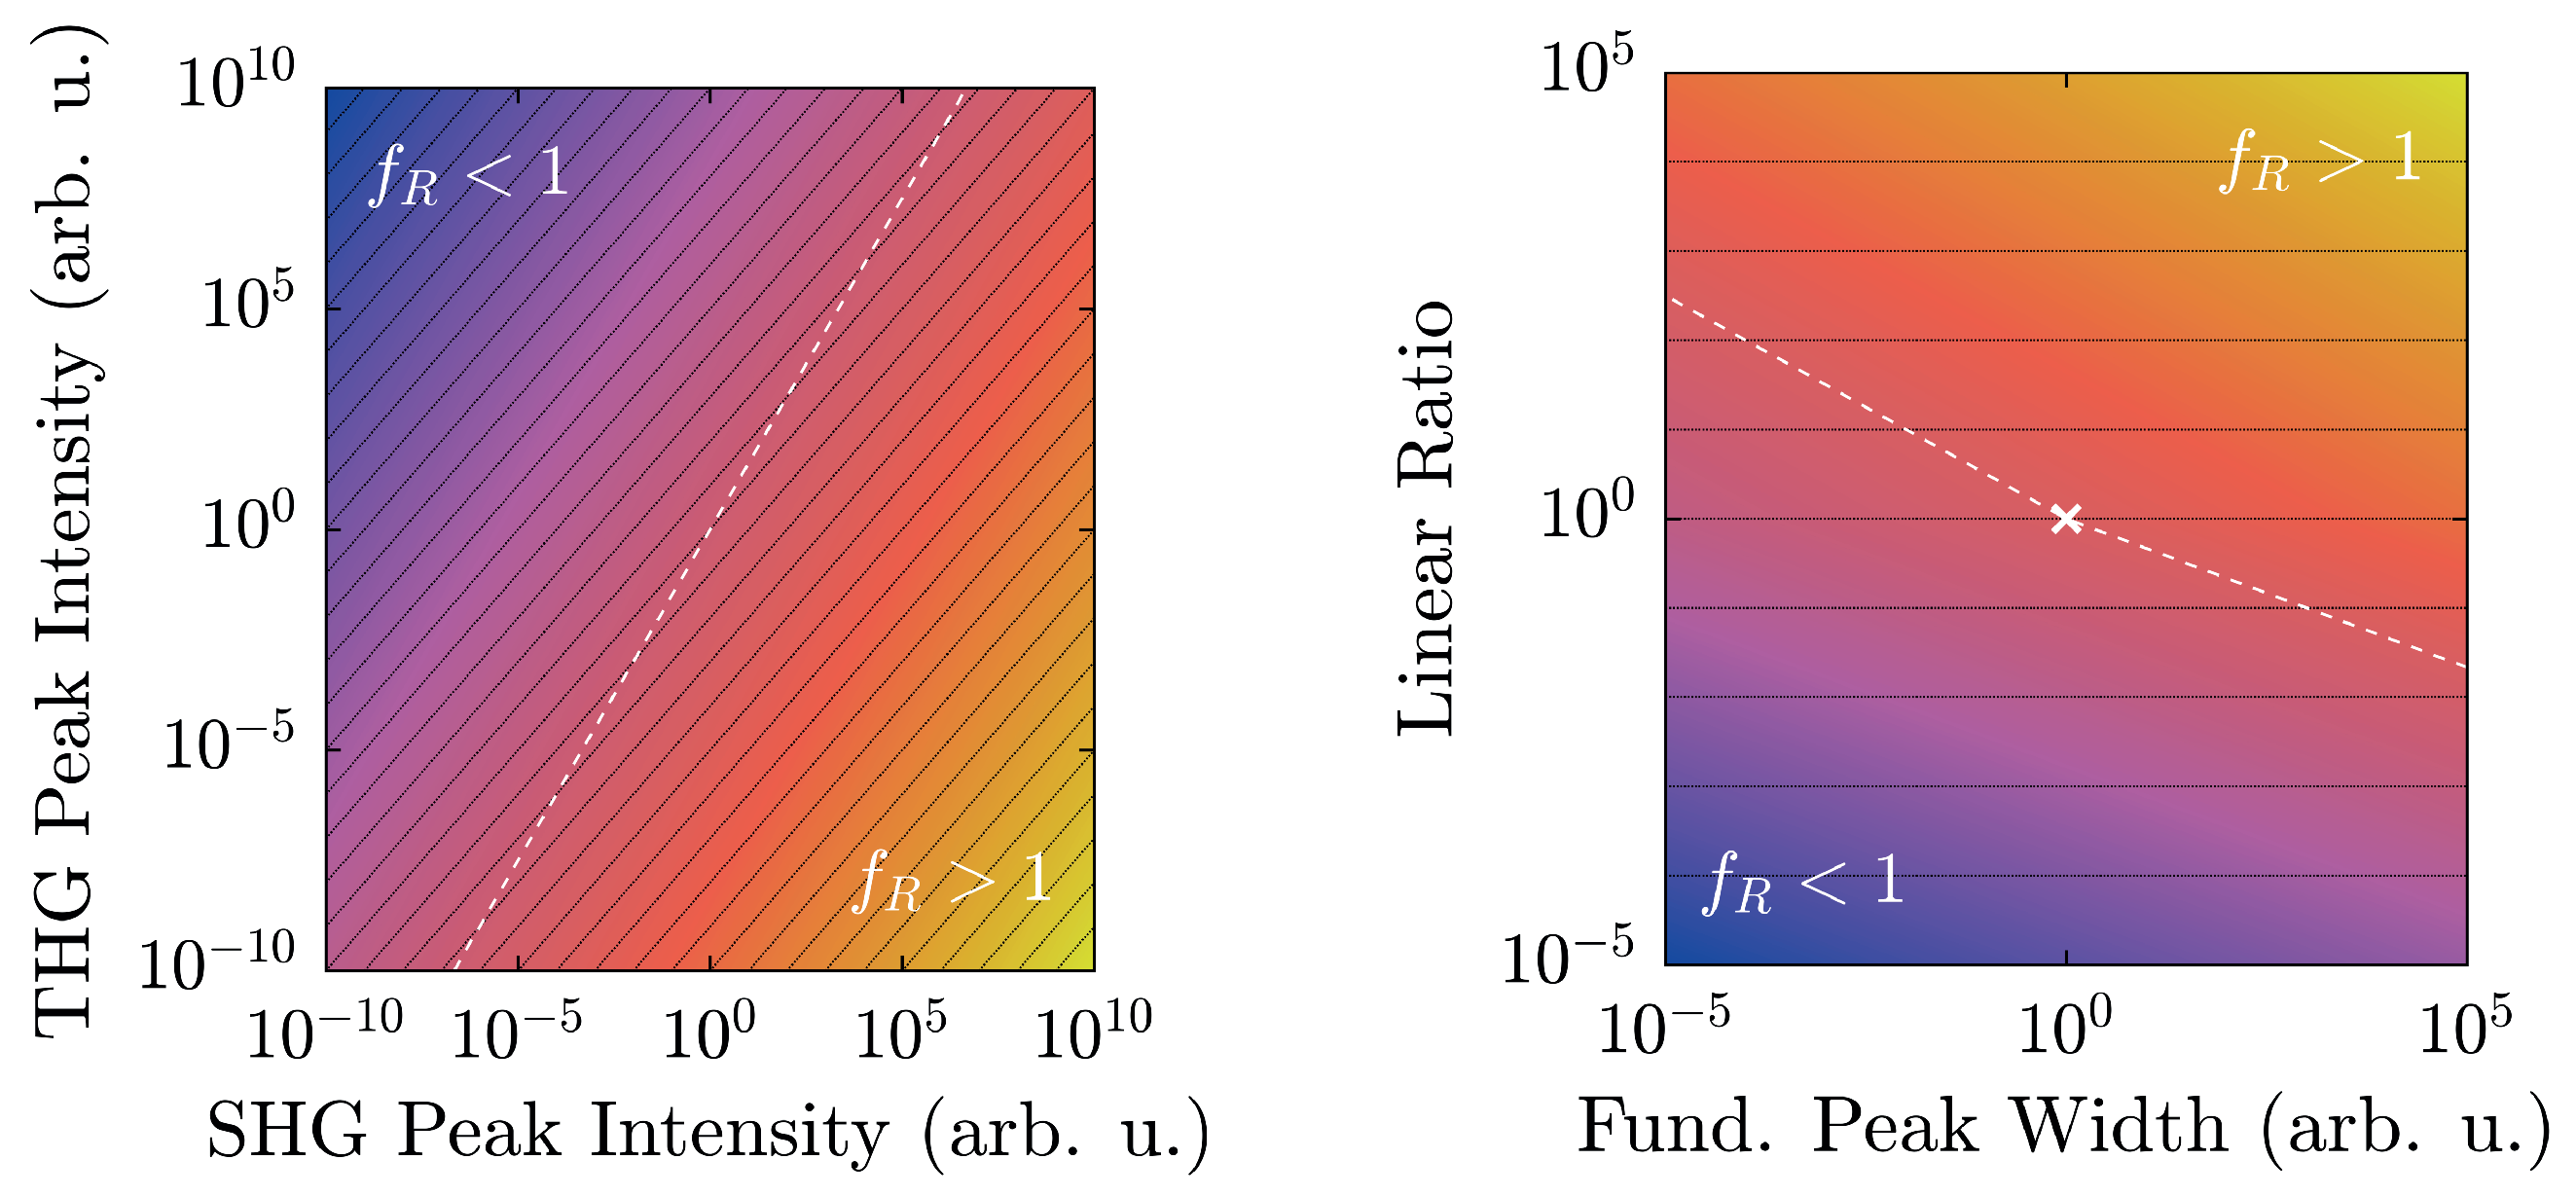
Additionally, with regard to f R , preliminary considerations in Section 2.2 have outlined the limits of its applicability. In fact, actual experimental conditions narrow the regime of physically realistic values even further, as shown in Figure 8.
At a maximum peak height of 50,000 counts, a typical value for a detection system scaling signals in 2 16 steps, and with a linear ratio given by the scaling factors of Figure 6, LiNbO 3 :Yb- and TiO 2 -nanopowders can be easily distinguished. Furthermore, they are both well-displaced in relation to the f R = 1 -line by approximately six to seven orders of magnitude. Taking the different scaling behaviors of the second and third harmonic intensities into account, weaker signals will run parallel to the f R = 1 -line as intensity-independent constants, and thus—ideally—never cross it. Of course, with diminishing signals, noise will eventually overwhelm the signal and may cause inconstant harmonic ratios that might approach unity as visible for both samples in Figure 7. With the goal of measuring high-quality spectra, the detection system should be readjusted at such points.
The spectral peak width-dependency as illustrated in Figure 8 (right) once more clarifies the clear distinction of f R between the two material classes. The linear ratios are taken from Figure 6, and the larger peak is scaled to 50,000 counts. In this case, the harmonic ratios differ by roughly thirteen decades, and each remains either above or below unity with no crossings in the depicted regime. When the FWHM is measured on the energy scale, typical values with our setup will be on the order of (10–100) meV, which corresponds to the shaded area. In fact, a Fourier-limited 40 fs-pulse possesses a FWHM of 46 meV, which is marked by the vertical black dashed line [41]. In order to attain a harmonic ratio of unity for LiNbO 3 :Yb-nanopowder with the same peak height yields a minimum pulse length τ min 450 ns. Therefore, with femtosecond-pulse setups, mix-ups with regard to the polarity—even with no reference standards for a given experimental arrangement—are highly unlikely.
Lastly, mixtures of particles with differing PSGs may be subject to investigation. In this case, even small fractions of polar samples will strengthen the otherwise minuscule SHG-peak, and thereby quickly push f R towards and above unity. In this case, the proposed method and evaluation can be used to trace fractions of polar media in an ensemble of nonpolar particles. For absolute determination of fractions, preliminary calibration with reference standards is required—ideally with pure samples whose mixtures are to be analyzed.
In fact, through calibration against a known material, this setup may also be capable of obtaining absolute values of nonlinear coefficients. The standard would be a nanocrystalline material of a well-defined size whose nonlinear coefficients—ideally both second- and third-order as a function of the wavelength—are known. Similar to linear optical characterization, measurements would then investigate upon the backscattered harmonic spectra, and thereby be able to examine material, size, and wavelength dependencies successively with a growing pool of data.
For LiNbO 3 :Yb-nanopowder, additional wavelength-dependent characterization has been conducted in the range λ ω = (1140–1580) nm. Within this range, slight fluctuations of the harmonic emission itself have been observed that could stem from the underlying absorption profile and especially the band gap itself [6]. On the other hand, the harmonic ratio f R remains well above 10 5 at fundamental intensities I ω = (1–9) PW/m2. Thus, the applicability of arbitrary fundamental wavelengths can be demonstrated, which is ultimately only limited by the optical absorption characteristics of the material under investigation. Detrimental factors can affect either THG (typically at the band edge), SHG (color centers and other defects), or both. In such case, an appropriate wavelength-triplet between fundamental, second harmonic, and third harmonic wave should be determined prior to nonlinear investigation; i.e., by diffuse reflectance spectroscopy, outlined in Section 3.
In conclusion, the presented investigations have revealed that nonlinear diffuse fs-pulse reflectometry serves as a tool for quickly assessing (non-)linear optical properties of nanomaterials. Together with the introduction of the harmonic ratio f R as a figure of merit, structural analysis has been conducted on a polar and a nonpolar substance with clear results. By using femtosecond pulses, the risk of thermal degradation can be vastly reduced. A positive side-effect is the boost of nonlinear harmonic generation by the inherently large peak intensities of such laser sources. Yet, the most striking advantage in comparison to other approaches is that this method is specifically tailored to the analysis of powders, thereby making use of the sheer number of nanocrystals to augment upconverted signals to easily detectable levels. Since the particles will be isotropically aligned in such powder plaques, a nonlinear signal will be picked up due to orientational averaging as soon as a single tensor-element is nonzero.
To summarize the workflow for structural clarification through investigation of the polarity: (1) synthesis of the material to be analyzed; (2) compressing the powder into a pellet; (3) obtaining a remission-spectrum to find an appropriate wavelength triplet of fundamental, SHG, and THG with negligible absorption; (4) recording of harmonic spectra; (5) determination of harmonic signals S n ω by integration of the respective baseline-corrected peak on an energy scale in eV; (6) calculation of the harmonic ratio f R according to Equation (5); (7) if f R 1 , the material is likely polar, if f R 1 , the powder exhibits nonpolar characteristics.
Furthermore, this technique is not limited to purely structural analysis. Additional cogitable subjects include higher harmonic generation beyond frequency-tripling, analysis of mixtures of two or more substances, or specific tailoring of illuminants for industrial purposes. It may further serve as an important additional tool for the determination of nonlinear optical coefficients when combined with polarization-dependent microscopy [42]. Extension to a vast array of nanoscaled materials, each with their very own properties, can thus be easily realized and will therefore likely be subject to future investigations.

Acknowledgments

The authors would like to thank KRONOS INTERNATIONAL, INC. for provision of TiO 2 -nanopowder samples. Financial support of Deutsche Forschungsgemeinschaft (DFG INST 190/165-1 FUGG), German Academic Exchange Service (DAAD 57139940), and Hungarian Tempus Foundation (MÖB 65056) is gratefully acknowledged.

Author Contributions

M.I., D.B., and C.K. conceived and designed the experiment; C.K., J.E., and S.B. performed the experiment; C.K., M.I., Z.S., and L.O. analyzed the data; L.O. and Z.S. synthesized LiNbO 3 :Yb-samples; M.I. and D.B. contributed analysis tools; C.K., J.E., and S.B. prepared samples; M.I., C.K., Z.K., and D.B. interpreted and discussed results; C.K. and M.I. wrote the paper.

Conflicts of Interest

The authors declare no conflict of interest. The founding sponsors had no role in the design of the study; in the collection, analyses, or interpretation of data; in the writing of the manuscript, and in the decision to publish the results.

References

  1. Zhou, B.; Shi, B.; Jin, D.; Liu, X. Controlling upconversion nanocrystals for emerging applications. Nat. Nanotechnol. 2015, 10, 924–936. [Google Scholar] [CrossRef] [PubMed]
  2. Drees, C.; Raj, A.N.; Kurre, R.; Busch, K.B.; Haase, M.; Piehler, J. Engineered Upconversion Nanoparticles for Resolving Protein Interactions inside Living Cells. Angew. Chem. Int. Ed. 2016, 55, 11668–11672. [Google Scholar] [CrossRef] [PubMed]
  3. Rogov, A.; Irondelle, M.; Ramos Gomes, F.; Bode, J.; Staedler, D.; Passemard, S.; Courvoisier, S.; Yamamoto, Y.; Waharte, F.; Ciepielewski, D.; et al. Simultaneous Multiharmonic Imaging of Nanoparticles in Tissues for Increased Selectivity. ACS Photonics 2015, 2, 1416–1422. [Google Scholar] [CrossRef]
  4. Campagnola, P.J.; Loew, L.M. Second-harmonic imaging microscopy for visualizing biomolecular arrays in cells, tissues and organisms. Nat. Nanotechnol. 2003, 21, 1356–1360. [Google Scholar] [CrossRef] [PubMed]
  5. Hsieh, C.L.; Grange, R.; Pu, Y.; Psaltis, D. Three-dimensional harmonic holographic microcopy using nanoparticles as probes for cell imaging. Opt. Express 2009, 17, 2880–2891. [Google Scholar] [CrossRef] [PubMed]
  6. Pantazis, P.; Maloney, J.; Wu, D.; Fraser, S.E. Second harmonic generating (SHG) nanoprobes for in vivo imaging. Proc. Natl. Acad. Sci. USA 2010, 107, 14535–14540. [Google Scholar] [CrossRef] [PubMed]
  7. Chen, O.; Zhao, J.; Chauhan, V.P.; Cui, J.; Wong, C.; Harris, D.K.; Wei, H.; Han, H.S.; Fukumura, D.; Jain, R.K.; et al. Compact high-quality CdSe-CdS core-shell nanocrystals with narrow emission linewidths and suppressed blinking. Nat. Mater. 2013, 12, 445–451. [Google Scholar] [CrossRef] [PubMed] [Green Version]
  8. Dolmans, D.E.J.G.J.; Fukumura, D.; Jain, R.K. Photodynamic therapy for cancer. Nat. Rev. Cancer 2003, 3, 380–387. [Google Scholar] [CrossRef] [PubMed]
  9. Boyd, R.W. Nonlinear Optics, 3rd ed.; Academic Press: Amsterdam, The Netherlands; Boston, MA, USA, 2008. [Google Scholar]
  10. Deisseroth, K.; Feng, G.; Majewska, A.K.; Miesenböck, G.; Ting, A.; Schnitzer, M.J. Next-Generation Optical Technologies for Illuminating Genetically Targeted Brain Circuits. J. Neurosci. 2006, 26, 10380–10386. [Google Scholar] [CrossRef] [PubMed]
  11. Toettcher, J.E.; Voigt, C.A.; Weiner, O.D.; Lim, W.A. The promise of optogenetics in cell biology: Interrogating molecular circuits in space and time. Nat. Methods 2011, 8, 35–38. [Google Scholar] [CrossRef] [PubMed]
  12. Cannon, J.R.; Cammarata, M.B.; Robotham, S.A.; Cotham, V.C.; Shaw, J.B.; Fellers, R.T.; Early, B.P.; Thomas, P.M.; Kelleher, N.L.; Brodbelt, J.S. Ultraviolet Photodissociation for Characterization of Whole Proteins on a Chromatographic Time Scale. Anal. Chem. 2014, 86, 2185–2192. [Google Scholar] [CrossRef] [PubMed]
  13. Bonacina, L. Nonlinear Nanomedecine: Harmonic Nanoparticles toward Targeted Diagnosis and Therapy. Mol. Pharm. 2013, 10, 783–792. [Google Scholar] [CrossRef] [PubMed]
  14. Liu, T.M.; Conde, J.; Lipiński, T.; Bednarkiewicz, A.; Huang, C.C. Revisiting the classification of NIR-absorbing/emitting nanomaterials for in vivo bioapplications. NPG Asia Mater. 2016, 8, e295. [Google Scholar] [CrossRef]
  15. Jones, G.O.; Thomas, P.A. Investigation of the structure and phase transitions in the novel A-site substituted distorted perovskite compound Na0.5Bi0.5TiO3. Acta Crystallogr. Sect. B Struct. Sci. 2002, 58, 168–178. [Google Scholar] [CrossRef]
  16. Buchsbaum, C.; Schmidt, M.U. Rietveld refinement of a wrong crystal structure. Acta Crystallogr. Sect. B Struct. Sci. 2007, 63, 926–932. [Google Scholar] [CrossRef] [PubMed]
  17. Kim, E.; Steinbrück, A.; Buscaglia, M.T.; Buscaglia, V.; Pertsch, T.; Grange, R. Second-Harmonic Generation of Single BaTiO3 Nanoparticles down to 22 nm Diameter. ACS Nano 2013, 7, 5343–5349. [Google Scholar] [CrossRef] [PubMed]
  18. Stuart, B.C.; Feit, M.D.; Herman, S.; Rubenchik, A.M.; Shore, B.W.; Perry, M.D. Nanosecond-to-femtosecond laser-induced breakdown in dielectrics. Phys. Rev. B 1996, 53, 1749–1761. [Google Scholar] [CrossRef]
  19. Kurtz, S.K.; Perry, T.T. A Powder Technique for the Evaluation of Nonlinear Optical Materials. J. Appl. Phys. 1968, 39, 3798–3813. [Google Scholar] [CrossRef]
  20. Clays, K.; Persoons, A. Hyper-Rayleigh scattering in solution. Phys. Rev. Lett. 1991, 66, 2980–2983. [Google Scholar] [CrossRef] [PubMed]
  21. Shen, Y.R. Surface Second Harmonic Generation: A New Technique for Surface Studies. Annu. Rev. Mater. Sci. 1986, 16, 69–86. [Google Scholar] [CrossRef]
  22. Heinz, T.F. Second-Order Nonlinear Optical Effects at Surfaces and Interfaces. In Modern Problems in Condensed Matter Sciences; Ponath, H.E., Stegeman, G.I., Eds.; Elsevier: Amsterdam, The Netherlands, 1991; Volume 29, pp. 353–416. [Google Scholar]
  23. Dadap, J.I.; Shan, J.; Eisenthal, K.B.; Heinz, T.F. Second-Harmonic Rayleigh Scattering from a Sphere of Centrosymmetric Material. Phys. Rev. Lett. 1999, 83, 4045–4048. [Google Scholar] [CrossRef]
  24. Shen, Y.R. The Principles of Nonlinear Optics; J. Wiley: New York, NY, USA, 1984. [Google Scholar]
  25. Banks, P.S.; Feit, M.D.; Perry, M.D. High-intensity third-harmonic generation. J. Opt. Soc. Am. B 2002, 19, 102–118. [Google Scholar] [CrossRef]
  26. Bosshard, C.; Gubler, U.; Kaatz, P.; Mazerant, W.; Meier, U. Non-phase-matched optical third-harmonic generation in noncentrosymmetric media: Cascaded second-order contributions for the calibration of third-order nonlinearities. Phys. Rev. B 2000, 61, 10688–10701. [Google Scholar] [CrossRef]
  27. Mateos, L.; Ramírez, M.O.; Carrasco, I.; Molina, P.; Galisteo-López, J.F.; Víllora, E.G.; de las Heras, C.; Shimamura, K.; Lopez, C.; Bausá, L.E. BaMgF4: An Ultra-Transparent Two-Dimensional Nonlinear Photonic Crystal with Strong χ(3) Response in the UV Spectral Region. Adv. Funct. Mater. 2014, 24, 1509–1518. [Google Scholar] [CrossRef]
  28. Dai, J.; Yuan, M.H.; Zeng, J.H.; Dai, Q.F.; Lan, S.; Xiao, C.; Tie, S.L. Controllable color display induced by excitation-intensity-dependent competition between second and third harmonic generation in ZnO nanorods. Appl. Opt. 2014, 53, 189–194. [Google Scholar] [CrossRef] [PubMed]
  29. Torrent, J.; Barrón, V. Diffuse Reflectance Spectroscopy. In Methods of Soil Analysis: Part 5. Mineralogical Methods; Ulery, A.L., Drees, L.R., Eds.; Soil Science Society of America: Madison, WI, USA, 2008. [Google Scholar]
  30. Kortüm, G. Reflectance Spectroscopy: Principles, Methods, Applications; Springer: New York, NY, USA, 1969. [Google Scholar]
  31. Volk, T.; Wöhlecke, M. Lithium Niobate: Defects, Photorefraction and Ferroelectric Switching; Springer: Berlin, Germany, 2008. [Google Scholar]
  32. Arizmendi, L. Photonic applications of lithium niobate crystals. Phys. Status Solidi A 2004, 201, 253–283. [Google Scholar] [CrossRef]
  33. Haussühl, S. Kristallgeometrie, 2nd ed.; VCH: Weinheim, Germany, 1993. [Google Scholar]
  34. Howard, C.J.; Sabine, T.M.; Dickson, F. Structural and thermal parameters for rutile and anatase. Acta Crystallogr. Sect. B Struct. Sci. 1991, 47, 462–468. [Google Scholar] [CrossRef]
  35. Kubelka, P.; Munk, F. Ein Beitrag zur Optik der Farbanstriche. Zeitschrift Für Technische Physik 1931, 12, 593–601. [Google Scholar]
  36. Escobedo Morales, A.; Sánchez Mora, E.; Pal, U. Use of diffuse reflectance spectroscopy for optical characterization of un-supported nanostructures. Revista Mexicana de Fisica S 2007, 53, 18–22. [Google Scholar]
  37. Smith, R.A. Semiconductors, 2nd ed.; Cambridge Univ. Press: Cambridge, UK, 1978. [Google Scholar]
  38. Tauc, J.; Grigorovici, R.; Vancu, A. Optical Properties and Electronic Structure of Amorphous Germanium. Phys. Status Solidi B 1966, 15, 627–637. [Google Scholar] [CrossRef]
  39. Tauc, J. Optical properties and electronic structure of amorphous Ge and Si. Mater. Res. Bull. 1968, 3, 37–46. [Google Scholar] [CrossRef]
  40. Ganeev, R.A.; Suzuki, M.; Baba, M.; Kuroda, H.; Kulagin, I.A. Third-harmonic generation in air by use of femtosecond radiation in tight-focusing conditions. Appl. Opt. 2006, 45, 748–755. [Google Scholar] [CrossRef] [PubMed]
  41. Träger, F. (Ed.) Springer Handbook of Lasers and Optics, 2nd ed.; Springer: Dordrecht, The Netherlands; New York, NY, USA, 2012.
  42. Schmidt, C.; Riporto, J.; Uldry, A.; Rogov, A.; Mugnier, Y.; Dantec, R.L.; Wolf, J.P.; Bonacina, L. Multi-Order Investigation of the Nonlinear Susceptibility Tensors of Individual Nanoparticles. Sci. Rep. 2016, 6, 25415. [Google Scholar] [CrossRef] [PubMed]
Figure 1. Logarithmized harmonic ratio log 10 ( f R ) as a function of spectral peak intensities according to Equation (6) with s = 1 (left) and as a function of the spectral peak width and the linear ratio A 2 ω / A 3 ω with max ( A 2 ω , A 3 ω ) = 1 (right). The white dashed line marks value-pairs where f R = 1 , whereas black lines illustrate equal ratios between second harmonic generation (SHG)- and third harmonic generation (THG)-peaks. Values scale from blue over red to yellow.
Photonics 04 00011 g001
Figure 2. (Left): prepared powder plaque for optical characterization; (Right): schematic experimental setup for nonlinear diffuse fs-pulse reflectometry. Str.: pulse-stretcher, RGA: regenerative amplifier, Cmp.: pulse-compressor, OPA: optical parametric amplifier, F: filter, M: mirror, S: sample. Further information can be found in the accompanying text.
Photonics 04 00011 g002
Figure 3. Diffuse reflectance spectra of LiNbO 3 :Yb- (left) and TiO 2 -nanopowder (right). Insets are corresponding Tauc-plots for determining the indirect allowed band edge. Further information is found in the accompanying text.
Photonics 04 00011 g003
Figure 4. Harmonic emission of LiNbO 3 :Yb- (top) and TiO 2 -nanopowder (bottom) at different fundamental wavelengths in the range λ ω = (900–1900) nm photographed with a digital camera. A shortpass filter was placed in front of the camera lens to suppress residue infrared pump radiation.
Photonics 04 00011 g004
Figure 5. (Left): baseline-corrected emission spectra of LiNbO 3 :Yb- (top) and TiO 2 -nanopowder (bottom) as a function of the fundamental wavelength. Dashed lines indicate SHG- and THG-peak positions. Each spectrum’s most significant peak has been scaled to unity; (Right): simulated spectra with their respective emission characteristics based on the spectral properties of the fundamental beam. All spectra are plotted on a logarithmic intensity scale with values exceeding unity clipped to one. Values scale from blue over red to yellow.
Photonics 04 00011 g005
Figure 6. Baseline-corrected and normalized emission spectra of LiNbO 3 :Yb- (top) and TiO 2 -nanopowder (bottom) at a fundamental wavelength λ ω = 1400 nm. The less intense peak has been scaled up to unity with displayed factors for clarity. Fundamental intensities for both samples are on the order of (9 ± 2) × 1015 W/m2 . Peak areas for calculation of the harmonic ratio are shaded.
Photonics 04 00011 g006
Figure 7. Harmonic ratio f R of LiNbO 3 :Yb- (left) and TiO 2 -nanopowder (right) as a function of the fundamental peak intensity I ω at a wavelength λ ω = 1400 nm (left) and λ ω = 1460 nm (right).
Photonics 04 00011 g007
Figure 8. Left: logarithmized harmonic ratio log 10 ( f R ) as a function of spectral peak intensities according to Equation (6), with s = 46   m e V ; the colors scale from 11 (blue) to 13 (yellow). Harmonic ratios of LiNbO 3 :Yb (dotted) and TiO 2 (dash-dotted) are simulated for max ( A 2 ω , A 3 ω ) = 50,000, their linear ratio given by the scaling factors of Figure 6, and extrapolated to low intensities. Right: f R of LiNbO 3 :Yb and TiO 2 as a function of the fundamental peak width s measured on an energy-scale with the linear ratio taken from Figure 6 and max ( A 2 ω , A 3 ω ) = 50,000. The horizontal dashed black line marks f R = 1 , whereas the vertical one marks s = 46   m e V . Shaded in light gray are typically accessible experimental peak widths. Both ratios are separated by a factor of almost 1013.
Photonics 04 00011 g008
Table 1. Relevant values for the determination of the harmonic ratio f R extracted from Figure 6. FWHM is the full width at half maximum of each peak, the signal S is given by the area under the peak and the indexes 2 ω and 3 ω denote the second and third harmonic, respectively.
FWHM2ωFWHM3ωS2ωS3ωfR
LiNbO3:Yb55 m e V 91 m e V 7.12 × 10−24.18 × 10−320.7
TiO262 m e V 97 m e V 2.90 × 10−51.13 × 10−11.93 × 10⁻¹²

