Article

Optical Analysis of the Oils Obtained from Acrocomia aculeata (Jacq.) Lodd: Mapping Absorption-Emission Profiles in an Induced Oxidation Process

by
Ivan P. De Oliveira
1,
Willian A. Correa
1,
Priscila V. Neves
1,
Perla V. B. Silva
1,
Caroline H. Lescano
1,
Flávio S. Michels
1,
Wilson E. Passos
1,
Rozanna M. Muzzi
1,
Samuel L. Oliveira
2 and
Anderson R. L. Caires
2,*
1
Faculdade de Ciências Exatas e Tecnologia, Universidade Federal da Grande Dourados, 79804-970 Dourados-MS, Brazil
2
Grupo de Óptica e Fotônica, Instituto de Física, Universidade Federal de Mato Grosso do Sul, 79070-900 Campo Grande-MS, Brazil
*
Author to whom correspondence should be addressed.
Photonics 2017, 4(1), 3; https://doi.org/10.3390/photonics4010003
Submission received: 29 November 2016 / Revised: 29 December 2016 / Accepted: 4 January 2017 / Published: 6 January 2017

Abstract

:
Acrocomia aculeata is a palm tree typical of the Brazilian savanna. Oils extracted from the pulp and kernel of Acrocomia aculeata fruits have gained considerable attention mainly due to their nutritional and medicinal features. Despite their potential applications, a detailed analysis of their oxidative stability is still needed. The present study shows a close analysis of the oxidative stability of the oils obtained from the kernel and pulp of Acrocomia aculeata fruits, evaluating the influence of the intrinsic antioxidants and the fatty acid composition on the oil’s thermal stability. A complete characterization of the physical-chemical and optical properties of the oils was performed. The results showed that 66% of the fatty acids present in the pulp oil are unsaturated, while 75% are saturated in the kernel oil. A higher content of intrinsic antioxidants was obtained in the pulp oil, and an induction period (at 110 °C) of 65 and 43 h was determined for the pulp and kernel oil, respectively. Additionally, oil absorption increases due to the formation of degradation products, and a new fluorescent compound was formed during the oil oxidation process at 110 °C. Even though the pulp presented a high content of unsaturated fatty acids, the pulp oil was more stable than the kernel oil due to its higher content of intrinsic antioxidant, especially carotenoids. The results also demonstrated that oil oxidation can be optically determined by analyzing the absorption at 232 and 270 nm, as well as the emission at 424 nm.

Graphical Abstract

1. Introduction

Native foods from Brazilian biodiversity have caught the attention of the scientific community [1]. For instance, Acrocomia aculeata (Jacq.) Lodd. is a palm tree typical of the Brazilian savanna [2], and its fruits are commonly used by the local community as traditional food. This palm tree is an example of candidate crop that can be used as an alternative feedstock to obtain new nutritional resources. In addition, the fruits of Acrocomia aculeata are rich in oils, which have also gained attention due to their potential for use in the cosmetic, pharmaceutical, and energy industry [3,4,5,6,7,8]. The high oil productivity is also well observed, with a yield of approx. 4000 t of oil ha−1 [8].
The fruits of A. aculeata are interesting because of their nutritional properties: (1) a high content of total lipids in pulp (24%) and kernel (47%); (2) proteins in pulp (5%) and kernel (16%); (3) carbohydrates in pulp (7%) and kernel (6%) and (4) total fibers in pulp (14%) and kernel (16%). Moreover, considerable quantities of minerals are found in both parts of the fruit, such as macronutrients calcium and magnesium, and micronutrients copper, manganese, iron, and zinc [9]. The Acrocomia aculeata oils can be extracted from the pulp and kernel, and each oil presents particular characteristics regarding both the fatty acid composition and the presence of secondary compounds, such as tocopherols and carotenoids [3,4]. In general, the pulp’s composition is comprised of approximately 73% unsaturated fatty acids, especially oleic acid (C18:1) and linoleic acid (C18:2). On the contrary, the kernel has 60% saturated fatty acids in its composition, of which lauric acid (C12:0), myristic acid (C14:0), and palmitic acid (C16:0) are commonly found [5]. In addition, the pulp´s oil is rich in tocopherols and carotenoids, which are natural antioxidants [4,5,6].
During the oil oxidation process, the molecular structures of the triacylglycerols, especially the carbon–carbon double bond of fatty acid chains [10], can be altered by the interaction with the oxygen, forming degradation compounds such as peroxides, aldehydes, ketones, and carboxylic acids [11]. Several methods, based on viscosity, peroxide value, acid value, iodine value, and Rancimat analysis have been used to evaluate oil oxidation [12,13]. However, these techniques are not easily applicable and require a long time for analysis. Recently, UV-Vis absorption spectroscopy has been proposed for monitoring the oxidation of the triacylglycerol by analyzing the absorption increase at 232 and 270 nm, corresponding to the primary and secondary stages of oxidation, respectively [14,15,16,17,18]. Alternatively, fluorescence spectroscopy can also be employed to evaluate the oxidation process of oils by monitoring the emission at around 430 nm [17,19] as well as the emission related to the carotenoids and tocopherols compounds, which present a high amount of these molecules in the oils [3,4,5,6].
In this context, the present study aimed to perform a close analysis of the oxidative stability of the oils obtained from the kernel and pulp of Acrocomia aculeata fruits, evaluating the influence of the intrinsic antioxidants and the fatty acid composition on the oil’s thermal stability, as the presence of unsaturated fatty acids makes the oils more susceptible to oxidative degradation and, on the contrary, intrinsic antioxidants (such as carotenoids and tocopherols) may minimize the oxidation process. Additionally, the oil’s thermal oxidation was optically monitored by UV-Vis absorption and fluorescence spectroscopy, determining the potential applicability of these optical techniques to evaluate the oil degradation.

2. Materials and Methods

2.1. Fruit Collection, Oil Extraction and Degradation

A. aculeata fruits collected in Dourados, Mato Grosso do Sul state, Brazil, were stored in the herbarium of the Federal University of Grande Dourados (voucher specimen no. 2169). The fruits were washed and processed manually to separate the pulp and kernel parts, and then were dried in a fan oven (Sterilifer SXCR42, Diadema, Brazil) at 60 °C for approximately 14 h. Then, they were triturated, separately, in an industrial blender (Becker LTB4, Brusque, Brazil), and the respective oils were obtained by the Sohxlet extraction method for about 5 h at 70 °C, using hexane PA (Proquimios, Rio de Janeiro, Brazil) as solvent. The oil was purified by a rotary evaporator (803 Fisatom, São Paulo, Brazil) operating at 50 °C and a rotation frequency between 25 and 55 rpm coupled to the vacuum pump of 400 mmHg (Fanem CAL-089, Guarulhos, Brazil) [20,21]. The oils were kept in a dark environment (refrigerator) at −4 °C until analyses. These oils were submitted to thermal treatment at 110 °C for 144 h, inducing oil deterioration. For the oil degradation analyses, aliquots were collected at 0, 24, 48, 72, 96, 120, and 144 h.

2.2. Fatty Acid Composition

Fatty acid composition of the A. aculeata oils was determined by triplicate GC-MS analysis [22]. The transesterification was performed as follows: 200 g of oil was mixed with methanol (60 mL) and 2 g of KOH. This solution was stirred and heated at 60 °C, and the conversion was monitored by thin-layer chromatography. Then, the solution was decanted for 1 h to separate the glycerin/methanolic phases. The transesterified was concentrated with a 20 mL solution (10 mL distilled water and 10 mL NaCl 10% w/v), then dried with MgSO4, filtered, and concentrated in a rotary evaporator. The fatty acid content was quantified by comparison of the retention times (CG) and fragmentation profile (MS) with standard FAME (Fatty Acid Methyl Esters, Supelco, Bellefonte, PA, USA). All samples were analyzed under the same experimental conditions in a gas chromatograph (Varian 431-MS-210 GC, Palo Alto, CA, USA) equipped with ZB-5ms column (30 m × 0.25 mm) using He 99.999% as a carrier gas, a flow rate of 3.0 mL·min−1, a temperature of 248 °C (6 min), and ionization by electron impact.

2.3. Physicochemical Characterization

Iodine value was quantified by following the EN 14111 method using automatic potentiometric titration (AT-500N, Shinjuku-ku, Japan). Water content was evaluated following the ASTM D6304 method employing the Coulometer (Karl Fisher) method (Metrohm 831 KF, Herisau, Switzerland). Oxidative stability was determined adopting the EN 14112 (Rancimat) method at 110 °C using a Metrohm apparatus [11]. Kinematic viscosity, dynamic viscosity, and specific mass were determined at 40 °C employing a SVM 300 Anton Paar-Stabinger (Graz, Austria). All analyses were performed in triplicate.

2.4. Total Polyphenol and Carotenoids Content

Total polyphenol content was determined according to the spectrophotometric method proposed by Folin-Ciocalteu [23], using gallic acid (Vetec, Duque de Caxias, Brazil) as the standard. First, a solution was prepared (10 g oil + 50 mL acetone/water 70% v/v). Next, 0.5 mL of the solution was diluted in 2.5 mL of the Folin-Ciocalteu reagent, 10% v/v (aqueous solution), and 2.0 mL of sodium carbonate aqueous solution (7.5% v/v) was then added. This solution was incubated in a water bath at 50 °C for 15 min and then cooled down using an ice bath. The absorbance readings at 760 nm were performed in a bench spectrophotometer (Varian Cary 50, Palo Alto, CA, USA).
The total carotenoid content was determined according to a method described previously [24]. Approximately 4.4 g of the pulp and kernel oil was used to extract the carotenoids from successive macerations using 50 mL of refrigerated acetone (Vetec). The samples were evaluated by spectrometry taking into account the absorbance at 450 nm. The total carotenoid concentration (Ct) was determined as follows:
C t ( μ g g ) = A b s × V × 10 4 E 1 c m 1 % × m s a m p l e
where A b s is the absorbance at 450 nm, V is the sample’s final volume (mL), m s a m p l e is the sample mass, and E 1 c m 1 % is the extinction coefficient (2592, for β-carotene). Both analyses were carried out in triplicate.

2.5. Antioxidant Activity

DPPH (2,2-Diphenyl-1-picrylhydrazine) and ABTS (2,2′-Azino-bis-3-ethylbenzothiazoline-6-sulfonic acid) methods were used to determine the antioxidant activity of the A. aculeata oils. The DPPH radical-scavenging activity was determined according to the method proposed by Rufino et al. [25]. A volume of 0.5 mL of each oil was diluted in 0.5 mL of DPPH solution at 0.04 mmol·L−1 (Sigma-Aldrich, St. Louis, MO, USA) and 1.5 mL of ethanol PA (Vetec). The mixture was shaken and allowed to stand at room temperature for 10 min. Antioxidant activity was measured by recording the absorbance at 517 nm using a spectrophotometer (Varian Cary 50). Ethanol PA (Vetec) was used as the reference sample.
The ability of the oils to eliminate the ABTS (Sigma-Aldrich) free radicals was determined according to the conventional methodology [25]. A standard curve was prepared using Trolox (6-Hydroxy-2,5,7,8-tetramethylchromane-2-carboxylic acid, Sigma-Aldrich) in different concentrations (100, 500, 1000, 1500, and 2000 µmol·L−1). Reaction solutions, containing 30 µL of the oil and 3 mL of reagent (potassium persulfate at 2.45 mmol·L−1 with ABTS at 7 mmol·L−1), were incubated at 30 °C for 6 min, and the absorbance at 734 nm was then determined. The inhibition concentration was based on the Trolox standard curve, and the results were expressed in mg Trolox/g of oil. Both analyses were performed in triplicate.

2.6. Acid Value

Acid value was determined by a triplicate classic titration assay. A mass of 2.0 g of the oil, 25 mL of ethyl ether/ethyl alcohol solution (2:1 v/v), and two drops of phenolphthalein indicator were added to three Erlenmeyer flasks. Then, the samples were titrated with a standardized solution of potassium hydroxide 0.1 mol·L−1. Titration was stopped when a pink coloration remained for 30 s [26].

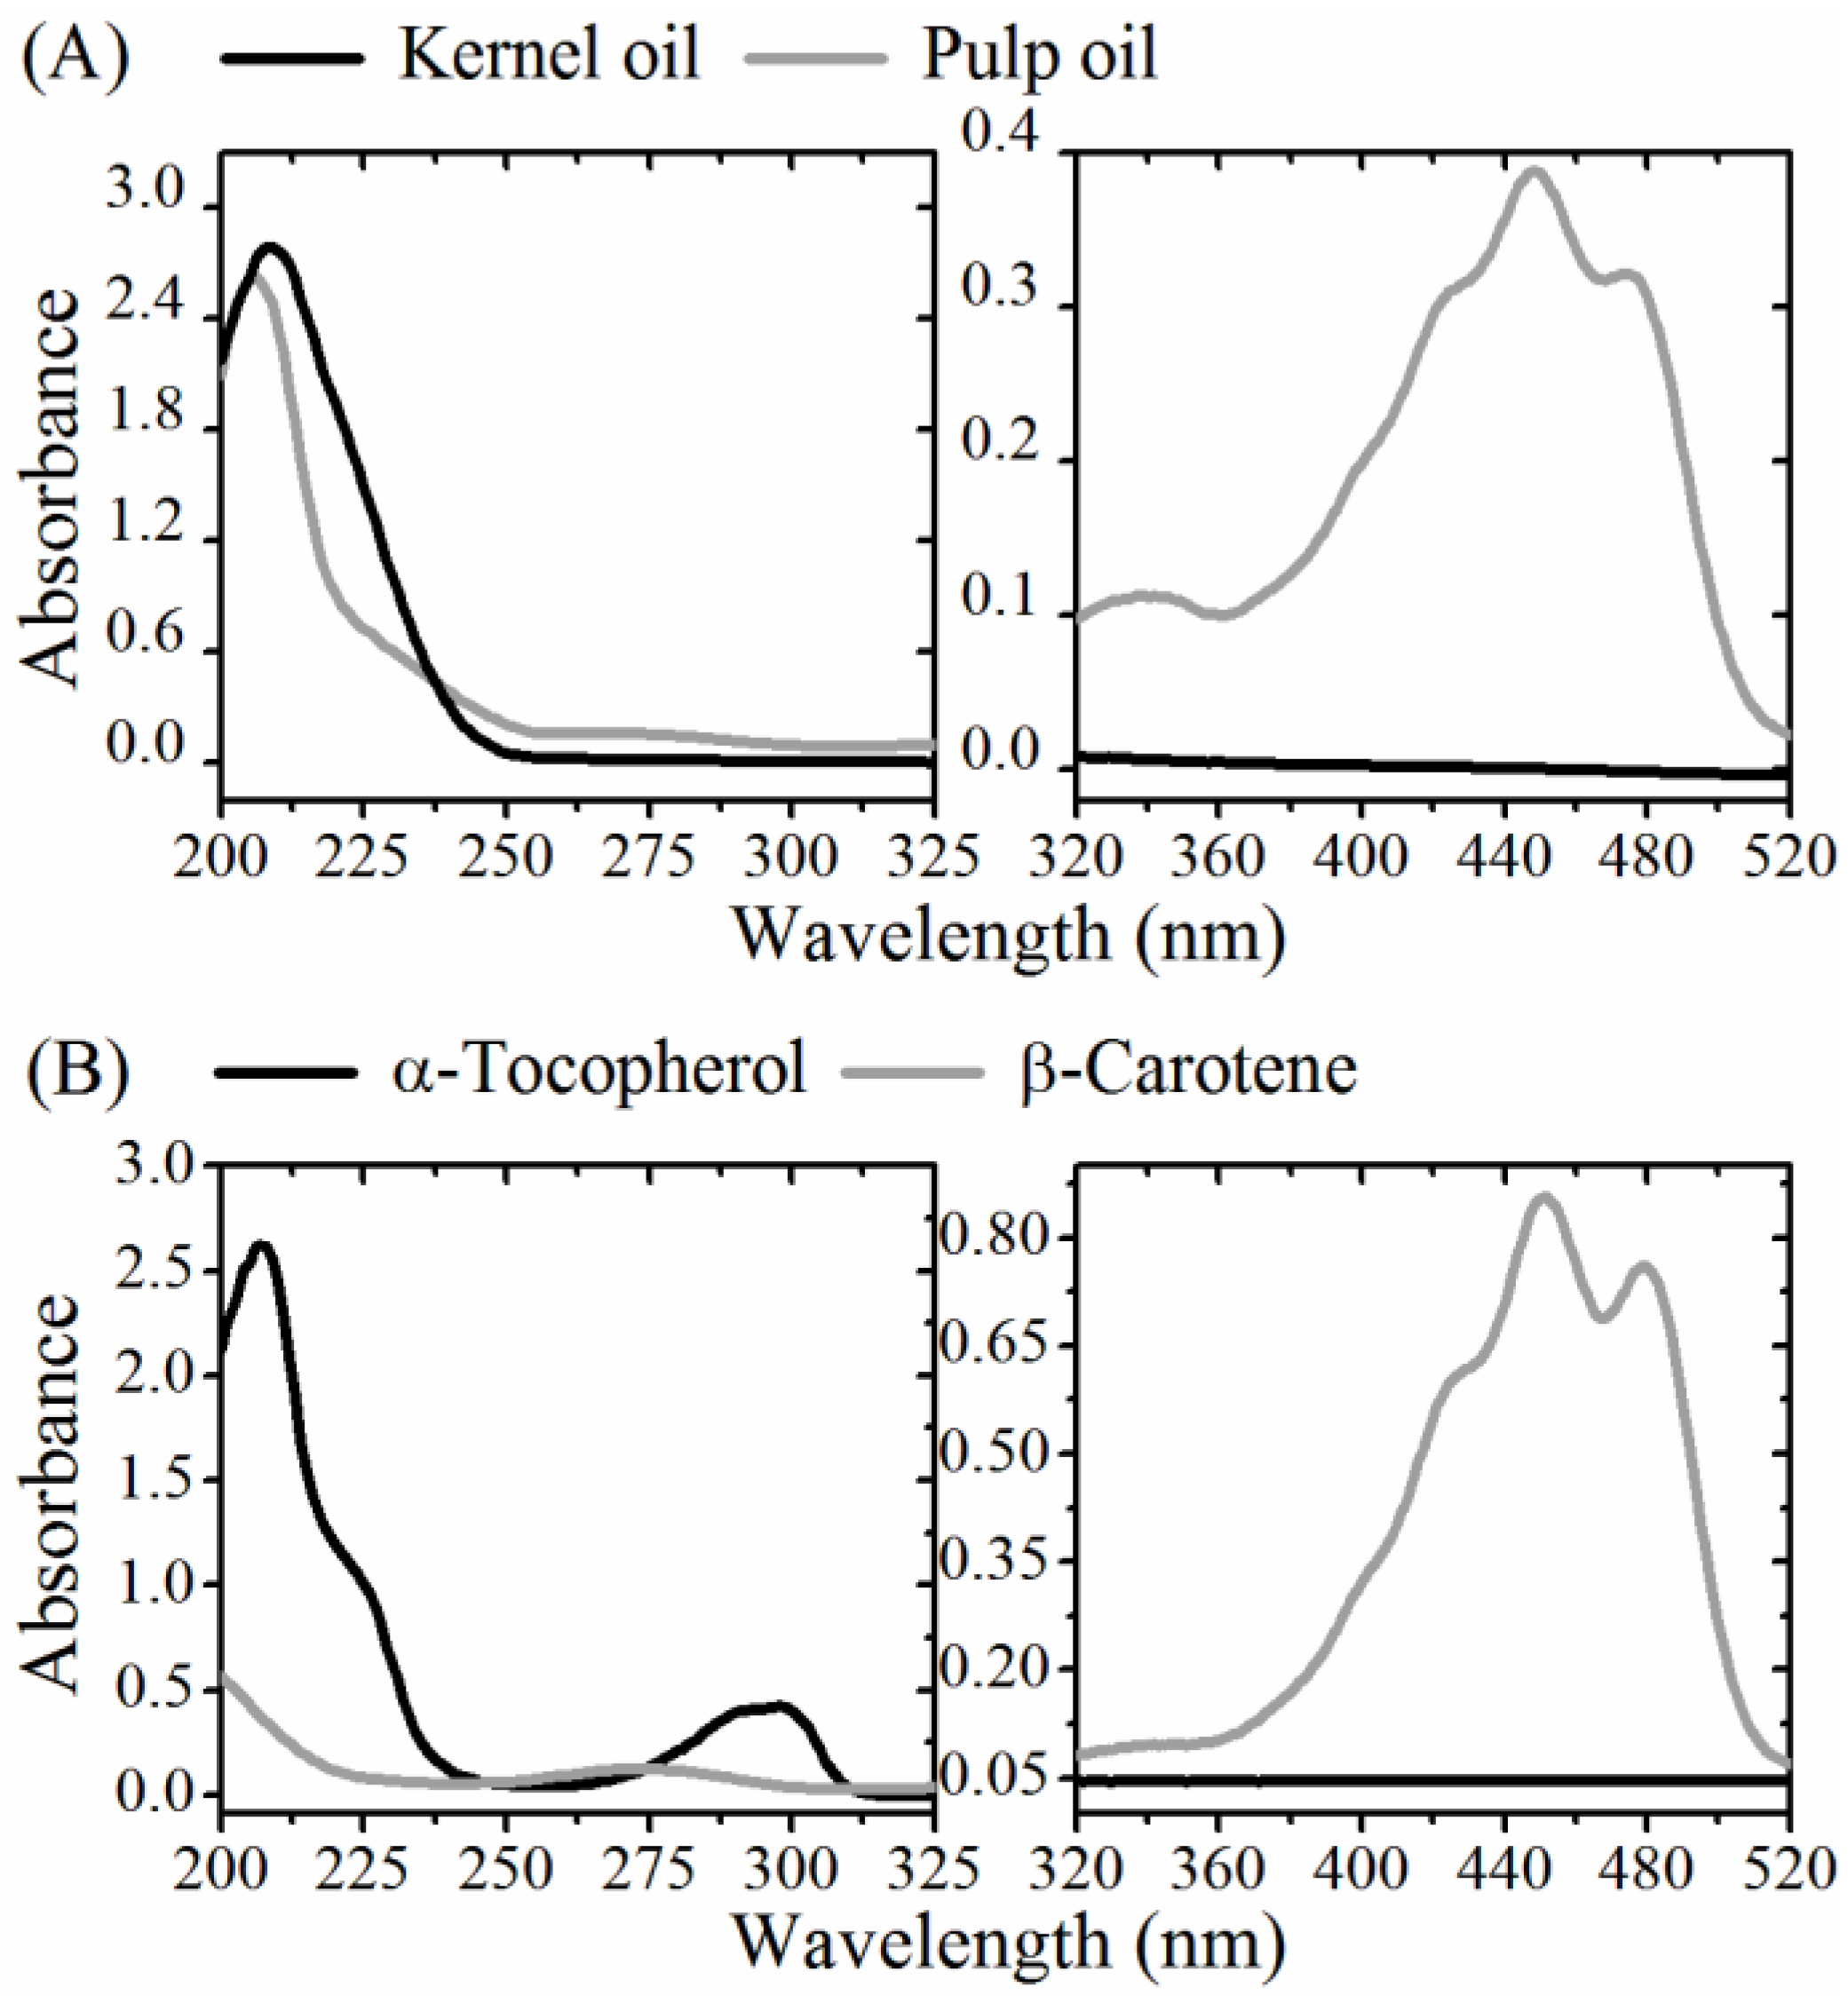
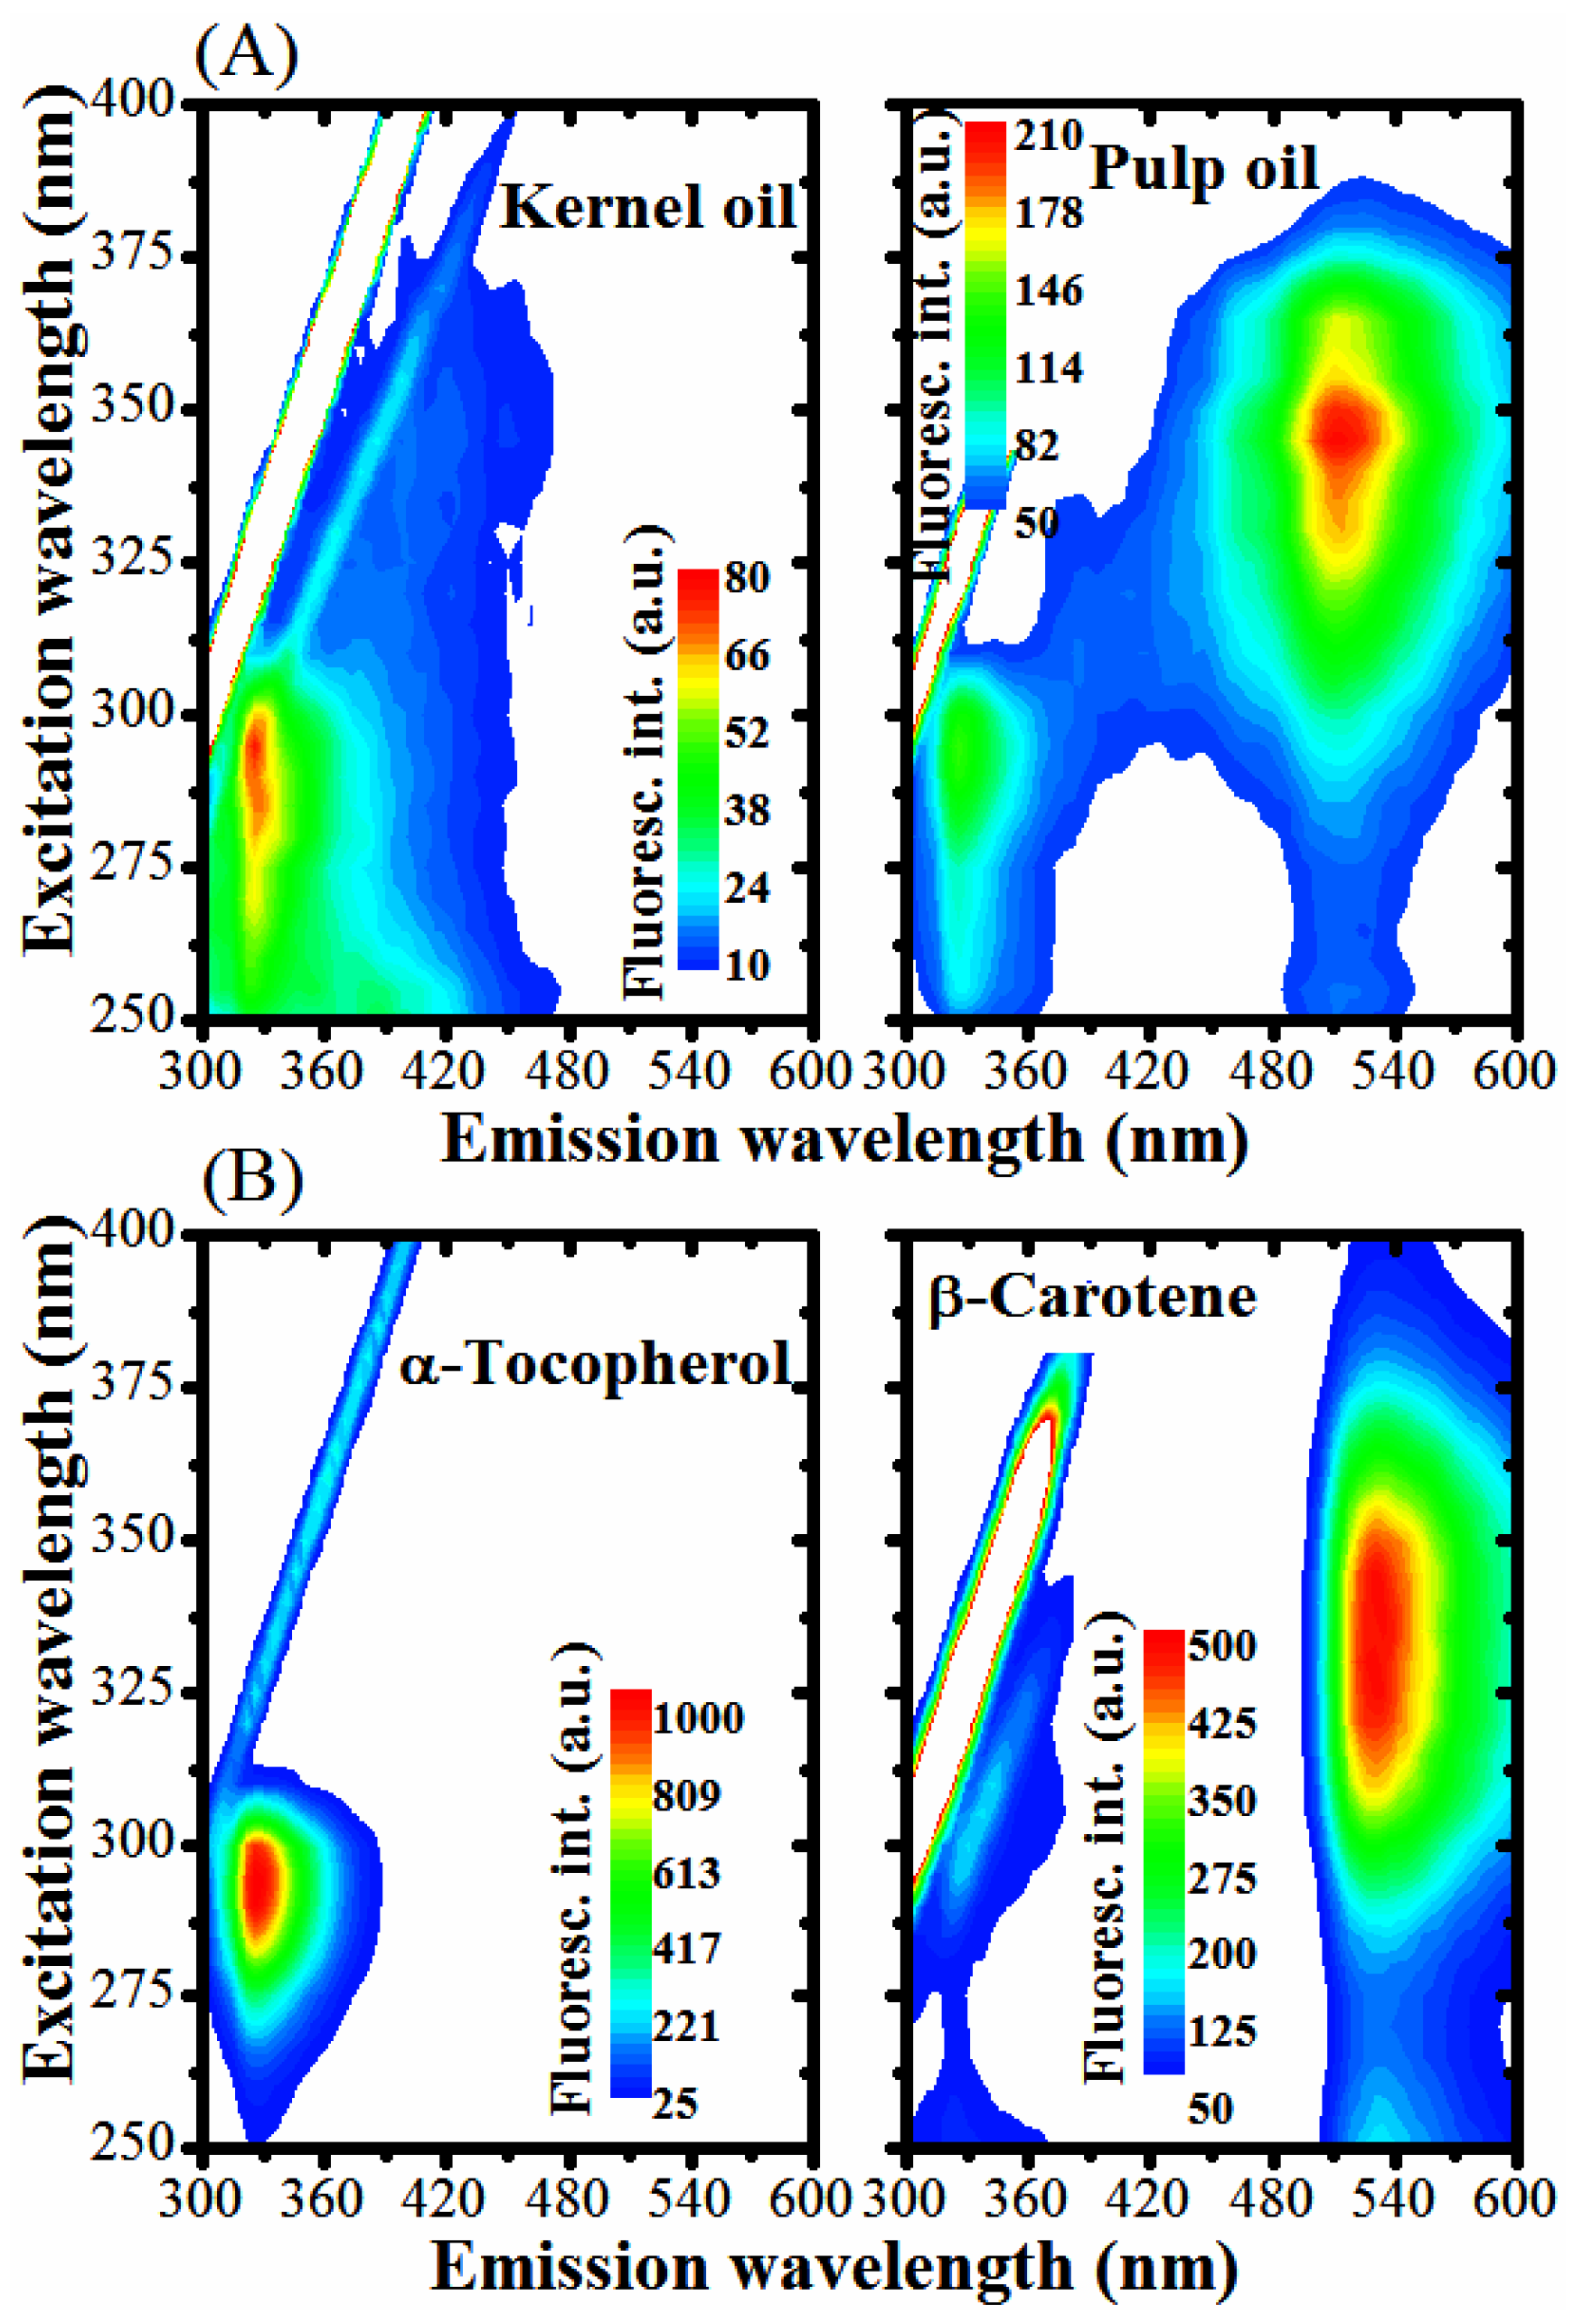
2.7. UV-Vis Absorption and Fluorescence

Absorption and fluorescence spectra were collected from oils diluted in hexane spectroscopic grade. The UV-Vis absorption was performed in the 200–600 nm range using a spectrophotometer (Cary 50, Varian) and a quartz cell with a 10 mm path length. The excitation-emission contour maps were obtained using a bench spectrofluorimeter (Cary Eclipse, Varian) by exciting between 240 and 400 nm and recording the emission in the 250–650 nm range. The absorption and fluorescence analyses of the α-Tocopherol (Sigma-Aldrich ≥ 96%) and β-Carotene (Sigma-Aldrich ≥ 93%) were also performed. Both antioxidants were diluted in hexane spectroscopic grade (Vetec > 99%). All measurements were performed in triplicate at room temperature.

3. Results and Discussions

3.1. Oxidative Stability Determination

Table 1 shows the fatty acid composition of the oils obtained from kernel and pulp of A. aculeata. A predominance of unsaturated fatty acids (65.8%) was verified in the pulp, mainly due to the high content of oleic acid (61.4%), while a prevalence of saturated fatty acids (74.5%) was determined in the kernel. In fact, two fatty acids (oleic and palmitic acids) were the main compounds present in the pulp oil, representing 91% of the fatty acid composition. In turn, lauric acid (50%), oleic acid (17%), myristic (10.4%), and palmitic acid (6%) were the main fatty acid compounds in the kernel oil, as similarly reported elsewhere [3,4,6].
The physicochemical features of the kernel and pulp oils of A. aculeata are presented in Table 2. The iodine value of the pulp oil (75 ± 9 g I2/100 g) was higher than that of the kernel oil (36 ± 3 g I2/100 g). These findings agree with the higher amount of unsaturated fatty acids in the pulp when compared with the kernel. In addition, the kinematic and dynamic viscosities were higher for the kernel oil possibly due to the saturated carbon chains interactions. Even though the pulp oil presented a higher concentration of unsaturated fatty acids, the results show that pulp oil is less susceptible to oxidation, as induction periods of 65 and 43 h were determined for the pulp and kernel oil, respectively. This result shows that the mechanism of oxidation prevention took place for the pulp oil, as it is well-known that unsaturated fatty acid content will make oil more susceptible to degradation [27,28].
The presence of intrinsic antioxidants in the oils (such as polyphenols and carotenoids) and antioxidant activity were analyzed as presented in Table 3. The total polyphenol content in the pulp oil (3.9 ± 0.3 mg gallic acid/100 g) was higher than that verified in the kernel (0.70 ± 0.02 mg gallic acid/100 g). In addition, the results also revealed the presence of carotenoids only in the pulp, at concentrations of (49 ± 2) × 10 µg/g oil. These results may justify the higher induction period observed for the pulp oil, as carotenoids may play an important role as natural antioxidants [28] and the high content of polyphenols may assist in the capture of free radicals. In both cases, the existence of carotenoids and high phenolic compound content in the pulp oil should act positively to retain the chemical structures of the unsaturated fatty acids for a longer period [29,30].
The antioxidant ability of A. aculeata oils of the pulp and kernel were also investigated by the DPPH and ABTS methods [31]. The results shown in Table 3 demonstrate that pulp and kernel oils showed no difference in the ability to scavenge free radicals DDPH. However, the analysis of the capture of ABTS radicals demonstrated that the antioxidant activity in the pulp oil, 52 µg trolox/g oil, is significantly higher than that verified in the kernel oil, 9 µg trolox/g oil, probably related to the presence of a high content of carotenoids in the pulp.

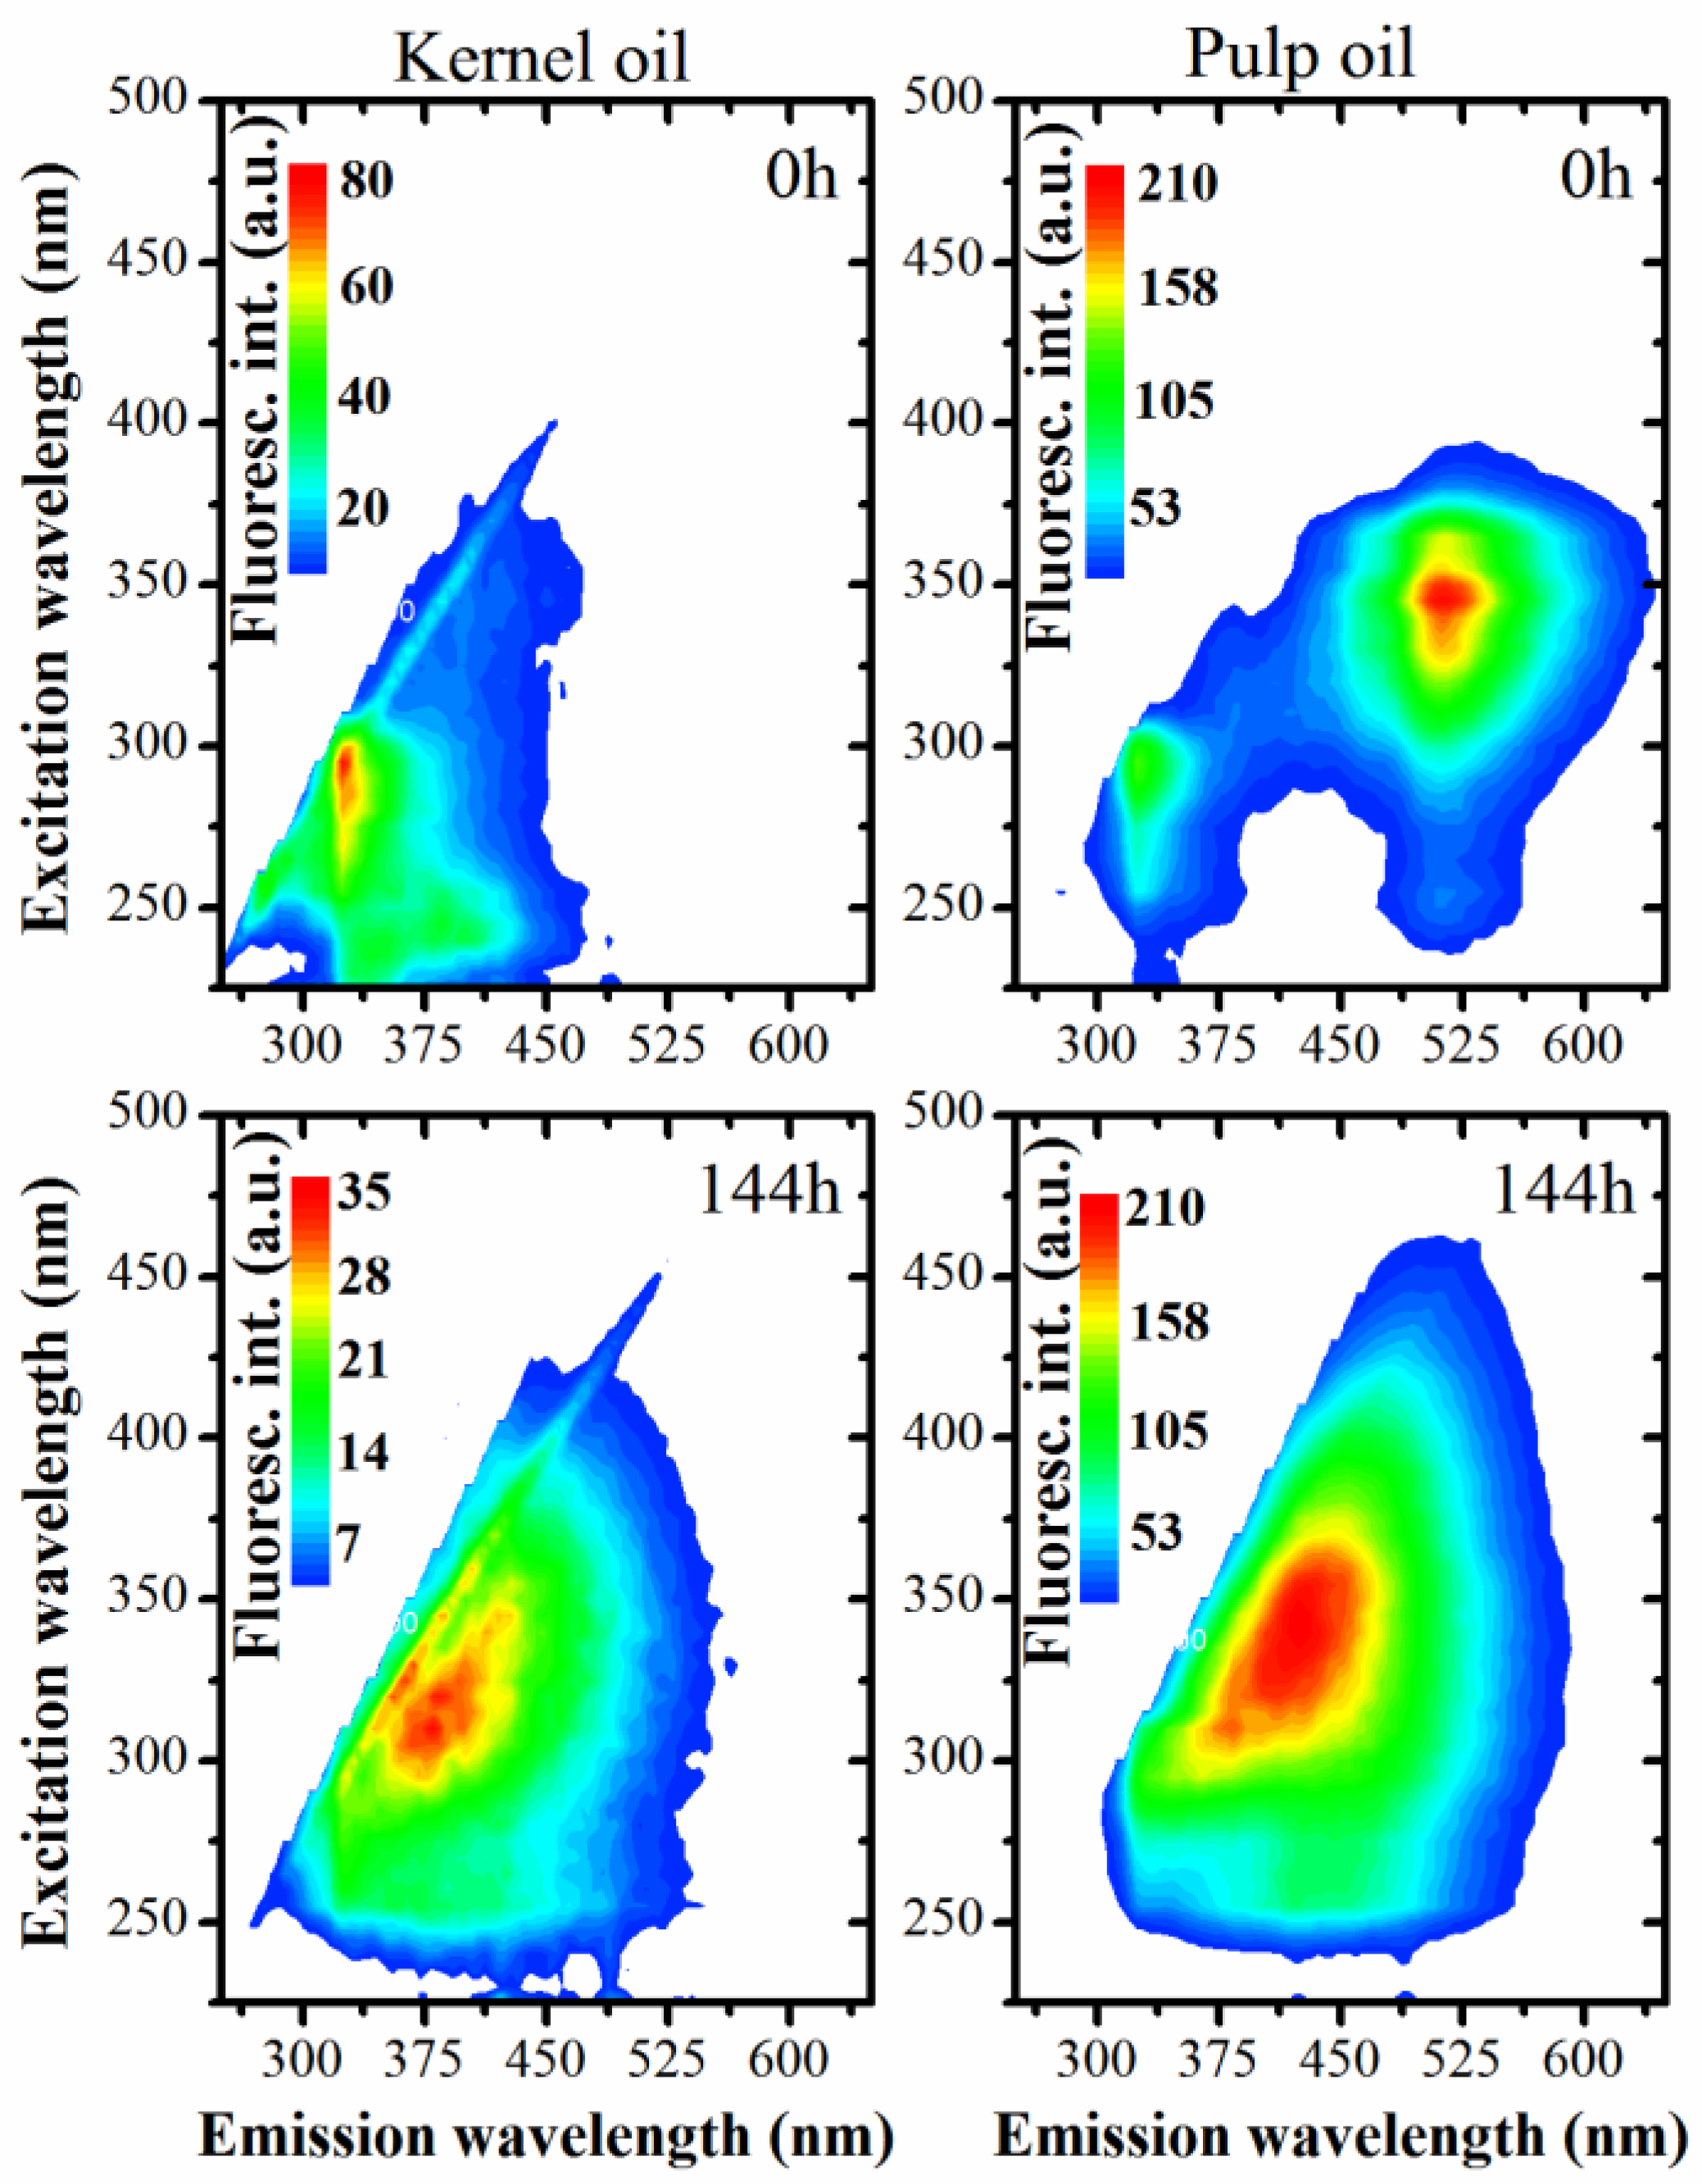
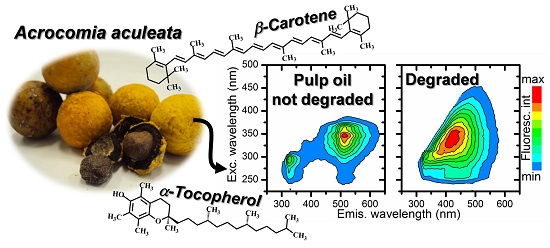
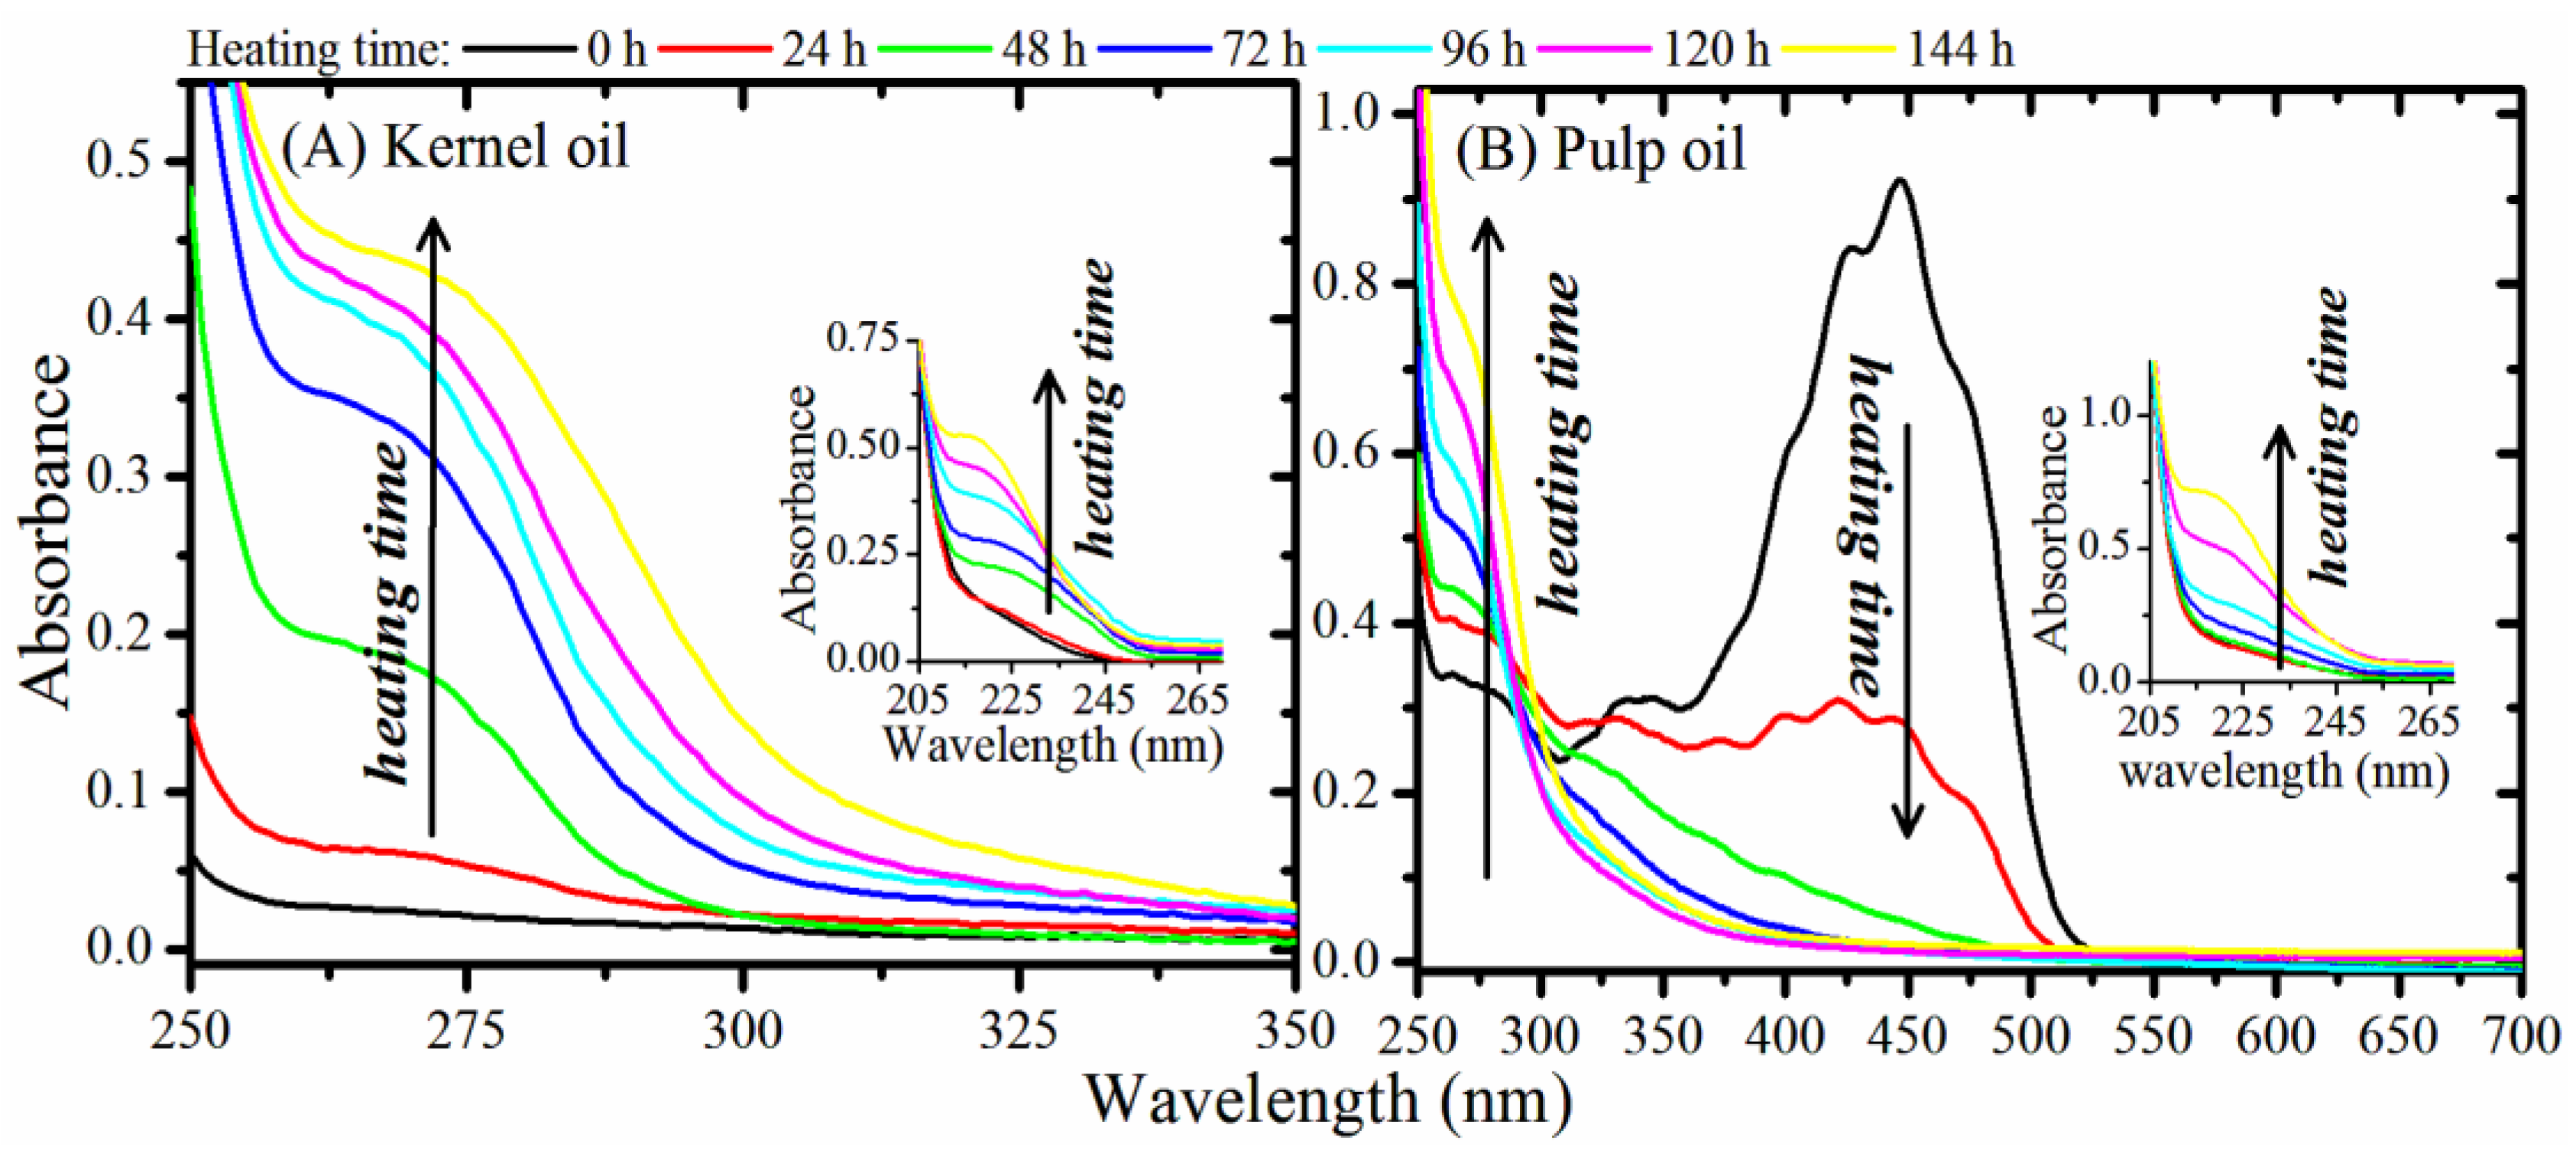
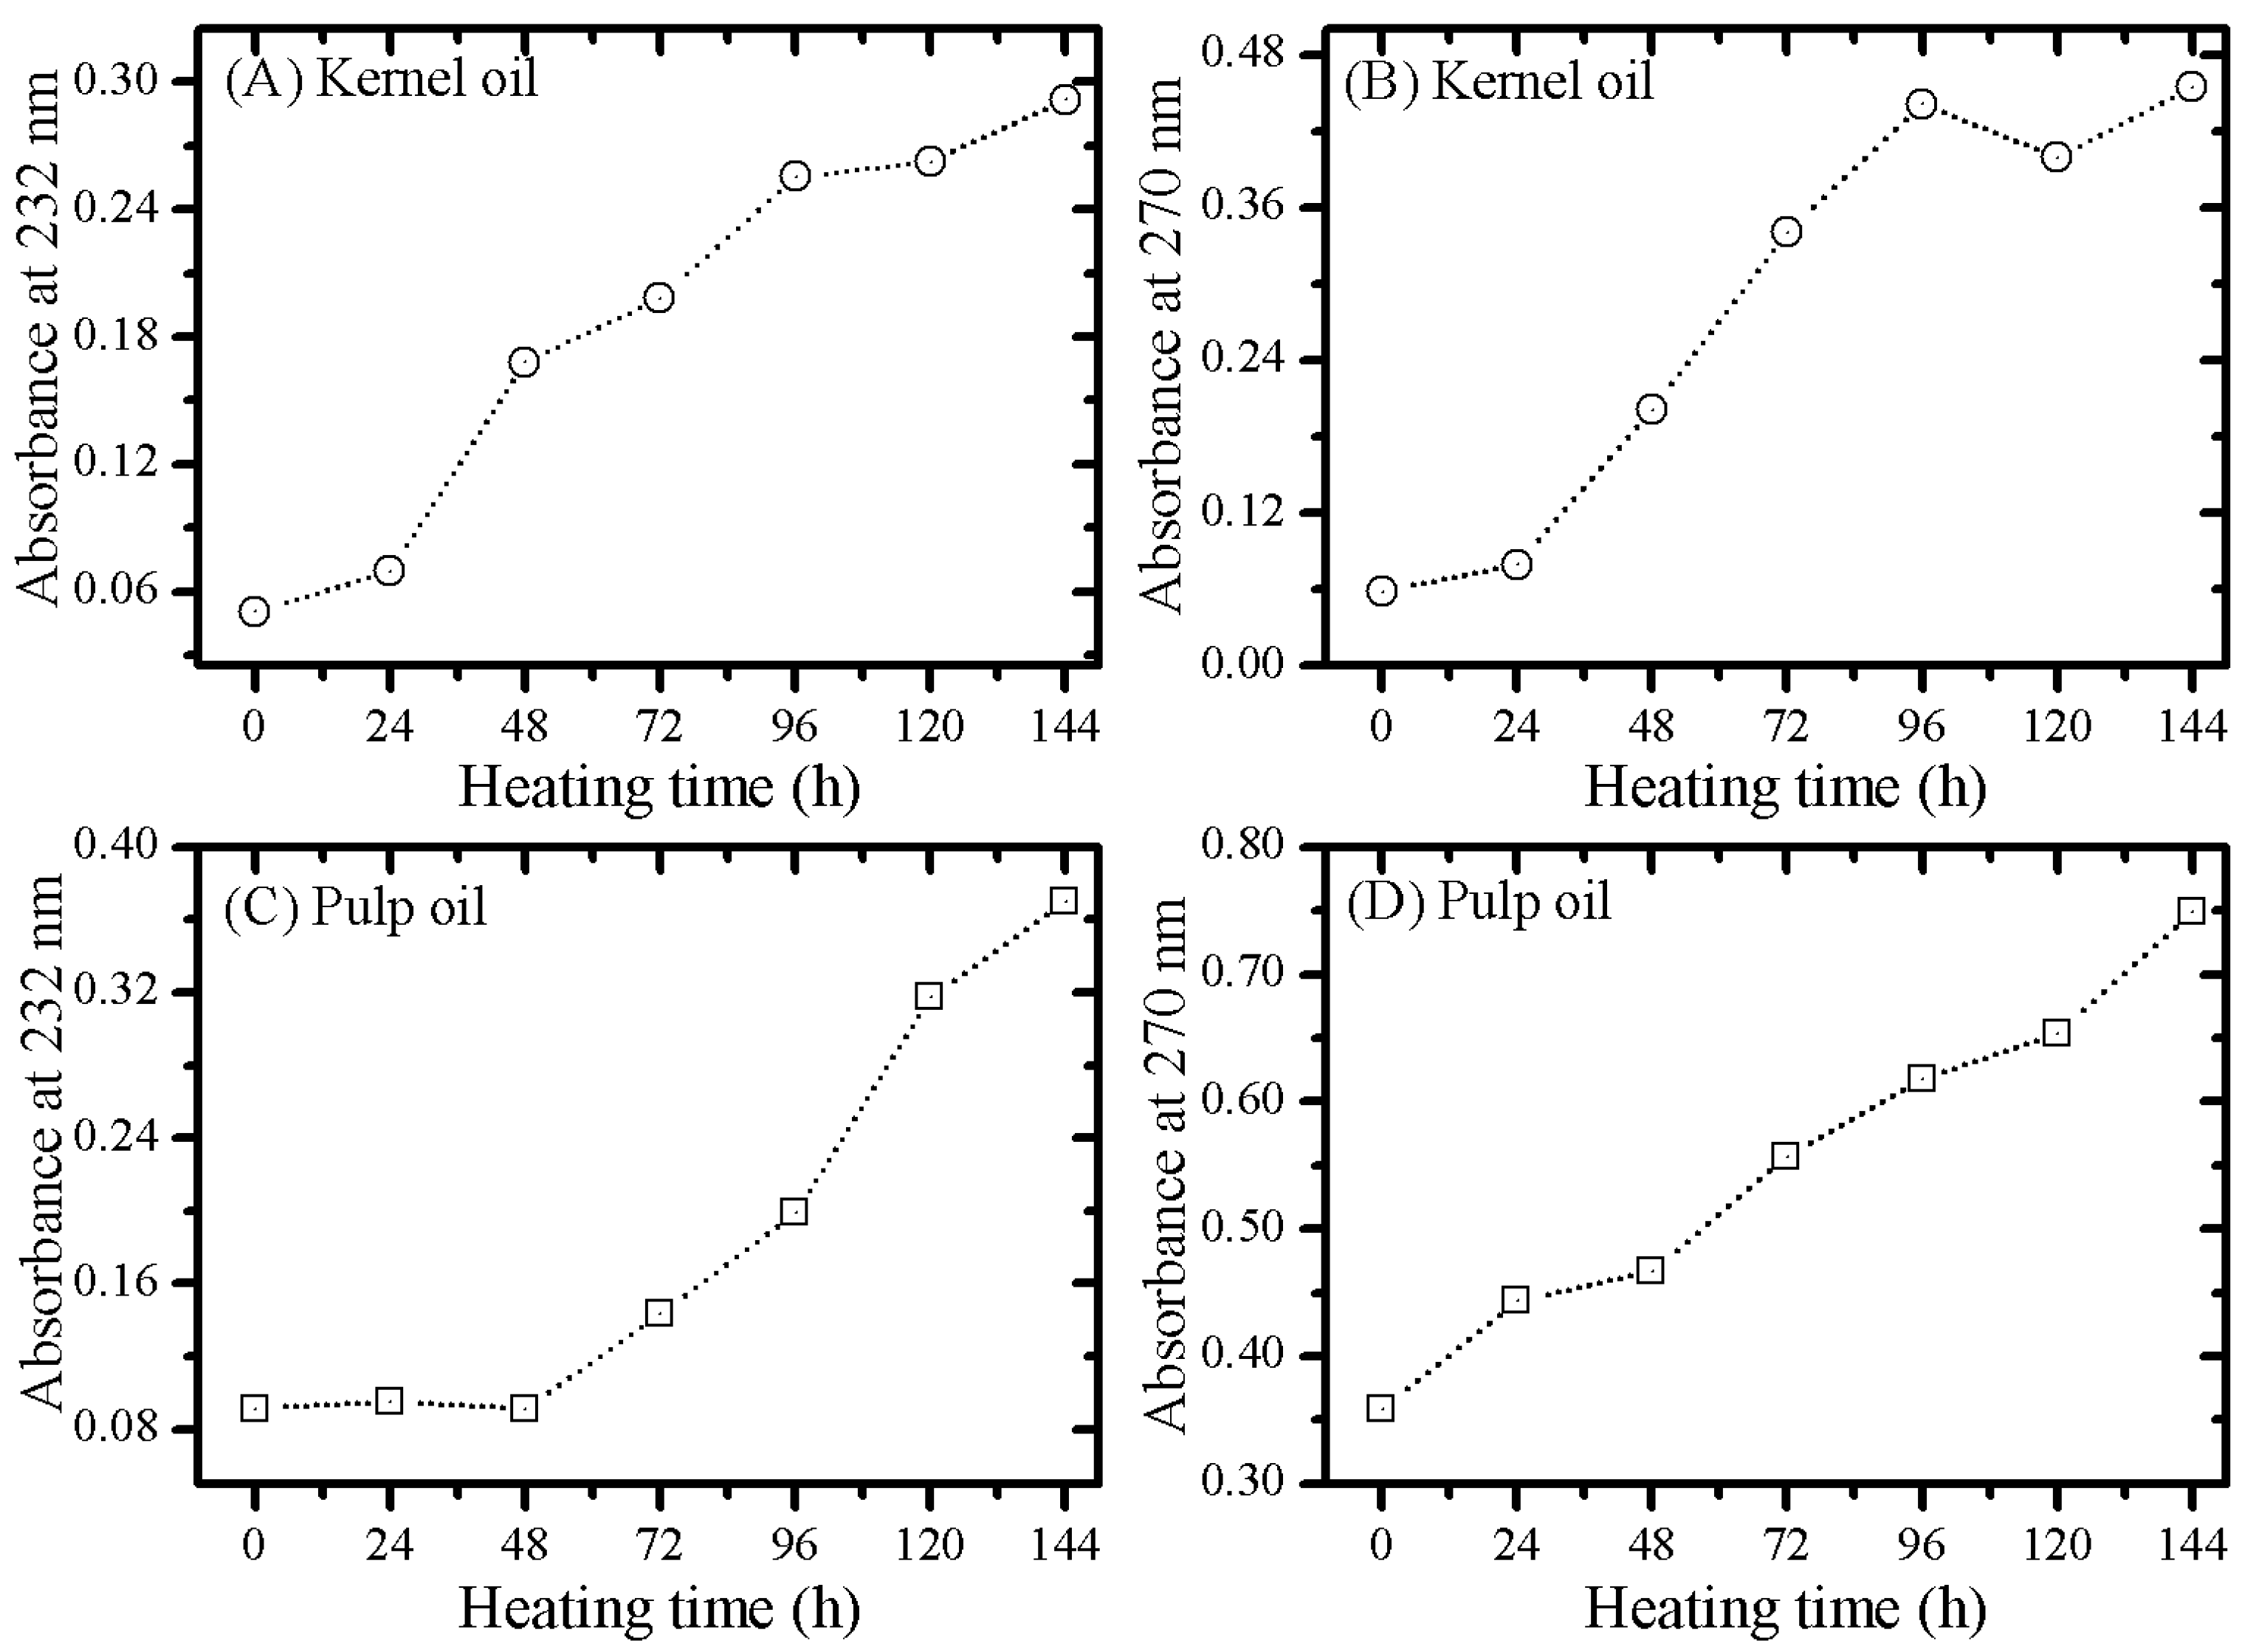
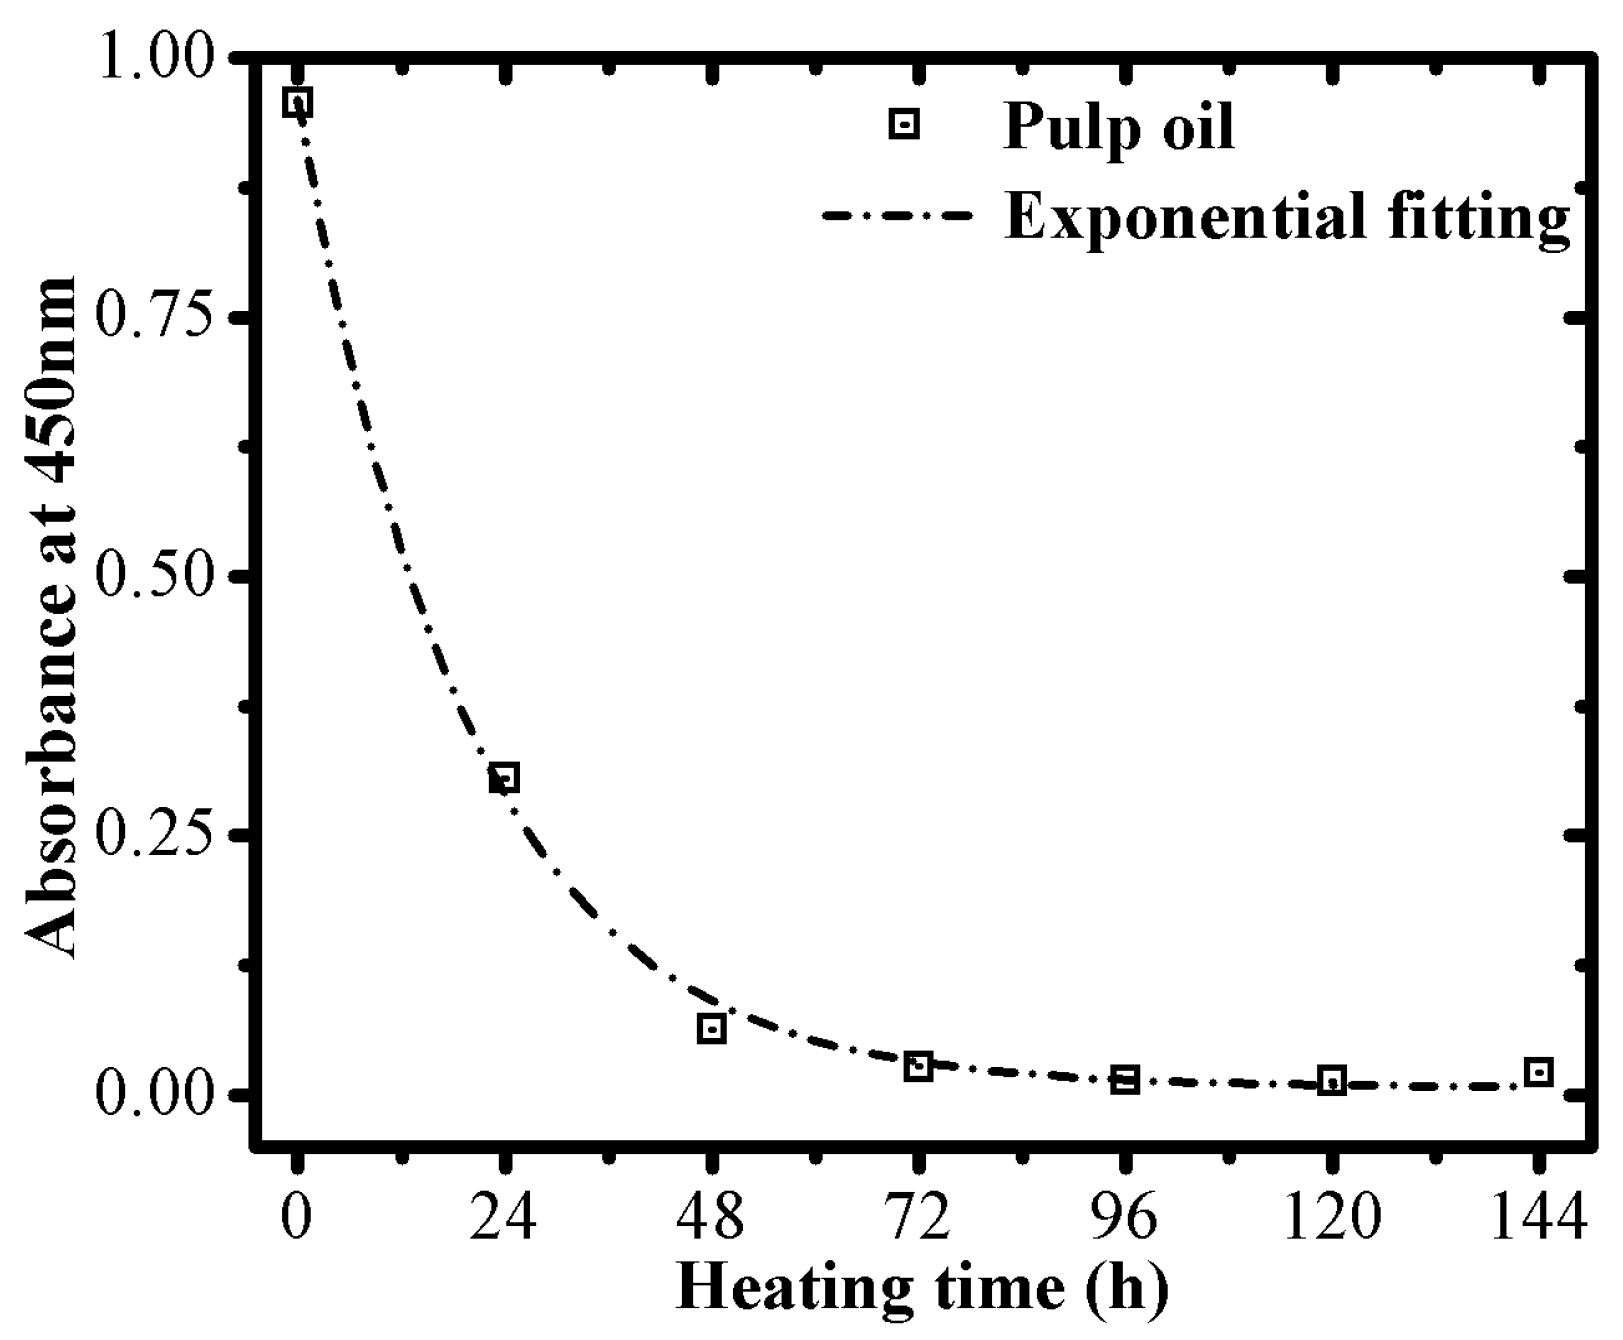
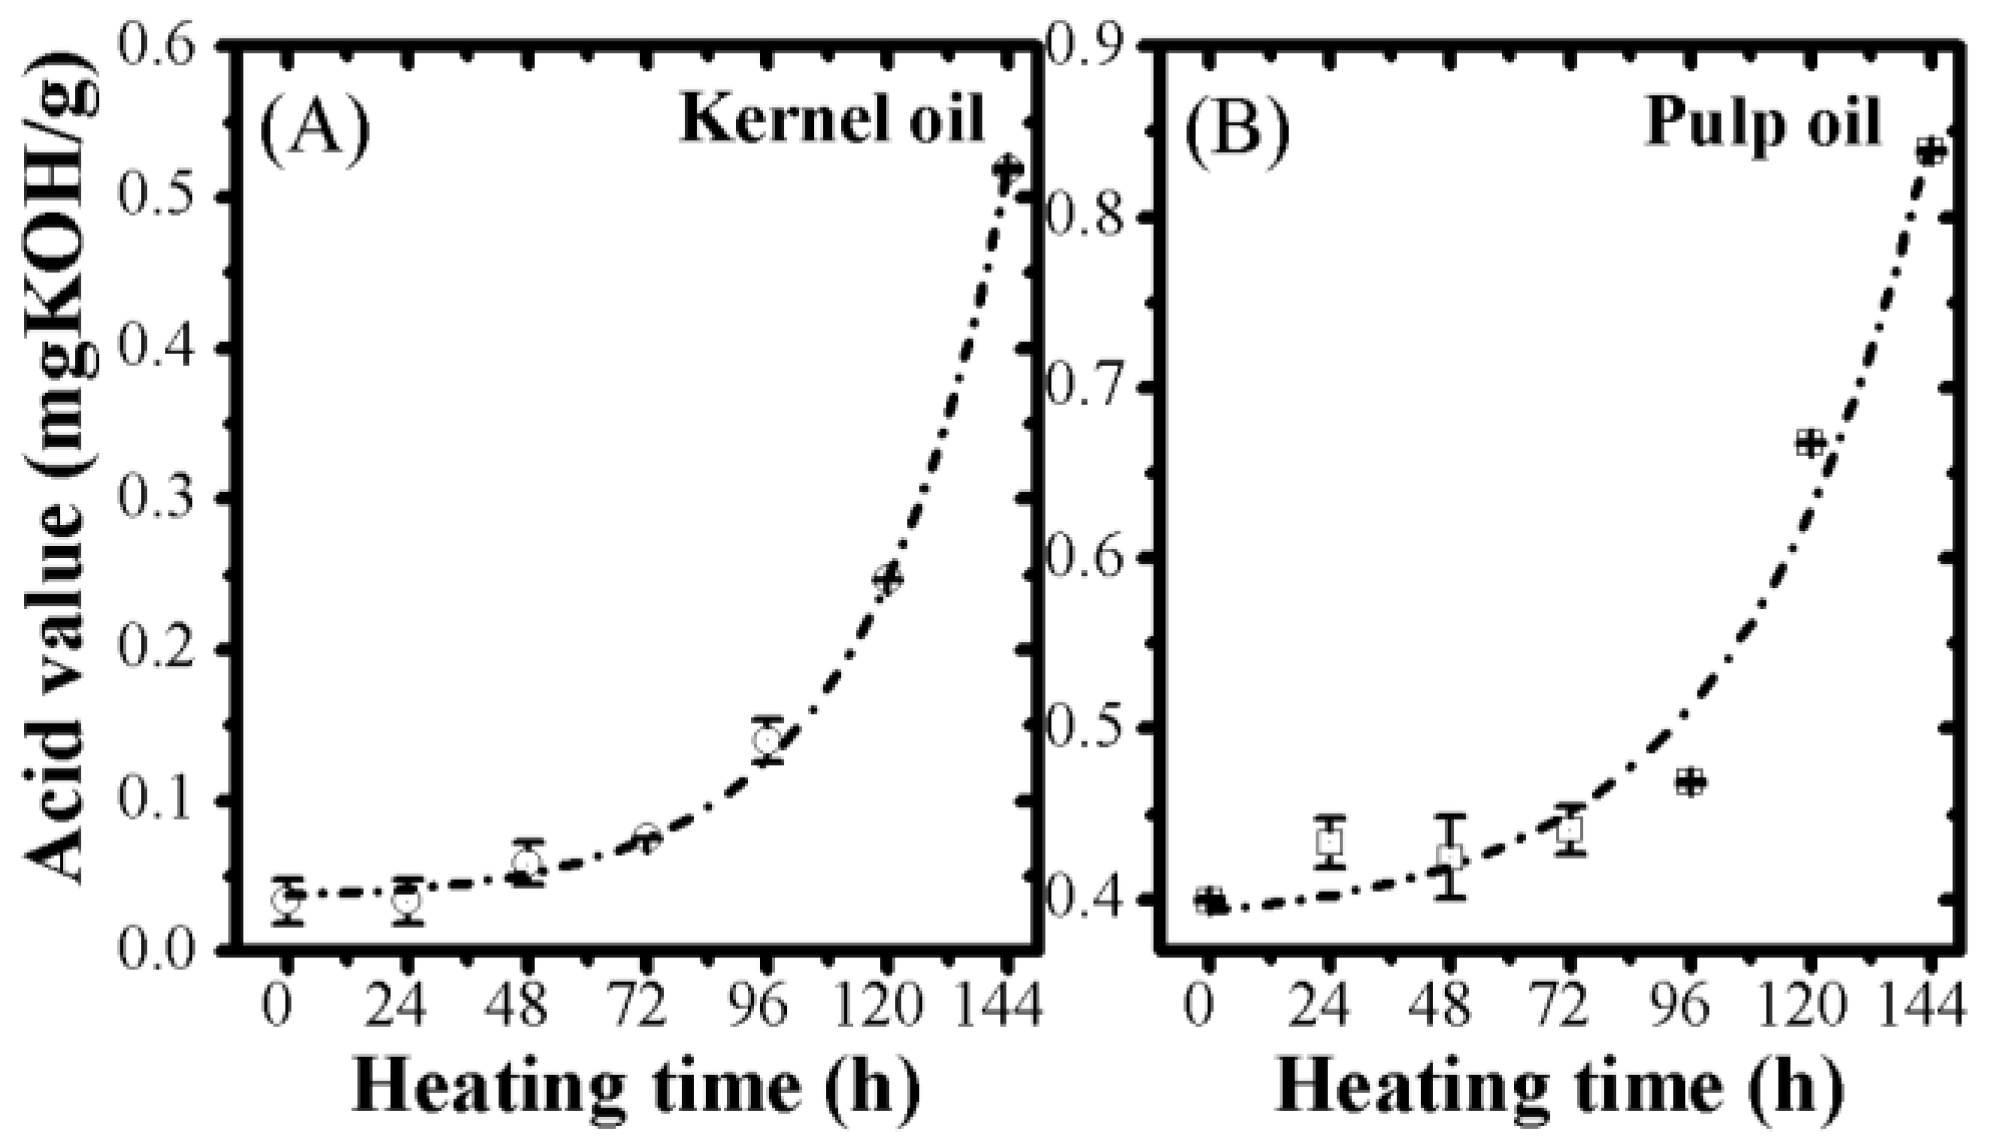
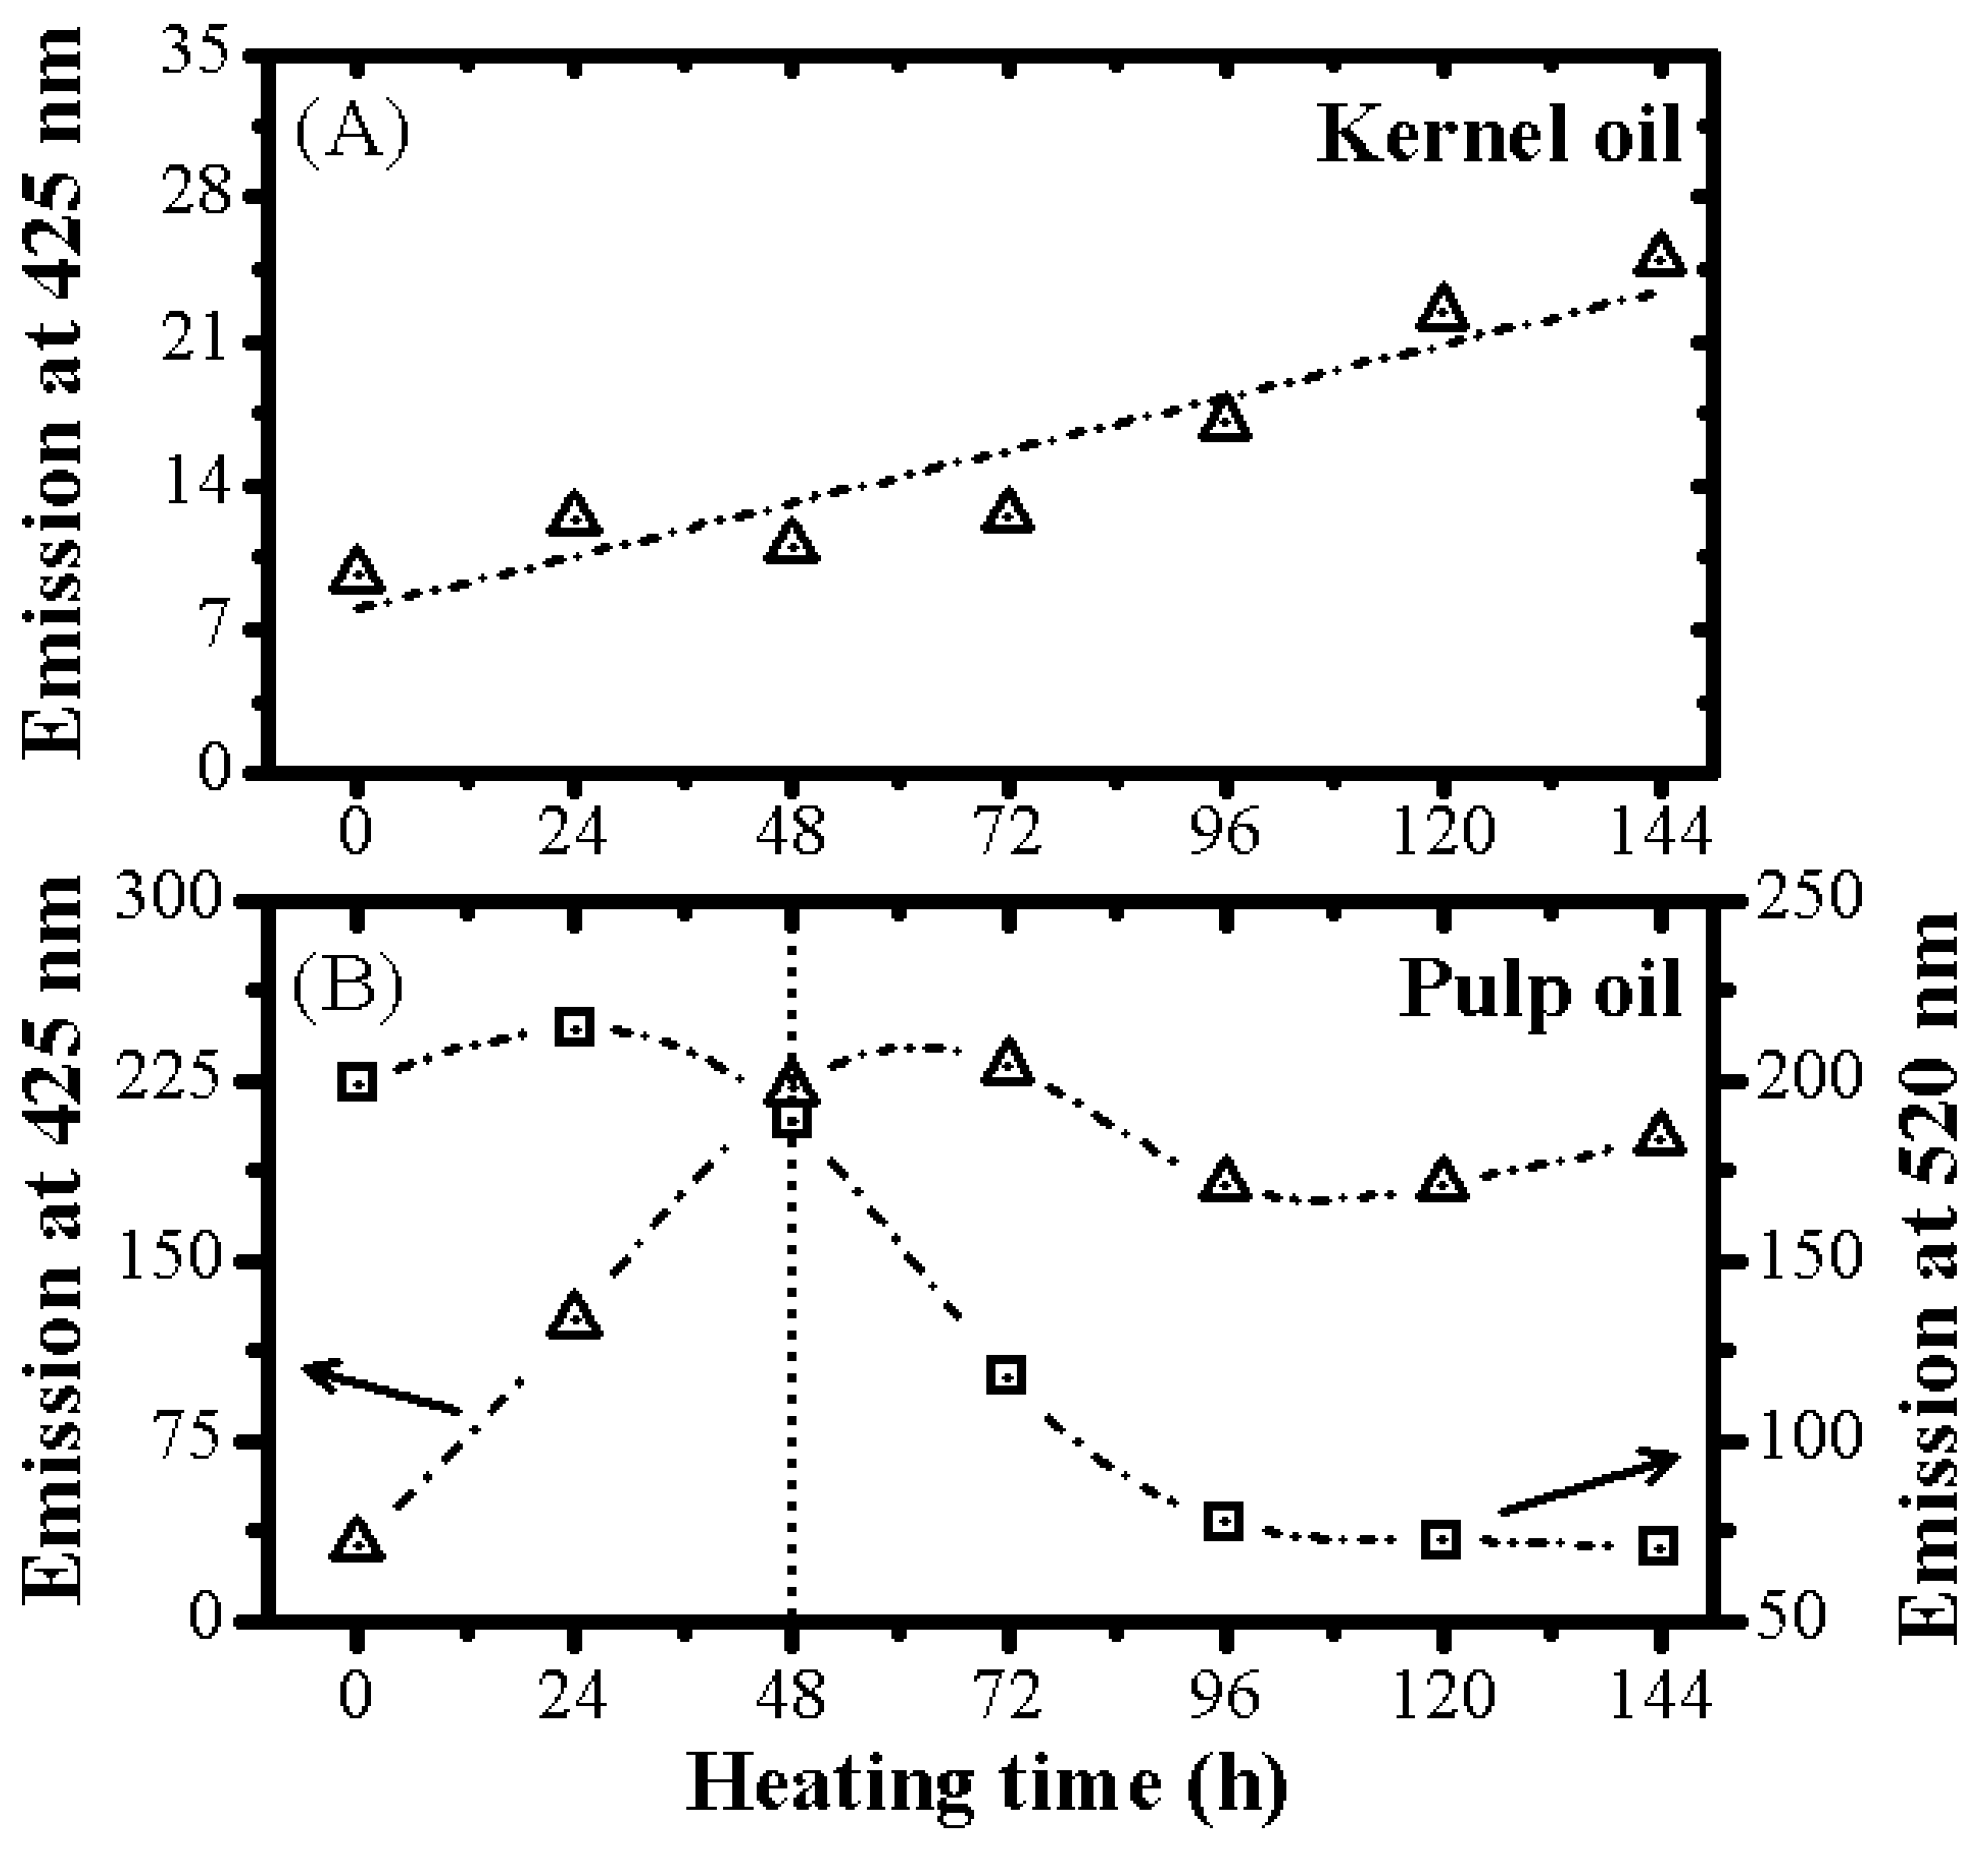
3.2. Optical Monitoring of Oil Degradation

In addition to the physicochemical characterization, the presence of carotenoids and polyphenols were also verified by analyzing the optical features of the oils. Figure 1A presents the absorption spectra of the oils extracted from pulp and kernel. The results revealed that kernel oil presented a molecular absorption band with a peak around 215 nm, revealing the polyphenol contribution for the light absorption by the oil. In fact, Figure 1B shows that the absorption spectrum shape of the oil is similar to that obtained by the α-Tocopherol (α-Toc), the main polyphenol in the oil composition. In addition to the polyphenol contribution, the pulp oil also presented an absorption profile in the 360–520 nm range due to the presence of carotenoids. This assumption can be verified by comparing the pulp oil and β-Carotene (β-Car) absorption spectra, shown in Figure 1A,B. The α-Toc absorption in the 200–240 and 270–310 nm range is associated to σ→π* and π→π* transitions, respectively [32]. The β-car absorption bands between 200 and 270 nm are due to σ→π* transitions, and the band in the 370–505 nm range is due to π→π* transitions related to the unsaturations in the carbon chain [33,34].
The excitation-emission contour maps confirm the presence of tocopherols in both oils as a result of maximum fluorescence intensity at about 325 nm under excitation at around 290 nm (Figure 2). In contrast, the data also show the existence of carotenoids only in the pulp oil because of the maximum fluorescence intensity at 520 nm when excited at around 335 nm. There is a small displacement at the maximum absorption/emission, possibly due to the environment in which the β-carotene is immersed. This is comparable to non-polar solvent hexane and in more complex organic sample media such as oils composed of triacylglycerols with large carbon chains. In addition, this observation may be related to the fact that the inner filter effect induced by the β-carotene reabsorption is avoided in the oil sample because of the low content of this compound in the oil, when compared with the β-carotene diluted in the solvent. Therefore, these results demonstrate that the presence of intrinsic antioxidants can be optically monitored in the oils.
Changes in the UV-Vis absorption spectrum were also observed during the thermal oxidation process, as presented in Figure 3. The results revealed in both oils an increase in the absorption below 300 nm due to the formation of degradation compounds [14,15,16,17,18]. The absorption measurements were performed by diluting the samples in hexane at 0.75% (w/v). Nevertheless, additional measurements were collected by diluting the samples in hexane at 0.04 (w/v) for a better determination of the absorption changes in the 200–250 nm range, as shown in the insets of Figure 3. In addition to the observed absorptions below 300 nm, bands in the 325–525 nm range were also determined in the pulp oil due to the presence of carotenoids [35], and they decreased during the thermal degradation as shown in Figure 3B.
It is worth pointing out that, during the oxidation process, absorption changes at around 232 and 270 nm are related to the formation of primary and secondary degradation compounds, respectively [16,18]. Figure 4 shows the absorption increase at 232 and 270 nm as a function of heating time, confirming the formation of primary and secondary degradation products [16].
In addition, our results also shown (Figure 5) that, for the pulp oil, the absorption at around 450 nm can be effectively used to monitor oil degradation by observing the carotenoid degradation [36] as recently demonstrated for baru (Dipteryxalata Vogel) oil [37]. In fact, the results demonstrated that carotenoid absorption exponentially decreases as a function of thermal degradation time guided by Equation (2):
A 450 = 0.007 + 0.95 e t 19.7
where A 450 is the oil absorption at 450 nm, and t is the heating time. A coefficient of correlation (R2) of 0.997 was obtained when using Equation (2) for fitting the experimental data.
It is well established that acid compounds are formed during the oil oxidation, especially in the final stage of oxidation process. Aiming to confirm that the oils were degraded during the heating process, the oil acid value was determined as a function of the heating time as shown in Figure 6. The findings revealed that acid value exponentially increased due to the thermal oxidation process, confirming the oil degradation.
Excitation-emission contour maps of kernel and pulp oils obtained before and after the thermal degradation are displayed in Figure 7. The fluorescence results revealed that the emission profile of both oils changed during the oxidation, mainly in the regions at around 325, 520, and 425 nm, typical emission regions of tocopherols [16,19], carotenoids [33,38], and degradation compounds [17], respectively. In fact, our results show that tocopherols and carotenoids are degraded during the oxidation process, as a fluorescent degradation product is formed during the oil oxidation. Accordingly, their emission intensity is reduced while a new fluorescence band arises, with a maximum emission centered at around 425 nm. Magalhães et al. [39] recently demonstrated that conjugated tetraenes molecules are formed during oil degradation, the fluorophore being responsible for this emission.
The fluorescence results shown that the emergence and increase of the conjugated tetraene emission can be used to monitor oil degradation. Figure 8A shows that degradation product emission (at 425 nm) of the kernel oil lineally increased as a function of the heating time. On the contrary, despite the fact that degradation emission of the pulp oil also increase with the heating time as presented in Figure 8B, a linear increase was observed only in the first 48 h. This behavior is explained by the fact that carotenoid emission, which strongly emits in the 400 and 600 nm range (see Figure 7), decreases as function of the time, disturbing the observation of the degradation product fluorescence, especially after 48 h as shown in Figure 8B.

4. Conclusions

The present study determined a predominance of saturated fatty acids (75%) in the kernel oil, while a high percentage of unsaturated fatty acids (66%) was obtained for the pulp oil. Nevertheless, our findings revealed that the concentration of unsaturated chains should not be taken as the main indicative for the oxidative stability for the oils obtained from A. aculeata since intrinsic antioxidant composition contributed significantly to enhancing the oil’s oxidative stability. The results showed that, even though the pulp presented a high content of unsaturated fatty acids, the pulp oil was more stable than the kernel oil due to its higher content of intrinsic antioxidant, especially carotenoids. The induction period of the pulp oil was 1.5 times higher than that of the kernel oil. Additionally, our results also demonstrated that oil oxidation can be optically determined by UV-Vis absorption and fluorescence spectroscopy, detecting the degradation compounds by analyzing the absorption at 232 and 270 nm as well as the fluorescence signal at 424 nm.

Acknowledgments

The authors are grateful for financial support from CNPq, CAPES, FUNDECT, and CEMPEQC coordinated by José. E. de Oliveira.

Author Contributions

I.P.O., W.A.C., P.V.N., P.V.B.S., C.H.L., F.S.M. and W.E.P. performed the experiments; I.P.O. and A.R.L.C. analyzed the data and prepared the figures; I.P.O., R.M.M., S.L.O. and A.R.L.C. wrote the paper. All authors approved the final manuscript.

Conflicts of Interest

The authors declare no conflict of interest.

References

  1. Oliveira, V.B.; Yamada, L.T.; Fagg, C.W.; Brandão, M.G.L. Native foods from Brazilian biodiversity as a source of bioactive compounds. Food Res. Int. 2012, 48, 170–179. [Google Scholar] [CrossRef]
  2. Ciconini, G.; Favaro, S.P.; Roscoe, R.; Miranda, C.H.B.; Tapeti, C.F.; Miyahira, M.A.M.; Bearari, L.; Galvani, F.; Borsato, A.V.; Colnago, L.A.; et al. Biometry and oil contents of Acrocomia aculeata fruits from the Cerrados and Pantanal biomes in Mato Grosso do Sul, Brazil. Ind. Crops Prod. 2013, 45, 208–214. [Google Scholar] [CrossRef]
  3. Ramos, M.I.L.; Siqueira, E.M.A.; Isomura, C.C.; Barbosa, A.M.J.; Arruda, S.F. Bocaiuva (Acrocomia aculeata (Jacq.) Lodd) improved vitamin A status in rats. J. Agric. Food Chem. 2007, 55, 3186–3190. [Google Scholar] [CrossRef] [PubMed]
  4. Coimbra, M.C.; Jorge, N. Proximate composition of guariroba (Syagrus oleracea), jeriva (Syagrus romanzoffiana) and macauba (Acrocomia aculeata) palm fruits. Food Res. Int. 2011, 44, 2139–2142. [Google Scholar] [CrossRef]
  5. Coimbra, M.C.; Jorge, N. Characterization of the Pulp and Kernel Oils from Syagrus oleracea, Syagrus romanzoffiana, and Acrocomia aculeata. J. Food Sci. 2011, 76, C1156–C1161. [Google Scholar] [CrossRef] [PubMed]
  6. Coimbra, M.C.; Jorge, N. Fatty acids and bioactive compounds of the pulps and kernels of Brazilian palm species, guariroba (Syagrus oleraces), jeriva (Syagrus romanzoffiana) and macauba (Acrocomia aculeata). J. Sci. Food Agric. 2012, 92, 679–684. [Google Scholar] [CrossRef] [PubMed]
  7. Traesel, G.K.; de Souza, J.C.; de Barros, A.L.; Souza, M.A.; Schmitz, W.O.; Muzzi, R.M.; Oesterreich, S.A.; Arena, A.C. Acute and subacute (28 days) oral toxicity assessment of the oil extracted from Acrocomia aculeata pulp in rats. Food Chem. Toxicol. 2014, 74, 320–325. [Google Scholar] [CrossRef] [PubMed]
  8. Aguieiras, E.C.G.; Cavalcanti-Oliveira, E.D.; De Castro, A.M.; Langone, M.A.P.; Freire, D.M.G. Biodiesel production from Acrocomia aculeata acid oil by (enzyme/enzyme) hydroesterification process: Use of vegetable lipase and fermented solid as low-cost biocatalysts. Fuel 2014, 135, 315–321. [Google Scholar] [CrossRef]
  9. Lescano, C.H.; Oliveira, I.P.; Silva, L.R.; Baldivia, D.S.; Sanjinez-Argandoña, E.J.; Arruda, E.J.; Moraes, I.C.F.; Lima, F.F. Nutrients content, characterization and oil extraction from Acrocomia aculeata (Jacq.) Lodd. fruits. Afr. J. Food Sci. 2015, 9, 113–119. [Google Scholar] [CrossRef]
  10. Paradiso, V.M.; Gomes, T.; Nasti, R.; Caponio, F.; Summo, C. Effects of free fatty acids on the oxidative processes in purified olive oil. Food Res. Int. 2010, 43, 1389–1394. [Google Scholar] [CrossRef]
  11. Pinheiro, I.; Luis, S.; Ferreira, C. Biodiesel: Parâmetros de qualidade e métodos analíticos. Quim. Nova 2009, 32, 1596–1608. [Google Scholar]
  12. Franco, M.N.; Galeano-Díaz, T.; Sánchez, J.; De Miguel, C.; Martín-Vertedor, D. Antioxidant capacity of the phenolic fraction and its effect on the oxidative stability of olive oil varieties grown in the southwest of Spain. Grasas y Aceites 2014, 65, e004. [Google Scholar]
  13. Mariod, A.; Ismail, M.; Rahman, N.F.A.; Matthaus, B. Stability of rice bran oil extracted by SFE and soxhlet methods during accelerated shelf-life storage. Grasas y Aceites 2014, 65, 1–10. [Google Scholar] [CrossRef]
  14. Gimeno, E.; Castellote, A.I.; Lamuela-Raventos, R.M.; De la Torre, M.C.; Lopez-Sabater, M.C. The effects of harvest and extraction methods on the antioxidant content (phenolics, alpha-tocopherol, and beta-carotene) in virgin olive oil. Food Chem. 2002, 78, 207–211. [Google Scholar] [CrossRef]
  15. Torres, M.; Martínez, M.; Pierantozzi, P.; Albanese, M.; Nasjleti, A.; Maestri, D. Contribution of compositional parameters to the oxidative stability of olive and walnut oil blends. JAOCS J. Am. Oil Chem. Soc. 2011, 88, 755–762. [Google Scholar] [CrossRef]
  16. Dantas, M.B.; Albuquerque, A.R.; Barros, A.K.; Rodrigues Filho, M.G.; Antoniosi Filho, N.R.; Sinfrônio, F.S.M.; Rosenhaim, R.; Soledade, L.E.B.; Santos, I.M.G.; Souza, A.G. Evaluation of the oxidative stability of corn biodiesel. Fuel 2011, 90, 773–778. [Google Scholar] [CrossRef]
  17. Tena, N.; García-gonzález, D.L.; Aparicio, R. Evaluation of virgin olive oil thermal deterioration by fluorescence spectroscopy. J. Agric. Food Chem. 2009, 57, 10505–10511. [Google Scholar] [CrossRef] [PubMed]
  18. Nehdi, I.A. Cupressus sempervirens var. horizentalis seed oil: Chemical composition, physicochemical characteristics, and utilizations. Ind. Crops Prod. 2013, 41, 381–385. [Google Scholar] [CrossRef]
  19. Cheikhousman, R.; Zude, M.; Bouveresse, D.J.R.; Léger, C.L.; Rutledge, D.N.; Birlouez-Aragon, I. Fluorescence spectroscopy for monitoring deterioration of extra virgin olive oil during heating. Anal. Bioanal. Chem. 2005, 382, 1438–1443. [Google Scholar] [CrossRef] [PubMed]
  20. Priego-López, E.; Velasco, J.; Dobarganes, M.C.; Ramis-Ramos, G.; Luque De Castro, M.D. Focused microwave-assisted Soxhlet extraction: An expeditive approach for the isolation of lipids from sausage products. Food Chem. 2003, 83, 143–149. [Google Scholar] [CrossRef]
  21. Almeida, P.P.; Mezzomo, N.; Ferreira, S.R.S. Extraction of Mentha spicata L. Volatile Compounds: Evaluation of Process Parameters and Extract Composition. Food Bioprocess Technol. 2012, 5, 548–559. [Google Scholar] [CrossRef]
  22. Li, Z.; Yang, D.; Huang, M.; Hu, X.; Shen, J.; Zhao, Z.; Chen, J. Chrysomya megacephala (Fabricius) larvae: A new biodiesel resource. Appl. Energy 2012, 94, 349–354. [Google Scholar] [CrossRef]
  23. Georgé, S.; Brat, P.; Alter, P.; Amiot, M.J. Rapid determination of polyphenols and vitamin C in plant-derived products. J. Agric. Food Chem. 2005, 53, 1370–1373. [Google Scholar] [CrossRef] [PubMed]
  24. De Carvalho, L.M.J.; Gomes, P.B.; de Oliveira Godoy, R.L.; Pacheco, S.; do Monte, P.H.F.; de Carvalho, J.L.V.; Nutti, M.R.; Neves, A.C.L.; Vieira, A.C.R.A.; Ramos, S.R.R. Total carotenoid content, α-carotene and β-carotene, of landrace pumpkins (Cucurbita moschata Duch): A preliminary study. Food Res. Int. 2012, 47, 337–340. [Google Scholar] [CrossRef]
  25. Rufino, M.D.S.M.; Alves, R.E.; de Brito, E.S.; Pérez-Jiménez, J.; Saura-Calixto, F.; Mancini-Filho, J. Bioactive compounds and antioxidant capacities of 18 non-traditional tropical fruits from Brazil. Food Chem. 2010, 121, 996–1002. [Google Scholar] [CrossRef]
  26. Vasconcelos, A.F.F.; de Godinho, O.E.S. Uso de métodos analíticos convencionados no estudo da autenticidade do óleo de copaíba. Quim. Nova 2002, 25, 1057–1060. [Google Scholar] [CrossRef]
  27. Cardoso, S.L. Photophysics of carotenoids and the antioxidant role of β-carotene. Quim. Nova 1997, 20, 535–540. [Google Scholar] [CrossRef]
  28. Romero, N.; Robert, P.; Masson, L.; Ortiz, J.; González, K.; Tapia, K.; Dobaganes, C. Effect of α-tocopherol, α-tocotrienol and Rosa mosqueta shell extract on the performance of antioxidant-stripped canola oil (Brassica sp.) at high temperature. Food Chem. 2007, 104, 383–389. [Google Scholar] [CrossRef]
  29. Liang, Y.C.; May, C.Y.; Foon, C.S.; Ngan, M.A.; Hock, C.C.; Basiron, Y. The effect of natural and synthetic antioxidants on the oxidative stability of palm diesel. Fuel 2006, 85, 867–870. [Google Scholar] [CrossRef]
  30. De Sousa, L.S.; de Moura, C.V.R.; de Oliveira, J.E.; de Moura, E.M. Use of natural antioxidants in soybean biodiesel. Fuel 2014, 134, 420–428. [Google Scholar] [CrossRef]
  31. Müller, L.; Fröhlich, K.; Böhm, V. Comparative antioxidant activities of carotenoids measured by ferric reducing antioxidant power (FRAP), ABTS bleaching assay (αTEAC), DPPH assay and peroxyl radical scavenging assay. Food Chem. 2011, 129, 139–148. [Google Scholar] [CrossRef]
  32. Li, X.; Hu, C.; Li, M.; Liu, Z. A study on photoinduced electronic transition in complex of vitamin E and benzoquinone. J. Mol. Struct. THEOCHEM 2004, 674, 257–266. [Google Scholar]
  33. DeCoster, B.; Christensen, R.L.; Gebhard, R.; Lugtenburg, J.; Farhoosh, R.; Frank, H.A. Low-lying electronic states of carotenoids. Biochim. Biophys. Acta 1992, 1102, 107–114. [Google Scholar] [CrossRef]
  34. Navarro-García, G.; Bringas-Alvarado, L.; Pacheco-Aguilar, R.; Ortega-García, J. Oxidative resistance, carotenes, tocopherols and lipid profile of liver oil of the ray Rhinoptera steindechneri. J. Food Compos. Anal. 2004, 17, 699–706. [Google Scholar] [CrossRef]
  35. Qiu, D.; Shao, S.X.; Zhao, B.; Wu, Y.C.; Shi, L.F.; Zhou, J.C.; Chen, Z.R. Stability of β-carotene in thermal oils. J. Food Biochem. 2012, 36, 198–206. [Google Scholar] [CrossRef]
  36. Murador, D.C.; da Cunha, D.T.; de Rosso, V.V. Effects of cooking techniques on vegetable pigments: A meta-analytic approach to carotenoid and anthocyanin levels. Food Res. Int. 2014, 65, 177–183. [Google Scholar] [CrossRef]
  37. Silva, V.D.; Conceição, J.N.; Oliveira, I.P.; Lescano, C.H.; Muzzi, R.M.; Filho, O.P.S.; Conceição, E.C.; Casagrande, G.A.; Caires, A.R.L. Oxidative stability of Baru (Dipteryx alata Vogel) oil monitored by fluorescence and absorption spectroscopy. J. Spectrosc. 2015, 2015, 803705. [Google Scholar]
  38. Christensen, R.L.; Barney, E.A.; Broene, R.D.; Galinato, M.G.I.; Frank, H.A. Linear polyenes: Models for the spectroscopy and photophysics of carotenoids. Arch. Biochem. Biophys. 2004, 430, 30–36. [Google Scholar] [CrossRef] [PubMed]
  39. Magalhães, K.F.; Caires, A.R.L.; Silva, M.S.; Alcantara, G.B.; Oliveira, S.L. Endogenous fluorescence of biodiesel and products thereof: Investigation of the molecules responsible for this effect. Fuel 2014, 119, 120–128. [Google Scholar] [CrossRef]
Figure 1. UV-Vis absorption spectra of the (A) A. aculeata kernel and pulp oils and (B) α-Tocopherol and β-Carotene. Samples diluted in hexane in the concentrations of 0.75 w/v (oils), 50 mg·L−1 (α-Tocopherol), and 3 mg·L−1 (β-Carotene).
Photonics 04 00003 g001
Figure 2. Excitation-emission contour maps of the (A) A. aculeata kernel and pulp oil and (B) α-Tocopherol and β-Carotene. Scatterings were not omitted. Samples diluted in hexane 1.5 w/v, α-Tocopherol 50 mg·L−1, and β-Carotene 3 mg·L−1.
Photonics 04 00003 g002
Figure 3. UV-Vis absorption spectra of the (A) kernel oil and (B) pulp oil as a function of heating time when diluted in hexane at 0.75% w/v. Inset: (A) kernel and (B) pulp oil absorption in the 200–270 nm range when diluted in hexane at 0.04% w/v. The arrows indicate the spectral response with the increase in time.
Photonics 04 00003 g003
Figure 4. Absorbance of the kernel oil at (A) 232 nm and (B) 270 nm and the pulp oil at (C) 232 nm and (D) 270 nm as a function of the heating time. Dotted lines are only guides to the eyes. The oils were diluted in hexane at 0.75% (w/v) and 0.04% (w/v) for analysis at 272 and 230 nm, respectively.
Photonics 04 00003 g004
Figure 5. Pulp oil absorption at 450 nm as a function of the heating time.
Photonics 04 00003 g005
Figure 6. Acid value as a function of heating time: (A) kernel oil and (B) pulp oil.
Photonics 04 00003 g006
Figure 7. Excitation-emission contour maps of the kernel and pulp oil for heating times of 0 and 144 h. Oils were diluted in hexane 1.5 w/v.
Photonics 04 00003 g007
Figure 8. Fluorescence intensity of the degradation product at 425 nm, when excited at 330 nm, as a function of the heating time for (A) kernel oil and (B) pulp oil. The right axis in (B) presents the carotenoids emission at 520 nm when excited at 345 nm.
Photonics 04 00003 g008
Table 1. Fatty acid composition (% of total lipid) in A. aculeata pulp and kernel oils.
Fatty AcidsPulp OilKernel Oil
Caprylic (C8:0)0.06 ± 0.061.7 ± 0.2
Capric (C10:0)0.07 ± 0.062.4 ± 0.4
Lauric (C12:0)0.4 ± 0.250 ± 16
Myristic (C14:0)0.29 ± 0.0510.4 ± 0.5
Palmitic (C16:0)30 ± 16 ± 2
Palmitoleic (C16:1)2.4 ± 0.4-
Stearic (C18:0)2.7 ± 0.34 ± 1
Oleic (C18:1)61.4 ± 0.317 ± 8
Linoleic (C18:2)2 ± 12.7 ± 0.8
Arachidic (C20:0)0.9 ± 0.7-
Σ saturated34.474.5
Σ unsaturated65.819.7
Table 2. Physicochemical parameters of pulp and kernel oils from A. aculeata.
ParametersPulp OilKernel Oil
Iodine value (g I2/100 g)75 ± 936 ± 3
Water content (mg/kg)464 ± 3476 ± 3
Induction period (h)>6543 ± 2
Kinematic viscosity (mm2/s)6.34 ± 0.0213.76 ± 0.01
Dynamic viscosity (mPa·s)5.22 ± 0.0112.09 ± 0.01
Specific mass (kg/m3)823.4 ± 0.6878.65 ± 0.07
Table 3. Antioxidant ability assay by DPPH and ABTS methods and antioxidant compounds in A. aculeata oils.
Antioxidant ActivityPulp OilKernel Oil
DPPH (g sample/g DPPH)63 ± 856.80 ± 0.09
ABTS (µg trolox/g oil)52 ± 39 ± 4
Total Polyphenols (mg gallic acid/100 g)3.9 ± 0.30.70 ± 0.02
Total Carotenoids (µg/g)(49 ± 2) × 10-

