Article

Dynamics of the MnAs α/β-Striped Microstructure and of the Fe Magnetization Reversal in Fe/MnAs/GaAs(001): An Optical-Laser Pump–Free-Electron-Laser Probe Scattering Experiment

by
Franck Vidal
1,
Lounès Lounis
1,2,
Carlo Spezzani
3,4,
Eugenio Ferrari
3,5,10,
Renaud Delaunay
6,
Alessandra Ciavardini
7,
Horia Popescu
7,
Mahmoud Eddrief
1,
Yunlin Zheng
1,
Flavio Capotondi
3,
Emanuele Pedersoli
3,
Cristian Svetina
3,11,
Lorenzo Raimondi
3,
Marco Zangrando
3,8,
Rosen Ivanov
3,12,
Ivaylo Nikolov
3,
Alexander Demidovich
3,
Miltcho B. Danailov
3,
Giovanni De Ninno
3,9,
Enrico Allaria
3,
Maya Kiskinova
3 and
Maurizio Sacchi
1,7,*
add Show full author list remove Hide full author list
1
Institut des NanoSciences de Paris, Sorbonne Universités, UPMC Univ Paris 06, CNRS UMR 7588, 75005 Paris, France
2
Ecole Normale Supérieure, PSL Research University, 75231 Paris, France
3
ELETTRA—Sincrotrone Trieste, Area Science Park, 34149 Trieste, Italy
4
Laboratoire de Physique des Solides, Université Paris-Sud, CNRS-UMR 8502, Bât. 510, 91405 Orsay, France
5
Dipartimento di Fisica, Università degli Studi di Trieste, 34127 Trieste, Italy
6
Laboratoire de Chimie Physique Matière et Rayonnement, Sorbonne Universités, UPMC Univ Paris 06, CNRS UMR 7614, 75005 Paris, France
7
Synchrotron SOLEIL, L’Orme des Merisiers, Saint-Aubin, B.P. 48, 91192 Gif-sur-Yvette, France
8
Istituto Officina dei Materiali, Consiglio Nazionale delle Ricerche, 34149 Trieste, Italy
9
Laboratory of Quantum Optics, University of Nova Gorica, 5001 Nova Gorica, Slovenia
10
Current Address: Particle Accelerator Physics Laboratory, École Polytechnique Fédérale de Lausanne, 1015 Lausanne, Switzerland.
11
Current Address: Swiss Light Source, Paul Scherrer Institute, PSI, 5232 Villigen, Switzerland.
12
Current Address: DESY Photon Science, Notkestr. 85, D-22607 Hamburg, Germany.
*
Author to whom correspondence should be addressed.
Photonics 2017, 4(2), 21; https://doi.org/10.3390/photonics4020021
Submission received: 27 January 2017 / Revised: 11 March 2017 / Accepted: 17 March 2017 / Published: 23 March 2017
(This article belongs to the Special Issue Extreme UV Lasers: Technologies and Applications)

Abstract

:
It was shown recently that the Fe magnetization reversal in the Fe/MnAs/GaAs(001) epitaxial system, attained by temperature control of the regular stripe pattern of the MnAs α- and β-phases, can also be driven by an ultrashort optical laser pulse. In the present time-resolved scattering experiment, we address the dynamics of the MnAs α-β self-organized stripe pattern induced by a 100 fs optical laser pulse, using as a probe the XUV radiation from the FERMI free-electron laser. We observe a loss in the diffraction intensity from the ordered α-β stripes that occurs at two characteristic timescales in the range of ~10−12 and ~10−10 s. We associate the first intensity drop with ultrafast electron-lattice energy exchange processes within the laser-MnAs interaction volume and the second with thermal diffusion towards the MnAs/GaAs interface. With the support of model calculations, the observed dynamics are interpreted in terms of the formation of a laterally homogeneous MnAs overlayer, the thickness of which evolves in time, correlating the MnAs microstructure dynamics with the Fe magnetization response.

1. Introduction

MnAs/GaAs(001) is a metal/semiconductor system in which the interplay between epitaxial constraints and temperature-driven phase transitions gives rise to a peculiar morphological and magnetic behavior [1]. Bulk MnAs undergoes a first order phase transition at T ~ 40 °C, from the hexagonal ferromagnetic (FM) α-phase to the orthorhombic non-magnetic β-phase. At higher temperatures (~125 °C) a second order transition to the hexagonal paramagnetic γ-phase takes place. MnAs has attracted renewed attention in the last decade for its potential applications in magnetocaloric [2,3] and spintronic devices [4]. In particular, the giant magnetocaloric effect at ambient temperatures [2], resulting from the interplay of magnetic and lattice degrees of freedom in the first order phase transition [5,6], provides an interesting approach to magnetic refrigeration.
In a thin MnAs layer grown on GaAs(001), subject to epitaxy constraints, the two phases coexist over an extended temperature range (~10–40 °C) in the form of a regular set of alternating α and β stripes. The period of the stripes, p, and the height of the steps between them, d, are determined by the MnAs layer thickness, t, with p ~ 5 × t and d ~ 1%–2% of t [7]. The period is almost temperature independent (this condition is not met at the extremes of the phase coexistence temperature region), and the relative width of α and β stripes within a period varies continuously with temperature [7,8]. Soft X-ray resonant scattering studies of the morphological and magnetic properties of MnAs/GaAs [8,9] showed that the intensity of the stripe-related diffraction peaks observed in a rocking scan can serve as a benchmark for evaluating the average width of α and β stripes versus temperature [8]. Later on, MnAs/GaAs(001) has been used as a template for growing a Fe ferromagnetic overlayer [10,11,12,13]. Taking advantage of the element selectivity of resonant X-ray magnetic scattering experiments, it was demonstrated that the direction of the Fe magnetization, MFe, can be controlled by varying the morphology of the MnAs template via temperature driven stripe formation [11,13]. These results are interesting for potential applications in temperature induced magnetization switching, without applying external fields.
Recently, it was shown that a ~100 fs optical laser pulse is a convenient trigger for a fast and local MFe reversal in Fe/MnAs [14]. Although a laser pulse is the external stimulus that promotes the magnetization reversal, here the underlying physics is rather different from the all-optical switching processes reported in the literature [15,16,17]. As for the static case [13], the laser-induced switching in Fe/MnAs is driven by the appearance and disappearance of surface dipolar fields, and its speed is determined by the timescales of the MnAs structural modifications in response to the external stimulus.
To date, the dynamics of α-β stripes formation and of their evolution upon ultra-fast local heating has not been explored extensively. A time-resolved experiment carried out at the synchrotron radiation free-electron laser (SR-FEL) source of ELETTRA [18] showed that a 5 mJ·cm−2 laser pulse with 100 fs time duration induces changes in the ordered α-β microstructure with a time constant of about 15 ps. This study made use of non-resonant 130 nm radiation and could span a limited time range of ~100 ps. A laser-based scattering experiment [19] investigated longer timescales, up to microseconds, showing an overall decrease of the diffracted intensity up to 400 ps, followed by a damped oscillatory behavior up to several ns. The results reported in these articles are at least partly in contrast over the common time range, showing either a fast decrease [18] or an increase [19] of the first order of Bragg peak intensity within the first 15 ps after the laser pulse.
Following our previous time-resolved diffraction experiment on Fe/MnAs/GaAs(001) carried out at the x-ray–ulraviolet (XUV) free-electron laser (FEL) source FERMI [14], the main goal of this study is to get more input for correlating the magnetic response of the Fe overlayer with the temporal evolution of the MnAs microstructure. With the help of simulations using a thermal diffusion model, we are able to set the relevant timescales of the magnetic and structural dynamics, revealing that the Fe magnetization reversal is driven by slow re-thermalization rather than by fast structural modifications of the MnAs template.

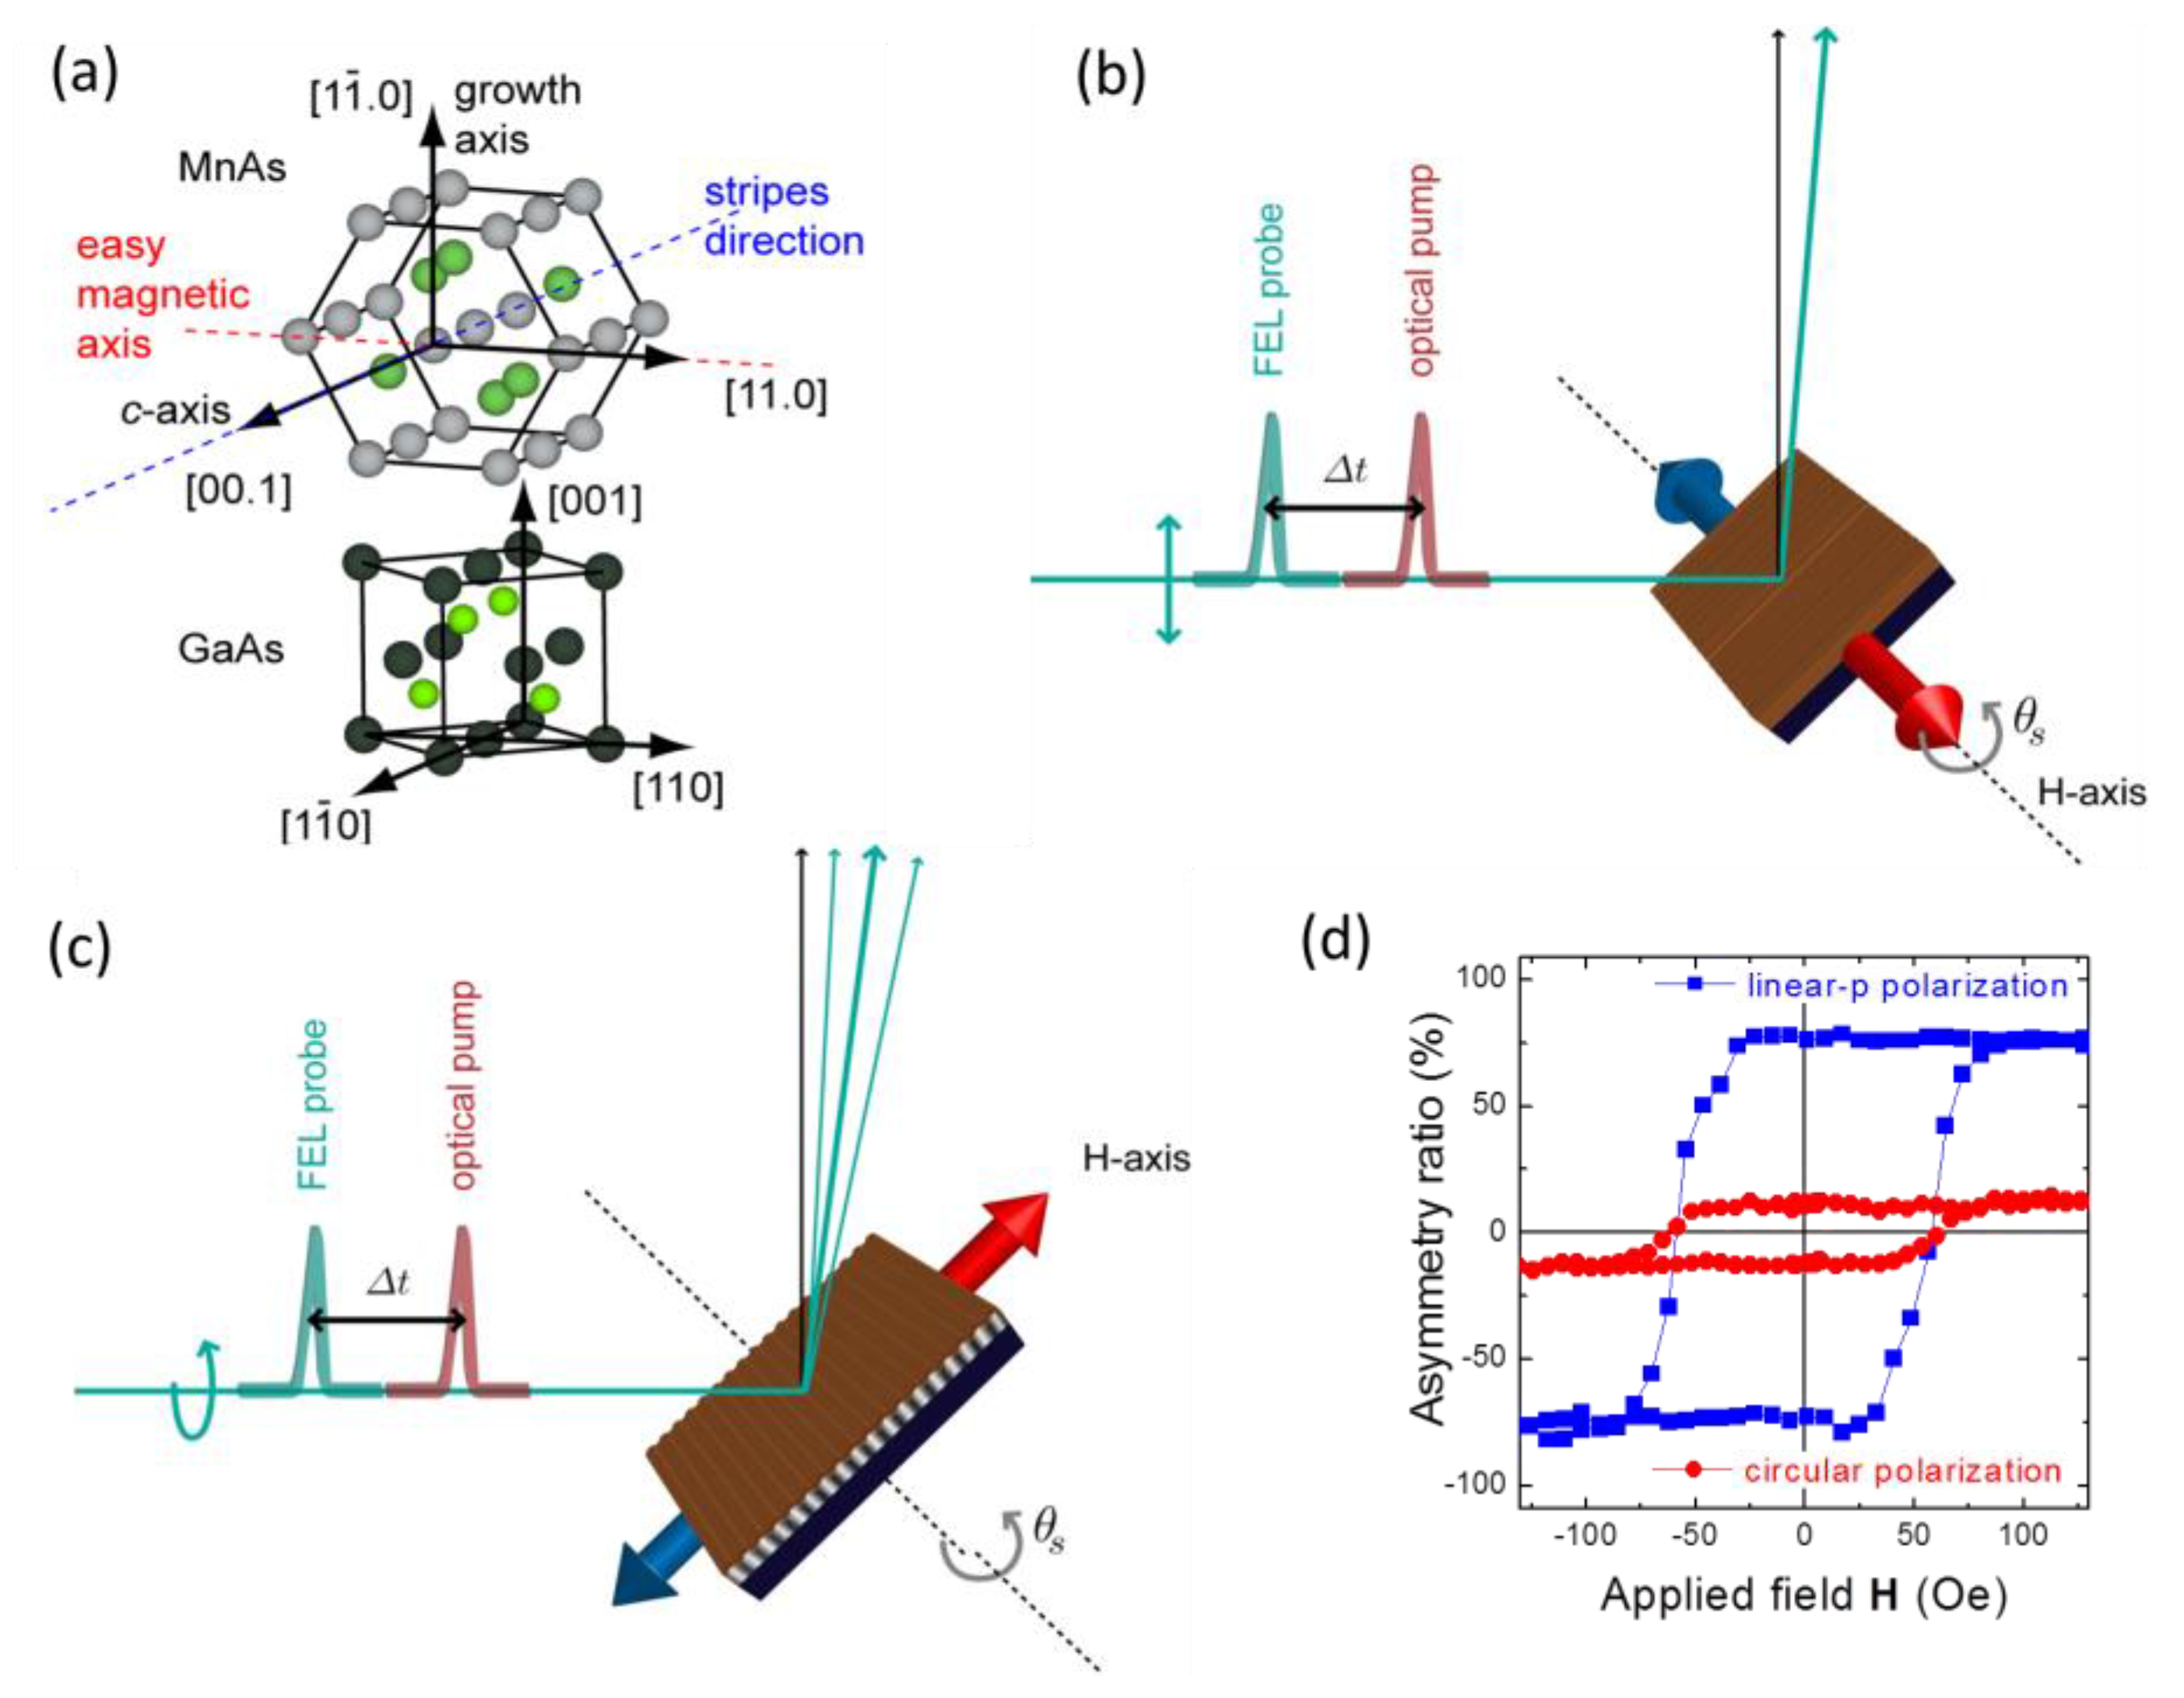
2. Materials and Methods

The sample, with the structure GaAs(001)/MnAs200nm/Fe3nm/ZnSe4nm, was prepared at the Institut des NanoSciences de Paris, following the same molecular beam epitaxy procedure detailed before [10,13]. An atomically flat GaAs buffer layer was grown on the epi-ready GaAs(001) substrate, cleaned at ~600 °C in As flux. Cooling the wafer to 450 °C under As flux formed an As-terminated c(4 × 4) surface. After further cooling to 230 °C, the MnAs layer was grown according to the procedure described by Tanaka et al. [20]. In situ electron diffraction and ex situ x-ray diffraction confirmed the A-type orientation of the MnAs film [1,7], which corresponds to having the [11.0] in-plane easy magnetization axis of the α-phase parallel to the GaAs [110] direction and the stripes running along the GaAs [001] direction (Figure 1a). After transfer under ultrahigh vacuum (UHV) to a separate chamber, the Fe layer was deposited from a Knudsen cell on the MnAs template kept at 160 °C. In situ electron diffraction and ex situ transmission electron microscopy showed ordered epitaxial growth of Fe on MnAs [10]. Finally, we deposited a 4 nm thick wide-gap transparent ZnSe capping layer for protection against contamination. The sample magneto-structural properties were characterized by scanning electron microscopy, atomic and magnetic force microscopy, vibrating sample magnetometry, x-ray diffraction, and the magneto-optic Kerr effect (MOKE). Stripes have an average period of 1340 nm, in good agreement with the expected value when taking into account that the α/β stripe period is influenced by the presence of the Fe overlayer [12].
The FEL-1 source at FERMI [21] provides XUV radiation with tunable energy (20–100 eV) and polarization [22], bunched into high intensity pulses (1012 photons/pulse, <100 fs duration), with excellent energy stability and peak flux reproducibility. The measurements were performed at the Diffraction and Projection Imaging (DIPROI) beamline [23,24], using the IRMA (Instrument pour la Réfléctivité MAgnétique) reflectometer, which features a vertical scattering plane [25]. Two bendable mirrors in Kirkpatrick-Baez configuration focused the x rays into a sub-100 µm spot. The same optical laser beam (λ = 780 nm) that seeds the FEL was used for pumping the sample, ensuring an extremely low jitter (<10 fs) between the pump and the probe [26,27]. The optical pump and the FEL probe beams were kept almost collinear (<2° apart), introducing a negligible temporal spread over the measured area. In order to have homogeneous pumping over the probed area the optical laser spot-size was adjusted to be about 300 µm at the sample, i.e., three times that of the FEL. The fluence, F, of the optical laser pump was calibrated at the sample position by measuring the energy passing through a 100 µm pin-hole, using a power-meter placed in air behind a UHV window; F values were adjusted over the 1–25 mJ·cm−2 range by using crossed polarizers. In the following, we will always refer to the raw F values of the laser pump as measured by the power meter; a correction factor of ~0.6 must be applied to account for window transmission, incidence angle, and sample reflectivity. The superposition of pump and probe beams was checked by scanning their positions while measuring the intensity transmitted through the same 100 µm pin-hole. The arrival time of the laser pump with respect to the FEL probe could be adjusted using an optical delay line; the probe-to-pump delay, Δt, could go from negative values (probe arriving before the pump) up to 400 ps in fs steps.
The sample holder was comprised of an electromagnet for applying fields of up to 500 Oe (1.5 kOe pulsed) parallel to the sample surface. A Peltier thermoelectric device set the static sample temperature TO, which was monitored by a thermo-resistance. All details concerning the experimental conditions (scattering geometry, sample temperature, etc.) had been optimized prior to the FEL experiment, during a dedicated session at the Circular Polarization beamline of the ELETTRA synchrotron, which covers the required energy range with variable polarization. The best sensitivity to magnetic order at the 3p resonances was attained using linear rather than circular polarization, adopting a transverse MOKE (T-MOKE) geometry [28,29], and setting the scattering angle close to the Brewster extinction condition (see Figure 1). Therefore, magnetic measurements were carried out by aligning the α-MnAs easy magnetization axis normal to the vertical scattering plane (i.e., with the stripes oriented within the scattering plane) and by using linear-vertical polarized x rays (Figure 1b). Under these conditions, variations of almost one order of magnitude in the scattered intensity were observed upon magnetization reversal (Figure 1d).
For structural analysis, we oriented the MnAs sample with the stripes orthogonal to the scattering plane (Figure 1c). The rocking curves were measured by scanning the sample angle, θS, at a fixed detector angle, θD, in order to vary the projection of the exchanged momentum along the sample surface in the direction orthogonal to the stripes. Magnetic signals can be recorded also in the geometry of Figure 1c if one uses circularly instead of linearly polarized photons (Figure 1d), but the relative variation of the scattered intensity upon magnetization reversal is much smaller than for the T-MOKE geometry of Figure 1b. All the magnetic scattering data shown hereafter were collected using 53.7 eV photons, tuned to the Fe-3p resonance.

3. Results

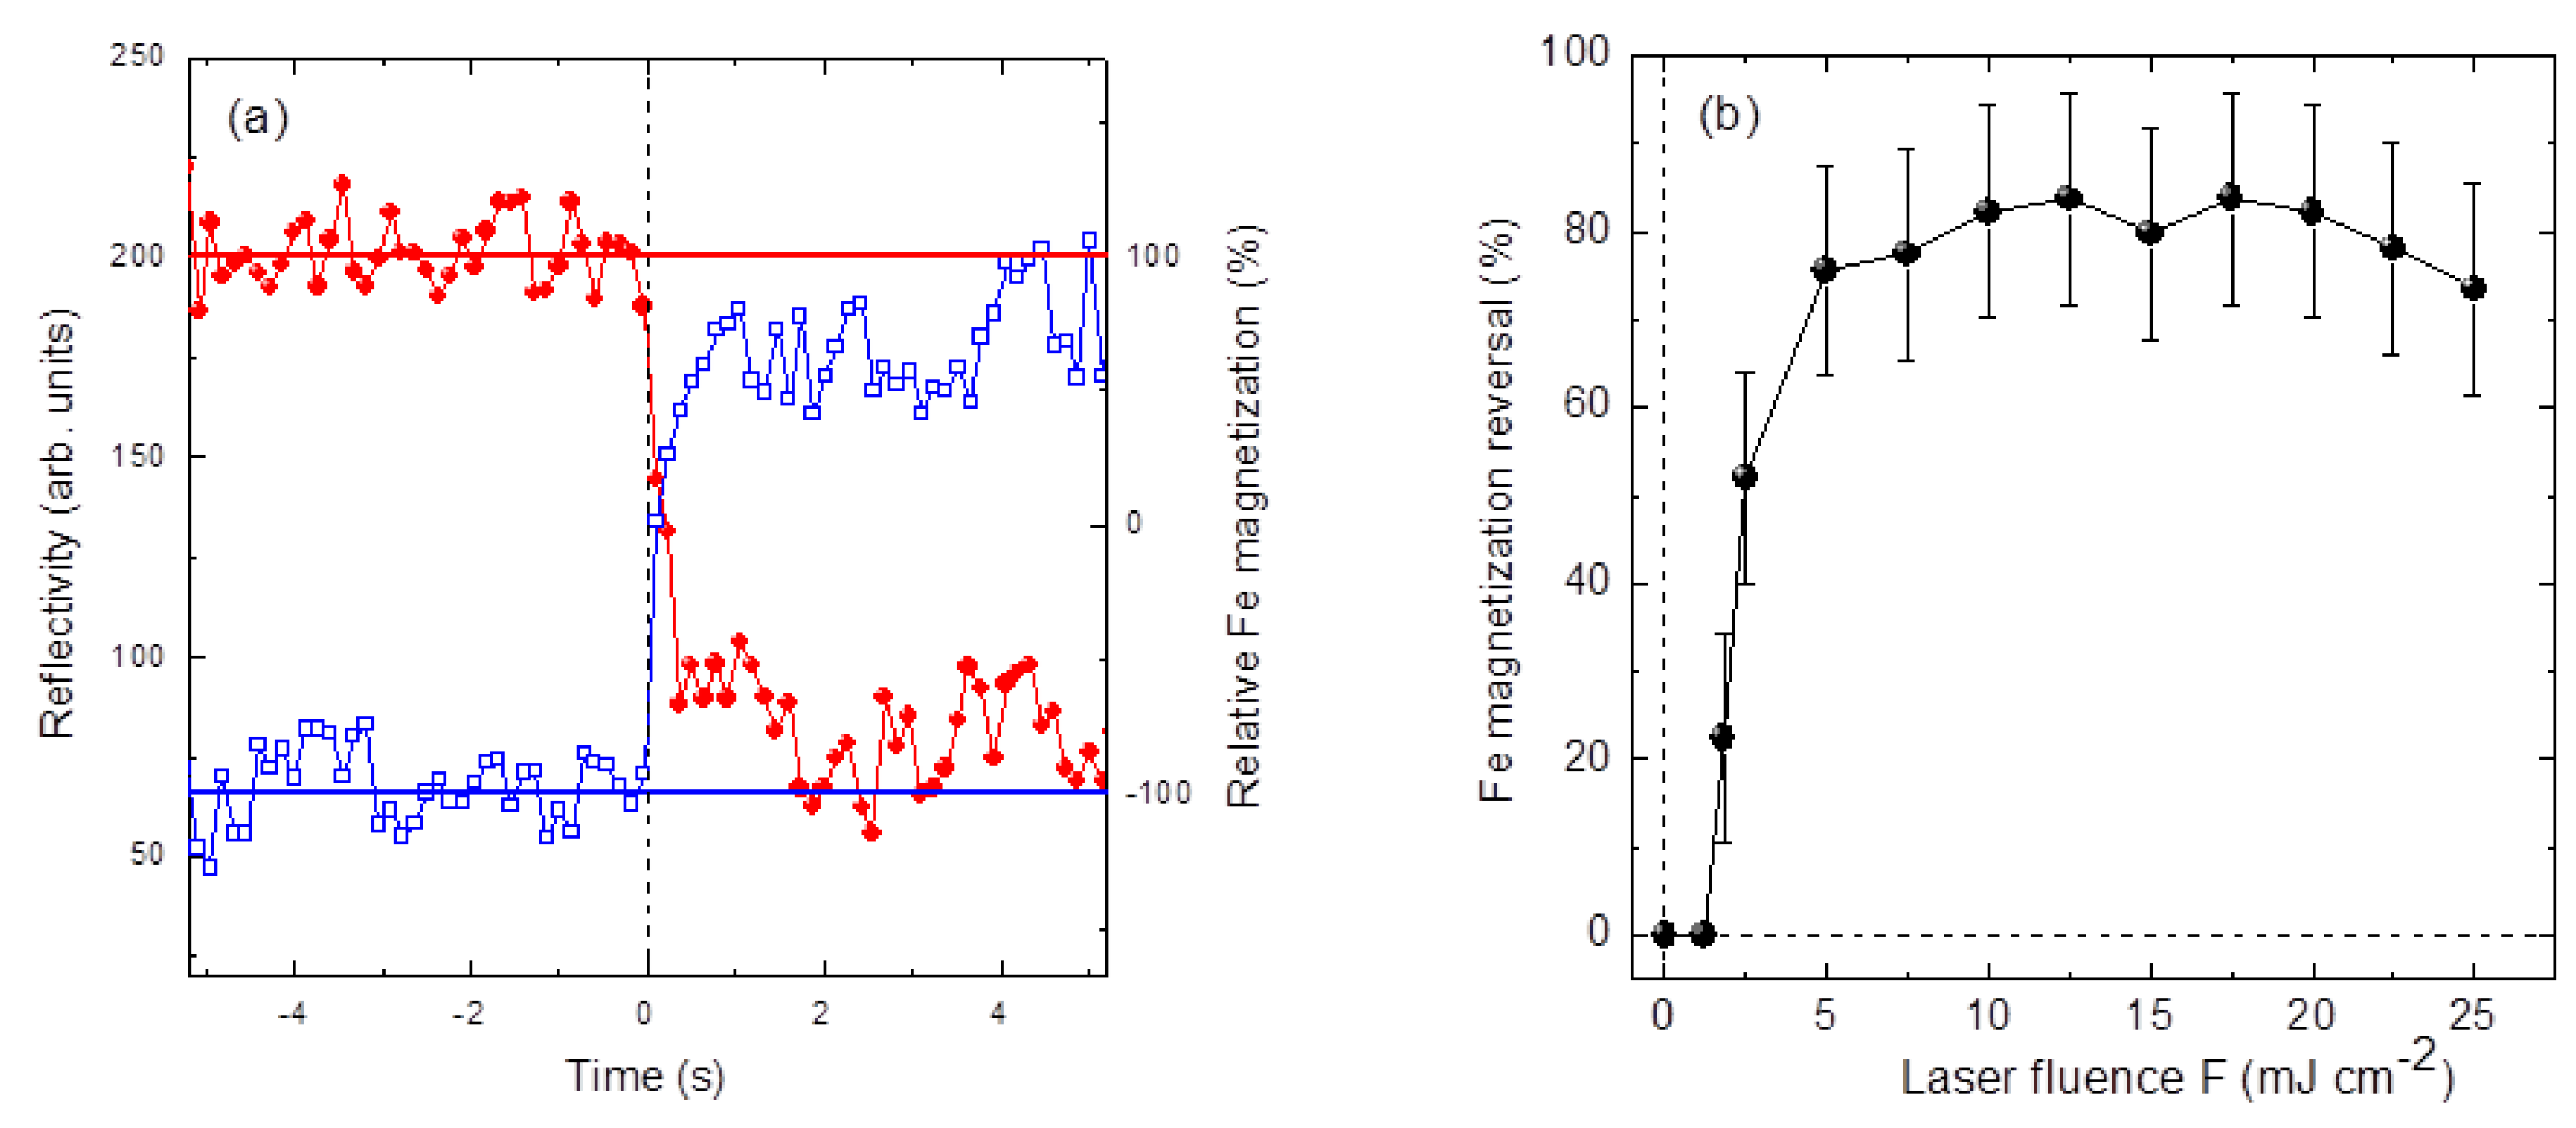
3.1. Magnetic Response of the Fe Layer

Let us briefly recall the magnetic properties of the Fe/MnAs system and the Fe magnetic response to an optical laser excitation. The element selective characterization of the static magnetic properties of the sample was carried out by resonant magnetic scattering using synchrotron radiation [13]. At low temperatures (T < 10 °C), the Fe coercive field (58 Oe) is about twice that of α-MnAs (27 Oe), confirming that no (or very weak) coupling exists between the two ferromagnetic layers. For this specific sample, we also confirmed that MFe can be reversed by thermal cycling [13]. As mentioned above, by working in T-MOKE geometry one can improve considerably the magnetic asymmetry ratio with respect to employing circular polarization (Figure 1d). This is because low photon energy and corresponding high reflectivity at the Fe-3p resonance provide sufficient signal, even close to the Brewster extinction condition. When it is possible to work at the Fe-2p resonance, this choice has to be re-evaluated and the availability of circular polarization is at a prime.
Using the T-MOKE geometry at the Fe-3p resonance, we characterized the fast magnetic response of the Fe layer after the laser pulse. Figure 2 shows a strong reduction of MFe (down to ~60% of its static value) with ~400 fs characteristic time for F = 10 mJ·cm−2. Both the magnetization reduction and the response time depend on the laser fluence. Therefore, at the ps timescale, the Fe overlayer shows ultrafast demagnetization and recovery similar to what is reported in the literature for thin layers of magnetic 3d transition metals [30].
Concerning the Fe-magnetization reversal by a single optical laser pulse [14], magnetization sensitive data were collected at static temperatures, TO, in the 0–10 °C range, i.e., with MnAs in its ferromagnetic α-phase. First, a magnetic pulse (5 ms duration, 300 Oe intensity) set the initial state with saturated and parallel Fe and Mn magnetizations. Then the reflectivity was recorded at remanence as a function of time in single-shot mode (i.e., each experimental point in Figure 3a corresponds to a single FEL pulse) using a channeltron detector and a current amplifier.
At t = 0, a single optical laser pulse was allowed to reach the sample by controlling a mechanical chopper. Figure 3a shows that, once the pump pulse has excited the sample, the reflectivity changes towards the value corresponding to the Fe magnetization opposite to that established by the initial magnetic pulse. By scanning the sample under the FEL beam, we verified that this change is stable in time and takes place locally, within the laser irradiated area only. By comparing the data collected after magnetic pulses of the opposite sign, i.e., starting from initial magnetization states saturated in opposite directions (Figure 3a), we can estimate the efficiency of the process as the fraction of the Fe magnetization that is reversed by a single laser pulse. Figure 3b summarizes these results as a function of F, showing that the efficiency of the fractional MFe reversal strongly depends on the energy deposited by the laser pulse. Above 5 mJ·cm−2, approximately 75%–80% of MFe is reversed regardless of the fluence, while the efficiency diminishes quickly at lower fluences and no reversal occurs at 1 mJ·cm−2.
As the next step, we addressed the timescale of the laser-induced Fe magnetization reversal. To do this, we implemented a measurement scheme in which we added to the laser-pump FEL-probe sequence a magnetic pulse that resets the sample magnetization in the same saturation state before each measurement. The FEL clock drove the magnetic pulse generator with an adjustable delay that was set to ~50 ms, making each magnetic pulse arrive approximately halfway between two consecutive FEL pulses. Spanning the whole available Δt range of 400 ps, we were not able to observe any Fe magnetization reversal in our reflectivity measurements. By sending only one magnetic pulse out of two (i.e., by averaging the signals originating from two subsequent x-ray pulses), the magnetic signal in the specular reflectivity was reduced close to zero. These two observations, together with the results in Figure 3a, indicate that the laser-induced Fe magnetization reversal takes place on a timescale shorter than the 100 ms separation between FEL pulses but longer than 400 ps.

3.2. Evolution of the MnAs/GaAs(001) Microstructure

In order to correlate the Fe magnetization response to an optical laser stimulus with the characteristic timescales of the MnAs template modifications, we addressed the MnAs microstructure dynamics in a similar pump–probe scattering experiment.

3.2.1. Experimental Results and Data Analysis

Figure 4a shows a rocking curve measured over the phase-coexistence temperature region with the sample oriented as in Figure 1c. The intense Bragg peaks originate from the regular modulation defined by the α-β stripes with a period p of 1340 nm. By measuring the complete rocking curves, one can determine both the intensity and the position of the diffraction peaks by fitting with five Lorentzians and disentangling the 0th (specular), 1st, and 2nd order contributions. We also collected the scattered intensity at a fixed sample angle (e.g. that corresponding to the 1st order Bragg peak, as shown in Figure 4b) as a function of Δt by scanning the delay line. This approach is less precise, since it does not monitor eventual peak displacements, but it is faster and allowed us to span a wider range of experimental parameters, notably of TO and F. The intensity decrease shown in Figure 4b is fitted by a double exponential decay with two time constants, t1 and t2. Figure 4c evidences the importance of performing both full rocking scans and delay scans. The data obtained by the two measurement methods coincide well as far as the 1st order Bragg peaks are concerned, but the intensity of the 2nd order peaks, which are superimposed on a relatively strong and parameter-dependent tail of the 1st order, can be obtained only by analyzing the full rocking curves. Figure 4c shows also how the delay dependent measurements at a fixed scattering angle can be recalibrated thanks to the results obtained by fitting the complete rocking scans.
The scattering data collected at different sample angles (specular, 1st, and 2nd order Bragg peak positions) as a function of TO and F were analyzed using a double exponential decay function of the delay Δt. The trend of the characteristic timescales t1 and t2 with TO and F is summarized in Figure 5.
Figure 6 compares the rocking scans measured at three delays for F = 10 mJ·cm−2 and at room temperature. At a negative delay (−10 ps, black circles), both the 1st and 2nd order Bragg peaks are visible and intense. After +155 ps (red squares), the 2nd order peaks are not distinguishable anymore, while the 1st order ones shift closer to the specular. At +255 ps delay (blue triangles), the 1st orders have become very weak and keep shifting towards the specular. The 2nd orders seem to regain intensity, but are shifting away from the specular, i.e., in the opposite direction with respect to the 1st orders.
Fitting similar rocking curves measured at several delays with five Lorentzians provides information on the position (Figure 6b), intensity (Figure 6c), and width of Bragg peaks. The width of the 1st orders (0.35° ± 0.05°) does not change appreciably up to about 150 ps, then it becomes slightly larger (0.45°) but with larger uncertainty too. Figure 6c shows that the diffracted intensity steadily decreases, whereas the specular reflectivity increases by about 10% within 50 ps and up to 15%–20% at longer delays. The peak positions can be determined precisely as a function of delay; the specular reflectivity is found at a constant position within the experimental precision, confirming that there is no drift in the sample angle over the timespan of the measurements. On the contrary, the 1st order Bragg peaks distinctly move closer to the specular reflection as a function of the delay. The stripes period p is given by p = /[2sin(θ)·sin(Δθ)], where λ is the photon wavelength, θ = θD/2 is half the scattering angle θD, i.e., the specular reflection angle, and Δθ = θS − θ is the off-specular angle corresponding to a Bragg peak of order n. Analyzing the peaks at Δθ ~ 0.7° with n = 1 (red squares in Figure 6d) shows that p evolves with delay from 1340 nm (static value) to ~1550 nm at Δt = 250 ps. Assuming n = 2 (open blue triangles), the analysis of peaks at Δθ ~ 1.4° leads to consistent results up to Δt ~ 100 ps, where they disappear. For Δt > 200 ps, there is an intensity regain at Δθ ~ 1.6° (see Figure 6b,c), but the peak position calculated with n = 2 is no longer consistent with the corresponding n = 1 peak at Δθ ~ 0.7° (encircled points in Figure 6d).
Looking at the complete set of data (scattered intensity at 1st and 2nd orders as a function of TO, Δt, and F), a few general trends for the structural dynamics of MnAs/GaAs(001) can be outlined:
-
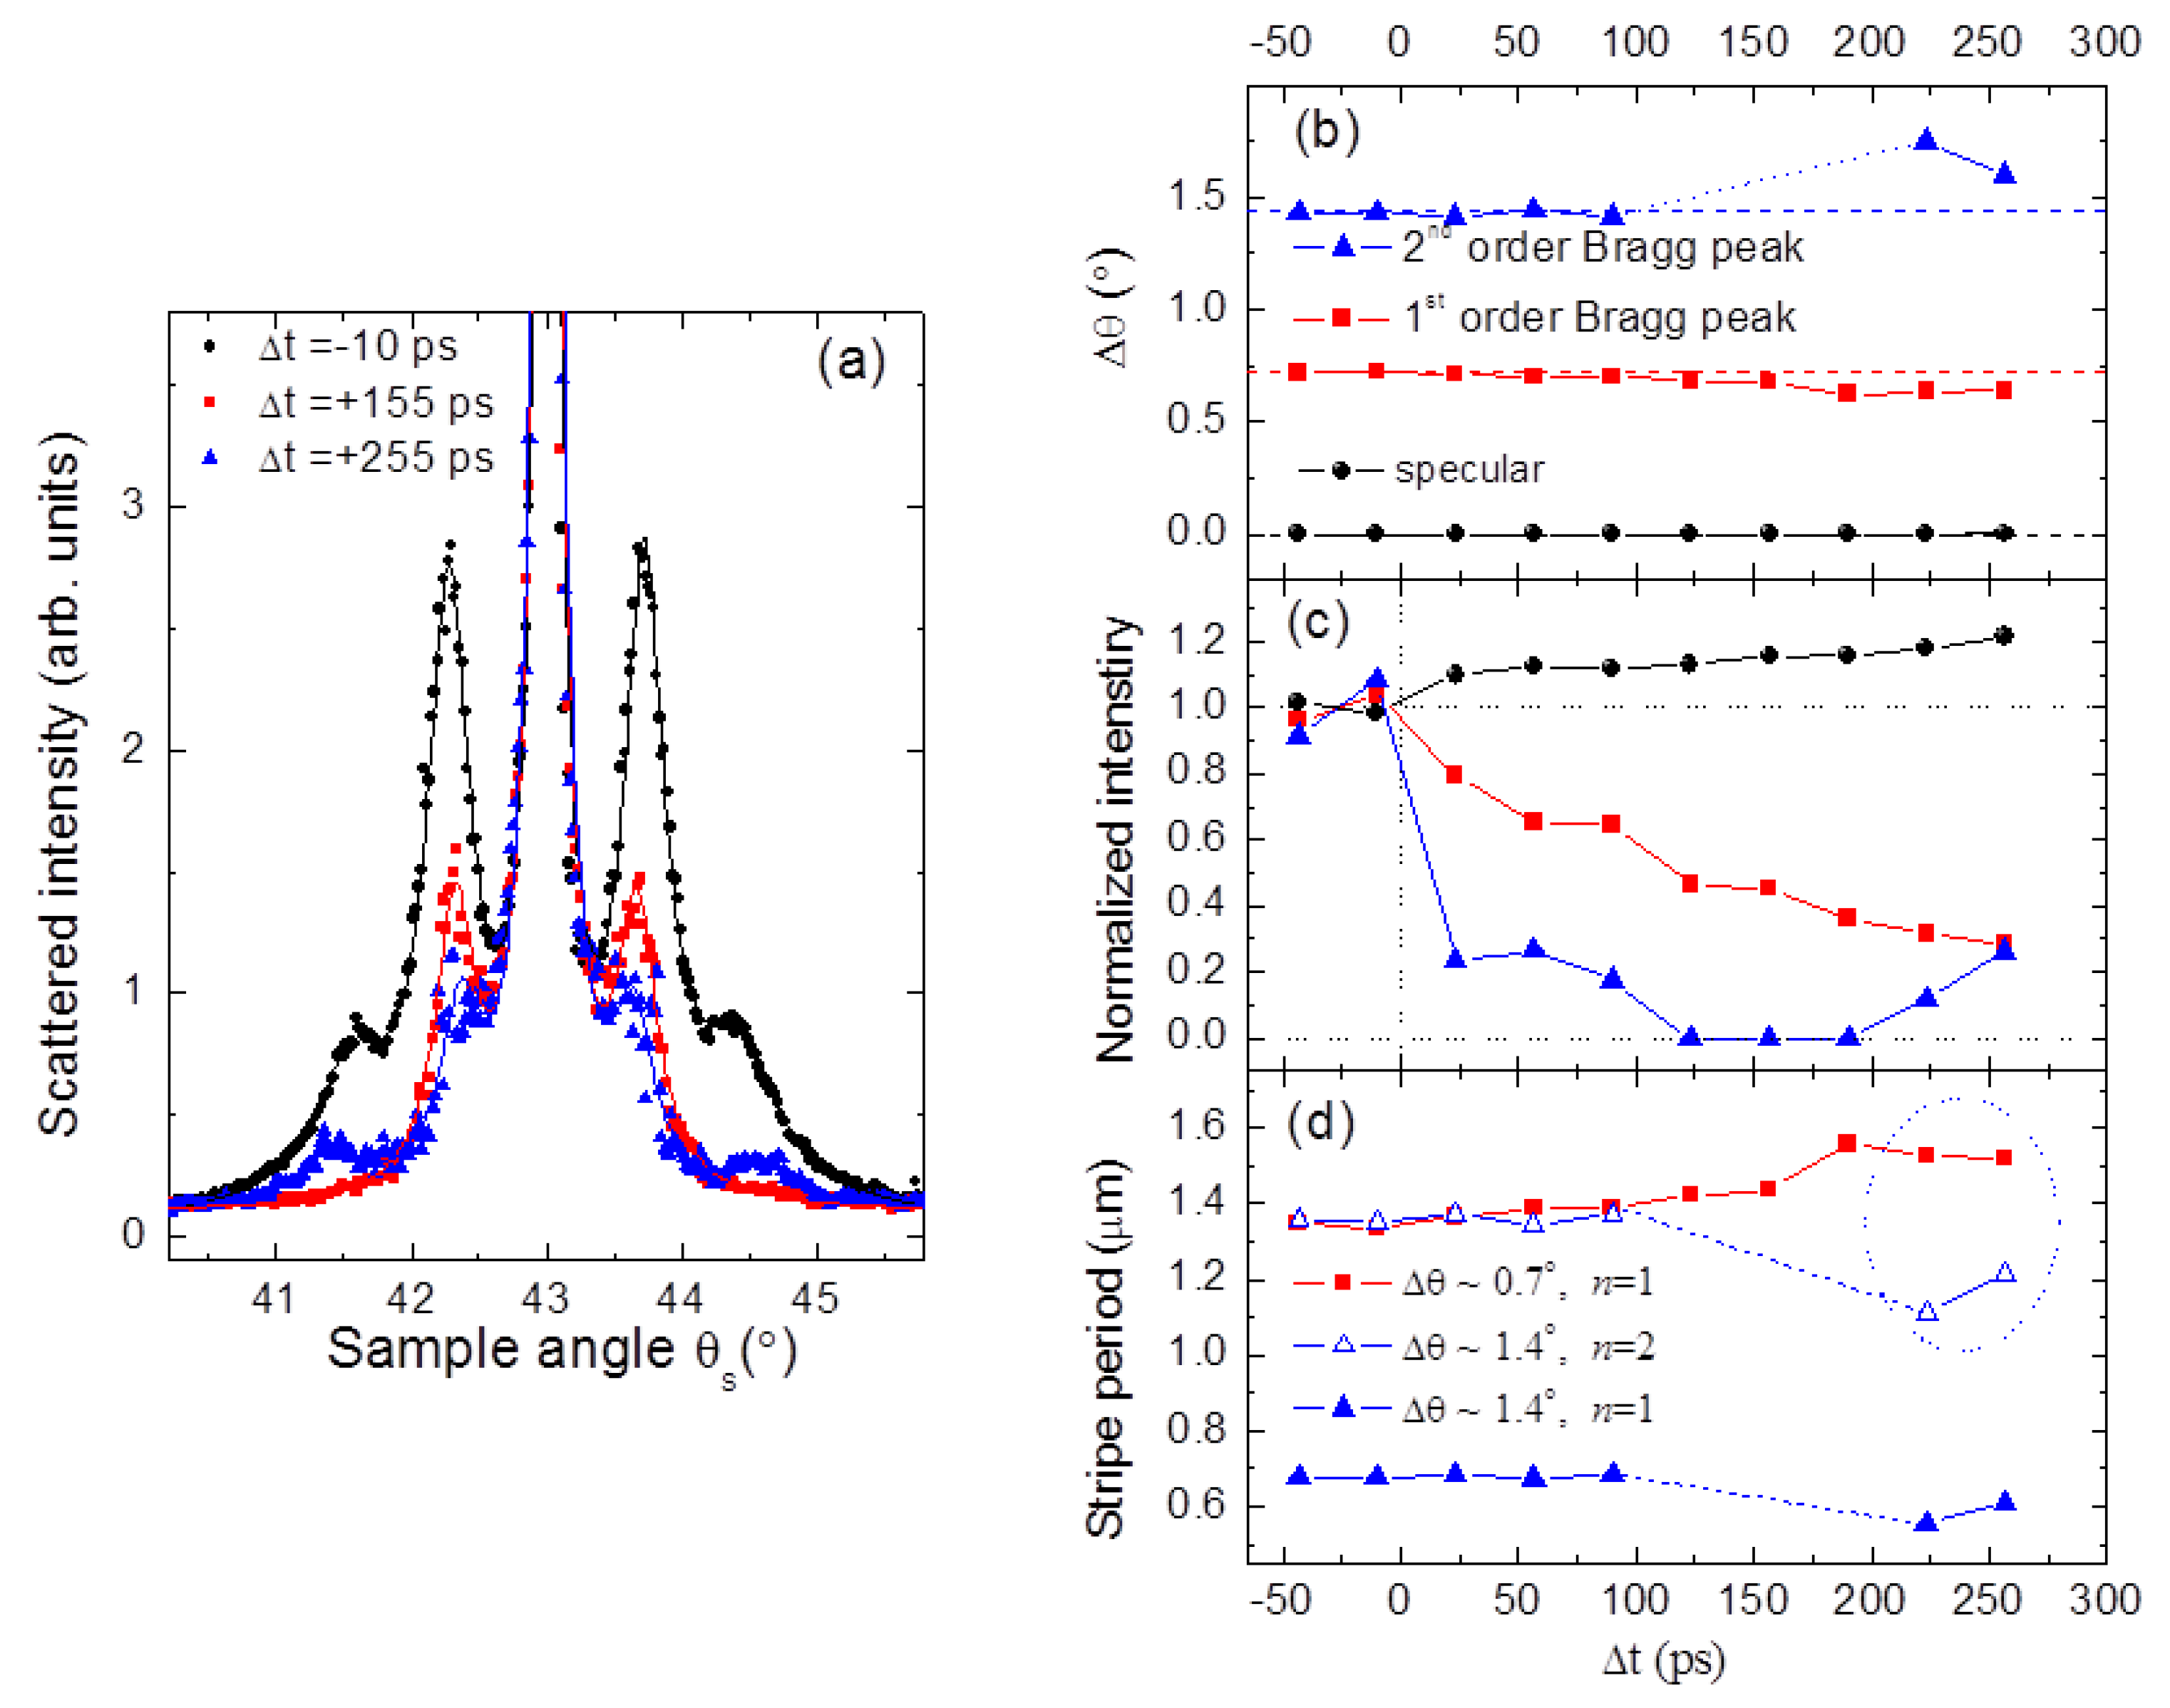
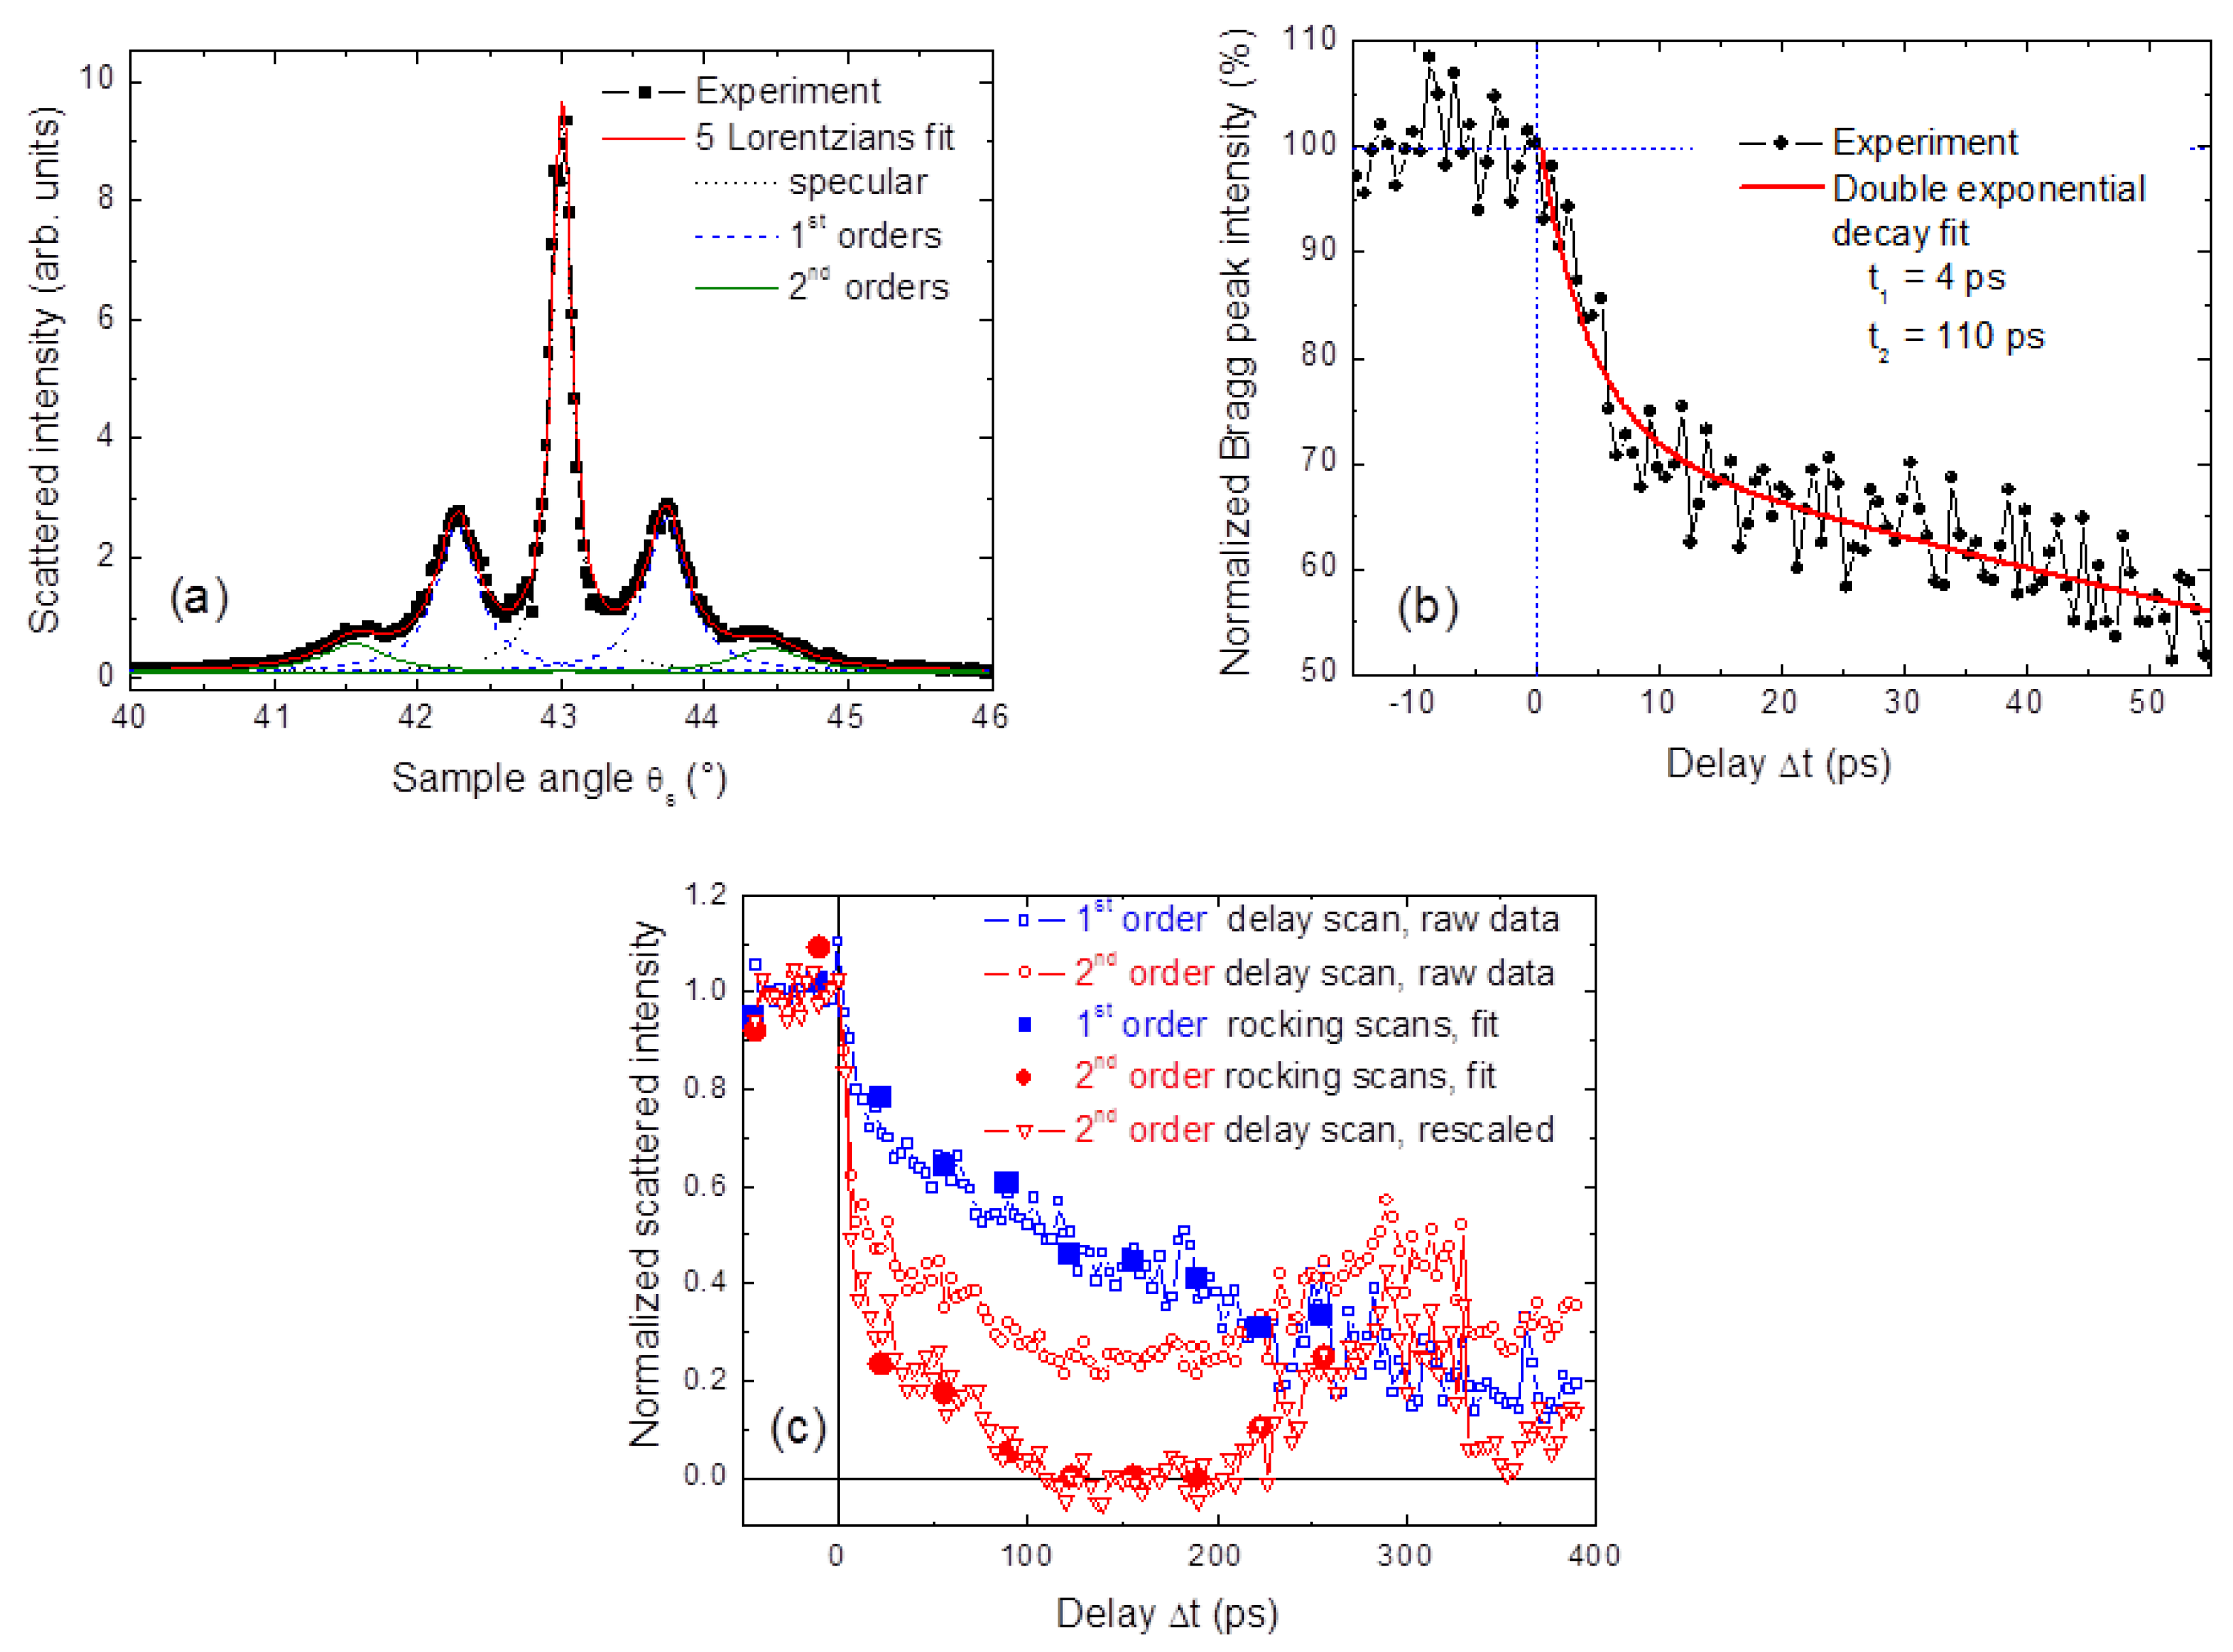
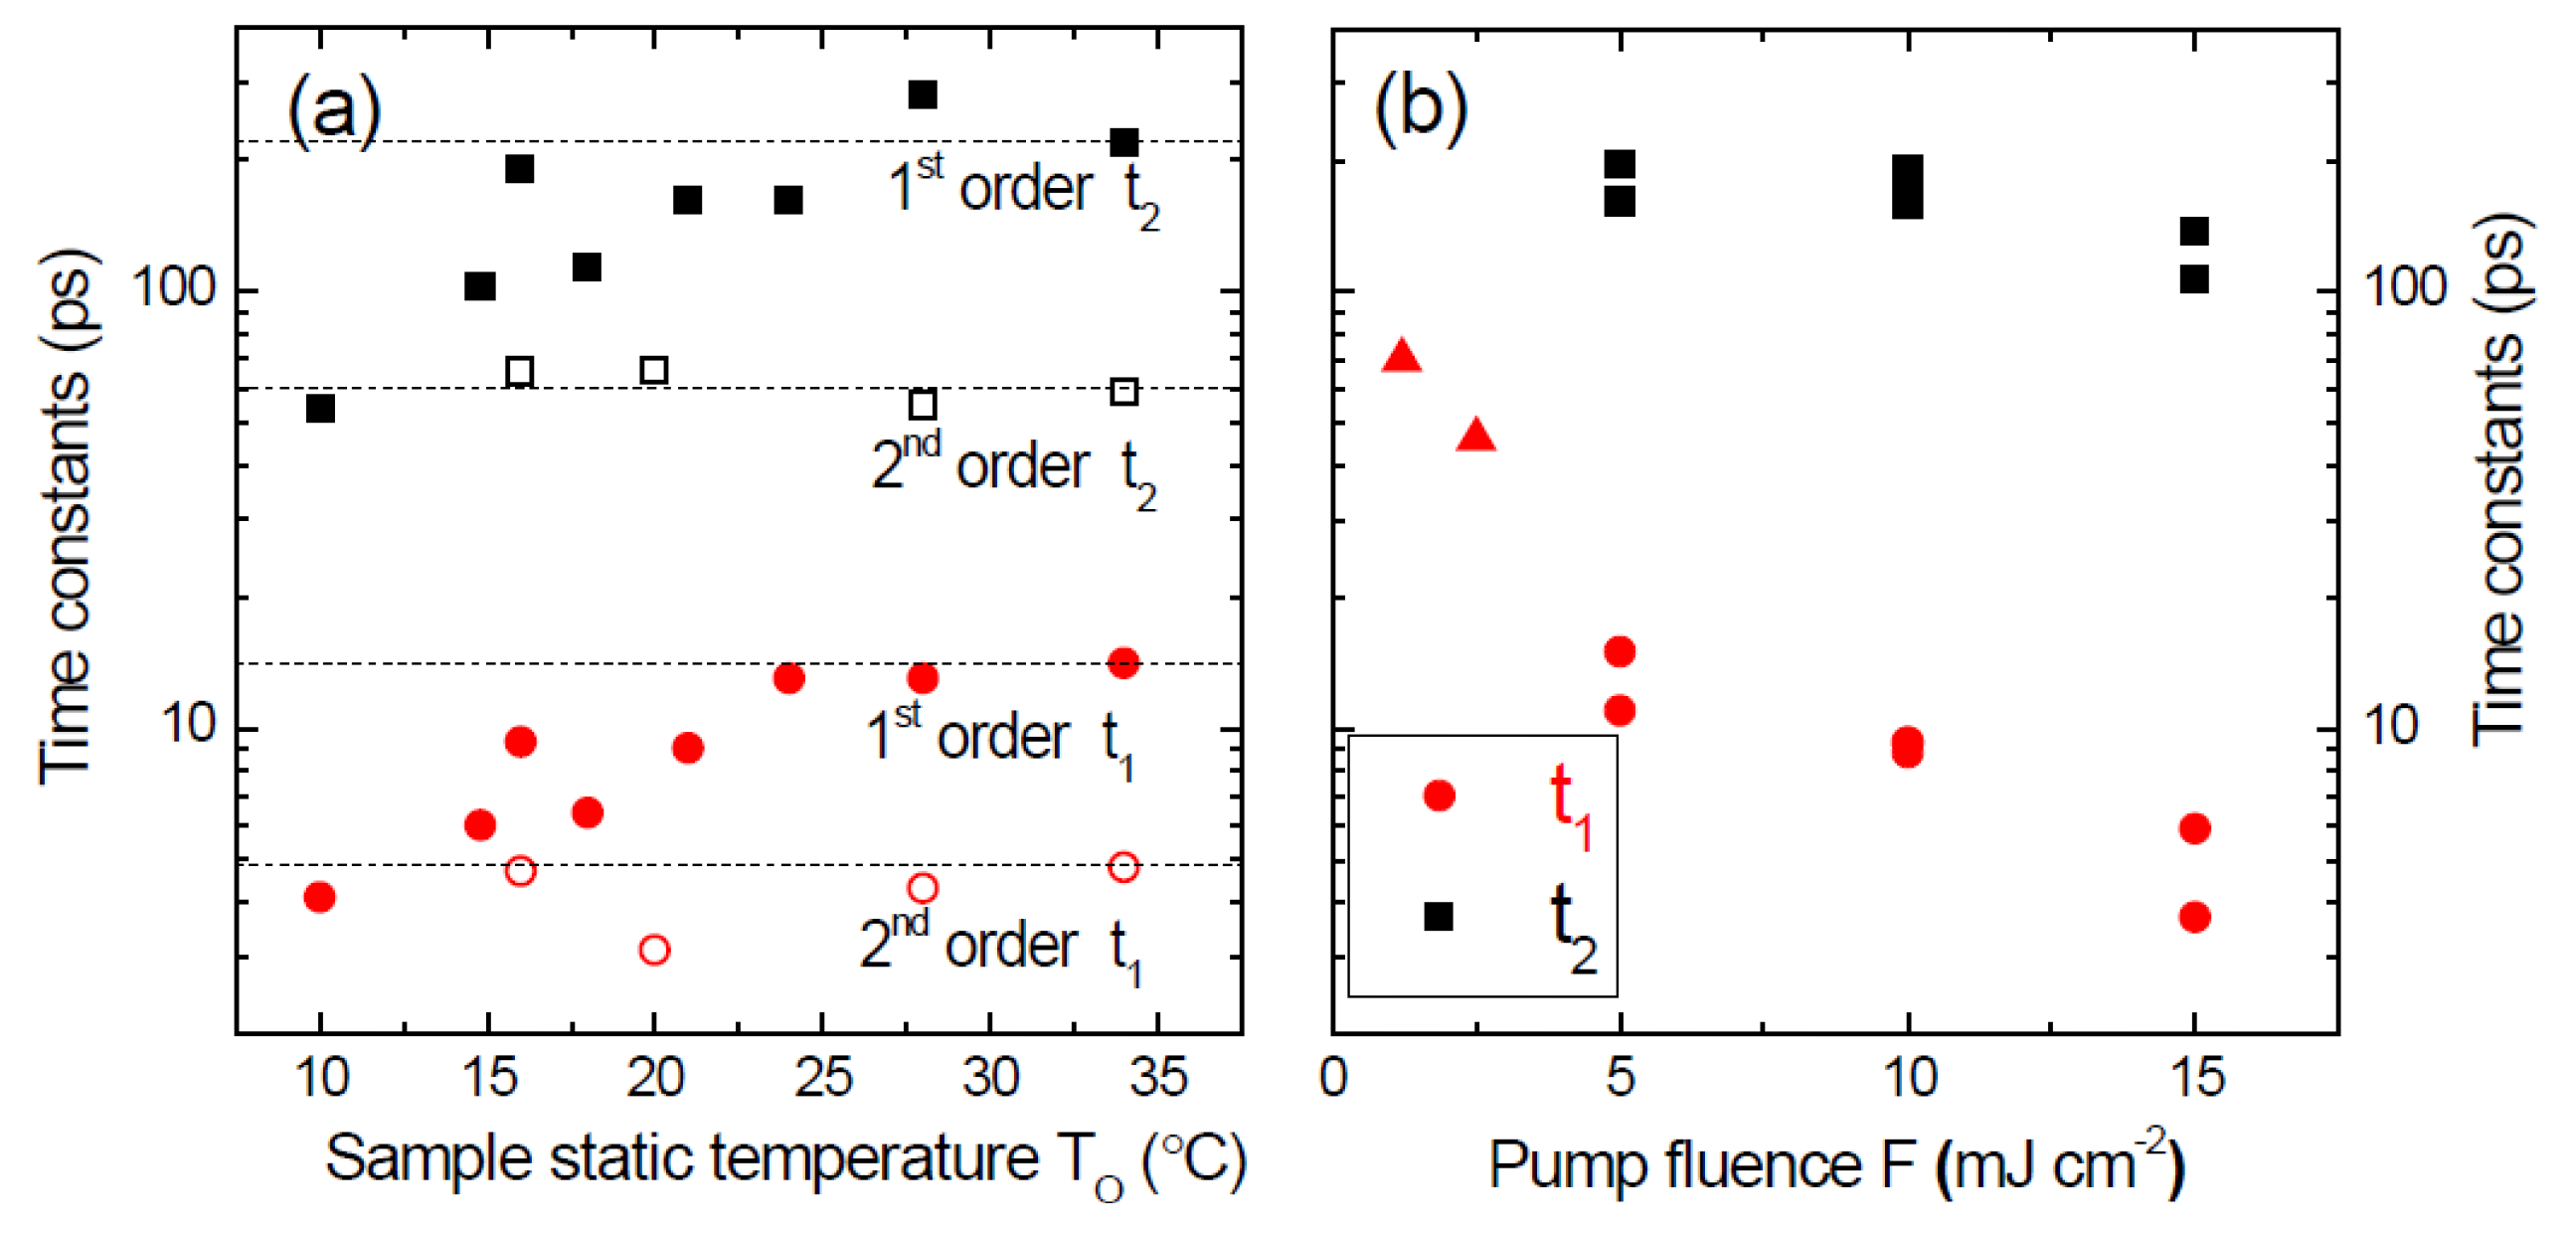
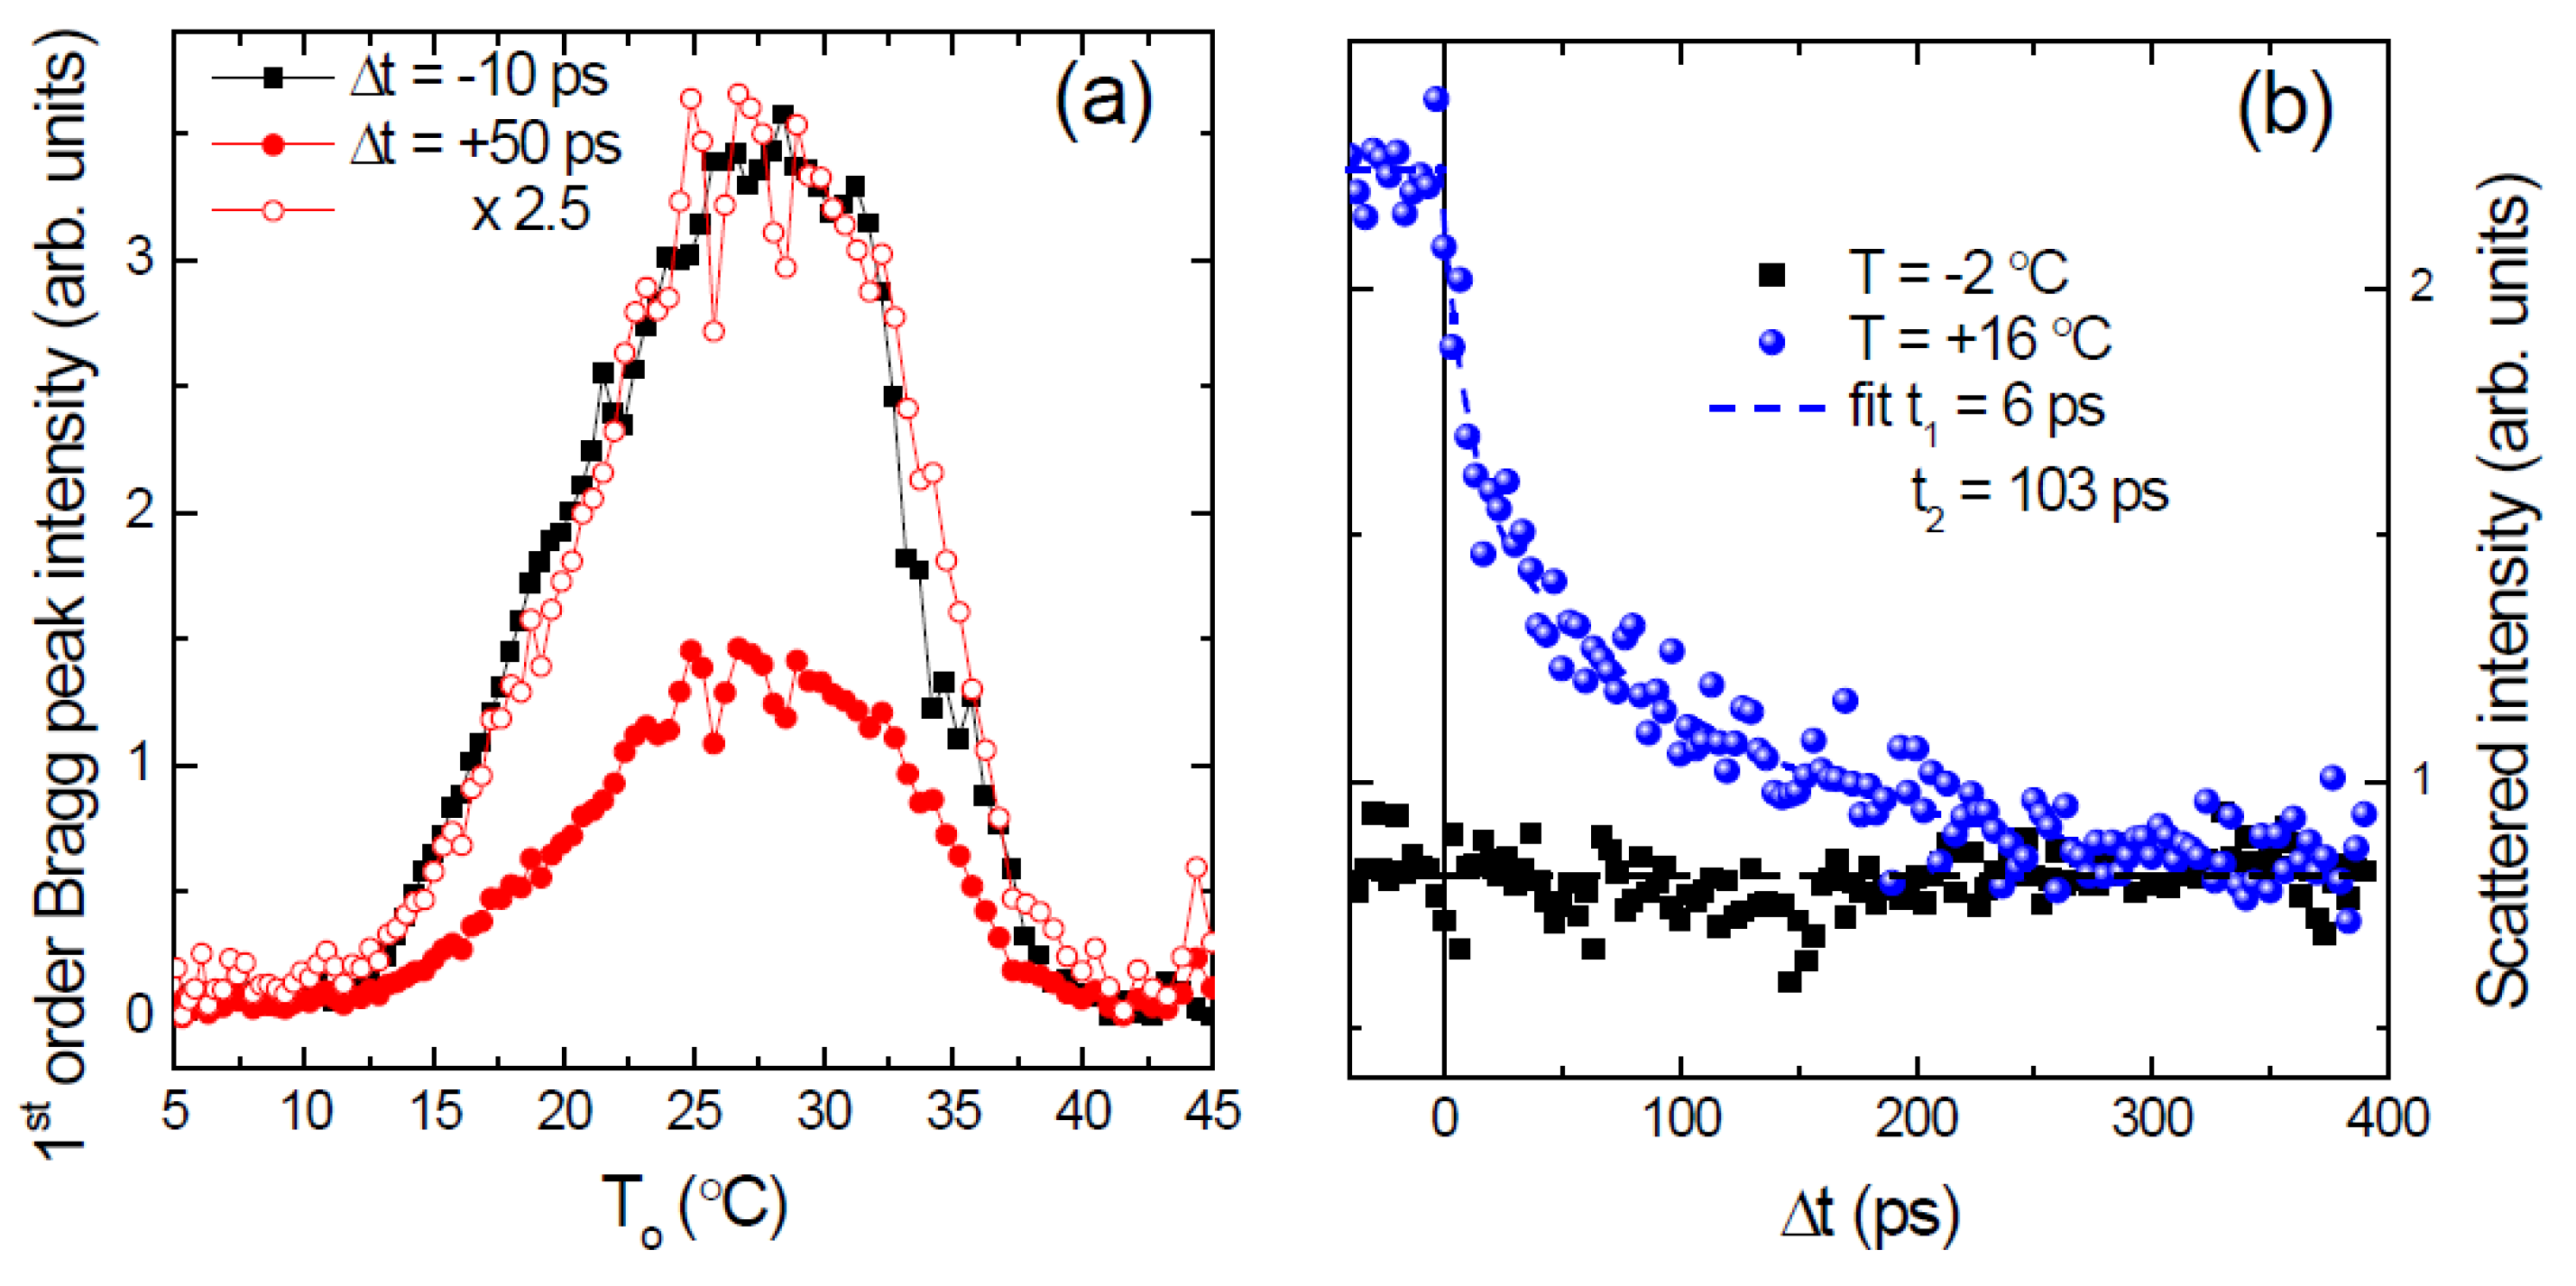
The temporal evolution of both 1st and 2nd order peaks shows clearly two different slopes, and it can be fitted by a double-exponential decay function, with two characteristic time constants t1 and t2. The values of t1 (4–14 ps) and of t2 (50–200 ps) for the 1st order peaks vary with parameters TO and F, but there is always about one order of magnitude between the two (Figure 5).
-
The 2nd order intensity decays faster than the 1st order one, both in t1 and t2 (Figure 5a).
-
Specular reflectivity increases steeply over a few tens of ps (Figure 6c).
-
While the first order peaks decrease monotonically up to 400 ps, the 2nd orders, which vanish after approximately 100 ps, seem to regain intensity for Δt > 200 ps (Figure 6c).

3.2.2. Electron-Spin-Phonon Coupling, α→β Transition and Time evolution of Bragg Peak Intensities

If it is clear that the α→β transition in MnAs takes place as a function of temperature, it has been shown that, at a more fundamental level, it is strongly influenced by the magnetic order. The first order magneto-structural phase transition in MnAs has been the object of many studies, both theoretical and experimental. One element of interpretation that is brought up recurrently is the presence of a soft phonon mode that drives the transition [31,32], giving preeminence to the magnetic contribution to entropy over the structural one [33]. The work by Lazewski et al. [34,35] has formalized this point better. By using density functional theory calculations, they simulated the structural and dynamic properties of the hexagonal and orthorhombic MnAs phases, showing the existence of a soft phonon mode that reduces the hexagonal symmetry of the α-phase to the orthorhombic one. They also revealed a marked influence of the magnetic order on the soft-mode frequency and on the dynamical stability of the α-phase, pointing at the strong spin-phonon coupling as the origin of the α→β magneto-structural transition. In particular, magnetic disordering is suggested to be responsible for the discontinuous volume change concomitant with the phase transition.
The analysis of the time evolution of the MnAs microstructure relies naturally on the electron-lattice interactions, following the energy deposition by the laser pump. This can induce in a few picoseconds a temperature increase exceeding one hundred degrees within the absorbing layer, driving the MnAs structure into the β-phase and possibly into the γ-phase as well. It is interesting, though, to consider our scattering data also within the framework of the Lazewski et al. model [34,35] in which the observed dynamics of Bragg peaks intensities can be associated with the laser induced ultra-fast Mn demagnetization driven by electron-spin coupling, a process that takes place within ~1 ps. The spin-lattice coupling, mediated by the soft phonon mode, would then promote the α→β transition. Within this description, the microstructure dynamics are initiated by the ultrafast demagnetization and driven by the spin-phonon coupling. Since both electron-lattice and spin-lattice characteristic timescales are of the order of a few ps, we cannot discriminate between their contributions based on our experimental results alone.
The shorter timescale t1 observed in our experiment (Figure 5) corresponds to the electron-lattice and/or spin-lattice energy exchange processes, leading to the formation of a homogeneous MnAs layer within the irradiated volume. In the following, we will assume that this layer is in the β-phase, but from our XUV scattering data alone we cannot exclude a direct transition to the hexagonal paramagnetic γ-phase. Since the laser pulse is entirely absorbed within a thickness of ~30 nm, the MnAs layer below still features α–β coexistence with a height difference that modulates the top β layer. If we picture our sample as a diffraction grating of period p, with α- and β-stripes defining the top surface and the grooves, respectively, the ultra-fast transition of the top ~30 nm layer into a homogeneous phase reduces both the height and the sharpness of the grating steps. Smoothing of the step edges with, e.g., a Gaussian broadening σ reduces the n-th order Bragg peak intensity with exp{−1/2[nσ/p]2} dependence [36], leading to a faster decrease of the 2nd order intensity with respect to the 1st order one. This matches well our experimental observation of a systematically faster decay of the 2nd order peaks (Figure 5a and Figure 6c).
Thermal diffusion progressively increases the temperature into the depth of the film and the phase transition front proceeds towards the GaAs substrate. Therefore, we associate the slower decrease of the Bragg peak intensity with characteristic time t2 to heat diffusion towards the MnAs/GaAs interface. Both the characteristic phonon modes and the heat capacity strongly depend on T over the phase coexistence region, influencing the energy transfer to the lattice and the thermal diffusion process. This is mirrored in our data by the TO dependence of the timescales t1 and t2 over the 15–35 °C range (Figure 5a).
Summarizing the discussion above, we interpret our results according to a sequence that can be described by the following four steps:
laser pulse/hot electrons → electron–spin coupling → electron/spin–lattice coupling → thermal diffusion.
The characteristic timescales increase by approximately one order of magnitude at each step from the laser pulse width of 10−13 s, to the electron-spin interaction within 10−12 s, to energy transfer to the phonon bath within 10−11 s, to end up with thermal diffusion over the 10−10 s range and beyond. The redistribution of the energy deposited by the laser pump drives, according to different mechanisms, the structural and microstructural transitions in the MnAs layer all along the time evolution of the system.
This description of the MnAs microstructure evolution implies that we will never observe an increase of the stripe-related Bragg peak intensity. This situation should be encountered at low temperatures (T < 25 °C) if one assumes that the deposited energy modulates the width of α and β stripes in a quasi-static T-driven α→β transition [19]. Since over the interaction volume the laser pulse leads to a complete single-phase MnAs transformation, driven by the local energy release to the lattice, the stripes with a long-range order can be destroyed, but their formation or growth at sub-ns timescales is never favored.
To support this conclusion, Figure 7a compares the 1st order Bragg peak intensity measured as a function of the static temperature TO at two fixed delays Δt = −10 ps (filled squares) and Δt = +50 ps (filled circles), i.e., with the probe arriving before and after the pump, respectively. For a negative Δt, one has the same curve measured under static conditions, featuring a maximum at around 28 °C, where the α and β stripes have approximately equal widths [8,11]. A redistribution of the α and β widths at a fixed stripe period following the laser pulse should lead to a different TO dependence for negative and positive delays. On the contrary, at Δt = +50 ps one observes a strong reduction of the Bragg peak intensity but no shift in temperature, as shown better by rescaling the positive delay curve (open circles). Also, at low static temperatures a rearrangement of α and β phases within a given period driven by a temperature increase after the laser pulse would imply a reinforced Bragg peak (e.g., stripes forming for TO = −2 °C or approaching the equal width condition starting from TO = +16 °C). However, the data shown in Figure 7b contradict such a description and demonstrate that the reduction of the Bragg peak intensity is not due to the β stripes widening at the expense of the α stripes. Figure 7b confirms that the laser pulse always weakens Bragg peaks when they are present, regardless of TO (i.e., of the relative α and β widths; see also Figure 4b,c and Figure 6a), and does not promote their appearance when TO is below the phase coexistence region (TO = −2 °C in Figure 7b).
A model in which the microstructure dynamics of the MnAs layer is determined by the step sequence suggested above seems to frame all our experimental findings except one, i.e., the apparent intensity regain of the 2nd order Bragg peak after ~200 ps (see Figure 4c and Figure 6a,c). The oscillatory behavior of the scattered intensity reported by Dean et al. [19] may provide an explanation for this intensity regain, since, if one assumes that the intensity modulations are due to oscillations of the fractional α/β components, the 2nd order peak would vary with twice the frequency of the 1st order one. Our temperature and fluence dependent analysis, though, shows that the laser pulse favours the formation of a laterally homogeneous MnAs layer over the reorganization of the α and β fractions within the stripes. Moreover, the analysis of the peak positions in terms of the stripes period (see Figure 6d) comprises a clear inconsistency between the 1st and 2nd order peaks for delays above 200 ps; the former indicates that p increases, while the latter suggests the opposite. These contrasting observations can be reconciled if one no longer assumes that the intensity regain at Δθ ~ 1.6° is related to the 2nd order Bragg peak of the original stripe pattern but rather to the emergence of a new in-plane order characterized by a different period.
In order to clarify this point, we address the relationship between stripes period p and layer thickness t in our sample. The p ≈ 5 × t relation, derived by Kaganer et al. [7] and confirmed experimentally for MnAs/GaAs(001), is modified by the presence of an overlayer that imposes additional epitaxial constraints at the top interface. A model that provides a satisfactory match to the experimental observations was developed for the epitaxial Fe/MnAs/GaAs(001) system [12]. Here, we extend this model to the system Fe3nm/β–MnAsξnm/α-β–MnAs(200−ξ)nm/GaAs(001), where we split the MnAs layer into two parts and assume that the top one, of thickness ξ nm, has undergone a complete transition to a single MnAs phase. The bottom part of the layer, (200 − ξ) nm thick, still features α/β phase coexistence, forming stripes of period p(ξ). Increasing the ξ value has two counteracting effects; the presence of a thicker β–MnAs overlayer favors a larger p(ξ) period [12], while reducing the thickness of the α/β layer to (200 − ξ) nm favors a shorter period [7]. The energy minimization takes into account both effects simultaneously and leads to the result reported in Figure 8. It shows the calculated p values that minimize the system energy as a function of ξ; the period increases up to ξ ≈ 50 nm, where it decreases rapidly till ξ ≈ 100 nm. At larger ξ values, the calculations do not show any clear energy minimum as a function of p, indicating that stripe formation is no longer favorable. Although it is difficult to compare calculations performed under static conditions with the results of fast dynamics experiments, the p(ξ) trend outlined in Figure 8 provides a clear framework for interpreting our scattering data. In conclusion, the appearance of a new shorter period is ascribed to transient changes in the elastic pattern driven by the excitation of the topmost part of the MnAs film.

4. Discussion of Structural Analysis and Implications on Fe Magnetism

Figure 9 gives a pictorial view of the way we interpret our data.
-
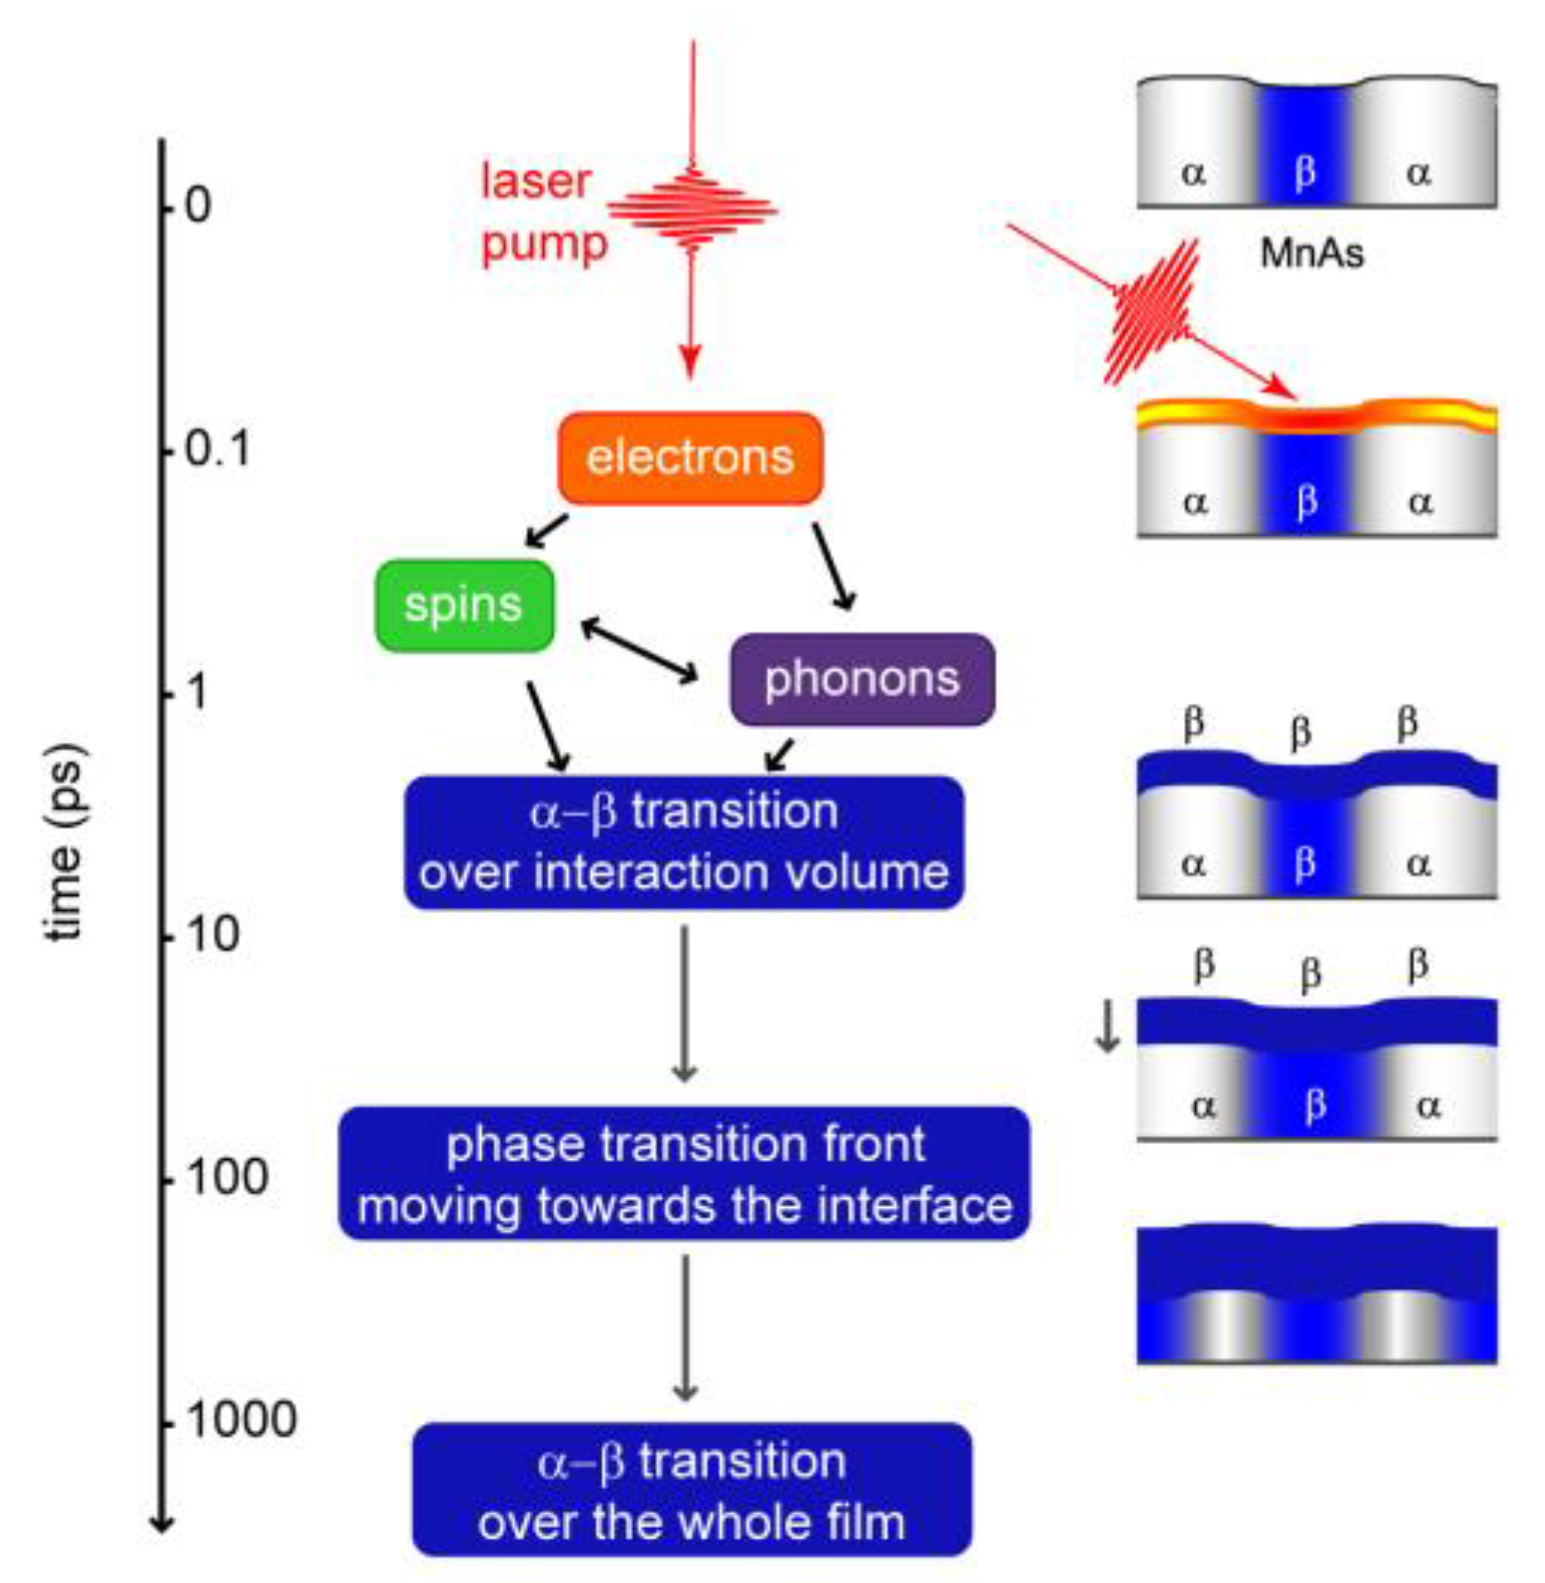
Absorption of pump energy by electrons within ~30 nm from the surface; timescale set by the laser pulse duration.
-
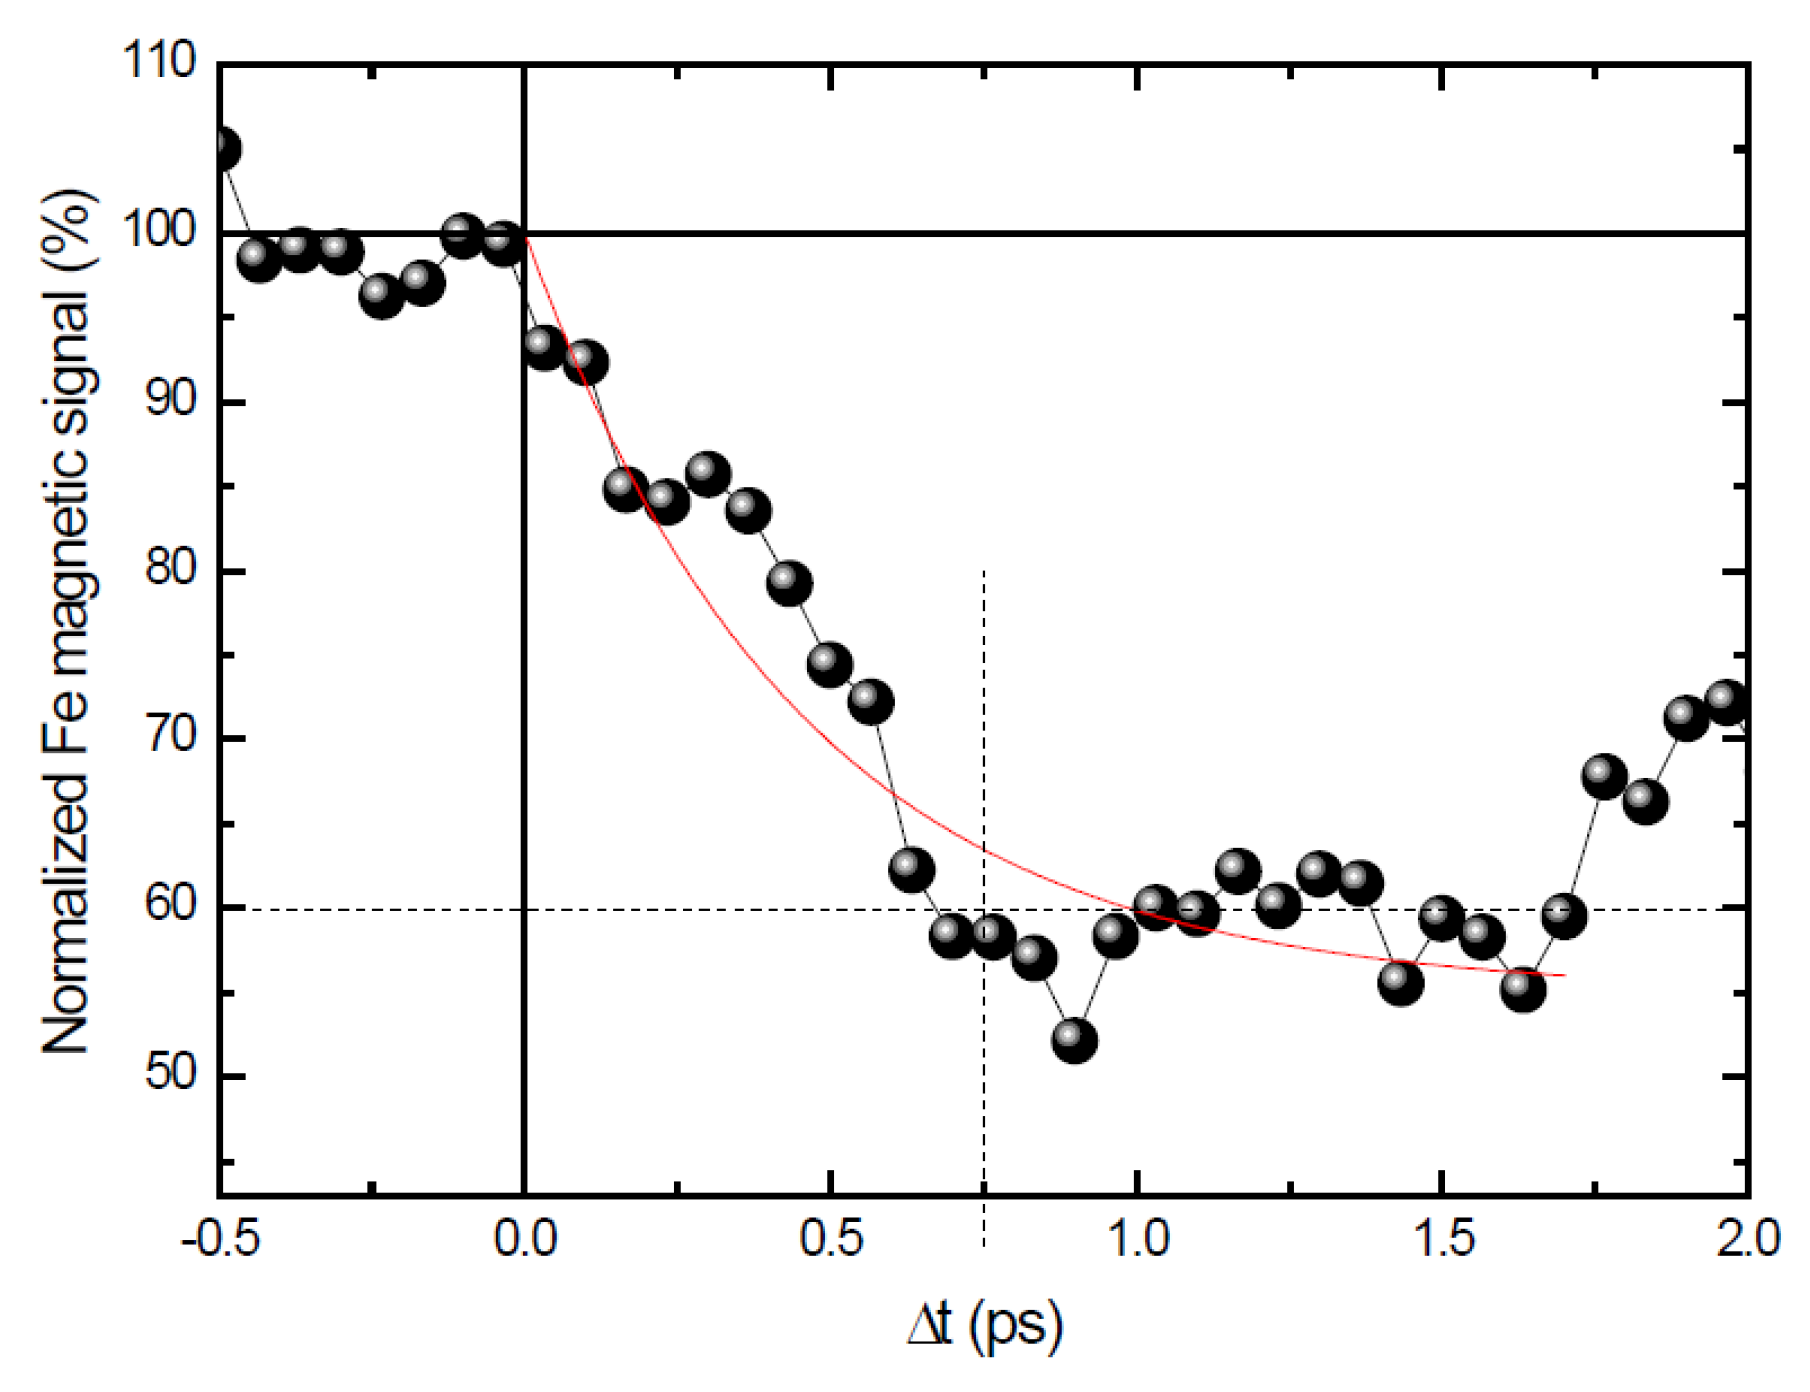
Energy transfer from the electron reservoir to the spin reservoir; timescale ~500 fs (Figure 2).
-
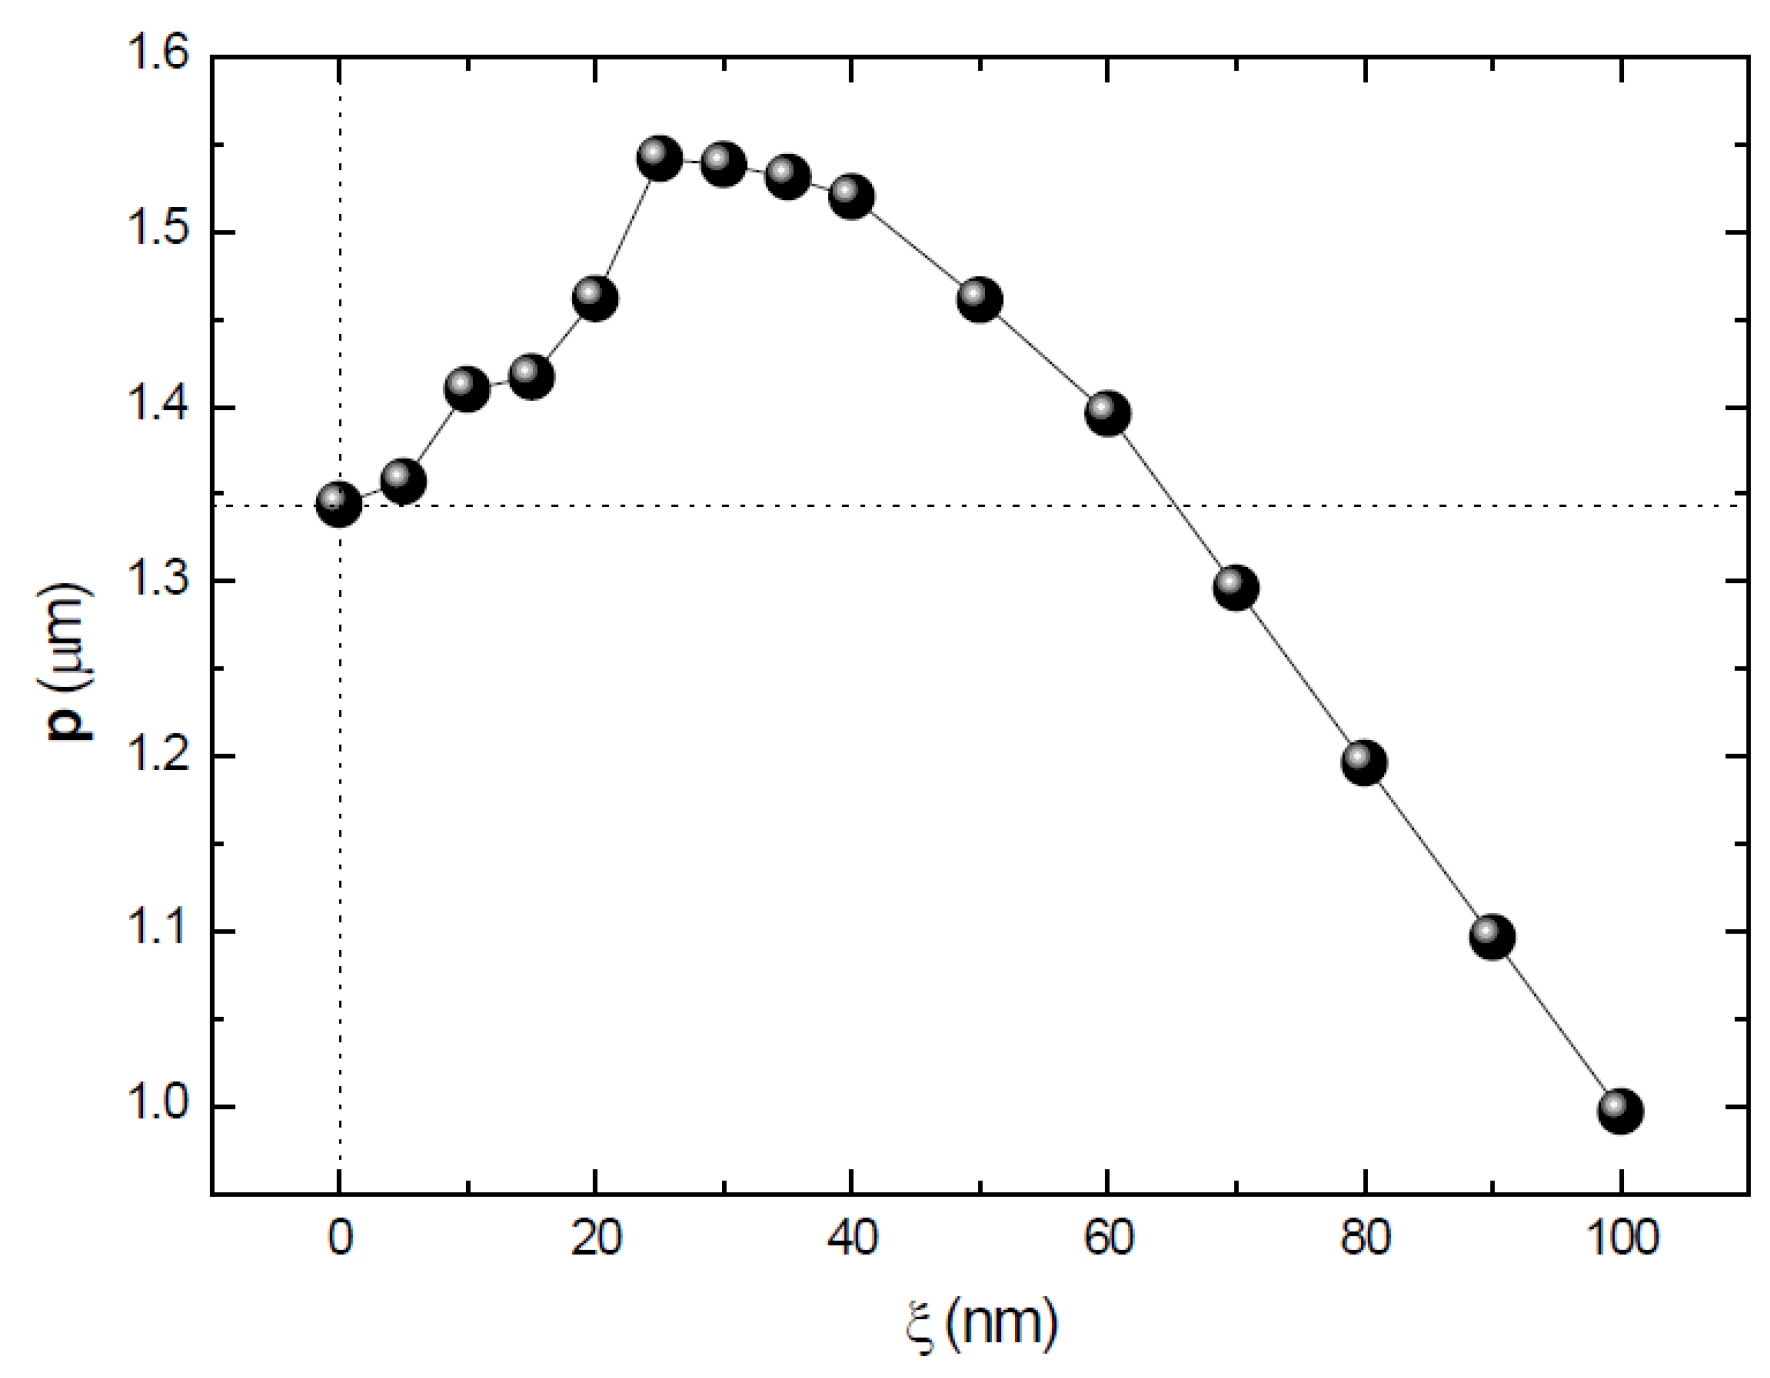
Energy transfer from electrons and spins to the lattice via electron–phonon and spin–phonon coupling, both processes promoting the transition to a homogeneous MnAs phase within the interaction volume (~30 nm); timescale of a few ps (Figure 5). The temperature increase affects the diffracted intensity by reducing the height and by smearing the edges of the steps between the stripes. Since edge smearing affects 2nd order peaks more than 1st order ones, different Δt dependencies of their intensities are observed (Figure 4c, Figure 5a and Figure 6c).
-
Thermal diffusion towards the MnAs/GaAs interface; the analysis of the timescale of this process is limited by the experimentally accessible delay range of 400 ps.
-
The overall effect is to progressively transform the MnAs layer into a single phase that we assume to be the β-phase. Starting from a homogeneously α-MnAs sample (TO < 10 °C), one doesn’t expect to induce stripe formation over the 400 ps delay range that we can access. This is confirmed experimentally by our data: Bragg peak intensities never increase and, especially, no Bragg peak ever appears over our Δt range when starting from TO < 10 C (Figure 7b).
In a previous work that analyzed a limited set of data collected at TO = 30 °C [18], it was suggested that the decrease of the Bragg peak intensity with ~15 ps time constant was due to a change in the α/β ratio within stripes of a given period. The present analysis of scattered intensity versus TO and F rules out this interpretation.
By introducing the parameters appropriate to MnAs [37] and to our experimental conditions (TO, F), we estimated the Δt-dependent temperature of the MnAs layer, using a standard thermal diffusion model [38,39]. The results show that the 200 nm MnAs film does not reach thermal equilibrium throughout its thickness within the 400 ps delay spanned by our measurements.
Figure 10 shows Tt) values calculated at different depths, z, of the MnAs layer down to the MnAs/GaAs interface and for different fluences. Figure 10a shows that the MnAs layer reaches a homogeneous temperature only after tens of ns. Over the Δt = 10−7 s range the MnAs layer starts cooling down, spanning the 42 to 10 °C range where the progressive β→α transition takes place with the formation of ordered stripes. In analogy with the results of static experiments [13], we postulate that it is during this process that the Fe magnetization reversal takes place. Figure 10b shows that the interface temperature depends on the fluence and, in particular, that a threshold fluence exists for the transformation of the whole MnAs layer into the β phase. Although the quantitative coincidence with the Fe magnetization reversal efficiency of Figure 3b can be considered fortuitous in view of the simplicity of the model that we have adopted, Figure 10b strongly suggests that a correlation exists between the two threshold fluences.
Putting all this information together, we conclude that the timescale pertaining to the modification of the MnAs microstructure is much faster than that of the Fe magnetization reversal. This means that, although a single laser pulse of ~100 fs duration is the triggering event, the Fe magnetization reversal is driven not by the fast modifications induced into the MnAs template (1–100 ps timescales) but rather by its return to the equilibrium configuration, a process that takes place at the ~10−7 s timescale.

5. Conclusions

The results of the optical-laser-pump–XUV-FEL-probe scattering experiments performed on the Fe/MnAs/GaAs(001) system at the FERMI FEL facility have revealed how the laser induced microstructure dynamics correlate with the observed Fe magnetization reversal. We monitored the temporal evolution of the ordered α/β-MnAs stripes after a short laser pulse of variable intensity by measuring complete rocking curves, which allowed us to separate specular reflectivity contributions from the 1st and 2nd order Bragg peaks originating from the ordered stripes. Fast laser induced microstructural modifications, which we associate with electron and spin energy transfer to the lattice, take place within a few ps and are followed by slower dynamics driven by thermal diffusion with characteristic time constants of the order of 100 ps. We also evidence a delay-dependent stripe period that we correlate with the formation of a single-phase MnAs top layer, the thickness of which increases with time.
One important result of our microstructure dynamics investigation is that, over the 400 ps delay range covered by the experiment, the laser pump does not promote the formation of ordered stripes, which is the key ingredient that generates the surface dipolar fields necessary for controlling the Fe magnetization reversal. This result explains why, although we observe fast changes of the MnAs microstructure, the Fe magnetization reversal induced by a single laser pulse does not take place within the 400 ps delay interval that we have explored.
A simple thermal diffusion model confirms that ordered MnAs stripes appear during the re-thermalization of the system, at delays of tens of ns for our experimental conditions. This provides an estimate for the timescale of the Fe magnetization reversal, a process driven by the formation of ordered stripes. The same thermal diffusion model also shows that there is a fluence threshold for stripe formation during the return to equilibrium. This result is in good agreement with the presence of a fluence threshold for the Fe magnetization reversal driven by a ~100 fs laser pulse.

Acknowledgments

We are grateful to Marcello Coreno (Elettra Trieste), Fausto Sirotti (Synchrotron SOLEIL), and Massimiliano Marangolo (INSP Paris) for useful discussions and suggestions. Preparatory work was carried out at the Circular Polarization beamline (Elettra) and at the Citius high harmonic generation source (University of Nova Gorica). This research received financial support from the European Community 7th Framework Programme under grant agreement No. 312284 and from CNRS (France) via the PEPS_SASLELX program. The FERMI project at Elettra—Sincrotrone Trieste is supported by MIUR under grants FIRB-RBAP045JF2 and FIRB-RBAP06AWK3.

Author Contributions

C. Spezzani and M.S. conceived and coordinated the experiment. C. Spezzani, E.F., G.D.N., M.B.D., and E.A. designed the optical-pump FEL-probe scheme. I.N., A.D., and M.B.D. operated the optical laser source. E.F., C. Spezzani, G.D.N., and E.A. operated the FEL source. C. Svetina, R.I., M.Z., L.R., E.P., F.C., and M.K. integrated the IRMA setup at DIPROI. M.E., L.L., R.D., Y.Z., and F.V. fabricated and characterized the sample. C. Spezzani, E.F., E.A., R.D., A.C., H.P., and M.S. performed the scattering experiment. F.V., L.L., C. Spezzani, and M.S. analysed the results. F.V., E.A., M.K., and M.S. wrote the manuscript, with contributions from all authors.

Conflicts of Interest

The authors declare no conflict of interest.

References

  1. Däweritz, L. Interplay of stress and magnetic properties in epitaxial MnAs films. Rep. Prog. Phys. 2006, 69, 2581–2629. [Google Scholar] [CrossRef]
  2. Wada, H.; Tanabe, Y. Giant magnetocaloric effect of MnAs1−xSbx. Appl. Phys. Lett. 2001, 79, 3302. [Google Scholar]
  3. Duquesne, J.-Y.; Prieur, J.-Y.; Agudo Canalejo, J.; Etgens, V.H.; Eddrief, M.; Ferreira, A.L.; Marangolo, M. Ultrasonic triggering of giant magnetocaloric effect in MnAs thin films. Phys. Rev. B 2012, 86, 035207. [Google Scholar]
  4. Ramsteiner, M.; Hao, H.Y.; Kawaharazuka, A.; Zhu, H.J.; Kastner, M.; Hey, R.; Daweritz, L.; Grahn, H.T.; Ploog, K.H. Electrical spin injection from ferromagnetic MnAs metal layers into GaAs. Phys. Rev. B 2002, 66, 081304. [Google Scholar] [CrossRef]
  5. Chernenko, V.A.; Wee, L.; McCormick, P.G.; Street, R. Giant magnetoelastic response in MnAs. J. Appl. Phys. 1999, 85, 7833–7837. [Google Scholar] [CrossRef]
  6. Ishikawa, F.; Koyama, K.; Watanabe, K.; Asano, T.; Wada, H. First-Order Phase Transition at the Curie Temperature in MnAs and MnAs0.9Sb0.1. J. Phys. Soc. Jpn. 2006, 75, 084604. [Google Scholar] [CrossRef]
  7. Kaganer, V.M.; Jenichen, B.; Schippan, F.; Braun, W.; Däweritz, L.; Ploog, K.H. Strain-mediated phase coexistence in MnAs heteroepitaxial films on GaAs: An x-ray diffraction study. Phys. Rev. B 2002, 66, 045305. [Google Scholar] [CrossRef]
  8. Magalhães-Paniago, R.; Coelho, L.N.; Neves, B.R.A.; Westfahl, H.; Iikawa, F.; Däweritz, L.; Spezzani, C.; Sacchi, M. Temperature dependent stripe domains in MnAs/GaAs(001) studied by resonant x-ray reflectivity. Appl. Phys. Lett. 2005, 86, 053112. [Google Scholar] [CrossRef]
  9. Coelho, L.N.; Magalhães-Paniago, R.; Neves, B.R.A.; Vicentin, F.C.; Westfahl, H., Jr.; Fernandes, R.M.; Iikawa, F.; Däweritz, L.; Spezzani, C.; Sacchi, M. Magnetic reconfiguration of MnAs/GaAs(001) observed by Magnetic Force Microscopy and Resonant Soft X-ray Scattering. J. Appl. Phys. 2006, 100, 083906. [Google Scholar] [CrossRef]
  10. Sacchi, M.; Marangolo, M.; Spezzani, C.; Coelho, L.N.; Breitwieser, R.; Milano, J.; Etgens, V. Uniaxial anisotropy and temperature driven magnetization reversal of Fe deposited on a MnAs/GaAs(001) magnetic template. Phys. Rev. B 2008, 77, 165317. [Google Scholar] [CrossRef]
  11. Sacchi, M.; Marangolo, M.; Spezzani, C.; Breitwieser, R.; Popescu, H.; Salles, B.R.; Delaunay, R.; Eddrief, M.; Etgens, V. Thermal switching of the magnetization in an iron film on a magnetically active template MnAs/GaAs(001). Phys. Rev. B 2010, 81, 220401. [Google Scholar] [CrossRef]
  12. Vidal, F.; Spezzani, C.; Brietwieser, R.; Marangolo, M.; Eddrief, M.; Sacchi, M.; Etgens, V. Tuning the period of elastic MnAs/GaAs(001) α→β pattern by Fe deposition. Appl. Phys. Lett. 2010, 97, 251914. [Google Scholar] [CrossRef]
  13. Spezzani, C.; Vidal, F.; Delaunay, R.; Eddrief, M.; Marangolo, M.; Etgens, V.; Popescu, H.; Sacchi, M. Thermally induced magnetization switching in Fe/MnAs/GaAs(001): Selectable magnetic configurations by temperature and field control. Sci. Rep. 2015, 5, 8120. [Google Scholar] [CrossRef] [PubMed]
  14. Spezzani, C.; Ferrari, E.; Allaria, E.; Vidal, F.; Ciavardini, A.; Delaunay, R.; Capotondi, F.; Pedersoli, E.; Coreno, M.; Svetina, C.; et al. Magnetization and microstructure dynamics in Fe/MnAs/GaAs(001): Fe magnetization reversal by a femtosecond laser pulse. Phys. Rev. Lett. 2014, 113, 247202. [Google Scholar] [CrossRef] [PubMed]
  15. Kirilyuk, A.; Kimel, A.V.; Rasing, T. Ultrafast optical manipulation of magnetic order. Rev. Mod. Phys. 2010, 82, 2731. [Google Scholar] [CrossRef]
  16. Mangin, S.; Gottwald, M.; Lambert, C.-H.; Steil, D.; Uhlíř, V.; Pang, L.; Hehn, M.; Alebrand, S.; Cinchetti, M.; Malinowski, G.; et al. Engineered materials for all-optical helicity-dependent magnetic switching. Nat. Mater. 2014, 13, 286–292. [Google Scholar] [CrossRef] [PubMed]
  17. Le Guyader, L.; Savoini, M.; El Moussaoui, S.; Buzzi, M.; Tsukamoto, A.; Itoh, A.; Kirilyuk, A.; Rasing, T.; Kimel, A.V.; Nolting, F. Nanoscale sub-100 picosecond all-optical magnetization switching in GdFeCo microstructures. Nat. Commun. 2015, 6, 5839. [Google Scholar] [PubMed]
  18. Sacchi, M.; Spezzani, C.; Allaria, E.; Ferrari, E.; Coreno, M.; Marangolo, M.; Eddrief, M.; Etgens, V.; DeNinno, G. Time resolved pump-probe scattering in MnAs/GaAs(001): A look into the dynamics of α-β stripe domains. Appl. Phys. Lett. 2012, 100, 211905. [Google Scholar] [CrossRef]
  19. Dean, J.J.; Rench, D.W.; Samarth, N.; van Driel, H.M. Domain dynamics in thin solid films following ultrashort pulse excitation. Phys. Rev. Lett. 2013, 111, 035701. [Google Scholar] [CrossRef] [PubMed]
  20. Tanaka, M.; Harbison, J.P.; Park, M.C.; Park, Y.S.; Shin, T.; Rothberg, G.M. Epitaxial orientation and magnetic properties of MnAs thin films grown on (001) GaAs: Template effects. Appl. Phys. Lett. 1994, 65, 1964–1966. [Google Scholar] [CrossRef]
  21. Allaria, E.; Appio, R.; Badano, L.; Barletta, W.A.; Bassanese, S.; Biedron, S.G.; Borga, A.; Busetto, E.; Castronovo, D.; Cinquegrana, P.; et al. Highly coherent and stable pulses from the FERMI seeded free-electron laser in the extreme ultraviolet. Nat. Photonic 2012, 6, 699–704. [Google Scholar] [CrossRef]
  22. Allaria, E.; Diviacco, B.; Callegari, C.; Finetti, P.; Mahieu, B.; Viefhaus, J.; Zangrando, M.; De Ninno, G.; Lambert, G.; Ferrari, E.; et al. Control of the polarization of a vacuum-ultraviolet, high-gain, free-electron laser. Phys. Rev. X 2014, 4, 041040. [Google Scholar] [CrossRef]
  23. Pedersoli, E.; Capotondi, F.; Cocco, D.; Zangrando, M.; Kaulich, B.; Menk, R.H.; Locatelli, A.; Mentes, T.O.; Spezzani, C.; Sandrin, G.; et al. Multipurpose modular experimental station for the DiProI beamline of Fermi@Elettra free electron laser. Rev. Sci. Instrum. 2011, 82, 043711. [Google Scholar] [PubMed]
  24. Capotondi, F.; Pedersoli, E.; Mahne, N.; Menk, R.H.; Passos, G.; Raimondi, L.; Svetina, C.; Sandrin, G.; Zangrando, M.; Kiskinova, M.; et al. Invited Article: Coherent imaging using seeded free-electron laser pulses with variable polarization: First results and research opportunities. Rev. Sci. Instrum. 2013, 84, 051301. [Google Scholar] [CrossRef] [PubMed]
  25. Sacchi, M.; Spezzani, C.; Torelli, P.; Avila, A.; Delaunay, R.; Hague, C.F. Ultra-high vacuum soft X-ray reflectometer. Rev. Sci. Instrum. 2003, 74, 2791. [Google Scholar]
  26. Danailov, M.B.; Bencivenga, F.; Capotondi, F.; Casolari, F.; Cinquegrana, P.; Demidovich, A.; Giangrisostomi, E.; Kiskinova, M.P.; Kurdi, G.; Manfredda, M.; et al. Towards jitter-free pump-probe measurements at seeded free electron laser facilities. Opt. Express 2014, 22, 12869–12879. [Google Scholar] [CrossRef] [PubMed]
  27. Cinquegrana, P.; Cleva, S.; Demidovich, A.; Gaio, G.; Ivanov, R.; Kurdi, G.; Nikolov, I.; Sigalotti, P.; Danailov, M.B. Optical beam transport to a remote location for low jitter pump-probe experiments with a free electron laser. Phys. Rev. Spec. Top. Accel. Beams 2014, 17, 040702. [Google Scholar] [CrossRef]
  28. Sacchi, M.; Panaccione, G.; Vogel, J.; Mirone, A.; van der Laan, G. Magnetic dichroism in reflectivity and photoemission using linearly polarized light: 3p core level of Ni(110). Phys. Rev. B 1998, 58, 3750–3754. [Google Scholar] [CrossRef]
  29. La-O-Vorakiat, C.; Siemens, M.; Murnane, M.M.; Kapteyn, H.C.; Mathias, S.; Aeschlimann, M.; Grychtol, P.; Adam, R.; Schneider, C.M.; Shaw, J.M.; et al. Ultrafast demagnetization dynamics at the M edges of magnetic elements observed using a tabletop high-harmonic soft X-ray source. Phys. Rev. Lett. 2009, 103, 257402. [Google Scholar] [CrossRef] [PubMed]
  30. Koopmans, B.; Malinowski, G.; Dalla Longa, F.; Steiauf, D.; Fahnle, M.; Roth, T.; Cinchetti, M.; Aeschlimann, M. Explaining the paradoxical diversity of ultrafast laser-induced demagnetization. Nat. Mater. 2010, 9, 259–265. [Google Scholar] [CrossRef] [PubMed]
  31. Ihlemann, J.; Bärner, K. Elastic anomalies and phonon damping in a metallic high spin-low spin system. J. Magn. Magn. Mater. 1984, 46, 40–48. [Google Scholar] [CrossRef]
  32. Palumbo, O.; Castellano, C.; Paolone, A.; Cantelli, R. Extended x-ray absorption fine structure study of the MnAs local structure at the phase transitions. J. Phys. Condens. Matter 2005, 17. [Google Scholar] [CrossRef]
  33. Zou, J.D.; Wada, H.; Shen, B.G.; Sun, J.R.; Li, W. Giant magnetocaloric effect and soft-mode magneto-structural phase transition in MnAs. Eur. Phys. Lett. 2008, 81, 47002. [Google Scholar] [CrossRef]
  34. Lazewski, J.; Piekarz, P.; Tobo, J.; Wiendlocha, B.; Jochym, P.T.; Sternik, M.; Parlinski, K. Phonon mechanism of the magnetostructural phase transition in MnAs. Phys. Rev. Lett. 2010, 104, 147205. [Google Scholar] [CrossRef] [PubMed]
  35. Lazewski, J.; Piekarz, P.; Parlinski, K. Mechanism of the phase transitions in MnAs. Phys. Rev. B 2011, 83, 054108. [Google Scholar] [CrossRef]
  36. Mikulík, P.; Baumbach, T. X-ray reflection by rough multilayer gratings: Dynamical and kinematical scattering. Phys. Rev. B 1999, 59, 7362. [Google Scholar] [CrossRef]
  37. Fujieda, S.; Hasegawa, Y.; Fujita, A.; Fukamichi, K. Thermal transport properties of magnetic refrigerants La(FexSi1−x)13 and their hydrides, and Gd5Si2Ge2 and MnAs. J. Appl. Phys. 2004, 95, 2429. [Google Scholar] [CrossRef]
  38. Bechtel, J.H. Heating of solid targets with laser pulses. J. Appl. Phys. 1975, 46, 1585. [Google Scholar] [CrossRef]
  39. Hohfield, J.; Wellershoff, S.-S.; Güdde, J.; Conrad, U.; Jähnke, V.; Matthias, E. Electron and lattice dynamics following optical excitation of metals. Chem. Phys. 2000, 251, 237–258. [Google Scholar] [CrossRef]
Figure 1. (a) Sketch of the MnAs epitaxy on GaAs(001), highlighting the stripe and easy magnetization directions; (b) Schematic setup for magnetic measurements in transverse magneto-optic Kerr effect (T-MOKE) geometry, using linearly p-polarized radiation. The magnetic field H is applied normal to the scattering plane along the α-MnAs[11.0] easy magnetization axis; (c) Schematic setup for rocking scans, with the α/β MnAs stripes running perpendicular to the scattering plane. Also magnetic measurements can be performed in this geometry by selecting circular polarization for the x rays; (d) Magnetic signal at the Fe-3p resonance versus applied field either in geometry (b) or (c). H is applied parallel to the sample surface and along the easy magnetization axis. The asymmetry ratio is defined as raw data minus their average over a loop, divided by the average.
Photonics 04 00021 g001
Figure 2. Time evolution of the Fe magnetic signal after a 10 mJ·cm−2 laser pulse. The Fe-3p resonant reflectivity is measured in T-MOKE geometry at TO = 7 °C and H = 300 Oe. The thin red line is an exponential decay with 400 fs time constant.
Photonics 04 00021 g002
Figure 3. (a) Single-shot Fe-3p resonant reflectivity (p-polarized light) as a function of time (TO = 5 °C, F = 10 mJ·cm−2). Initially, the Fe magnetization is saturated either in the high () or in the low () reflectivity state by a magnetic pulse. When a single laser pulse excites the sample at time zero, the reflectivity changes to a value corresponding to the opposite Fe magnetization direction; (b) Fractional Fe magnetization reversal as a function of the pulse fluence. The vertical error bars are representative of the FEL intensity fluctuations over the measurement time; see (a). The variations in F are smaller than the dot size.
Photonics 04 00021 g003
Figure 4. (a) Rocking curve measured at room temperature in static conditions (squares) and five Lorentzian fit (thick full line). The specular peak, the 1st, and the 2nd order Bragg reflections are reported as dotted, dashed, and full lines, respectively; (b) Δt dependent 1st order Bragg peak intensity for F = 15 mJ·cm−2 and TO = 21 °C. The full line is a double exponential decay fit with time constants t1 = 4 ps and t2 = 110 ps; (c) Δt dependence of the 1st order (blue squares) and 2nd order (red circles) Bragg peak intensities obtained by fitting rocking scans at fixed delays (large filled symbols), as in (a), and by performing delay line scans at a fixed scattering angle (small hollow symbols), as in (b). Open triangles represent the same data as open circles but are renormalized according to rocking scan fits in order to account for the Δt dependent background. TO = 16 °C; F = 10 mJ·cm−2.
Photonics 04 00021 g004
Figure 5. (a) Time constants t1 (circles) and t2 (squares) of the double-exponential decay fit of the 1st (filled symbols) and 2nd (hollow symbols) order Bragg peaks versus static temperature (F = 10 mJ·cm−2). Horizontal lines locate the high temperature value for each parameter and are a guide to the eye. The fitting range was 0–400 ps and 0–150 ps for 1st and 2nd order peaks, respectively; (b) Time constants of the 1st order Bragg peak decay versus pump laser fluence at room temperature. For a fluence of 2.5 mJ·cm−2 or lower, the two exponentials are redundant and the data can be fitted by one exponential decay only (up triangles).
Photonics 04 00021 g005
Figure 6. (a) Rocking scans measured at three different delays, Δt, representative of characteristic timescales in the MnAs microstructure dynamics. TO = 21 °C and F = 10 mJ·cm−2. Continuous lines are the best fits with five Lorentzians. (bd) Parameters of the Lorentzian fit components for specular (black circles), 1st order (red squares), and 2nd order (blue triangles) peaks. (a) Peak position values, given as the off-specular angle Δθ = θS − θ. Dashed horizontal lines correspond to the values for negative delays and are a guide to the eye; (b) Peak intensities, normalized to negative delay values; (c) Period of the stripes calculated as p = n λ/[2sin(θ)·sin(Δθ)]. Squares refer to values derived from the positions of 1st order Bragg peaks at Δθ ~ 0.7°. Triangles correspond to the period derived from the positions of peaks at Δθ ~ 1.4°, assuming n = 1 (filled triangles) and n = 2 (open triangles). In both (b) and (c), all values relative to peaks at Δθ ≈ 1.4°, see (a), are associated with 2nd order Bragg diffraction.
Photonics 04 00021 g006
Figure 7. (a) 1st order Bragg peak intensity as a function of TO for Δt = −10 ps (black squares) and Δt = +50 ps (red filled circles). For better comparison, the latter is also plotted multiplied by a factor of 2.5 (red open circles); (b) Scattered intensity at the 1st order Bragg peak position as a function of Δt for TO = −2 °C (no stripes) and TO = +16 °C. The dashed blue line is a double exponential decay fit.
Photonics 04 00021 g007
Figure 8. Equilibrium stripes period p(ξ) in Fe3nm/β–MnAsξnm/α/β–MnAs200−ξnm/GaAs(001) calculated using an elastic model [12] that accounts for the formation of a ξ nm thick homogeneous β-MnAs layer on top of a (200 − ξ) nm MnAs layer featuring α/β phase coexistence.
Photonics 04 00021 g008
Figure 9. Pictorial view of the microstructure dynamics in the MnAs layer following a laser pulse (right) and associated principal physical phenomena (center) as a function of delay (left).
Photonics 04 00021 g009
Figure 10. Calculated sample temperature as a function of the delay Δt, of the fluence F and of the depth z into the MnAs layer, z = 200 nm corresponding to the interface with the GaAs substrate. (a) Tt, z) at F = 10 mJ·cm−2; (b) Tt, F) at z = 200 nm. TO = 7 °C in both panels. The light and dark gray dots correspond to isothermals at T = 20 and 40 °C, respectively. The horizontal light and dark gray dashed lines in (b) locate the minimum F values necessary for reaching T = 20 and 40 °C at the interface.
Photonics 04 00021 g010

