Article

Transient EUV Reflectivity Measurements of Carbon upon Ultrafast Laser Heating

Elettra Sincrotrone Trieste SCpA, Basovizza, 34149 Trieste, Italy
*
Authors to whom correspondence should be addressed.
Photonics 2017, 4(2), 23; https://doi.org/10.3390/photonics4020023
Submission received: 17 February 2017 / Revised: 17 March 2017 / Accepted: 18 March 2017 / Published: 23 March 2017
(This article belongs to the Special Issue Extreme UV Lasers: Technologies and Applications)

Abstract

:
Time resolved extreme ultraviolet (EUV) transient reflectivity measurements on non-equilibrium amorphous carbon (a-C) have been carried out by combining optical and free electron laser (FEL) sources. The EUV probing was specifically sensitive to lattice dynamics, since the EUV reflectivity is essentially unaffected by the photo-excited surface plasma. Data have been interpreted in terms of the dynamics of an expanding surface, i.e., a density gradient rapidly forming along the normal surface. This allowed us to determine the characteristic time ( τ   1 ps) for hydrodynamic expansion in photo-excited a-C. This finding suggests an extremely narrow time window during which the system can be assumed to be in the isochoric regime, a situation that may complicate the study of photo-induced metastable phases of carbon. Data also showed a weak dependence on the probing EUV wavelength, which was used to estimate the electronic temperature ( T e 0.8 eV) of the excited sample. This experimental finding compares fairly well with the results of calculations, while a comparison of our data and calculations with previous transient optical reflectivity measurements highlights the complementarities between optical and EUV probing.

1. Introduction

The interaction of an ultrafast laser pulse with a solid state specimen can induce phase transitions [1]. Depending on the laser flux, the photo-excited sample can reach the liquid phase (ultrafast melting [2]) or more exotic states, such as, e.g., the warm dense matter [3] or the dense plasma phase [4], where the kinetic energy of the photo-excited free electrons compares or exceeds the potential energy of ion–electron interactions. In almost all cases, laser-driven excited states are characterized by short lifetimes, typically ranging from sub-ps to a few ps. After this narrow time window, the excited portion of the sample starts to interact with the surrounding (unexcited) regions. The energy equilibration process between excited and unexcited regions ineluctably leads to an hydrodynamic expansion, which literally blows up the sample. The experimental investigations are therefore hampered by (i) the need to probe the system at such ultra-fast scales; and (ii) the availability of many identical samples (for data averaging and reproducibility). The pump–probe approach can tackle both issues, since it can ensure fs time resolution (in terms of both accuracy and reproducibility) and allows to perform sequential measurements on extended (homogeneous) samples; i.e., the repetition rate of the pump–probe pulse sequences can be synchronized with a sample translation, so that each sequence interacts with a fresh portion of the sample.
In this manuscript, we combined ultrafast optical (pump) and free electron laser (FEL, probe) sources to carry out transient extreme ultraviolet (EUV) reflectivity measurements on amorphous carbon (a-C), in a time-scale range (∼0–5 ps) that includes the one expected for the hydrodynamic expansion. The choice of the sample was driven by the fact that many of its properties are still disputed. For example, the carbon phase diagram in the high pressure and temperature regime, transiently reachable by laser-excitation, is not uniquely defined and there are indications of the presence of two distinct liquid phases (characterized by different densities and resistivity) [5,6,7]; a phenomenology likely connected with the general (and highly debated) concept of liquid phase polymorphism; in this context, water is the most notable example [8,9].
The study of carbon in extreme thermodynamic conditions was pioneered more than 50 years ago by Bundy, who performed a flash heating experiment to induce fast melting in a graphite sample [10]. In this experiment, only a fraction of the energy was effectively used to stimulate the phase transition and, later, it was shown how a faster heating system can improve the excitation efficiency. The natural evolution of this concept is the use of an ultrafast pump–probe technique, an approach followed, e.g., by Reitze et al. [11], who measured the transient optical reflectivity and transmissivity in photo-excited graphite and diamond, finding evidence of an ultrafast metallization of the sample (ascribed to a solid–liquid transition). However, the effects of the surface plasma screening, inherently related to the use of an optical probe, raised some questions regarding the probe’s sensitivity to bulk properties. This issue is overcome by the EUV probe employed in the present work, because the photon frequency of the probe (varied in the 40–65 eV range) largely exceeds that of the photo-induced plasma, hence ensuring bulk sensitivity. Furthermore, the presence of photo-excited electrons (and holes), responsible for the surface plasma, may strongly affect the time evolution of the optical reflectivity and trasmissivity, even over the typical time scales of the hydrodynamic expansions [12,13]. This makes data interpretation much less straightforward.

2. Results

The measurements have been carried out at the EIS-TIMEX beamline of the FERMI seeded FEL facility (Elettra, Trieste, Italy) [14]. The FEL pulses (time duration ∼70 fs full-width-half-maximum (FWHM) [15], pulse energy ∼0.7 μ J) were focused on a 30 × 15 μ m 2 spot size and spatially overlapped with the optical pump beam. The latter was a Ti:sapphire laser pulse frequency up-converted to the third harmonic (wavelength 260 nm, pulse duration 100 fs FWHM, pulse energy 45 μ J, spot size 70 × 100 μ m 2 ) and synchronized with the FEL pulse with a jitter less than 10 fs [16]. The FEL probe wavelength ( λ p r o b e ) was varied in the 19–31 nm spectral window. The sample was an a-C layer (70 nm thick) deposited on a Si substrate. The pulse energy of the pump pulse was large enough to induce, at least, the melting of the a-C sample. The employed parameters for the laser correspond to a fluence of ∼0.6 J/cm 2 , roughly six times that needed to melt graphite. Moreover, damage was observed in the sample after the pump exposure, which is clear evidence that an irreversible transition took place. On the contrary, the probe energy was selected to not alter the sample. This can be indicated by looking at Figure 1, top left panel; here, the data set (blue diamonds) collected without the pump can be superimposed to pump–probe data (black circles) at negative delays. This indicates that the FEL pulses, arriving at the sample before the pump pulse, do not alter the reflectivity. Moreover, visual inspection of the sample surface did not reveal evidence of damage after prolonged exposure to the FEL probe pulses. Finally, taking into account the beam line transmission (∼60%), the fluence at the sample position results to be ≈0.09 J/cm 2 , which is below the damage threshold reported in the literature [17]. EIS-TIMEX was operated in a single-shot mode, moving the sample in a pristine region after exposure to a single pulse sequence, which consists of (i) three probing FEL pulses arriving well before (i.e., more than 100 ms) the pump; (ii) an optical-pump/FEL-probe sequence in which the two pulses are separated by a time delay ( Δ t ) variable in the −1∼+10 ps range; and (iii) a FEL probing pulse arriving ∼100 ms after the pump. The Δ t -dependence of the reflected intensity ( I r ) of the probe pulses arriving at steps (i), (ii) and (iii) of the aforementioned sequence are reported in Figure 1, top left panel, as blue diamonds, black circles and green squares, respectively. This approach accounts for the reflectivity differences revealed upon scanning the sample surface (see, e.g., the fluctuation of the blue diamond data set in Figure 1, top left panel) and guarantees a precise evaluation of the I r variation induced by the laser pump. In order to measure the dependence of I r on the EUV probe wavelength, we changed the harmonics of the seeded FEL emission [18,19]. The full data set includes five FEL wavelengths and is presented in Figure 1. One can readily appreciate how I r monotonically decreases in about 2 ps from the unexcited value (data at Δ t < 0 ) to that recorded by the probe pulse arriving ∼100 ms after the main pump–probe sequence (Figure 1 top left), hence showing how the whole dynamics has been recorded in a time window of about 4 ps. For large pump–probe delays, the reflectivity decrease is likely because of the ablation of the carbon layer; see Figure 2. This makes the probe sensitive to the silicon substrate, which is characterized by a lower reflectivity. Moreover, the flatness of the surface is not preserved after the interaction with the pump and this may also cause a (permanent) decrease in the reflectivity.
The decay times, determined through Equation (3), as function of λ p r o b e , are reported in Figure 3 and show a weak dependence on the FEL wavelength. A decay time in the ps range can be typically ascribed to lattice dynamics or to the recombination of photo-excited carriers. The latter process may lead to transient changes in the photo-excited free electron (and hole) density and hence to the surface plasma frequency and refractive index. This turns into large changes in the optical reflectivity, where the photon frequency of the probe ( Ω p r o b e ) is below the plasma frequency ( Ω p l a s m a ), while the use of an EUV probe with Ω p r o b e Ω p l a s m a minimizes the effects of such carrier dynamics on the measured data. In order to estimate Ω p l a s m a in our experimental conditions, we carried out calculations in the frame of a density-dependent two temperature model (nTTM), following Ref. [12]; see Materials and Methods for details.
Using such a calculation, we found Ω p l a s m a 5 eV, which leads to expected reflectivity changes below 1 % (more details further below), while the observed reflectivity variations are almost one order of magnitude larger. On the other hand, the short wavelength of EUV photons, as compared to optical ones, enhances the sensitivity of transient EUV reflectivity to surface displacements, which reflects the dynamics of the lattice [21]. An expanding surface can indeed introduce a dependence of τ on λ p r o b e [11,22,23], which is compatible with the weak dependence of τ on λ p r o b e observed in our experiment (see Figure 3); unfortunately, the large scattering of the present data does not allow the analysis of the wavelength dependence to be pushed beyond a mere qualitative comparison. Further and more accurate data are definitely needed to improve data interpretation.

3. Discussion

Transient EUV reflectivity displays a clear drop occurring at a ∼0.8 ps scale with a weak dependence (with respect to the poor accuracy of the present data) on the probe wavelength. This trend is markedly different with respect to that reported for optical reflectivity [11], which consists of a fast (≪ps) increase of reflectivity, followed by a slower (>ps) decay. These differences can be accounted for by the different probing wavelengths and highlight the complementarities between the optical and EUV probe. Indeed, the interaction with the pump leads to an increase in the free electrons density (see, e.g., calculations shown in Figure 4) which turns into a metallic-like behaviour of the system. This drastically enhances/weakens the optical reflectivity/transmissivity on a time scale comparable with the time duration of the excitation pulses, since the photo-excitation of the free electron density occurs on the scale of a few fs [24], but loosely affects the EUV response because of the high frequency probing photons. In the visible photons, the subsequent decrease of optical reflectivity can be ascribed both to the relaxation of the free electron density, due to electron–hole recombination ( τ 0.2 ps, estimated through nTTM calculations, see below for further details), and to the hydrodynamic expansion of the lattice. The concurrence of these two processes complicates the analysis and interpretation of the data. On the other hand, in similar excitation conditions the EUV probe is essentially sensitive to lattice dynamics, via surface expansion.
In order to quantify the experimental observation, following the same reasoning as outlined in Ref. [11], we consider that after the interaction with the pump, the sample surface develops a density gradient along the normal surface, whose spatial extension varies with time and depends on the velocity ( v ¯ ) of the expanding surface. In such a condition, a numerical treatment based on the Helmotz wave equations is required to properly describe the reflectivity and, according to Ref. [22,23], during an expansion process, the reflectivity experiences a decrease when the characteristic length scale L ( t ) of the density gradient compares with λ p r o b e . The value of v ¯ can be estimated using the expression for a surface experiencing a shock wave [11,25]:
v ¯ = 2 γ 1 Z k B T e M 2 k B T e e V 10 4 m s ,
where γ is the ratio of electronic heat capacities at constant pressure and volume (∼1.6 for hot carbon [26]), Z is the effective ion charge (4 for carbon [26]), k B is the Boltzmann constant, T e is the electronic temperature, and M is the mass of a carbon atom. Based on the assumption that v ¯ is constant within the probed time window, the observed time decay of the EUV reflectivity can be associated with the time needed by the density gradient to reach a spatial extension comparable with the probe wavelength (i.e., to meet the condition L λ p r o b e ). The hypothesis of a constant value for ( v ¯ ) hence turns into [11]:
τ ( λ p r o b e ) = L λ p r o b e v ¯ = f λ p r o b e v ¯
where f ( 0.1 < f < 1 ) is a parameter depending on the probe polarization and on the exact form of the density gradient [22,23]. A best fit of the experimental data (confidence bound of 95%) in Figure 3 with Equation (2) provides an angular coefficient, defined as f v ¯ , of 0.03 ± 0.01 × 10 3 s/m and, using the value f = 0.6 reported for graphite [11], one obtains v ¯ = 17 ± 4 nm/ps, which is, as expected, in the same order as the sound velocity (≈18 nm/ps [27]) in the material. Finally, we used Equation (1) to calculate the corresponding electronic temperature, which results to be T e = 0.8 ± 0.4 eV. A similar value for T e can be obtained by numerical calculations using a nTTM model [12], as shown in Figure 4a. This comparison supports the choice for the value of the parameter f, thus endorsing the proposed data interpretation essentially based on the (lattice) dynamics of an expanding surface. nTTM model simulations permit to calculate the temperatures of the electronic and lattice subsystems, as well as the density of the conduction electron induced by the pump pulse, see Figure 4b. In correspondence with the peak of the excitation pulse, the induced electron density is ∼1.6 × 10 22 cm 3 , corresponding to Ω p l a s m a ∼ 5 eV, then rapidly decreases (in ∼0.1–0.2 ps), but maintains a quite high value (order of 10 21 cm 3 ) in the 1–10 ps range, which still corresponds to Ω p l a s m a values in the optical regime (≈eV). Using the output of nTTM calculations and hypothesizing a Drude model for the reflectivity, one can estimate the ratio between the un-perturbed value and the one induced by the free electron density. For an optical ( Ω p r o b e 2.3 eV) photon, this ratio is of ∼4 (see Figure 4c), while in the EUV the variation is negligible and the reflectivity is almost unaffected by the laser induced plasma, even at the lowest EUV photon energy (∼40 eV) used in the present work (see Figure 4d). nTTM calculations provide indications of the time evolution of the temperature of photo-excited electrons and the lattice. The temperature equilibration process proceeds very fast (sub-100 fs) and mainly depends on the characteristic time of electron–phonon ( τ E P ) coupling (see Materials and Method for further details). Assuming τ E P 10 fs, in agreement with indications found in the literature [28], such a process is essentially “instantaneous” and, consequently, one may assume that the system, even though in metastable state, reaches a (nearly equilibrium) temperature of about 0.8 eV (see Figure 4a). This value is in remarkable agreement with the one estimated from the dependence of the transient EUV reflectivity data on λ p r o b e . It is also worth noting that the same asymptotic temperature is reached even for values of τ E P in the ≈100 fs range, even though the initial electronic temperature is substantially higher. However, in light of the time resolution (≈100 fs) of the present experiment, the temperature equilibration process would also appear “instantaneous” at such τ E P -values, which can be assumed to be an ample upper limit for this parameter. Such a comparison, together with the estimated negligible contribution of the free electron plasma to the EUV reflectivity, corroborates the assumption that the EUV probing is mainly sensitive to lattice dynamics. Furthermore, such a temperature value (≈10 4 K), rapidly reached by both the electronic and lattice sub-systems, confirms that the used pump fluence is, in principle, large enough to stimulate phase transitions. We finally remark how, on time scales longer than a few ps, both the sample temperature and electron density are expected to decrease more than what has been shown by our calculations, because of the hydrodynamic expansion and transport phenomena, not implemented in the nTTM calculations. A refinement of the data analysis should include a more accurate determination of f, taking into account the band structure of the a-C sample [23], as well as explicitly accounting for the expectedly small contributions (below 1%) of the carrier excitation and recombination to the EUV transient reflectivity. These additional steps are therefore expected to lead to minor modifications to the overall picture. On the other hand, a more exhaustive experimental campaign, which includes the parallel detection of transient EUV and optical reflectivity (and transmissivity) as well as a study as a function of the pump intensity is expected to provide more information on this phenomenology.

4. Materials and Methods
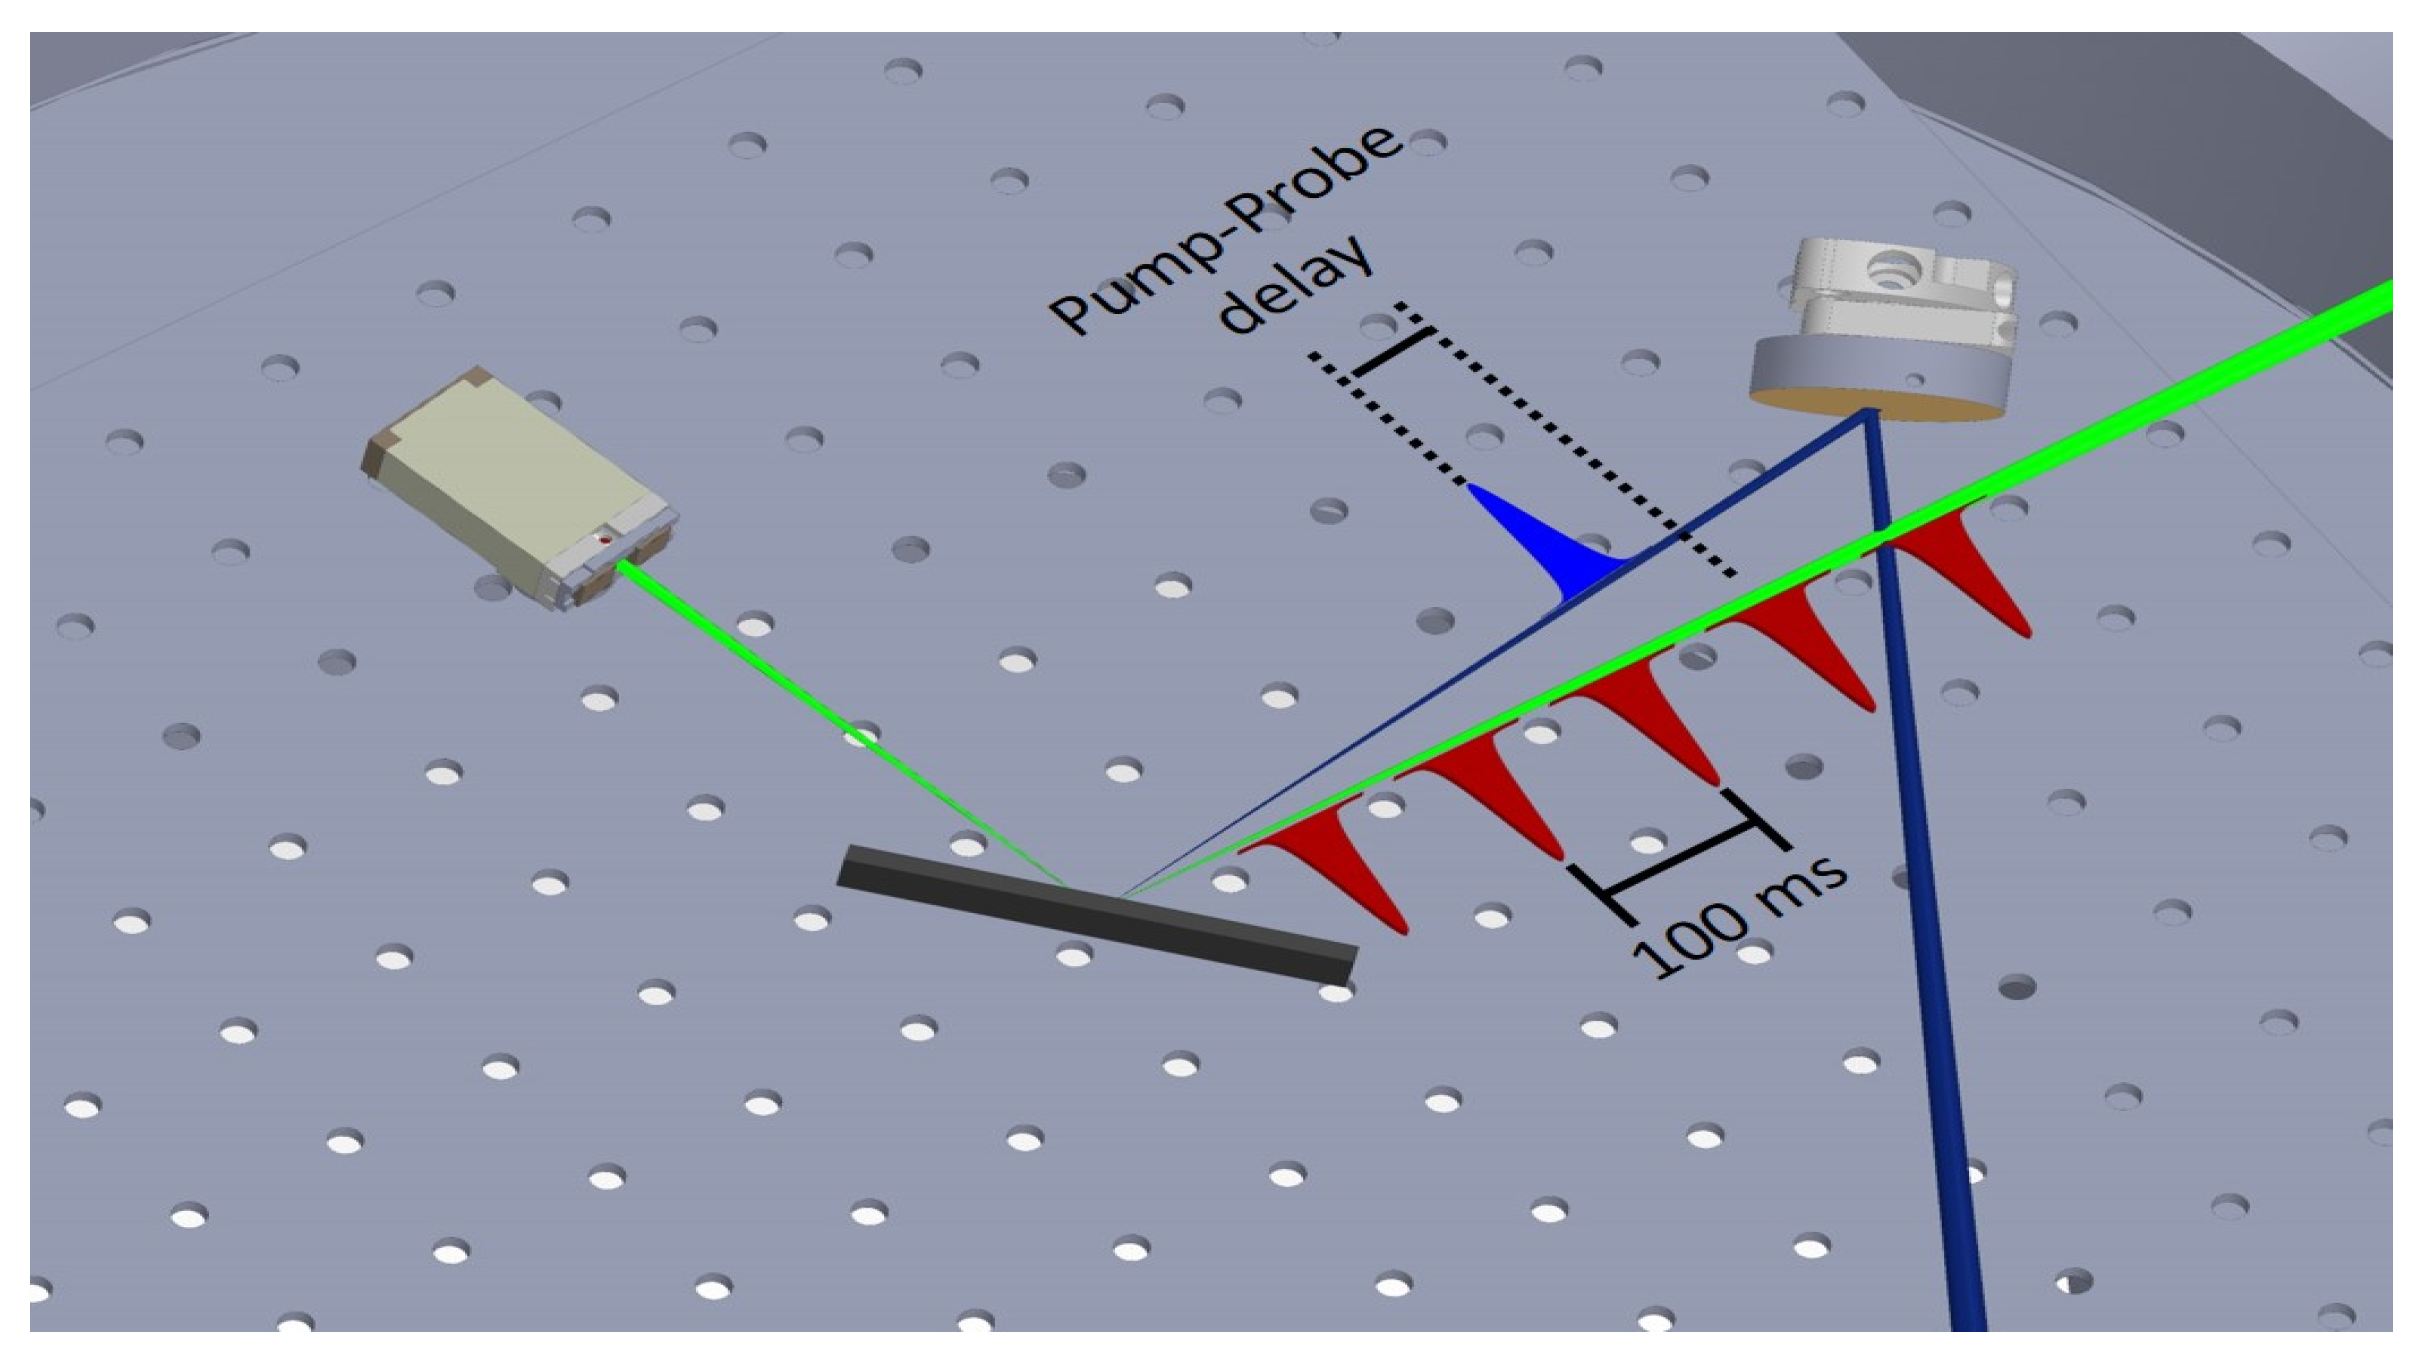
The experimental geometry realized inside the TIMEX experimental end-station is shown in Figure 5. The experimental set-up consisted of an AXUV photo-diode (Opto-Diode) with a response time much shorter than 100 ms (the FEL repetition rate is 10 Hz), screened from the background radiation of the pump by means of a 100 nm thick Al-foil. The FEL probe and the optical pump beams impinged onto the sample almost collinearly. The sample was rotated by 40 in order to send the reflected EUV beam into the photo-diode. The FEL beam was focussed by a gold-coated ellipsoidal mirror down to 30 × 15 μ m FWHM, while the pump laser spot was 70 × 100 μ m FWHM. The FEL (probe) spot size was much smaller than the optical (pump); this situation ensures that the EUV beam probes an almost (spatially) homogeneously excited sample.
For each sample position, we recorded data in three steps:
(i)
three EUV reflectivity values well before the arrival of the pump (un-pumped reflectivity);
(ii)
one value for the pumped reflected intensity (main pump–probe sequence);
(iii)
one value 100 ms after the arrival of the pump (post-expansion reflectivity).
After each sequence, the sample was moved to a new, non-irradiated position. Each acquired value for the reflectivity was separated by 100 ms; this value is dictated by the FERMI repetition rate of 10 Hz, so that the reflectivity values obtained from the EUV pulse arriving after the main pump–probe sequence (pulse at step (iii)) can effectively be considered as the asymptotic value for this quantity. On the contrary, the delay between the FEL and the pump laser, which encoded the sample dynamic, was set through a delay line. The pump–probe sequence defined above was repeated ten times for each value of the pump–probe delay. The experimental data obtained in this configuration are reported in Figure 1. The un-pumped (pulses at step (i)) and pumped (pulses at step (ii)) series are superposed for negative delays. This is the evidence that any damage occurred after the three FEL shots (pulses at step (i)) used to obtain the reference value for the reflected intensity. The experimental points were obtained by binning the raw data with a step-size of 0.2 ps; error bars are one standard deviation.
The pumped reflected intensity as a function of the delay was fitted through the following empirical model:
A 0 t < 0 A e x p e t / τ + A 1 t 0 .
In this case, it is not necessary to convolute the model with a Gaussian miming the time resolution of the set-up, since the detected dynamics develops on a much longer time scale than the time duration (≲100 fs) of the incoming pulses.
The temperature estimated through the dependence of τ vs. λ p r o b e has been compared to the temperature obtained using calculations based on nTTM calculation, see Figure 4. Such a computational method is based on a set of coupled rate equations to describe the time evolution of the temperatures of the electronic and lattice subsystems. These are coupled through a parameter, defined as the ratio between the carrier specific heat and the electron–phonon relaxation time. In addition to that, nTTM also takes into account the variation of the free electron density induced by the pump pulse. According to this model, the free electron density is increased through linear absorption, two photon absorption (negligible in the present case) and impact ionization, which describes the probability of a free electron impacting a valence one and promoting it into the conduction band. The relaxation of the free electron density is instead given by Auger recombination and current gradients; the latter process is usually negligible [12]. The energy carried by the pump pulse is initially deposited in the carrier subsystems, mainly through single photon absorption, free carrier absorption (leading to a density-dependent absorption coefficient) and two photon absorption, while it is drained out of the interaction region by heat density gradients, negligible in thermal insulators (as in the present case), and transfers to the lattice subsystem. The deposited energy—amended by the contribution of the gap closure and by the energy spent varying the free electron density at a given temperature and value of the electronic gap—is translated into an electronic temperature value through the heat capacity, which in the current model is density dependent. In this formulation, there is no direct coupling between the pump pulse and the lattice subsystem. The energy is transferred to the lattice only through electron–phonon coupling, the strength of which is modulated by the carrier heat capacity and equilibrates to the environment through heat diffusion, which is negligible on short (<ns) time scales. The energy in the lattice subsystem is related to the lattice temperature through the (macroscopic) heat capacity of the material. Using this approach, it is quite straightforward to calculate the optical properties of the system through, for example, a Drude model, and to take into account, e.g., the reflectivity variation at the pump wavelength during the time evolution of the excitation pulse. For further details on the employed model, we refer readers to more exhaustive works [12,13,29]. The input parameters (besides those of the input beams, quoted in the text) for nTTM calculations are band gap 3 eV [30], temperature-dependent lattice-specific heat [31], Auger recombination rate of 1 × 10 31 cm 6 [32] and temperature-dependent impact ionization coefficient [33].
We verified that reasonable variations of the values of these parameters with respect to those found in the literature do not substantially affect the overall results. In this specific case, the parameter that affects the simulation results more strongly is τ E P . In Figure 6, we show the results of the calculations as a function of this parameter, hypothesizing a value of 1 fs [28] (Figure 6a), 10 fs (Figure 6b) and 100 fs (Figure 6c). In all cases, the lattice temperature has already reached an asymptotic value of ∼0.8 eV, compatible with the one estimated by the τ vs. λ p r o b e relation, in the ≲100 fs scale. Moreover, the assumption of τ E P 10 fs gives an initial electronic temperature compatible with the one determined in our experiment. nTTM also permitted to calculate the electron density in the conduction band, from which it is possible to estimate the plasma frequency and consequently the expected reflectivity in the visible and EUV photons (Figure 4).

5. Conclusions

We have shown that an intense 260 nm laser pulse can induce a large decrease in the EUV reflectivity, with a weak dependence on the probe wavelength. We interpreted this phenomenology as the hydrodynamic expansion of the sample surface after laser excitation, occurring on a characteristic time scale of about 0.8 ps. Data have been analyzed within a simple empirical model based on the dynamics of an expanding surface, and this allowed us to estimate the average electronic temperature ( T e 0.8 eV) reached by the excited sample. This experimental finding was positively compared with calculations, which also show (i) an ultra-fast thermalization of the electron–lattice subsystem given by the very efficient electron–phonon coupling; (ii) a high peak electron density, ∼1.6 × 10 22 cm 3 ; and (iii) an induced Ω p l a s m a of ∼5 eV. A comparison of the present results with those achieved by using an optical probe [11] underlines how the optical probe is sensitive to both carrier and lattice dynamics, even when the hydrodynamic expansion of the lattice becomes the dominant parameter to define the thermodynamic state of the system. Such sensitivity to both dynamical processes ineluctably complicates the data interpretation, in particular in cases similar to the present one, i.e., when the hydrodynamic expansion occurs on time scales similar to that typical of carrier dynamics [12,13,34]. However, since the EUV probing is more sensitive to the lattice dynamics, one can speculate on the possibility to perform a combined campaign of an optical/EUV transient reflectivity measurements, able to disentangle electron and lattice dynamics. This is a concept of general validity, not strictly connected to the investigated sample. In the particular case of a-C, such a fast (sub-ps) time scale for the hydrodynamic expansion suggests a very short time duration of the isochoric regime, during which one can define the concept of the thermodynamic phase in a more meaningful way (even in metastable conditions). This situation may severely complicate the use of photo-excitation to study the exotic states of carbon, such as high pressure/high temperature liquid phases and their properties.

Author Contributions

R.M., E.P., C.M., G.K. conceived and conducted the experiment. R.M., F.B. wrote the manuscript. All the authors discussed the data.

Conflicts of Interest

The authors declare no conflict of interest.

Abbreviations

The following abbreviations are used in this manuscript:
FELfree electron laser
EUVExtreme Ultra Violet
a-Camorphous carbon
FWHMfull-width-half-maximum
EPelectron phonon coupling

References

  1. Mariager, S.O.; Pressacco, F.; Ingold, G.; Caviezel, A.; Möhr-Vorobeva, E.; Beaud, P.; Johnson, S.L.; Milne, C.J.; Mancini, E.; Moyerman, S.; et al. Structural and magnetic dynamics of a laser induced phase transition in FeRh. Phys. Rev. Lett. 2012, 108, 1–5. [Google Scholar] [CrossRef] [PubMed]
  2. Wang, N.; Rokhlin, S.I.; Farson, D.F. Ultrafast laser melting of Au nanoparticles: Atomistic simulations. J. Nanoparticle Res. 2011, 13, 4491–4509. [Google Scholar] [CrossRef]
  3. Koenig, M.; Benuzzi-Mounaix, A.; Ravasio, A.; Vinci, T.; Ozaki, N.; Lepape, S.; Batani, D.; Huser, G.; Hall, T.; Hicks, D.; et al. Progress in the study of warm dense matter. Plasma Phys. Control. Fusion 2005, 47, B441–B449. [Google Scholar] [CrossRef]
  4. Vinko, S.M.; Ciricosta, O.; Cho, B.I.; Engelhorn, K.; Chung, H.K.; Brown, C.R.D.; Burian, T.; Chalupský, J.; Falcone, R.W.; Graves, C.; et al. Creation and diagnosis of a solid-density plasma with an X-ray free-electron laser. Nature 2012, 482, 59–62. [Google Scholar] [PubMed]
  5. Savvatimskiy, A.I. Measurements of the melting point of graphite and the properties of liquid carbon (A review for 1963–2003). Carbon 2005, 43, 1115–1142. [Google Scholar] [CrossRef]
  6. Togaya, M. Pressure Dependences of the Melting Temperature of Graphite and the Electrical Resistivity of Liquid Carbon. Phys. Rev. Lett. 1997, 79, 4–7. [Google Scholar] [CrossRef]
  7. Galli, G.; Martin, R.M.; Car, R.; Parrinello, M. Ab initio calculation of properties of carbon in the amorphous and liquid states. Phys. Rev. B 1990, 42, 7470–7482. [Google Scholar] [CrossRef]
  8. Errington, J.; Debenedetti, P.G. Relationship between structural order and the anomalies of liquid water. Nature 2001, 409, 318–321. [Google Scholar] [CrossRef] [PubMed]
  9. Mishima, O.; Stanley, H.E. The relationship between liquid, supercooled and glassy water. Nature 1998, 396, 329–335. [Google Scholar]
  10. Bundy, F.P. Melting of Graphite at Very High Pressure. J. Chem. Phys. 1963, 38, 618. [Google Scholar] [CrossRef]
  11. Reitze, D.H.; Ahn, H.; Downer, M.C. Optical properties of liquid carbon measured by femtosecond spectroscopy. Phys. Rev. B 1992, 45, 2677–2693. [Google Scholar] [CrossRef]
  12. Rämer, A.; Osmani, O.; Rethfeld, B. Laser damage in silicon: Energy absorption, relaxation, and transport. J. Appl. Phys. 2014, 116, 1–12. [Google Scholar] [CrossRef]
  13. Shin, T.; Teitelbaum, S.W.; Wolfson, J.; Kandyla, M.; Nelson, K.A. Extended two-temperature model for ultrafast thermal response of band gap materials upon impulsive optical excitation. J. Chem. Phys. 2015, 143, 1–8. [Google Scholar] [CrossRef] [PubMed]
  14. Masciovecchio, C.; Battistoni, A.; Giangrisostomi, E.; Bencivenga, F.; Principi, E.; Mincigrucci, R.; Cucini, R.; Gessini, A.; D’Amico, F.; Borghes, R.; et al. EIS: The scattering beamline at FERMI. J. Synchrotron Radiat. 2015, 22, 553–564. [Google Scholar] [CrossRef] [PubMed]
  15. Ratner, D.; Fry, A.; Stupakov, G.; White, W. Laser phase errors in seeded free electron lasers. Phys. Rev. ST Accel. Beams 2012, 15, 030702. [Google Scholar] [CrossRef]
  16. Danailov, M.B.; Bencivenga, F.; Capotondi, F.; Casolari, F.; Cinquegrana, P.; Demidovich, A.; Giangrisostomi, E.; Kiskinova, M.P.; Kurdi, G.; Manfredda, M.; et al. Towards jitter-free pump–probe measurements at seeded free electron laser facilities. Opt. Express 2014, 22, 12869–12879. [Google Scholar] [CrossRef] [PubMed]
  17. Chalupský, J.; Hájková, V.; Altapova, V.; Burian, T.; Gleeson, A.J.; Juha, L.; Jurek, M.; Sinn, H.; Störmer, M.; Sobierajski, R.; et al. Damage of amorphous carbon induced by soft X-ray femtosecond pulses above and below the critical angle. Appl. Phys. Lett. 2009, 95, 3–6. [Google Scholar] [CrossRef]
  18. Allaria, E.; Appio, R.; Badano, L.; Barletta, W.; Bassanese, S.; Biedron, S.; Borga, A.; Busetto, E.; Castronovo, D.; Cinquegrana, P.; et al. Highly coherent and stable pulses from the FERMI seeded free-electron laser in the extreme ultraviolet. Nat. Photon. 2012, 6, 699–704. [Google Scholar] [CrossRef]
  19. Allaria, E.; Castronovo, D.; Cinquegrana, P.; Craievich, P.; Dal Forno, M.; Danailov, M.B.; D’Auria, G.; Demidovich, A.; De Ninno, G.; Di Mitri, S.; et al. Two-stage seeded soft-X-ray free-electron laser. Nat. Photon. 2013, 7, 913–918. [Google Scholar] [CrossRef]
  20. The Center for X-Ray Optics. Available online: http://www.cxro.lbl.gov/ (accessed on 16 March 2017).
  21. Tobey, R.I.; Siemens, M.E.; Cohen, O.; Murnane, M.M.; Kapteyn, H.C.; Nelson, K.A. Ultrafast extreme ultraviolet holography: Dynamic monitoring of surface deformation. Opt. Lett. 2007, 32, 286. [Google Scholar] [CrossRef] [PubMed]
  22. Fedosejevs, R.; Ottmann, R.; Sigel, R.; Kühnle, G.; Szatmari, S.; Schäfer, F.P. Absorption of femtosecond laser pulses in high-density plasma. Phys. Rev. Lett. 1990, 64, 1250–1253. [Google Scholar] [CrossRef] [PubMed]
  23. Milchberg, H.M.; Freeman, R.R. Light Absorption in Ultrashort Scale Length Plasmas. J. Opt. Soc. Am. B 1989, 6, 1351–1355. [Google Scholar] [CrossRef]
  24. Meitzner, J.; Moore, F.G.; Tillotson, B.M.; Kevan, S.D.; Richmond, G.L. Time-resolved measurement of free carrier absorption, diffusivity, and internal quantum efficiency in silicon. Appl. Phys. Lett. 2013, 103, 092101. [Google Scholar] [CrossRef]
  25. Zel’dovich, Y.B.; Raizer, Y.P. Physics of Shock Waves and High-Temperature Hydrodynamic Phenomena; Dover Publication: New York, NY, USA, 1966. [Google Scholar]
  26. More, R.M. Pressure ionization, resonances, and the continuity of bound and free states. Adv. At. Mol. Phys. 1985, 21, 305. [Google Scholar]
  27. Silva, S.R.P. Properties of Amorphous Carbon; Institution of Engineering and Technology: London, UK, 2003. [Google Scholar]
  28. Tandon, N.; Albrecht, J.D.; Ram-Mohan, L.R. Electron-phonon coupling and associated scattering rates in diamond. Diam. Relat. Mater. 2015, 56, 1–5. [Google Scholar] [CrossRef]
  29. Chen, J.; Tzou, D.; Beraun, J. A semiclassical two-temperature model for ultrafast laser heating. Int. J. Heat Mass Transf. 2006, 49, 307–316. [Google Scholar] [CrossRef]
  30. Baydogan, N.D. Evaluation of optical properties of the amorphous carbon film on fused silica. Mater. Sci. Eng. B 2004, 107, 70–77. [Google Scholar] [CrossRef]
  31. Butland, A.T.D.; Maddison, R.J. The Specific Heat of Graphite: An Evaluation of Measurements. J. Nucl. Mater. 1973, 49, 45–56. [Google Scholar]
  32. Shimano, R.; Nagai, M.; Horiuch, K.; Kuwata-Gonokami, M. Formation of a high Tc electron-hole liquid in diamond. Phys. Rev. Lett. 2002, 88, 574041–574044. [Google Scholar]
  33. Watanabe, T.; Teraji, T.; Ito, T.; Kamakura, Y.; Taniguchi, K. Monte Carlo simulations of electron transport properties of diamond in high electric fields using full band structure. J. Appl. Phys. 2004, 95, 4866–4874. [Google Scholar] [CrossRef]
  34. Verburg, P.C.; Römer, G.R.B.E.; Huis, A.J. Two-temperature model for pulsed-laser-induced subsurface modifications in Si. Appl. Phys. A Mater. Sci. Process. 2014, 114, 1135–1143. [Google Scholar] [CrossRef]
Figure 1. Top left: values of I r recorded well before (more than 100 ms) the main pump–probe sequence (blue diamonds); at a given value of Δ t after the optical pump pulse (black circles); and ∼100 ms after the main pump–probe sequence (green squares). Data correspond to λ p r o b e = 19 nm. Other panels refer to the time resolved reflectivity change at the different free electron laser (FEL) wavelengths. Continuous lines are an exponential fit to data, while dashed lines are the confidence interval. Data have been scaled in order to match the tabulated extreme ultraviolet (EUV) reflectivity values [20] for negative Δ t ’s.
Photonics 04 00023 g001
Figure 2. Image of the sample before exposure to the pump (panel a) and after exposure (panel b). Damage is clearly visible.
Photonics 04 00023 g002
Figure 3. Function τ ( λ ) (red solid line) obtained by fitting the experimental τ values obtained in Figure 1. Equation (2) yields a maximum average electron temperature of 0.8 eV. Dashed lines are the expected τ s for electron temperatures of 1.2 and 0.4 eV.
Photonics 04 00023 g003
Figure 4. Panel (a) reports the trend for the electronic (blue curve) and lattice temperature (red curve) using an electron phonon coupling (EP) of 10 fs. Panel (b) is the calculated conduction electron density. Panels (c,d) show the expected ratio between the static un-perturbed reflectivity and the Drude one for visible (2.3 eV) and EUV (40 eV) photons.
Photonics 04 00023 g004
Figure 5. Sketch of the set-up in which the FEL pulses are separated by 100 ms. The first three FEL pulses probe the un-pumped reflectivity, while the last one probes the sample after the main pump–probe sequence. The blue pulse is the optical pump pulse which is time delayed with respect to the fourth FEL pulse.
Photonics 04 00023 g005
Figure 6. Lattice and electronic temperature trend calculated using τ E P =1 fs (panel a), 10 fs (panel b) and 100 fs (panel c).
Photonics 04 00023 g006

