Study of the Effect of Nematic Order Degradation in Liquid Crystal-Based Surface Plasmon Resonance Sensors


Department of Engineering and Physics, University of Central Oklahoma, 100 N. University Drive, Edmond, OK 73034, USA
Photonics 2017, 4(2), 24; https://doi.org/10.3390/photonics4020024
Submission received: 28 February 2017
/
Revised: 21 March 2017
/
Accepted: 23 March 2017
/
Published: 25 March 2017
Abstract
:This paper presents a new analysis of optical sensors based on surface plasmon resonance (SPR) phenomenon and nematic liquid crystal (LC) sensitive layer in the partially ordered state. In particular, the paper studies the influence of degradation in the LC ordering state on the behavior of the plasmon resonance parameters. The degradation in the LC ordering is represented by the order parameter. The explicit treatment of the order parameter is critical when trying to differentiate between a change in alignment and a degradation of alignment in LC in response to the presence of an external stimulus in LC based sensors. When a reduction in ordering occurs, ignoring the order parameter can produce misleading results. This sensor has potential applications in chemical and biological systems. The paper presents a tracking method for the state of alignment and degree of ordering of the partially ordered LC film. This can be achieved via the SPR propagation constant and the critical angle at the interface between a metal and an LC film.
1. Introduction
Recently, liquid crystal (LC)-based sensors have been proven to be successful in sensing and identifying toxic chemicals, explosive and radioactive materials, and biological agents at very low levels in gasses and liquids, and on surfaces in real time [1,2,3,4,5,6]. In these sensors, the molecular alignment in the LC film is altered in response to some environmental conditions or external stimuli. For most biochemical sensors, the orientational behavior of liquid crystals near surfaces is exploited. Due to the collective behavior of molecules forming LCs, a change in the structure at the surface caused by the binding of a chemical or biological agent is amplified into a significant change in the average molecular alignment of the LC film. These changes in the molecular alignment could be associated with changes in the surface anchoring energy and molecular degree of ordering [6].
An example of using LC in sensing applications is the work done by researchers from the University of Wisconsin-Madison [7,8]. In these research efforts, researchers reported several cases and experiments in using LC in sensing applications. In [7], the authors performed an experiment in detecting vapor-phase Dimethyl methylphosphonate (DMMP) by monitoring the intensity of polarized light transmitted through 4′-pentyl-4-cyanobiphenyl (5CB) liquid crystal film. The substrate holding the LC was treated with copper perchlorate (Cu(ClO4)2) layer (a receptor) to homeotropically align the 5CB molecules. When the DMMP gas diffuses through the LC, it will disrupt the LC homeotropic alignment (creating a weak partially ordered LC film) and then bind to the receptors. In [8], the authors reported different cases for LC alteration in response to external stimuli. For example, a homeotropic alignment of LC will change to homogeneous alignment in detecting part-per billion concentration of Dimethyl methylphosphonate (DMMP). Another example is when a homogeneous alignment at a given angle will rotate to a homogeneous alignment at a different angle.
In the LC-based sensors, optical transduction techniques are common in sensing the deformations within the LC material. Some of these transduction techniques allow detecting the average deformation and monitoring the molecular alignment along with the degree of ordering. Optical transduction requires the targeted behavior to be transduced into measurable optical quantities. Some of these LC optical sensors utilize visual inspection. In this case, an optical microscopy is used to sense the deformation within the LC material without having the ability to identify and track the average deformation. Another approach used in detecting the LC deformation is achieved by capacitive transduction techniques. In a previous effort, the author and others have demonstrated a novel capacitive transduction technique to monitor these LC deformations [5]. In capacitive transduction methods, when the director axis orientation alters, the electrical properties of the LC change and the capacitance will change accordingly. The capacitive method has also been proven to have the capability of tracking the LC director and degree of ordering. In this paper, we switch to an alternative optical transduction technique that utilizes surface plasmon resonance (SPR) phenomenon at metal/dielectric interface. In particular, LC will be used as the dielectric material utilized in the sensing approach.
The surface plasmon resonance phenomenon has been studied intensively in the literature [9,10]. SPR has been involved in many applications in engineering, biotechnology, and other life science disciplines. In the past two decades, SPR had played a vital role in many promising sensing applications in biological and chemical systems [11,12,13,14,15]. Recently, LC coupled with SPR phenomenon has been widely utilized in sensing applications. These sensors have been proven to be superior to the conventional SPR sensors with the dielectric being an isotropic material [16]. For example, an LC filled fiber SPR temperature sensor was used in [17] as a thermometer in the range of 20–50°C . A wavelength shift of more than 46 nm was caused by the transition between the nematic and isotropic phases. In another example, the phase transition from nematic to isotropic caused by temperature is used to sense even the small changes in an analyte’s concentration [18]. The threshold concentration is achieved by shifting the clearing point of the LC to optimal concentration sensitivity.
Switching to optical transduction using SPR-LC sensors offers some remarkable advantages. First, it provides greater insight into the fundamental deformation occurring in the LC film due to the presence of external stimuli such as chemical and biological agents. Second, the proposed SPR-LC sensor does not require visual inspection; therefore, a simpler system with autonomous operation and reduced possible false alarms are achievable. Third, this sensor offers the ability to identify and track the average LC deformation and is capable of providing information about the order parameter in partially ordered LC phase. These advantages and others provide a compelling argument to investigate the SPR-LC sensing approach.
In the conventional analysis of SPR-LC, the LC material is treated in the ordered anisotropic phase. This will allow in detecting the average deformation and in some cases monitoring the molecular alignment of the LC film without explicitly treating the influence of the change in the degree of ordering. In this research paper, we propose an optical transduction technique that utilizes LC in partially ordered and fully ordered phases along with SPR configuration. This method has the potential to identify and track the LC profile deformations (the average LC director as well as the ordering degree) rather than merely sensing the LC director alteration. Studying SPR-LC sensors with the explicit treatment of the ordering degree is significant; as it helps in tracking the LC profile deformation in LC-based sensors when the molecular degree of ordering is distorted. Explicit treatment of the order parameter is critical when trying to differentiate between a change in alignment (average director deformation) and a degradation of alignment (loss in entire uniaxial structure). When a reduction in ordering occurs, ignoring this parameter can produce misleading results.
2. SPR-LC Sensor Fundamentals and Analysis
2.1. The Fundamentals
A conventional Kretschmann configuration SPR sensor consists of a prism with a thin metal film deposited on the prism, typically gold or silver, and an optical dielectric sensitive layer on the top of the metal film. Gold is more common as it exhibits significantly more absorption than silver and easier to functionalize. These sensors are capable of sensing remarkably small changes in the dielectric constants of this sensitive layer. Biomolecular interactions on thin dielectric layers may cause changes to the refractive index of the dielectric material at the metal/dielectric interface. Consequently, the dispersion of the propagating SPR will change, without affecting the biomolecular interactions. These interactions can then be monitored by tracking the changes in the dielectric material.
The proposed SPR-LC sensor utilizes nematic liquid crystal as the dielectric sensitive layer coating the metal film. For example, in Figure 1a, the receptors will homeotropically align the LC molecules in the absence of external stimuli (in this case, the biological or chemical agents). In general, the LC homeotropic alignment may or may not be a perfectly ordered film. Although the director axis defines the average orientation of molecules in the nematic phase, it provides no information regarding the degree of orientational ordering. A scalar quantity is required to identify the spread of the molecules about the director axis and give information about the degree of order along the director axis. The scalar quantity is called the order parameter and is used to quantify the long-range orientational order and to define the degree of alignment in LCs. The order parameter, S, depends on the angle between the long axis of the rod-like molecule and the director axis; . The order parameter can be mathematically expressed according to the second order Legendre polynomial as [19]
where denotes the statistical average. The order parameter has a value in the range of , with represents the completely disordered LC or the isotropic state and represents the completely ordered state. The order parameter in the range is used to describe the LC in the partially ordered state. The evanescent wave in the LC will experience an effective refractive index of [20]
where
such that and represent the LC ordinary and extraordinary dielectric constants, respectively, in the partially ordered state. The permittivity in the isotropic state (fully disordered) is given by
where and are the ordinary and extraordinary permittivities at the fully ordered state, respectively, and is called the LC dielectric anisotropy. These numbers are usually provided by the manufacturer in the LC datasheet. and are unit vectors representing the direction of the refracted wave vector inside the LC, and the LC director axis, respectively. Alternatively, in the presence of biological or chemical agents, these agents will compete with the LC molecules to bind to receptors near the metal/LC interface, as in Figure 1b. Owing to the collective behavior of molecules forming LCs, minor changes in the structure of the surface can be amplified into a significant change in the director field of the LC. This behavior will deform the current LC alignment and results in a partially, or even completely, disordered LC film that affects the effective refractive index.
2.2. The Analysis
Surface plasmon is the phenomenon of the free electron density oscillation near the surface of a metal that is in contact with a dielectric material. The boundary of the two materials can support surface waves if the real parts of the dielectric constants have opposite signs. Let and be the electric permittivity of the metal film and the dielectric material, respectively. The surface plasmon polaritons are exist under the conditions of and , with . The other important condition is that the light should be p-polarized where the electric field lies in the plane of incidence, and the magnetic field in perpendicular to this plane, i.e., TM polarization.
Recalling Maxwell’s equations
where and , , , , and are the electric field, magnetic field, the angular frequency, the free space permittivity, the free space permeability, electric permittivity, and relative permeability, respectively. The electric permittivity in the metal is a complex quantity, . Nematic LCs are commonly known as diamagnetic materials, therefore, their relative permeability is close to unity [21]. In general, the electric permittivity for the partially ordered LC film is a tensor () that can be expressed as:
such that is the dielectric constant experienced by the electric field in the direction and
where is the angle between the director axis and the normal on the surface. Let be the plane of incidence and the director axis inside the LC is a planer director (i.e., in the plane), such that the director can be written as
For a TM polarized light wave, the electric field is given by and the magnetic field is , Let the metal/LC interface be the plane such that the metal film (medium 1) lies in the region and the LC (medium 2) is in . Therefore
where and are the propagation constants in the i-th medium, with for Au film and for LC. Recalling Maxwell’s equations and solving for the electric field in medium 1 gives:
where the solution for the electric field in medium 2 is:
The boundary conditions at the interface ( plane) are and . Applying these conditions gives
Let’s call:
applying the initial conditions and solving for the surface plasmon existence condition at the metal/LC interface gives
This result shows that for completely disordered LC state (i.e., LC is in the isotropic phase and ), then the SPR condition is
Applying the Maxwell’s equation in the metal film and solving for gives
where is the propagation constant in air and is the wavelength in air. Now let us apply the same condition for the LC and solve for , this will give
substitute and in (14) and solve for the surface plasmon propagation constant gives
The surface plasmon propagation constant is a complex quantity which can be expressed as . The SPR wavelength is then determined by , where the propagation length is determined by [12]. The surface plasmon penetration depth is defined as the perpendicular (on the interface) penetration at which the wave intensity falls to of the intensity at the interface (the maximum intensity). From (9), (16) and (18), the penetration depth in the metal film can be written as
The above results show that the propagation constant and the penetration depth depend on the director axis orientation as well as the order parameter of the LC. As a special case, the surface plasmon propagation constant for completely disordered LC is
and the penetration depths in (19) and (20) become
where and for penetration depth in the metal and the LC, respectively. The results in (21) and (22) matches the results for isotropic sensing material as derived in [9]. With two independent measurements, we can track the director orientation and the order parameter. For instance, measuring the angle of resonance (polariton angle) and the critical angle will provide information about the LC profile parameters (i.e., the director and the order parameter). Those parameters can report whether a biomolecular interaction occurs or not. The polariton angle is the angle of incidence (at the prism/metal interface, i.e., as in Figure 1) when the propagation constant at that interface is close to the SPR propagation constant, i.e., . Thus, can be expressed by
where is the dielectric constant of the prism. This shows that is a function of the director zenithal angle, , and the order parameter, S. Another useful measurement is the critical angle for the extraordinary wave inside the LC, which is obtained from the total internal reflection as
3. Simulation Results
Figure 2 shows a proposed experimental setup for the discussed SPR-LC sensor. The laser light is TM polarized with a wavelength , while is the angle of incidence at the glass/metal interface. A change in the structure at the LC/agents interface caused by binding of a chemical or biological agent or biomolecular interactions is amplified into a significant change in the average molecular alignment of the LC film. The molecular anchoring energy at the LC/metal interface is assumed to be weak enough for the anchoring molecules to respond to the deformation in the LC due to the presence of external stimulus at the LC surface. In homogeneous (planar alignment) LC film, the anchoring layer can be weakened by exposing ultraviolet radiation to the poly-vinyl-alcohol (PVA) used to align the LC molecules homogeneously. In homeotropic (vertical alignment) LC film, weak anchoring can be achieved by treating the metal surface with low concentration solution of cetyltrimethyl-ammonium bromide (CTAB). In a previous work, Jun et al. have presented a weak homeotropic alignment by using a low concentration of 0.035% of CTAB/deionized water solution [22]. This change will significantly drop the reflection coefficient when the angle of incidence is equal to the angle of resonance, . Therefore, to detect the angle of resonance, the angle of incidence is adjusted to achieve the minimum reflected intensity. Simulation results can be utilized to go back from the measured resonance angle to deduce the LC parameters.
The following parameters were used in the simulation: Au film with 50 nm thickness and electric permittivity of at 632.8 nm. The liquid crystal is E7 from Licristal® (Philadelphia, PA, USA) with extraordinary and ordinary refractive indices of and at 632.8 nm, respectively. The glass prism has a high refractive index, for example LASF35 from SCHOTT® (Elmsford, NY, USA) has a refractive index of at 632.8 nm.
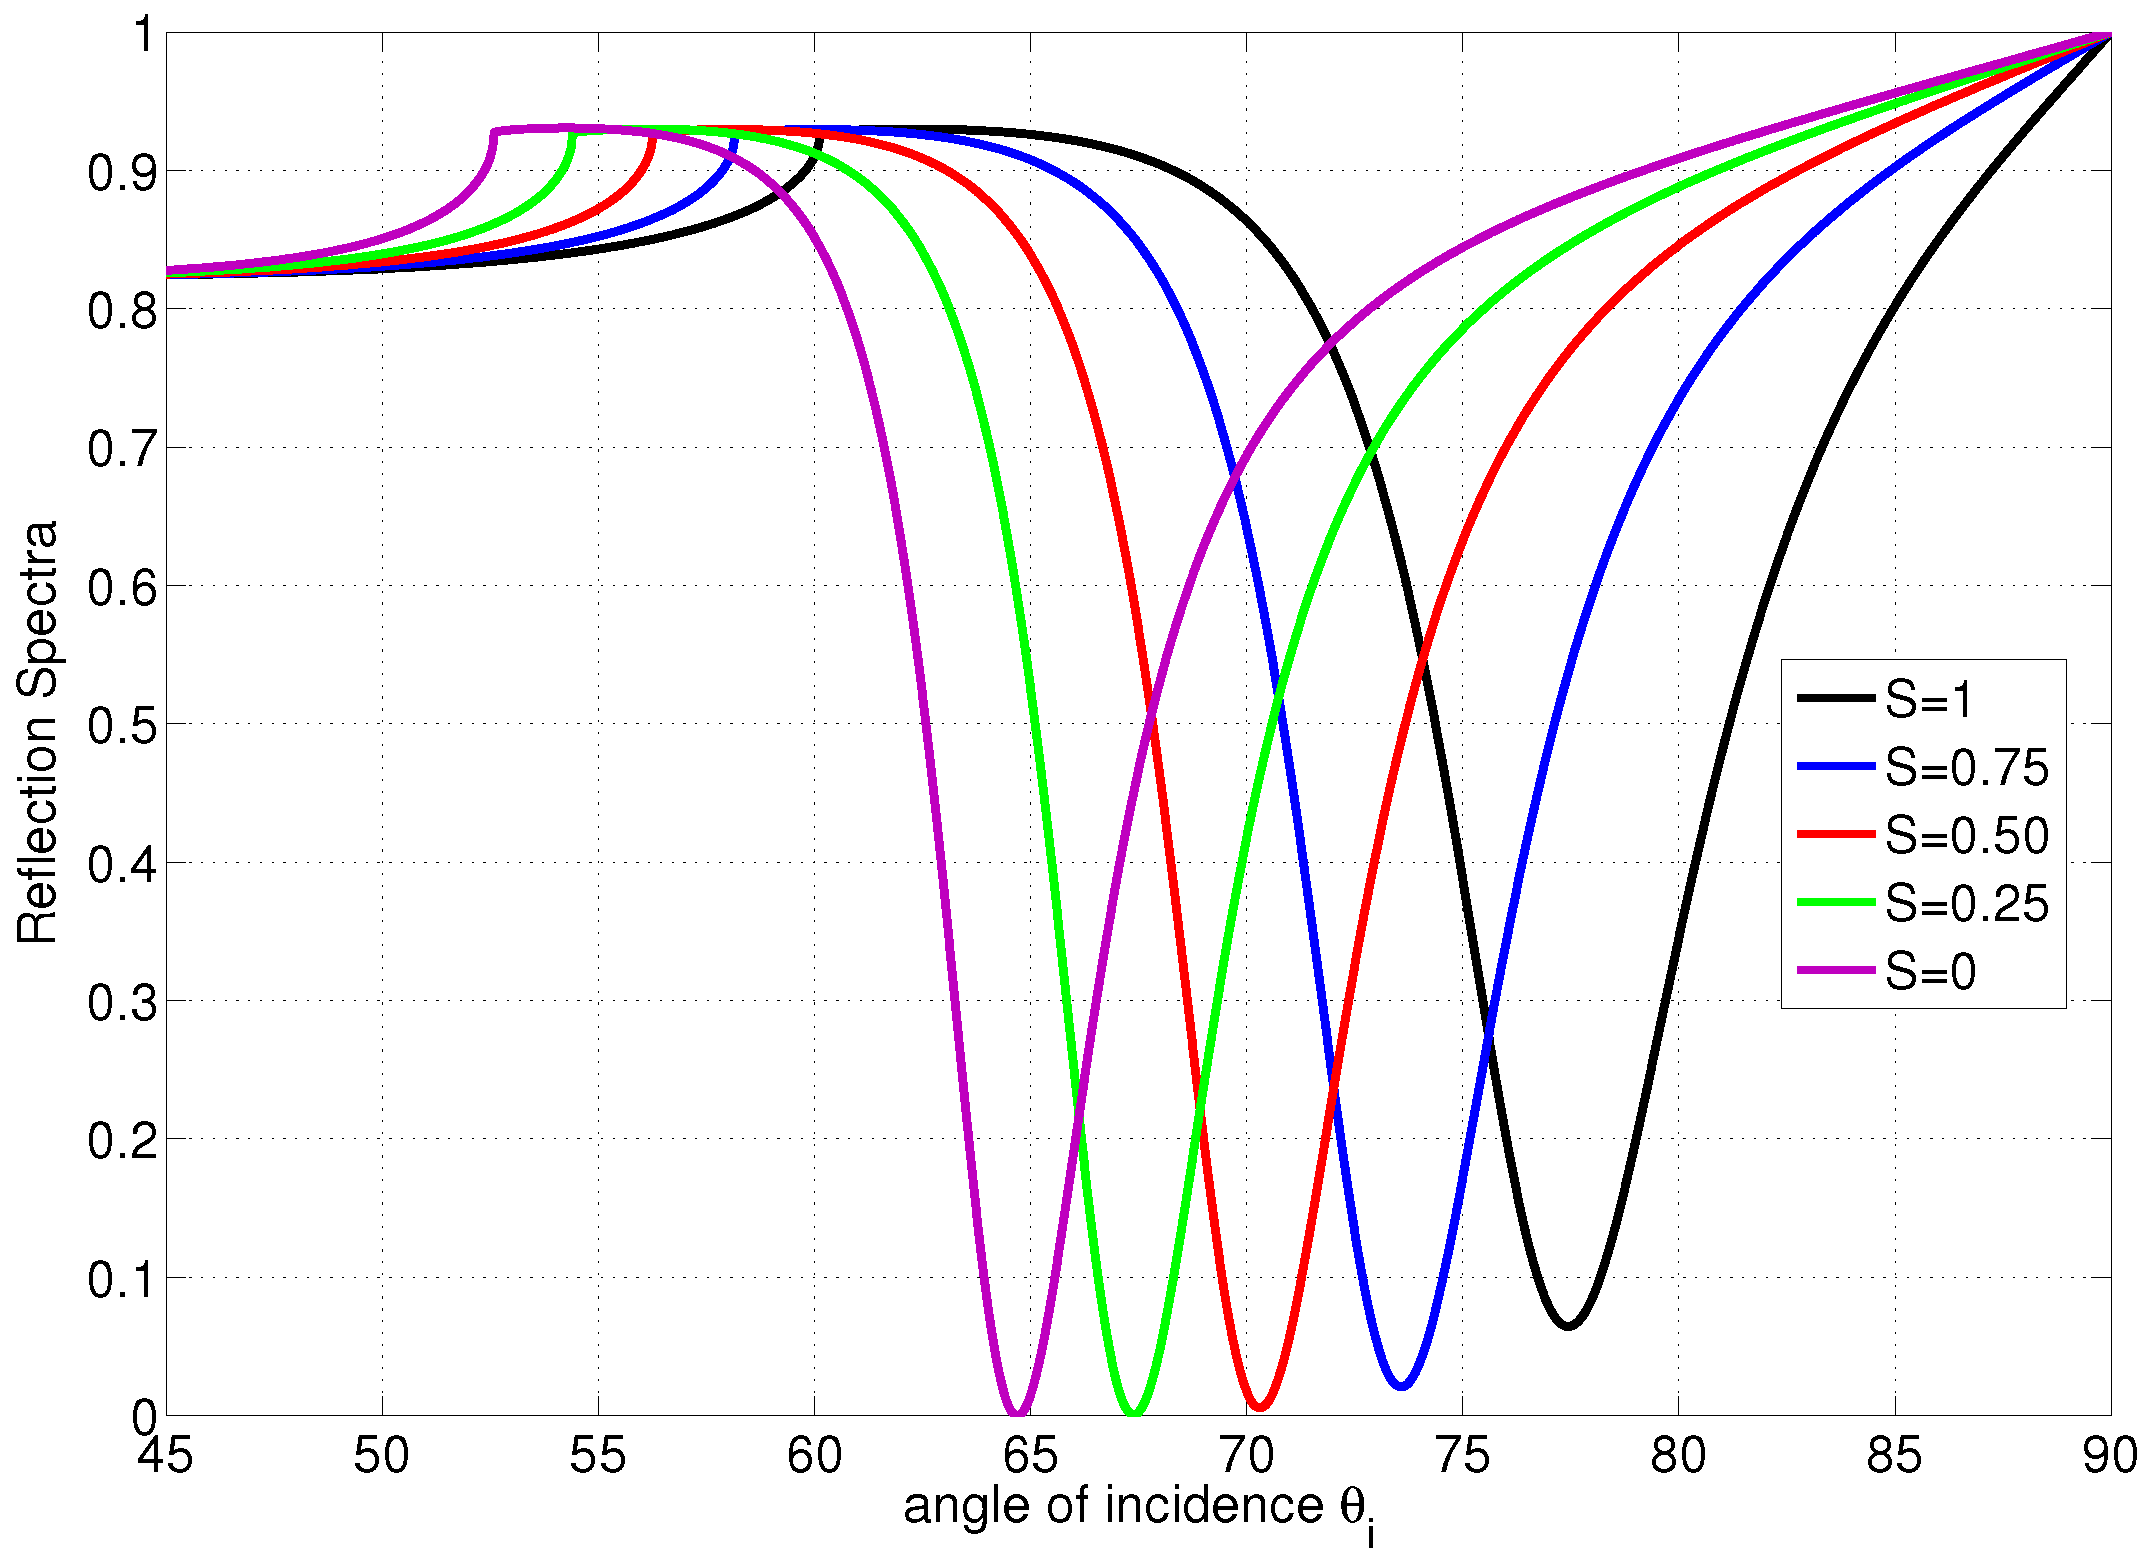
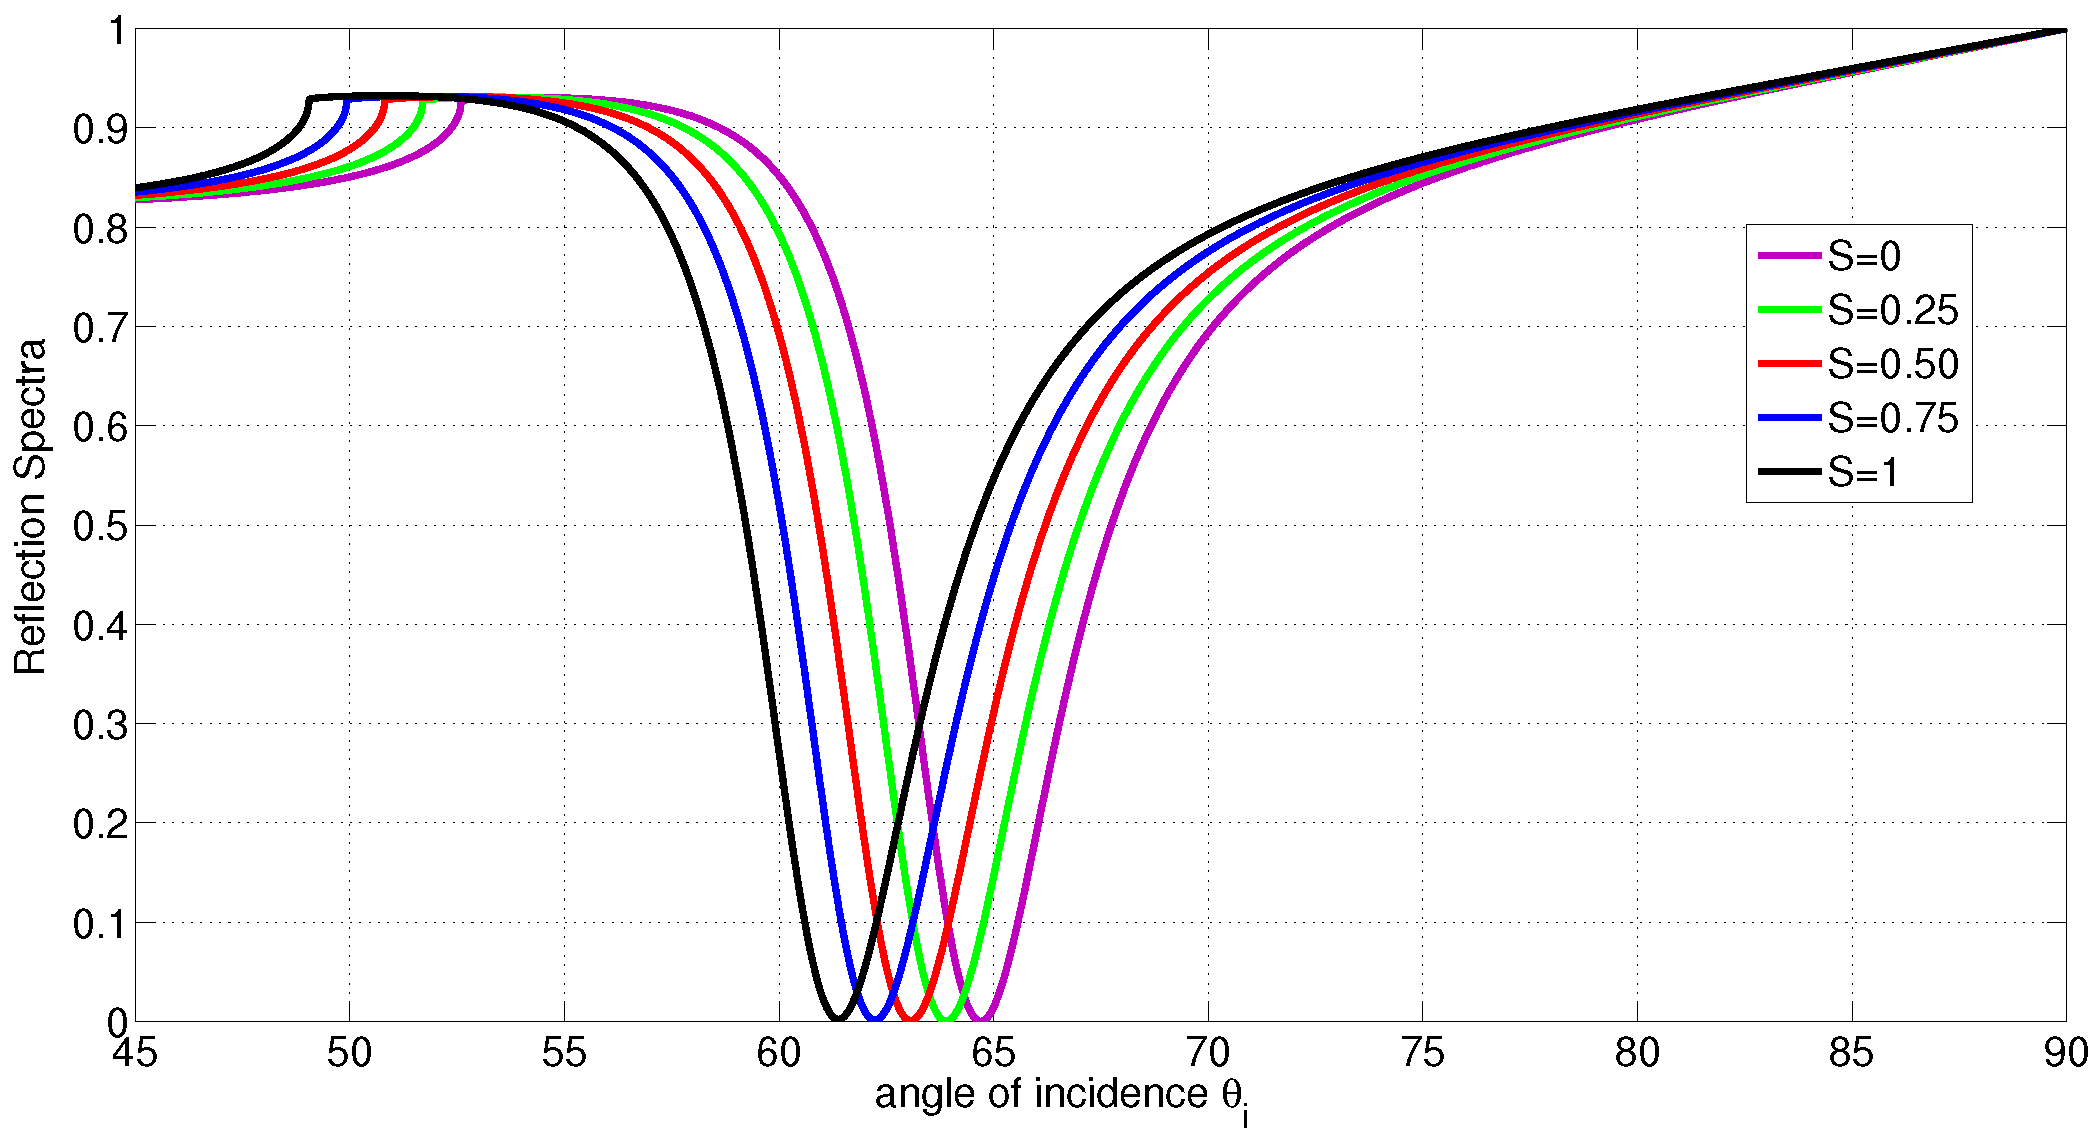
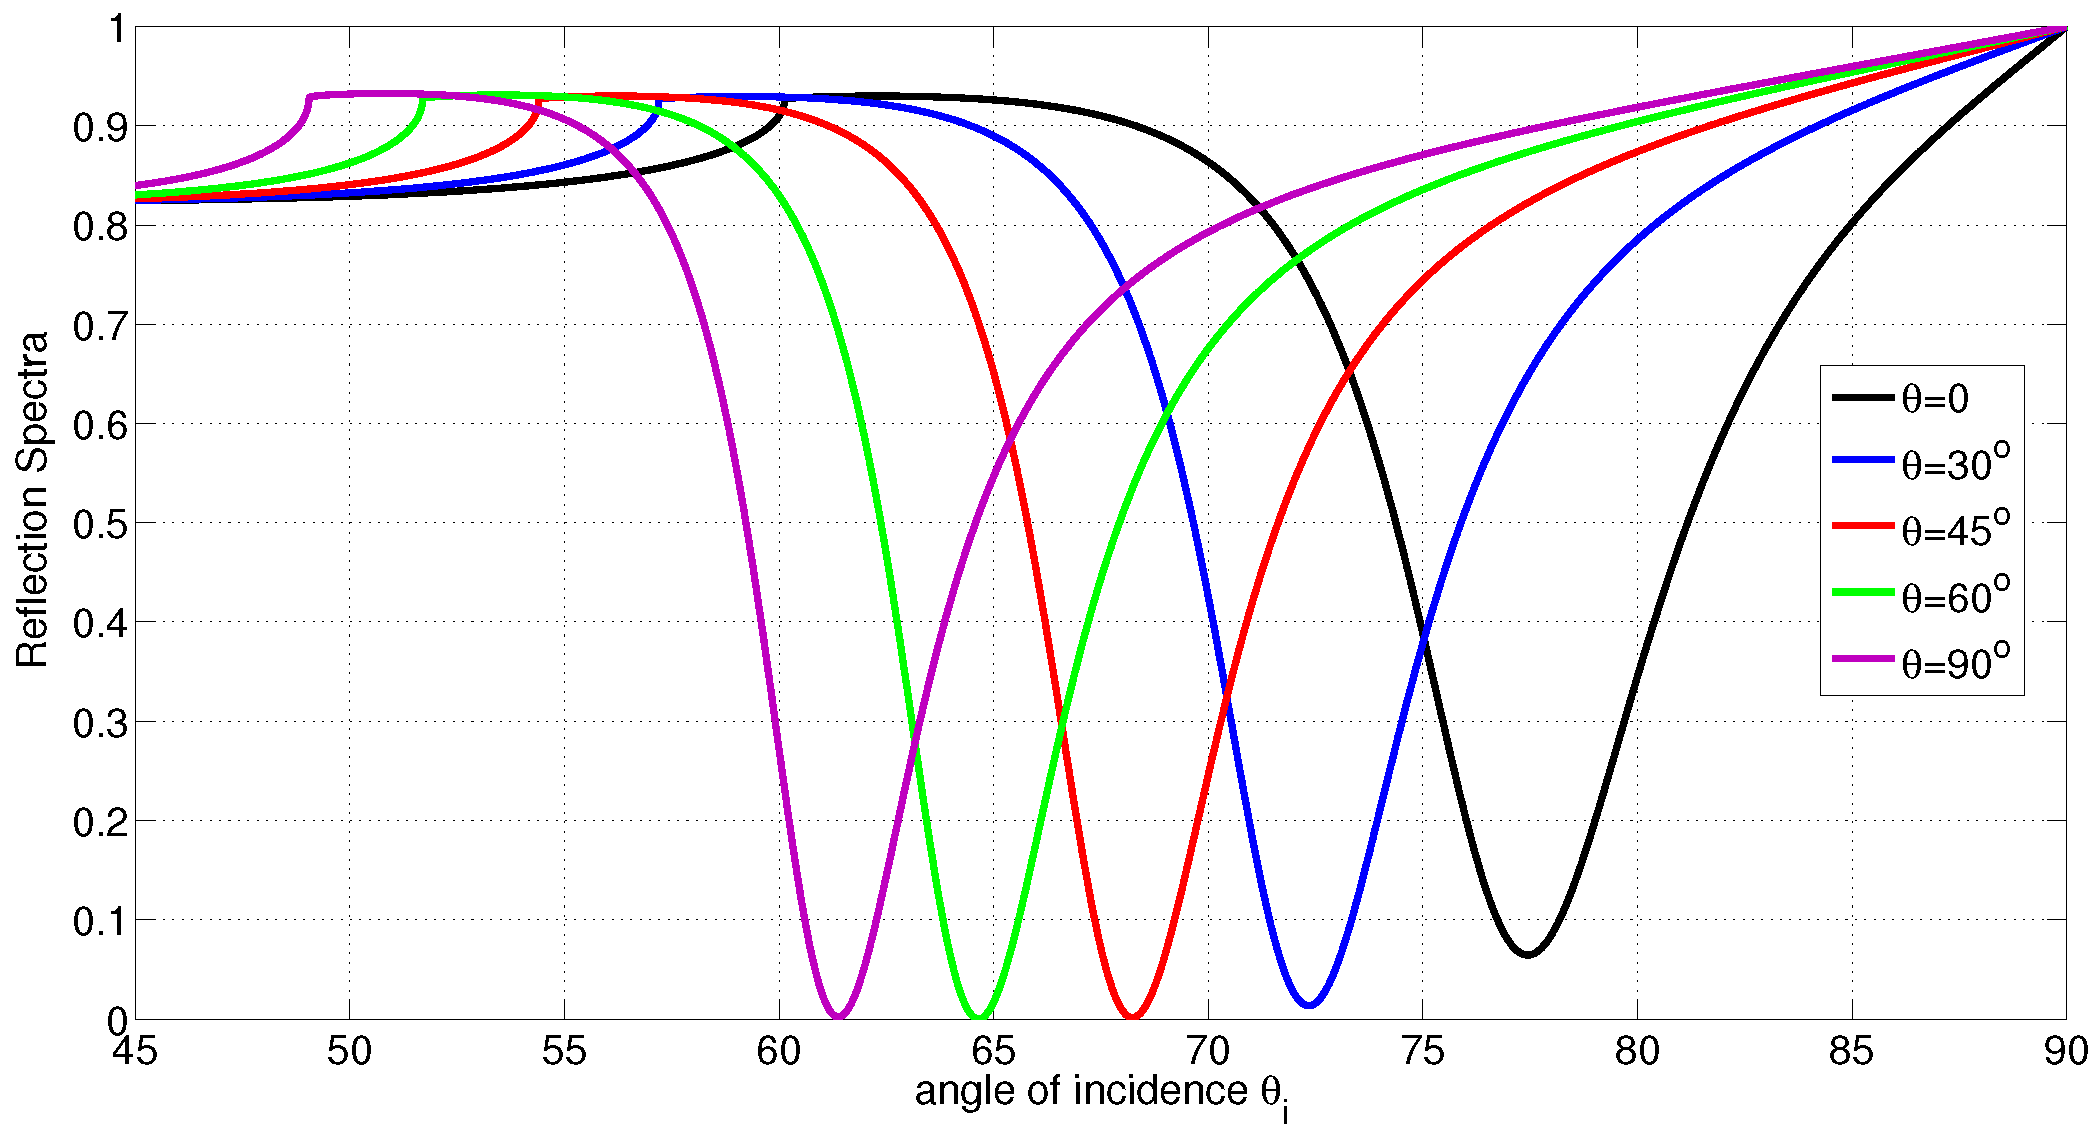
Let us study a case when the LC molecules are homeotropically aligned (molecules are normal on the metal/LC interface and the director zenithal angle is ). The reflection spectrum at different degrees of ordering is shown in Figure 3. In this example, it is shown that the critical angle and the angle of resonance will be shifted to the left if a reduction in the order parameter occurs; however, the average director orientation is maintained. As the LC film deforms from homeotropically ordered to disordered state, the polariton angle is shifted by . Therefore, the average order parameter sensitivity is 0.0775/∘. This is an important result in the case when the binding effect causes a reduction in the degree of ordering with no alteration to the director axis. The spectrum for homogenous LC when the degree of ordering change is shown in Figure 4. It is shown that the critical angle and the angle of resonance will be shifted to the right if a reduction in the order parameter occurs; however, the average director orientation is maintained. As the LC film deforms from homogeneously ordered to disordered state, the polariton angle is shifted by . Therefore, the average order parameter sensitivity is 0.303/∘. The other possible LC deformation occurs by altering the director and possibly maintaining the degree of ordering as the example shown in Figure 5. In this example, it is shown that deforming the director from fully ordered homeotropic alignment () to fully ordered homogeneous alignment () will significantly drop the critical angle by and the polariton angle by . For the parameters used above, the penetration depth in the metal slightly varies in the range nm when S or change. The penetration depth in the LC can range from 96 nm for perfectly ordered homogenous LC to 124 nm for perfectly ordered homeotropic LC. For LC in the isotropic state; , the penetration depth will be 114 nm. For thicker LC films, a deeper polariton penetration in LC is needed in order to probe the profile of the director and reveal more accurate measurements. This can be achieved by using a metal film with higher electric permittivity, for example silver, and a higher wavelength laser.
The method discussed in this paper relies on measuring the polariton angle and the critical angle in monitoring the LC profile. Relaying only on the polariton angle can be misleading in some cases. For example, disordered LC film and perfectly ordered LC film with the director making with the normal, both have the same polariton angle . The difference between both reflection spectra is in the critical angle. The critical angle for first case is where the critical angle for the second case is . Another example to clarify this ideas is for two partially ordered cases that have the same polariton angle when and . The difference between both spectra is the critical angle, and . These two examples show how relaying on the polariton angle only can reveal misleading interpretation about the LC profile deformation.
4. Conclusions
An optical transduction mechanism that utilizes surface plasmon resonance phenomenon in tracking the LC profile in partially ordered LC sensors is presented. This work has proven that measuring the critical angle and the angle of resonance can provide information about the LC ordering degree as well as the director axis orientation. Explicit treatment of the order parameter is critical when trying to differentiate between a change in alignment and a degradation of alignment in LC in response to the presence of external stimulus. When a reduction in ordering occurs, ignoring the order parameter can produce misleading results. Numerical examples with different alignments and degree of ordering are presented.
Conflicts of Interest
The author declare no conflict of interest.
References
- Brake, J.; Daschner, M.; Abbott, N.L. Biomolecular interactions at phospholipid decorated surfaces of thermotropic liquid crystals. Science 2003, 302, 2094–2097. [Google Scholar] [CrossRef] [PubMed]
- Liang, B.-J.; Hsu, J.-S.; Hsu, P.-F.; Liu, D.-G. Electrostatic Discharge Sensor Based on Brightness Retention of Liquid Crystals. IEEE Sens. J. 2016, 4, 918–923. [Google Scholar] [CrossRef]
- Ferhat, M.; Hameed, O.; Azab, Y.; Heikal, A.M.; El-Hefnawy, S.M.; Obayya, S.S.A. Highly Sensitive Plasmonic Photonic Crystal Temperature Sensor Filled With Liquid Crystal. IEEE Photonics Technol. Lett. 2016, 28, 59–62. [Google Scholar] [CrossRef]
- Feng, J.; Zhao, Y.; Li, S.-S.; Lin, X.-W.; Lu, Y.-Q. Fiber-Optic Pressure Sensor Based on Tunable Liquid Crystal Technology. IEEE Photonics J. 2010, 3, 292–298. [Google Scholar] [CrossRef]
- Abu-Abed, A.S.; Lindquist, R.G. Capacitive transduction for liquid crystal based sensors, part II: Partially disordered systems. IEEE Sens. J. 2008, 8, 1557–1564. [Google Scholar] [CrossRef]
- Carlton, R.J.; Hunter, J.T.; Miller, D.S.; Abbasi, R.; Mushenheim, P.C.; Tan, L.N.; Abbott, N.L. Chemical and biological sensing using liquid crystals. Liq. Cryst. Rev. 2013, 1, 29–51. [Google Scholar] [CrossRef] [PubMed]
- Sridharamurthy, S.; Cadwell, K.; Abbott, N.L.; Jiang, H. A Liquid crystal based gas sensor using microfabricated pillar arrays as a support structure. In Proceedings of the IEEE Sensors Conference, Atlanta, GA, USA, 28–31 October 2007; pp. 1044–1047. [Google Scholar]
- Shah, R.; Abbott, N.L. Principles for measurment of chemical exposure based on recognition-driven anchoring transitions in liquid crystals. Science 2001, 293, 1296–1299. [Google Scholar] [CrossRef] [PubMed]
- Raether, H. Surface Plasmons on Smooth and Rough Surfaces and on Gratings; Springer: New York, NY, USA, 1988. [Google Scholar]
- Srid, D.; Challene, W. Modern Introduction to Surface Plasmons: Theory, Mathematica Modeling, and Applications; Cambridge University Press: Cambridge, UK, 2010. [Google Scholar]
- Liu, Y.; Liu, X.; Chen, S.; Liu, Q.; Peng, W. Investigation of a Capillary-Based Surface Plasmon Resonance Sensor for Biosensing. J. Lightwave Technol. 2016, 17, 4036–4042. [Google Scholar] [CrossRef]
- Shalaev, V.M.; Kawata, S. Nanophotonics with Surface Plasmons; Elsevier Science: New York, NY, USA, 2007. [Google Scholar]
- Byun, K.M.; Kim, D.; Kim, S.J. Investigation of the profile effect on the sensitivity enhancement of nanowire-mediated localized surface plasmon resonance biosensors. Sens. Actuators B Chem. 2007, 117, 401–407. [Google Scholar] [CrossRef]
- Chinowsky, T.M.; Quinn, J.G.; Bartholomew, D.; Kaiser, R.; Elkind, J. Performance of the spreeta 2000 integrated surface plasmon resonance affinity sensor. Sens. Actuators B Chem. 2003, 91, 266–274. [Google Scholar] [CrossRef]
- Hodnik, V.; Anderluh, G. Toxin detection by surface plasmon resonance. Sensors 2009, 9, 1339–1354. [Google Scholar] [CrossRef] [PubMed]
- Ruan, L.; Yang, F.; Sambles, J.R. Otto-coupled surface plasmons in a liquid crystal cell. Appl. Phys. Lett. 2009, 95, 171102. [Google Scholar] [CrossRef]
- Lu, M.; Zhang, X.; Liang, Y.; Li, L.; Masson, J.-F.; Peng, W. Liquid crystal filled surface plasmon resonance thermometer. Opt. Express 2016, 10, 10904–10911. [Google Scholar] [CrossRef] [PubMed]
- Kieser, B.; Pauluth, D.; Gauglitz, G. Nematic liquid crystals as sensitive layers for surface plasmon resonance sensors. Anal. Chim. Acta 2001, 434, 231–237. [Google Scholar] [CrossRef]
- De Gennes, P.G.; Prost, J. The Physics of Liquid Crystals; Oxford Science: Oxford, UK, 1993. [Google Scholar]
- Abu-Abed, A.S. Optical waves in partially ordered anisotropic media. Opt. Express 2009, 17, 1646–1651. [Google Scholar] [CrossRef] [PubMed]
- Buka, A.; de Jeu, W.H. Diamagnetism and orientational order of nematic liquid crystals. J. Phys. Fr. 1982, 43, 361–367. [Google Scholar] [CrossRef]
- Jun, N.; Zou, Y.; Abu-Abed, A.S.; Lindquist, R.G. Capacitive Techniques to Monitor of Anchoring Energy for Liquid Crystal Sensors. IEEE Sens. J. 2009, 10, 1479–1485. [Google Scholar]
Figure 1.
Typical surface plasmon resonance-liquid crystal (SPR-LC) Sensor with Kretschmann Configuration (a) Receptors homeotropically align the LC molecules in the absence of the biological or chemical agents (b) Biological or chemical agents will compete with the LC molecules to bind to receptors near the metal/LC interface. As result, the LC film alignment will deform.
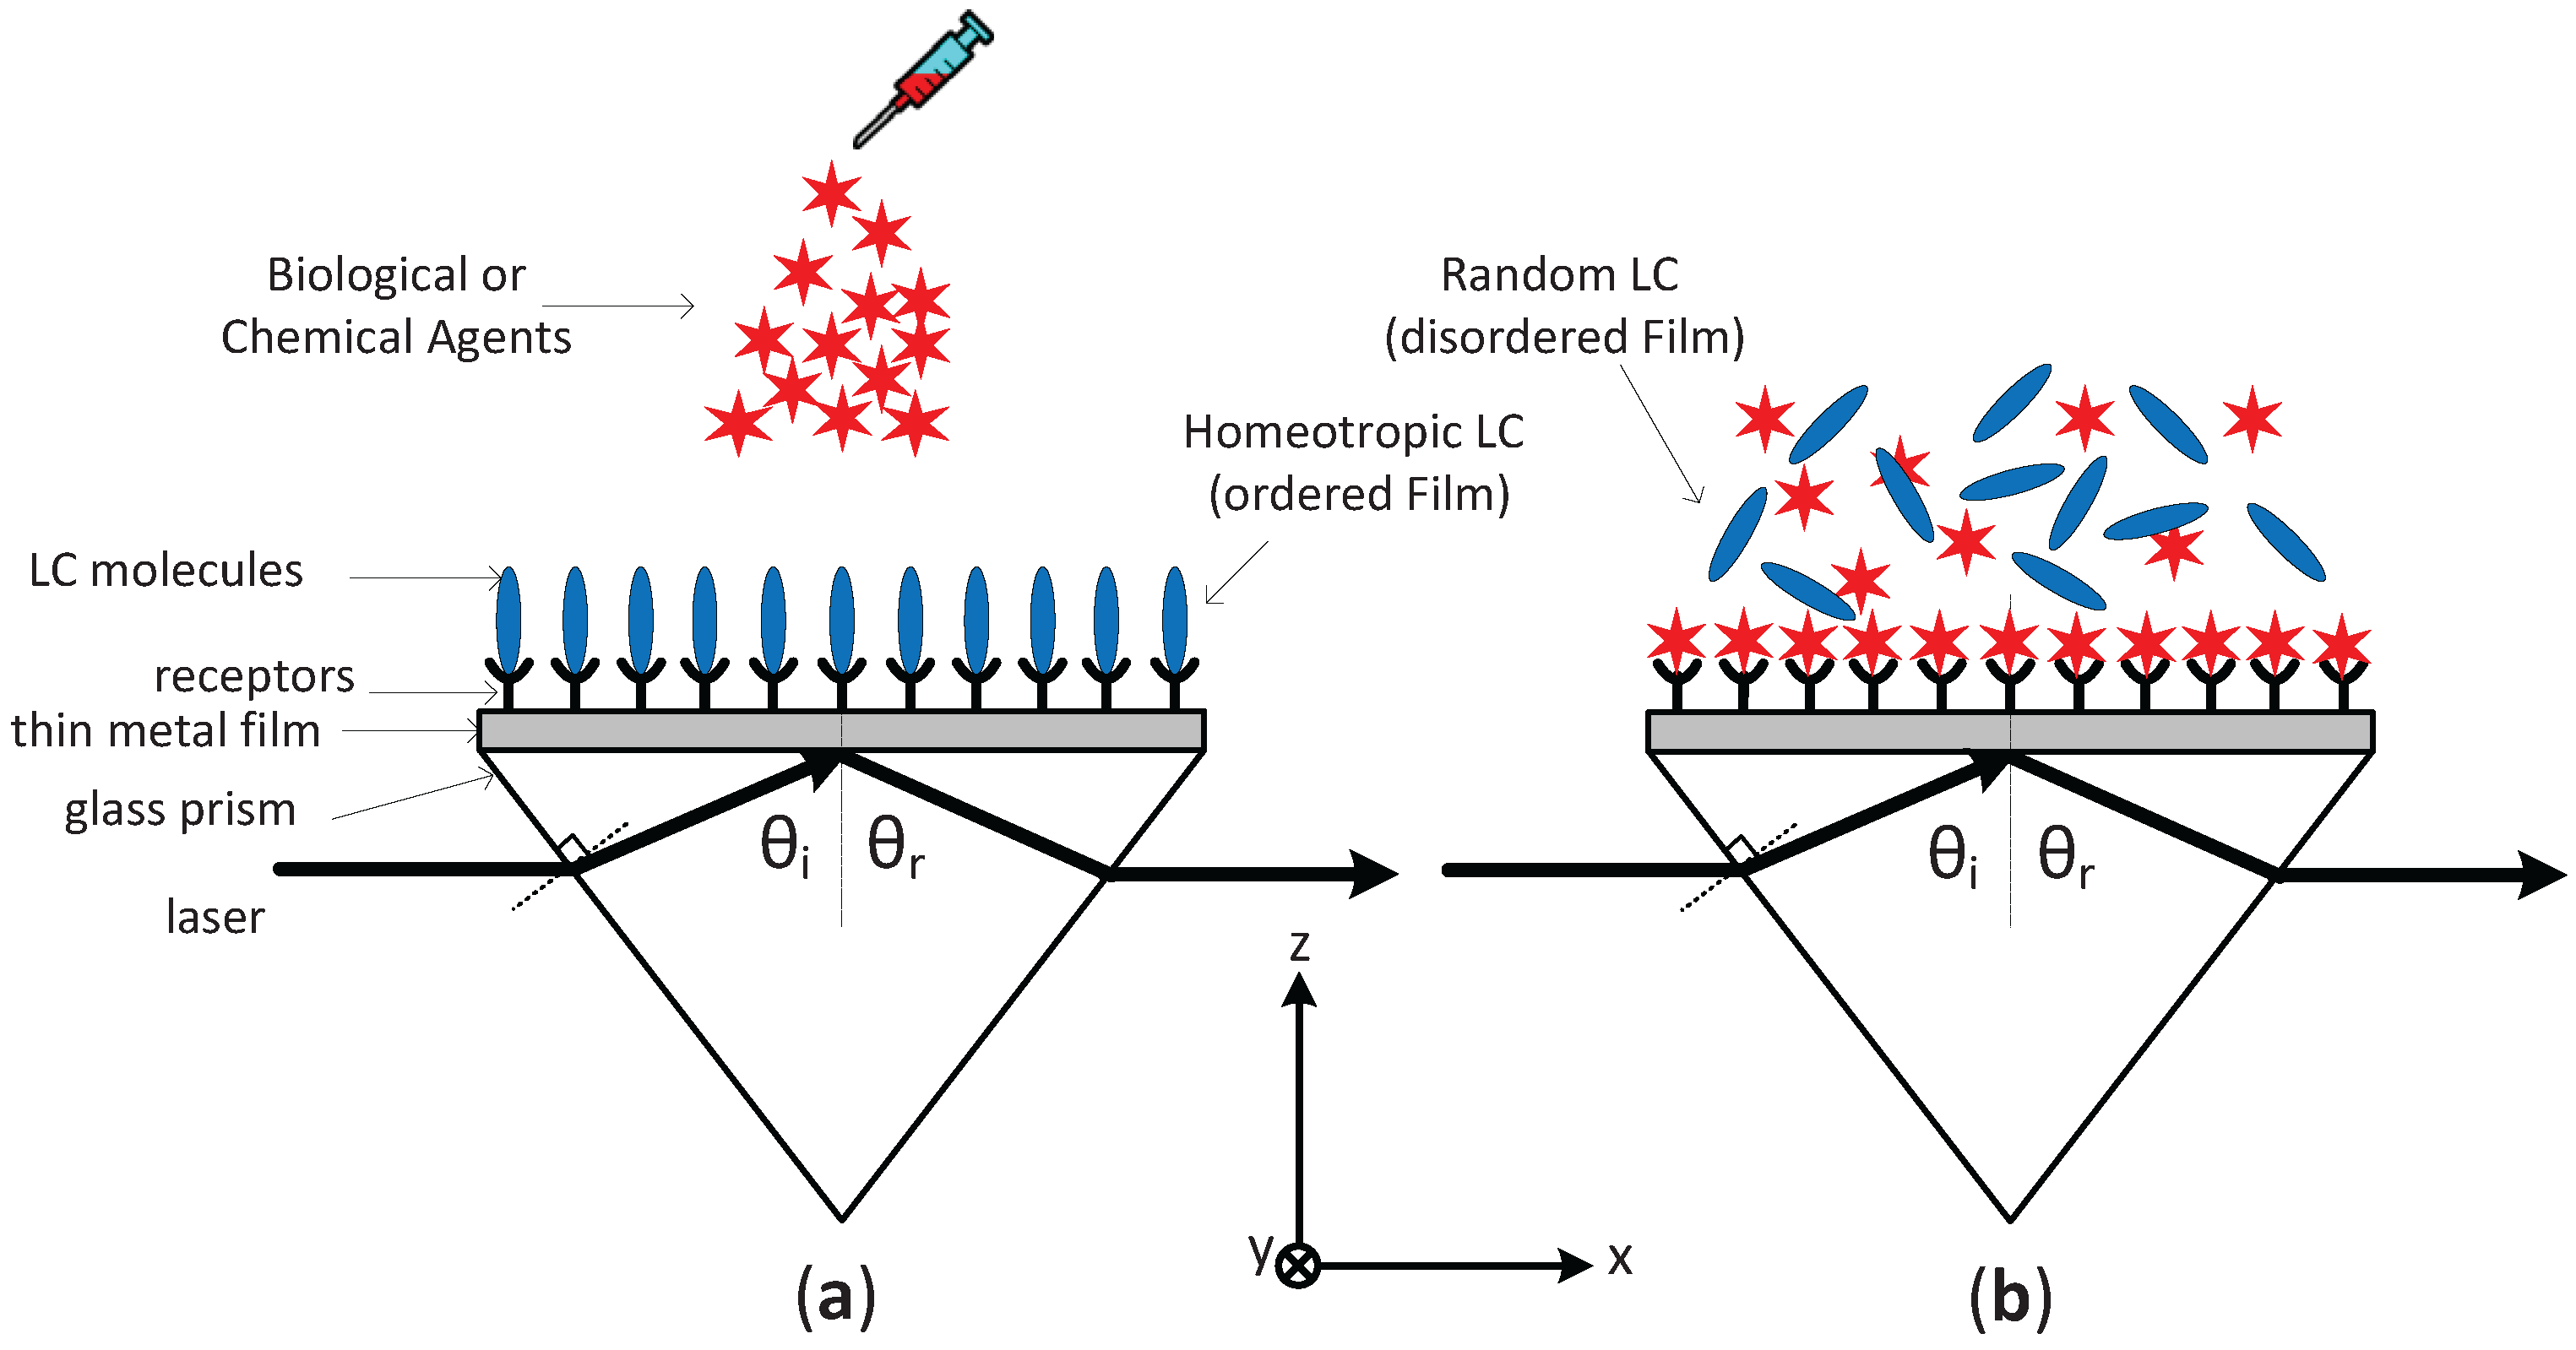
Figure 2.
Experimental setup for SPR-LC biochemical sensor.
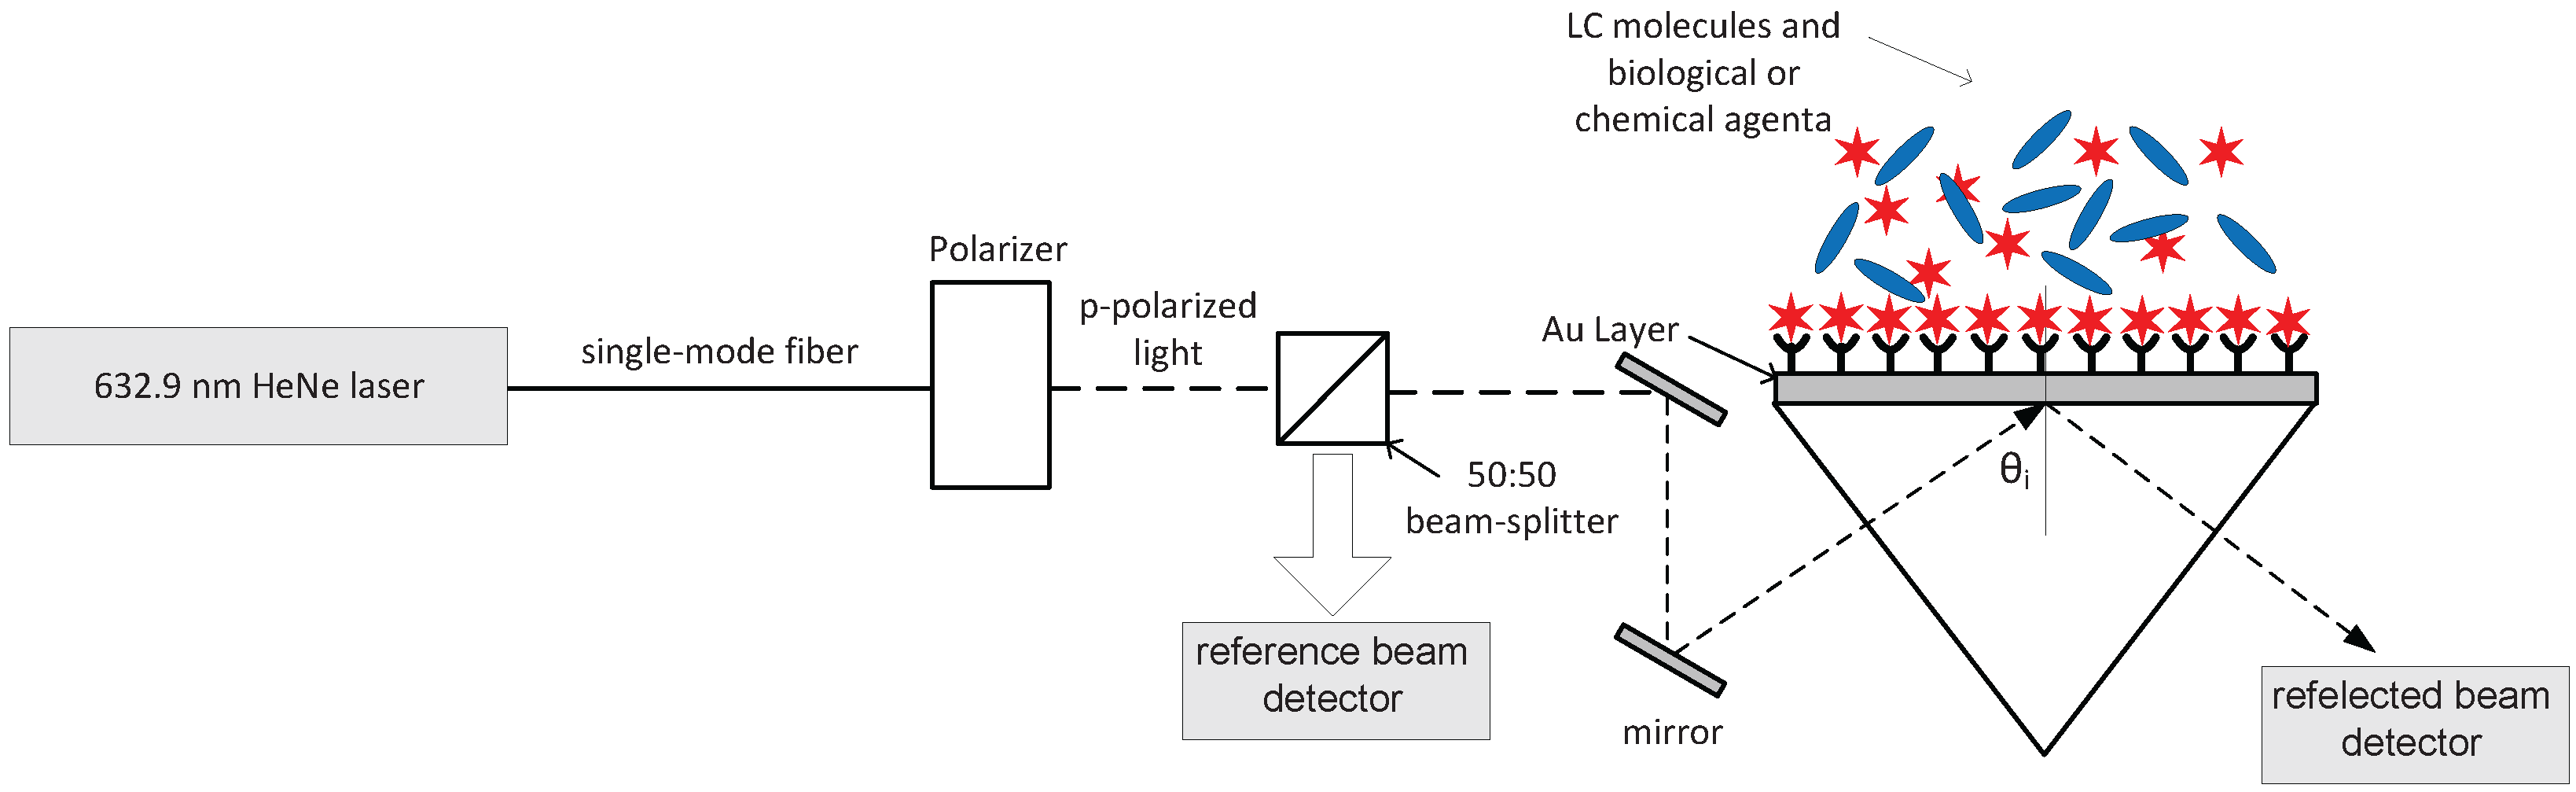
Figure 3.
Reflection Spectra with disordered , partially ordered and ordered LC film, versus the angle of incidence when the director axis is normal to the metal film (homeotropic alignment). The polariton angle shifts from to when the LC profile deforms from ordered state to disordered state.
Figure 3.
Reflection Spectra with disordered , partially ordered and ordered LC film, versus the angle of incidence when the director axis is normal to the metal film (homeotropic alignment). The polariton angle shifts from to when the LC profile deforms from ordered state to disordered state.

Figure 4.
Reflection Spectra with disordered , partially ordered and ordered LC film, versus the angle of incidence when the director axis is parallel with the metal film (homogeneous alignment). The polariton angle shifts from to when the LC profile deforms from ordered state to disordered state.
Figure 4.
Reflection Spectra with disordered , partially ordered and ordered LC film, versus the angle of incidence when the director axis is parallel with the metal film (homogeneous alignment). The polariton angle shifts from to when the LC profile deforms from ordered state to disordered state.

Figure 5.
Reflection Spectra with Ordered LC versus the angle of incidence. The polariton angle shifts from to when the director axis rotate from homogeneous to homeotropic.
Figure 5.
Reflection Spectra with Ordered LC versus the angle of incidence. The polariton angle shifts from to when the director axis rotate from homogeneous to homeotropic.

© 2017 by the author. Licensee MDPI, Basel, Switzerland. This article is an open access article distributed under the terms and conditions of the Creative Commons Attribution (CC BY) license (http://creativecommons.org/licenses/by/4.0/).
Share and Cite
MDPI and ACS Style
Abuabed, A.S.A. Study of the Effect of Nematic Order Degradation in Liquid Crystal-Based Surface Plasmon Resonance Sensors. Photonics 2017, 4, 24. https://doi.org/10.3390/photonics4020024
AMA Style
Abuabed ASA. Study of the Effect of Nematic Order Degradation in Liquid Crystal-Based Surface Plasmon Resonance Sensors. Photonics. 2017; 4(2):24. https://doi.org/10.3390/photonics4020024
Chicago/Turabian StyleAbuabed, Alaeddin S. A. 2017. "Study of the Effect of Nematic Order Degradation in Liquid Crystal-Based Surface Plasmon Resonance Sensors" Photonics 4, no. 2: 24. https://doi.org/10.3390/photonics4020024
Note that from the first issue of 2016, this journal uses article numbers instead of page numbers. See further details here.