Review

Generation of Attosecond Light Pulses from Gas and Solid State Media

by
Stefanos Chatziathanasiou
1,
Subhendu Kahaly
2,
Emmanouil Skantzakis
1,
Giuseppe Sansone
2,3,4,
Rodrigo Lopez-Martens
2,5,
Stefan Haessler
5,
Katalin Varju
2,6,
George D. Tsakiris
7,
Dimitris Charalambidis
1,2 and
Paraskevas Tzallas
1,2,*
1
Foundation for Research and Technology—Hellas, Institute of Electronic Structure & Laser, PO Box 1527, GR71110 Heraklion (Crete), Greece
2
ELI-ALPS, ELI-Hu Kft., Dugonics ter 13, 6720 Szeged, Hungary
3
Physikalisches Institut der Albert-Ludwigs-Universität, Freiburg, Stefan-Meier-Str. 19, 79104 Freiburg, Germany
4
Dipartimento di Fisica Politecnico, Piazza Leonardo da Vinci 32, 20133 Milano, Italy
5
Laboratoire d’Optique Appliquée, ENSTA-ParisTech, Ecole Polytechnique, CNRS UMR 7639, Université Paris-Saclay, 91761 Palaiseau CEDEX, France
6
Department of Optics and Quantum Electronics, University of Szeged, Dóm tér 9., 6720 Szeged, Hungary
7
Max-Planck-Institut für Quantenoptik, D-85748 Garching, Germany
*
Author to whom correspondence should be addressed.
Photonics 2017, 4(2), 26; https://doi.org/10.3390/photonics4020026
Submission received: 25 February 2017 / Revised: 25 March 2017 / Accepted: 27 March 2017 / Published: 31 March 2017
(This article belongs to the Special Issue Extreme UV Lasers: Technologies and Applications)

Abstract

:
Real-time observation of ultrafast dynamics in the microcosm is a fundamental approach for understanding the internal evolution of physical, chemical and biological systems. Tools for tracing such dynamics are flashes of light with duration comparable to or shorter than the characteristic evolution times of the system under investigation. While femtosecond (fs) pulses are successfully used to investigate vibrational dynamics in molecular systems, real time observation of electron motion in all states of matter requires temporal resolution in the attosecond (1 attosecond (asec) = 10−18 s) time scale. During the last decades, continuous efforts in ultra-short pulse engineering led to the development of table-top sources which can produce asec pulses. These pulses have been synthesized by using broadband coherent radiation in the extreme ultraviolet (XUV) spectral region generated by the interaction of matter with intense fs pulses. Here, we will review asec pulses generated by the interaction of gas phase media and solid surfaces with intense fs IR laser fields. After a brief overview of the fundamental process underlying the XUV emission form these media, we will review the current technology, specifications and the ongoing developments of such asec sources.

1. Introduction

Impressive technological achievements in the fs laser pulse engineering have led to the development of table-top Ti:sapphire laser systems which nowadays can deliver high power laser pulses with duration down to ~5 fs [1,2,3,4,5,6]. The high intensities achievable with these pulses have enabled the observation of many fascinating non-linear processes occurring in all states of matter. Among these is the process of High-Order-Harmonic (HOH) generation induced in the strong-field regime. This process, which is quintessential for in-depth understanding of the strong-field laser-matter interaction [7,8,9,10,11,12,13,14,15,16,17,18,19,20,21,22,23] led to immersive applications ranging from the field of high-resolution spectroscopy in XUV [24,25] to “Attosecond Science” [26,27,28,29,30]. HOH generation has been observed for the first time in solid-surfaces [31,32], and later in gas phase media [33,34], liquid surfaces [35], liquid crystal films [36,37], tape-like solid targets [38], bulk materials [39,40] and nanostructures [41]. Although liquid surfaces, bulk materials and nanostructures can be considered promising targets of laser-driven asec sources, to our knowledge, asec pulses with photon fluxes sufficient for applications have been experimentally demonstrated in gases (usually noble) [27,42,43,44,45,46,47,48,49,50,51,52,53] and solid-surfaces [54,55,56].
Gases and solid-surfaces are currently the most commonly used nonlinear (NL) media for the generation of asec pulses. For both NL media, the asec pulse structure is achieved by synthesizing the coherent broadband XUV radiation generated during their interaction with intense fs pulses. In gases, the XUV emission is described by the three-step model [9,10,12,13]. In solids, the coherent wake emission (CWE) [22,57,58] and the relativistic oscillating mirror (ROM) [21,59,60,61] models are used to describe the HOH generation process for driving laser field intensities in the nonrelativistic (IL λ2 < 1018 W/cm2 μm2) and relativistic domains (IL λ2 > 1018 W/cm2 μm2), respectively. In both media, trains of asec pulses are generated, when they interact with multi-cycle driving fs (>5 fs) laser fields. Isolated asec pulses are generated when the medium interacts with carrier-envelope-phase (CEP) stable few-cycle driving laser fields [27] or few-cycle fields combined with Polarization Gating (PG) [62,63,64], Ionization Gating (IG) [49,65,66] or LightHouse (LH) [67,68,69] approaches. Also, the development of PG approaches which are applicable for multi-cycle high power driving laser fields [49,64,70,71,72] led to the generation of intense isolated XUV pulses with duration <2 fs [48]. Another kind of temporal gating based on incommensurate multi-color combinations has recently led to the generation of intense isolated pulses of asec duration [50,71,73].
In gases, for driving field intensities just below the ionization saturation of the medium, the maximum generated XUV photon energy (given by the cut-off energy law E X U V λ 2 , where EXUV, λ is the XUV photon energy and the carrier wavelength of the driving field, respectively) and the output from the medium XUV photon flux (which scales with λ−5.5 [74]) depends on the carrier wavelength of the driving field [10,11], the type of the gas, the focusing geometry (which is associated with the intensity of the driving field) and the phase matching conditions used for the generation [42,75,76,77,78]. For “low” ionization potential (IP) noble gases (Xenon, Argon, Krypton) driven by high power infrared (IR) laser pulses, photon fluxes in the range of ~1011 photons/pulse have been measured for XUV photon energies up to ~30 eV [44,46,47,48,49,50,53,71], while for “high” IP noble gases (Helium, Neon) the photon flux drops by more than 4 orders of magnitude [44] and the XUV photon energy is extended up to ~150 eV. According to the cut-off energy law and incorporating the ionization saturation effects, extension of the XUV photon energies up to the water window (280–530 eV) and to the keV range requires the use of driving fields with carrier wavelengths longer than IR. This has been recently shown using driving pulses in the mid-IR spectral range [79,80]. However, due to the λ−5.5 scaling of the XUV yield the application of mid-IR determines a strong reduction of the XUV photon flux compared to the IR driving pulses. Increasing the XUV photon flux in gas phase media using larger scale IR laser systems (e.g., in the PWatt range) is in general a complicated issue as it requires extremely loose focusing geometries in order to avoid the ionization saturation effects of the gas medium which are taking place in the intensity range of IL ~ 1014–1015 W/cm2. Nowadays, using CEP stable few-cycle IR driving fields in gas phase media, “low” intensity (intensities which are not sufficient to induce non-linear processes) isolated asec pulses with duration <150 asec can be routinely generated in the 20–100 eV photon energy range [63,80,81], while mid-IR laser driven sources look very promising for efficient generation of isolated asec pulses in the water-window spectral region and duration in the range of atomic unit of time [79]. For studies in the asec time scale using non-linear XUV processes “high” intensity (intensities which are sufficient to induce non-linear processes, e.g., IXUV > 1011 W/cm2) asec pulses are required. “High” intensity trains and isolated asec pulses of duration <700 asec are currently generated in the 15 eV–35 eV photon energy range [45,46,47,48,50] using high power multi-cycle IR driving fields, while recent progress on the enhancement of the XUV photon flux led to the observation of non-linear process in atoms using XUV radiation in the ~60 eV photon energy range [51,52]. Although there is a lot of ongoing development in this direction, gas-phase is considered as the main asec source which led to impressive progresses in the field of ultrafast extreme ultraviolet (XUV) spectroscopy and of asec science with a broad range of fascinating applications in all states of matter.
In solids, there is no limitation on the intensity of the driving field which can be used for the generation of the XUV radiation. The higher the intensity of the driving field on the target, results to higher XUV photon flux and higher photon energies. This is the main advantage of the solid surface media compared to all other laser-driven XUV sources. The other unique advantage of HOH from solid surfaces is that it provides a metrology tool to investigate ultrafast plasma dynamical processes, which is otherwise inaccessible experimentally [82,83,84,85,86]. Theoretical predictions [83] show that using ~5 fs IR laser pulses with intensity on target in the range of IL ~ 1020 W/cm2, pulses of duration ~200 asec in the ~60 eV photon energy range can be generated with conversion efficiency ~10−1 (~1015 photons/pulse), while the generation of ~5 asec pulses in the keV photon energy range can take place with conversion efficiency ~10−4 (~1011 photons/pulse). Although these predictions constitute the solid surfaces as one of the most promising XUV asec sources, challenges experimental obstacles associated mainly with the stringent requirements on properties of the focused IR driving field (like the laser pulse peak to background contrast both spatially and temporally) and target technology (like the availability of the surface quality and the mechanical stability for the entire number of laser shots) did not yet allowed the sufficient progress to materialize experimentally the full potential of this approach leading to the observation of the optimum predicted values. Up to now, XUV frequency combs (generated with measured conversion efficiency in the range of ~10−6–10−4 [54,55] and coherent continuum XUV radiation have been measured in the photon energy range of ~12–40 eV using multi- and few-cycles driving IR laser fields [67,87,88]. The emission of photons in the keV energy range [89] has been measured using the Vulcan PWatt laser system at Rutherford Appleton Laboratories [90]. Although these spectra can support the formation of asec pulse structures, the asec temporal localization has been measured directly only in the XUV energy range of ~12–20 eV [54] where the CWE harmonic generation mechanism is dominating. Additional experimental evidence that CWE harmonics have asec structure has been demonstrated in Refs. [67,91]. Due to the experimental obstacles mentioned before, the solid surface harmonics as a robust asec source (that can be utilized for further experiments) is still in the development phase and applicability up to now is mainly dedicated to the studies of the ultrafast dynamics of laser-plasma interaction [82,83,84,85,86]. Nevertheless, recent experiments performed in the non-linear XUV regime [54,92] and recent progress in the laser pulse engineering and solid target technology [5,6,35,36,37,67] verifies the feasibility of using solid surface harmonics in ultrafast XUV spectroscopy and attosecond science.
The present manuscript is organized in the following way: in Section 2, we provide a brief overview of theoretical description of the XUV emission from gases and solid surfaces. In Section 3, we review on the current technology used for the development of the asec sources. In Section 4, we discuss the approaches used for the characterization of XUV radiation and we will conclude in Section 5 with the ongoing research on gas-phase and solid-surface asec sources.

2. Theoretical Description of the XUV Emission from Gases and Solids

The asec pulse structure in gases and solid surfaces is achieved by their interaction with intense fs pulses. In both media, trains of asec pulses are generated, when they interact with multi-cycle driving fs (>5 fs) laser fields. This is because a single sub-fs burst of broadband continuum XUV radiation is emitted periodically (in gases, the process is repeated twice and in solids once per laser cycle) during the interaction with the driving laser field. As the process is periodic, the emitted spectrum consists of well confined harmonic peaks, which in the time domain can result in a train of asec pulses. Isolated asec pulses are generated when the medium is steered to emit XUV radiation only once during the driving laser pulse. In this case, the emitted XUV spectrum is a broadband continuum which in the time domain can result in an isolated asec pulse.

2.1. XUV Emission from Gases

2.1.1. Single Atom Response

The principle of asec pulse generation is illustrated in Figure 1. Briefly, by focusing an intense (with IL ~ 1014–1015 W/cm2) linearly polarized multi-cycle fs laser pulse into a gas-phase medium, an XUV frequency comb, which consist odd harmonics of the driving frequency, is emitted in the direction of the laser field (Figure 1a). Due to the non-linearity of the harmonic generation process the divergence of the XUV beam is smaller compared the IR driving field. In appropriate phase matching conditions (atomic and macroscopic response) the phase locking between the harmonics leads to the formation of an asec pulse train. A band pass XUV filter arrangement can be placed at the XUV beam path in order to remove the IR beam and to select the wanted harmonic bandwidth.
The theoretical approach which describes the HOH generation process is the classical (where laser field and electron are treated classically) [9] and semi-classical (where the laser field is treated classically and the atom/electron quantum mechanically) three-step model [10,13]. The model has been recently extended to the full quantum mechanical region (where the laser field is treated quantum mechanically) taking into account the back-action of the strong-field laser–atom interaction on the driving IR laser field [15,16]. Although an accurate description of the HHG process requires the consideration of the laser bandwidth and the propagation effects in the medium, the fundamental properties of the interaction can be adequately explored with the single-color single-atom interaction. According to the three-step model, the electron tunnels out from the atomic potential distorted by the laser field, then accelerates in the laser field from which it gains kinetic energy and then it may recollide elastically or inelastically with the parent ion (upper panel in Figure 1b). The non-recolliding electrons and the electrons that recollide elastically with the parent ion are contributing to the ATI spectrum, while the inelastic recollision leads to the generation of HOH (electron recombines with the ion emitting a photon) and multiple charge ions (for example via non-sequential double ionization).
According to the 3-step model (down panel of Figure 1b), in the first step the electron enters the continuum at t = ti (ti is named ionization time which takes places during the half cycle of the driving field, i.e., ti < TL/2 and TL is the period of the driving cycle of the driving laser field) with a tunneling rate Γ(ti) which can be found by the PPT-ADK theory [93,94]. Each electron trajectory in the continuum is defined by the ionization time ti and is weighted by the corresponding tunneling rate Γ(ti) which depends on the field E(t) = −∂A(t)/∂t (A(t) is the vector potential) at the moment of ionization ti. The motion of the electron in the continuum starts with zero initial velocity (v(ti) = 0) at a distance (ti) = |IP|/|eE(ti)| (IP is the ionization potential of the atom) which is much smaller compared to the length of the electron trajectory in the continuum and thus can be ignored, i.e., x(ti) ≈ 0. We note that the dipole approximation is made for the E(t) and A(t) to be independent of the spatial coordinates [10,13]. In the second step the electron gains kinetic energy from the driving field. Neglecting the influence of the atomic potential, the momentum of the electron in the continuum is p(t) = pieA(t) (where pi = eA(ti) is the drift momentum). The third step corresponds to the case where the electron recollides at tr with the parent ion. Ion and electron are then recombined towards XUV emission.
At tr (with ti < tr < TL), the position of the electron with respect to the nuclei is x(tr) ≈ 0 (where x ( t ) = e m [ ( t t i ) A ( t i ) t i t A ( t ) d t ] is the trajectory of the electron in the continuum) and the kinetic energy is Kr = p2(tr)/2m = e2 [A(tr) − A(ti)]2/2m. Maximizing Kr with respect to ti can be obtained that for ωti = 108° and ωtr = 342° the maximum recollision energy is K r ( max ) = 3.17 Up (Up is the ponteromotive energy of the electron). The photon energy of the emitted XUV photons is the sum of the electron kinetic energy and the binding energy of the atom, i.e., ħωXUV = IP + Kr. As the recollission process takes place every half cycle of the driving field, the emitted spectrum is an XUV comb which consists of only odd harmonic peaks (blue filled area in the down panel of Figure 1c). The spectrum depicts a plateau region (where the XUV yield is approximately constant) which is extended up to a cut-off region (where there is a rapid reduction of the XUV yield) where the photon energy is ħωXUV = IP + 3.17 Up.
The semi–classical description of the three-step model which introduces in the recollision picture to the quantum mechanical tunneling effect, allows the extension of the classical electron trajectories to the quantum mechanical orbits and provides access to quantum interference effects taking place during the recollision process. In this context the harmonic spectrum is obtained by the Fourier transform of the time-dependent dipole moment which contains an integral over all possible electron trajectories characterized by ionization time (ti), recombination time (tr), and momentum p. Using a saddle-point analysis it can be shown that, for a given driving laser intensity IL, there are two interfering quantum [95,96,97,98,99] electron trajectories (the “Long” and the “Short” noted as L and S in the down panel of Figure 1b) with different flight times τ q L ( I L ) = t r L t i L (with τ q L T L ) and τ q S ( I L ) = t r S t i S (with τ q S T L / 2 ) dominating the emission of a given harmonic order q in the plateau region of the spectrum. The two paths degenerate to a single one (noted as C in the down panel of Figure 1b) for the harmonics laying in the cut-off region of the spectrum. The phase of each harmonic order q results from the phase accumulated by the electron trajectory in the continuum (which can be approximate by τ q L , S U p = a q L , S I L ) and the phase (ωqtr) introduced by the recombination time measured with respect to the reference time of the laser period (upper panel of Figure 1c), i.e., φ q L , S ω q t r L , S + τ q L , S U p . The green solid line in the down panel Figure 1c shows the harmonic spectral phase distribution calculated using the semi-classical 3-step model. It is evident that the harmonics generated in rare gases have an inherent linear chirp (which is positive for the S- and negative for the L-trajectory harmonics) due to the lack of synchronization during their generation process. Quantitatively, for a superposition of the harmonics this can be expressed as a quadratic dependence of the relative spectral phase on the harmonic frequency, i.e., for the qth harmonic the corresponding spectral phase is given by φ q L , S ( ω q ) ( q q 0 ) 2 ω L 4 Δ t r L , S , where Δ t r L , S is the temporal drift (harmonic chirp) between harmonics and q0 is the first harmonic used in the superposition towards the formation asec pulse structure (detailed discussion on this matter can be found in Ref. [100].

2.1.2. Generation of Asec Pulse Trains

Taking into account the spectral phase distribution shown in the down panel of Figure 1c, the synthesis of a harmonic comb produced by the “Long”- and “Short”-trajectories can result to an asec pulse train structure. However, for the generation of asec pulses the “Long”-trajectory harmonics are usually minimized due to the lack of their temporal confinement. The pulse broadening of the “Long”-trajectory harmonics is associated with the long traveling time and the spread of the electron wave packet in the continuum which is strongly influenced by the spatiotemporal and shot-to-shot laser intensity variations in the harmonic generation medium [97,100,101]. This is evident from the strong influence of the “Long”-trajectory harmonics on the gradient forces [102] in the harmonic generation medium, which leads to beams of larger divergence compared to the harmonic beam generated by the “Short”-trajectories [103]. The reduction of the contribution of the “Long”-trajectory harmonics in an XUV beam, can be achieved using appropriate phase matching conditions in the generation medium (e.g., focusing the IR beam before the gas medium) [104] and spatial filtering approaches (e.g., apertures placed at the XUV beam path). Nevertheless, recent studies on this matter have shown that the “Long”-trajectory harmonics driven by a two-color field can highly benefit the properties of the XUV pulses through the enhancement of the harmonic yield and the control of the spectral phase distribution. The latter can be achieved by changing the relative phase and the intensity ratio between the two colors in the two-color driving field [105,106].

2.1.3. Generation of Isolated Asec Pulses

Isolated asec pulses can be generated when the XUV emission is restricted to occur within half cycle of the driving field. In this case a single recollission in an atomic ensemble leads to the emission of a single XUV burst with continuum spectral power distribution (illustrated with black solid line in the down panel of Figure 1c) and the shortest duration of the asec pulse is limited by the XUV spectrum passing though the band pass XUV filter. Isolated pulses can be produced using (I) part of the continuum XUV radiation emitted using single-cycle driving laser fields [83]; (II) the cut-off region of the quasi-continuum XUV spectrum emitted using few-cycles driving laser fields [29]; (III) part of the continuum XUV radiation emitted using few-cycle driving laser fields in combination with PG approaches [62,63]; (IV) part of the continuum XUV radiation emitted using few-cycle driving laser fields in combination with IG approaches [63,65,66] part of the continuum XUV radiation emitted using multi-cycle driving laser fields in combination with LH approaches [67,68,69] and (V) part of the continuum XUV radiation emitted using multi-cycle driving laser fields in combination with PG approaches [49,64,70,71,72,107]. In all cases the stability of the CEP of the laser system is a decisive matter, while if this is not possible (as in the case of high power multi-cycle laser systems), approaches for selecting single asec pulses by shot-to-shot measuring the CEP value are required [71,108].

2.1.4. Macroscopic Effects in HHG

The high harmonic radiation that we observe experimentally is a superposition of the elementary contributions from the single atoms interacting with the laser pulse. To describe this macroscopic effect one needs to consider the three stages of what is happening in the gas medium. (i) The first stage is the propagation of the driving pulse in the ionized medium—the gas atoms at different spatial points experience different driving fields. As the driving pulse changes both in space and time (since it is finite in both dimensions), and through ionization it modifies the medium it propagates through, to describe this stage requires a full 3D modeling; (ii) in the second stage the propagated electric field locally interacts with the gas particles, and high harmonic radiation is generated. This can be described in the single atom response described in Section 2.1.1; (iii) finally, the elementary radiations add up to produce the macroscopically observable radiation. In this stage the different propagation velocities of the generating (usually IR) and generated (usually XUV) pulses affect the output of the interaction. As the single atom response have been described in Section 2.1.1, here we revisit in more details the propagation stages (i) and (iii).
Distortions of the laser pulse in the gas medium: As the generating pulse propagates, its temporal evolution changes. As HHG is a highly nonlinear phenomenon, even a small change in the driving field might affect the generation severely. There are various effects to consider [109]:
  • Linear effects: during propagation even linear dispersion causes a temporal stretch of the broad bandwidth laser pulse. Due to diffraction/focusing (and HHG is usually achieved in a focusing arrangement) the intensity distribution changes both along propagation, and in the transverse plane, affecting both the amplitude and the phase of the generated radiation.
  • The high intensity laser beam evokes the Kerr-type non-linear refractive index of the generating medium, leading to self-focusing of the beam, and a blue-(red) shift on the rising (falling) slope due to self-phase modulation.
  • Due to the ionization of the medium by the driving field, the presence of free electrons modifies both the linear and non-linear properties of the medium. This can even result in defocusing of the beam.
At the onset of the laser pulse it enters a neutral medium. As the intensity increases on the optical cycle level, ionization events become more probable, and the following parts of the laser pulse now propagate through an ionized medium. In each half-cycle of the laser field new ionization events occur, thus the propagation conditions vary during the evolution of the pulse [109]. Using the now available ultra-intense laser pulses, multiple ionization of the medium can be achieved, yielding a very strong contribution of the electrons to the refractive index. The ionization fraction depends on the local intensity, and has a spatial variation, leading to diffraction, defocusing or refocusing of the laser beam. The balance between focusing and defocusing of the generating beam determines the intensity of the radiation, thus the ionization fraction, thus the focusing/defocusing effects. The proper description of the propagation requires an iterative process [76,110].
Ionization which depends locally on the spatial and temporal position, will affect the laser pulse propagation and the intensity at the succeeding spatial and temporal points, creates a highly non-trivial spatio-temporal coupling in the laser pulse propagation and hence the high harmonic generation process.
Phase matching aspects of high harmonic generation: It is well known in nonlinear optics, that the generation of new frequency components is only effective if the phase velocity of the fundamental field and that of the generated radiation can be matched over the length of the generating medium. In case of HHG there are multiple components of the phase velocity to be considered. The contributions, with respect to c (speed of light in vacuum) are:
  • Neutral dispersion—for XUV spectral domain negative, for IR components it is positive.
  • Plasma dispersion—it is always negative, and scales as λ2, so IR is effected more. Since ionization fraction varies in space and time, this contribution is also varying.
  • Gouy phase shift—affects the focused IR beam, there is a negative contribution as we go from before focus to after focus.
  • Dipole/atomic phase—proportional to the intensity of the IR field, and depends on whether the generation occurs via the short or long trajectory. As the driving field intensity is space and time dependent, this component also varies spatiotemporally.
Due to temporal variations of the above mentioned phase matching contributions, phase matching may lead to temporal gating of the produced radiation. This effect was observed, e.g., in [111].
Phase matching scenarios for high power laser pulses: The available laser power has grown so much in the last 10 years, that today the main question is how can we utilize these powerful lasers to generate the brightest asec pulses. Simply using more powerful laser pulses does not guarantee the generation of more powerful asec pulses. This is mainly due to the macroscopic effects arising during the high-order harmonic generation process but also to the depletion of the generating medium. The most important limiting effects are the distortions of the laser pulse, and ineffective phase matching, which can both significantly reduce the intensity of the generated asec pulse.
Spatial and temporal distortion may also lead to effective phase matching via “stabilizing” the pulse intensity during propagation in the target gas.
(a)
Long (few tens of cm scale), low pressure (few mbar) target: Scaling up high order harmonic generation by increasing driving laser powers in the low density target regime has been investigated thoroughly in [99,112]. Phase matching conditions by balancing the effects of Gouy phase shift, neutral and plasma dispersion provides scaling principles. It has been found, that for this low ionization regime increasing laser powers requires the up-scaling of the geometric parameters (focal length, target length) and downscaling the target pressure. In this phase matching regime today’s state of the art laser pulses will require focusing of several tens (to a hundred) meters and gas target lengths of tens of centimeters (to meters).
(b)
Short (mm scale), high pressure (tens to thousands of mbar) target: Generating intense XUV radiation by intense laser pulses can also be achieved in a different phase matching regime, using high density short gas targets (jets) [113]. In this case the required focal lengths are somewhat shorter (few to ten meters), leading to higher intensity in the target. This means that the target will be ionized stronger than in the previous case, but due to the shorter medium length the distortion of the laser pulse can be reduced. The high number of interacting atoms, required to achieve a high XUV flux, in this case is confined in a small volume.
(c)
Quasi phase matching: Various quasi phase matching techniques have been applied for gas HHG to reduce the phase mismatch naturally accompanying the nonlinear process see [114,115] and references therein. In these arrangements either the target or the propagating laser beam is periodically modulated (by means of successive gas targets, propagation of the beam in a modulated waveguide or superposing a secondary modulating laser beam counter- or perpendicularly propagating with the generating laser pulse).
The macroscopic conditions to generate intense XUV pulses via gas HHG are being investigated in many laboratories. Direct comparison of the different methods is usually not possible in a single laboratory, due to practical reasons. The efforts to reach optimum conditions, often puts severe requirements on the realization of the proposed setup: to reach interferometric stability in an arrangement several tens of meters long, or reaching a target pressure of several bar in ideally vacuum environment is technically challenging. Solving these issues promises to reach few-μJ level XUV pulses paving the way to nonlinear XUV optics.

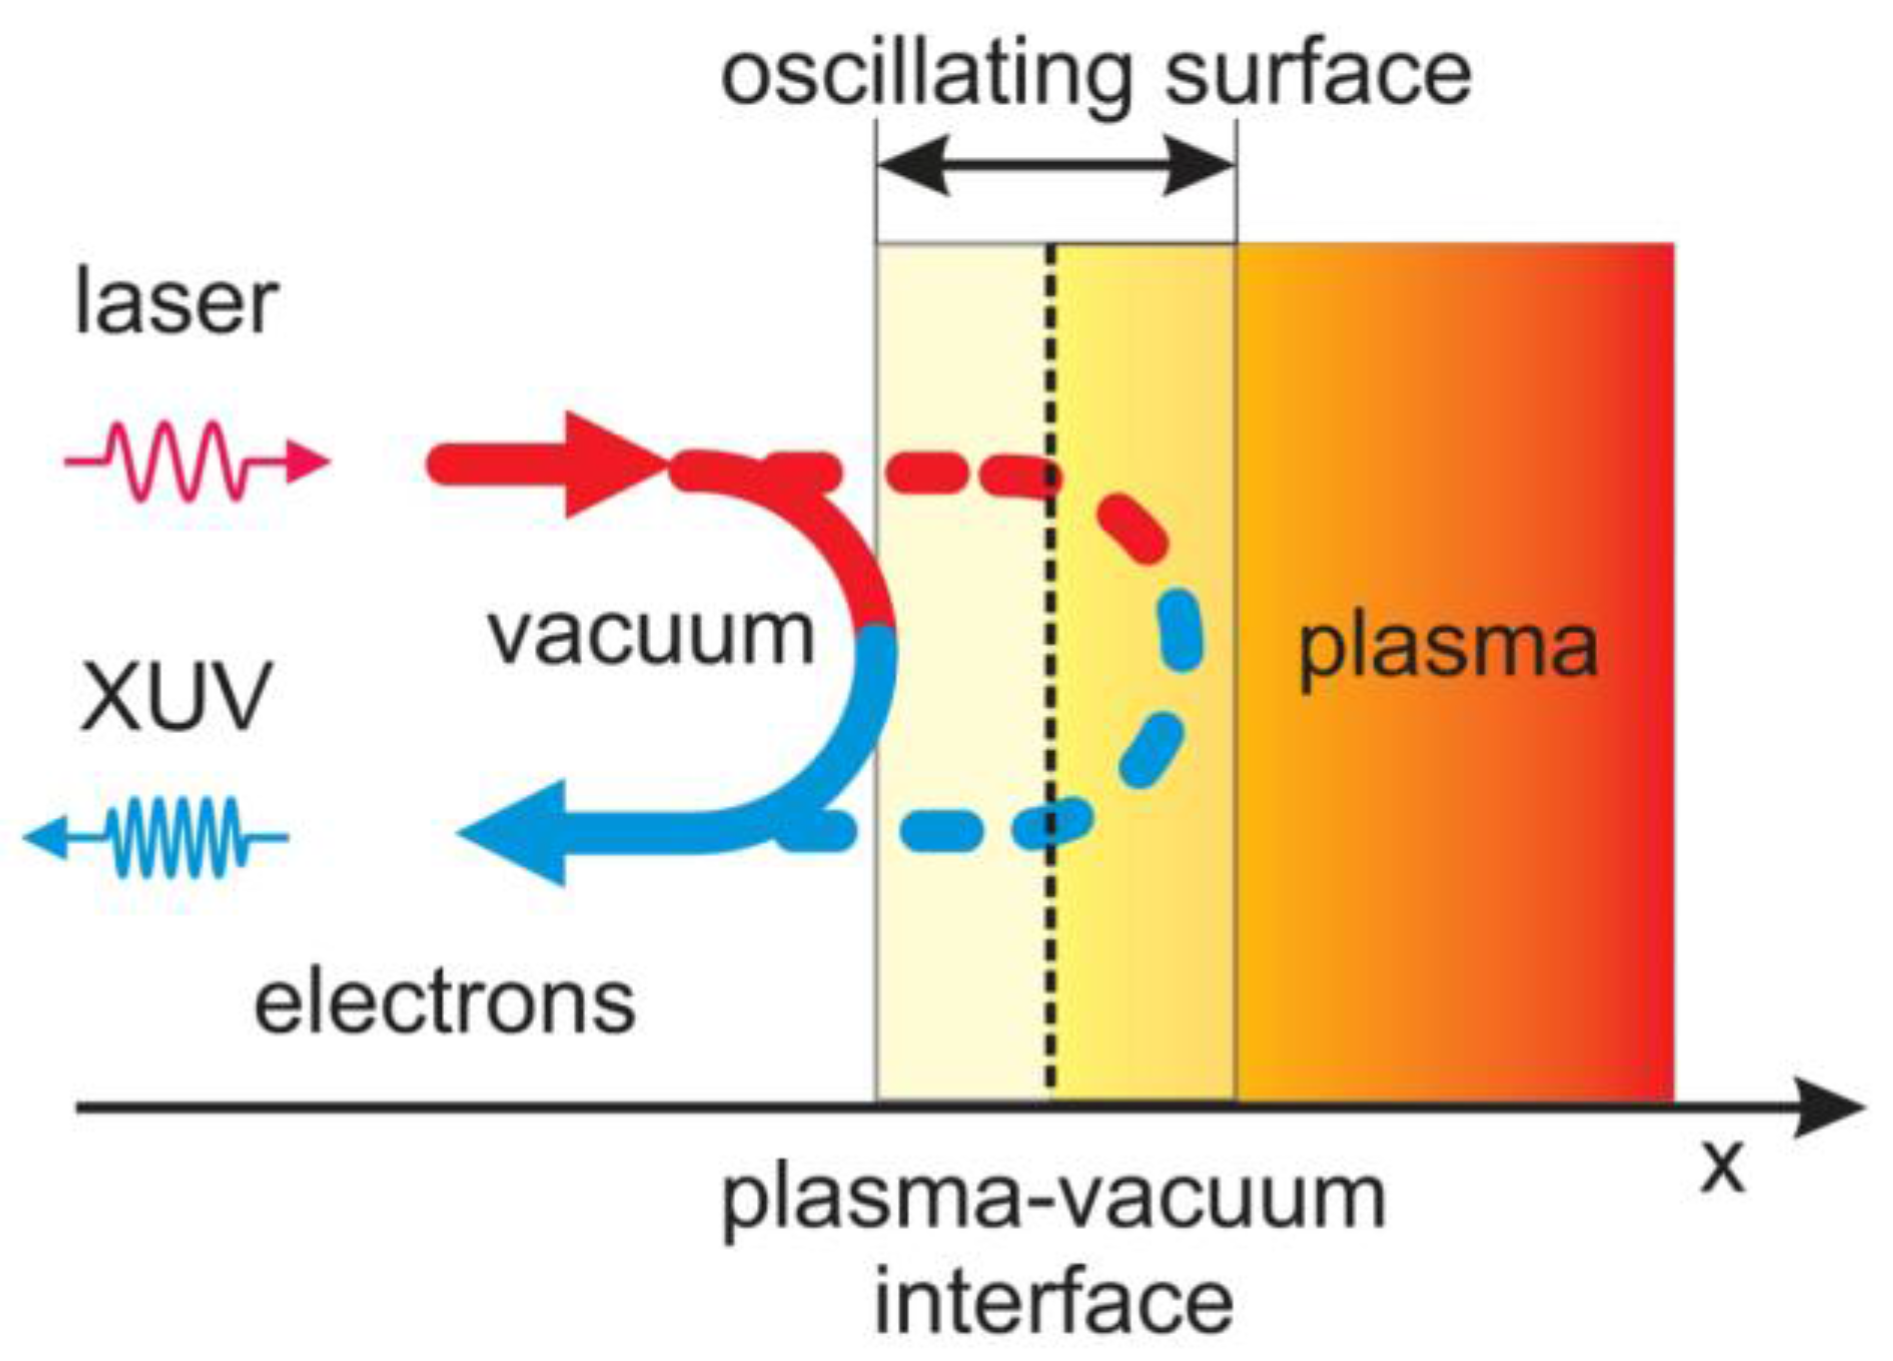
2.2. XUV Emission from Solid Surfaces

In this section there will be a short account of the theoretical models that have been introduced to describe the process of harmonic generation in the interaction of intense laser pulses with solid targets (extend description can be found in [20]).
The plasma vacuum interface, holds the promise of substantially increasing the number of photons carried away even in single asec bursts [87]. This medium for the conversion of short optical pulses into asec pulses via harmonic generation appears to be attractive for two main reasons: it provides higher conversion efficiencies and it does not exhibit a limit to the maximum laser intensity that can be used.
The modeling of the high harmonic generation in the intense laser pulse solid target interaction has been the object of a number of reports over the years. Some theoretical models proposed describe the experimentally observed features of harmonic generation mechanism quite successfully. It appears however, that one should treat different intensity regimes separately because the underlying process is different. For relatively low laser intensities the so-called coherent wake emission mechanism (CWE) dominates [22,57,58]. It has been recently demonstrated that the harmonic emission emanating in this regime from the interaction of intense laser pulses with solid-density plasma leads indeed to temporal bunching with asec pulse durations [54,67,91,116]. At higher intensities, the relativistic oscillating mirror (ROM) mechanism becomes dominant [21,59,60,61]. The delimitation between the two mechanism is usually based on the normalized vector potential aL value, which in terms of the focused laser intensity IL and laser wavelength λL is given by a L 2 = I L   λ L 2 / [ 1.38 × 10 18   W / cm 2   μ m 2 ] . The ROM mechanism prevails when aL is larger than unity, while for a L 1 the CWE mechanism is considerably more efficient. In the transitional range, the two processes can coexist and which one of the two dominates depends sensitively on the gradient of the plasma density profile [117,118]. Due to its superior properties and predominance at high intensities, the basis for the generation of single asec light pulses [87,119] will most probably be the ROM mechanism. More recently, theoretical work has revealed that, under certain conditions, another mechanism can dominate and produce harmonic radiation with superior efficiency [120,121,122,123,124,125]. In this mechanism dense electron nanobunches are formed at the plasma vacuum boundary giving rise to XUV radiation by coherent synchrotron emission (CSE). Simulations have shown that the dynamical evolution of the plasma filaments during the relativistic laser-plasma interactions allow the formation of such dense electron nanobunches on ultra-fast timescales. These charges accelerated by the strong fields of a relativistically intense laser pulse result in the generation of CSE extending to the x-ray regime. In what follows, the main features of the two most well-known mechanisms are described.

2.2.1. The Coherent Wake Emission (CWE) Mechanism

The basic idea of this mechanism is depicted in Figure 2. The harmonic generation takes place in the bulk of the plasma profile existing in front of the solid target [22,57,126]. By aiming the E-field component perpendicular to the target with obliquely incident, p-polarized laser pulse launches electrons into the vacuum (Brunel electrons [127]). Depending on the E-field phase during the injection some of these energetic electrons are hurled back into the plasma during the second half-cycle of the laser period and form bunches that pass through the density ramp. In their passage, they excite resonantly plasma oscillations at positions within the density gradient where the plasma frequency ωp satisfies the condition: ωp = L, with q an integer number. At these points, the plasma waves undergo linear mode conversion into EM-waves at harmonics of the fundamental laser frequency via inverse resonance absorption [128].
The conversion process is nearly linear and dominant at moderate laser intensities. There are a couple of distinctive features associated with this mechanism of harmonic generation. The most important is that there is a distinct cut-off. This is easily seen, since only those harmonics at whose frequency plasma oscillations can be excited and sustained in the plasma ramp in front of the solid target, are being produced. This means that the highest generated harmonic by the CWE does not depend on the laser intensity but rather on the properties of the target material. If the maximum plasma density available during the interaction is nmax,e then the highest harmonic produced is q c u t o f f = n m a x , e / n c with nc the plasma critical density for the given laser frequency. This property has been exploited in the autocorrelation experiment described in Ref. [54].
The CWE generated harmonics possess in general an intrinsic chirp which has to be sought in the details of the generation mechanism. For example, the higher the harmonic the deeper the location into the plasma ramp where it is at resonance with the local plasma frequency. This path difference leads to so called “atto” chirp between the individual components of the emitted spectrum. It has been estimated that the total phase difference accumulated by the qth harmonic varies as Δϕqq3 (see Ref. [54]).
Besides the chirp coming from the different emission depths of different frequencies, the so called atto-chirp, there is a second chirp intrinsic to CWE generation process, the so-called harmonic-chirp, introducing phase fluctuations within the single harmonics. It originates from the varying time of the occurrence of electron bunches within the plasma. The relative timing of these bunches depends on the instantaneous intensity of the laser pulse. Those electrons expelled at the peak of the laser pulse have longer excursion times, while those at the rising and falling edge shorter. There is thus a variation of the relative emission times by fractions of an optical cycle of the driving laser pulse, with the relative emission time increasing at the beginning and then decreasing at the end of the pulse. The deviation from strictly periodic emission leads to effects ranging from simple broadening to the splitting of the harmonics and appearance of multi-peaks spectrum. As expected, the effect is more pronounced for few-cycle laser pulses than for multi-cycle ones [58,91].

2.2.2. The Relativistic Oscillating Mirror (ROM) Mechanism

An intuitive nevertheless very useful model that provides insight into the mechanism of high harmonic generation in solid targets for laser intensities aL 1.0 is the so called relativistic oscillating mirror model. It was first proposed by Bulanov et al. [129] and later formulated and developed in detail by Lichters et al. [60]. The basic idea of the model is rather simple and is schematically shown in Figure 3. According to this model, the up conversion of the laser pulse light is due to the Doppler shifted reflection off a moving at relativistic speed surface.
It assumes that the electrons at the plasma vacuum interface reflect the incident light while executing forced oscillations near the edge of an immobile step-like ion background. The oscillatory term F p ( t ) I L λ L 2 sin ( 2 ω L t ) due to the v × Β term of the Lorentz force of the incident laser pulse, drives these oscillations. Charge separation and corresponding electrostatic fields give rise to the restoring force. As it has been pointed out by Lichters [60], one of the main reasons for the rich harmonic content in the reflected pulse is the retardation effect between a point of reference (observer) and the electron interface on which the incident wave is reflected.
More recently, a number of reports have provided very important additional insight in the theoretical aspects of the model and additional predictions have been derived [21,130,131,132]. The most notable prediction that was deduced in rather general terms is that the harmonic spectrum exhibits a universal scaling for the roll-off in power law form I(ω) ∝ ω−q with q ≈ 5/2 [130]. It was also shown that the harmonic spectrum extends up to a maximum cut-off frequency ω c o 4 γ m a x 2 ω L where ωL is the incident laser frequency and γmax denotes the relativistic γ-factor corresponding to the maximum velocity at which the mirror moves towards the incoming light. The factor 4 γ m a x 2 relates to the basic underlying mechanism which is Doppler shifted backscattering of light on a relativistic mirror. It should be pointed out here that these very important predictions of the ROM model have been confirmed not only in 1D-PIC simulations [82,130] but also in experiments [89,133]. Subsequent reports derived a more accurate exponent for the power-law (q ≈ 8/3 instead of q ≈ 5/2) and for the actual cut-off frequency ω c o γ m a x 3 beyond the power-law roll-off [21,132]. Of late comprehensive semi-analytical models that take into account realistic experimental scenarios while working over a wider parameter space [134,135] have been proposed revealing correlation of different HOH regimes.

2.2.3. Particle-in-Cell (PIC) Simulations

Particle-In-Cell codes are well established tools for kinetic treatment of a number of topics related to the interaction of high intensity pulses with plasmas. They self consistently treat the underlying physical processes albeit for a reduced number of dimensions, in most cases in one. Despite this shortcoming, they have helped to understand some intricacies associated with the generation mechanism of high harmonics at overdense plasma surfaces [126,136,137,138,139,140]. Thus, their appropriateness in predicting new phenomena in previously unexplored laser intensities is well justified.
Here, we present one result previously reported in [84], which was obtained by the one dimensional code LPIC [60]. It refers to the expected efficiency ηXUV of the harmonic radiation as a function of the vector potential aL associated with the laser pulse (see Figure 4).
This simulation was performed in a parameter range, which is expected to provide intense isolated asec pulses in the XUV or even SXR spectral range, i.e., for two-cycle (gaussian) laser pulse. For that purpose, three different filters have been assumed to select different spectral ranges. On this graph, some experimental results have been added from a collection of more recent reports. Despite the fact that the experimental results were obtained predominantly with multi-cycle laser pulses, the agreement to the simulations is worth noticing. This gives rise to cautious optimism, that in the near future, with the new generation laser systems [5,6,27], we will be able to reach the unprecedented efficiencies predicted by the PIC simulations.

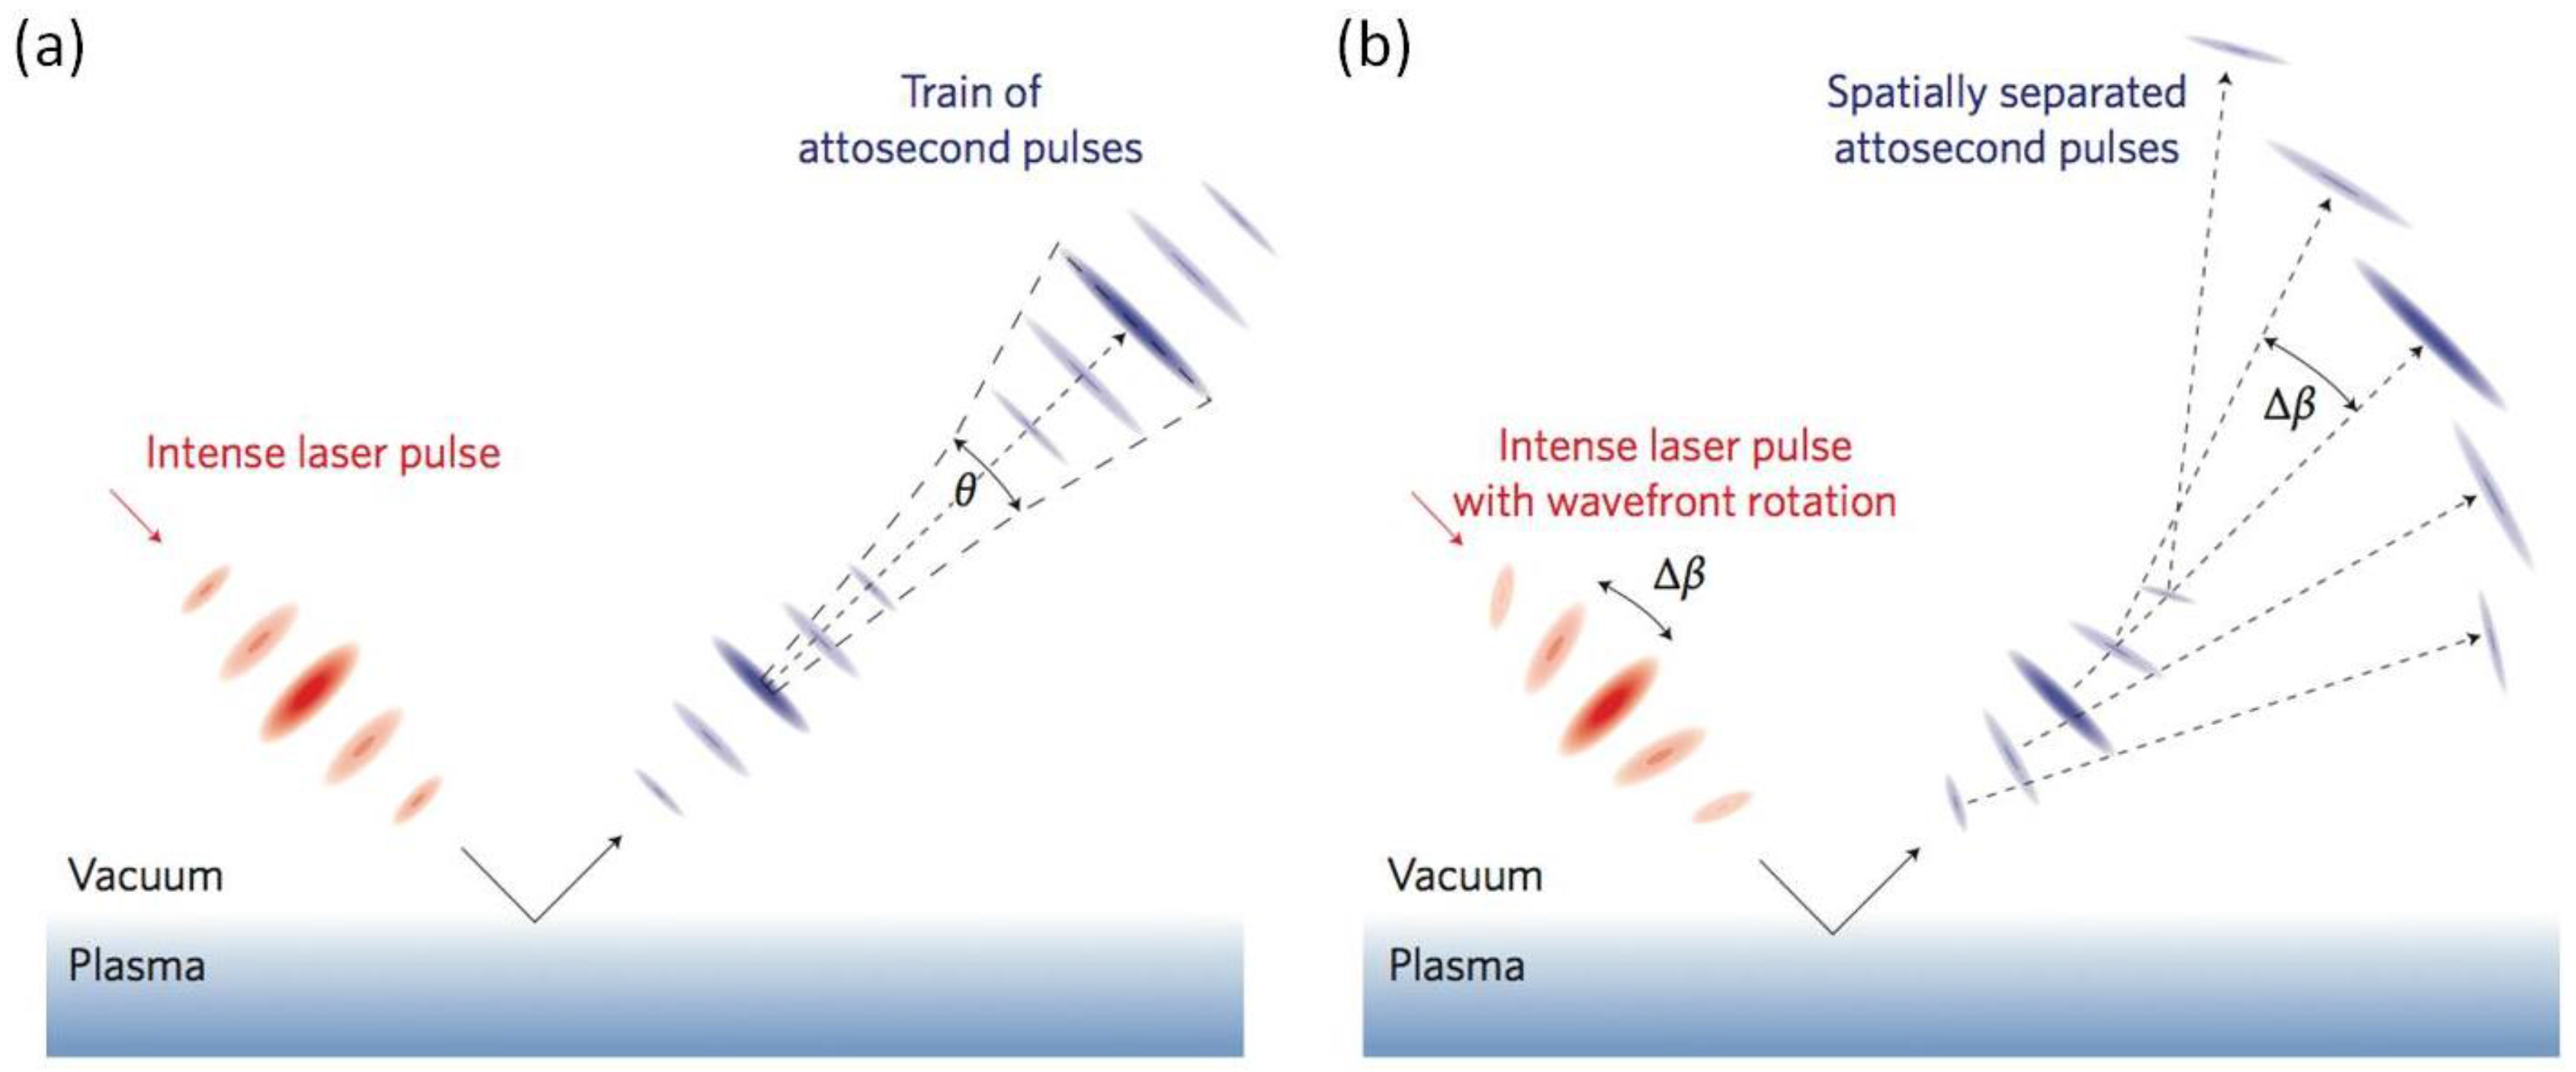
2.2.4. Asec Lighthouse Effect
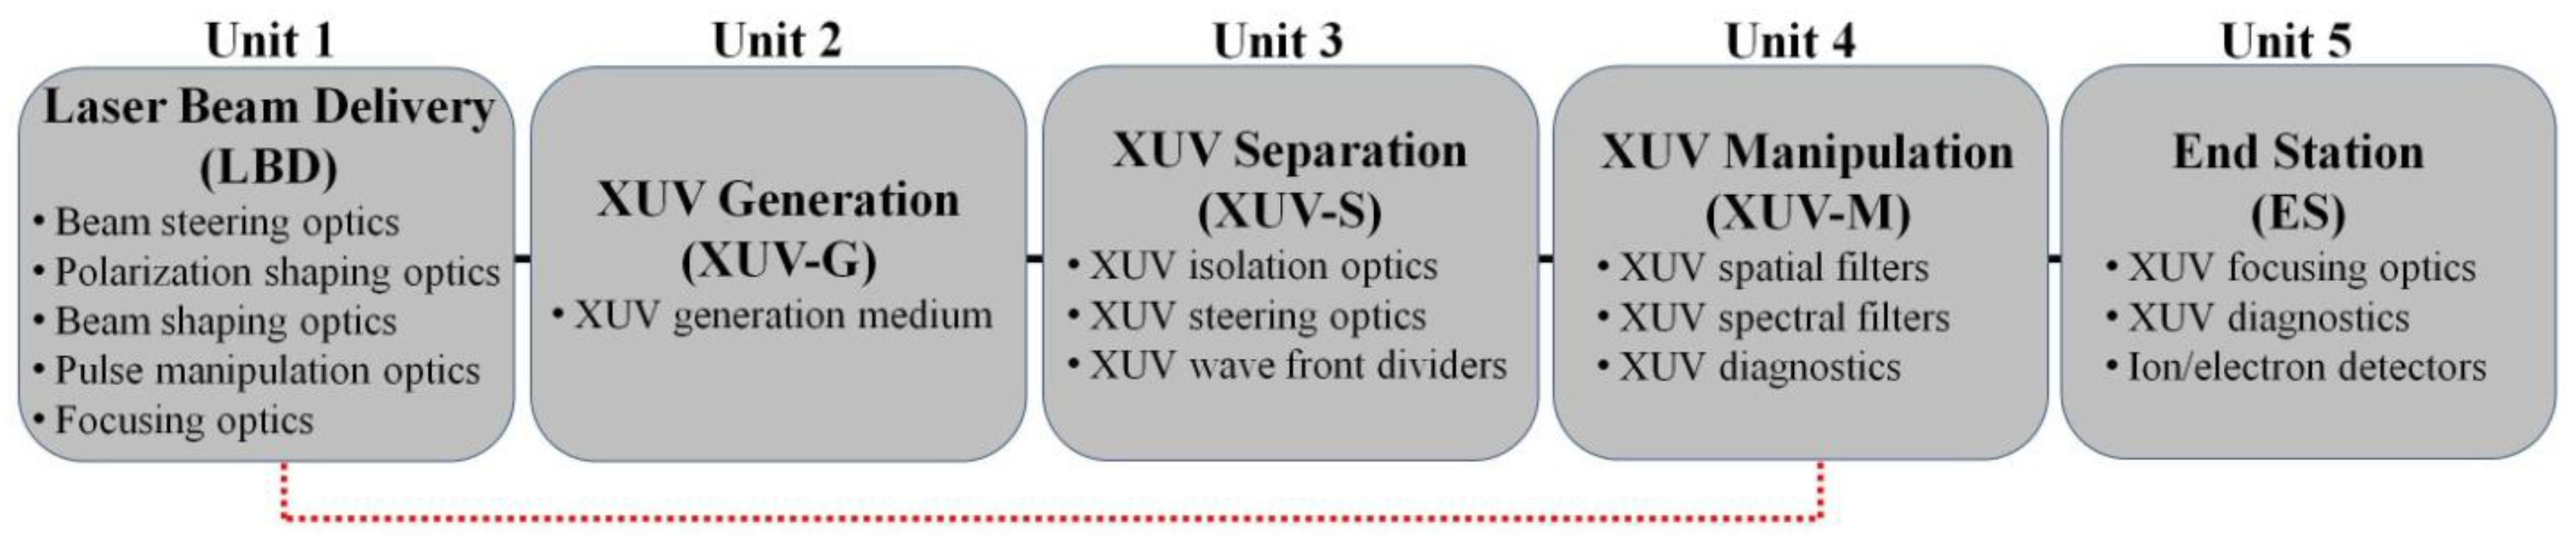
High-harmonic generation (HHG) driven by an intense fs laser field naturally tends to generate an asec pulse train (APT). For over a decade now, considerable efforts have been deployed to generate isolated asec pulses, as these are much convenient for performing time-resolved pump-probe type experiments. To this end, many temporal gating techniques have been proposed and successfully applied to intense HHG in gases, which essentially consist in eliminating all but one pulse in APT produced by the multiple cycles contained in the driving laser pulse (See Section 2.1.3). Because these techniques exploit the specific nonlinear response of an atom to the driving laser waveform, they cannot be easily extended to other nonlinear laser-matter interactions, such HHG from plasma mirrors, despite being theoretically predicted as a highly efficient source of high-energy asec pulses when driven at relativistic intensity [87]. In 2012, Vincenti and Quéré proposed a new approach to this problem, which consists in dispersing the asec pulses of the train in different and perfectly controlled directions in space, a scheme they called the asec lighthouse [141]. This way, by using an appropriate spatial mask, one can obtain not only a single asec pulse but even better, a manifold of independent yet perfectly synchronized asec pulses, ideally suited to pump-probe spectroscopy. The advantage of this technique is that it is relatively simple to implement and universally applicable to any nonlinear mechanism responsible for asec pulse generation, and also offers many exciting new tools for asec metrology [69].
A key property of HHG is that the individual asec pulses in the APT propagate in a collimated beam along the direction normal to the laser wavefronts at focus, as exampled in Figure 5a in the case of plasma mirrors driven by intense few-cycle pulses. If the laser wavefronts at focus can be made to rotate in time during the pulse, the individual asec pulses from the APT will now be generated in slightly different directions (Figure 5b). When the angular separation between successive asec pulses is larger than the divergence of each individual pulse in the APT, a collection of angularly separated asec pulses will be produced.
Ultrafast wavefront rotation (WFR) is a direct consequence of pulse-front tilt (PFT), a linear optic effect resulting at the focus of ultrashort laser pulses following angular dispersion, such as that introduced by slightly misaligning one of the gratings in the compressor or by introducing a prism into the beam [142]. Heyl et al. [99] proposed an elegant alternative for achieving WFR. In the presence of WFR, the laser wavefronts sweep part of the cone of light formed by the focused driving laser beam. The wavefront rotation velocity v R corresponds to the rate at which this angle is swept. As a result, the maximum achievable rotation velocity v R m a x is given by the ratio between the maximum possible angle that can be swept, i.e., the numerical aperture θ L of the driving laser pulse, divided by the minimal time it takes to sweep this angle, i.e., the Fourier transform limited pulse duration. The price to pay for achieving maximum WFR is a 2-fold reduction in laser peak intensity, due to the increase in both focal spot size and pulse duration at focus [141], which remains an acceptable degradation of the beam quality.
In order to spatially separate the asec pulses, the angle of emission Δ β between successive pulses must be larger than the divergence θ of the individual pulses. The maximum angular separation between pulses is therefore achieved for maximum rotation velocity, such that Δ β m a x = v R m a x × T t r a i n θ , where T t r a i n is the time interval between the emission of successive asec pulses. θ is imposed by the nonlinear interaction conditions and can only be partly controlled experimentally. Therefore, the above condition can only be fulfilled if the asec pulse divergence is small compared to the laser divergence, such that θ / θ L 1 / p N , where p is the number of asec pulses produced per laser cycle and N the number of cycles contained in the laser pulse. In practical terms, for any given experimental configuration, one can use the above relationship to deduce the longest possible pulse duration for which the asec lighthouse effect can still be efficiently achieved.
The first experimental demonstration of asec lighthouses was performed at Laboratoire d'Optique Appliquée LOA in France [67] on laser-driven plasma mirrors (Figure 6), with rather favourable conditions for visualizing the asec lighthouse effect since the HHG process was driven using tightly focused pulses containing only 2 optical cycles, such that θ a t t o / θ L 1 / 5 < 1 / p N 1 / 2 . The LOA team looked at the evolution of the spatial XUV beam footprint as a function of WFR introduced at the focus by rotating one of the wedges used in the setup to fine-tune pulse compression on target. In the absence WFR, a uniform XUV beam profile was observed (Figure 6b, left panel), corresponding to an asec pulse train with a discrete harmonic spectrum (Figure 6b, right panel) measured at the centre of the direction of emission. In the presence of WFR, the generated XUV beam splits into a manifold of angularly separated asec beamlets (Figure 6c, left panel), each exhibiting a continuum-like spectrum (Figure 6c, right panel), which is characteristic of single asec pulse emission.
The first application of the lighthouse approach was done by the NRC team in Canada exploiting the time-to-angle mapping induced by WFR, called photonic streaking, to investigate ultra fast dynamics of HHG in atoms and molecules [68]. They recently measured the temporal structure of the individual asec beamlets generated via the lighthouse effect and found that the latter does not change their characteristics for applications [143], while proposed advanced lighthouse schemes can be found in a comprehensive review on the subject by Quéré et al. in Ref. [69].

3. Asec Beam Lines

The gas and solid-surface XUV beam lines can be divided in four units as is shown in the block diagram of Figure 7. The 1st unit, named “Laser Beam Delivery (LBD)”, which is used for the manipulation of the driving field towards the generation of the XUV radiation, contains the laser beam steering, polarization shaping, beam shaping, pulse manipulation and focusing optics. The 2nd unit, named “XUV Generation (XUV-G)”, is used for the generation of the XUV radiation and contains the XUV generation medium. The 3rd unit, named “XUV Separation (XUV-S)”, contains the optical elements which are used for the isolation of the generated XUV radiation from the driving laser field and the steering (and XUV wave front splitting in case that is needed) of the XUV beam. The 4th unit, named “XUV Manipulation (XUV-M)”, contains optical elements used for spatial and spectral selection of the XUV radiation. In this unit, XUV diagnostics can also be used. The 5th unit, named “End Station (ES)”, which is used for the temporal characterization and the applications of the asec pulses, contains the XUV focusing elements, the XUV diagnostics and the detectors required for performing experiments using the XUV radiation.
In the 1st unit, the “beam steering optics” are broadband high reflectivity plane mirrors and beam splitters (or drilled holey mirrors) used for alignment and splitting of the driving laser field. The beam splitters are used to steer part of the driving field away from the XUV generation area (red dashed line in Figure 7). This auxiliary pulse, after its recombination with the XUV (which usually takes place in unit 4), can be used for IR/XUV pump-probe applications at the ES (see for example Ref. [144]). In this case ultrahigh stability optical arrangements are required. Also, part of this beam can be used for the measurement of the carrier-envelope-phase (CEP) in case of using few-cycle driving fields [145]. The “polarization shaping optics” are zero-order half- and/or quarter-wave plates used to control the polarization of the driving field. “Beam shaping optics” concern optical arrangements used for the optimization/manipulation of the XUV generation process through the control of the spatial intensity distribution of the driving field. Apertures and/or beam stops are “Beam shaping optics” which are commonly used for the formation of annular shaped beams and are very useful for the optimization and the spatial isolation (from the driving laser beam) of the XUV radiation generated in gas phase media. Also, they can be used for the creation of beams where an inner beam of small diameter is surrounded by an annular one. Such beams can be used for the manipulation of the harmonic generation process and for the temporal characterization of asec pulses via IR/XUV cross-correlation approaches (see for example Refs. [97,146]). The “pulse manipulation optics” concern the optical arrangements used for the manipulation of the XUV generation process through the control of the driving field waveform. Such arrangements are used for the generation of isolated asec pulses by multi-cycle laser fields, utilizing the PG [64,70,71,72] and LH [69] approaches. “XUV focusing” concern the optical elements/configurations (lens, focusing mirrors, deformable mirrors) used for the optimization of the XUV emission through the focusing conditions.
In the 2nd unit, the “XUV generation medium” concerns the type and the properties of the medium used for the generation of the XUV radiation. Gas phase media can be introduced in the unit by means of pulsed nozzles (pulsed gas targets) or leaking valves (static gas cell targets). In solid surfaces, each laser shot requires an optical quality substrate for the generation of the XUV radiation as the surface quality is destroyed after each laser. Thus, solid targets are introduced in the unit by using rotatable disk-shape substrates mounted on a high precision translation stages. In this way the targets are capable to acquire thousands of laser shots. Promising configurations which can potentially lead to a reliable XUV emission for a large number of laser shots are the tape-like solid targets [38], liquids [35] and liquid crystal films [36,37].
In the 3rd unit, the “XUV isolation optics” are used in order to reflect the XUV beam towards ES and significantly reduce the laser driving field which can damage the XUV elements existing in the units 4 and 5. The “XUV steering optics” are used for the alignment of the XUV beam towards the ES. The XUV optics in this unit can be specially designed multilayer mirrors with high reflectivity in a specific broadband XUV energy region or plane mirrors placed at grazing incidence angle for high reflectivity in a broadband XUV range. Silicon plates [147], coated Silicon plates [148] placed at the Brewster angle of the fundamental laser frequency and grazing incidence BK7 mirrors with antireflection coating the fundamental laser frequency can sufficiently fulfill these requirements. For example, a single split Silicon plate placed on translation/tilting stages can serve as an XUV isolator, steering element and wave front beam splitter. Additionally, due to the strong dependence of their reflectivity on the polarization direction of the driving field, these plates (in combination with the half wave plates of unit 1), can provide a precise control of the energy of the reflected driving field. This is a crucial point in case that the driving field is used as auxiliary pulse (in this case the XUV filters have to be removed from the beam path) for IR/XUV pump-probe experiments at the ES. This can be achieved using in unit 1 the beam shaping optics used for the temporal characterization of asec pulses via IR/XUV cross-correlation approaches.
In the 4th unit, the “XUV spatial filters” (apertures and/or beam stops) are used in order to spatially select part of the XUV beam and block the outer part of the XUV beam which may contain part of the driving field. This is crucial for the selection of XUV radiation generated by different electron trajectories in gas phase media and for the isolation of single asec pulses in case of using the LH approach in gases and solids. The “XUV spectral filters” are metal (Al, Sn, In, Zr etc.) foils of ~100 nm thickness used as band pass filters for the spectral selection of the XUV radiation. Also, these filters eliminate any residual part of the driving field which is reflected by the “XUV isolation optics”. It is advisable to use two filters of half thickness one after the other instead of one. This is because thin filters may have tiny pinholes and thus using two of them the second one blocks with very high probability any radiation going through the tiny holes of the first one. Both, spatial and spectral filters, are placed on motorized translation stages for the precise control of their position with respect to the position of the XUV beam. For the measurement of the XUV energy, and the spatial/spectral characterization of the XUV beam which enters the ES, calibrated XUV detectors (like photodiodes, PMT, MCP etc.), XUV diagnostics (like XUV beam profilers and XUV spectrometers) can also be placed at the end of this unit.
In the 5th unit, the “XUV focusing optics” concern grazing- or normal-incidence XUV focusing mirrors. Grazing incidence focusing optics are usually toroidal [52,144] or parabolic [92] mirrors with high reflectivity in a broadband XUV spectral range, while normal-incidence focusing optics are unprotected metal coated or multilayer spherical mirrors with high reflectivity in a more confined (compared the toroidal mirrors) XUV spectral range. Although, both configurations can deliver asec structure in the XUV interaction region, the advantages and disadvantages of each of them is a matter under investigation. To our knowledge, up to now, a single toroidal mirror has been used for the temporal characterization of gas phase asec pulses via IR/XUV cross-correlation approaches, e.g., Ref. [144], while recently a system of toroidal mirrors (in a Wolter configuration [149]) with reflectivity 40%–50%, has been used for focusing an XUV beam of ~60 eV photon energy down to ≈ 13 μm reaching intensities in the range of ~1012 W/cm2 [52]. Parabolic mirrors have been used for focusing solid surface harmonics of ~20 eV photon energy in a focal spot diameter of ≈ 16 μm reaching in this way intensities in the range of ~1012 W/cm2 [92]. Normal incidence spherical mirrors with reflectivity 10%–20% have been used for focusing an XUV beam of ~20 eV photon energy in the sub-4 μm level reaching intensities >1013 W/cm2 [150] while multilayer mirrors have been used for focusing an XUV beam of ~90 eV photon energy [29]. This XUV focusing geometry has been extensively used for the temporal characterization of asec pulses via IR/XUV cross-correlation [29,97,146], 2nd-order autocorrelation approaches (using spit spherical mirror in unit 5 or spit silicon plates in unit 3) [45,47,48,50,54,97], and for imaging the ion distribution produced by linear and non-linear processes at the focus of the XUV beam [98,150]. In order to characterize the XUV beam after the interaction with the system under investigation, XUV diagnostics as those described in unit 4 can also be placed at the output of the 5th unit.
In the following Section 3.1 and Section 3.2 we provide two examples on how the block diagram of Figure 7 was implemented for the generation, characterization and applications of intense asec pulses.

3.1. Asec Beam Lines for Gas Phase Media

Figure 8 shows a beam line which has been used for the generation, characterization and applications of intense asec pulses generated in gas-phase media. Examples of alternative arrangements can be found in Refs. [47,53,79,80,111,145,151,152,153,154].
An annular shaped p-polarized IR (with carrier frequency 800 nm) laser beam of ≈ 15 mJ energy, and ≈ 33 fs duration is focused with an f = 3 m focal length lens into a pulsed gas jet (P-GJ) filled with Xe, where the harmonic radiation is generated. A Silicon (Si) plate, placed after the jet at the Brewster angle for the fundamental (75°), reflects the harmonics towards the detection area, while substantially attenuating the IR field. After reflection from the Si plate, the XUV radiation passes through a 5 mm diameter aperture (A) which blocks the residual outer part of the IR beam. A 150 nm thick Sn filter (F) selects the 11th to 15th harmonics with approximately equal amplitudes. Subsequently, the XUV beam is focused into the target gas jet (T-GJ) (filled with Argon or Helium) with a spherical gold mirror (SM) of 5 cm focal length. With this configuration XUV peak intensities up to 1014 W/cm2 have been achieved at the focus of the XUV beam [150]. The energy of the XUV radiation in the interaction region was obtained from the measured pulse energy using an XUV calibrated photodiode (PDEUV) taking into account the reflectivity of the gold spherical mirror. The PDEUV has been placed after the aperture (A) and the filter (F). The harmonic spectrum measured by recording energy resolved photoelectron spectra resulting from the single-photon photoionization of Ar by the harmonic comb, is shown in Figure 8b. The electron spectra were recorded using a μ-metal shielded time-of-flight (TOF) ion/electron spectrometer, attached to a second XUV beam-line branch (upper branch in unit 5 of Figure 8a). The TOF can be set to record either the photoelectron energy distribution or ion-mass spectrum. The measured photoelectron distribution does not differ significantly from the XUV spectral distribution as in the photon energy range between 15 eV and 30 eV the single-photon-ionization cross section of Argon is almost constant. Ions are measured using an Ion Microscope (IM) [98,155] (down branch in unit 5 of Figure 8a) that images the focal area onto a Micro-channel Plate (MCP) detector equipped with a phosphor (Ph) screen anode. The resolution of the IM is ≈ 1 μm. In order to have the same experimental conditions in both the TOF and the IM set-ups, the TOF branch was constructed in an identical way to the IM. Thus, the two symmetric branches in Figure 8a are used for different diagnostics, i.e., for measuring energy resolved photoelectron spectra resulting from the interaction of the XUV with gas targets (upper branch) or the spatially resolved ion distribution resulting from the interaction of the XUV with gas targets (lower branch). Figure 8c shows the spatial ion distributions at the XUV focus induced by single- and two-XUV-photon ionization of Ar and He, respectively. We note that as the single-XUV-photon ionization process is proportional to the intensity of the radiation, the Ar+ distribution corresponds to the intensity distribution of the XUV at the focus.
Using a split spherical mirror of 5 cm focal length in the TOF branch of unit 5 of this beam line the duration of the asec pulses in a train was obtained by means of 2nd order volume autocorrelation (2-IVAC) measurements [45,97]. When a PG optical arrangement [64] is introduced in unit 1 the spectrum shown in Figure 8b switches form a harmonic comb to continuum (Figure 8d) which reflects the generation of isolated asec pulses.
It has been found that the intensities of the XUV pulses in the interaction area can be up to 1014 W/cm2 [48], while their durations can be obtained by means of 2-IVAC measurements in case the CEP of the driving field is stabilized or measured and tagging approaches are applied [48,156]. These pulses were used for the observation of two-XUV-photon double ionization in Xenon gas (which has been placed in T-GJ) [48], for time-resolved XUV spectroscopy studies [157] and XUV-XUV pump-probe measurements of ~1 fs scale dynamics in atoms [48] and molecules [158]. The temporal characterization of asec pulses generated in gas-phase media will be described in Section 4.

3.2. Asec Beam Lines for Solid Surface Media

Figure 9 shows a typical beam line which has been used for the generation and applications of asec pulses generated by solid-surfaces [86]. Examples of alternative arrangements can be found in Refs. [54,56,67,68,69]. A p-polarized IR (with carrier wavelength 800 nm) laser pulse of duration ≈ 26 fs and energy ≈ 100 mJ was focused by an f/2.5, 90° off-axis parabolic mirror (PM1) (of effective focal length of 20 cm) on a 1 cm thick fused silica target (ST) of 12 cm diameter. The angle of incidence on the target was 45°. In every shot, a single laser pulse interacted with a new (unused) position of the target. Full control over the position and pointing of the laser beam was achieved by controlling the x, y, z, and the tip and tilt degrees of freedom of the focusing parabola. Adjustment of the laser focus was possible by moving the entire target setup out of the laser beam. Removal occurred through an additional long linear translation stage. A microscope objective (IL1) connected to a CCD camera could then be moved in the beam path, allowing the observation of the laser focus. The diverging harmonic radiation, generated on the target and co-propagating with the laser beam, was collimated by a 135° off-axis fused silica parabolic mirror (PM2) having a focal length of 13 cm. This mirror was placed on a motorized translation stage, so that it could be moved out of the beam, allowing it to enter an imaging spectrometer (S) equipped with a 1200 lines/mm Hitachi flat-field grating. By placing the 135° off-axis parabola in the beam path, the collimated beam was directed to a second vacuum chamber. In this chamber, two Si plane mirrors placed at Brewster’s angle for λ = 800 nm reflected the XUV radiation, thus separating it from the absorbed IR laser beam. The XUV spectral region used in this experiment was selected by a 150 nm thick Sn filter. The filtered XUV radiation entered a third chamber, in which it was focused by a second 135° parabolic mirror (PM3) into a pulsed argon gas jet. The XUV intensity per laser pulse at the interaction area of the third chamber is ≈ 25 nJ, which when focused to a spot of ≈ 16 μm diameter (Figure 9a) resulted in a lower limit for the focused intensity of 5 × 10¹¹ W/cm2. A 1.5 m long magnetic bottle (MB) electron spectrometer was attached to the third chamber with its axis perpendicular to the beam propagation axis (Figure 9a). The MB was used in order to record energy-resolved PE spectra produced through single- and two-photon ionization (ATI) of Argon (Figure 9b,c). The concept of the above experimental arrangement was used for the temporal characterization of the asec pulse trains generated by the CWE process in the photon energy range of ~12–20 eV [54].
The pulse duration was obtained by means of 2-IVAC measurements using a split spherical mirror as an XUV wave front splitter. The temporal characterization of asec pulse trains generated in solid-surfaces will be described in more detailed in Section 4.2. Regarding the temporal characterization of the isolated asec pulses emitted by solid-surfaces, we note that, although the confinement of the XUV emission in a single burst has been achieved by the successful implementation of the LH approach [69] the measurement of their duration it is still an open issue.

4. Characterization of XUV Sources

The asec pulse metrology is one of the larger chapters in the field of attosecond science. Continues efforts in ultrafast light-matter interaction and engineering in the XUV range led to development of impressive techniques for the characterization of asec pulses. Nowadays, the tool box for the characterization of asec pulses is quite rich. To our knowledge, it contains approaches like 2-IVAC [45,47,159], XUV-IR cross-correlation named RABBITT (applicable for asec pulse trains) [146], Streaking (applicable for isolated asec pulses) [160], FROG-CRAB (applicable for arbitrary asec fields) [161], PROOF (applicable for asec pulses with bandwidth >70 eV) [162,163], Terahertz streaking (applicable for FEL sources) [164], XUV-SPIDER [165,166], and in-situ cross-correlation [167].
Most of the above approaches have been developed using gas-phase high order harmonics. Despite the large variety of the developed methods, lots of work still needs to be done mainly in the comparative studies between different approaches [97,168] and the extension of these methods to higher XUV photon energies and shorter asec pulse durations (see Section 5). The appropriateness of these methods to the characterization of asec pulses generated by solid-surfaces is quite limited. This is mainly due to experimental difficulties but also due to the presence of even- order harmonics in the XUV spectrum.
In Section 4.1 and Section 4.2, we will briefly review the widely used 2-IVAC and RABBITT/ FROG-CRAB methods. We will present how the 2-IVAC approach was used for the temporal characterization of trains and isolated pulses generated in gases (Section 4.1.1) and solid-surfaces (Section 4.2.1) and how the RABBITT (Section 4.1.2), FROG-CRAB (Section 4.1.3) methods were used for the reconstruction of trains and isolated pulses, respectively. Also, we will present recently developed approaches which can be used for the spectral/amplitude retrieval of the individual harmonic generated on solid-surfaces (Section 4.2.2).

4.1. Temporal Characterization of Asec Pulses Generated in Gases

4.1.1. The 2-IVAC Method in Gas-Phase Harmonics

The method was introduced in 2003 by P. Tzallas et al. [45]. It is an extension of the well-known in the fs metrology technique to the XUV spectral range and provides the direct information of the duration of the asec pulses. It requires high intensity asec pulses (typically > 1011 W/cm2), a dispersionless autocorrelator (XUV wave front spitting device like split mirror) and a spectrally flat and temporally instantaneous non-linear detector. The non-linear detector is an atomic/molecular system which is ionized by a non-resonant 2-XUV-photon excitation process [45,47,169,170] or a 2-XUV-photon excitation process where the width of the resonances are much smaller than the bandwidth of the XUV radiation [48,156]). The ionization products (electrons or ions) can be detected by a TOF spectrometer. In case of fulfilling these requirements the measurement of the asec pulse duration can be directly obtained by the width of the peak of the 2-IVAC trace ( τ A C ) after dividing with 2 , i.e., τ X U V = τ A C / 2 . We note that the peak to background ratio of a 2-IVAC trace cannot be higher than ≈2:1 [169] and in case of pulse trains the resulted duration reflects the average duration of the individual asec pulses in the train. Figure 10 shows a 2-IVAC measurement of an asec pulse train and an isolated ~1 fs XUV pulse as has been obtained using the arrangement Figure 10a. A high power ≈ 35 fs IR laser beam was focused into the Xenon gas jet where the harmonics were generated. The laser focus was placed before the Xenon gas jet at a position which is favorable for temporal confinement in the asec scale. The harmonic beam was passed through 150 nm thick Indium filter to select the 9th–15th harmonic. This beam was then focused by a split spherical gold mirror of 5 cm in focal length into a Helium pulsed gas jet. The relative field amplitudes of the harmonics in the interaction region were measured to be 1, 0.4, 0.3, and 0.25 for the 9th, 11th, 13th, and 15th harmonics, respectively. The Helium ions produced by a 2-XUV-photon ionization process (Figure 10b) were recorded by a μ-metal-shielded time-of-flight (TOF) spectrometer. The 2-IVAC trace synthesized by the 9th–15th harmonics is shown in Figure 10c. The trace was obtained by recording the He+ signal as a function of the delay between the XUV replicas. The duration of the asec pulses in the train was found to be (660 ± 50) asec. Asec pulse trains have been also temporally characterized by means of mode-resolved autocorrelation techniques using 2-XUV-photon-above-threshold ionization (ATI) schemes [159]. This technique is promising for extending the 2-IVAC method to high XUV photon energies and performing FROG-type [171] measurements in the XUV domain.
For the generation of isolated asec pulses a PG arrangement [64] was used. In this case the generated XUV spectrum switches from a harmonic comb to continuum. The XUV beam was passed through 150 nm thick Sn filter to select a bandwidth of ≈ 10 eV in the photon energy range of ≈ 19 eV (orange filled area in Figure 10d). This beam was then focused by a split spherical gold mirror of 5 cm in focal length into a Xenon pulsed gas jet. The Xe2+ ions produced by a 2-XUV-photon direct double ionization process (TPDDI) (Figure 10d) were recorded by a time-of-flight (TOF) spectrometer. In this process, the single-XUV-photon absorption is by passing the XUV continuum through an ensemble of autoionizing states (AIS). The 2-IVAC trace synthesized by the broadband continuum XUV radiation is shown in Figure 10e. The trace was obtained by recording the Xe2+ signal as a function of the delay between the XUV replicas in an interval around zero delay values. At longer delay times the 2-IVAC trace provides information about the wave packet evolution induced by the atomic coherences associated with the coherent excitation of the AIS. The duration of the XUV pulse was found to be ≈ 1.5 0.7 + 0.2 fs, which is an overestimation of the pulse duration. The measured “broad” pulse is a consequence of the appearance of not resolved side peaks present due to the unstable CEP of the high power multi-cycle laser system and the measurement of averages for many laser shots at each delay. We note that the influence of the AIS in the measured pulse duration is negligible as the width of the states is much smaller compared to the bandwidth of the XUV pulse or equivalently the measured beating periods are much larger than the pulse duration. Detail information on this matter can be found in Ref. [48].

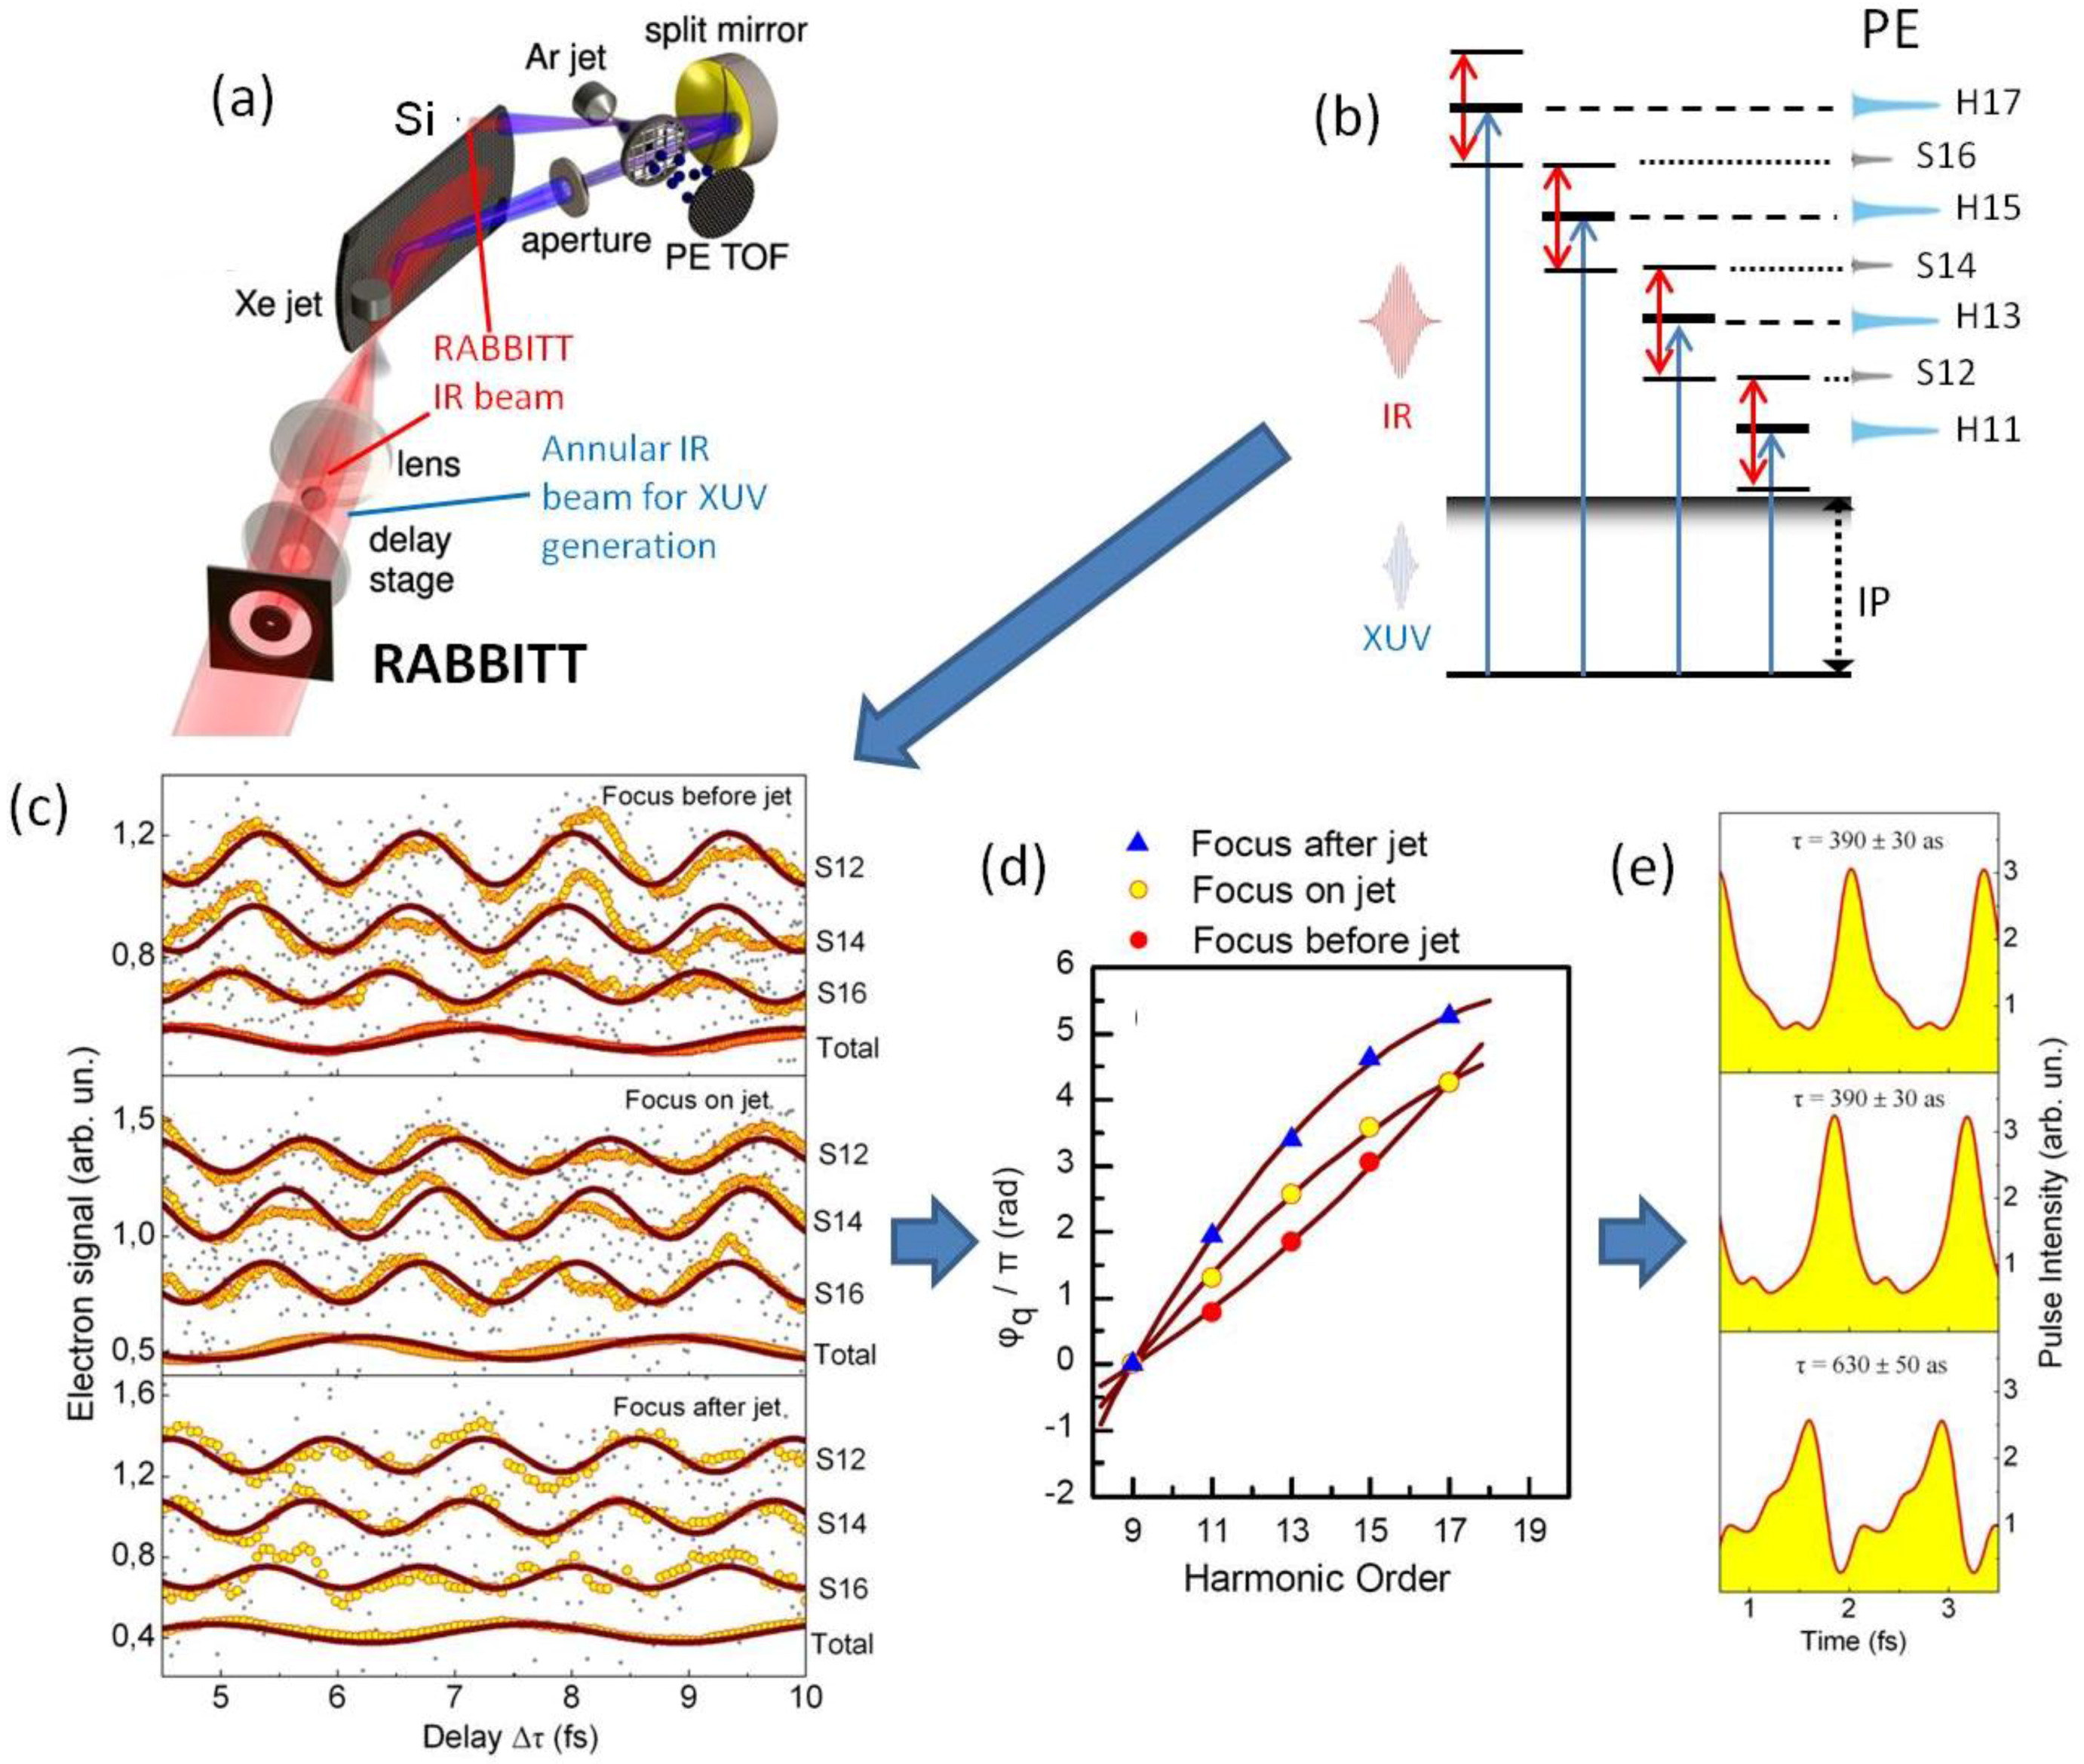
4.1.2. The RABBITT Method in Gas-Phase Harmonics

The RABBITT (stands for reconstruction of asec beating by interference of two-photon transitions) approach was introduced in 2001 by P. M. Paul et al. [146]. It is applicable for asec pulse trains and does not require high intensity asec pulse trains. It is a cross-correlation method which combines, at the focus in the ES of unit 5, the asec pulse train with a multi-cycle IR pulse (Figure 11a).
Note that the split spherical mirror in Figure 11a is used for comparative studies between the 2-IVAC and RABBITT approaches [97]. For the RABBITT measurements only one part of the split mirror was used. Figure 11a shows the experimental set-up of Figure 8a as has been used for RABBITT measurements for three different positions of the laser focus relative to the position of the Xe gas jet. In this arrangement Xenon gas was used for the generation of harmonics while the gas-jet at the ES was filled with Argon. The interaction of the combined field with Argon leads to an XUV + IR photon ionization (Figure 11b). The generated photoelectron (PE) distribution was detected by a μ-metal shielded TOF electron spectrometer.
The PE distribution consists of a series of well confined PE peaks (H11, H13, H15, H17) which correspond to the single-photon ionization induced by the high order harmonic (blue peaks at the up-right side of Figure 11b) and the “sideband” peaks (S12, S14, S16) (gray peaks at the up-right side of Figure 11b) which correspond to the two-photon ionization induced by the combined harmonic + IR field. The RABBITT method relies on the measurement of the average spectral phase and amplitude distribution between the consecutive harmonics. The spectral phase distribution can be obtained by the dependence of the sideband peaks appeared in the photoelectron spectrum on the delay between the XUV and the IR pulse. As the Sq signal is proportional to cos(2ωIRτ + φq−1-φq+1 + Δφat) (where q = 12, 14, 16 is the order of the sideband ωIR is the frequency of the IR field, τ is the delay between the IR and the XUV and Δφat are the atomic phases of each of the two photon transitions responsible for the sideband peaks [146]) the phase difference between the consecutive harmonics can be obtained by the measured phase shift between the sideband oscillations. Figure 11c shows the RABBITT traces (dependence of the sideband (S12, S14, S16) signal as a function of τ for three different positions of the laser focus with respect to the Xe gas jet normalized to the “total” signal (lower line in each panel). The oscillation period of the “total” signal which corresponds to the period of the driving field, i.e., ωIR, is due to IR intensity changes caused by interference effects of the two IR beams (shown as “RABBITT beam” and “annular IR beams used for XUV generation” in Figure 11a) in the harmonic generation region. This oscillation disappears in case of using a non-interacting with the XUV generation medium IR auxiliary pulse (red dashed line in Figure 7). Figure 11d shows the phases of the consecutive harmonics obtained by the RABBITT traces (the phase of the 9th harmonic was extrapolated from a quadratic fit to the measured phases of the 11th to 17th harmonics as is shown in solid line of Figure 11d). It is evident that as the focus of the IR beam is moving from the position “Focus before jet” to the position “Focus after jet” as the chirp is changing from positive to negative values. The corresponding reconstructed asec pulse trains are shown in Figure 11e.

4.1.3. Temporal Characterization of Asec Pulses Using FROG-CRAB

The temporal characterization of asec pulses relies on a technique usually indicated as asec streak camera [172,173]. The physical principle is similar to the streak camera used to characterize the temporal structure of a light pulse: the unknown pulse impinges on a photocathode and the variation of the temporal intensity of the electromagnetic field are mapped onto the temporal structure of the photoelectron bunch created. The electrons pass then pass a region characterized by a fast-changing electric field and are deflected to different positions of a screen, depending on their arrival time.
The application of this scheme requires the use of a changing electric field as a temporal scale, which is usually comparable with the duration of the pulse to be characterized. For this reason, an electric field changing on the sub-fs timescale is required for the characterization of isolated asec pulse.
For the asec streak camera, this condition is ensured by using a synchronized replica of the infrared (IR) pulse, which has generated the asec pulse. The electric field of the IR pulse can be expressed as: E ( t ) = E e n v ( t ) cos ( ω t + φ ) , where   E e n v ( t ) ,   ω , and φ indicate the envelope, the central frequency, and the carrier-envelope-phase, respectively.
The extreme ultraviolet (XUV) and the synchronized IR pulse are focused in a gas jet, where photoelectrons are released by the absorption of a single XUV photon. The freed electrons are then accelerated by the IR field. The final velocity v f of the electron depends only on the initial velocity v i and on the value of the vector potential A ( t ) at the ionization instant t 0 according to the equation (atomic units):
v f = v i A ( t 0 )
Under suitable approximation, the nature of which is associated to the strong-field-approximation, it can be demonstrated that the final kinetic energy W f , as a function of the relative delay τ , can be expressed as [160]:
W f = W i + 8 W i U p ( τ ) sin ( ω τ + φ )
where W i and U p ( τ ) are the initial kinetic energy and the ponderomotive potential at the delay τ , respectively.
It is important to observe that asec streaking allows one to retrieve in a visual, direct way information about the group delay dispersion (or chirp) of the asec pulse. Indeed, for an asec pulse characterized by a linear chirp, the streaking effect due to the linear variation of the electric field around the zeros of the vector potential, leads to a broadening (or narrowing) in energy of the photoelectron distributions, depending on whether the linear variation of the central frequency of the XUV pulses in time sums up (or subtract) the streaking effect due to the IR field.
The comparison between the streaking effect on two opposite zero-crossings of the vector potential, was first used in Ref. [174] to determine the pulse duration of an isolated asec pulses.
Later on in 2005 [161], it was recognized that the action of the electric field on the generated photoelectron wave packet can be considered as pure phase-gate on the emitted photoelectrons according to the equation:
a ( v , τ ) = i + d t e i ϕ ( t ) d v · E x u v ( t τ ) e i ( W + I p ) t
where   a ( v , τ ) is the transition amplitude to the state of the continuum | v , d v = v | r | 0 is the dipole matrix element between the ground state | 0 and the state | v , W = v 2 / 2 is the kinetic energy, I p is the ionization potential,   E x u v ( t ) the XUV field, τ the delay between the XUV and IR pulses and ϕ ( t ) is the phase given by:
ϕ ( t ) = t + d t [ v · A ( t ) + A 2 ( t ) / 2 ]
where A ( t ) is the vector potential of the IR pulse.
Therefore, the IR field modulates in time the phase of the photoelectron wave packet d v · E x u v ( t ) emitted in the continuum by the XUV field.
In a streaking experiment, the photoelectron energy (and angular) distribution is measured. This quantity corresponds to the square of the amplitude of a ( v , τ ) .   The measured signal, therefore, can be expressed in the form:
S ( ω , τ ) = | + d t   G ( t ) E ( t τ ) e i ω t | 2
which corresponds to a spectrogram or FROG trace of the pulse E ( t τ ) with the gate function G ( t ) . Using suitable inversion algorithms, it is possible to fully reconstruct both the pulse and gate functions from such a spectrogram. This reconstruction can be used for isolated, as well as trains of asec pulses. Even very complex asec waveforms can be reconstructed. This approach is usually indicated as FROG-CRAB (frequency-resolved-optical gating for the complete reconstruction of asec burst) [161].
This approach was first used to reconstruct the temporal structure of an isolated asec pulse generated using the polarization gating method [63]. This technique allows one to select one a single recollision trajectory, by using a pulse with a time-dependent polarization, which is circular in the leading and falling edges of the pulse, and linear only in a time window located in the center of the pulse.
With the polarization gating method, broadband continua extending over the harmonic plateau up to the cut-off region were obtained. The low-order harmonics were eliminated using an aluminum filter.
Figure 12a shows the spectrogram obtained for an aluminum filter with a thickness of 100 nm. The trace clearly evidences a periodic oscillation with a period of about 2.6 fs, which follow the oscillation of the vector potential. This indicates that the generation of the photoelectron wave packet is confined to a sub-cycle time window, and is due to a sub-cycle XUV pulse. The different intensities of the photoelectron spectra for consecutive zero energy shifts (corresponding to the zero-crossings of the vector potential) indicate that the XUV pulse has a linear (positive) chirp. This observation is confirmed by the outcome of the Principal Component Generalized Projections Algorithm (PCGPA), which was used to reconstruct the temporal amplitude (black solid line) and temporal phase (red dashed line) of the isolated asec pulse, as shown in Figure 12c. The reconstruction indicates a pulse duration of 280 as with a clear positive chirp. The measurement was acquired with a 100-nm-thick aluminum filter in the XUV-beam path in order to eliminate the lower harmonics and the collinear IR pulse.
As the aluminum filter presents a negative dispersion in the spectral range around 40 eV, compensation of the positive chirp could be achieved by increasing the filter thickness (but at the expense of a lower photon flux). This is demonstrated in Figure 12b, which presents the FROG CRAB trace obtained in the same experimental conditions, but with a filter with a thickness of 300 nm. The spectrogram clearly indicates that the signal intensities for consecutive zero energy shifts are comparable, thus indicating a significant reduction of the linear chirp affecting the pulse. This qualitative conclusion is confirmed by the reconstructed pulse, which is shown in Figure 12d. The pulse duration is 130 as and the quadratic temporal phase term is strongly reduced with respect to the previous case. The pulse duration is very close to the transform limited one, indicating a good compensation of the intrinsic positive chirp of the asec pulse.

4.2. Characterization of Asec Pulses Generated in Solid-Surfaces

4.2.1. Temporal Characterization of Asec Pulses Using the 2-IVAC Method

The 2-IVAC method is used in solid-surface harmonic in the same way as is described in Section 4.1.1 for gas-phase harmonics. The solid-surface harmonics were generated by focusing high power 45 fs pulses onto a solid target (polymethylmethacrylate (PMMA)) under 45° angle of incidence. The spatially averaged, effective laser intensity on target is estimated as ≈4 × 10¹⁸ W/cm2, yielding a normalized amplitude aL ≈ 1.5 for λ = 800 nm. At this intensity region, both mechanisms (CWE and ROM) may play a role in the harmonic generation. However, the appearance of a distinct cut-off in the harmonic spectrum and the scaling of this with the target density (with a higher density target (BK7) the cut-off moved to higher order harmonics) suggest that the CWE mechanism provides a dominant contribution in the harmonic generation process of this experiment. The harmonic beam was passed through 150 nm thick Indium filter to select the 8th–14th harmonic. This beam was then focused by a split spherical gold mirror of 15 cm in focal length into a Helium pulsed gas jet. The Helium ions produced by a 2-XUV-photon ionization process were recorded by a time-of-flight (TOF) spectrometer.
The temporal characterization of the harmonic superposition was performed in two steps. The overall duration of the XUV emission is obtained by a course scan (Figure 13a) of the ion signal as a function of the delay between the two replicas of the XUV pulse prepared by the split mirror. From the resultant AC trace shown in Figure 13a we evaluate an overall duration of the XUV emission as the full-width at half-maximum (FWHM) of the envelope of the XUV train assuming a Gaussian profile, which gives τXUV ≈ 44 fs. The fact that this value is very close to the laser pulse duration indicates that CWE scales nearly linearly with laser intensity, which agrees with the findings in Ref. [22].
To ascertain whether the XUV emission shows a sub-laser-cycle temporal structure indicative of asec synchronism among the filtered harmonics, we have performed a fine scan over a delay interval of ≈ 4 laser cycles centered near the zero delay that yielded the maximum signal in the coarse scan. Figure 13b shows the result of this fine scan. A periodic sub-fs structure with the period of the driving laser field, TL, is clearly discernible. This is in contrast to the time structure of atomic harmonics, which is characterized by a pulse spacing of TL/2 due to the absence of even harmonics in the emission spectrum. Fitting a train of Gaussian pulses to the measured AC trace gives an estimate for the duration of the individual pulses of τXUV ≈ (0.9 ± 0.4) fs FWHM.

4.2.2. Spectrally Resolved Spatial Phase and Amplitude Retrieval of Solid-Surface Harmonics

The high harmonic generation process in solid density plasma is, as described in Section 2.2, a periodically driven nonlinear surface effect (density gradient, L << λ) [175]. The surface electrons are super strongly driven by the focused laser field resulting in a spatially collimated beam of accelerated electrons [176] and a concomitant beam [177] of asec pulse trains described before. Here the spatiotemporal characteristics of the resulting XUV pulses are encoded in the reflected light field [178]. The spatial properties of the XUV beam, i.e., the beam profile and the beam divergence is directly correlated to the spatial amplitude and spatial phase profile of the generated high order harmonics in the source plane [84] and essentially controls the focussability of the generated attopulses showing the potential of diffraction limited focusing [61].
The two main mechanisms of high harmonic generation from plasma mirrors discussed previously (Section 2.2) demonstrate contrasting behaviors in their spatial properties. The spatial amplitude profile of a particular high harmonic at the source depends on the efficiency of its generation and hence on the driving laser beam parameters (focused intensity, polarization etc.) [175] and the driven plasma mirror properties (plasma density gradient) [118]. These parameters together determine the source size on the target plane which for the CWE turns out to be comparable to the laser focal spot size [85].
The spatial phase properties in the two cases show remarkable differences, due to distinct physical origins of the phase. The CWE process is more akin to the three step process occurring in gas HHG and similar to that they show an intensity dependent emission time for attopulses or harmonic chirp [100]. In the ROM case the spatial phase originates from the laser dented shape of the plasma mirror at the time of emission [84]. The combined effect of source size and spatial phase manifests itself in the high harmonic beam divergence and its dependence on the interaction conditions as observed in Figure 14.
At a higher driving laser intensity (I2 ~ 5 × 10¹⁹ W/cm2) a softer plasma mirror (higher L/λ) is more dented compared to a stiffer one (smaller L/λ) during the high harmonic generation resulting in an increase in the measured beam divergence [118], whereas at a comparatively lower laser intensity (I1 ~ 1 × 10¹⁸ W/cm2) the light pressure is not sufficient to affect the mirror curvature during the harmonic generation leading to the shaded area in Figure 14e. This information can in turn be used to infer the light induced curvature of the plasma mirror validating models of relativistic optics [84].
Retrieving simultaneously amplitude and phase information of the plasma mirror high harmonic source in experiments is a very challenging task in itself due to: (i) usually the spectrally and spatially resolved high harmonic detection system can only capture the harmonic intensity profile in far field and (ii) one has limited access to focal plane parameters at very high intensities with the required spatial and temporal resolution. Recent advances in ptychographic measurements on high harmonic emission from optically controllable solid density plasma gratings [85] in combination with the application of state of the art reconstruction algorithm has allowed scientists to carry out amplitude and phase resolved measurement of the high harmonic source in the relativistic interaction plane [86]. Figure 15a,b shows that for CWE case the harmonic source size is similar to the laser spot size while for the ROM case it is a fraction of laser focal spot size.
The measured spatial phase shows opposite curvature in the source plane in the two scenarios. While the ROM harmonic phase capture the plasma mirror curvature, which is dented in by the light pressure [84], the CWE harmonic phase reflects the intensity dependent attopulse emission times discussed earlier in this section.

5. Conclusions and Ongoing Development on Gas-Phase and Solid-Surface Asec Sources

Asec sources based on the interaction of fs laser pulses with gas targets acting as non-linear media have undergone enormous progress in the last 25 years. The results of this progress are novel technologies and rather robust operation of asec sources. However, there are still a lot of challenges in this by far not saturated area. While asec sources are mature enough for user applications at the same time they belong to an open research area in which ongoing developments keep on producing novel and sound scientific results as well as improving the performance of the sources. Such developments target advanced operational parameters such as high photon fluxes, high photon energies, high repetition rates, controllable polarization and advanced diagnostics. At the same time asec sources based on laser plasma of solid surface targets, hold promise for an outstanding performance, nevertheless they are still in an infant stage where lots of further research and development is required in order to elevate them to the level of a users’ source.
One of the key factors in the improvement of the asec sources is the advancement of the driving laser sources. Indeed, to summarize some of the laser developments from which asec sources will greatly benefit: (I) Few-cycle laser with high repetition rates of some hundreds of kHz with 1 mJ level pulse energies immediately greatly improve gas target asec sources and subsequently quality and degree of sophistication of the applications of these sources due to the increased statistics offered; (II) CEP stabilized high peak power few cycle lasers with pulse energies of the order of 100 mJ are boosting asec photon fluxes to a level that asec XUV non-linear optics will be unlocked and expected to flourish; (III) Energetic Mid-IR sources have already demonstrated, that asec sources driven by them have reached the water widow spectral regime [179] and beyond [79]; (IV) While 10 µJ scale sub-fs confinement in solid surface laser plasma XUV harmonics has been demonstrated only in one experiment [54] so far, high contrast PW laser systems driving solid surface laser plasma harmonics hold promise for keV photon energy, asec pulses at the 1–10 mJ level. Such developments in laser technology are currently underway strongly enriching the near future operation prospects of asec sources.
A major advancement that is targeted currently in several research institutions is a high asec photon flux at increased repetition rates and increased photon energies. While XUV-pump-XUV-probe experiments have been performed in the ~1 fs time scale [48,158,180] it is not rigorously proven that they were using pulses of asec duration. The importance of XUV-pump-XUV-probe experiments has been stressed in a recent publication [181] highlighting the fact that XUV-IR pump-probe experiments might suffer from distortions of the system under instigation due to in some cases high intensity IR pulses are unavoidable. Moreover, all these experiments were performed with repetition rates of 10 or 100 Hz and photon energies approximately up to 20 eV. While this spectral regime is the one where valence electrons have eigenstates and are strongly absorbing, larger photon energies will open the path to XUV-pump-XUV-probe inner-shell electron dynamics. A substantial increase of the source throughput can be achieved by properly designing the source geometry. In a recent work [99] it has been established that paraxial nonlinear wave equations are scale-invariant when spatial dimensions, gas density, and laser pulse energy are appropriately scaled. One consequence of this is that when excess energy is present in the laser pulse, causing depletion of the non-linear medium, the throughput of the source can be substantially increased by properly scaling the size of the source (using laser focusing elements of long focal lengths) and the gas pressure in the interaction area. At rather high laser pulse energies in the order of 100 mJ scaling of the source size may reach 100 m as discussed before. This is, e.g., the case of the so called “long” gas HHG source that is under development by the Lund University for ELI-ALPS [182]. This is a very new development that will for the first time be exploited at ELI-ALPS driven by the 5 fs, 100 mJ, 1 kHz, CEP stabilized laser chain called SYLOS. Asec pulses of tens of mJ can be expected from this system in the XUV and sub- mJ for soft x-rays. While this system will use a single long length (in the meter scale) gas cell filled with low pressure (in the few-mbar scale) rare gas in a second asec gas HHG source, the so called “compact” one, asec pulses of tens of μJ is expected to be generated utilizing quasi-phase matching conditions [78] by means of 10 m long focusing elements and a multiple short length (in the few-mm scale) and high pressure (in tens of mbar scale) gas jet configuration. As discussed in Section 2.1.2, It is well established that momentum conservation in the HHG process involves several contributions, such as the momenta of the fundamental and harmonic photons, the geometrical factor, medium dispersion, electron dispersion and momentum originating from the “atomic phase” [102]. Using two or more jets appropriately positioned along the focus some of the contributions may cancel each other leading to phase matching and thus coherent superposition of the harmonics emitted by the different jets thus leading to an increased output. So far, most of the asec sources were operated in the tight focusing regime leading to short confocal parameters, and thus very demanding positioning of the jets that reduces practicability this effect. Long focusing geometries greatly facilitate the application of quasi phase matching approaches as positioning requires reduced spatial accuracy (mm scale) and loose spacing between the jets (cm scale). Preliminary experiments indicate that using four jets may increase the output by an order of magnitude. Proper positioning of multiple jets can be achieved using feed-back approaches in conjunction with optimization algorithms.
Improved operation of asec sources allow for and require advanced characterization methods, in particular when it comes to the temporal characterization of the asec pulses that are to be used in time domain experiments. Here two main approaches have been used so far in the time domain. Some others like the Spectral Phase Interferometry for Direct Electric Field Reconstruction (XUV-SPIDER) [162,166] and the “in-situ” method [167] are not frequently used. From the two mainly used, the first one and most abundantly applied relies, as is mentioned before, on some type of cross-correlation measurement between the driving IR and the XUV pulse, including Resolution of Attosecond Beating by Interference of Two photon Transitions (RABBITT) [144,146,161,183,184] and RABBITT based approaches as well as asec-streaking [29]). The second one is based on the 2-IVAC [45,169,170,185]. As has been shown experimentally [97], under certain conditions and for photon energies not exceeding 24 eV, the 2-IVAC and the RABBITT techniques give rather different results. This has been attributed to the fact that RABBITT measures spatiotemporal averages of spectral phases, while 2-IVAC measures spatiotemporal averages of pulse durations. Current developments of asec sources include in their research programs further comparative studies between these two approaches for other geometries and other spectral regions. Connected to this, new developments in experimental set ups and methods will be required. In particular (i) new combinations of asec delay lines and focusing elements have to be introduced, such as the recently set up of the Lund group [52] and (ii) new non-linear processes have to be considered allowing the application of the method at higher photon energies. So far the two photon ionization of He [43] and N2 [186] that have been used are not applicable at higher photon energies because the target will be single photon ionized. Candidate processes for this extension are two-photon multiple ionization [156] and two-photon ATI [92]. Such types of developments are currently designed and will be soon implemented in asec laboratories. ELI-ALPS will provide advanced features for such developments, i.e., high XUV pulse energies at kHz repetition rates.
While 2-IVAC gives a fair estimation of the pulse duration it does not contain information allowing for the reconstruction of the pulse profile as RABBITT claims to do. Temporal profile reconstruction requires measurement of the spectral phase and amplitude distributions of the pulse under investigation. A widely used approach in optical fs pulse metrology is the Frequency Resolved Optical Gaiting (FROG) method [171], in which the radiation is spectrally dispersed and for individual spectral segments a 2nd order autocorrelation is measured, while an iterative process allows for retrieval of the spectral phase distribution and the pulse reconstruction, except for the distinction between left-right asymmetry that requires a higher order than 2nd order process. Extension of FROG to the XUV regime seeks for an energy resolved measurement of a two photon process, which can be achieved through energy resolved photoelectron spectroscopy in two photon ionization [187] instead of ion mass spectroscopy used in the 2-IVAC. Towards this target an important step was made in Japan [159] where 2nd order autocorrelation has been achieved with energy resolved two photon ionization. However, a FROG type reconstruction was not completed in this work. FROG type reconstruction requires high degree of source stability and possible high repetition rates. These parameters are expected to be provided by the gas medium asec sources driven by the SYLOS system at ELI-ALPS.
A further development that is currently under development not only in asec sources but also in FEL laboratories are single shot non-linear autocorrelators. Such devices allow the shot to shot measurement of the pulse duration, which in turn is important if the duration is shot to shot fluctuating and non-linear processes are studied using these pulses. For such measurements the shot to shot knowledge of the pulse parameters allows for correction or sorting of the measured quantities. Optical single-shot autocorrelators relay on the spatially resolved measurement of the 2nd or 3rd order harmonic images of the harmonics being produced in a non-linear crystal by intersected laser beams. The temporal dimension of the pulse is thus mapped in the spatial dimension of the image. Extension of this approach in the XUV spectral region can be achieved via spatially resolved two-photon ionization of a gas target by two crossed XUV beams [188]. Although the ion distribution produced by a two-XUV-photon ionization process has been already demonstrated using a single XUV beam in a multi-shot measurement [150], the produced number of ions were not enough for recording a clear single shot ion distribution. Increased photon fluxes are required in order to increase the statistics in the images. This will be another task of the advanced asec sources currently under development including the ELI-ALPS SYLOS driven sources.
Some steps are currently being made in controlling the ellipticity of the asec pulses [189]. Although photon fluxes are here reduced increased repetition rates as, e.g., the 100 kHz of the ELI-ALPS HR system, hold promise for enough statistics in condensed matter experiments like magnetic circular dichroism or gas phase experiments with chiral samples.
Finally, with respect to the prospects of sources driven with mid-IR lasers some sound advantages and bottlenecks should be addressed here. For gas medium asec sources mid-IR driving lasers are advantageous (i) because the so called atto-chirp affecting the asec harmonics scales as λ−1, leading to an asec duration that scales as λ−1/2 and thus to shorter pulse durations; (ii) Since the ponteromotive potential scales as λ2 and so does the kinetic energy of the recolliding electron at the moment of the recombination and thus the cut-off energy of the harmonic spectrum [9,10] very high photon energy asec pulses can be generated. However, the harmonic generation (HHG) efficiency scales as λ−5.5. This bottleneck defines new challenges for mid-IR laser sources with increased peak power and at the same time consolidation of phase matching approaches that increase the HHG efficiency. One step further, considering relativistic interactions, the crucial parameter is the normalized vector potential a = ( 2 e 2 λ 0 2 I / π m e 2 c 5 ) 1 / 2 = 0.855 × 10⁻⁹ I1/2 [W/cm2] λ [µm]. The relativistic regime is reached when α ≥ 1. Consequently, long wavelengths are entering the relativistic regime at lower intensity. Interactions with mid IR lasers become relativistic at 1016–1017 W/cm2.

Acknowledgments

This work is supported by the Greek funding program NSFR and the European Union’s Horizon 2020 research and innovation program under Marie Sklodowska-Curie grant agreement no. 641789 MEDEA. ELI-ALPS is supported by the European Union and cofinanced by the European Regional Development Fund (GINOP-2.3.6-15-2015-00001).

Conflicts of Interest

The authors declare no conflict of interest.

References

  1. Steinmeyer, G.; Sutter, D.H.; Galmann, L.; Matuschek, N.; Keller, U. Frontiers in Ultrashort Pulse Generation: Pushing the Limits in Linear and non linear optics. Science 1999, 286, 1507–1512. [Google Scholar] [CrossRef] [PubMed]
  2. Brabec, T.; Krausz, F. Intense few-cycle laser fields: Frontiers of nonlinear optics. Rev. Mod. Phys. 2010, 72, 545. [Google Scholar] [CrossRef]
  3. Keller, U. Recent developments in compact ultrafast lasers. Nature 2003, 424, 831–838. [Google Scholar] [CrossRef] [PubMed]
  4. Witte, S.; Zinkstok, R.T.; Hogervorst, W.; Ubachs, W.; Eikema, K.S.E. A source of 2 terawatt, 2.7 cycle laser pulses based on noncollinear optical parametric chirped pulse amplification. Opt. Express 2006, 14, 8168–8177. [Google Scholar] [CrossRef] [PubMed]
  5. Hermann, D.; Veisz, L.; Tautz, R.; Tavella, F.; Schmid, K.; Pervak, V.; Krausz, F. Generation of sub-three-cycle, 16 TW16 TW light pulses by using noncollinear optical parametric chirped-pulse amplification. Opt. Lett. 2009, 34, 2459–2461. [Google Scholar] [CrossRef]
  6. Major, Z.; Trushin, S.A.; Ahmad, I.; Siebold, M.; Wandt, C.; Klingebiel, S.; Wang, T.J.; FÜ Lop, J.A.; Henig, A.; Kruber, S.; et al. Basic concepts and current status of the petawatt field synthesizer-a new approach to ultrahigh field generation. Rev. Laser Eng. 2009, 37, 431–436. [Google Scholar] [CrossRef]
  7. Gavrila, M. Atoms in Intense Fields; Academic Press: Boston, MA, USA, 1992. [Google Scholar]
  8. Protopappas, M.; Keitel, C.H.; Knight, P.L. Atomic physics with super-high intensity lasers. Rep. Prog. Phys. 1997, 60, 389. [Google Scholar] [CrossRef]
  9. Corkum, P.B. Plasma perspective on strong field multiphoton ionization. Phys. Rev. Lett. 1993, 71, 1994. [Google Scholar] [CrossRef] [PubMed]
  10. Lewenstein, M.; Balcou, Ph.; Ivanov, M.Y.; L’Huiller, A.; Corkum, P.B. Theory of high harmonic generation by low frequency fields. Phys. Rev. A 1994, 49, 2117. [Google Scholar] [CrossRef] [PubMed]
  11. Krause, J.L.; Schafer, K.J.; Kulander, K.C. High-order harmonic generation from atoms and ions in the high intensity regime. Phys. Rev. Lett. 1992, 68, 3535. [Google Scholar] [CrossRef] [PubMed]
  12. Schafer, K.J.; Yang, B.; DiMauro, L.F.; Kulander, K.C. Above threshold ionization beyond the high harmonic cutoff. Phys. Rev. Lett. 1993, 70, 1599. [Google Scholar] [CrossRef] [PubMed]
  13. Becker, W.; Long, S.; and Melver, J.K. Modeling harmonic generation by a zero-range potential. Phys. Rev. A 1994, 50, 1540. [Google Scholar] [CrossRef] [PubMed]
  14. Salières, P.; Carre, B.; Le Deroff, L.; Grasbon, F.; Paulus, G.G.; Walther, H.; Kopold, R.; Becker, W.; Milosevic, D.B.; Sanpera, A.; et al. Feynman’s path-integral approach for intense-laser-atom interactions. Science 2001, 292, 902–905. [Google Scholar] [CrossRef] [PubMed]
  15. Gonoskov, I.A.; Tsatrafyllis, N.; Kominis, I.K.; Tzallas, P. Quantum optical signatures in strong-field laser physics: Infrared photon counting in high-order-harmonic generation. Sci. Rep. 2016, 6, 32821. [Google Scholar] [CrossRef] [PubMed]
  16. Tsatrafyllis, N.; Kominis, I.K.; Gonoskov, I.A.; Tzallas, P. High-order harmonics measured by the photon statistics of the infrared driving-field exiting the atomic medium. Nat. Commun. 2017, 8, 15170. [Google Scholar]
  17. Bezzerides, B.; Jones, R.D.; Forslund, D.W. Plasma Mechanism for Ultraviolet Harmonic Radiation Due to Intense CO2 Light. Phys. Rev. Lett. 1982, 49, 202. [Google Scholar] [CrossRef]
  18. Grebogi, C.; Tripathi, V.K.; Chen, H.H. Harmonic generation of radiation in a steep density profile. Phys. Fluids 1983, 26, 1904–1908. [Google Scholar] [CrossRef]
  19. Von Der Linde, D.; Rzazewski, K. High-order optical harmonic generation from solid surfaces. Appl. Phys. B 1996, 63, 499–506. [Google Scholar] [CrossRef]
  20. Teubner, U.; Gibbon, P. High-order harmonics from laser irradiated plasma surfaces. Rev. Mod. Phys. 2009, 81, 445. [Google Scholar] [CrossRef]
  21. Baeva, T.; Gordienko, S.; Pukhov, A. Theory of high-order harmonic generation in relativistic laser interaction with overdense plasma. Phys. Rev. E 2006, 74, 046404. [Google Scholar] [CrossRef] [PubMed]
  22. Quéré, F.; Thaury, C.; Monot, P.; Dobosz, S.; Martin, P.; Geindre, J.-P.; Audebert, P. Coherent wake emission of high-order harmonics from overdense plasmas. Phys. Rev. Lett. 2006, 96, 125004. [Google Scholar] [CrossRef] [PubMed]
  23. Blaga, C.I.; Catoire, F.; Colosimo, P.; Paulus, G.G.; Muller, H.G.; Agostini, P.; DiMauro, L.F. Strong-field photoionization revisited. Nat. Phys. 2009, 5, 335–338. [Google Scholar] [CrossRef]
  24. Gohle, C.; Udem, T.; Hermann, M.; Rauschenberger, J.; Holzwarth, R.; Shuessler, H.A.; Krausz, F.; Hansch, T.W. A frequency comb in the extreme ultraviolet. Nature 2005, 436, 234–237. [Google Scholar] [CrossRef] [PubMed]
  25. Cingöz, A.; Yost, D.C.; Allison, T.K.; Ruehl, A.; Fermann, M.E.; Hartl, I.; Ye, J. Direct frequency comb spectroscopy in the extreme ultraviolet. Nature 2012, 482, 68–71. [Google Scholar] [CrossRef] [PubMed]
  26. Träger, F. Springer Handbook of Lasers and Optics; Springer: Berlin/Heidelberg, Germany, 2012; pp. 219–236. [Google Scholar]
  27. Reduzzi, M.; Carpeggiani, P.; Kühn, S.; Calegari, F.; Nisoli, M.; Stagira, S.; Vozzi, C.; Dombi, P.; Kahaly, S.; Tzallas, P.; et al. Advances in high-order harmonic generation sources for time-resolved investigations. J. Electron Spectrosc. Relat. Phenom. 2015, 204, 257–268. [Google Scholar] [CrossRef]
  28. Corkum, P.B.; Krausz, F. Attosecond science. Nat. Phys. 2007, 3, 381–387. [Google Scholar] [CrossRef]
  29. Krausz, F.; Ivanov, M. Attosecond physics. Rev. Mod. Phys. 2009, 81, 163. [Google Scholar] [CrossRef]
  30. Gallman, L.; Cirelli, C.; Keller, U. Attosecond Science: Recent Highlights and Future Trends. Annu. Rev. Phys. Chem. 2012, 63, 447–469. [Google Scholar] [CrossRef] [PubMed]
  31. Burnett, N.H.; Baldis, H.A.; Richardson, M.C.; Enright, G.D. Harmonic generation in CO2 laser target interaction. Appl. Phys. Lett. 1977, 31, 172–174. [Google Scholar] [CrossRef]
  32. Carman, R.L.; Forslund, D.W.; Kindel, J.M. Visible Harmonic Emission as a Way of Measuring Profile Steepening. Phys. Rev. Lett. 1981, 46, 29. [Google Scholar] [CrossRef]
  33. Ferray, M.; L’Huillier, A.; Li, X.F.; Lompré, L.A.; Mainfray, G.; Manus, C. Multiple-harmonic conversion of 1064 nm radiation in rare gases. J. Phys. B At. Mol. Opt. Phys. 1988, 21, L31. [Google Scholar] [CrossRef]
  34. L’Huillier, A.; Balcou, P. High-order harmonic generation in rare gases with a 1-ps 1053-nm laser. Phys. Rev. Lett. 1993, 70, 774. [Google Scholar] [CrossRef] [PubMed]
  35. Heissler, P.; Lugovoy, E.; Hörlein, R.; Waldecker, L.; Wens, J.; Heigoldt, M.; Khrennikov, K.; Karsch, S.; Krausz, F.; Abel, B.; et al. Using the third state of matter: High harmonic generation from liquid targets. New J. Phys. 2014, 16, 113045. [Google Scholar] [CrossRef]
  36. Poole, P.L.; Willis, C.; Cochran, G.E.; Hanna, R.T.; Andereck, C.D.; Schumacher, D.W. Moderate repetition rate ultra-intense laser targets and optics using variable thickness liquid crystal films. Appl. Phys. Lett. 2016, 109, 151109. [Google Scholar] [CrossRef]
  37. Poole, P.L.; Andereck, C.D.; Schumacher, D.W.; Daskalova, R.L.; Feister, S.; George, K.M.; Willis, C.; Akli, K.U.; Chodhury, E.A. Liquid crystal films as on-demand, variable thickness (50–5000 nm) targets for intense lasers. Phys. Plasmas 2014, 21, 063109. [Google Scholar] [CrossRef]
  38. Bierbach, J.; Yeung, M.; Eckner, E.; Roedel, C.; Kuschel, S.; Zepf, M.; Paulus, G.G. Long-term operation of surface high-harmonic generation from relativistic oscillating mirrors using a spooling tape. Opt. Express 2015, 23, 12321–12327. [Google Scholar] [CrossRef] [PubMed]
  39. Ghimire, E.; DiChiara, A.D.; Sistrunk, E.; Agostini, P.; DiMauro, L.F.; Reis, D.A. Observation of high-order harmonic generation in a bulk crystal. Nat. Phys. 2011, 7, 138–141. [Google Scholar] [CrossRef]
  40. Luu, T.T.; Wörner, H.J. High-order harmonic generation in solids: A unifying approach. Phys. Rev. B 2016, 94, 115164. [Google Scholar] [CrossRef]
  41. Han, S.; Kim, H.; Kim, Y.W.; Kim, Y.J.; Kim, S.; Park, I.Y.; Kim, S.W. High-harmonic generation by field enhanced femtosecond pulses in metal-sapphire nanostructure. Nat. Commun. 2016, 7, 13105. [Google Scholar] [CrossRef] [PubMed]
  42. Constant, E.; Garzella, D.; Breger, P.; Mével, E.; Dorrer, Ch.; Le Blanc, C.; Salin, F.; Agostini, P. Optimizing High Harmonic Generation in Absorbing Gases: Model and Experiment. Phys. Rev. Lett. 1999, 82, 1668. [Google Scholar] [CrossRef]
  43. Papadogiannis, N.A.; Nikolopoulos, L.A.A.; Charalambidis, D.; Tzallas, P.; Tsakiris, G.; Witte, K. Two-photon ionization of He through a superposition of higher harmonics. Phys. Rev. Lett. 2003, 90, 133902. [Google Scholar] [CrossRef] [PubMed]
  44. Hergott, J.F.; Kovacev, M.; Merdji, H.; Hubert, C.; Jean, E.; Breger, P.; Agostini, P.; Carré, B.; Salières, P. Extreme-ultraviolet high-order harmonic pulses in the microjoule range. Phys. Rev. A 2002, 66, 021821. [Google Scholar] [CrossRef]
  45. Tzallas, P.; Charalambidis, D.; Papadogiannis, N.A.; Witte, K.; Tsakiris, G.D. Direct observation of attosecond light bunching. Nature 2003, 426, 267–271. [Google Scholar] [CrossRef] [PubMed]
  46. Skantzakis, E.; Tzallas, P.; Kruse, J.; Kalpouzos, C.; Charalambidis, D. Coherent continuum extreme ultraviolet radiation in the sub-100-nJ range generated by a high-power many-cycle laser field. Opt. Lett. 2009, 34, 1732–1734. [Google Scholar] [CrossRef] [PubMed]
  47. Midorikawa, K.; Nabekawa, Y.; Suda, A. XUV multiphoton processes with intense high-order harmonics. Prog. Quant. Electron. 2008, 32, 43–88. [Google Scholar] [CrossRef]
  48. Tzallas, P.; Skantzakis, E.; Nikolopoulos, L.A.A.; Tsakiris, G.D.; Charalambidis, D. Extreme-ultraviolet pump–probe studies of one-femtosecond-scale electron dynamics. Nat. Phys. 2011, 7, 781–784. [Google Scholar] [CrossRef]
  49. Sansone, G.; Poletto, L.; Nisoli, M. High-energy attosecond light sources. Nat. Photonics 2011, 5, 655–663. [Google Scholar] [CrossRef]
  50. Takahashi, E.J.; Lan, P.; Mücke, O.D.; Nabekawa, Y.; Midorikawa, K. Attosecond nonlinear optics using gigawatt-scale isolated attosecond pulses. Nat. Commun. 2013, 4, 2691. [Google Scholar] [CrossRef] [PubMed]
  51. Brizuela, F.; Heyl, C.M.; Rudawski, P.; Kroon, D.; Rading, L.; Dalhström, J.M.; Mauritsson, J.; Johnsson, P.; Arnold, C.L.; L’Huillier, A. Efficient high-order harmonic generation boosted by below-threshold harmonics. Sci. Rep. 2013, 3, 1410. [Google Scholar] [CrossRef] [PubMed]
  52. Manschwetus, B.; Rading, L.; Campi, F.; Maclot, S.; Coudert-Alteirac, H.; Lahl, J.; Wikmark, H.; Rudawski, P.; Heyl, C.M.; Farkas, B.; et al. Two-photon double ionization of neon using an intense attosecond pulse train. Phys. Rev. A 2016, 93, 061402. [Google Scholar] [CrossRef]
  53. Wu, Y.; Cunninghmam, E.; Zang, H.; Li, J.; Chini, M. Generation of high-flux attosecond extreme ultraviolet continuum with a 10 TW laser. Appl. Phys. Lett. 2013, 102, 201104. [Google Scholar] [CrossRef]
  54. Nomura, Y.; Hörlein, R.; Tzallas, P.; Dromey, B.; Rykovanov, S.; Major, Z.S.; Osterhoff, J.; Karsch, S.; Veisz, L.; Zepf, M.; et al. Attosecond phase locking of harmonics emitted from laser-produced plasmas. Nat. Phys. 2009, 5, 124–128. [Google Scholar] [CrossRef]
  55. Heissler, P.; BarnaJ, A.; Mikhailova, J.M.; Ma, G.; Khrennikov, K.; KarschL, S.; Veisz, L.; Földes, I.B.; Tsakiri, G.D. Multi-μJ harmonic emission energy from laser-driven plasma. Appl. Phys. B 2015, 118, 195–201. [Google Scholar] [CrossRef]
  56. Bierbach, J.; Rödel, C.; Yeung, M.; Dromey, B.; Hahn, T.; Pour, A.G.; Fuchs, S.; Paz, A.E.; Herzer, S.; Kuschel, S.; et al. Generation of 10 μW relativistic surface high-harmonic radiation at a repetition rate of 10 Hz. New J. Phys. 2012, 14, 065005. [Google Scholar] [CrossRef]
  57. Thaury, C.; Quéré, F.; Geindre, J.P.; Levy, A.; Ceccotti, T.; Monot, P.; Bougeard, M.; Réau, F.; d’Oliveira, P.; Audebert, P.; et al. Plasma mirrors for ultrahigh-intensity optics. Nat. Phys. 2007, 3, 424–429. [Google Scholar] [CrossRef]
  58. Heissler, P.; Hörlein, R.; Stafe, M.; Mikhailova, J.M.; Nomura, Y.; Hermann, D.; Tautz, R.; Rykovanov, S.G.; Földes, I.B.; Varju, K.; et al. Toward single attosecond pulses using harmonic emission from solid-density plasmas. Appl. Phys. B 2010, 101, 511–521. [Google Scholar] [CrossRef]
  59. Gibbon, P. Harmonic Generation by Femtosecond Laser-Solid Interaction: A Coherent “Water-Window” Light Source? Phys. Rev. Lett. 1996, 76, 50. [Google Scholar] [CrossRef] [PubMed]
  60. Lichters, E.; Meyer-Teh-Vehn, J.; Pukhov, A. Short-pulse laser harmonics from oscillating plasma surfaces driven at relativistic intensity. Phys. Plasmas 1996, 3, 3425–3437. [Google Scholar] [CrossRef]
  61. Dromey, B.; Adams, D.; Hörlein, R.; Nomura, Y.; Rykovanov, S.G.; Carroll, D.C.; Foster, P.S.; Kar, S.; Markey, K.; McKenna, P.; et al. Diffraction-limited performance and focusing of high harmonics from relativistic plasmas. Nat. Phys. 2009, 5, 146–152. [Google Scholar] [CrossRef]
  62. Sola, I.J.; Mével, E.; Elouga, L.; Constant, E.; Strelkov, V.; Poletto, L.; Villoresi, P.; Benedetti, E.; Caumes, J.P.; Stagira, S.; et al. Controlling attosecond electron dynamics by phase-stabilized polarization gating. Nat. Phys. 2006, 2, 319–322. [Google Scholar] [CrossRef]
  63. Sansone, G.; Benedetti, E.; Calegari, F.; Vozzi, C.; Avaldi, L.; Flammini, R.; Poletto, L.; Villoresi, P.; Altucci, C.; Velotta, R.; et al. Isolated Single-Cycle Attosecond Pulses. Science 2006, 314, 443–446. [Google Scholar] [CrossRef] [PubMed]
  64. Tzallas, P.; Skantzakis, E.; Kalpouzos, C.; Benis, E.P.; Tsakiris, G.D.; Charalambidis, D. Generation of intense continuum extreme-ultraviolet radiation by many-cycle laser fields. Nat. Phys. 2007, 3, 846–850. [Google Scholar] [CrossRef]
  65. Abel, M.J.; Pfeifer, T.; Nagel, P.M.; Boutu, W.; Bell, M.J.; Steiner, C.P.; Neumark, D.M.; Leone, S.R. Isolated attosecond pulses from ionization gating of high-harmonic emission. Chem. Phys. 2009, 366, 9–14. [Google Scholar] [CrossRef]
  66. Ferrari, F.; Calegari, F.; Lucchini, M.; Vozzi, C.; Stagira, S.; Sansone, G.; Nisoli, M. High-energy isolated attosecond pulses generated by above-saturation few-cycle fields. Nat. Photonics 2010, 4, 875–879. [Google Scholar] [CrossRef]
  67. Wheeler, J.A.; Borot, A.; Monchocé, S.; Vincenti, H.; Ricci, A.; Malvache, A.; Lopez-Martens, R.; Quéré, F. Attosecond lighthouses from plasma mirrors. Nat. Photonics 2012, 6, 829–833. [Google Scholar] [CrossRef]
  68. Kim, K.T.; Zhang, C.; Ruchon, T.; Hergott, J.F.; Auguste, T.; Villeneuve, D.M.; Corkum, P.B.; Quéré, F. Photonic streaking of attosecond pulse trains. Nat. Photonics 2013, 7, 651–656. [Google Scholar] [CrossRef]
  69. Quéré, F.; Vincenti, H.; Borot, A.; Monchocé, S.; Hammond, T.J.; Kim, K.T.; Wheeler, J.A.; Zhang, C.; Ruchon, T.; Auguste, T. Applications of ultrafast wavefront rotation in highly nonlinear optics. J. Phys. B At. Mol. Opt. Phys. 2014, 47, 124004. [Google Scholar] [CrossRef]
  70. Feng, X.; Gilbertson, S.; Mashiko, H.; Wang, H.; Khan, S.D.; Chini, M.; Wu, Y.; Zhao, K.; Chang, Z. Generation of Isolated Attosecond Pulses with 20 to 28 Femtosecond Lasers. Phys. Rev. Lett. 2009, 103, 183901. [Google Scholar] [CrossRef] [PubMed]
  71. Takahashi, E.J.; Lan, P.; Mücke, O.D.; Nabekawa, Y.; Midorikawa, K. Infrared Two-Color Multicycle Laser Field Synthesis for Generating an Intense Attosecond Pulse. Phys. Rev. Lett. 2010, 104, 233901. [Google Scholar] [CrossRef] [PubMed]
  72. Kolliopoulos, G.; Carpeggiani, P.A.; Rompotis, D.; Charalambidis, D.; Tzallas, P. A compact collinear polarization gating scheme for many cycle laser pulses. Rev. Sci. Instr. 2012, 83, 063102. [Google Scholar] [CrossRef] [PubMed]
  73. Haessler, S.; Balciunas, T.; Fan, G.; Chipperfield, L.E.; Baltuska, A. Enhanced multi-colour gating for the generation of high-power isolated attosecond pulses. Sci. Rep. 2015, 5, 10084. [Google Scholar] [CrossRef] [PubMed]
  74. Shiner, A.D.; Trallero-Herrero, C.; Kajumba, N.; Bandulet, H.-C.; Comtois, D.; Légaré, F.; Giguère, M.; Kieffer, J.C.; Corkum, P.B.; Villeneuve, D.M. Wavelength Scaling of High Harmonic Generation Efficiency. Phys. Rev. Lett. 2009, 103, 073902. [Google Scholar] [CrossRef] [PubMed]
  75. L’Huillier, A.; Li, X.F.; Lompré, L.A. Propagation effects in high-order harmonic gene-ration in rare gases. J. Opt. Soc. Am. B 1990, 7, 527–536. [Google Scholar] [CrossRef]
  76. Priori, E.; Cerullo, G.; Nisoli, M.; Stagira, S.; De Silvestri, S.; Villoresi, P.; Poletto, L.; Ceccherini, P.; Altucci, C.; Bruzzese, R.; et al. Nonadiabatic three-dimensional model of high-order harmonic generation in the few-optical-cycle regime. Phys. Rev. A 2000, 61, 063801. [Google Scholar] [CrossRef]
  77. Jin, C.; Le, A.T.; Lin, C.D. Medium propagation effects in high-order harmonic generation of Ar and N2. Phys. Rev. A 2011, 83, 023411. [Google Scholar] [CrossRef]
  78. Seres, J.; Yakovlev, V.S.; Seres, E.; Streli, C.; Wobrauschek, P.; Spielmann, C.; Krausz, F. Coherent superposition of laser-driven soft-X-ray harmonics from successive sources. Nat. Phys. 2007, 3, 878–883. [Google Scholar] [CrossRef]
  79. Popmintchev, T.; Chen, M.-C.; Popmintchev, D.; Arpin, P.; Brown, S.; Ališauskas, S.; Andriukaitis, G.; Balčiunas, T.; Mücke, O.D.; Pugzlys, A.; et al. Bright Coherent Ultrahigh Harmonicsin the keV X-ray Regime from Mid-Infrared Femtosecond Lasers. Science 2012, 336, 1287–1291. [Google Scholar] [CrossRef] [PubMed]
  80. Teichmann, S.M.; Silva, F.; Cousin, S.L.; Hemmer, M.; Biegert, J. 0.5-keV Soft X-ray attosecond continua. Nat. Commun. 2016, 7, 11493. [Google Scholar] [CrossRef] [PubMed]
  81. Zhao, K.; Zhang, Q.; Chini, M.; Wu, Y.; Wang, X.; Chang, Z. Tailoring a 67 attosecond pulse through advantageous phase-mismatch. Opt. Lett. 2012, 37, 3891–3893. [Google Scholar] [CrossRef] [PubMed]
  82. Leblanc, A.; Denoeud, A.; Chopineau, L.; Mennerat, G.; Martin, P.; Quéré, F. Plasma holograms for ultrahigh-intensity optics. Nat. Phys. 2017. [Google Scholar] [CrossRef]
  83. Goulielmakis, E.; Schultze, M.; Hofstetter, M.; Yakovlev, V.S.; Gagnon, J.; Uiberacker, M.; Aquila, A.L.; Gullikson, E.M.; Attwood, D.T.; Kienberger, R.; et al. Single-Cycle Nonlinear Optics. Science 2008, 320, 1614–1617. [Google Scholar] [CrossRef] [PubMed]
  84. Vincenti, H.; Monchocé, S.; Kahaly, S.; Bonnaud, G.; Martin, P.; Quéré, F. Optical properties of relativistic plasma mirrors. Nat. Commun. 2014, 5, 3403. [Google Scholar] [CrossRef] [PubMed]
  85. Monchocé, S.; Kahaly, S.; Leblanc, A.; Videau, L.; Combis, P.; Réau, F.; Garzella, D.; D’Oliveira, P.; Martin, P.; Quéré, F. Optically Controlled Solid-Density Transient Plasma Gratings. Phys. Rev. Lett. 2014, 112, 145008. [Google Scholar] [CrossRef] [PubMed]
  86. Leblanc, A.; Monchocé, S.; Bourassin-Bouchet, C.; Kahaly, S.; Quéré, F. Ptychographic measurements of ultrahigh-intensity laser–plasma interactions. Nat. Phys. 2016, 12, 301. [Google Scholar] [CrossRef]
  87. Tsakiris, G.D.; Eidmann, K.; Meyer-ter-Vehn, J.; Krausz, F. Route to intense single attosecond pulses. New J. Phys. 2006, 8, 19. [Google Scholar] [CrossRef]
  88. Heissler, P.; Hörlein, R.; Mikhailova, J.M.; Waldecker, L.; Tzallas, P.; Buck, A.; Schmid, K.; Sears, C.M.S.; Krausz, F.; Veisz, L.; et al. Few-Cycle Driven Relativistically Oscillating Plasma Mirrors: A Source of Intense Isolated Attosecond Pulses. Phys. Rev. Lett. 2012, 108, 235003. [Google Scholar] [CrossRef] [PubMed]
  89. Dromey, B.; Zepf, M.; Gopal, A.; Lancaster, K.; Wei, M.S.; Krushelnick, K.; Tatarakis, M.; Vakakis, N.; Moustaizis, S.; Kodama, R.; et al. High harmonic generation in the relativistic limit. Nat. Phys. 2006, 2, 456–459. [Google Scholar] [CrossRef]
  90. Danson, C.N.; Brummitt, P.A.; Clarke, R.J.; Collier, J.L.; Fell, B.; Frackiewicz, A.J.; Hancock, S.; Hawkes, S.; Hernandez-Gomez, C.; Holligan, P.; et al. Vulcan Petawatt—An ultra-high-intensity interaction facility. Nucl. Fusion 2004, 44, S239. [Google Scholar] [CrossRef]
  91. Borot, A.; Malvache, A.; Chen, X.; Jullien, A.; Geindre, J.-P.; Audebert, P.; Mourou, G.; Quéré, F.; Lopez-Martens, R. Attosecond control of collective electron motion in plasmas. Nat. Phys. 2012, 8, 416–421. [Google Scholar] [CrossRef]
  92. Heissler, P.; Tzallas, P.; Mikhailova, J.M.; Khrennikov, K.; Waldecker, L.; Krausz, F.; Karsch, S.; Charalambidis, D.; Tsakiris, G.D. Two-photon above-threshold ionization using extreme-ultraviolet harmonic emission from relativistic laser–plasma interaction. New J. Phys. 2012, 14, 043025. [Google Scholar] [CrossRef]
  93. Ammosov, M.V.; Delone, N.B.; Krainov, V.P. Tunnel ionization of complex atoms and of atomic ions in an alternating electromagnetic field. Sov. Phys. JETP 1986, 64, 1191. [Google Scholar]
  94. Perelomov, A.M.; Popov, V.S.; Terent’ev, M.V. Ionization of atoms in an alternating electric field. Sov. Phys. JETP 1966, 23, 924. [Google Scholar]
  95. Zaïr, A.; Holler, M.; Guandalini, A.; Schapper, F.; Biegert, J.; Gallmann, L.; Keller, U.; Wyatt, A.S.; Monmayrant, A.; Walmsley, I.A.; et al. Quantum Path Interferences in High-Order Harmonic Generation. Phys. Rev. Lett. 2008, 100, 143902. [Google Scholar] [CrossRef] [PubMed]
  96. Corsi, C.; Pirri, A.; Sali, E.; Tortora, A.; Bellini, M. Direct interferometric measurement of the atomic dipole phase in high-order harmonic generation. Phys. Rev. Lett. 2006, 97, 023901. [Google Scholar] [CrossRef] [PubMed]
  97. Kruse, J.E.; Tzallas, P.; Skantzakis, E.; Kalpouzos, C.; Tsakiris, G.D.; Charalambidis, D. Inconsistencies between two attosecond pulse metrology methods: A comparative study. Phys. Rev. A 2010, 82, 021402. [Google Scholar] [CrossRef]
  98. Kolliopoulos, G.; Bergues, B.; Schröder, H.; Carpeggiani, P.A.; Veisz, L.; Tsakiris, G.D.; Charalambidis, D.; Tzallas, P. Revealing quantum path details in high-field physics. Phys. Rev. A 2014, 90, 013822. [Google Scholar] [CrossRef]
  99. Heyl, C.M.; Coudert-Alteirac, H.; Miranda, M.; Louisy, M.; Kovacs, K.; Tosa, V.; Balogh, E.; Varjú, K.; L’Huillier, A.; Couairon, A.; et al. Scale-invariant nonlinear optics in gases. Optica 2016, 3, 75–81. [Google Scholar] [CrossRef]
  100. Varjú, K.; Mairesse, Y.; Carré, B.; Gaarde, B.M.; Johnsson, P.; Kazamias, S.; López-Martens, R.; Mauritsson, J.; Schafer, K.J.; Balcou, P.; et al. Frequency chirp of harmonic and attosecond pulses. J. Mod. Opt. 2004, 52, 379–394. [Google Scholar] [CrossRef]
  101. Antoine, P.; L’huillier, A.; Lewenstein, M. Attosecond pulse trains using high–order harmonics. Phys. Rev. Lett. 1996, 77, 1234. [Google Scholar] [CrossRef] [PubMed]
  102. Balcou, P.; Salieres, P.; L’Huillier, A.; Lewenstein, M. Generalized phase-matching conditions for high harmonics: The role of field-gradient forces. Phys. Rev. A 1997, 55, 3204. [Google Scholar] [CrossRef]
  103. Bellini, M.; Lyngå, C.; Tozzi, A.; Gaarde, M.B.; Hänsch, T.W.; L’Huillier, A.; Wahlström, C.G. Temporal coherence of ultrashort high-order harmonic pulses. Phys. Rev. Lett. 1998, 81, 297. [Google Scholar] [CrossRef]
  104. Gaarde, M.B.; Schafer, K.J. Space-time considerations in the phase locking of high harmonics. Phys. Rev. Lett. 2002, 89, 213901. [Google Scholar] [CrossRef] [PubMed]
  105. Brugnera, L.; Hoffmann, D.J.; Siegel, T.; Frank, F.; Zaïr, A.; Tisch, J.W.; Marangos, J.P. Trajectory selection in high harmonic generation by controlling the phase between orthogonal two-color fields. Phys. Rev. Lett. 2011, 107, 153902. [Google Scholar] [CrossRef] [PubMed]
  106. Hutchison, C.; Houver, S.; Lin, N.; Hoffmann, D.J.; McGrath, F.; Siegel, T.; Marangos, J.P. Electron trajectory control of odd and even order harmonics in high harmonic generation using an orthogonally polarised second harmonic field. J. Mod. Opt. 2014, 61, 608. [Google Scholar] [CrossRef]
  107. Mashiko, H.; Gilbertson, S.; Li, C.; Khan, S.D.; Shakya, M.M.; Moon, E.; Chang, Z. Double Optical Gating of High-Order Harmonic Generation with Carrier-Envelope Phase Stabilized Lasers. Phys. Rev. Lett. 2008, 100, 103906. [Google Scholar] [CrossRef] [PubMed]
  108. Tzallas, P.; Skantzakis, E.; Charalambidis, D. Measuring the absolute carrier-envelope phase of many-cycle laser fields. Phys. Rev. A 2010, 82, 061401. [Google Scholar] [CrossRef]
  109. Tosa, V.; Kovacs, K.; Major, B.; Balogh, E.; Varju, K. Propagation effects in highly ionised gas media. Quantum Electron. 2016, 46, 321. [Google Scholar] [CrossRef]
  110. Tosa, V.; Kim, K.; Nam, C.H. Macroscopic generation of attosecond-pulse trains in strongly ionized media. Phys. Rev. A 2009, 79, 043828. [Google Scholar] [CrossRef]
  111. Schütte, B.; Weber, P.; Kovács, K.; Balogh, E.; Major, B.; Tosa, V.; Han, S.; Vrakking, M.J.J.; Varjú, K.; Rouzée, A. Bright attosecond soft X-ray pulse trains by transient phase-matching in two-color high-order harmonic generation. Opt. Express 2015, 23, 33947–33955. [Google Scholar] [CrossRef] [PubMed]
  112. Rudawski, P.; Heyl, C.M.; Brizuela, F.; Schwenke, J.; Persson, A.; Mansten, E.; Rakowski, R.; Rading, L.; Campi, F.; Kim, B.; et al. A high-flux high-order harmonic source. Rev. Sci. Instr. 2013, 84, 073103. [Google Scholar] [CrossRef] [PubMed]
  113. Dubrouil, A.; Hort, O.; Catoire, F.; Descamps, D.; Petit, S.; Mével, E.; Constant, E. Spatio–spectral structures in high-order harmonic beams generated with Terawatt 10-fs pulses. Nat. Commun. 2014, 5, 4637. [Google Scholar] [CrossRef] [PubMed]
  114. Popmintchev, T.; Chen, M.-C.; Arpin, P.; Murnane, M.M.; Kapteyn, H.C. The attosecond nonlinear optics of bright coherent X-ray generation. Nat. Photonics 2010, 4, 822–832. [Google Scholar] [CrossRef]
  115. Balogh, E.; Varjú, K. Field strength scaling in quasi-phase-matching of high-order harmonic generation by low-intensity assisting fields. J. Opt. Soc. Am. B 2016, 33, 230–238. [Google Scholar] [CrossRef]
  116. Hörlein, R.; Nomura, Y.; Tzallas, P.; Rykovanov, S.G.; Dromey, B.; Osterhoff, J.; Major, Z.; Karsch, S.; Veisz, L.; Zepf, M.; et al. Temporal characterization of attosecond pulses emitted from solid-density plasmas. New J. Phys. 2010, 12, 043020. [Google Scholar] [CrossRef]
  117. Tarasevitch, A.; Orisch, A.; von der Linde, D.; Balcou, P.; Rey, G.; Chambaret, J.P.; Teubner, U.; Klöpfel, D.; Theobald, W. Generation of high-order spatially coherent harmonics from solid targets by femtosecond laser pulses. Phys. Rev. A 2000, 62, 023816. [Google Scholar] [CrossRef]
  118. Kahaly, S.; Monchocé, S.; Vincenti, H.; Dzelzainis, T.; Dromey, B.; Zepf, M.; Martin, P.; Quéré, F. Direct Observation of Density-Gradient Effects in Harmonic Generation from Plasma Mirrors. Phys. Rev. Lett. 2013, 110, 175001. [Google Scholar] [CrossRef] [PubMed]
  119. Ma, G.; Dallari, W.; Borot, A.; Krausz, F.; Yu, W.; Tsakiris, G.D.; Veisz, L. Intense isolated attosecond pulse generation from relativistic laser plasmas using few-cycle laser pulses. Phys. Plasmas 2016, 22, 033105. [Google Scholar] [CrossRef]
  120. An der Brügge, D.; Kumar, N.; Pukhov, A.; Rödel, C. Influence of Surface Waves on Plasma High-Order Harmonic Generation. Phys. Rev. Lett. 2012, 108, 125002. [Google Scholar] [CrossRef] [PubMed]
  121. Dromey, B.; Rykovanov, S.; Yeung, M.; Hörlein, R.; Jung, D.; Gautier, D.C.; Dzelzainis, T.; Kiefer, D.; Palaniyppan, S.; Shah, R.; et al. Coherent synchrotron emission from electron nanobunches formed in relativistic laser–plasma interactions. Nat. Phys. 2012, 8, 804–808. [Google Scholar] [CrossRef]
  122. Mikhailova, J.M.; Fedorov, M.V.; Karpowicz, N.; Gibbon, P.; Platonenko, V.T.; Zheltikov, A.M.; Krausz, F. Isolated Attosecond Pulses from Laser-Driven Synchrotron Radiation. Phys. Rev. Lett. 2012, 109, 245005. [Google Scholar] [CrossRef] [PubMed]
  123. Dromey, B.; Cousens, S.; Rykovanov, S.; Yeung, M.; Jung, D.; Gautier, D.C.; Dzelzainis, T.; Kiefer, D.; Palaniyppan, S.; Shah, R.; et al. Coherent synchrotron emission in transmission from ultrathin relativistic laser plasmas. New J. Phys. 2013, 15, 015025. [Google Scholar] [CrossRef]
  124. Cousens, S.; Reville, B.; Dromey, B.; Zepf, M. Temporal Structure of Attosecond Pulses from Laser-Driven Coherent Synchrotron Emission. Phys. Rev. Lett. 2016, 116, 083901. [Google Scholar] [CrossRef] [PubMed]
  125. Yeung, M.; Rykovanov, S.; Bierbach, J.; Li, L.; Eckner, E.; Kuschel, S.; Woldegeorgis, A.; Rödel, C.; Sävert, A.; Paulus, G.G.; et al. Experimental observation of attosecond control over relativistic electron bunches with two-colour fields. Nat. Photonics 2017, 11, 32–35. [Google Scholar] [CrossRef]
  126. Teubner, U.; Eidmann, K.; Wagner, U.; Andiel, U.; Pisani, F.; Tsakiris, G.D.; Witte, K.; Meyer-ter-Vehn, J.; Schlegel, T.; Förster, E. Harmonic Emission from the Rear Side of Thin Overdense Foils Irradiated with Intense Ultrashort Laser Pulses. Phys. Rev. Lett. 2004, 92, 185001. [Google Scholar] [CrossRef] [PubMed]
  127. Brunel, F. Not-so-resonant, resonant absorption. Phys. Rev. Lett. 1987, 59, 52. [Google Scholar] [CrossRef] [PubMed]
  128. Hinkel-Lipsker, D.E.; Fried, B.D.; Morales, G.J. Analytic expression for mode conversion of Langmuir and electromagnetic waves. Phys. Rev. Lett. 1989, 62, 2680. [Google Scholar] [CrossRef] [PubMed]
  129. Bulanov, S.V.; Naumova, N.M.; Pegoraro, F. Interaction of an ultrashort, relativistically strong laser pulse with an overdense plasma. Phys. Plasmas 1994, 1, 745–757. [Google Scholar] [CrossRef]
  130. Gordienko, S.; Pukhov, A.; Shorokhov, O.; Baeva, T. Relativistic Doppler Effect: Universal Spectra and Zeptosecond Pulses. Phys. Rev. Lett. 2004, 93, 115002. [Google Scholar] [CrossRef] [PubMed]
  131. Baeva, T.; Gordienko, S.; Pukhov, A. Relativistic plasma control for single attosecond x-ray burst generation. Phys. Rev. E 2006, 74, 065401. [Google Scholar] [CrossRef] [PubMed]
  132. Baeva, T.; Gordienko, S.; Pukhov, A. Relativistic plasma control for single attosecond pulse generation: Theory, simulations, and structure of the pulse. Laser Part. Beams 2007, 25, 339. [Google Scholar] [CrossRef]
  133. Dromey, B.; Kar, S.; Bellei, C.; Carroll, D.C.; Clarke, R.J.; Green, J.S.; Kneip, S.; Markey, K.; Nagel, S.R.; Simpson, P.T.; et al. Bright Multi-keV Harmonic Generation from Relativistically Oscillating Plasma Surfaces. Phys. Rev. Lett. 2007, 99, 085001. [Google Scholar] [CrossRef] [PubMed]
  134. Gonoskov, A.A.; Korzhimanov, A.V.; Kim, A.V.; Marklund, M.; Sergeev, A.M. Ultrarelativistic nanoplasmonics as a route towards extreme-intensity attosecond pulses. Phys. Rev. E 2011, 84, 046403. [Google Scholar] [CrossRef] [PubMed]
  135. Debayle, A.; Sanz, J.; Gremillet, L. Self-consistent theory of high-order harmonic generation by relativistic plasma mirror. Phys. Rev. E 2015, 92, 053108. [Google Scholar] [CrossRef] [PubMed]
  136. Zepf, M.; Tsakiris, G.D.; Pretzler, G.; Watts, I.; Chambers, D.M.; Norreys, P.A.; Andiel, U.; Dangor, A.E.; Eidmann, K.; Gahn, C.; et al. Role of the plasma scale length in the harmonic generation from solid targets. Phys. Rev. E 1998, 58, 5253. [Google Scholar] [CrossRef]
  137. Watts, I.; Zepf, M.; Clark, E.L.; Tatarakis, M.; Krushelnick, K.; Dangor, A.E.; Allott, R.M.; Clarke, R.J.; Neely, D.; Norreys, P.A. Dynamics of the Critical Surface in High-Intensity Laser-Solid Interactions: Modulation of the XUV Harmonic Spectra. Phys. Rev. Lett. 2002, 88, 155001. [Google Scholar] [CrossRef] [PubMed]
  138. Teubner, U.; Pretzler, G.; Schlegel, T.; Eidmann, K.; Förster, E.; Witte, K. Anomalies in high-order harmonic generation at relativistic intensities. Phys. Rev. A 2003, 67, 013816. [Google Scholar] [CrossRef]
  139. Rykovanov, S.G.; Geissler, M.; Meyer-ter-Vehn, J.; Tsakiris, G.D. Intense single attosecond pulses from surface harmonics using the polarization gating technique. New J. Phys. 2008, 10, 025025. [Google Scholar] [CrossRef]
  140. Rykovanov, S.G.; Ruhl, H.; Meyer-ter-Vehn, J.; Hörlein, R.; Dromey, B.; Zepf, M.; Tsakiris, G.D. Plasma surface dynamics and smoothing in the relativistic few-cycle regime. New J. Phys. 2011, 13, 023008. [Google Scholar] [CrossRef]
  141. Vincenti, H.; Quéré, F. Attosecond lighthouses: How to use spatiotemporally coupled light fields to generate isolated attosecond pulses. Phys. Rev. Lett. 2012, 108, 113904. [Google Scholar] [CrossRef] [PubMed]
  142. Akturk, S.; Gu, X.; Gabolde, P.; Trebino, R. The general theory of first-order spatio-temporal distortions of Gaussian pulses and beams. Opt. Express 2005, 13, 8642–8661. [Google Scholar] [CrossRef] [PubMed]
  143. Hammond, T.J.; Brown, G.G.; Kim, K.T.; Villeneuve, D.M.; Corkum, P.B. Attosecond pulses measured from the attosecond lighthouse. Nat. Photonics 2016, 10, 171. [Google Scholar] [CrossRef]
  144. Mairesse, Y.; de Bohan, A.; Frasinski, L.J.; Merdji, H.; Dinu, L.C.; Monchicourt, P.; Breger, P.; Kovacev, M.; Taïeb, R.; Carré, B.; et al. Attosecond synchronization of high-harmonic soft x-rays. Science 2003, 302, 1540–1543. [Google Scholar] [CrossRef] [PubMed]
  145. Paulus, G.G.; Grasbon, F.; Walther, H.; Villoresi, P.; Nisoli, M.; Stagira, S.; Priori, E.; De Silvestri, S. Absolute-phase phenomena in photoionization with few-cycle laser pulses. Nature 2001, 414, 182–184. [Google Scholar] [CrossRef] [PubMed]
  146. Paul, P.M.; Toma, E.S.; Breger, P.; Mullot, G.; Auge, F.; Balcou, P.; Muller, H.G.; Agostini, P. Observation of a train of attosecond pulses from high harmonic generation. Science 2001, 292, 1689–1692. [Google Scholar] [CrossRef] [PubMed]
  147. Takahashi, E.J.; Hasegawa, H.; Nabekawa, Y.; Midorikawa, K. High-throughput, high-damage-threshold broadband beam splitter for high-order harmonics in the extreme-ultraviolet region. Opt. Lett. 2004, 29, 507–509. [Google Scholar] [CrossRef] [PubMed]
  148. Nagata, Y.; Nabekawa, Y.; Midorikawa, K. Development of High-Throughput, High-Damage-Threshold Beam Separator for 13 nm High-Order Harmonics. Opt. Lett. 2006, 31, 1316–1318. [Google Scholar] [CrossRef] [PubMed]
  149. Wolter, H. Spiegelsysteme streifenden Einfalls als abbildende Optiken für Röntgenstrahlen. Ann. Phys. 1952, 445, 94–114. [Google Scholar] [CrossRef]
  150. Tsatrafyllis, N.; Bergues, B.; Schröder, H.; Veisz, L.; Skantzakis, E.; Gray, D.; Bodi, B.; Kuhn, S.; Tsakiris, G.D.; Charalambidis, D.; et al. The ion microscope as a tool for quantitative measurements in the extreme ultraviolet. Sci. Rep. 2016, 6, 21556. [Google Scholar] [CrossRef] [PubMed]
  151. Goulielmakis, E.; Yakovlev, V.S.; Cavalieri, A.L.; Uiberacker, M.; Pervak, V.; Apolonski, A.; Kienberger, R.; Kleineberg, U.; Krausz, F. Attosecond Control and Measurement: Lightwave Electronics. Science 2007, 317, 769–775. [Google Scholar] [CrossRef] [PubMed]
  152. Frank, F.; Arrell, C.; Witting, T.; Okell, W.A.; McKenna, J.; Robinson, J.S.; Haworth, C.A.; Austin, D.; Teng, H.; Walmsley, I.A.; et al. Invited Review Article: Technology for Attosecond Science. Rev. Sci. Instrum. 2012, 83, 071101. [Google Scholar] [CrossRef] [PubMed]
  153. Frassetto, F.; Trabattoni, A.; Anumula, S.; Sansone, G.; Calegari, F.; Nisoli, M.; Poletto, L. High-throughput beamline for attosecond pulses based on toroidal mirrors with microfocusing capabilities. Rev. Sci. Instrum. 2014, 85, 103115. [Google Scholar] [CrossRef] [PubMed]
  154. Locher, R.; Lucchini, M.; Herrmann, J.; Sabbar, M.; Weger, M.; Ludwig, A.; Castiglioni, L.; Greif, M.; Hengsberger, M.; Gallmann, L.; et al. Versatile attosecond beamline in a two-foci configuration for simultaneous time-resolved measurements. Rev. Sci. Instrum. 2014, 85, 013113. [Google Scholar] [CrossRef] [PubMed]
  155. Schultze, M.; Bergues, B.; Schröder, H.; Krausz, F.; Kompa, K.L. Spatially resolved measurement of ionization yields in the focus of an intense laser pulse. New J. Phys. 2011, 13, 033001. [Google Scholar] [CrossRef]
  156. Tzallas, P.; Skantzakis, E.; Charalambidis, D. Direct two-XUV-photon double ionization in xenon. J. Phys. B At. Mol. Opt. Phys. 2012, 45, 074007. [Google Scholar] [CrossRef]
  157. Skantzakis, E.; Tzallas, P.; Kruse, j.E.; Kalpouzos, C.; Faucher, O.; Tsakiris, G.D.; Charalambidis, D. Tracking Autoionizing-Wave-Packet Dynamics at the 1-fs Temporal Scale. Phys. Rev. Lett. 2010, 105, 043902. [Google Scholar] [CrossRef] [PubMed]
  158. Carpeggiani, P.A.; Tzallas, P.; Palacios, A.; Gray, D.; Martín, F.; Charalambidis, D. Disclosing intrinsic molecular dynamics on the 1-fs scale through extreme-ultraviolet pump-probe measurements. Phys. Rev. A 2014, 89, 023420. [Google Scholar] [CrossRef]
  159. Nabekawa, Y.; Shimizu, T.; Okino, T.; Furusawa, K.; Hasegawa, H.; Yamanouchi, K.; Midorikawa, K. Conclusive Evidence of an Attosecond Pulse Train Observed with the Mode-Resolved Autocorrelation Technique. Phys. Rev. Lett. 2006, 96, 083901. [Google Scholar] [CrossRef] [PubMed]
  160. Drescher, M.; Hentschel, M.; Kienberger, R.; Tempea, G.; Spielmann, C.; Reider, G.A.; Corkum, P.B.; Krausz, F. X-ray Pulses Approaching the Attosecond Frontier. Science 2001, 291, 1923–1927. [Google Scholar] [CrossRef] [PubMed]
  161. Mairesse, Y.; Quéré, F. Frequency-resolved optical gating for complete reconstruction of attosecond bursts. Phys. Rev. A 2005, 71, 011401. [Google Scholar] [CrossRef]
  162. Chini, M.; Gilbertson, S.; Khan, S.D.; Chang, Z. Characterizing ultrabroadband attosecond lasers. Opt. Express 2010, 18, 13006–13016. [Google Scholar] [CrossRef] [PubMed]
  163. Keathley, P.D.; Bhardwaj, S.; Mose, J.; Kärtner, F.X. Volkov transform generalized projection algorithm for attosecond pulse characterization. New J. Phys. 2016, 18, 073009. [Google Scholar] [CrossRef]
  164. Grguraš, I.; Maier, A.R.; Behrens, C.; Mazza, T.; Kelly, T.J.; Radcliffe, P.; Düsterer, S.; Kazansky, A.K.; Kabachnik, N.M.; Tschentscher, T.; et al. Ultrafast X-ray pulse characterization at free-electron lasers. Nat. Photonics 2012, 6, 852–857. [Google Scholar] [CrossRef]
  165. Mairesse, Y.; Gobert, O.; Breger, P.; Merdji, H.; Meynadier, P.; Monchicourt, P.; Perdrix, M.; Salières, P.; Carré, B. High harmonic XUV spectral phase interferometry for direct electric-field reconstruction. Phys. Rev. Lett. 2005, 94, 173903. [Google Scholar] [CrossRef] [PubMed]
  166. Cormier, E.; Walmsley, I.A.; Kosik, E.M.; Wyatt, A.S.; Corner, L.; DiMauro, L.F. Self-Referencing, Spectrally, or Spatially Encoded Spectral Interferometry for the Complete Characterization of Attosecond Electromagnetic Pulses. Phys. Rev. Lett. 2005, 94, 033905. [Google Scholar] [CrossRef] [PubMed]
  167. Dudovich, N.; Smirnova, O.; Levesque, J.; Mairesse, Y.; Ivanov, M.Y.; Villeneuve, D.M.; Corkum, P.B. Measuring and controlling the birth of attosecond XUV pulses. Nat. Phys. 2006, 2, 781–786. [Google Scholar] [CrossRef]
  168. Cattaneo, L.; Vos, J.; Lucchini, M.; Gallmann, L.; Cirelli, C.; Keller, U. Comparison of attosecond streaking and RABBITT. Opt. Express 2016, 24, 29060–29076. [Google Scholar] [CrossRef] [PubMed]
  169. Tzallas, P.; Charalambidis, D.; Papadogiannis, N.A.; Witte, K.; Tsakiris, G.D. Second-order autocorrelation measurements of attosecond XUV pulse trains. J. Mod. Opt. 2005, 52, 321–338. [Google Scholar] [CrossRef]
  170. Nikolopoulos, L.A.A.; Benis, E.P.; Tzallas, P.; Charalambidis, D.; Witte, K.; Tsakiris, G.D. Second order autocorrelation of an XUV attosecond pulse train. Phys. Rev. Lett. 2005, 94, 113905. [Google Scholar] [CrossRef] [PubMed]
  171. Trebino, R.; Kane, D.J. Using phase retrieval to measure the intensity and phase of ultrashort pulses: Frequency-resolved optical gating. J. Opt. Soc. Am. A 1993, 10, 1101–1111. [Google Scholar] [CrossRef]
  172. Itatani, J.; Quéré, F.; Yudin, G.L.; Ivanov, M.Y.; Krausz, F.; Corkum, P.B. Attosecond streak camera. Phys. Rev. Lett. 2002, 88, 173903. [Google Scholar] [CrossRef] [PubMed]
  173. Kitzler, M.; Milosevic, N.; Scrinzi, A.; Krausz, F.; Brabec, T. Quantum theory of attosecond XUV pulse measurement by laser dressed photoionization. Phys. Rev. Lett. 2002, 88, 173904. [Google Scholar] [CrossRef] [PubMed]
  174. Kienberger, R.; Goulielmakis, E.; Uiberacker, M.; Baltuska, A.; Yakovlev, V.; Bammer, F.; Scrinzi, A.; Westerwalbesloh, T.; Kleinberg, U.; Heinzmann, U.; et al. Atomic transient recorder. Nature 2004, 427, 817–821. [Google Scholar] [CrossRef] [PubMed]
  175. Thaury, C.; Quéré, F. High-order harmonic and attosecond pulse generation on plasma mirrors: Basic mechanisms. J. Phys. B At. Mol. Opt. Phys. 2010, 43, 213001. [Google Scholar] [CrossRef]
  176. Thévenet, M.; Leblanc, A.; Kahaly, S.; Vincenti, H.; Vernier, A.; Quéré, F.; Faure, J. Vacuum laser acceleration of relativistic electrons using plasma mirror injectors. Nat. Phys. 2016, 12, 355. [Google Scholar] [CrossRef]
  177. Bocoum, M.; Thévenet, M.; Böhle, F.; Beaurepaire, B.; Vernier, A.; Jullien, A.; Faure, J.; Lopez-Martens, R. Anticorrelated Emission of High Harmonics and Fast Electron Beams From Plasma Mirrors. Phys. Rev. Lett. 2016, 116, 185001. [Google Scholar] [CrossRef] [PubMed]
  178. Quéré, F.; Thaury, C.; George, H.; Geindre, J.-P.; Lefebvre, E.; Bonnaud, G.; Monot, P.; Martin, P. High-order harmonic generation using plasma mirrors. Plasma Phys. Control. Fusion 2008, 50, 124007. [Google Scholar] [CrossRef]
  179. Silva, F.; Teichmann, S.M.; Cousin, S.L.; Hemmer, M.; Biegert, J. Spatiotemporal isolation of attosecond soft X-ray pulses in the water window. Nat. Commun. 2015, 6, 6611. [Google Scholar] [CrossRef] [PubMed]
  180. Nabekawa, Y.; Furukawa, Y.; Okino, T.; Eilanlou, A.A.; Takahashi, E.J.; Yamanouchi, K.; Midorikawa, K. Sub-10-fs control of dissociation pathways in the hydrogen molecular ion with a few-pulse attosecond pulse train. Nat. Commun. 2016, 7, 12835. [Google Scholar] [CrossRef] [PubMed]
  181. Palacios, A.; González-Castrillo, A.; Martín, F. Molecular interferometer to decode attosecond electron–nuclear dynamics. PNAS 2014, 111, 3973–3978. [Google Scholar] [CrossRef] [PubMed]
  182. Kühn, S.; Dumergue, M.; Kahaly, S.; Mondal, S.; Füle, M.; Csizmadia, T.; Farkas, B.; Major, B.; Calegari, F.; Devetta, M.; et al. The ELI-ALPS facility: The next generation of attosecond sources. J. Phys. B At. Mol. Opt. Phys. 2017, in press. [Google Scholar]
  183. Dinu, L.C.; Muller, H.G.; Kazamias, S.; Mullot, G.; Augé, F.; Balcou, P.; Kovačev, M.; Breger, P.; Agostini, P. Measurement of the subcycle timing of attosecond XUV bursts in high-harmonic generation. Phys. Rev. Lett. 2003, 91, 063901. [Google Scholar] [CrossRef] [PubMed]
  184. Aseyev, S.A.; Ni, Y.; Frasinski, L.J.; Muller, H.G.; Vrakking, M.J.J. Attosecond angle-resolved photoelectron spectroscopy. Phys. Rev. Lett. 2003, 91, 223902. [Google Scholar] [CrossRef] [PubMed]
  185. Faucher, O.; Tzallas, P.; Benis, E.P.; Kruse, J.; Peralta Conde, A.; Kalpouzos, C.; Charalambidis, D. Four-dimensional investigation of the 2nd order volume autocorrelation technique. Appl. Phys. B 2009, 97, 505–510. [Google Scholar] [CrossRef]
  186. Nabekawa, Y.; Shimizu, T.; Okino, T.; Furusawa, K.; Hasegawa, H.; Yamanouchi, K.; Midorikawa, K. Interferometric autocorrelation of an attosecond pulse train in the single-cycle regime. Phys. Rev. Lett. 2006, 97, 153904. [Google Scholar] [CrossRef] [PubMed]
  187. Benis, E.P.; Tzallas, P.; Nikolopoulos, L.A.A.; Kovacev, M.; Kalpouzos, C.; Charalambidis, D.; Tsakiris, G.D. Frequency-resolved photoelectron spectra of two-photon ionization of He by an attosecond pulse train. New J. Phys. 2006, 9, 92. [Google Scholar] [CrossRef]
  188. Kolliopoulos, G.; Tzallas, P.; Bergues, B.; Carpeggiani, P.A.; Heissler, P.; Schröder, H.; Veisz, L.; Charalambidis, D.; Tsakiris, G.D. Single-shot autocorrelator for extreme-ultraviolet radiation. J. Opt. Soc. Am. B 2014, 31, 926–938. [Google Scholar] [CrossRef]
  189. Skantzakis, E.; Chatziathanasiou, S.; Carpeggiani, P.A.; Sansone, G.; Nayak, A.; Gray, D.; Tzallas, P.; Charalambidis, D.; Hertz, E.; Faucher, O. Polarization shaping of high order harmonics in laser-aligned molecules. Sci. Rep. 2016, 6, 39325. [Google Scholar] [CrossRef] [PubMed]
Figure 1. (a) A schematic representation of High-order harmonic generation (HOHG) in gas-phase media; (b) (upper panel) An oversimplified picture of the recollision process. ti, tr, MI, XUV, ATI are the ionization time, recollision time, multiple ionization, generation of XUV radiation and ATI photoelectrons, respectively. The red arrow shows the polarization direction of the driving field and the black line the electron trajectory; (down panel) High-order-harmonic generation process in the spirit of three-step model. L (black line), S (green line) show the “Long” and “Short” electron trajectories contribute to the plateau harmonic emission, respectively. teL and teS are the corresponding emission times. C (red line) shows the electron trajectory contribute to the cut-off harmonic emission; (c) (upper panel) Emission times as a function of the harmonic order (calculated using the semi-classical 3-step model for IL = 2 × 10¹⁴ W/cm2 and IP = 15 eV, and λ = 800 nm). teL(IL) and teS(IL) depict the emission times (which depend on IL) corresponding the “Long” and “Short” trajectory harmonics. In the spirit of semi-classical 3-step model the emission times is the real part of the recombination time tr. (down panel) Calculated harmonic spectrum (blue filled area) with ωq = (2q + 1)ωL (where ωL is the frequency of the IR field). The “Long” and “Short” trajectory harmonics, which contribute in plateau region, degenerate to a single trajectory in the cut-off region of the spectrum. The green solid line is the spectral phase distribution of the S and L trajectory harmonics. The black solid line illustrates the XUV continuum spectrum emitted in case of a single electron recollision. The line-shaded area illustrates the bandwidth of the XUV radiation which passes through a band pass XUV filter.
Photonics 04 00026 g001
Figure 2. Schematic showing the basic idea of the coherent wake emission mechanism.
Photonics 04 00026 g002
Figure 3. Schematic showing the basic idea of the relativistic oscillating mirror mechanism.
Photonics 04 00026 g003
Figure 4. Variation of the XUV pulse efficiency ηXUV with the normalized vector potential aL for three different spectral ranges determined by the indicated thin filter used. Part of the figure from Ref. [87].
Photonics 04 00026 g004
Figure 5. Asec lighthouse effect for few-cycle laser-driven plasma mirrors. (a) When an intense few-cycle laser pulse interacts nonlinearly with a plasma mirror, the sub-cycle modulation of the temporal laser wavefronts is associated with the generation of a train of asec light pulses, which all propagate in a collimated beam along the direction normal to the laser wavefronts at focus; (b) When the laser wavefronts are made to rotate in time at focus (WFR), each asec pulse of the train is emitted in a slightly different direction. From Ref. [67].
Photonics 04 00026 g005
Figure 6. Asec ligthouses from plasma mirrors. (a) Schematic of the experimental set-up; (b) Measured XUV beam profile in the absence of WFR for a fixed arbitrary CEP value (left panel) and the corresponding XUV spectrum at the center of the XUV beam profile (right panel); (c) Measured XUV beam profile in the presence of WFR for a fixed arbitrary CEP value (left panel) and the corresponding XUV spectrum at the center of the spatial XUV beam profile (right panel). From Ref. [67].
Photonics 04 00026 g006
Figure 7. Block diagram of gas and solid surface asec sources.
Photonics 04 00026 g007
Figure 8. (a) Beam line for the generation of intense asec pulses in gas phase media. L: Lens; P-GJ: Pulsed gas jet used; Si: Silicon plate; A: Aperture; F: Filter; PDEUV: Calibrated XUV photodiode; T-GJ: Target gas jet; TOF: Time of flight ion/electron spectrometer; IM: Ion Microscope; SM: Spherical mirror; MCP: Microchannel plate detector; Ph: Phosphor screen; CCD: CCD camera. The y-axis is parallel to the TOF axis and the x-axis is parallel to the plane of the detector (MCP + Ph); (b) The spectrum of the harmonics used in the TOF and IM branch; (c) Spatial ion distributions at the XUV focus induced by single- and two-XUV-photon ionization of Ar and He; (d) Continuum XUV spectrum generated when the PG optical arrangement [64] is introduced in unit 1. Figures (ac) from Ref. [150] and Figure (d) from Ref. [48].
Photonics 04 00026 g008
Figure 9. (a) Schematic diagram of the experimental setup. PM1, 2, 3: parabolic mirrors; ST: solid target; IL1, 2: imaging systems; F: filters; S: XUV flat field spectrometer; S-Si, Si: silicon plates; GJ: Ar gas jet; Sc: the scintillator used for the imaging of the XUV focus (the image in the inset); MB: 1.5 m long magnetic bottle; MCP: microchannel plates; M: mirrors; P: turbo pumps; (b) Single-photon photoelectron spectrum of Ar (black line). The ionizing radiation consists of harmonic 11th–16th. The measured PE (crossed circles) and calculated overall spectral transmission (red rhombs) of the setup is shown in the inset; (c) Two-XUV-photon ATI photoelectron spectrum of Ar. The black line filled in green shows a single-shot trace, the gray dotted line is an average of nine shots and the red line is obtained from the nine shots average (gray dotted line) after a 150 points moving average is performed. The orange and green shaded areas depict the SPI and ATI signals, respectively. Figure from Ref. [92].
Photonics 04 00026 g009
Figure 10. (a) Experimental set-up showing the 2nd order volume autocorrelation (2-IVAC) arrangement. It is a 3D illustration of a part of the beam line shown in Figure 8; (b) 2-XUV-photon ionization scheme of Helium using the 9th–15th harmonics passing through Indium filter; (c) 2-IVAC trace of an asec pulse train synthesized by the 9th–15th harmonics. The duration of the asec pulses in the train is found to be (660 ± 50) asec. The trace was obtained by recording the He+ signal as a function of the delay between the XUV replicas. Gray dots are the raw data and the yellow correspond to a 10-point running average. The purple line is a 12-peak sum of Gaussians fit to the raw data; (d) 2-XUV-photon direct double ionization (TPDDI) scheme of Xenon using the broadband coherent continuum XUV radiation (orange filled area) generated in Xenon gas jet by means of PG arrangement. The XUV spectrum is also shown in Figure 8d. In this process the single XUV photon absorption is passing through an ensemble of autoionizing states (AIS); (e) 2-IVAC trace of a ≈ 1.5 0.7 + 0.2 fs XUV pulse. The trace was obtained by recording the Xe2+ signal as a function of the delay between the XUV replicas. The blue squares are the raw data and the red line is a Gaussian fit to the raw data. The pulse broadening is a consequence of the appearance of side pulses due to the unstable carrier-envelope-phase (CEP) of the high power multi-cycle laser system. Figure (c) from Ref. [97] and Figures (d,e) from Refs. [48,156].
Photonics 04 00026 g010
Figure 11. (a) Experimental set-up showing the Resolution of Attosecond Beating by Interference of Two photon Transitions (RABBITT) arrangement. It is a 3D illustration of a part of the beam line shown in Figure 8; (b) XUV + IR ionization scheme; (c) RABBITT traces at three different positions of the laser focus with respect to the Xenon gas jet (focus before jet, focus on jet and focus after jet). The gray dots are the measured data, the yellow circles correspond to a running average of 15 points and 40 points for the total signal. The solid purple lines are sinusoidal fits to the raw data over 13 oscillations on the sideband traces and over 6 oscillations on the total signal; (d) Phases of the consecutive harmonics obtained by the RABBITT traces; (e) Reconstructed asec pulse trains. Figures (a,ce) from Ref. [97].
Photonics 04 00026 g011
Figure 12. (a) Experimental Frequency Resolved Optical Gaiting for Complete Reconstruction of Attosecond Bursts (FROG-CRAB) traces for an isolated asec pulse generated by the polarization gating technique in Argon using an Al filter with a thickness of 100 nm (a) and 300 nm (b), respectively; (c,d) Reconstructed amplitudes (black solid lines) and phases (red dashed lines) for the experimental traces shown in (a,b), respectively. From Ref. [63].
Photonics 04 00026 g012
Figure 13. 2-IVAC measurement of high-order-harmonics emitted from solid-surface. The data are obtained from He+ and H2O+ signal in the TOF mass spectra by varying the delay between the two parts of the split mirror. The red circles represent the He+ signal produced by 2-XUV-photon ionization and the blue circles the H2O+ signal produced by single photon ionization. (a) A coarse scan over the laser pulse duration. A Guassian fit to He+ raw data yields a duration of ≈ 44 fs; (b) a fine scan near zero delay. The raw data are shown as grey circles connected by grey lines. The green line is a fit to the raw data (grey circles) of a sequence of Gaussian pulses to the second-order XUV AC signal yielding τXUV ≈ (0.9 ± 0.4) fs. In both panels, the H2O+ signal serves as reference for monitoring the XUV intensity and provides a clear indication of the absence of modulation as a result of single-photon ionization. From Ref. [54].
Photonics 04 00026 g013
Figure 14. (ad) Angle-resolved high harmonic spectra from plasma mirror diagnosed under different interaction conditions. The main pulse is contrast cleaned with a double plasma mirror temporal contrast cleaning set up and the plasma density gradient (L/λ) is tuned with a delay controlled pre-pulse; (e) The beam divergence Δθ(ω) shows different behavior with L/λ at different intensity regimes (I1 ~ 1 × 10¹⁸ W/cm2 and I2 ~ 5 × 10¹⁹ W/cm2). The figures (ae) from Ref. [118].
Photonics 04 00026 g014
Figure 15. Retrieved amplitude |h12| (solid curve) and phase profile φ12 (dashed curve) of the 12th harmonic in the focal plane (a) for ROM case (peak intensity on target is IL ~ 7 × 10¹⁸ W/cm2, main beam waist w0 = 6.2 µm and appropriately long plasma density gradient [118]) and (b) for CWE case (peak intensity on target is IL ~ 3 × 10¹⁷ W/cm2, main beam waist w0 = 14.4 µm and appropriately short plasma density gradient [118]). x is the focal plane coordinate. Figure from Ref. [86].
Photonics 04 00026 g015

