Terahertz Radome Inspection
by
 ,
,
Fabian Friederich
1,2,*, 
Karl Henrik May
1,
Bessem Baccouche
1,
Carsten Matheis
1,
Maris Bauer
1 ,
,
Joachim Jonuscheit
1,
Michael Moor
3,
David Denman
3,
Jamie Bramble
3 and
Nick Savage
3 1
Center for Materials Characterization and Testing, Fraunhofer Institute for Industrial Mathematics ITWM, 67663 Kaiserslautern, Germany
2
Department of Physics and Research Center OPTIMAS, University of Kaiserslautern, 67663 Kaiserslautern, Germany
3
Meggitt Polymers & Composites, Stevenage, Hertfordshire SG1 2DH, UK
*
Author to whom correspondence should be addressed.
Photonics 2018, 5(1), 1; https://doi.org/10.3390/photonics5010001
Submission received: 24 November 2017
/
Revised: 23 December 2017
/
Accepted: 4 January 2018
/
Published: 8 January 2018
(This article belongs to the Special Issue Microwave Photonics 2017)
Abstract
:Radomes protecting sensitive radar, navigational, and communications equipment of, e.g., aircraft, are strongly exposed to the environment and have to withstand harsh weather conditions and potential impacts. Besides their significance to the structural integrity of the radomes, it is often crucial to optimize the composite structures for best possible radio performance. Hence, there exists a significant interest in non-destructive testing techniques, which can be used for defect inspection of radomes in field use as well as for quality inspection during the manufacturing process. Contactless millimeter-wave and terahertz imaging techniques provide millimeter resolution and have the potential to address both application scenarios. We report on our development of a three-dimensional (3D) terahertz imaging system for radome inspection during industrial manufacturing processes. The system was designed for operation within a machining center for radome manufacturing. It simultaneously gathers terahertz depth information in adjacent frequency ranges, from 70 to 110 GHz and from 110 to 170 GHz by combining two frequency modulated continuous-wave terahertz sensing units into a single measurement device. Results from spiraliform image acquisition of a radome test sample demonstrate the successful integration of the measurement system.
Keywords:
millimeter wave; microwave; terahertz; imaging; contactless; non-destructive testing; composites; radome; GFRP; FMCW1. Introduction
Contactless microwave, millimeter wave, and terahertz techniques have proven to be highly suitable for nondestructive testing of glass-fiber reinforced composites [1,2,3,4,5,6]. Respective materials are typically used for the construction of aircraft radomes. Besides the required regular functional testing of radomes in service, it is of significant interest to inspect radome structures already during the manufacturing process in order to guarantee the required structural integrity and to ensure proper functionality for relevant radar and communication systems. While different ultrasound methods, as well as optical techniques, for nondestructive radome inspection are widely used [7], the inspection of sandwich structures is extremely challenging and eventually not feasible with these techniques [1,2]. In case of civilian aircraft, up until this day, the only established method for regular inspections of radomes in service are tap tests, which provide only limited information about structural defects and have to be performed manually. Millimeter wave and terahertz imaging techniques allow for the contactless visual inspection of a radome’s inner structure [3] at any processing stage or even in field use, while also providing depth information. In addition, automatic defect or feature recognition can be applied. However, depending on the exact materials and the thicknesses of the composite structures under test, a trade-off between spatial resolution and penetration depth with respect to millimeter wave and terahertz inspection systems must be considered. Millimeter wave and terahertz systems, which take advantage of the frequency modulation continuous wave (FMCW) method, allow for the reconstruction of depth information of transparent samples under test with the depth resolution being inversely proportional to the modulation bandwidth, as described in Section 4. While many different terahertz imaging schemes have been developed (a variety of different concepts are exemplary given in [8]), the relations between object size, wavelength, and required resolution often rise the need for custom-designed solutions. In this contribution, we report on the development of an industrial three-dimensional (3D) terahertz imaging system for radome inspection using sensor units working at 100 and 150 GHz, respectively. The measurement data can be evaluated individually or be combined by a data fusion approach for increased depth resolution.
2. Preliminary Investigations
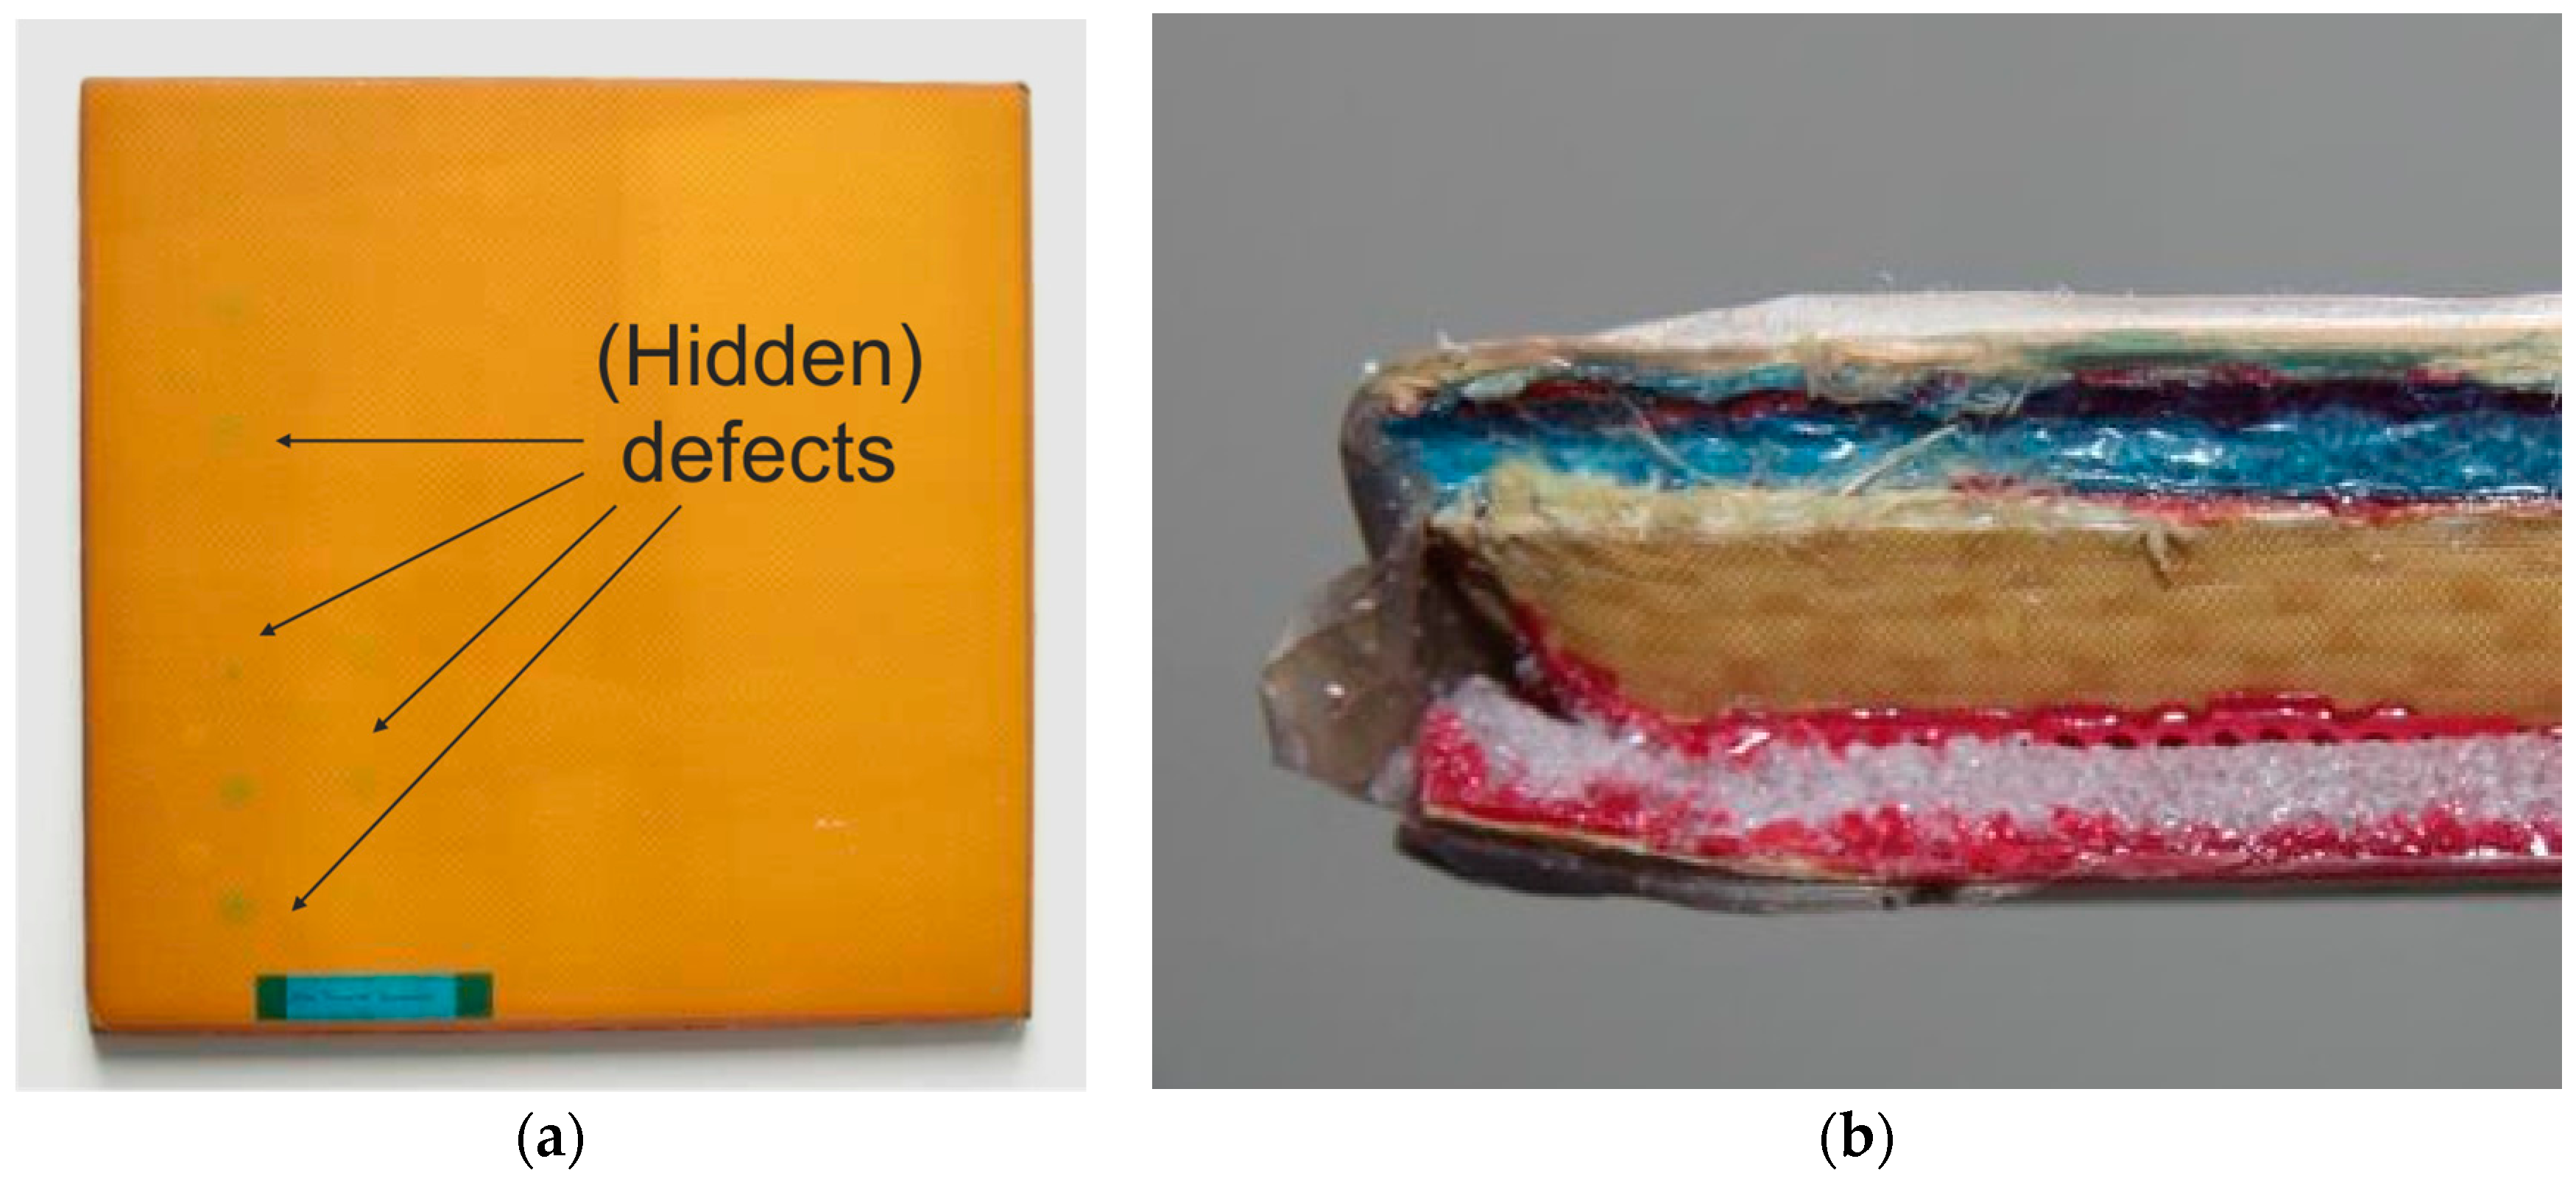
In order to investigate the sensor requirements, we performed several test inspections on relevant glass fiber reinforced plastics (GFRP) sample structures with defined integrated features and defects. Figure 1 shows an example of a respective test structure. In the top view depicted in Figure 1a, some of the circular features can be seen shining through the GFRP surface layer along the lower left edge of the sample, in total measuring 50 cm × 50 cm × 2 cm. The photograph of the sample’s cross section in Figure 1b reveals that the structure consists of several layers of different materials, such as aramid and foam cores.
For the initial study, terahertz images of test samples were acquired by raster-scanning the samples in reflection geometry with three different frequency-modulated continuous-wave (FMCW) transceiver units operating at 100 GHz, 150 GHz, and 300 GHz, while providing modulation bandwidths of around 40 GHz, 60 GHz, and 90 GHz, respectively. For the measurements on the test panels, we employed the same quasi-optical system, as described in [1].
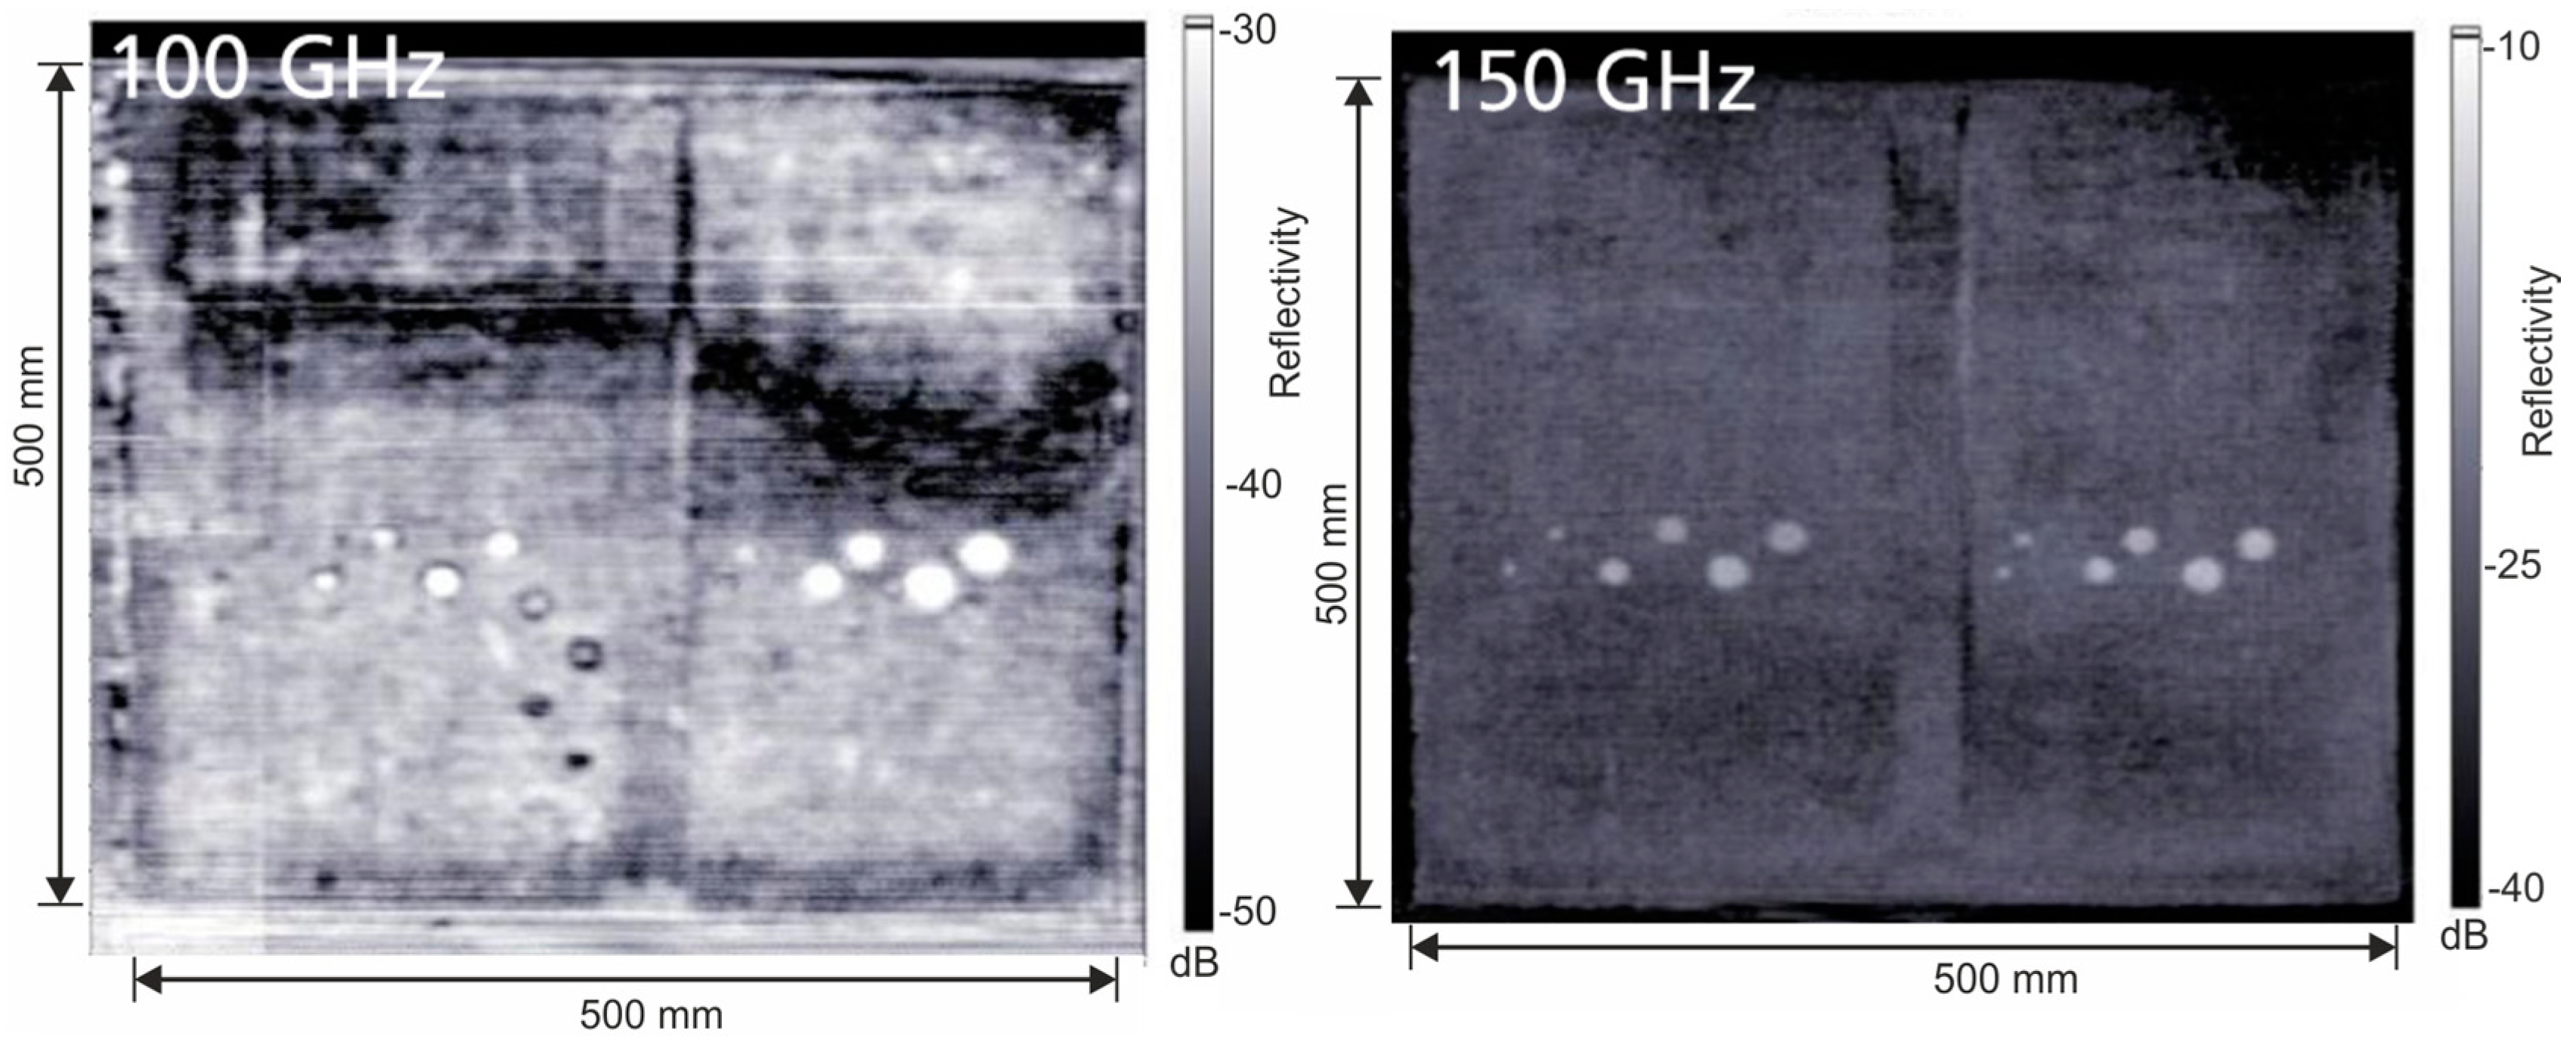
Figure 2 shows two exemplary terahertz imaging results at roughly the same depth position around the center in one of the samples. Since both of the images were acquired with the same quasi-optical configuration, the sensor unit operating at 100 GHz provides a lower resolution (ca. 7.5 mm in air) than the sensor unit at 150 GHz (ca. 5 mm in air). The latter also provides a higher modulation bandwidth, and therefore a better depth resolution (ca. 2.5 mm in air). These aspects are clearly represented by a better depth selectivity and the finer details of the sample’s integrated features in the 150 GHz image. It has to be noted that a hamming window function was applied during processing of the measurement data in order to compensate for leakage effects due to the time-limited frequency sweep of the FMCW setup. This downgraded the best possible depth resolution by roughly a factor of 2. The overall results of the initial test measurements are in excellent accordance to the outcomes of [1]. On the other hand, the penetration depth in terahertz measurements is, in general, larger at lower frequencies. Our measurements revealed that in the case of the given sample thickness of 2 cm, this issue prevents a potential use of the 300 GHz sensor unit in the given application scenario (data not shown here). Since the thickness and the composition of a radome may vary in industrial production, flexibility in respect to image resolution, and penetration depth is required. Therefore, we developed a system, which combines two different frequency-modulated continuous-wave terahertz (FMCW) sensing units within a single sensor head.
3. The Radome Inspection System
The developed terahertz radome inspection system is based on a point sensor operated in connection with a machining center for radome manufacturing. As shown in Figure 3, the system combines two different FMCW sensing units within a single sensor head. They are operating in adjacent frequency ranges, from 70 to 110 GHz and from 110 to 170 GHz, designated as Head100 and Head150 unit, respectively. As part of a sensor control computer, a multifunctional data acquisition card (DAQ) drives the voltage controlled oscillator (VCO) of each measurement unit. A linear sawtooth-shaped frequency ramp is generated for FMCW operation. The output signal of each VCO is fed into an active frequency multiplier chain (S), as well as a harmonic mixing receiver (D), both of which being attached to a three-port waveguide directional coupler (multi-hole split-block design, around −11 dB coupling factor) with a mounted horn antenna designed for the respective output frequencies. Multiple reflections between the ports of the directional coupler and the attached components lead to a signal floor, which limits the achievable signal-to-noise ratio within the intermediate frequency spectrum to around 30 dB. The emitted multiplied signal from each antenna is guided through a focusing configuration of PTFE lenses focusing the beam into the measurement object. The back-reflected signals are fed back into the horn antennas and guided to the harmonic mixing receivers by the directional couplers. The beams of both measurement branches are linearly polarized and are overlayed collinearly by a polarization wire grid to simultaneously acquire two terahertz images at the two different center frequencies of 100 and 150 GHz. The horn antennas are based on a Pickett-Potter design, and therefore provide a cross-polarization of around 20 dB [9]. Hence, the power of the discarded signal portions of the diverging beam by the polarization wire grid is quite small and has only a negligible influence on the measurement signal in the given setup.
The two-frequency sensor head is mounted in a metallic housing of cylindrical shape with a diameter of 150 mm and a length of 271 mm, as shown in Figure 4. The sensor can be attached to the tool holder of a robotic arm of a machining center by the electrically isolated shaft at the backside of the housing. The collinear beams of the two incorporated transceivers are collimated by an integrated PTFE lens, which is enclosed by the metal front cover of the sensor. A removable lens tube containing a second lens to focus the radiation extends the sensor housing. In this way, the focusing length of the sensor can be easily adjusted by exchanging the lens tube with the integrated lens, while the collimating lens remains fixed to the sensor as part of the front cover. A single robust connection interface provides all the necessary signal and electrical power connections to the sensor control computer, which comprises the multifunctional DAQ.
Figure 5a shows a simplified drawing of the measurement procedure. The radome is mounted on a rotational stage for rotation with respect to its longitudinal axis. When the terahertz sensor is attached to the machining head and the machine program has initiated the measurement, the machining center moves the sensor perpendicular and in a fixed distance to the radome’s surface and along the rotation axis. Hence, a spiral scan is performed, where depth information is obtained by the FMCW operation principle of the measurement head. While the sensor is continuously measuring with a sampling rate of 10 MS/s, the sweep time of the FMCW measurement is 200 µs. This leads to a measurement rate of up to 5 kHz per measurement position. The sensor starts operating as soon as it is powered on, but the start and stop of data recording is triggered by the machining center. In order to obtain full three-dimensional terahertz images, the measurement data and the positional data of the machine axis are synchronized by triggering the machining center to store its axis positions to the sensor control computer. The measurement and the positional data are then reconstructed together. While this scheme seems rather obvious, it should be noted that no additional interaction between machining center and inspection system is required. In another operation mode, the terahertz sensor is operated independent from the machining center moving the sensor head at a constant surface speed. In order to be able to reconstruct the measured terahertz data, the radome is equipped with an attached metal stripe, which can be recognized on the small radome test sample in Figure 5b. The metallic marker can be easily identified in the measurement data and allows for the reconstruction of the radome structure by considering the speed of motion and the known shape of the radome.
4. FMCW Measurements
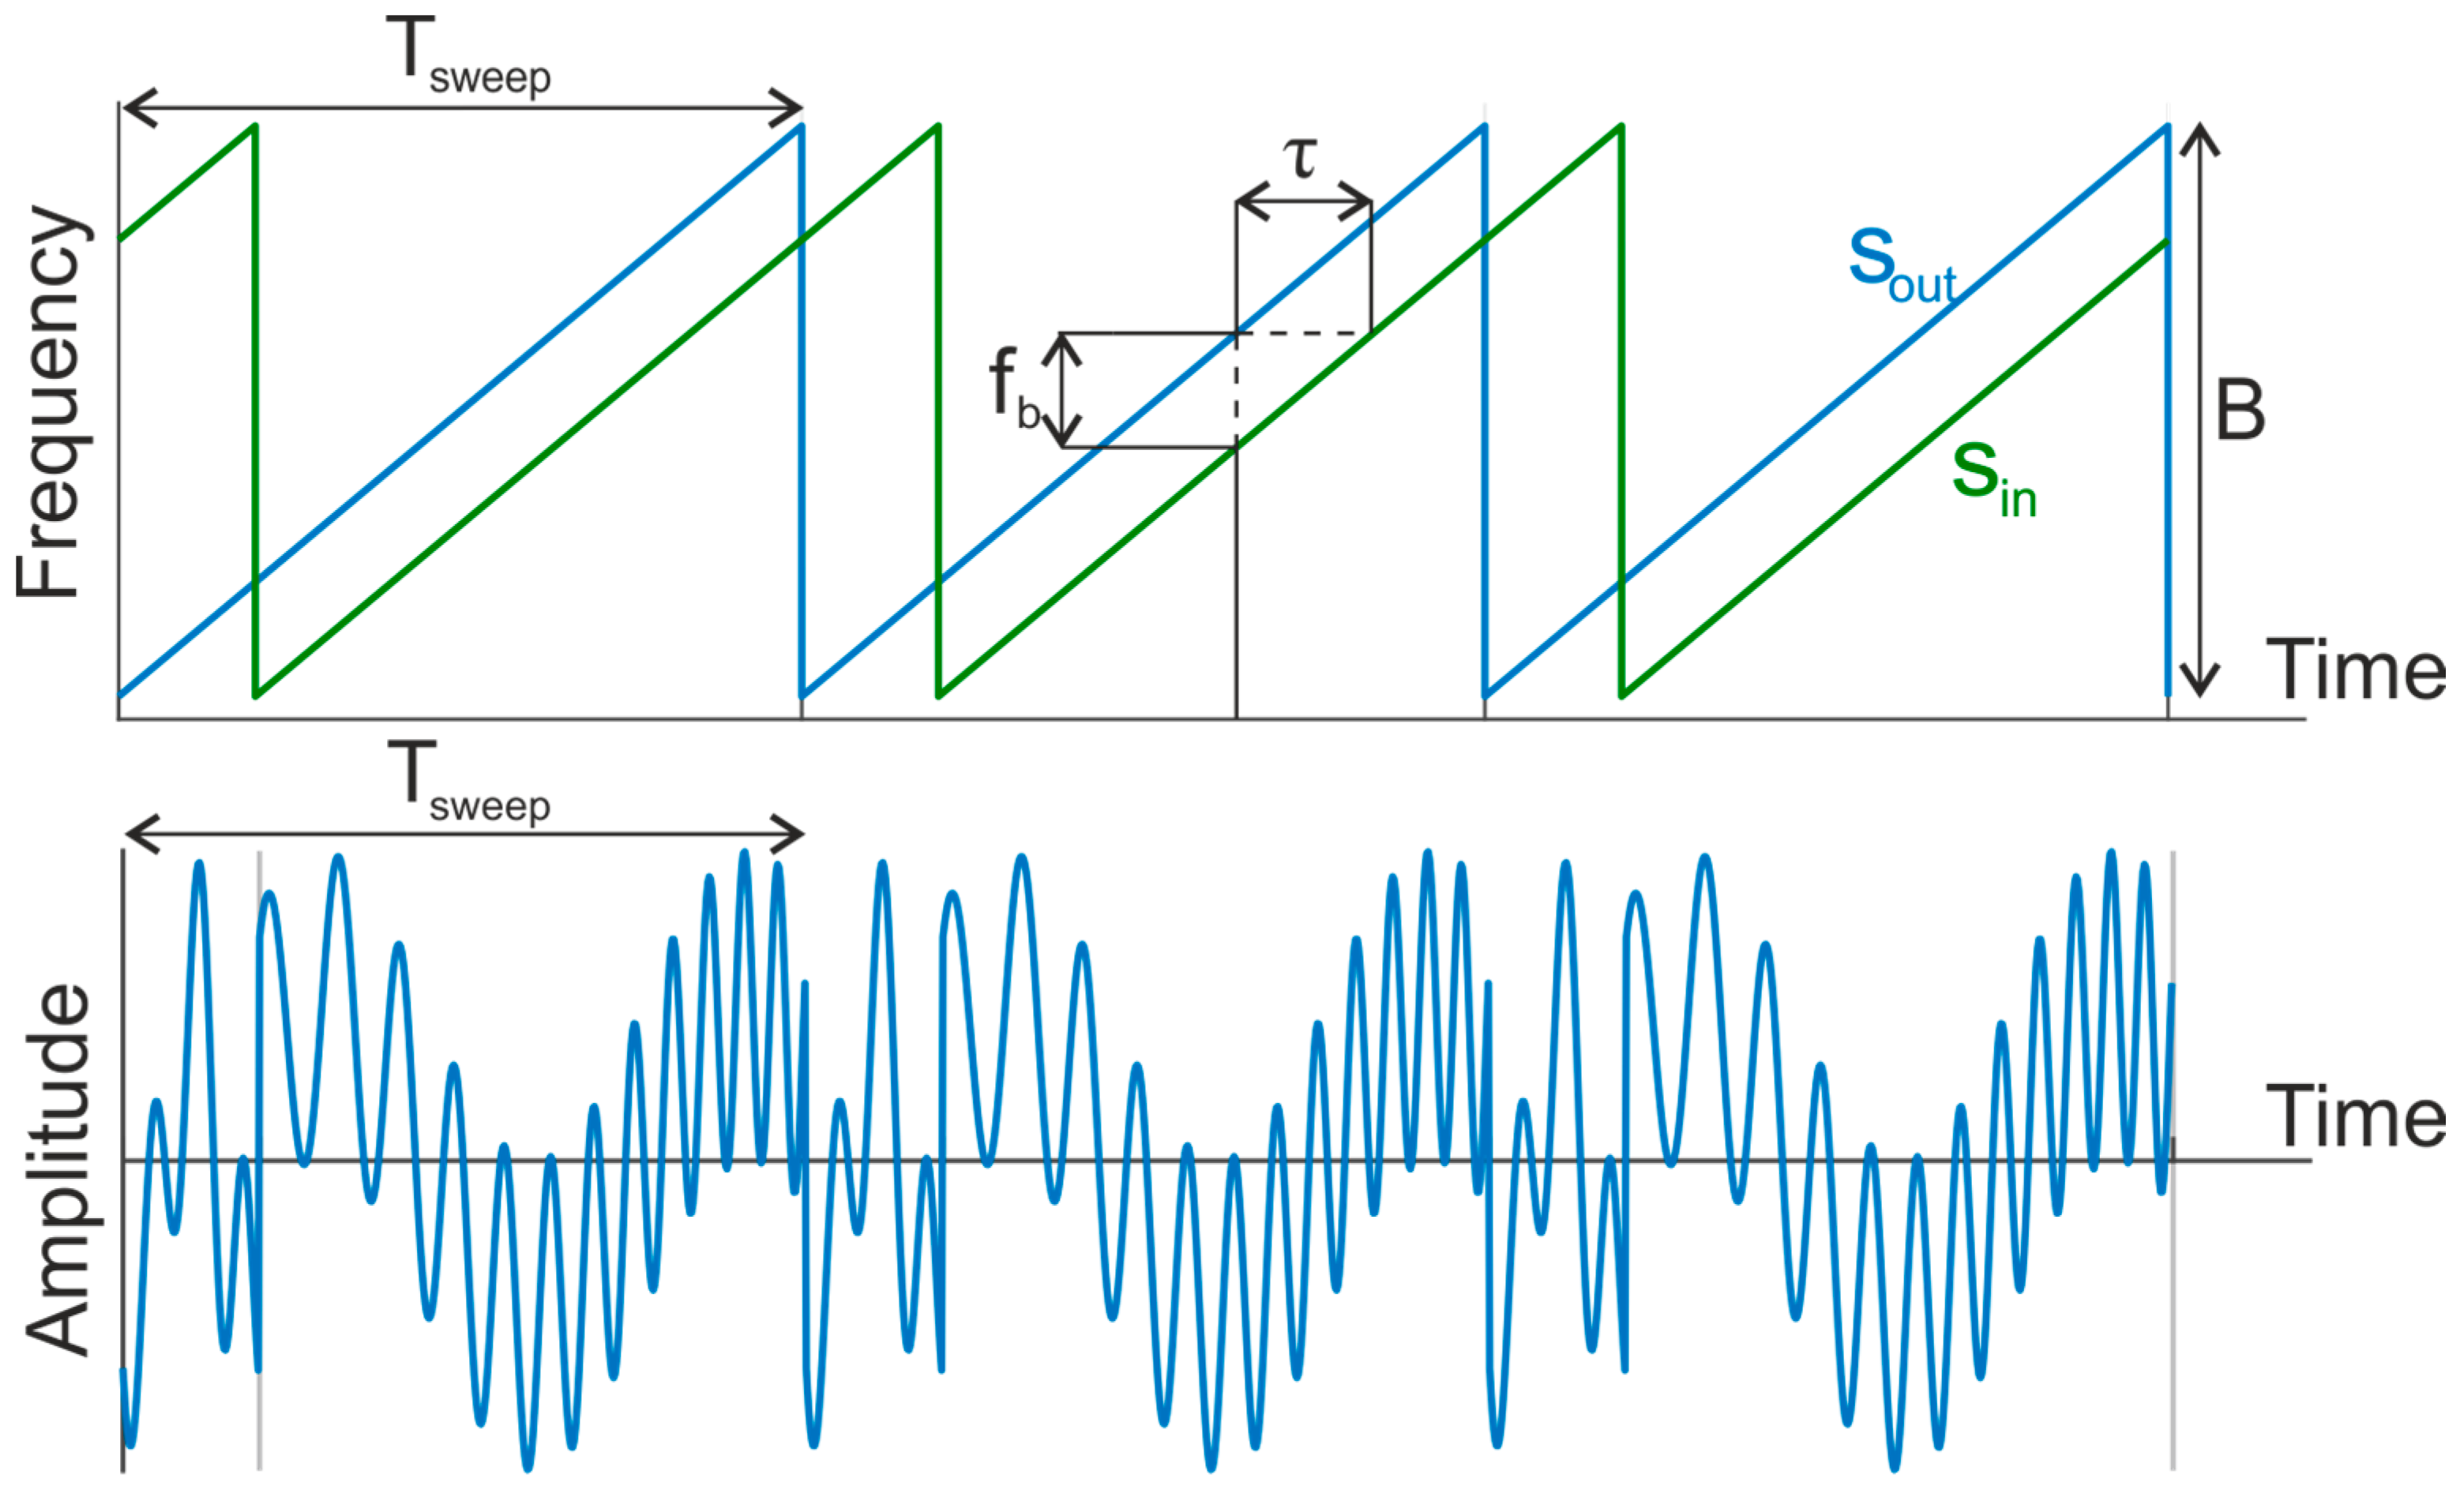
A schematic of the FMCW principle is shown in Figure 6. The time-of-flight , which an emitted signal needs until it is received by the harmonic mixing receiver is translated into a characteristic intermediate mixing frequency of the mixer’s output. Since the time-of-flight of the signal is directly proportional to the distance of its back-reflection, a Fourier analysis of the measurement signal allows reconstruction of depth information of the measurement signal. Hence, three-dimensional terahertz images can be generated. The distance can be calculated as
where is the speed of light in vacuum, the refractive index of the material, the duration of one frequency sweep, and the frequency modulation bandwidth. While the lateral resolution depends on the operation frequency of the sensing units, the depth resolution depends on the refractive index of the propagated material and their bandwidth via
Hence, the achievable depth resolutions of the 100 GHz (40 GHz of bandwidth) and the 150 GHz (60 GHz of bandwidth) transceivers for n = 1 (air) are 3.75 mm and 2.5 mm, respectively. As already discussed in Section 2, it could be useful to apply a proper window function during signal processing of the measurement data in order to compensate for leakage effects due to the FMCW operation. The underlying system is setup to operate within an intermediate frequency range from 2 MHz to 3 MHz in connection with the parameters for data acquisition given in Section 3. Besides the three-dimensional data sets for the two integrated transceivers, a third three-dimensional data set is reconstructed by combining the measurement data of the two adjacent frequency bands to form a synthetic total frequency modulation bandwidth of 100 GHz centered around 120 GHz. As a result, an enhanced depth resolution is obtained. Since the sweep duration and the sampling rate for the measurement signals are identical for both transceivers, whereas the bandwidth differs by 20 GHz, the frequency step size between the acquired samples is different. In order to fuse the acquired data, the frequency step size of the individual measurement data has been equalized by zero padding of the Fourier transformed frequency domain data prior to further processing. The data fusion concept relies on the adjacent frequency ranges to align without an additional frequency gap. However, experimental evaluations have shown that small gaps (a few percent of the synthetic modulation bandwidth) can be tolerated with little artifacts if the missing frequency points are, e.g., linearly interpolated.
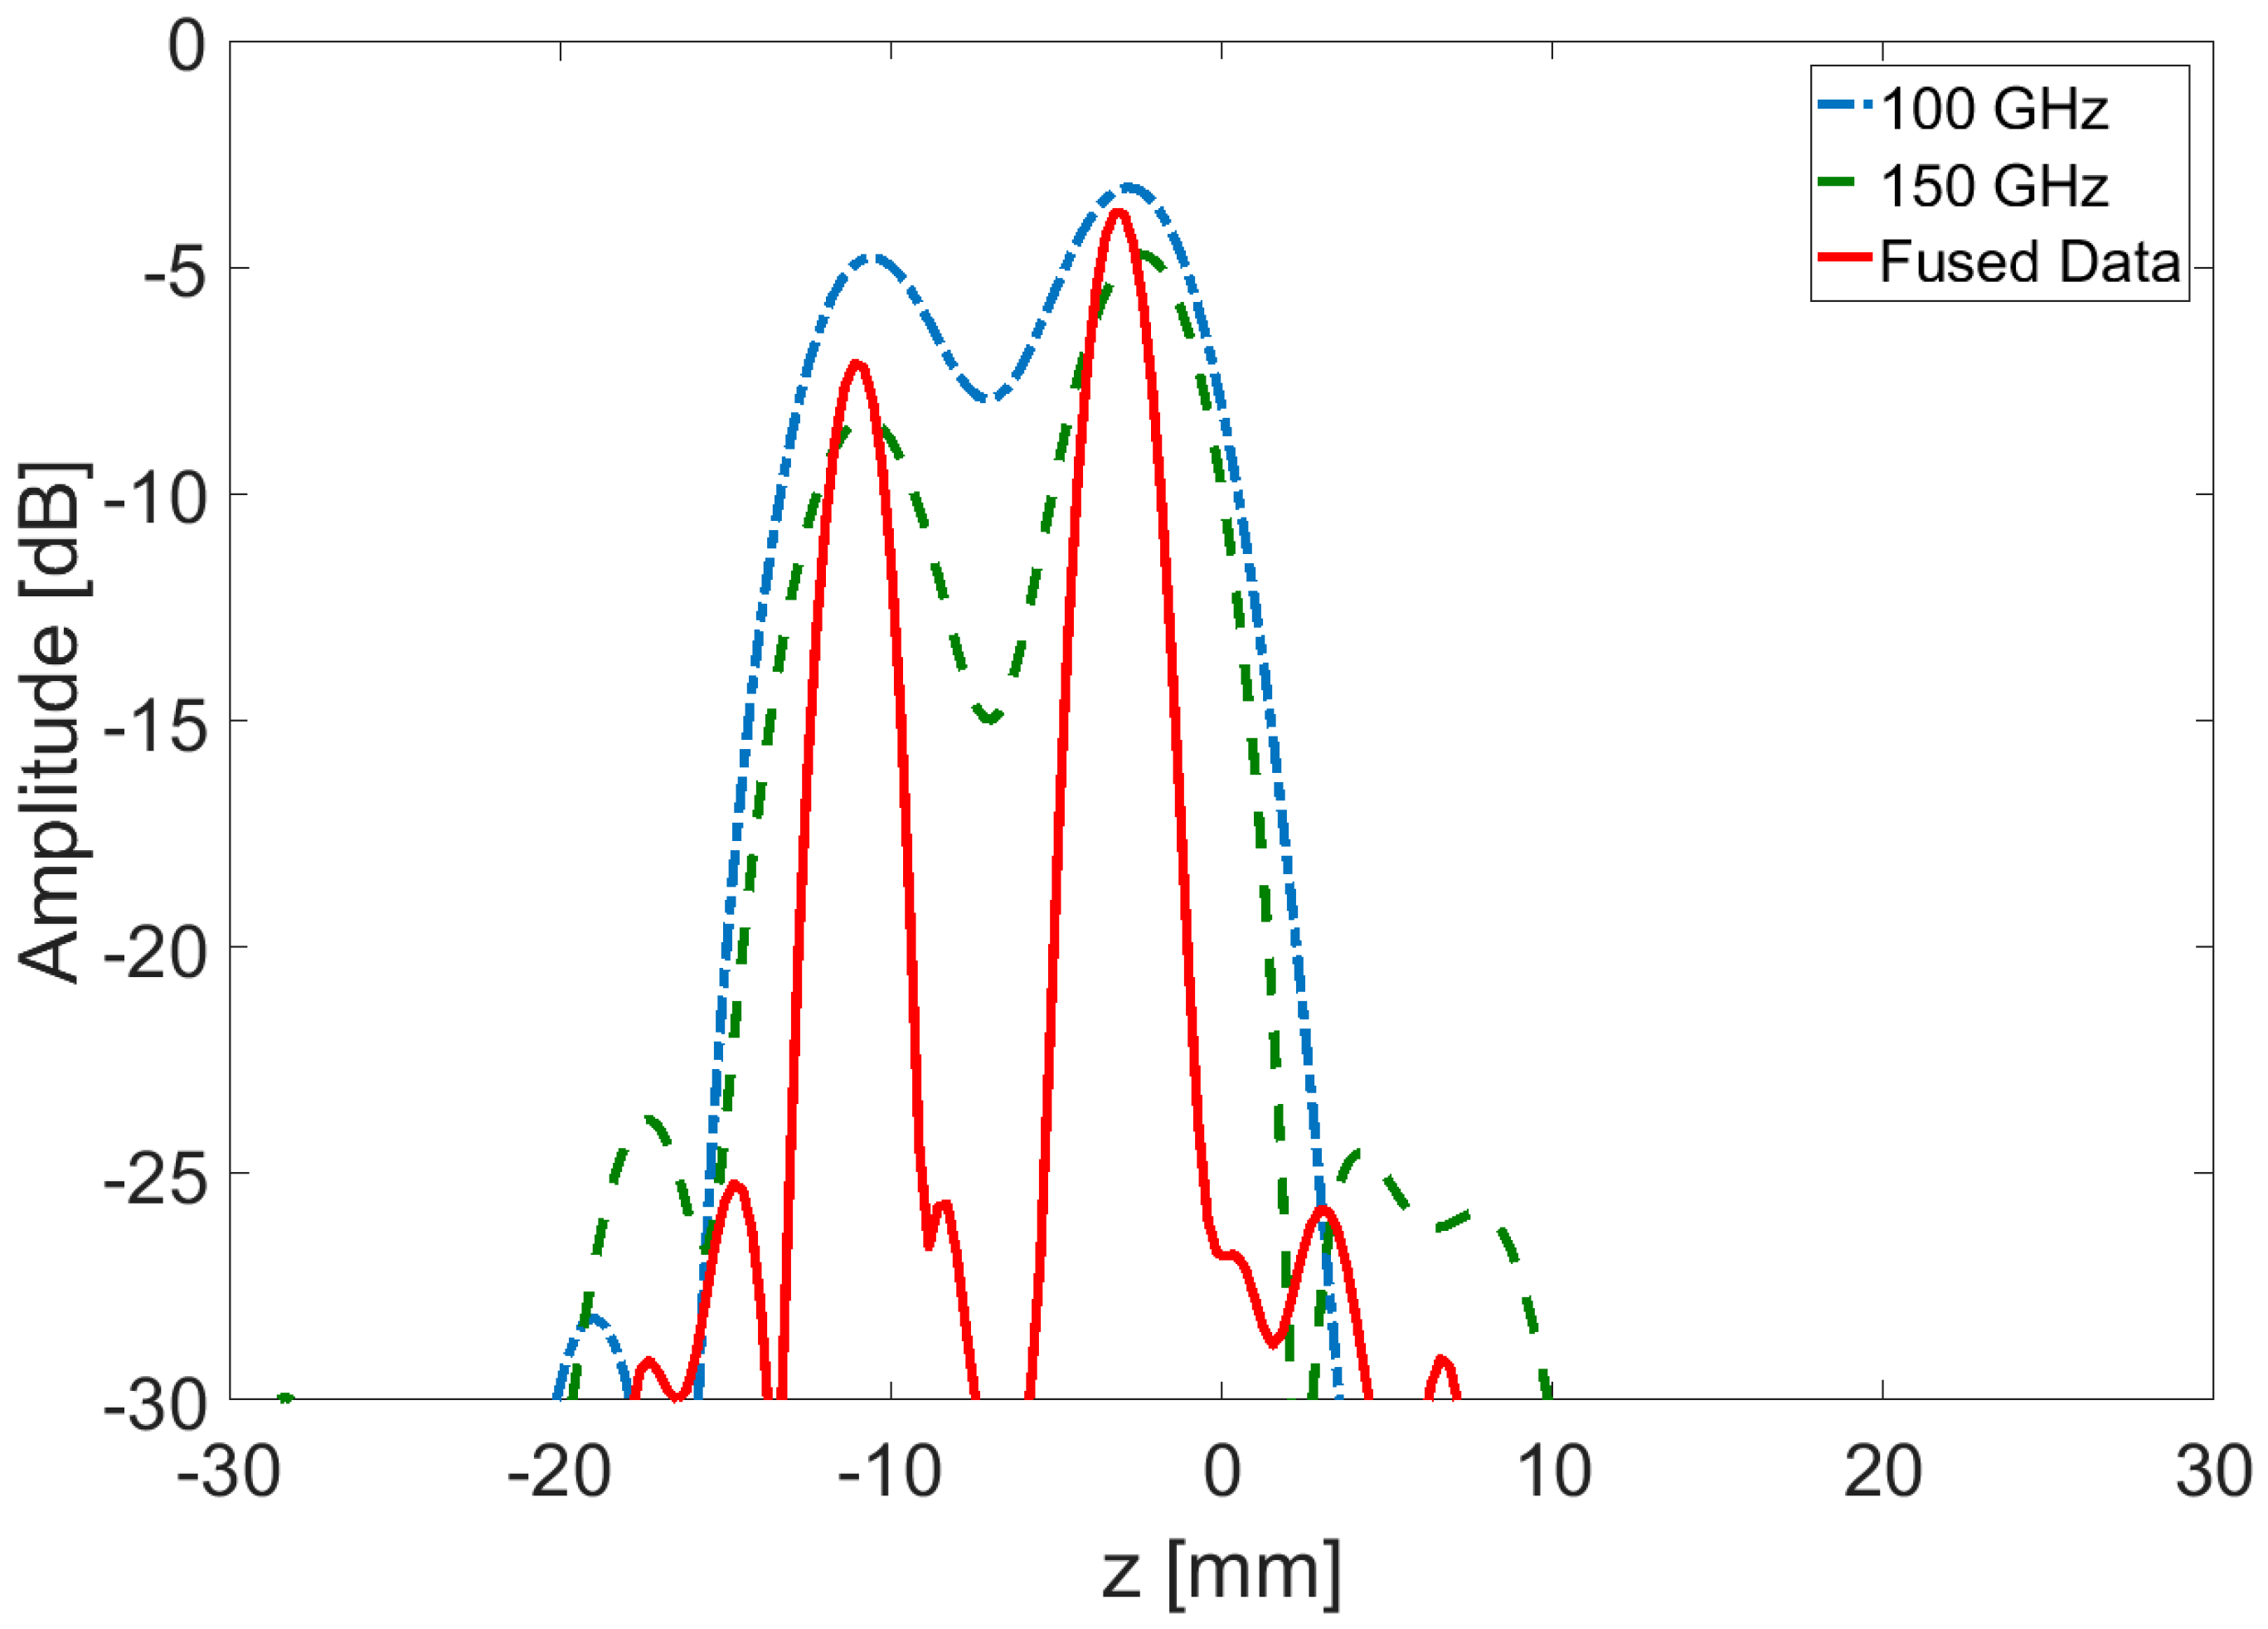
Figure 7 shows a single-point depth measurement of a plastic sample () with a thickness of 4.9 mm after the application of a hamming window on the Fourier transformed measurement signal. Two individual signal peaks from the sample’s front and backside can be recognized in all three reconstructed data. The distance of the two respective peaks within the plot appears to be larger (7.6 mm) than the real sample dimension due to the refractive index of the sample. While the depth resolution of the individual sensor units is barely enough to identify the two sample layers, as expected, the fused data shows narrower main lobes, and hence a better depth resolution than the data of the individual transceivers. The two reflection peaks are clearly resolved by the combination of the individual sensor signals with a total synthetic bandwidth of 100 GHz, yielding a depth resolution up to 1.5 mm in air.
5. Imaging Results
Figure 8 and Figure 9 show terahertz imaging results of radome measurement data acquired in the test arrangement shown in the photograph of Figure 5b. The data was acquired in the measurement mode without triggering synchronization between the measurement head and the machining center by using the metal stripe attached to the radome for the allocation of the measurement data. The machining center and the radome’s rotational speed were setup to yield a constant speed of the terahertz sensor’s spiral movement with respect to the radome’s surface. The measurement data was later reconstructed by aligning the strong reflection of the metal stripe and employing the machining center’s position data to reproduce the radome’s shape (see description in Section 2). By addressing a spacing of the measurement points of 2 mm the measurement speed is limited by the speed of the machine movement, which is slower than the sensor’s measurement rate. For the given results a surface speed of 3000 mm per minute was used.
The reconstructed images in Figure 8 show that the radome test sample has a rather smooth top surface. It is composed of small separate panels, which have the same longitudinal axis as the radome itself and are attached to a carbon mandrel. The aluminum tape serving as a marker along the radome’s longitudinal axis can be identified as a strong reflection signal on the left side of the front surface. Since three-dimensional data is acquired via the FMCW measurement principle, the radome’s inner structure, and, in particular, the back surface can be viewed and clearly reveal the separate GFRP panels, as well as their fiber structure. At the bottom of all three images, a fixation mount of the radome can be recognized. The center image shows a large rectangular feature, which is assumed to be an inserted fiber sheet inside the GFRP material. The large signal in the back surface image stems from the strongly reflecting carbon mandrel behind the separate GFRP panels. Besides the shadow from the blocked signal by the metal tape, the fixation mount leaves a clear contrast on the strong background. It has to be mentioned that the depth of focus is in connection with the used 115 mm focus lens is around 2 cm and smaller than the thickness of the inspected structure. By focusing into the center of the sample, the resolution throughout the depth of the sample is still sufficient to reveal the relevant features.
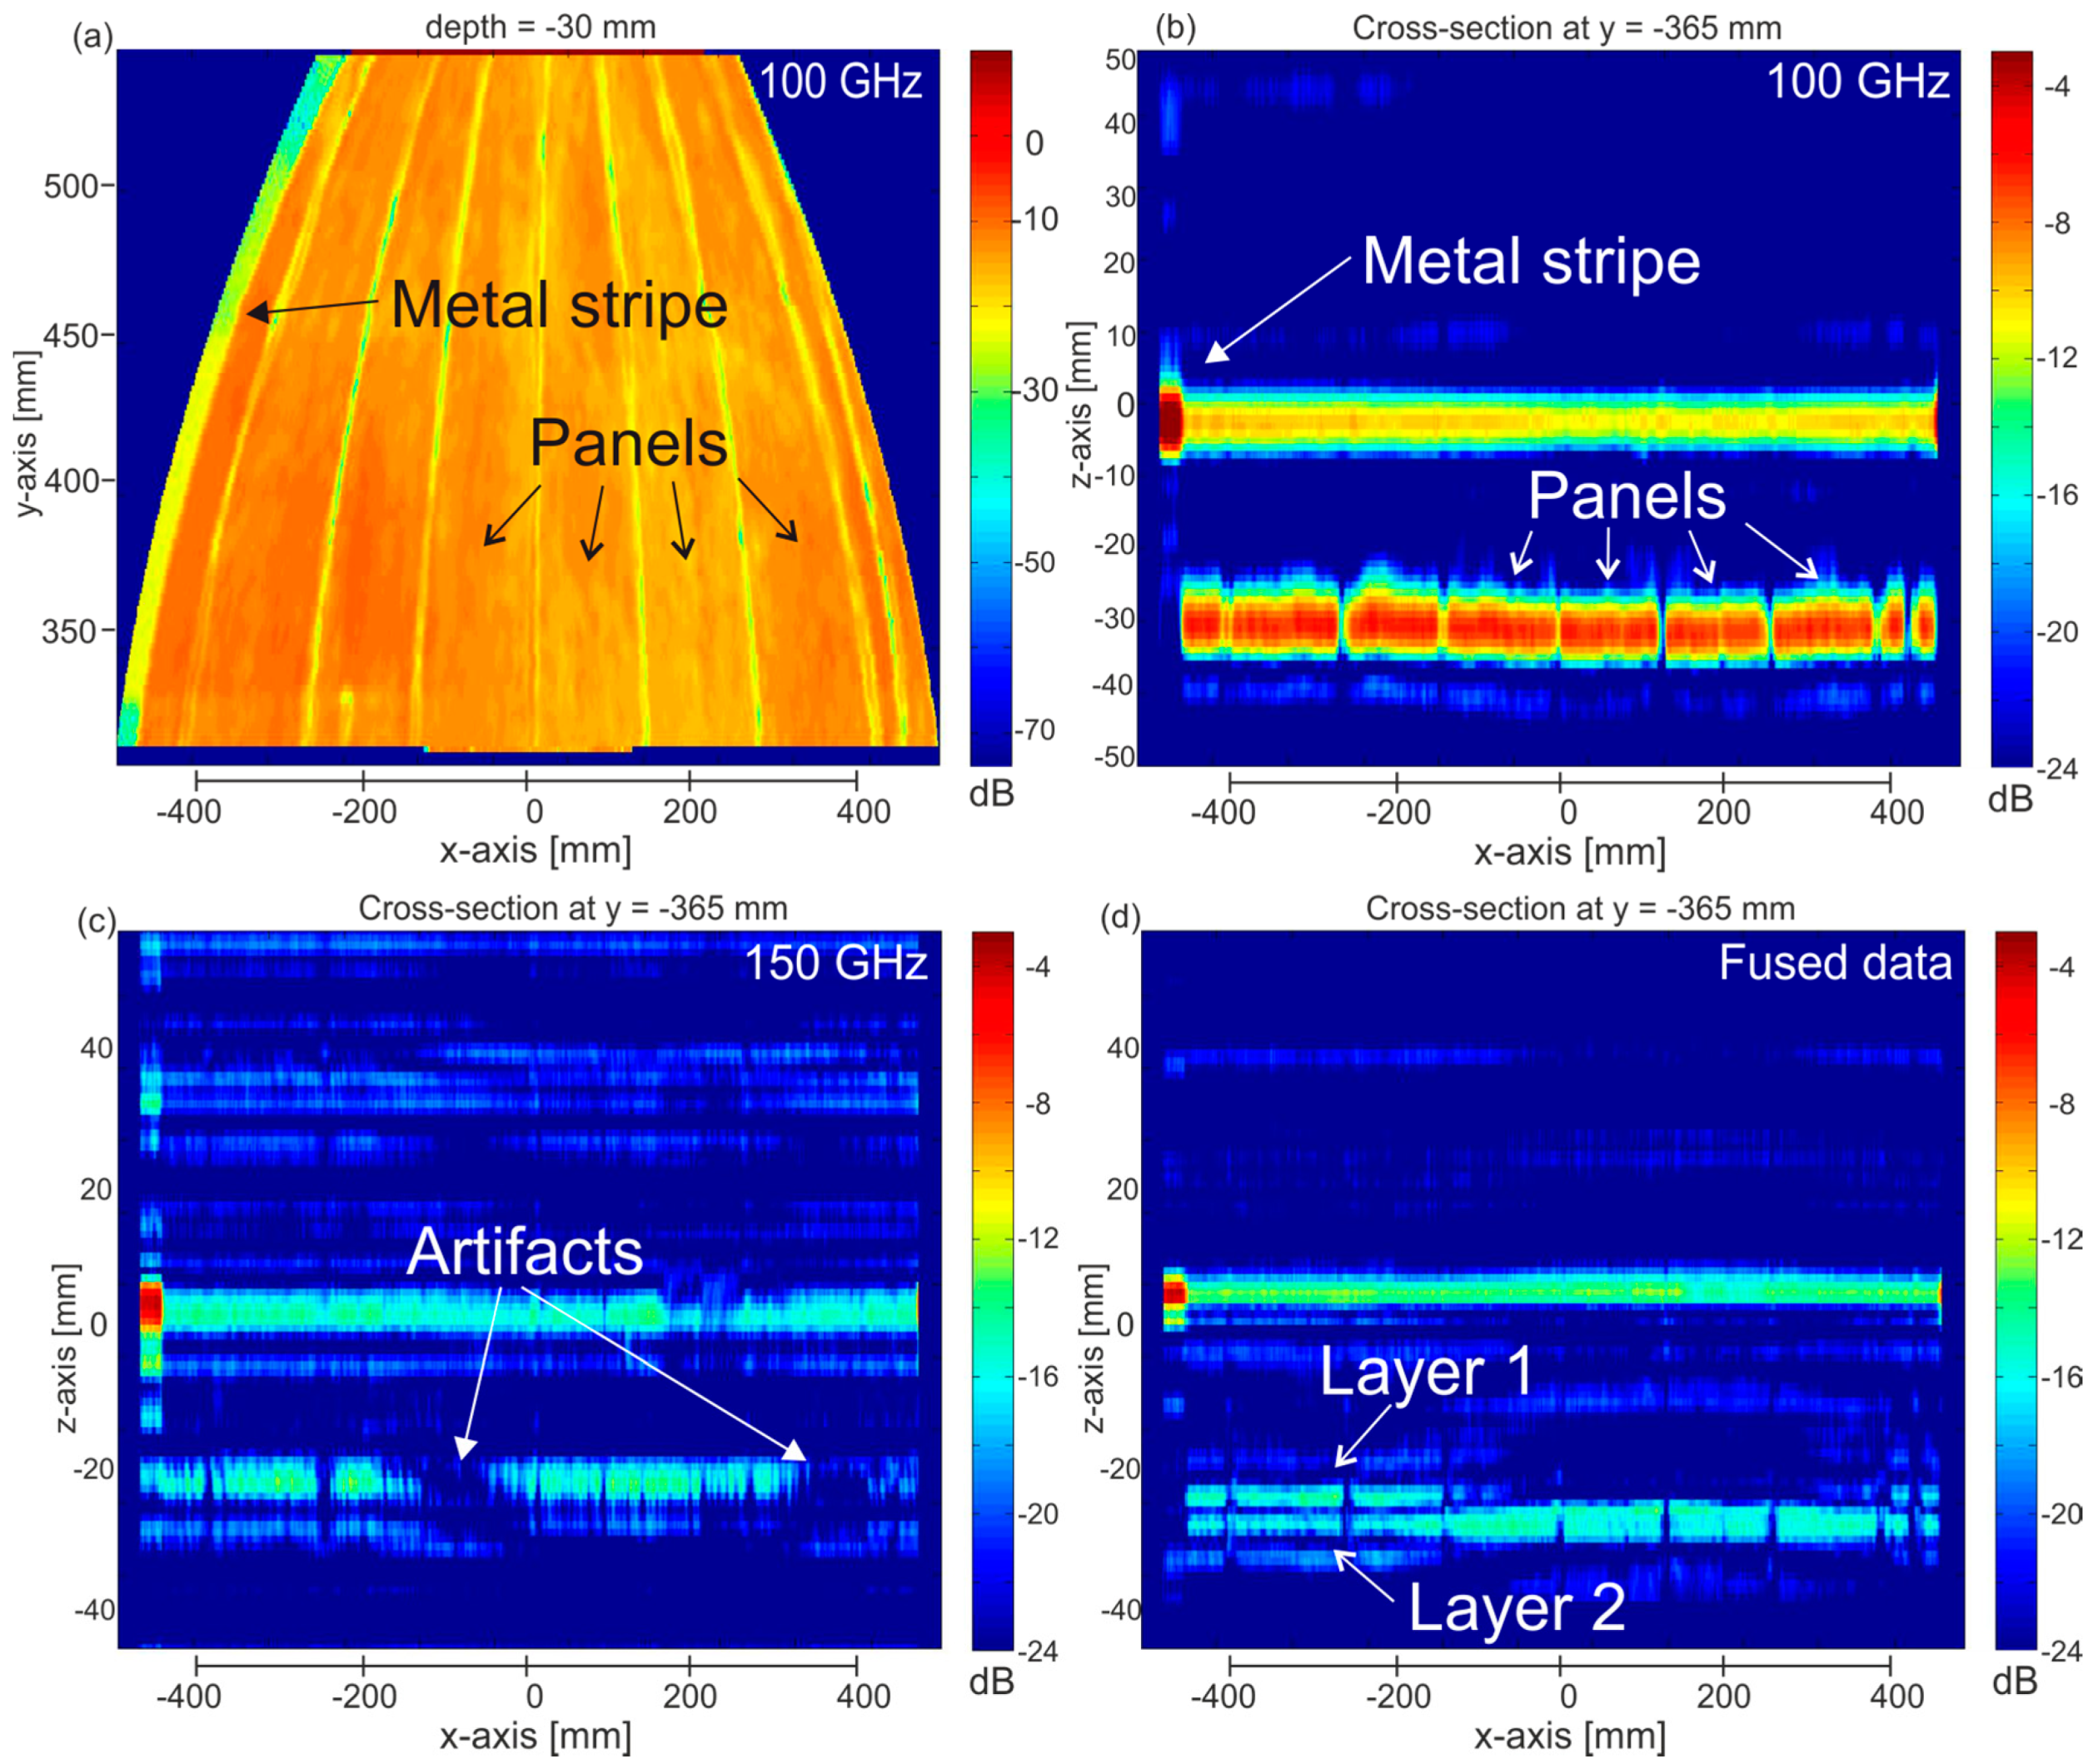
Figure 9a shows a colored version of the inner surface measured at 100 GHz, which demonstrates the same features as above. A depth cross-section from the same measurement data is displayed in Figure 9b. All of the relevant characteristics, such as the strongly reflecting metal stripe (left edge), the smooth surface, as well as the individual GFRP panels can be seen at once. Moreover, it can be clearly recognized from the dynamics color scheme that the back surface provides a stronger reflection than the top surface due to the attached carbon structure. A good signal penetration depth at 100 GHz is achieved. As indicated in Figure 9c by the much weaker reflection from the mandrel, the penetration depth at 150 GHz is significantly lower. We observe a number of strong artifacts (dark areas on the back surface) in the image. We attribute these issues to the non-ideal electrical settings of the measurement unit, which led to an insufficient drive of the VCO affecting its linearity. The settings have been improved since the date of the measurements (data not shown here). Despite this shortcoming, the measurement data could be used for data fusion (see Section 4). The resulting fused image is shown in Figure 9d and illustrates the finer depth resolution revealing an additional layer structure in the panels on the back surface. This observation led us to the assumption that the radome structure has detached from the mandrel in the respective location. A further investigation of this aspect would have required destructive methods, and was therefore not pursued.
6. Discussion and Conclusions
We have developed a terahertz inspection system for operation in connection with a machining center for radome manufacturing. The measurement sensor has been designed for easy integration in existing machining environments. The system comprises two frequency-modulated continuous-wave transceivers, which are operating from 70 to 110 GHz and from 110 to 170 GHz, respectively. Both transceivers are combined within a single sensor unit. Besides the acquisition of volumetric data within the two adjacent frequency ranges, this data is used in connection with a data fusion approach to obtain a third volumetric data set with enhanced depth resolution. The addressed glass-fiber reinforced plastic composites in this work have thicknesses of up to 2 cm. For thinner structures with similar material compositions, one could take advantage of higher operation frequencies (e.g., around 300 GHz) in order to achieve a better spatial resolution with a single transceiver unit [1]. In the future, the use of integrated ultra-wide band radar chips [10,11,12], in connection with embedded sensor control systems, could lead to more compact sensor layouts. If a high imaging throughput is required one could take advantage of array solutions, as we recently demonstrated in [13].
Besides technological improvements, we are working towards standardization of this non-destructive testing (NDT) method in collaboration with the UK National Aeronautical NDT board.
Acknowledgments
The authors would like to thank Andreas Keil for his support in the software development.
Author Contributions
All authors contributed in various degrees to the development concept, theory, the experimental study and the final system development. Fabian Friederich was the chief investigator for this project and designed the whole system concept supported by Joachim Jonuscheit, Carsten Matheis, Nick Savage, David Denman, Michael Moor and Jamie Bramble. Fabian Friederich and Carsten Matheis were involved in the hardware development. Karl Henrik May and investigated and developed the data fusion concept. Maris Bauer, Karl Henrik May and Bessem Baccouche contributed to the software development. Fabian Friederich and Maris Bauer wrote the paper.
Conflicts of Interest
The authors declare no conflict of interest.
References
- Cristofani, E.; Friederich, F.; Wohnsiedler, S.; Matheis, C.; Jonuscheit, J.; Vandewal, M.; Beigang, R. Nondestructive testing potential evaluation of a terahertz frequency-modulated continuous-wave imager for composite materials inspection. Opt. Eng. 2014, 53, 031211. [Google Scholar] [CrossRef]
- Cristofani, E.; Friederich, F.; Vandewal, M.; Jonuscheit, J. Nondestructive Testing of Aeronautic Composite Structures Using Ultrawideband Radars. In Advanced Ultrawideband Radar: Signals, Targets, and Applications; Taylor, J.D., Ed.; CRC Press, Taylor & Francis Group: Boca Raton, FL, USA, 2016; pp. 237–269. ISBN 978-1-4665-8657-4. [Google Scholar]
- Ravuria, M.; Abou-Khousa, M.A.; Kharkovsky, S.; Zoughi, R.; Austin, R. Microwave and Millimeter Wave Near-Field Methods for Evaluation of Radome Composites. AIP Conf. Proc. 2008, 975, 976–981. [Google Scholar] [CrossRef]
- Rutz, F.; Koch, M.; Khare, S.; Moneke, M.; Richter, H.; Ewert, U. Terahertz quality control of polymeric products. Int. J. Infrared Millim. Terahertz Waves 2006, 26, 547–556. [Google Scholar] [CrossRef]
- Stoik, C.; Bohn, M.; Blackshire, J. Nondestructive evaluation of aircraft composites using reflective terahertz time domain spectroscopy. NDT E Int. 2010, 43, 106–115. [Google Scholar] [CrossRef]
- Ospald, F.; Zouaghi, W.; Beigang, R.; Matheis, C.; Jonuscheit, J.; Recur, B.; Guillet, J.P.; Mounaix, P.; Vleugels, W.; Bosom, P.V.; et al. Aeronautics composite material inspection with a terahertz time-domain spectroscopy system. Opt. Eng. 2013, 53, 031208. [Google Scholar] [CrossRef]
- Abou-Khousa, M.A.; Ryley, A.; Kharkovsky, S.; Zoughi, R.; Daniels, D.; Kreitinger, N.; Steffes, G. Comparison of X-ray, Millimeter Wave, Shearography and Through-Transmission Ultrasonic Methods for Inspection of Honeycomb Composites. AIP Conf. Proc. 2007, 894, 999–1006. [Google Scholar] [CrossRef]
- Friederich, F.; Spiegel, W.; Bauer, M.; Meng, F.; Thomson, M.; Boppel, S.; Lisauskas, A.; Hils, B.; Krozer, V.; Keil, A.; et al. THz active imaging systems with real-time capabilities. IEEE Trans. Terahertz Sci. Technol. 2011, 1, 183–200. [Google Scholar] [CrossRef]
- Kittara, P.; Grimes, P.; Yassin, G.; Withington, S.; Jacobs, K.; Wulff, S. A 700-GHz SIS antipodal finline mixer fed by a Pickett-Potter horn-reflector antenna. IEEE Trans. Microwave Theory Tech. 2004, 52, 2352–2360. [Google Scholar] [CrossRef]
- Pohl, N.; Jaeschke, T.; Aufinger, K. An Ultra-Wideband 80 GHz FMCW Radar System Using a SiGe Bipolar Transceiver Chip Stabilized by a Fractional-N PLL Synthesizer. IEEE Trans. Microwave Theory Tech. 2012, 60, 757–765. [Google Scholar] [CrossRef]
- Jaeschke, T.; Bredendiek, C.; Kueppers, S.; Pohl, N. High-Precision D-Band FMCW-Radar sensor based on a wideband SiGe-Transceiver MMIC. IEEE Trans. Microwave Theory Tech. 2014, 62, 3582–3597. [Google Scholar] [CrossRef]
- Statnikov, K.; Grzyb, J.; Sarmah, N.; Heinemann, B.; Pfeiffer, U.R. A Lens-Coupled 210–270 GHz Circularly Polarized FMCW Radar Transceiver Module in SiGe Technology. In Proceedings of the 2015 European Microwave Conference (EuMC), Paris, France, 7–10 September 2015; pp. 550–553. [Google Scholar] [CrossRef]
- Baccouche, B.; Agostini, P.; Mohammadzadeh, S.; Kahl, M.; Weisenstein, C.; Jonuscheit, J.; Keil, A.; Löffler, T.; Sauer-Greff, W.; Urbansky, R.; et al. Three-dimensional Terahertz imaging with sparse multistatic line arrays. IEEE J. Sel. Top. Quantum Electron. 2017, 23, 1–11. [Google Scholar] [CrossRef]
Figure 1.
Two photographs of a glass fiber reinforced plastics (GFRP) test sample containing defined integrated defects and features. (a) Top view. Along the left edge of the sample, some of the defects can be recognized shining through the surface layer. (b) Side view. The sample consists of several layers of different materials (e.g., aramid and foams).

Figure 2.
Terahertz images of the test sample shown in Figure 1. The measurements were performed with two individual sensors operating at (left) 100 GHz and (right) 150 GHz with modulation bandwidths of 40 and 60 GHz, respectively. The images show a cross-sectional view of the sample at the same depth around the center of its thickness. The 100 GHz measurement provides a larger penetration depth, while on the other hand, the 150 GHz measurement provides a larger spatial and depth resolution.

Figure 3.
Schematic (top) and photograph (bottom) of the two-frequency terahertz measurement head combining the two sensor units working at adjacent frequency ranges from 70 to 110 and from 110 to 170 GHz. The fundamental oscillations are generated by two voltage controlled oscillators (VCOs) and multiplied to the target frequencies. A polarization wire grid is employed to overlay the two output signals, which are then focused onto the radome. Images are recorded in reflection geometry.

Figure 4.
(a) Photograph of the two-frequency sensor head mounted inside a cylindrical metallic housing. (b) Photograph of the assembled measurement device with data I/O and power supply connector. The focusing lens tube can be exchanged depending on the exact measurement geometry and distance of the object under test.
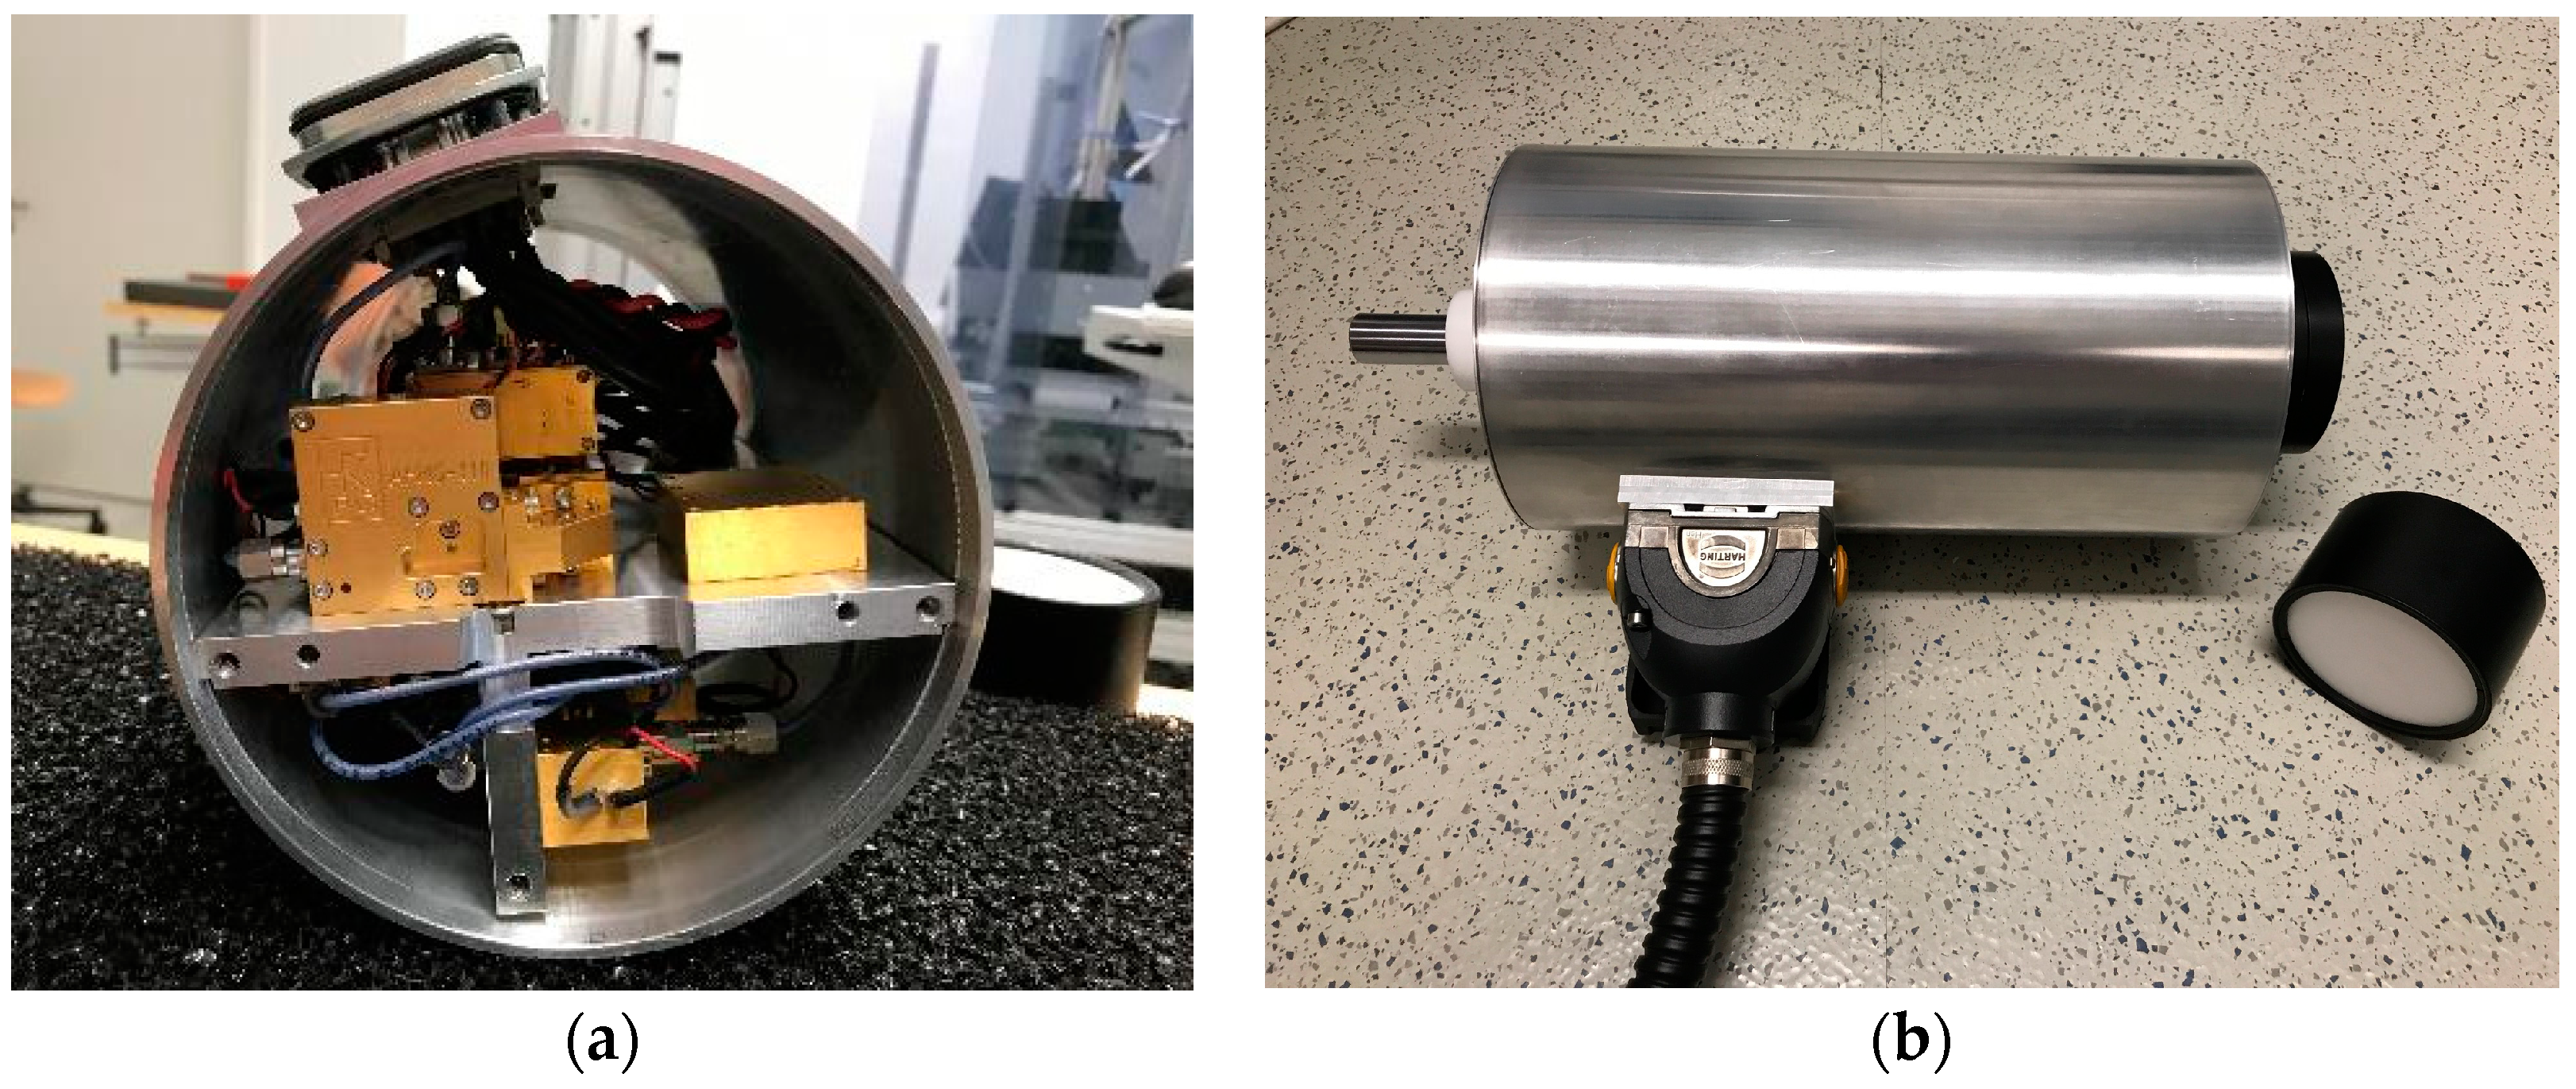
Figure 5.
(a) Schematic drawing of the measurement procedure. A machining head moves the terahertz sensor head at a fixed distance perpendicular along the surface of the radome, which in turn is rotated around its longitudinal axis. In this way, a full three-dimensional image of the radome is acquired. (b) Photograph of the sensor unit mounted on a robotic arm of the machining center in a realistic measurement environment.
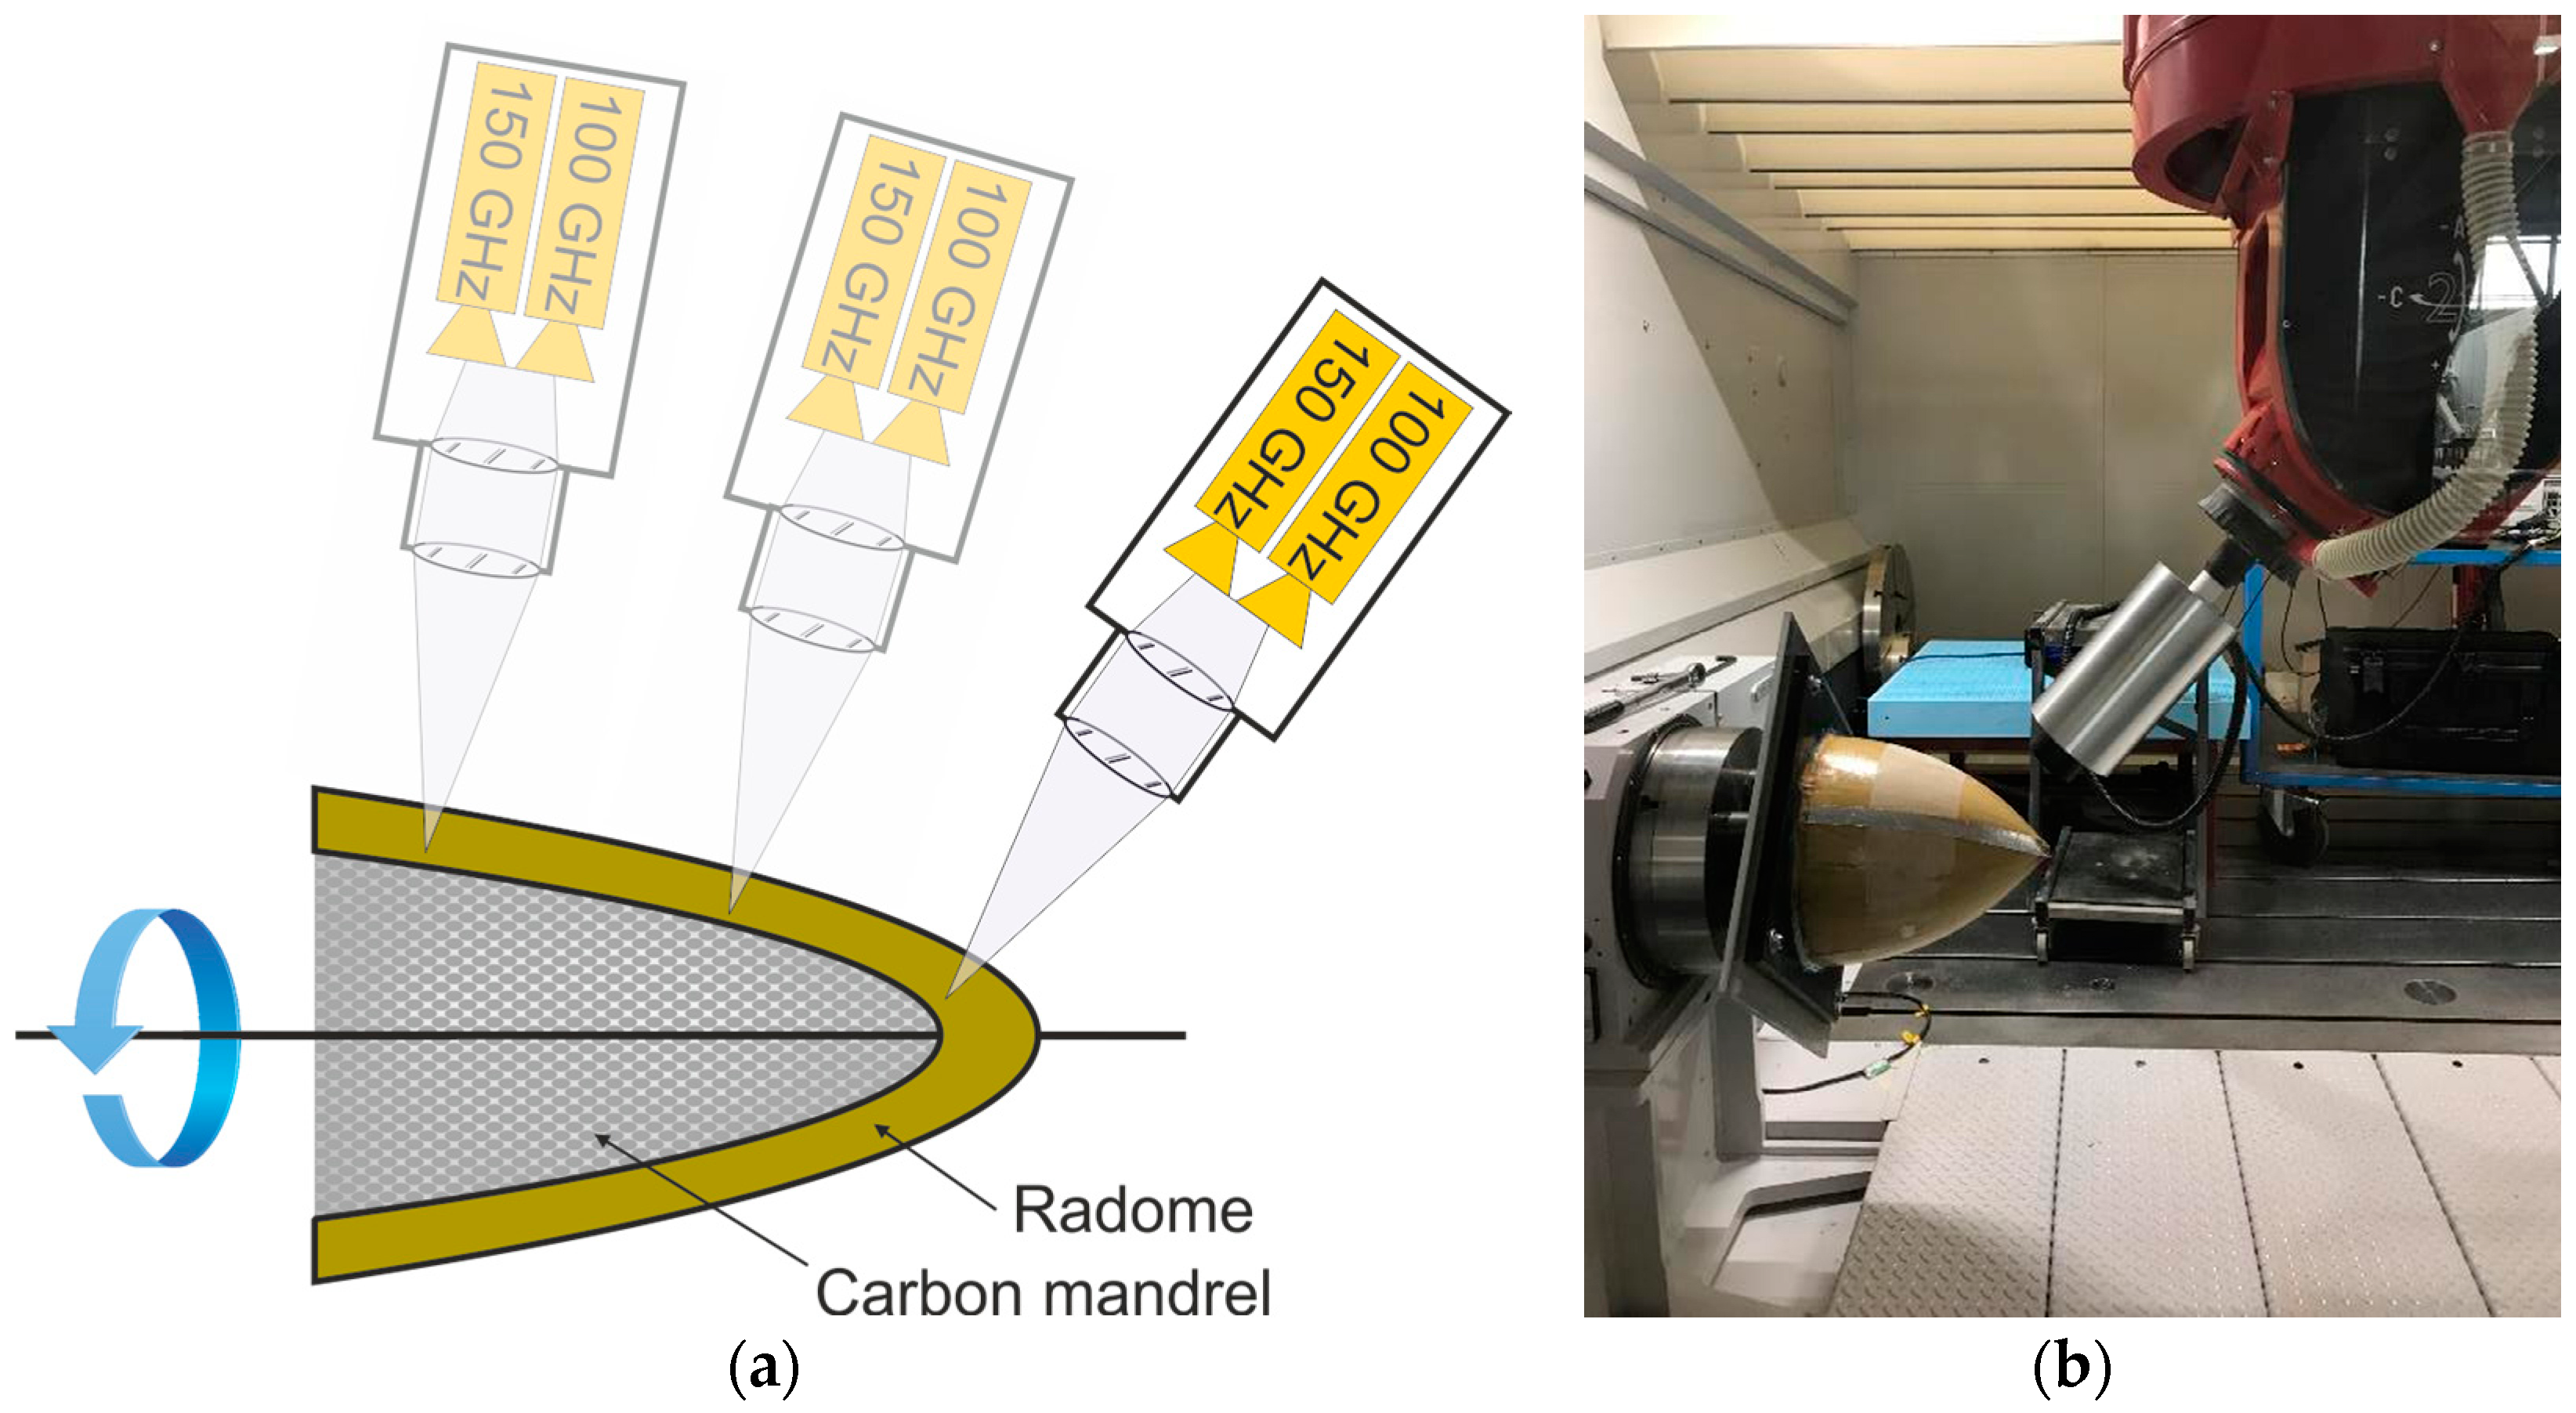
Figure 6.
The top graph shows the linear frequency sweep of the frequency-modulated continuous-wave (FMCW) output signal Sout (blue) and reflected input signal Sin (green). The reflected signal is delayed by a time (time-of-flight) resulting in a frequency difference of at the receiver. The bottom graph shows the time-dependent amplitude of the mixed input and output signal. It consist of the two beat frequencies (sum and difference frequency) of input and output signal. In the given measurement scheme, only the difference frequency is acquired.

Figure 7.
Depth measurement of a plastic sample showing reflection peaks in the measurement signals from the front and backside of the sample. While the reflections from the two layers are almost blurred and reaching the Rayleigh resolution limit for the two individual measurements at 100 GHz (40 GHz bandwidth, blue) and 150 GHz (60 GHz bandwidth, green dots), the fused data (red) with enhanced synthetic bandwidth of 100 GHz clearly resolves the two reflection peaks.

Figure 8.
Terahertz images of the radome structure at three distinct depth layers reconstructed from the measurement data of the 100 GHz sensor unit. The left image shows the radome’s smooth surface, while the center image shows the radomes inner structure at a depth of 10 mm below the surface. The right image of the radome’s back surface reveals individual GFRP panels aligned with its longitudinal axis.
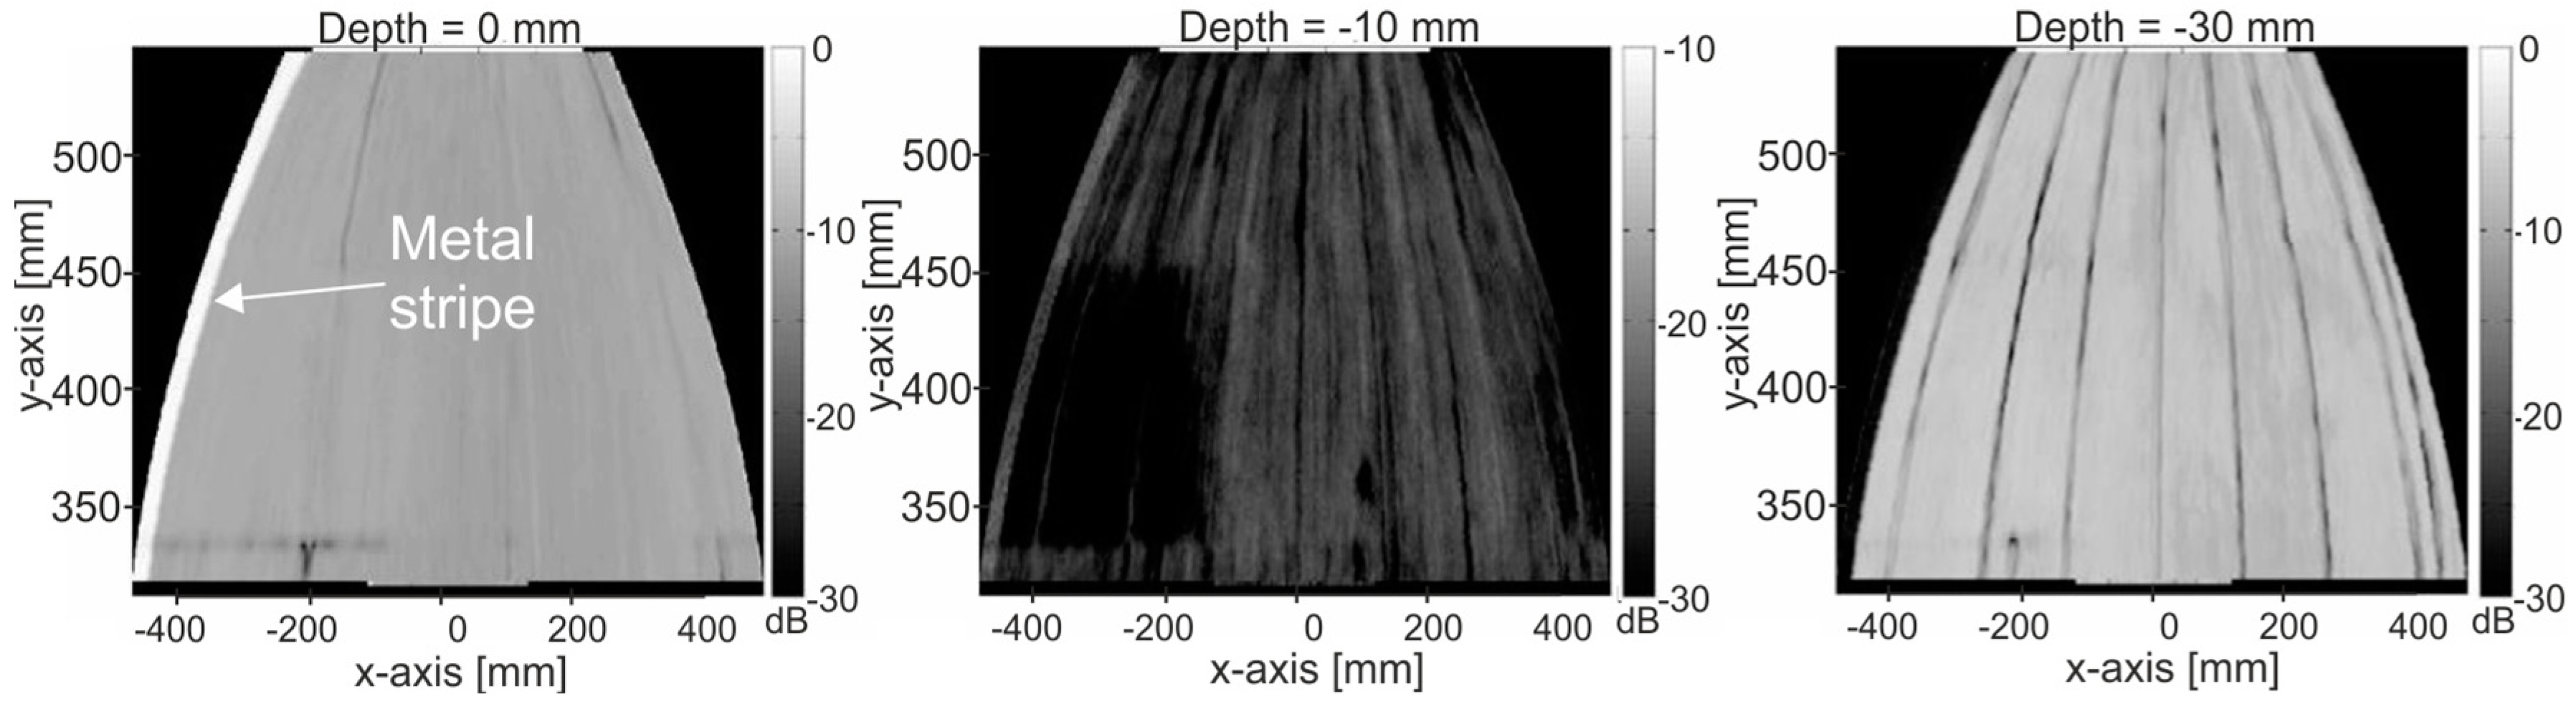
Figure 9.
Top: Reconstructed image of the radome measured with the 100 GHz unit showing the radome’s back surface (a) and a depth cross section (b). The GFRP panels, which the radome is composed of, are clearly identified in both images, as well as the attached metal stripe (left edge). Bottom: The same cross-sectional view from the reconstructed measurement with the 150 GHz unit (c) exhibits a significantly smaller penetration depth. Fusion of the data of both units (d) can be employed to achieve an improved depth resolution and reveals delamination of the GFRP panels from the carbon mandrel at the back surface (Layers 1 and 2).

© 2018 by the authors. Licensee MDPI, Basel, Switzerland. This article is an open access article distributed under the terms and conditions of the Creative Commons Attribution (CC BY) license (http://creativecommons.org/licenses/by/4.0/).
Share and Cite
MDPI and ACS Style
Friederich, F.; May, K.H.; Baccouche, B.; Matheis, C.; Bauer, M.; Jonuscheit, J.; Moor, M.; Denman, D.; Bramble, J.; Savage, N. Terahertz Radome Inspection. Photonics 2018, 5, 1. https://doi.org/10.3390/photonics5010001
AMA Style
Friederich F, May KH, Baccouche B, Matheis C, Bauer M, Jonuscheit J, Moor M, Denman D, Bramble J, Savage N. Terahertz Radome Inspection. Photonics. 2018; 5(1):1. https://doi.org/10.3390/photonics5010001
Chicago/Turabian StyleFriederich, Fabian, Karl Henrik May, Bessem Baccouche, Carsten Matheis, Maris Bauer, Joachim Jonuscheit, Michael Moor, David Denman, Jamie Bramble, and Nick Savage. 2018. "Terahertz Radome Inspection" Photonics 5, no. 1: 1. https://doi.org/10.3390/photonics5010001
Note that from the first issue of 2016, this journal uses article numbers instead of page numbers. See further details here.