Article

Crystal Structure and Coordination of B-Cations in the Ruddlesden–Popper Phases Sr3−xPrx(Fe1.25Ni0.75)O7−δ (0 ≤ x ≤ 0.4)

by
Gunnar Svensson
1,*,
Louise Samain
1,
Jordi Jacas Biendicho
1,2,3,
Abdelfattah Mahmoud
4,
Raphaël P. Hermann
5,
Sergey Ya. Istomin
6 and
Jekabs Grins
1
1
Department of Materials and Environmental Chemistry, Stockholm University, S-106 91 Stockholm, Sweden
2
Catalonia Institute for Energy Research, Jardins de les Dones de Negre 1, 08930 Sant Adrià de Besos, Spain
3
The ISIS Facility, STFC Rutherford Appleton Laboratory, Didcot OX11 0QX, UK
4
GREENMAT, Institute of Chemistry B63APTIS, Institute of Physics, Universitè de Liège, B-4000 Liege, Belgium
5
Materials Science and Technology Division, Oak Ridge National Laboratory, Oak Ridge, TN 37831, USA
6
Department of Chemistry, M.V. Lomonosov Moscow State University, 119991 Moscow, Russia
*
Author to whom correspondence should be addressed.
Inorganics 2018, 6(3), 89; https://doi.org/10.3390/inorganics6030089
Submission received: 5 July 2018 / Revised: 22 August 2018 / Accepted: 24 August 2018 / Published: 31 August 2018
(This article belongs to the Special Issue Mixed Metal Oxides)

Abstract

:
Compounds Sr3−xPrxFe1.25Ni0.75O7−δ with 0 ≤ x ≤ 0.4 and Ruddlesden–Popper n = 2 type structures were synthesized and investigated by X-ray and neutron powder diffraction, thermogravimetry, and Mössbauer spectroscopy. Both samples, prepared at 1300 °C under N2(g) flow and samples subsequently air-annealed at 900 °C, were studied. The structures contained oxygen vacancies in the perovskite layers, and the Fe/Ni cations had an average coordination number less than six. The oxygen content was considerably higher for air-annealed samples than for samples prepared under N2, 7 − δ = ~6.6 and ~5.6 per formula unit, respectively. Mössbauer data collected at 7 K, below magnetic ordering temperatures, were consistent with X-ray powder diffraction (XRD) and neutron powder diffraction (NPD) results. The electrical conductivity was considerably higher for the air-annealed samples and was for x = 0.1~30 S·cm−1 at 500 °C. The thermal expansion coefficients were measured in air between room temperature and 900 °C and was found to be 20–24 ppm·K−1 overall.

Graphical Abstract

1. Introduction

Layered oxides with Ruddlesden–Popper (RP) type structures with general composition An+1BnO3n+1 [1] have represented so-called bifunctional materials, since they contain intergrowth of a rock-salt (AO) slab responsible for oxide-ion conductivity, and perovskite slabs (n·ABO3) which provide electronic conductivity. The second member (n = 2) of the RP family of structures is illustrated in Figure 1. Compounds with mixed electronic and oxide-ion conductivity attract particular interest due to their potential application in high-temperature electrochemical devices, such as solid-state sensors, oxygen permeation membranes, and cathode materials for intermediate temperature solid oxide fuel cells (IT-SOFCs) [2,3,4]. An+1BnO3n+1 RP phases tolerate a wide range of A- and B-cations, like alkaline, alkaline-earth, and rare-earth cations at A-positions, as well as various cations at B-positions, including late 3d-metal cations like Mn–Cu. Moreover, depending on the nature of the B-cation they can form both oxygen deficient or oxygen hyper-stoichiometric phases, although the latter with interstitial oxygen has only been reported for RP n = 1 phases. This allows for a tuning of the electronic and electrochemical properties of RP oxides through variations of their oxygen content.
Sr3Fe2O7−δ [5,6,7] has been known for a long time and been considered for cathode material in IT-SOFC. The oxygen content of the phase is very dependent on the synthesis conditions, and the (7 − δ) values range is typically between 5.5 and 7 [8]. A problem regarding its use in IT-SOFCs is the oxygen loss above 400 °C in air, which leads to a substantial decrease in electrical conductivity [9]. Many studies have aimed to increase the conductivity and minimize oxygen loss of this ferrate at elevated temperatures by replacing part of the Fe by Ni, as in (Sr3−xLaxFe2−yNiyO7−δ, 0 ≤ x ≤ 0.3 and 0 ≤ y ≤ 1.0) [10,11], or Co in (Sr3Fe2−xCoxO7−δ with 0 ≤ x ≤ 1) [12,13]. However, the thermal expansion coefficients (TECs) for these compounds, unfortunately, do not match those of the commonly used electrolytes for SOFC. One reason for this is the change in oxygen content, leading to a strong chemical component in the thermal expansion behavior at high temperature.
We have shown that Sr3−xYxFe1.25Ni0.75O7−δ RP phases have a comparatively low TEC of 14.4 ppm·K−1 [14] (x = 0.75). This may be attributed to the higher strength of the Y–O bond, as compared to the Sr–O bond [15]. However, the electronic conductivity of the phases is rather low.
In this study, instead of Y, we have substituted Sr with Pr, in Sr3−xPrx(Fe1.25Ni0.75)O7−δ with 0 ≤ x ≤ 0.4, as Pr is known to have a high electrochemical and catalytic activity for oxygen reduction. The prepared compounds have been structurally characterized using X-ray powder diffraction (XRD), neutron powder diffraction (NPD), and iron-57 Mössbauer spectroscopy. The high-temperature properties for x = 0.2, 0.3, and 0.4 have been studied using thermogravimetry (TG), dilatometry, and electrical conductivity measurements as a function of temperature. The study shows that it is possible to replace Sr by up to x = 0.4 Pr and that it results in improved electrical conductivity in air compared to Y-substituted phases.

2. Results

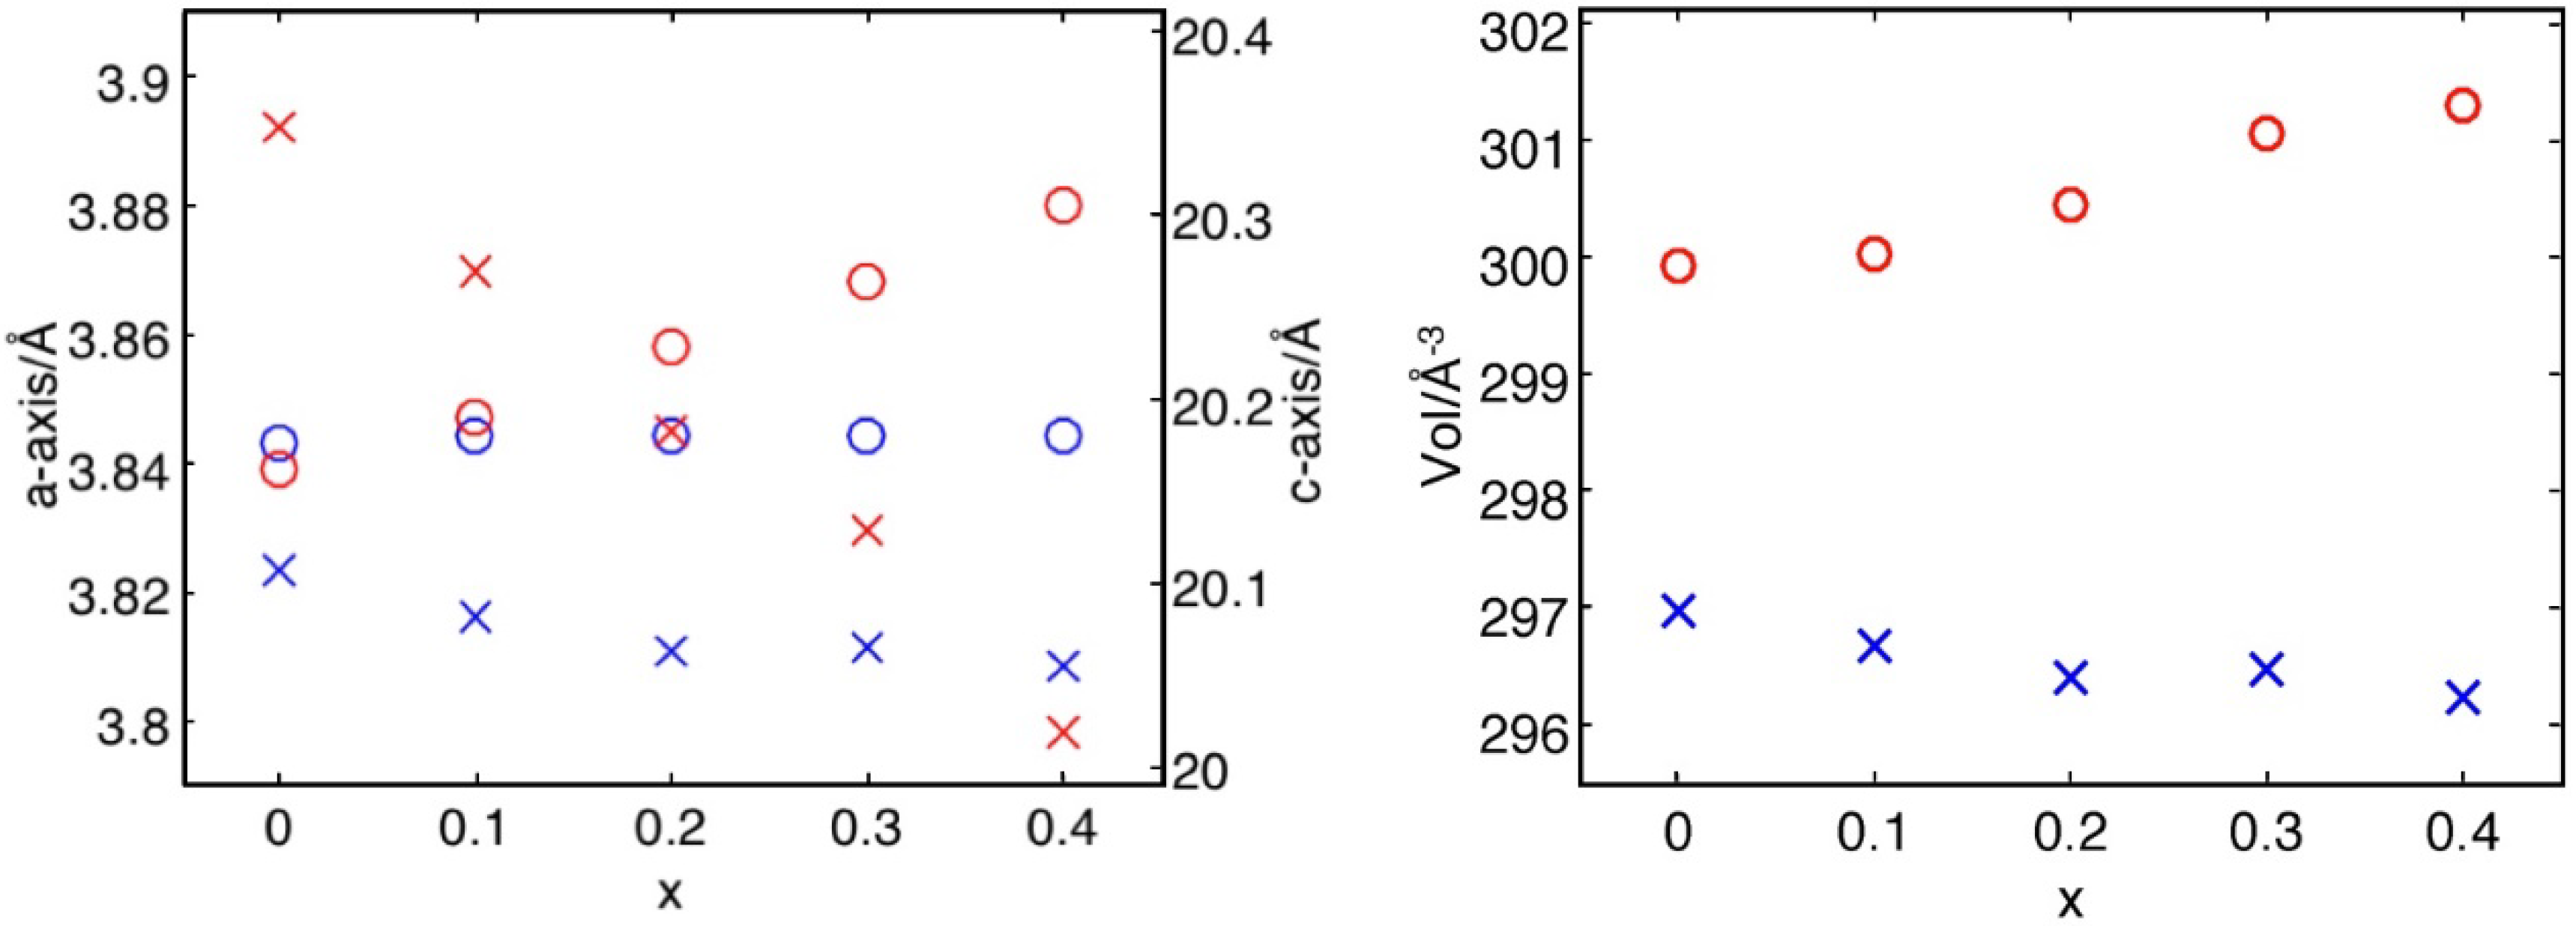
2.1. Phase Analysis and Unit Cell Parameters

XRD single-phase RP n = 2 phases Sr3−xPrx(Fe1.25Ni0.75)O7−δ were obtained in the compositional range 0 ≤ x ≤ 0.4 for both N2- and air-annealed samples. However, x = 0.4 samples were very difficult to obtain as a pure phase. For N2-annealed samples the a-axis increased, while the c-axis decreased with increasing Pr-content, resulting in a small increase in volume as shown in Figure 2. For air-annealed samples the changes were smaller, the a-axis being unaffected and the c-axis slightly decreasing with x, resulting in a minor decrease in unit cell volume, as shown in Figure 2, respectively. The variations are similar to what is observed for Y-doped analogues (x ≤ 0.4) except that the maximum in volume observed therein for N2-annealed samples at x = 0.2 is absent here [14,16]. The trends in unit cell parameters can be related to size difference between Sr2+, Pr3+ and Pr4+ (r(Sr2+) = 1.31 Å, r(Pr3+) = 1.179 Å, r(Pr4+) = 0.96 Å for CN = 9) and Ni2+, Ni3+, Fe2+, Fe3+, Fe4+ (r(Ni2+) = 0.69 Å, r(Ni3+) = 0.60 Å (HS), r(Ni4+) = 0.48 Å (LS), r(Fe2+) = 0.61 Å, r(Fe3+) = 0.645 Å (HS), r(Fe4+) = 0.585 Å for CN = 6) [17] as well as oxygen vacancies in the compounds. Thus, it is not likely that the oxidation number is 4+ for Pr in the N2-annealed sample—we assign it to be 3+. The increase in unit cell volume with increasing x for the N2-annealed samples, despite the smaller size of Pr3+ compared to Sr2+, is thus probably an effect of the reduction of Fe or Ni. For the air-annealed samples, the larger unit cell volumes for the Pr compounds compared to the Y ones suggest that a large amount of Pr3+ is also present in the samples, assuming that the oxygen content is similar [14,16]. The decrease in unit cell volume with increasing x is in agreement with the replacement of the larger Sr2+ with the smaller Pr cation.

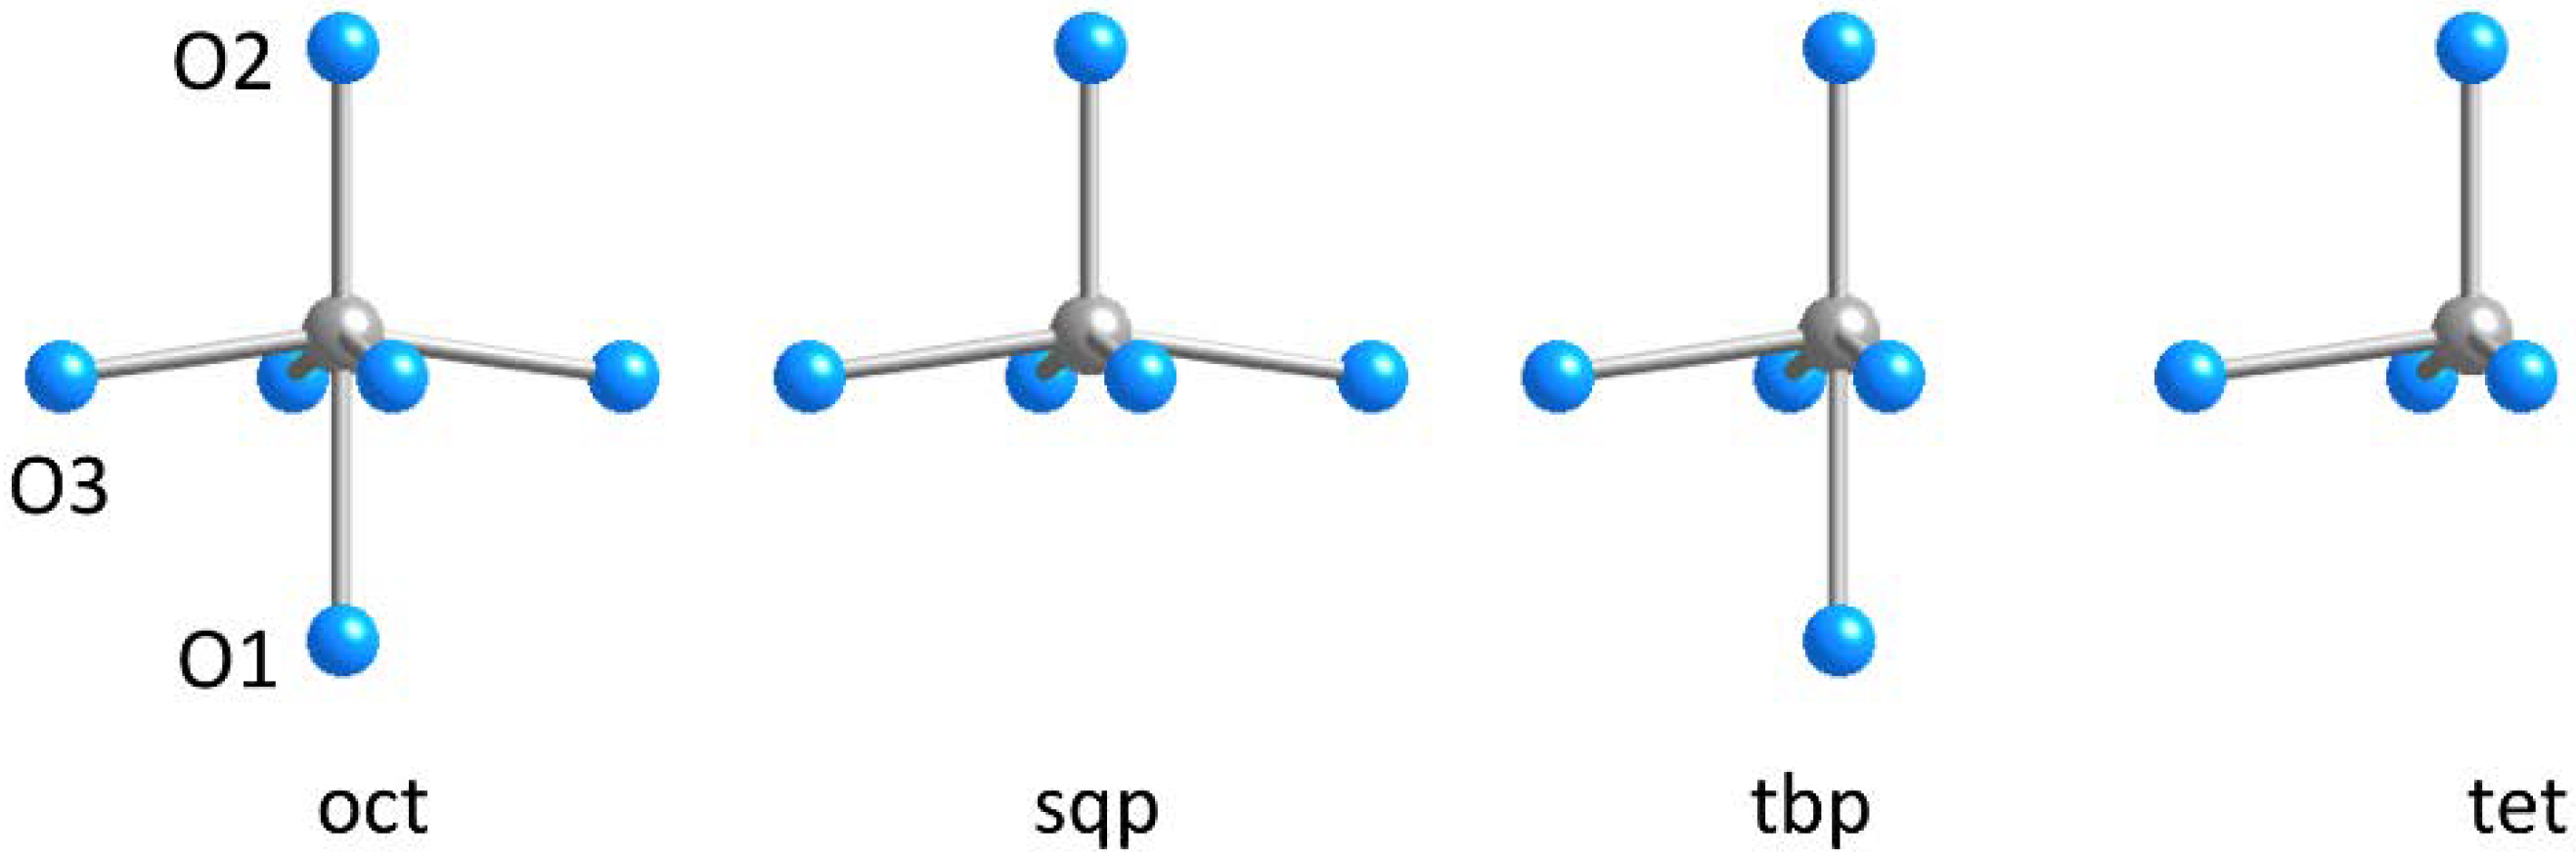
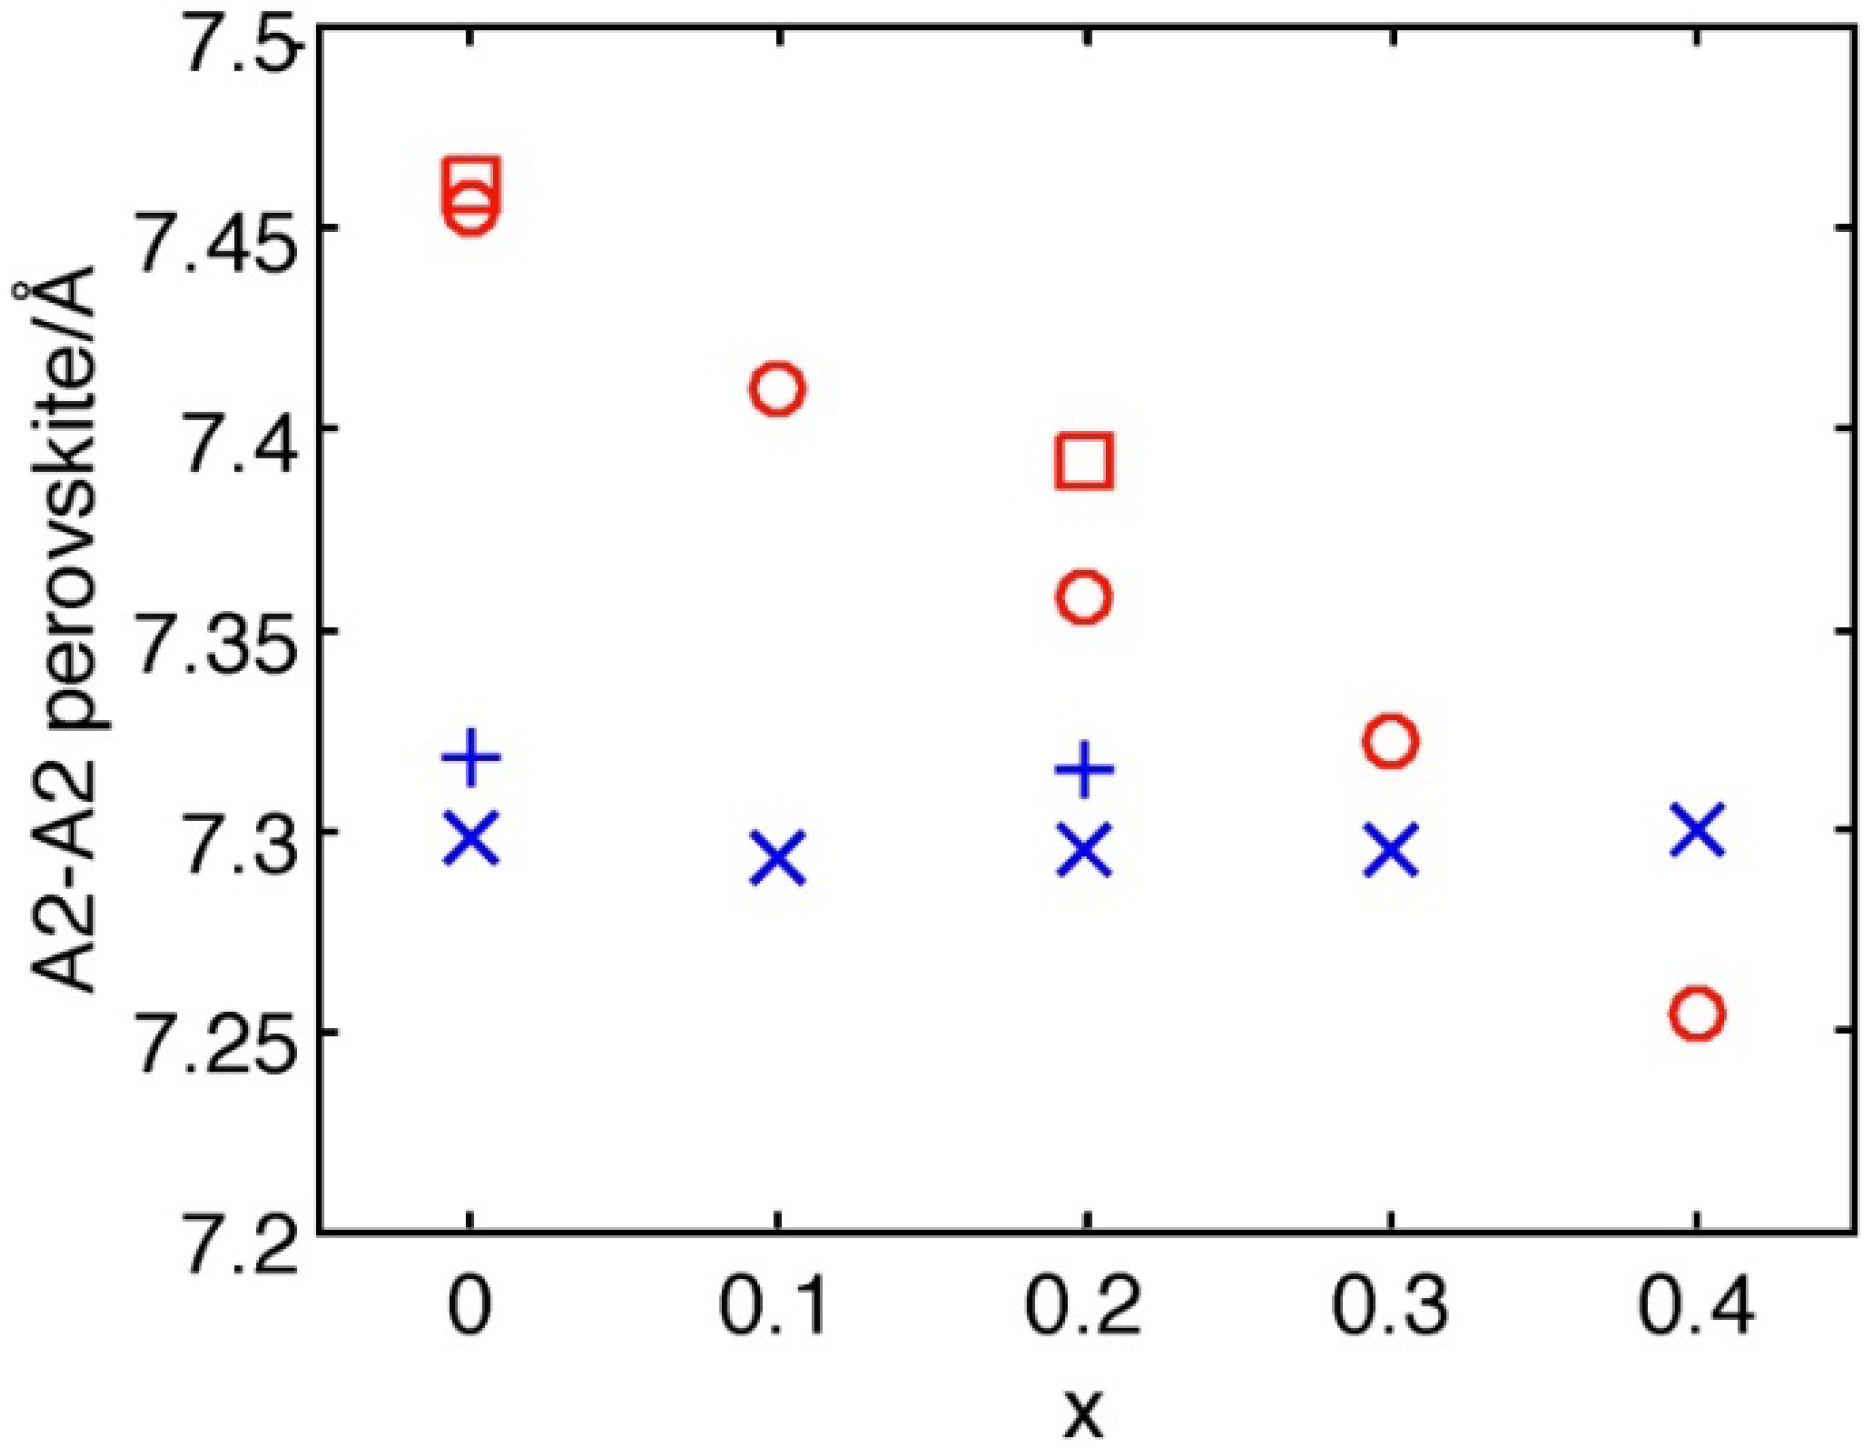
2.2. Neutron Powder Diffraction Studies

XRD data is not optimal for determining the positions and occupancies of O atoms in compounds containing heavier elements. NPD studies were therefore made for four Sr3−xPrx(Fe1.25Ni0.75)O7−δ samples (as prepared and air-annealed x = 0.0, 0.2), for an accurate determination of the O-contents and the oxygen atomic positions in the structures. The structural parameters refined were the z-coordinates for the Sr/Y, Fe/Ni, O2, and O3 atoms, the site occupancy factors (s.o.f.) for O1 and O2, and 12 anisotropic displacement parameters. The accuracy of derived structural parameters can, in the case of NPD data, be accessed from the data obtained for 15 compositions of the analogous phase Sr3−xYx(Fe1.25Ni0.75)O7−δ [16] and in the case of XRD data from the data given in [14]. These results constitute a basis for an analysis of compositional variations of the unit-cell parameters, cation-oxygen distances, and oxygen atom occupancies, complemented with structural refinements based on XRD data. The NPD patterns of the investigated single-phase samples are shown in the Supplementary Information in Figure S1. The refined unit-cell and structural parameters are given in Table 1, and selected bond distances and angles in Table 2.
The refinement of the O occupancies for the N2-annealed samples show that positions O1 and O3 are partially occupied (O1 is ~1/3 of O3) and that the occupancy of the former decreases while the latter increases with increasing x, as shown in Table 1. For air-annealed samples the oxygen contents are higher, and vacancies are only found on the O1 site. The O2 position is fully occupied for all samples in agreement with observations in the literature for other iron-containing Ruddlesden–Popper phases with n = 2 [8,9,10,11,12,13,14,16,18]. The larger O contents for the air-annealed samples implies significant amounts of either Fe4+/Ni3+or Fe5+ in addition to Fe3+.
The refinements show a preferred localization of the smaller Pr cation in the A1 position in the perovskite layer (cf. Table 1) for both x = 0.2 samples. This is understandable for the N2-annealed sample where both O1 and O3 sites are partially occupied, giving A1 an average coordination number of ~8, while the A2 site has a 9-fold coordination. However, for the air-annealed sample, the O1-site occupancy for x = 0.2 is 0.64, and the average coordination for the A1 site is 10.6. The reason why Pr preferably keeps occupying the A1 site also after annealing at 900 °C in air is probably due to moderate diffusion rates of Sr2+ and Pr3+ at that temperature.
The structure can be described in terms of alternating rock salt and perovskite layers, the latter being two octahedra thick. When the corner-shared central O1 ion in the perovskite slabs is absent, square pyramids are formed. To compensate for the missing negative charge, the neighboring O3 ions move towards the positive A1 cation. This leads to shorter A1–O3 and longer B–O3 and B–O1 distances for the N2-annealed Pr sample, where the O1 site is highly vacant, in comparison with the corresponding one in the air-annealed sample. The B–O2 bond distances are very similar for the N2 and air-annealed samples. The presence of partial vacancies at both the O1 and O3 sites in the N2-annealed sample leads to a static disorder of different coordination polyhedra for the B atoms; (i) o = BO6 octahedron (no vacancies), (ii) sp = BO5 square pyramid (O1 vacancy), (iii) tbp = BO5 trigonal bipyramid (1 O3 vacancy), or (iv) t = BO4 tetrahedron (1 O1 and 1 O3 vacancy), shown in Figure 3, as described by Kharton et al. [18]. This static disorder is reflected in large anisotropic atomic displacements of the O atoms (see Figure 4), as they contain contributions from a static disorder from several different coordination polyhedra. Other coordination polyhedra are conceivable, e.g., a distorted planar 4-coordination, but are considered less likely. Overall, the most probable coordination is square pyramidal, because the O1 site occupancies are only ~0.3 for the N2-annealed samples. The anisotropic temperature factors for the air-annealed phase are smaller, as there are only O1 vacancies and thus only two polyhedra, octahedra, and square planar pyramids.
The B–O3–B angle strongly deviates from the ideal angle of 180°, with values being 161.50(6)° and 170.33(7)° for the as-prepared and air-annealed samples, respectively. As expected, the deviation from 180° for the B–O3–B angle is more substantial for the N2-annealed sample, with a lower occupancy of the O1-site.
The bond valence sums (BVS) calculated for the A and B cations in the x = 0.0 and 0.2 crystal structures using A = Sr2+ and B = Fe3+ are shown in Table 3. The BVS for both A sites increases upon air-annealing, while with increasing Pr-content (x = 0.2), only the A1 increases, while A2 stays the same. This is in agreement with the Sr/Pr content from the NPD and XRD refinements (see below), showing a preference for the Pr to A1 site.

2.3. Refinements Using XRD Data

Structural refinements using XRD should give rather reliable positions for Sr/Pr/Ni/Fe atoms, while being less reliable for the light oxygen atoms. The refinements confirm that Pr has a strong preference for the A1 position in the perovskite layer for both the N2- and air-annealed samples, as shown in Supplementary Materials. The Sr/Pr distribution is set at the high temperature (1300 °C) annealing in N2, where the smaller Pr3+, compared to Sr2+, prefers the lower coordination number in the perovskite layer with vacancies at the O1 and O3 positions. The thickness of the perovskite slab, as defined by the interatomic distance between A2–A2 cations, decreases with x for the N2-treated samples, shown in Figure 5. This is a combined effect of increased Pr content and a transfer of vacancies from the O3 to the O1 site with increasing x, as shown by the NPD data—similar to that observed for the Y-analogues [16]. For the air-annealed samples, the perovskite block does not change in size with increasing x.
Despite the uncertainty in the O positions from XRD data, important trends can be identified in each series as a group and by comparing them with the results from the NPD data. The only refined positional coordinates are z for O2 and O3, and occupancies for O1 and O3. A plot of z versus x reveals large standard deviations and spread in z for O2, showing that these values are of low reliability. The O3 z-values behave better, and for N2-annealed samples a systematic decrease with x is observed, while it is more or less constant for air-treated samples. This leads to a systematic decrease of the O3–B–O3 angle with x for the N2-annealed samples, whereas it is absent for the air-annealed samples. The former is understandable, considering that there are oxygen vacancies both at the O1 and O3 positions for low x-values, while for x = 0.3 and 0.4 the O3 site is close to fully-occupied and the O1 site is close to empty, which is in agreement with that reported for the Y-analogues [14,16]. The overall oxygen content for the N2-annealed sample seems to increase slightly with x with a median at 5.5, although exact values are not possible to obtain on the basis of XRD data. The values are, however, similar to those given by the NPD data for x = 0.0 and 0.2, being 5.59 and 5.68, respectively, as well as for those reported for related systems [9,12,14,16]. For the air-annealed samples, oxygen vacancies are only found at the O1 site, in agreement with oxygen contents ranging from ~6.1 for x = 0.0 to ~6.7 for x = 0.4. They can be compared with those from NPD data, 6.55(1) and 6.64(1) for x = 0.0 and 0.2, respectively.

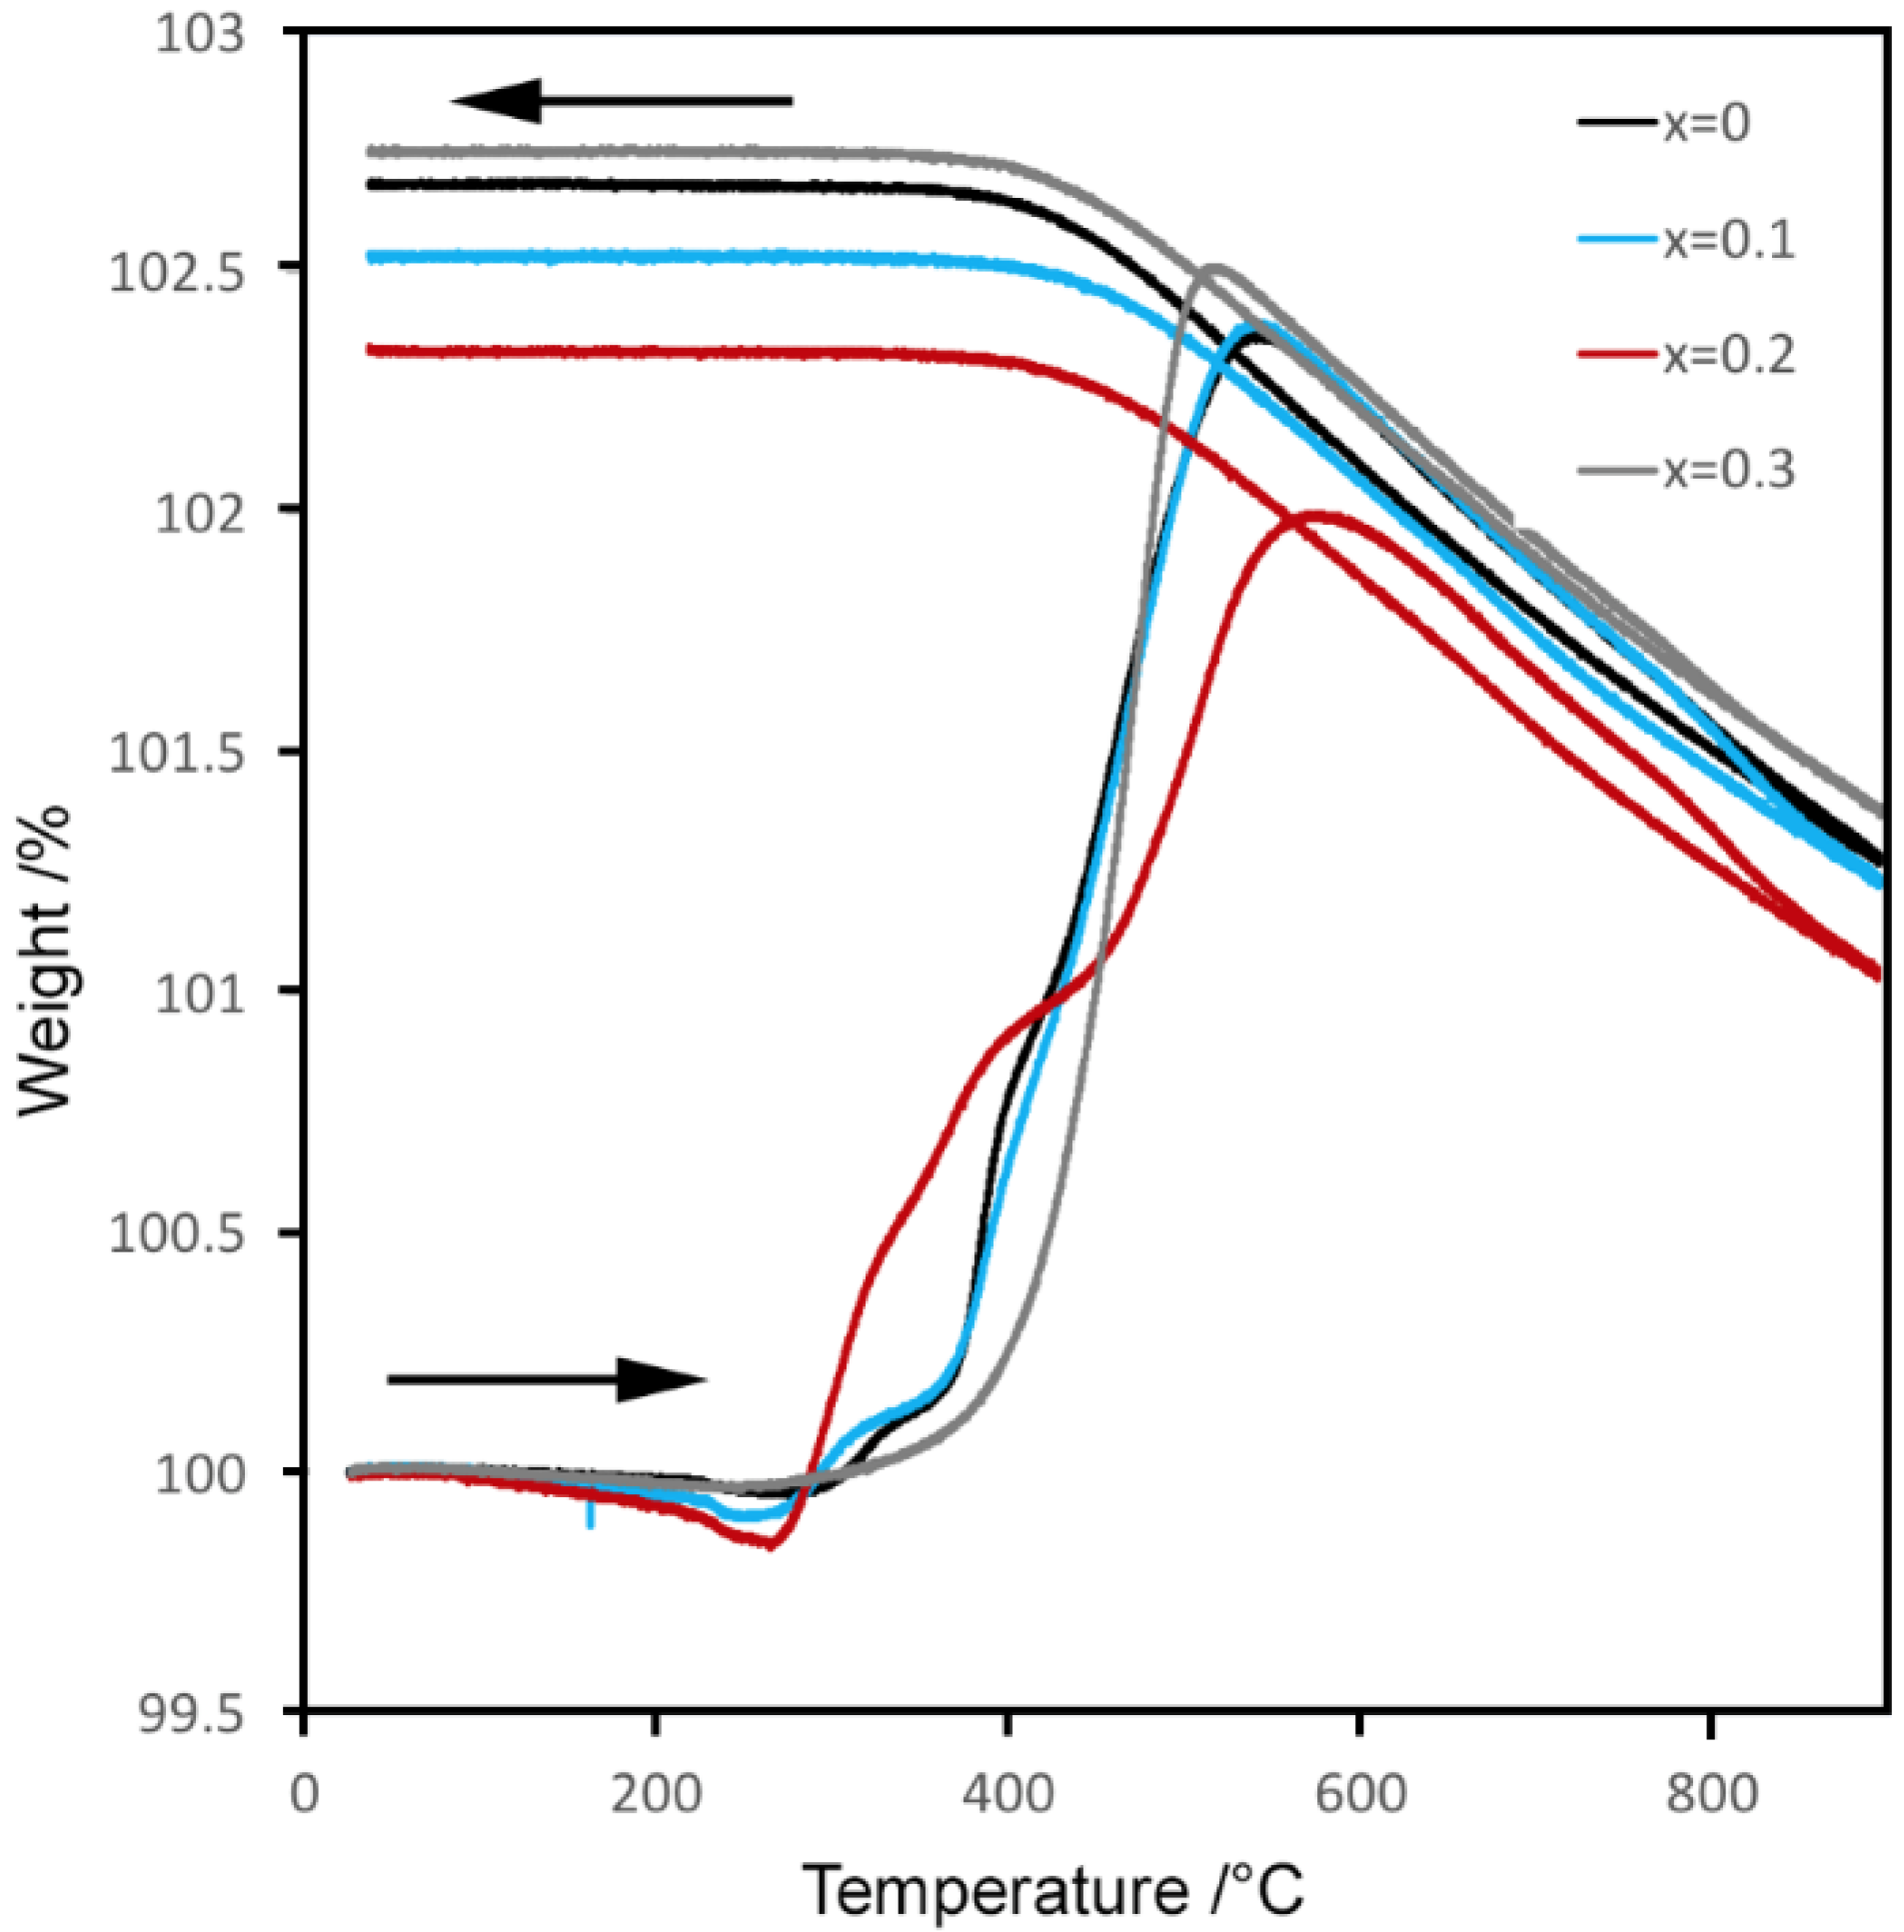
2.4. Thermal Studies

Freshly-prepared samples, or samples stored in desiccators, showed no significant weight changes upon heating below ~400 °C. It is known that small weight losses are observed in this temperature range for x = 0 samples exposed to ambient air for long periods of time [14]. TG-analysis of the N2-annealed samples in air shows that their weight increases from ~350 °C to ~500 °C, whereupon they start to lose weight, as shown in Figure 6. The TG-curves show only minor weight changes below ~400 °C upon cooling, indicating that the oxygen content is set by the pO2 at that temperature upon cooling in air and most probably also in N2(g).
The observed weight increases for N2-annealed samples with x = 0.0 to 0.3 varied in a non-systematic way between 2.34 and 2.72 wt %. This corresponds to the changes in O content per formula unit of δ = 0.70–0.82, which is in reasonable agreement with the difference in O-content for N2-annealed and air-annealed samples observed from both XRD and NPD data, δ = 0.9–1.0, very similar to what is observed for the Y-analogues [14]. A TG analysis in 4% H2 in Ar of the x = 0.1 N2-annealed sample yielded an oxygen content of 5.46, which is in excellent agreement with that from XRD/NPD data, shown in Supplementary Materials, Figure S3.
The thermal expansion coefficients (TEC) are shown in Table 4. The overall TEC is in the same range as observed for Sr3FeNiO7−δ (22.7 ppm·K−1) [11] and decreases slightly with increasing x. It is significantly higher than that of Sr2.25Y0.75Fe1.25Ni0.75O7−δ (14.4 ppm·K−1), which can partly be seen as an effect of a larger thermo-chemical expansion due to higher O-content for the Sr/Pr compounds. The thermal expansion exhibits a low and high temperature region, and the TEC is significantly higher, above 400 °C. This is due to a thermo-chemical expansion effect, as the compounds start to lose oxygen at this temperature.

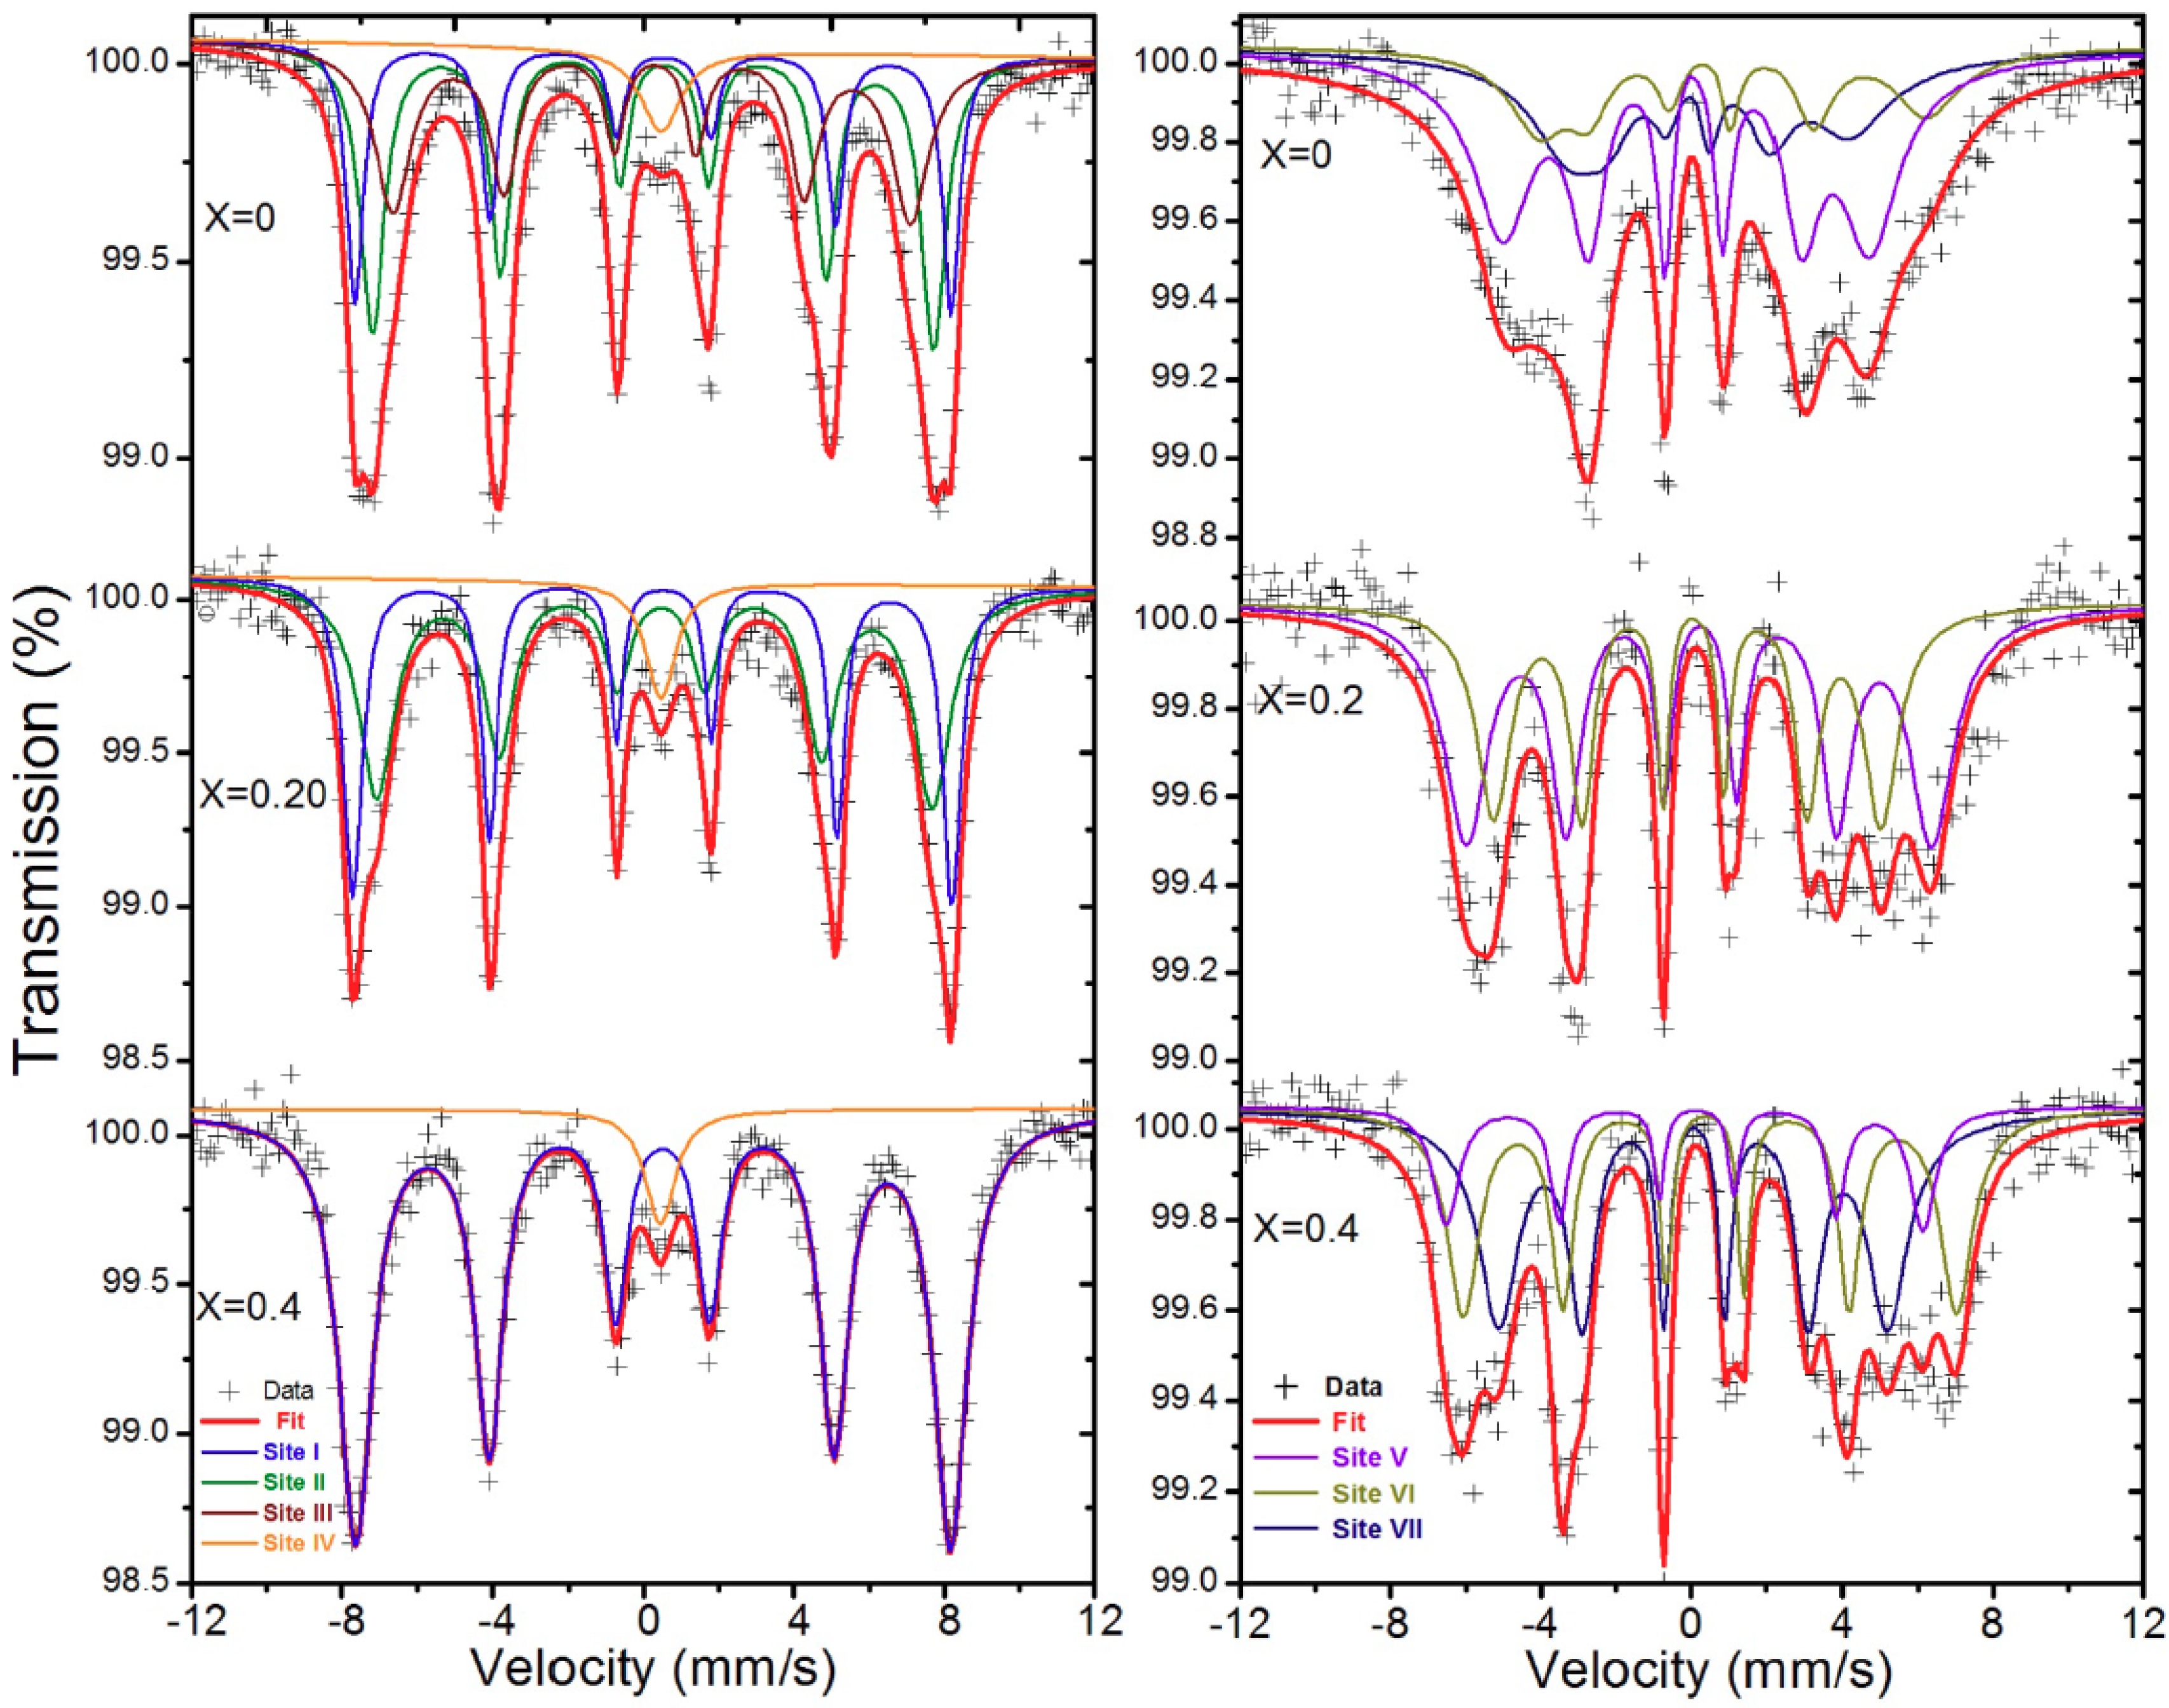
2.5. Iron-57 Mössbauer Spectroscopy

Iron-57 Mössbauer spectroscopy at 7 K was used to probe the oxidation state of Fe ions and to investigate their coordination, as shown in Figure 7. The results indicate clear changes in the local coordination of the Fe ions upon oxygen uptake. All spectra reveal the presence of magnetic ordering, manifested as relatively well-resolved sextets, which makes it possible to arrive at rather unique fitting models which are consistent with the NPD and XRD data. At room temperature, all samples are paramagnetic.
The magnetic spectra for the N2-annealed samples were fitted with one to three sextets (denoted by site I, site II, and site III) and a possible paramagnetic singlet component (site IV). The corresponding spectral parameters are given in Table 5. All as-prepared samples exhibit sextets with an isomer shift, δ, between 0.26 and 0.40 mm/s, and a single component with a slightly high isomer shift, δ, 0.45–0.5, all typical for Fe3+. The presence of exclusively Fe3+ is consistent with the inert synthetic conditions for these samples, as no higher oxidation states of iron are expected under an atmosphere with nitrogen. The differences in isomer shift and hyperfine field, Bhf = µ0Hhf, are related to the differences in iron coordination. Generally, an increase in isomer shift and hyperfine field corresponds to an increased coordination number [7,20].
The spectral parameters for Sites I and II are similar, as both correspond to pentahedrally-coordinated Fe3+ ions. The iron ions with pyramidal coordination can adopt two different configurations in the as-prepared phases—either a square pyramid (sp) or a trigonal bipyramid (tbp), depending on the oxygen site (O1 or O3) that is vacant. Moreover, variations in the second coordination spheres of the iron ions can also lead to slightly different spectral [21]. Site III is assigned to tetrahedral iron ions, as suggested by its isomer shift and hyperfine field that are smaller than those of sites I and II. Finally, we attributed site IV to paramagnetic Fe3+. In the as-prepared phases, octahedral Fe3+ is absent, in agreement with NPD and XRD data, which both indicate a very low probability of having both O1 and O3 sites occupied. Only the non-substituted sample, Sr3Fe1.25Ni0.75O7−δ, appears to contain a non-negligible amount of tetrahedral iron ions (33%), according to the Mössbauer data. This is unexpected, as according to the NPD data, both x = 0.0 and 0.2 have significant amounts of vacancies (18% and 15%) at the O3 site.
The information that all Fe cations are in oxidation state 3+ and assuming Ni cations are 2+ gives the oxygen content for N2-annealed samples to be 5.62, 5.72, and 5.82 for x = 0, 0.2, and 0.4, respectively. This is in fair agreement with what has been observed in the NPD, XRD, and TG studies.
The 7 K Mössbauer spectra of the air-annealed samples have been fitted with two or three sextets (sites V, VI, and VII), shown in Figure 7. The obtained spectral parameters are shown in Table 6. The iron ions on sites V and VI exhibit a positive isomer shift, ranging from 0.06 to 0.65 mm·s−1, whereas site VII exhibits a slightly negative isomer shift, around −0.02 mm/s. According to the NPD and XRD, the oxygen contents in air-annealed samples range between 6.4 and 6.6. After an uptake of oxygen, the samples are expected to contain octahedral Fe3+, penta-coordinated Fe3+ (due to the partial occupation of the O1 sites), as well as oxidized iron ions, Fe4+ and/or Fe5+, for charge balance, which can both be in octahedral or pyramidal coordination. The assignment of the three sextets, V, VI, and VII, to specific coordination and oxidation states proceeds by using this information.
The presence of tetravalent iron ions is not uncommon in complex oxides [22,23] treated in oxidizing atmospheres. Tetravalent iron, next to a genuine Fe4+ state, can either undergo charge disproportionation, i.e., 2Fe4+ → Fe3+ + Fe5+, in the limit where electron-hopping is slower than the Mössbauer time scale, or appear as an “averaged” valence state, with an isomer shift between the value expected for Fe3+ and that for Fe5+ [24,25,26], in the fast electron-hopping limit. The isomer shift and a hyperfine field of site VII are typical for octahedral Fe5+ in perovskite-like structures [27]. The sextet with the largest isomer shift (ranging from 0.46 to 0.65 mm·s−1) and hyperfine field (from 25 to 40 T), i.e., site V in each sample, is attributed to octahedral Fe3+. The assignment of site VI is more ambiguous because the isomer shift for the x = 0.4 sample is significantly different from those for x = 0.0 and 0.2. We interpret this as site VI in the x = 0.4 being related to Fe4+, whereas it is related to Fe3+ in the x = 0.0 and 0.2 samples. The lower spectral hyperfine parameters for x = 0.0 suggest a 5-fold coordination.
Assuming equal recoil-free fractions for Fe3+, Fe4+, and Fe5+ ions, and based on the spectral area of the different site, an average oxidation state for Fe can be calculated in each sample. Matching the derived oxygen contents with those obtained by XRD, NPD, and TG (see below) requires Ni to be necessarily Ni3+ in the air-annealed samples, while maintaining the oxidation states of Pr3+ and Sr2+. However, there is an ambiguity for the oxidation state of the Fe at site VI. If one assumes it to be 3+ for x = 0.0 and 0.2 but 4+ for 0.4, as motivated by the lower isomer shift for the latter, then the oxygen content will be 6.6, 6.8, and 6.5, respectively. This is in agreement with the NPD/XRD results.

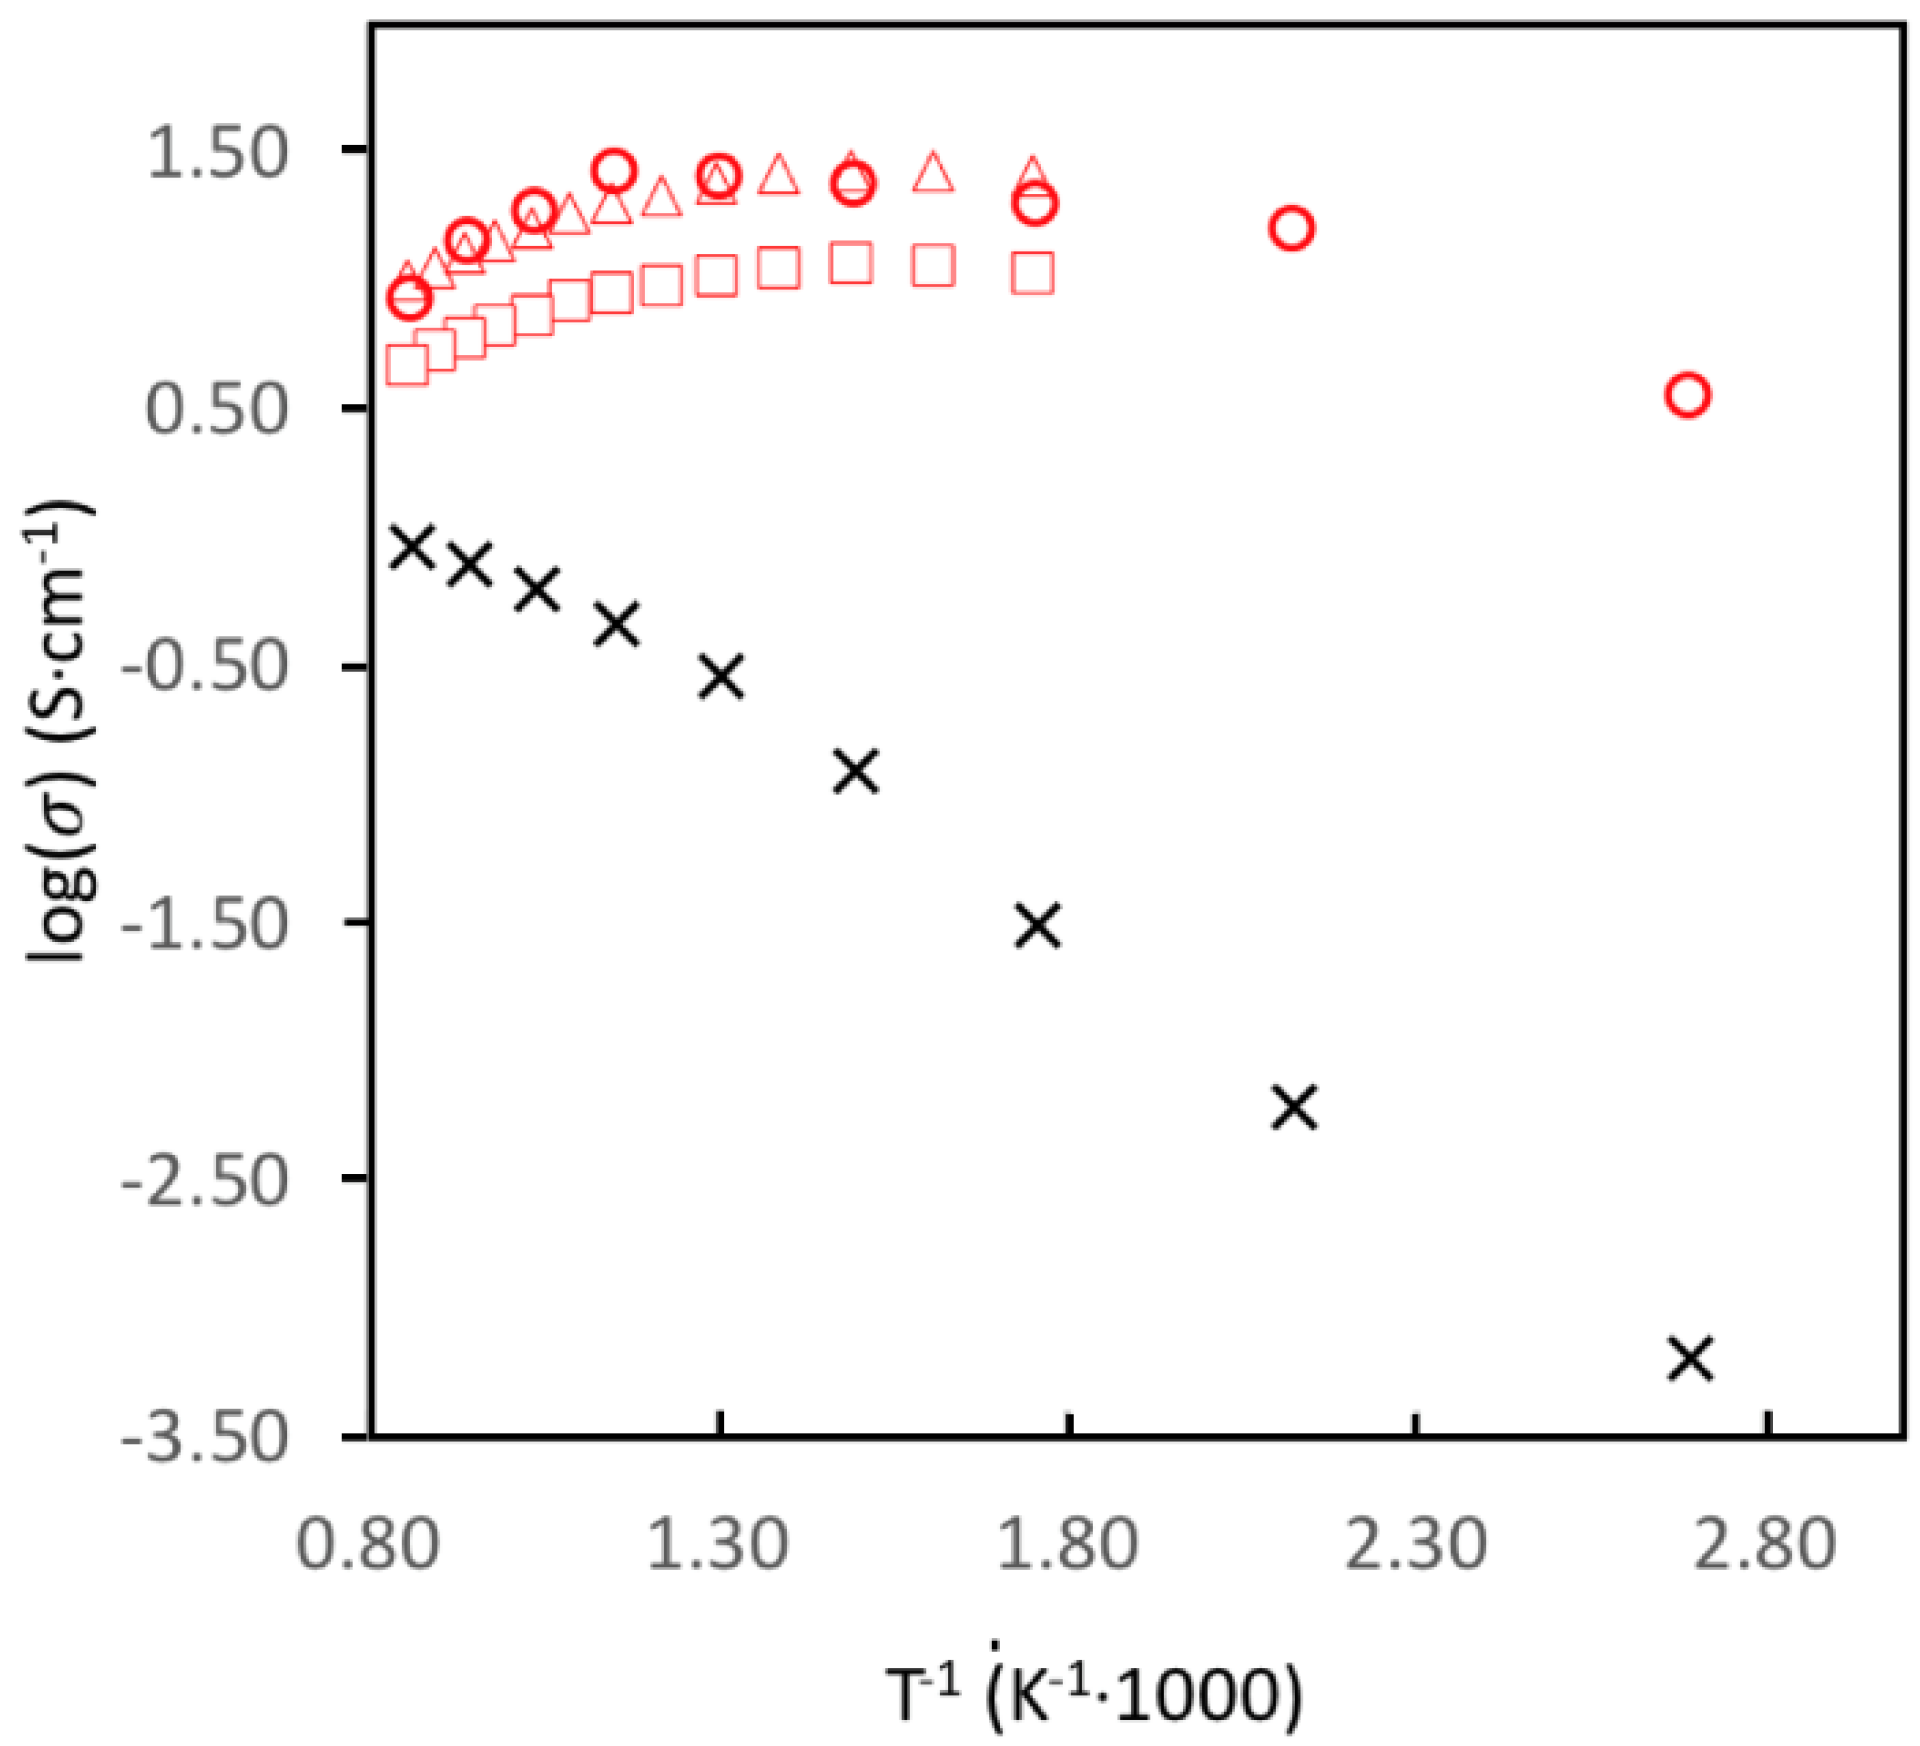
2.6. High-Temperature Electrical Conductivity

The temperature dependence of the conductivity for x = 0.2 N2-annealed (measured in N2(g)) and x = 0.2, 0.3, and 0.4 air-annealed samples (measured in air) are shown in Figure 8. The conductivity of the N2-annealed sample follows an Arrhenius-type behavior with activation energy of ~0.33 eV, and is ~30 S·cm−1 at 900 °C. The conductivity for the air-annealed samples are between one and two orders of magnitudes higher (depending on temperature) and decreases with increasing x, which we attribute to a higher oxidation state of the B-cations and a larger B–O3–B angle.
Between 100 and ~400 °C, the conductivity of the air-annealed sample with x = 0.2 is thermally activated and essentially constant with an activation energy of ~0.16 eV, similar to what is reported for Sr2.7Ba0.3Fe2O7−δ, Sr2.6La0.4Fe2O7−δ and Sr2.5Y0.5Fe1.25Ni0.75O7−δ (0.11, 0.12, and 0.16 eV, respectively) [14,26]. At higher temperatures, the conductivity starts to decrease due to oxygen loss and associated decrease of charge carrier concentration due to a reduction of the average oxidation state of the B-cations. This is similar to what reported in related systems—Sr3FeNiO7−δ [10], Sr3Fe2O7−δ [10], and SrxY1−xFeO3−δ [28] and Sr3−xYxFe1.25Ni0.75O7−δ [14]. It should also be noted that conductivity for the Pr-containing sample is an order-of-magnitude higher than that reported for the Y-system. This is not surprising, as there is a strong hybridization near the Fermi level of the 4f states of Pr and 2p states of O resulting in the formation of wide energy bands.

3. Discussion and Conclusions

The oxygen content of the samples, assuming phase purity and deduced from a combination of experimental results and assumptions, are presented in Table 7. Sr3−xPrxFe1.25Ni0.75O7−δ annealed in N2 as well as in air are highly oxygen deficient, and the Fe/Ni ions have various coordination polyhedra. The O-content for the N2-annealed samples can be calculated with the assumption that all Fe is 3+ (supported by the Mössbauer data, MB) and Ni is 2+. It varies between 5.63 for x = 0 to 5.83 for x = 0.4, which is in decent agreement with the NPD/XRD results. The occupancies from the NPD data and, to some extent, also from the XRD data (with its limitations) show that tetrahedra and bipyramids/square pyramids must be present for all x values. The MB data suggest that five coordinated Fe3+ dominate for x = 0.0, 0.2, and 0.4, while tetrahedrally coordinated Fe3+ is only found for x = 0.0 (cf. Table 5, site III). This is a bit surprising, as one would expect some tetrahedral coordinated B-cations also for x = 0.2 and 0.4, as O3 is not fully occupied. One reason for this happening could be that some of the Ni2+ have a tetrahedral coordination, an element which Mössbauer does not provide any information about. For a random distribution of Fe3+ and Ni2+ ions over the coordination polyhedra, the occupancies of O1 and O3 and the oxygen content from the NPD/XRD data suggest that for x = 0.0, 0.2, and 0.4: ~43%, ~59%, and ~0% tetrahedra, ~43%, ~27%, and 0% bipyramids, ~23%, ~17%, and ~100% square pyramids.
The air-annealed samples show substantially larger O contents than the N2-annealed ones. The O contents are around ~6.6 according to NPD and XRD data, associated with higher average oxidation states of the B cations. A significant number of vacancies are only found on the O1 site, and the expected coordination polyhedra are square pyramids and octahedra. The interpretation of the Mössbauer data is not straightforward, as the result is model-dependent—but if the oxygen content from the NPD/XRD studies are used as guidelines, then the x = 0.0 and 0.2 samples contain two sites—V and VI with Fe3+ and one VII with Fe5+—while for x = 0.4 sites, V is Fe3+, site VI Fe4+, and site Fe5+, shown in Table 5, assuming all Ni in the phase to be Ni3+. The Fe5+ ions are formed by disproportionation of Fe4+, according to 2Fe4+ → Fe3+ + Fe5+. According to the NPD/XRD study, the average oxidation states of Fe are very similar for all the x-values, i.e., +3.7–3.8, which is in rather good agreement with the values obtained from the MB studies (see Table 6).
The moderate values of high-temperature electrical conductivity of the Sr3−xPrxFe1.25Ni0.75O7−δ samples in combination with their rather high TEC are weak points of these compounds as electrode materials for IT-SOFCs. However, due to the wide range of oxygen non-stoichiometry, existence of Fe cations in various coordination environments and easy transition between them indicate that oxygen reduction kinetics on these cathode materials need to be improved.

4. Materials and Methods

4.1. Materials

The phases Sr3−xPrxFe1.25Ni0.75O7−δ with 0 ≥ x ≥ 0.4 were prepared by annealing mixtures of NiO (99%, Sigma-Aldrich, St. Louis, MO, USA), α-Fe2O3 (99.8%, ABCR GmbH, Karlsruhe, Germany), SrCO3 (99%, Mallinckeodt, St. Louis, MO, USA), dried at 500 °C for 12 h before use, and Pr6O11, prepared by oxidizing Pr metal (99.9%, ABCR GmbH, Karlsruhe, Germany) and checked by XRD. Stoichiometric amounts of the starting materials were homogenized by grinding in isopropanol and pressed to pellets. The pellets were heated under a N2(g) flow at 1300 °C for 68 h, then slowly cooled to 900° thereafter, and the furnace was turned off while leaving the N2(g) flow on. This was repeated four times with intermediate grindings and pelletizing. A part of the as-prepared samples was subsequently heat-treated in air at 900 °C for 12 h, using a heating rate of 300 °C/h and a cooling rate of 50 °C/h. The obtained dark-brown- to black-colored samples were pulverized and characterized by XRD. Samples were stored in desiccators in order to avoid compositional and structural changes due to moisture uptake, which were observed for similar phases, especially for Sr-rich compositions [12,14]. Characterizations by XRD and TG were made on fine-grinded powders, implying a grain size distribution centered around 1–10 µm.

4.2. Methods

Room temperature XRD patterns were recorded with a PANalytical PRO MPD diffractometer (Panalytical, Almelo, Netherlands) using 1.5406 Å Cu Kα1 radiation, a 2θ range of 15.0° to 140.0°, a step size of 0.0131°, and a total measuring time of 4.25 h, yielding maximum peak intensities of ~25,000 counts.
Time of flight (TOF) NPD patterns of as-prepared and air-annealed samples were obtained at room temperature; (i) for x = 0.0 with the POWGEN instrument at the Spallation Neutron Source, Oak Ridge National Laboratory, Oak Ridge, TN, USA, and (ii) for x = 0.2 with the POLARIS instrument at the ISIS neutron spallation source, Rutherford Appleton Laboratory, England.
Structural parameters were refined using the Rietveld method [29] and the Fullprof software [30] for the XRD data, and for the NPD data the program TOPAS (Topas Academic Version 4.1, Coelho Software, Brisbane, Australia) for x = 0.0 and GSAS (95/98/NT/2000 Distribution Kit, Regents of the University of California, Berkely, USA) [31] for x = 0.2 was used. The space group I4/mmm was used in all refinements. Further information about the refinements is given in the Supplementary Materials.
Thermogravimetric (TG) analysis was performed with a PerkinElmer TGA7 instrument using a Pt crucible (The Perkin Elmer Corporation, Norwalk, CT, USA). Two series of experiments were made: (i) as-prepared samples were heated in flowing air to 900 °C, held for 15 min and then cooled to room temperature (heating/cooling rate of 5 °C·min−1), and (ii) air-annealed samples were heated in flowing N2 up to 900°C using a heating rate of 10 °C·min−1, and then quenched to room temperature. Additional TG measurements in 4% H2/Ar atmosphere were made with a Netzsch STA 449 F1 Jupiter (Netzsch Gerätebau GmbH, Selb, Germany), equipped with a mass spectrometer Netzsch QMS 403 C Aëolos (Netzsch Gerätebau GmbH, Selb, Germany). The measurements were carried out between room temperature and 1500 °C with a heating rate of 5 °C·min−1, shown in Supplementary Materials, Figure S3. The temperature regime was defined by measuring the binary oxides Pr6O11, NiO, and Fe3O4, which showed weight loss due to reduction of the cations in the temperature ranges 400–590 °C (Pr4+ → Pr3+), 330–690 °C (Ni2+ → Ni0), 550–720 °C (Fe3+ → Fe2+), and ~700–1220 °C (Fe2+ → Fe0), as shown in Supplementary Materials, Figure S4. For compensation of buoyancy, the recorded measurements were corrected with a reference measurement without sample. For each measurement, about 40 mg of powder was placed in an alumina crucible.Iron-57 Mössbauer spectra were recorded at 7, 15, 25, and 300 K for x = 0.0, 0.2, and 0.4 samples (made in N2 and made in air) with a constant-acceleration spectrometer (close-cycle cryostat (Janis SH-850) with a 57Co(Rh)) source at room temperature. The Mössbauer spectral absorbers were prepared with 40 mg·cm–2 of powdered RP phases mixed with boron nitride. The spectrometer was calibrated at room temperature with an α-iron foil. The measurements were carried out in two velocity ranges: a small velocity range (±4 mm·s−1) with optimal energy resolution at room temperature, and a large velocity range (±12.1 mm·s−1) at which all other spectra were measured at 7 and 15 K where the entire magnetic hyperfine splitting could be seen. The room temperature Mössbauer spectra were fitted with three Lorentzian doublets, and with sextets in case spectra recorded at 10 K.
The thermal expansion behavior of air-annealed samples with x = 0.1, 0.2, and 0.3 were measured in a Netzsch DIL 402C dilatometer in air up to 900 °C, using a heating rate of 10 °C·min−1. The sample was in the form of a pellet, 8 mm in diameter and 5 mm in height. A correction for the sample holder expansion was made using a routine procedure with a sapphire standard sample.
High-temperature electrical conductivity measurements were performed for x = 0.2 in N2(g) for as-prepared samples and in air for air-annealed samples, using the Van der Pauw method with a ProboStat (Norecs) cell in the temperature range 100–1000 °C. Samples were in the form of disks, with calculated densities of 70–80%, a diameter of 20 mm, and a thickness of ~3 mm. In addition, conductivities were for x = 0.2 and x = 0.3 measured in air by the four-point method, up to 900 °C on sintered bar samples with approximate dimensions of 14 × 5 × 5 mm using a computer-controlled setup, with a Keithley 2182A nano-voltmeter and a Keithley G221 DC and AC current source. A DC current of 1–10 µA was used. Gold contacts were first sputtered onto the samples with a JEOL JFC-1200 fine-coater, and gold wires were then attached to them by using C2090908D1 gold ink from Gwent Electronic Materials Ltd., Pontypool, UK) and hardened at 700 °C. Prior to each conductivity measurement, the contact resistances were tested and found to be very low, meaning that its contribution to total conductivity could be neglected.

Supplementary Materials

The following are available online at https://www.mdpi.com/2304-6740/6/3/89/s1. Details of XRD and NPD experiment, Figure S1: Measured, calculated, and differences in NPD patterns, Table S1: Anisotropic thermal parameters for N2- and air-annealed Sr3−xPrxFe1.25Ni0.75O7−δ samples, Tables S2 and S3: Unit cell parameters and results from the refinement using XRD data for N2-annealed and air-annealed Sr3−xPrxFe1.25Ni0.75O7−δ samples, Tables S4 and S5: Atomic coordinates (z-value) from the refinement using XRD data for N2-annealed and air-annealed Sr3−xPrxFe1.25Ni0.75O7−δ samples, Tables S6–S9: A–O and B–O bond lengths (Å) from the refinement using XRD data for N2-annealed and air-annealed Sr3−xPrxFe1.25Ni0.75O7−δ samples. Tables S10 and S11: Bond valence sums based on the crystal structures refined from XRD data for N2-annealed and air-annealed Sr3−xPrxFe1.25Ni0.75O7−δ samples. Table S12: Oxygen content of Sr3−xPrxFe1.25Ni0.75O7−δ calculated from the occupancies of oxygen atomic positions. Figure S2–S4: TG curves. Reference [14] are cited in the Supplementary Materials.

Author Contributions

Conceptualization, G.S., S.Y.I. and J.G.; Data Curation: J.G., J.J.B.; Formal Analysis, J.G., L.S., J.J.B., A.M.; Funding Acquisition, G.S.; Investigation, J.G., L.S., A.M.; Methodology, G.S., J.G.; Project Administration, G.S.; Resources, L.S., J.G., J.J.B.; Supervision, G.S., J.G.; Validation, G.S., S.Y.I., J.G., R.P.H.; Visualization, G.S., A.M., J.G., J.J.B.; Writing—Original Draft G.S., R.P.H., A.M.; Writing—Review & Editing, G.S., S.Y.I., J.G., S.Y.I., A.M.

Funding

This research was funded by “Consortium for Crystal Chemistry, C3” within the Röntgen-Ångström cluster, Swedish research Council VR 2011-6512, VR 2012-5240] and by UT-Battelle, LLC, under Contract No. DE AC0500OR22725 with the U.S. Department of Energy. The United States Government retains and the publisher, by accepting the article for publication, acknowledges that the United States Government retains a non-exclusive, paid-up, irrevocable, world-wide license to publish or reproduce the published form of this manuscript, or allow others to do so, for the United States Government purposes. The Department of Energy will provide public access to these results of federally sponsored research in accordance with the DOE Public Access Plan.

Acknowledgments

M.-T. Gerhards is thanked for carrying out the DTA/TG measurements. A. Mahmoud acknowledges the Forschungzentrum Jülich for an international postdoctoral grant. R.P.H. acknowledges support from the U.S. Department of Energy, Office of Basic Energy Sciences, Materials Sciences and Engineering Division. This research used resources at the Spallation Neutron Source, a DOE Office of Science User Facility operated by the Oak Ridge National Laboratory.

Conflicts of Interest

The authors declare no conflict of interest.

References

  1. Ruddlesden, S.N.; Popper, P. The compound Sr3Ti2O7 and its structure. Acta Crystallogr. 1958, 11, 54–55. [Google Scholar] [CrossRef]
  2. Kharton, V.V.; Viskup, A.P.; Naumovich, E.N.; Marques, F.M.B. Oxygen ion transport in La2NiO4-based ceramics. J. Mater. Chem. 1999, 9, 2623–2629. [Google Scholar] [CrossRef]
  3. Skinner, S.J.; Kilner, J.A. Oxygen diffusion and surface exchange in La2−xSrxNiO4+δ. Solid State Ion. 2000, 135, 709–712. [Google Scholar] [CrossRef]
  4. Istomin, S.Y.; Antipov, E.V. Cathode materials based on perovskite-like transition metal oxides for intermediate temperature solid oxide fuel cells. Russ. Chem. Rev. 2013, 82, 686–700. [Google Scholar] [CrossRef]
  5. Dann, S.E.; Weller, M.T.; Currie, D.B. Structure and oxygen stoichiometry in Sr3Fe2O7−y, 0 ≤ y ≤ 1.0. J. Solid State Chem. 1992, 97, 179–185. [Google Scholar] [CrossRef]
  6. Peets, D.C.; Kim, J.-H.; Dosanj, P.; Reehuis, M.; Aliouane, N.; Ulrich, C.; Keimer, B. Magnetic phase diagram of Sr3Fe2O7−δ. Phys. Rev. B 2013, 87, 214410. [Google Scholar] [CrossRef]
  7. Dann, S.E.; Weller, M.T.; Currie, D.B.; Thomas, M.F.; Al-Rawwa, A.D. Structure and magnetic properties of Sr2FeO4 and Sr3Fe2O7 studied by powder neutron diffraction and Mössbauer spectroscopy. J. Mater. Chem. 1993, 3, 1231–1237. [Google Scholar] [CrossRef]
  8. Bréard, Y.; Michel, C.; Hervieu, M.; Studer, F.; Maignan, A.; Raveau, B.B. Large Oxygen Deficiency in a n = 2 Member of the RP Series: Sr3FeCoO7−x (x ≤ 1.55). Chem. Mater. 2002, 14, 3128–3135. [Google Scholar] [CrossRef]
  9. Prado, F.; Armstrong, T.; Caneiro, A.; Manthiram, A. Structural Stability and Oxygen Permeation Properties of Sr3−xLaxFe2−yCoyO7−δ (0 ≤ x ≤ 0.3 and 0 ≤ y ≤ 1.0). J. Electrochem. Soc. 2001, 148, J7–J14. [Google Scholar] [CrossRef]
  10. Mogni, L.; Prado, F.; Caneiro, A.; Manthiram, A. High temperature properties of the n = 2 Ruddlesden–Popper phases (La, Sr)3(Fe, Ni)2O7−δ. Solid State Ion. 2006, 177, 1807–1810. [Google Scholar] [CrossRef]
  11. Mogni, L.; Prado, F.; Caneiro, A. Defect Structure and Electrical Conductivity of the Ruddlesden–Popper Phases Sr3FeMO6+δ (M = Co, Ni). Chem. Mater. 2006, 18, 4163–4170. [Google Scholar] [CrossRef]
  12. Mogni, L.V.; Prado, F.D.; Cuello, G.J.; Caneiro, A. Study of the Crystal Chemistry of the n = 2 Ruddlesden–Popper Phases Sr3FeMO6+δ (M = Fe, Co, and Ni) Using in Situ High Temperature Neutron Powder Diffraction. Chem. Mater. 2009, 21, 2614–2623. [Google Scholar] [CrossRef]
  13. Ghosh, S.; Adler, P. Evolution of electronic state, magnetism, and magnetotransport properties in Sr3Fe2−xCoxO7−y (x ≤ 1). J. Mater. Chem. 2002, 12, 511–521. [Google Scholar] [CrossRef]
  14. Samain, L.; Amshoff, P.; Biendicho, J.J.; Tietz, F.; Mahmoud, A.; Hermann, R.P.; Istomin, S.Y.; Grins, J.; Svensson, G. Crystal structure and high-temperature properties of the Ruddlesden–Popper phases Sr3−xYx(Fe1.25Ni0.75)O7−δ (0 ≤ x ≤ 0.75). J. Solid State Chem. 2015, 227, 45–55. [Google Scholar] [CrossRef]
  15. Weast, R.C. CRC Handbook of Chemistry and Physics; CRC Press: Boca Raton, FL, USA, 1981. [Google Scholar]
  16. Grins, J.; Wardecki, D.; Jansson, K.; Carlson, S.; Biendicho, J.J.; Svensson, G. A structural study of Ruddlesden–Popper phases Sr3−xYx(Fe1.25Ni0.75)O7−δ with x ≤ 0.75 by neutron powder diffraction and EXAFS/XANES spectroscopy. J. Mater. Chem. A 2018, 6, 5313–5323. [Google Scholar] [CrossRef]
  17. Shannon, R.D. Revised effective ionic radii and systematic studies of interatomic distances in halides and chalcogenides. Acta Cryst. 1976, A32, 751–767. [Google Scholar] [CrossRef]
  18. Kharton, V.V.; Patrakeev, M.V.; Tsipis, E.V.; Avdeeev, M.; Naumovich, E.N.; Anikina, P.V.; Waerenborgh, J.C. Oxygen nonstoichiometry, chemical expansion, mixed conductivity, and anodic behavior of Mo-substituted Sr3Fe2O7−δ. J. Solid State Ion. 2010, 181, 1052–1063. [Google Scholar] [CrossRef]
  19. Brown, I.D. The Chemical Bond in Inorganic Chemistry, The Bond Valence Model; Oxford University Press: Oxford, UK, 2002. [Google Scholar]
  20. McCammon, C.A.; Becerro, A.I.; Langenhorst, F.; Angel, R.J.; Marion, S.; Seifert, F. Short-range ordering of oxygen vacancies in CaFexTi1−xO3−x/2 perovskites (0 < x < 0.4). J. Phys. Condens. Matter 2000, 12, 2969–2984. [Google Scholar]
  21. Waerenborgh, J.C.; Figueiredo, F.M.; Frade, J.R.; Colomer, M.T.; Jurado, J.R. Fe4+ content and ordering of anion vacancies in partially reduced AFexTi1−xO3−y (A = Ca, Sr; x ≤ 0.6) perovskites. An 57Fe Mössbauer spectroscopy study. J. Phys. Condens. Matter 2001, 13, 8171–8187. [Google Scholar] [CrossRef]
  22. Figueiredo, F.M.; Waerenborgh, J.; Kharton, V.V.; Näfe, H.; Frade, J.R. On the relationships between structure, oxygen stoichiometry and ionic conductivity of CaTi1−xFexO3−δ (x = 0.05, 0.20, 0.40, 0.60). Solid State Ion. 2003, 156, 371–381. [Google Scholar] [CrossRef]
  23. Delattre, J.L.; Stacy, A.M.; Young, V.G., Jr.; Long, G.J.; Hermann, R.; Grandjean, F. Study of the Structural, Electronic, and Magnetic Properties of the Barium-Rich Iron(IV) Oxides, Ba2FeO4 and Ba3FeO5. Inorg. Chem. 2002, 41, 2834–2838. [Google Scholar] [CrossRef] [PubMed]
  24. Battle, P.D.; Gibb, T.C.; Nixon, S. A study of charge disproportionation in the nonstoichiometric perovskite Sr2LaFe3O8+y by Mössbauer spectroscopy. J. Solid State Chem. 1988, 77, 124–131. [Google Scholar] [CrossRef]
  25. Adler, P. Electronic state, magnetism, and electrical transport behavior of Sr3−xAxFe2O7 (x ≤ 0.4, A = Ba, La). J. Solid State Chem. 1997, 130, 129–139. [Google Scholar] [CrossRef]
  26. Adler, P. Charge disproportionation in iron (IV) oxides: Electronic properties and magnetism in Sr3Fe2−xTixO7−y annealed at high oxygen pressures. J. Mater. Chem. 1999, 9, 471–477. [Google Scholar] [CrossRef]
  27. Tsipis, E.V.; Naumovich, E.N.; Patrakeev, M.V.; Anikina, P.V.; Waerenborgh, J.C.; Kharton, V.V. Defect Interactions in Sr3La(Fe, Al)3O10−δ by Computer Simulations and Mössbauer Spectroscopy. Chem. Mater. 2009, 21, 5072–5078. [Google Scholar] [CrossRef]
  28. Biendicho, J.J.; Shafeie, S.; Frenck, L.; Gavrilova, D.; Böhme, S.; Bettanini, A.M.; Svedlindh, P.; Hull, S.; Zhao, Z.; Istomin, S.Y.; et al. Synthesis and characterization of perovskite-type Sr(x)Y1−xFeO(3−δ) (0.63 ≤ x < 1.0) and Sr0.75Y0.25Fe1−yMyO3−δ (M = Cr, Mn, Ni), (y = 0.2, 0.33, 0.5). J. Solid State Chem. 2013, 200, 30–38. [Google Scholar] [CrossRef]
  29. Rietveld, H.M. Line profiles of neutron powder-diffraction peaks for structure refinement. Acta Crystallogr. 1967, 22, 151–152. [Google Scholar] [CrossRef] [Green Version]
  30. Rodriguez-Carvajal, J. FULLPROF: A program for Rietveld refinement and pattern matching analysis. In Proceedings of the Satellite Meeting on Powder Diffraction of the XV Congress of the IUCr, Bordeaux, France, 19–28 July 1990. [Google Scholar]
  31. Larson, A.C.; Von Dreele, R.B. General Structure Analysis System (GSAS). In Los Alamos National Laboratory Report LAUR 86-748; Los Alamos National Laboratory: Los Alamos, NM, USA, 2000. [Google Scholar]
Figure 1. The crystal structure of a n = 2 A3(Fe,Ni)2O7 Ruddlesden–Popper (RP) phase.
Inorganics 06 00089 g001
Figure 2. Unit cell parameters (a = circles and c = crosses) (left) and volume (right) of Sr3−xPrx(Fe1.25Ni0.75)O7−δ versus x for N2-annealed (red) and air-annealed (blue) compositions.
Inorganics 06 00089 g002
Figure 3. Possible coordination environments for the B-cations (gray) in the perovskite block of N2-annealed (oxygen deficient) n = 2 RP phases: oct = octahedron, sqp = square pyramid (O1 vacancy), tbp = trigonal bipyramid (1 O3 vacancy), and t = tetrahedron (1 O1 and 1 O3 vacancy).
Inorganics 06 00089 g003
Figure 4. The perovskite block with anisotropic thermal ellipsoids of the atoms and atomic positions of x = 0.2 phase (left, N2-annealed, right, air-annealed). The occupancies of the O1 and O3 positions are 27%, 85% in N2-annealed and 64%, 100% in air-annealed oxides (O is blue, A is red, B is gray).
Inorganics 06 00089 g004
Figure 5. Size of the perovskite slab along the c-axis measured as A2–A2 interatomic distance versus Pr-content, x, for N2-annealed (XRD data—red circles, NPD data red squares) and air-annealed Sr3−xPrx(Fe1.25Ni0.75)O7−δ (XRD data—blue crosses, NPD data—blue plus signs).
Inorganics 06 00089 g005
Figure 6. Weight change of N2-annealed Sr3−xPrx(Fe1.25Ni0.75)O7−δ upon heating (starts at 100%) and then cooling in air.
Inorganics 06 00089 g006
Figure 7. The Mössbauer spectra of selected N2- (left) and air-annealed (right) Sr3−xPrxFe1.25Ni0.75O7−δ phases recorded at 7 K.
Inorganics 06 00089 g007
Figure 8. Electrical conductivity as a function of inverse temperature for as-prepared and air-annealed Sr3−xPrxFe1.25Ni0.75O7−δ, N2-annealed x = 0.2 (black crosses), air-annealed x = 0.2 (red circles) 0.3 (red triangles), 0.4 (red squares) RP samples.
Inorganics 06 00089 g008
Table 1. Refined structural parameters for as-prepared in N2 and air-annealed x = 0.0 and 0.2 Sr3−xPrx(Fe1.25Ni0.75)O7−δ phases from time-of-flight neutron powder diffraction (NPD) data.
N2-Annealed aAir-Annealed bN2-Annealed cAir-Annealed d
x000.20.2
Site e,fz/occupancyz/occupancyz/occupancyz/occupancy
A1 2b0000
Sr/Pr--0.840(7) Sr + 0.160(7) Pr0.89(1) Sr + 0.11(1) Pr
A2 4e0.68335(4)0.68202(4)0.68280(4)0.6821(1)
Sr/Pr--0.980(3) Sr + 0.020(3) Pr0.956(7) Sr + 0.044(7) Pr
B 4e g0.10043(3)0.09898(3)0.10041(2)0.09881(3)
O1 2a0000
occ0.335(5)0.552(6)0.274(4)0.640(6)
O2 4e0.19502(5)0.19406(5)0.19562(5)0.19437(6)
occ1111
O3 8b0.08683(4)0.09094(4)0.08487(4)0.09072(1)
occ0.813(3)10.852(2)1
aa = 3.83922(4) Å, c = 20.3484(2) Å, V = 299.929(7) Å3, RI = 2.9%, χ2 = 3.7, Rwp = 2.8%, Rp = 4.7%, refined chemical formula is Sr3Fe1.25Ni0.75O5.587(7); b a = 3.84236(5) Å, c = 20.1045(3) Å, V = 296.819(9) Å3, RI = 2.6%, χ2 = 9.2, Rwp = 4.1%, Rp = 6.1%, refined chemical formula is Sr3Fe1.25Ni0.75O6.552(5); c a = 3.8584(3) Å, c = 20.219(2) Å, V = 301.01(1) Å3, RI = 1.5%, χ2 = 1.9, Rwp = 3.7%, Rp = 2.2%, refined formula Sr2.80Pr0.20Fe1.25Ni0.75O5.682(6); d a = 3.8441(2) Å, c = 20.085(1) Å, V = 296.80(3) Å3, RI = 4.2%, χ2 = 1.9, Rwp = 3.8%, Rp = 4.5%, refined chemical formula is Sr2.80Pr0.20Fe1.25Ni0.75O6.640(6); e 2a (0,0,0): 2b (0,0,½); 4e (0,0,z); 8b (0,½,z); f The overall Sr/Pr ratios were constrained to nominal values. g The Fe/Ni ratios were fixed to nominal values.
Table 2. Selected interatomic distances (Å) and angles (°) for as-prepared in N2 and air-annealed x = 0.0 and 0.2 Sr3−xPrx(Fe1.25Ni0.75)O7−δ phases from time-of-flight NPD data.
N2-AnnealedN2-AnnealedAir-AnnealedAir-Annealed
x00.200.2
A1–O1 × 42.7147(1)2.7283(2)2.7170(1)2.7182(1)
A1–O3 × 82.6121(1)2.5820(5)2.6522(1)2.6485(6)
A2–O2 × 12.4790(1)2.458(1)2.4919(1)2.481(1)
A2–O2 × 42.7248(1)2.7406(2)2.7277(1)2.7293(2)
A2–O3 × 42.7428(1)2.7645(7)2.6537(1)2.6579(9)
B–O1 × 12.0438(1)2.0301(5)1.9901(1)1.9847(7)
B–O2 × 11.9207(1)1.9252(9)1.9113(1)1.919(1)
B–O3 × 41.9388(1)1.9546(2)1.9280(1)1.9289(2)
B–O3–B163.86(1)161.50(6)170.38(1)170.33(7)
Table 3. Bond valence sums (BVS) for A1, A2, and B atoms for x = 0.0 and 0.2 in the crystal structures of N2- and air-annealed phases (NPD-data). Bond valence radii used; R0(A) = 2.118 Å (Sr2+), R0(B) = 1.759 Å (Fe3+) [19].
N2-AnnealedAir-Annealed
x0.00.20.00.2
A11.962.172.322.43
A21.741.742.072.07
B2.892.963.623.54
Table 4. Thermal expansion coefficients (TECs) (ppm·K−1) of Sr3−xPrx(Fe1.25Ni0.75)O7−δ, x = 0.1, 0.2, and 0.3.
x0.10.20.3
150–900 °C23.422.519.5
150–400 °C17.917.715.6
400–900 °C26.224.921.5
Table 5. Mössbauer spectral parameters of N2-annealed Sr3−xPrxFe1.25Ni0.75O7−δ phases below their magnetic transition temperature a.
x00.20.4
Site I
Pentahedral (1)
Fe3+
δ0.40(1)0.38(5)0.37(2)
Δ−0.27(2)−0.10(2)−0.23(5)
Γ0.52(1)0.8(3)0.68(1)
Bhf (T)46.2(1)45.6(5)49.1(2)
Area (%) b37(3)50(3)94(1)
Site II
5-fold (2)
Fe3+
δ0.39(1)0.39(2)-
Δ−0.26(2)−0.28(4)-
Γ0.52(1)0.36(5)-
Bhf (T)49.1(1)49.3(2)-
Area (%) b24(1)43(1)-
Site III
Tetrahedral
Fe3+
δ0.26(2)--
Δ−0.06(2)--
Γ0.52(1)--
Bhf (T)42.7(2)--
Area (%) b33(1)--
Site IV
Paramagnetic
δ0.45(1)0.44(2)0.5(1)
Γ1.29(1)1.0(1)0.97(1)
Area (%) b6(1)7(1)6(1)
a δ = isomer shift (mm·s−1), referred to α-iron at 295 K, Δ = quadrupole splitting (mm·s−1), Γ = line width (mm·s−1); b The recoil-free fractions of tetrahedral and pyramidal Fe3+ are assumed equal.
Table 6. Mössbauer spectral parameters at T = 7 K for air-annealed Sr3−xPrxFe1.25Ni0.75O7−δ phases a.
x00.20.4
Site V
Fe3+
octahedral
δ0.65(4)-0.46(8)
Δ0.80(2)-0.09(1)
Γ0.50(4)-0.28(3)
Bhf (T)33(1)-40.5(6)
Area (%) b21(1)-36(2)
Site VI
Fe3+/Fe4+
δ0.17(1)0.21(7)0.06(6)
Δ0.50(4)−0.06(1)−0.07(1)
Γ0.50(4)0.40(2)0.28(-)
Bhf (T)25(1)38.5(7)32.1(2)
Area (%) b28(4)57(1)46(3)
Site VII
Fe5+
octahedral
δ−0.03(1)−0.03(1)−0.02(2)
Δ−0.2(1)−0.1(1)−0.4(1)
Γ0.28(1)0.25(1)0.28(1)
Bhf (T)31.6(9)32.0(9)39(1)
Area (%) b51(2)43(2)18 (3)
O-content 6.46.86.5
a δ = isomer shift (mm·s−1), referred to α-iron at 295 K, Δ = quadrupole splitting (mm·s−1), Γ = line width (mm·s−1); b The recoil-free fractions of tetrahedral and pyramidal Fe3+ are assumed equal.
Table 7. Oxygen content of Sr3−xPrxFe1.25Ni0.75O7−δ phases derived from assumptions and experimental data. Matching data are written in bold.
x00.20.4
Ideal aFe3+/Ni2+5.635.735.83
Ideal aFe3+/Ni3+6.006.106.20
Ideal aFe4+/Ni3+6.636.736.83
MB b—N2Fe3+/Ni2+5.635.735.83
MB b—airFe3+/Fe4+/Fe5+/Ni2+6.66.86.5
N2-NPD*/XRD** c-5.56*5.68*5.90**
air-NPD*/XRD** c-6.55*6.64*6.68**
a Iron and nickel are assigned oxidation states. b Oxidation states for iron assigned from Mössbauer measurements. c Oxygen content derived from Rietveld refinements of NPD* and XRD** data.

