Article

Bioactive Compounds and Antioxidant Capacity of Camarosa and Selva Strawberries (Fragaria x ananassa Duch.)

1
Food Technology Institute, Faculty of Chemical Engineering, National University of Littoral, Santiago del Estero 2829, Santa Fe 3000, Argentina
2
National Council of Scientific and Technical Research (CONICET), Santiago del Estero 2829, Santa Fe 3000, Argentina
3
Department of Management, University of Roma La Sapienza,Via del Castro Laurenziano 9, Rome 00161, Italy
*
Author to whom correspondence should be addressed.
Foods 2013, 2(2), 120-131; https://doi.org/10.3390/foods2020120
Submission received: 13 February 2013 / Revised: 4 March 2013 / Accepted: 5 March 2013 / Published: 25 March 2013

Abstract

:
Strawberries represent an important source of bioactive compounds due to their vitamin C and phenolic compound levels, which present high antioxidant effects, beneficial for the maintenance of consumer’s health. Argentina is the second largest strawberry producer in The Common Market of the Southern Cone (MERCOSUR), covering the main export destinations of Argentinian strawberries, i.e., Canada, United States, and European Union. Information about the bioactive compound occurrence and antioxidant capacity of these fruits is scarce or not available. Health related compounds of strawberry cultivars (Camarosa and Selva) from different zones of Argentina were investigated. Vitamin C content was in the same range for both studied cultivars. However, Camarosa strawberries, which are the most cultivated, consumed, and exported berries in Argentina, presented higher total phenolic and anthocyanins content, and consequently better in vitro antioxidant capacity. Moreover, there were differences in the occurrence and concentration in the phenolic compound profiles for both cultivars. Camarosa cultivar presented higher content of anthocyanidins, and Selva showed higher total ellagic acid content. The research shows that Argentina’s strawberries are an interesting source of bioactive compounds comparable to those in other parts of the world.

Graphical Abstract

1. Introduction

Strawberry (Fragaria x ananassa Duch.) is a known non-climacteric fruit of frequent human consumption with an attractive color, flavor and aroma. Strawberry is a relevant source of bioactive compounds due to its high level of vitamin C and phenolics. These compounds present antioxidant effects, and therefore a consequent beneficial effect on the maintenance of consumer health [1,2,3]. The main phenolic compounds are anthocyanins which are responsible for the fruit color, with reported concentrations of up to 65 mg/100 g fresh weight (FW) [4]. Like other fruits, strawberries can be consumed “in natura”, which is advantageous to consumers since there are no nutritional losses due to processing [1].
Argentina is the second largest strawberry producer in MERCOSUR (The Common Market of the Southern Cone), after Brazil. Coronda in Santa Fe Province (31°58′0″S, 60°55′0″W) and surroundings are one of the main producing strawberry zones in Argentina. About 60% of Argentina’s strawberries are consumed fresh, while most of the remaining production is processed, generally by individual quick freezing. The main overseas destinations of strawberries from Argentina are Canada, United States, and countries of the European Union [5]. Most of strawberries grown in the central region are of the variety “Camarosa” (80%), originating from the University of California, USA. It is a variety with prominent climatological adaptation, exceptional quality and flavor and a good tolerance to diseases. Furthermore, “Selva” variety is also cultivated in the southern regions of Argentina [6].
In order to increase the limited knowledge of Argentina’s strawberries, the aim of this study was to identify and quantify the bioactive compounds and the in vitro antioxidant capacity of strawberry cultivars from different regions: Camarosa from the central and, Selva from the southern region.

2. Experimental Section
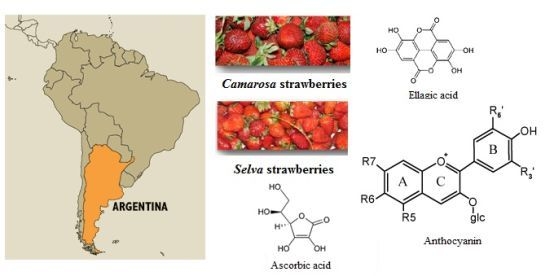
2.1. Plant Material

Cultivated strawberries (Fragaria x ananassa Duch.) of variety Camarosa were obtained from one planting at Arroyo Leyes (31°27′0″S, 60°40′0″W) (Santa Fe, Argentina) during November 2009, December 2010 and November 2011. Fully developed strawberries were harvested by skilled workers at full ripe stage (90% of the surface showing a red color). They were transported 40 km directly from the field to the laboratory in Santa Fe. Strawberries (Fragaria x ananassa Duch.) of variety Selva cultivated in Mar del Plata (37°59′42″S, 57°34′0″W) (Buenos Aires, Argentina) were purchased at full ripe stage (90% surface red color) in a local market in Santa Fe, Argentina, during March 2010 and March 2011.
Physicochemical characteristics of both strawberries cultivars were: 6.6°–8.5° Brix (soluble solids), pH 3.4, and total acidity: 0.8 mg citric acid/100 g fresh weight (FW).

2.2. Strawberry Sample Preparation

From each lot of Camarosa and Selva strawberry received at the laboratory, 500 g were randomly sampled. Calyxes and peduncles were removed, and then fruits were washed with tap water, drained on absorbent paper and stored at −80 °C until analysis. For phenolic profile determination a portion of each strawberry cultivar was lyophilized and stored at −80 °C. The moisture was measured for strawberries by drying at 70 °C until constant weight, according to Deutsch (1995) [7].

2.3. Apparatus and Software

LC-UV vitamin C analysis was performed on a KONIK KNK-500-A Series liquid chromatograph, coupled to a variable wavelength detector (Uvis 200 Konik Instruments, Barcelona, Spain). LC-DAD phenolic compounds analysis was performed on a Shimadzu HPLC system, a LC-10AT liquid chromatograph equipped with four pumps FCV-10AL, a degasser DGU-14A, and a photodiode array detector SPD-M20A operating at wavelengths between 200 and 900 nm. LC-DAD data was processed using Shimadzu LC solution software (Shimadzu Co., Kyoto, Japan). Spectrophotometric determinations were performed with a Genesis 5 spectrophotometer with 1 cm path length cuvettes (Milton Roy, Ivyland, PA, USA). The statistical analysis of data was performed with STATGRAPHICS Centurion XV 15.2.06 (Statpoint Technologies, Inc., Warrenton, VA, USA).

2.4. Chemicals and Reagents

Flavonoids (catechin, epicatechin, rutin, quercetin, kaempferol, cyanidin and pelargonidin), and phenolic acids (gallic, ferulic, coumaric and ellagic acid), DL-dithiothreitol (DTT), Folin-Ciocalteu reagent, 1,1-diphenil-2-picrylhydrazil radical (DPPH*), and 2,4,6-tripyridy-s-triazine (TPTZ) were from Sigma Chemical Co. (St. Louis, MO, USA). Metaphosphoric acid was obtained from Merck KGaA (Damnstadt, Germany). Other used chemicals and solvents were pro-analysis and were acquired from Laboratorios Cicarelli (Reagents S.A., San Lorenzo, Santa Fe, Argentina). Distilled water was purified using a Milli-Q system (Millipore, Bedford, MA, USA).

2.5. Ascorbic Acid and Vitamin C Content

The ascorbic acid (AA) and vitamin C (VitC) content were determined by HPLC according to van de Velde et al. [8]. Separations were achieved in a reversed phase column Phenomenex Gemini 5 μm C18 110A attached to a Phenomenex guardcolumn (Phenomenex Inc., Torrance, CA, USA) at 25 °C. The mobile phase, under isocratic conditions, consisted of a 0.03 mol/L sodium acetate/acetic acid buffer, 5% HPLC-grade methanol (pH = 5.8). The flow rate was 1.15 mL/min and the detection was performed at 251 nm. For extraction, samples of 5 g homogenized strawberries were added to 25 mL metaphosphoric acid (30 g/L), acetic acid (80 g/L). The mixture was homogenized for 1 min, sonicated in an ultrasonic bath for 15 min and then centrifuged at 12,000× g at 4 °C for 20 min. The supernatant was separated and 1 mL of it was diluted with mobile phase to achieve a final volume of 6 mL, then filtered through a 0.45 µm Millipore membrane and injected in the HPLC system for quantifying the content of ascorbic acid (AA) of the samples. For vitamin C quantification, 1 mL supernatant was added with 0.2 mL of DL-dithiothreitol solution (5 g/L DTT prepared in 2.6 mol/L potassium phosphate dibasic). The mixture was kept in the darkness at 25 °C for 2 h. Then it was made-up to volume with mobile phase to achieve a final volume of 6 mL, filtered through a 0.45 µm Millipore membrane and injected into the HPLC system. Samples were prepared in triplicates. Quantification was performed with ascorbic acid and vitamin C calibration curves and the results were expressed as mg AA or VitC/100 g FW. Dehydroascorbic acid (DHAA) content was obtained as the difference between vitamin C and ascorbic acid content.

2.6. Phenolic Compounds by HPLC

Phenolic compounds determination was performed by HPLC according to Tarola et al. [9]. The extraction was performed with 0.25 g lyophilized strawberry samples (dry weight 8.8 and 10.4 g/100 g FW in Camarosa and Selva cultivars, respectively) in 5 mL of HPLC-grade methanol. The extracts were crushed and sonicated for 15 min, then were centrifuged (2500× g at 25 °C for 20 min) and supernatants were collected. The insoluble plant material was re-extracted twice with 5 mL HPLC-grade methanol. Collected fractions were concentrated by a nitrogen flow at 25 °C to 5 mL and finally filtered through a Millipore 0.45 µm pore size filter. These fractions were used for the analysis of free aglycones or nonconjugated or noncondensed phenolic compounds naturally present in strawberry extracts. After taking these samples, an acid hydrolysis was performed over all obtained extracts with the objective of releasing the aglycone portion from glycosylated phenolic compounds and hydrolyzing the conjugated and condensed ones. The hydrolysis consisted in 2 mL extracted sample plus 1 mL HCl 12 N at 90 °C for 50 min. After hydrolysis, the extracts were allowed to cool and were ready to be injected in the HPLC system. Compounds were separated on a 150 mm × 4.5 mm, 5 µm particle size, Supelcosil LC-ABZ column (Sigma-Aldrich Co. LLC, St. Louis, MO, USA) and an Alltech C18 5 µm guard column (Alltech Associates Inc., Deerfield, IL, USA). The mobile phase was a gradient prepared from formic acid in water (2%, pH 3, solvent A) and formic acid in methanol (2%, pH 3, solvent B): 0.01–8.00 min, 15% B isocratic; 8.01–25.00 min, 15%–50% B; 25.01–40.00 min, 50% B isocratic; 40.01–50.00 min, 50%–90% B; 50.01–60.00 min, 90%–15% B. Ten minutes of equilibration was required before the next injection. The flow rate was 0.7 mL/min at 25 °C. The detector was set at 280, 320, 360, and 520 nm and peak identification was performed by comparison the retention times and diode array spectral characteristics with external standards and peak spiking. The quantification was performed through external standard calibration curves for catechin, epicatechin, gallic, ferulic, coumaric and ellagic acids, rutin, quercetin, kaempferol, pelargonidin, and cyanidin. Results were expressed as mg/100 g FW.

2.7. Antioxidant Capacity, Total Anthocyanins and Total Phenolics Content

2.7.1. Extracts Preparation

For extraction, 5 g homogenized strawberries were added to 75 mL acetone/water (80:20) and sonicated for 15 min. The mixture was centrifuged at 12,000× g at 4 °C for 20 min and then supernatant was separated and used for analysis.

2.7.2. Total Anthocyanins Content

The total anthocyanins (TA) content was determined by the pH differential method according to Jin-Heo and Yong-Lee [10]. Each sample supernatant pH was adjusted to 1.0 with a 0.1 mol/L HCl and 25 mmol/L KCl solutions; and at pH 4.5 with a 0.4 mol/L sodium acetate/acetic acid buffer solution (triplicates). Absorbance readings were measured at 510 and 700 nm. Results were converted to mg pelargonidin-3-glucoside/100 g FW, using a molar extinction coefficient of 22,400 L/mol·cm, a molecular weight of 433.2 g/mol, an optical path of 1 cm and an absorbance (A) of:
A = [(A510 − A700)pH 1 − (A510 − A700)pH 4.5]
Where A510 and A700 are the absorbance measures of samples at pH 1.0 and 4.5.

2.7.3. Total Phenolics Content

The total phenolics (TP) content was determined using the Folin-Ciocalteu reagent [11]. Aliquots of 0.125 mL extracts were added with 0.25 mL of Folin-Ciocalteu reagent, 0.5 mL of Na2CO3 (20%) and 4.1 mL of distilled water. The mixture was incubated for 25 min at room temperature and then was centrifuged for 5 min at 2000× g. Absorbance was measured at 760 nm. Reagent blanks were prepared by replacing the sample volume by acetone/water (80:20). The total phenols content was performed by triplicates. Gallic acid was used as standard and results were expressed as mg gallic acid equivalents per 100 g FW.

2.7.4. Antioxidant Capacity by DPPH*

Antioxidant capacity was estimated by determining of the free-radical scavenging capacity evaluated with the stable radical DPPH*, according to Sánchez-Moreno et al. [12]. For this purpose, extract aliquots (0.025–0.075 mL) were mixed with 3.9 mL of a methanol DPPH* solution (0.03 g/L). Homogenate solutions were kept in darkness for 120 min, and absorbance was measured at 517 nm. Blanks were included replacing strawberry extracts volumes for acetone/water. The percentage of DPPH* remaining against extract concentration (mg/mL) was then plotted to obtain the amount necessary to decrease the initial DPPH* concentration by 50 % (IC50(sample)). The antioxidant activity of strawberry extracts were expressed as the ascorbic acid equivalent antioxidant capacity (AEAC) as mg AA/100 g FW [13]:
AEAC = IC50(AA)/IC50(sample) × 105
IC50(AA) was determined with an ascorbic acid calibration curve and its value was 3.22 × 10⁻³ mg/mL.

2.7.5. Antioxidant Capacity by FRAP

Antioxidant capacity was determined by means of the ferric reducing antioxidant power (FRAP) technique [14]. The FRAP was obtained by measuring the absorbance change at 593 nm caused by the reduction of the Fe3+-TPTZ complex to the ferrous form at pH 3.6. The FRAP reagent was freshly prepared by mixing 25 mL of acetate buffer (300 mmol/L, pH 3.6), 2.5 mL of FeCl3·6H2O solution (20 mmol/L). Briefly, 90 µL extract was added with 90 µL distilled water and 900 µL FRAP reagent. The homogenate was incubated at 37 °C for 60 min, and absorbance was measured. Blanks were included replacing strawberry extracts volumes for acetone/water. Results were expressed as mmol Fe2+/100 g FW, using a FeSO4·7H2O calibration curve.

3. Results and Discussion

3.1. Vitamin C Content

Vitamin C content ranged from 41.2 to 47.6 mg/100 g FW in Camarosa cultivar and from 28.7 to 51.0 mg/100 g FW in Selva cultivar. Mean values are presented in Table 1. The natural difference in the vitamin C content among strawberry cultivars was observed in previous works. A high variability in the vitamin C content was observed by Tulipani et al. [15] among strawberry cultivars from Italy ranging from 23 to 47 mg/100 g FW. Pincemail et al. [16] also describe variability among cultivars from Belgium (ranging from 33.5 to 115.7 mg/100 g FW) [7]. Vitamin C content could also vary with growing and storage conditions [17]. Ascorbic acid is the main biologically active form of vitamin C, being reversible oxidized to dehydroascorbic acid, which also exhibits biological capacity. Further oxidation generates diketogulonic acid, which has no biological function and the reaction is no longer reversible [17]. The dehydroascorbic acid content in Camarosa was lower than in Selva cultivar (Table 1). The higher percentage of DHAA in Selva cultivar (33.1% vs. 11.7% for Camarosa cultivar) could be due to the postharvest storage.
Table 1. Vitamin C (Vit C), ascorbic acid (AA), dehydroascorbic acid (DHAA), total phenolics (TP), total anthocyanins (TA), and in vitro antioxidant capacity (DPPH* and FRAP) in two strawberry cultivars
Cultivar
CamarosaSelva
Bioactive compounds
Vit C44.5 ± 3.2 a39.9 ± 15.8 a
AA40.2 ± 3.7 a27.5 ± 18.0 a
DHAA5.2 ± 3.7 a13.2 ± 1.6 b
TP295.3 ± 39.7 b248.4 ± 62.3 a
TA38.4 ± 10.2 b22.1 ± 4.2 a
Antioxidant capacity
DPPH* (AEAC)440.1 ± 8.1 b395.7 ± 7.2 a
FRAP2.4 ± 0.5 b1.9 ± 0.9 a
Vit C, AA, DHAA: mg AA/100 g FW; TP: mg gallic acid equivalents/100 g FW; TA: mg pelargonidin-3-glucoside/100 g FW; DPPH* (AEAC): ascorbic acid equivalent antioxidant capacity, mg AA/100 g FW; FRAP, mmol Fe2+/100 g FW; Mean ± S.D., n=9; Values in the same row with different superscript lowercase letters are significantly different (p ≤ 0.05) by t-test.

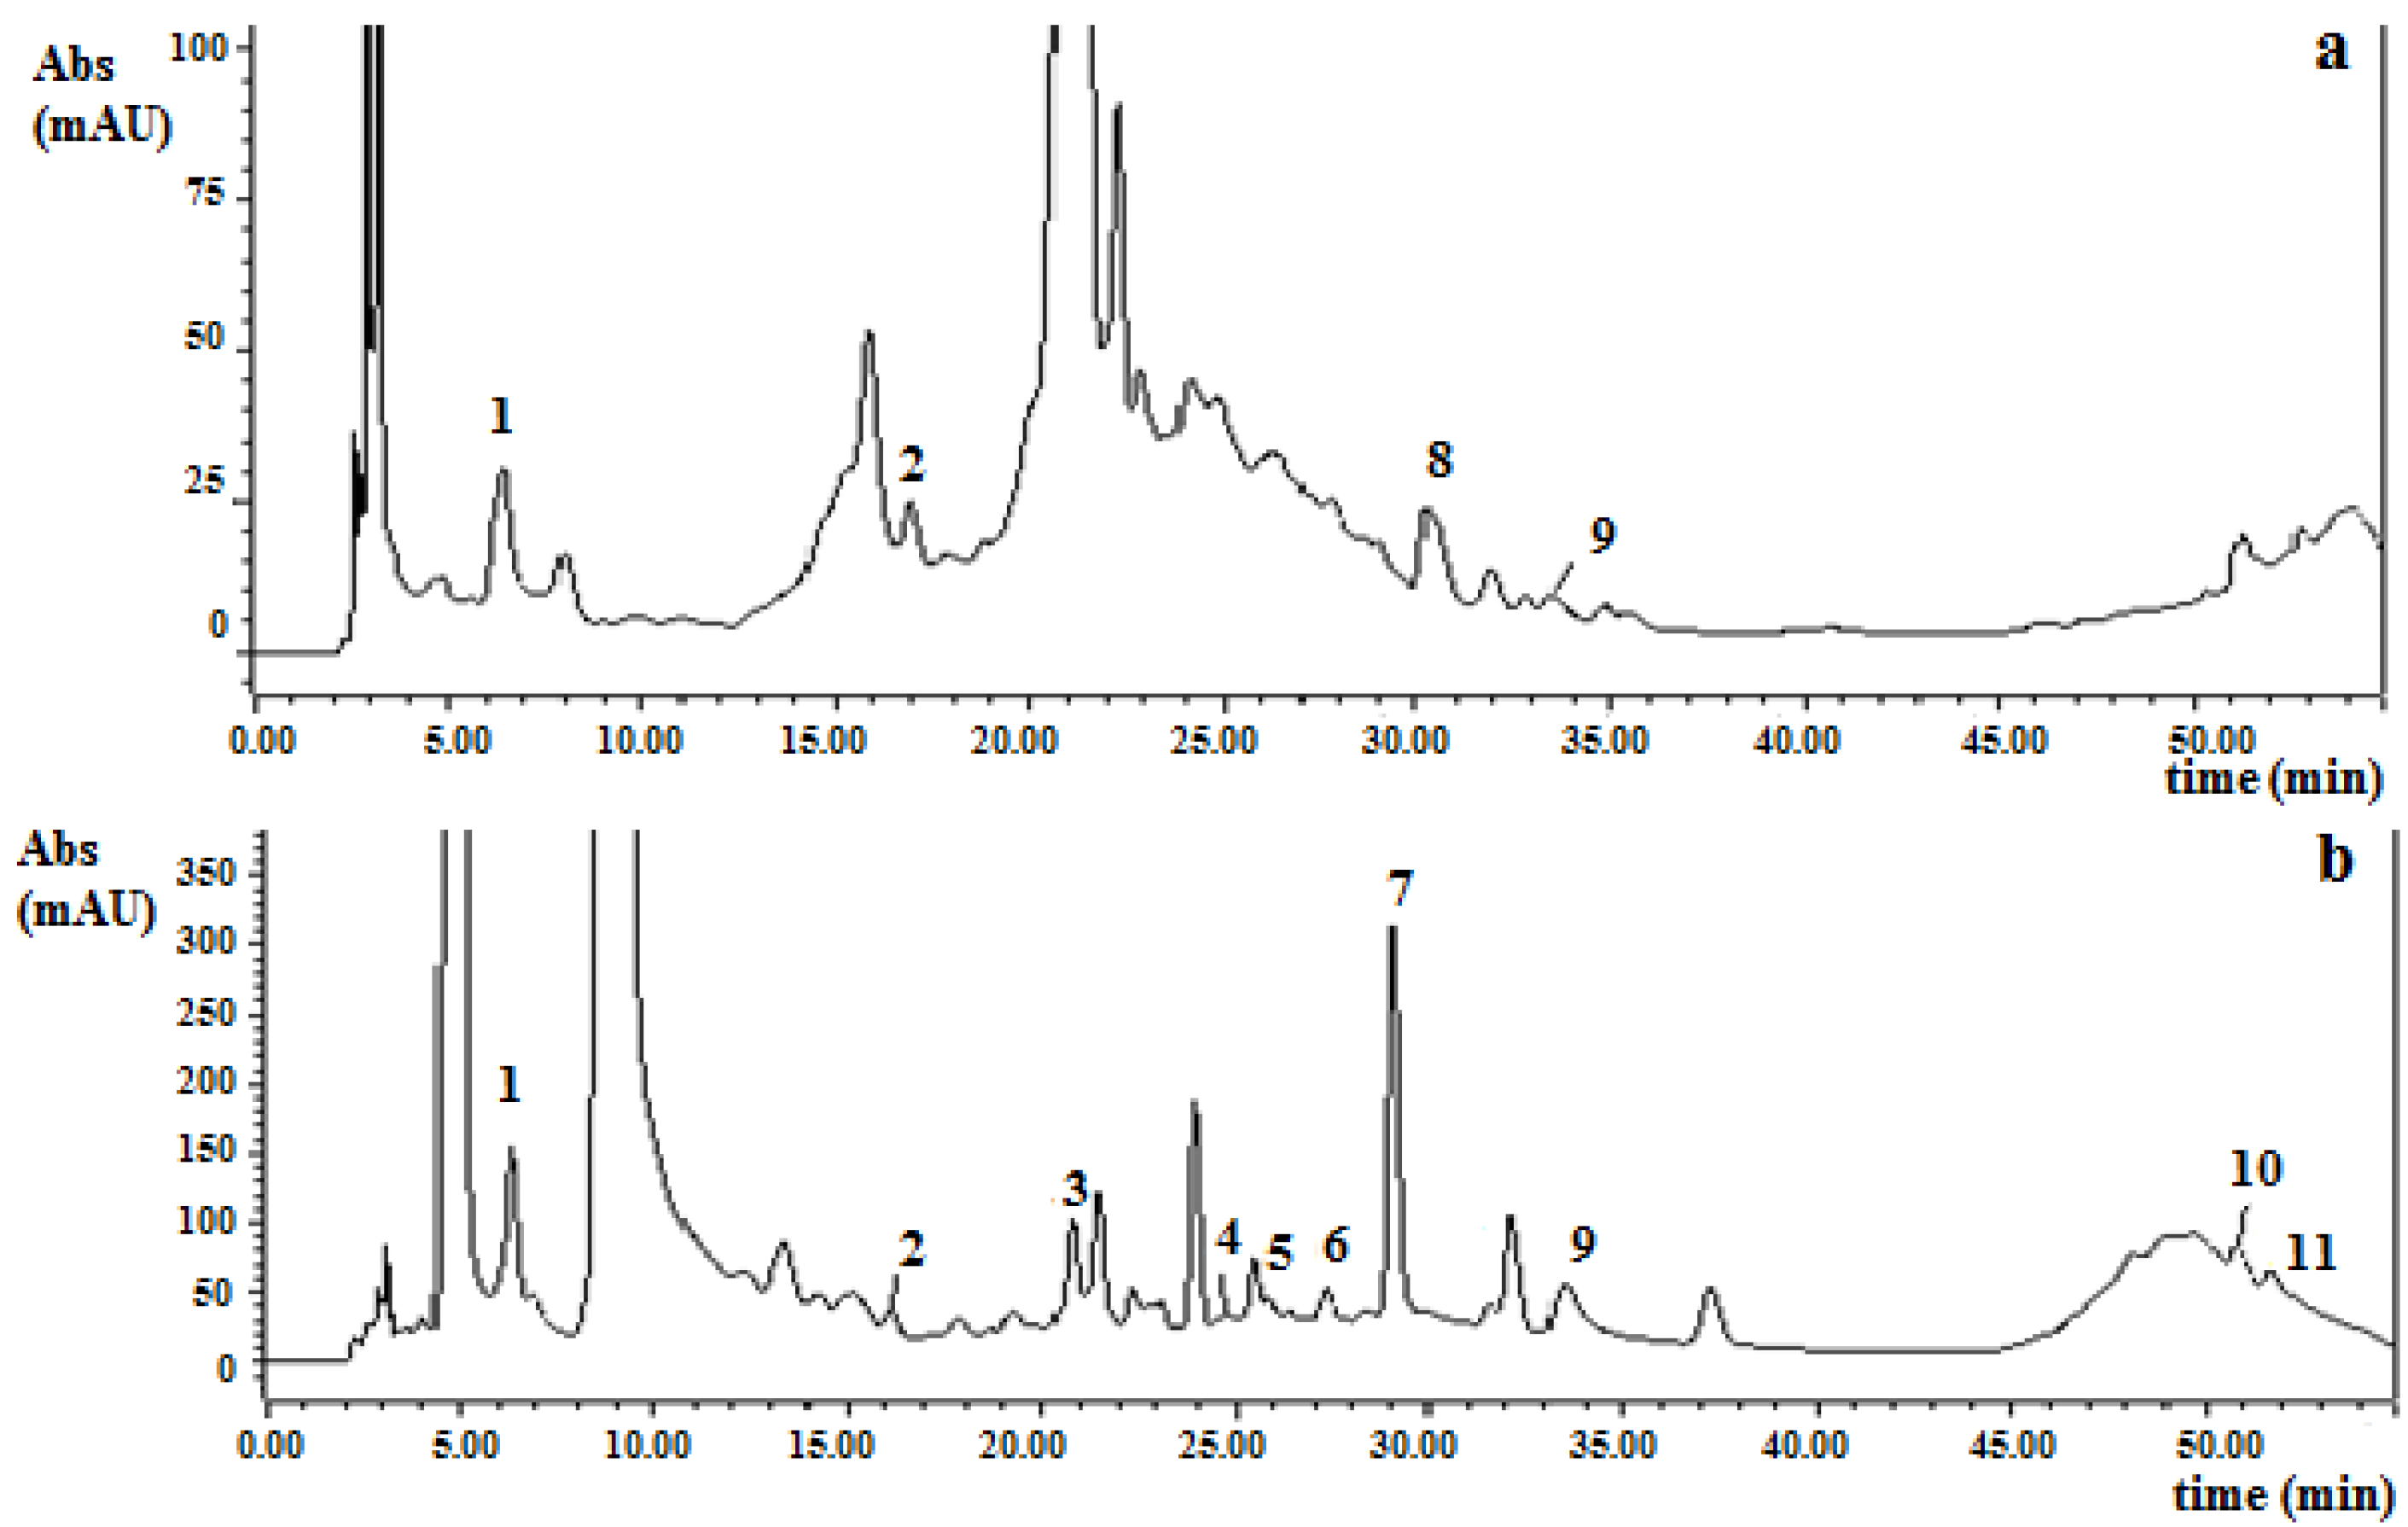
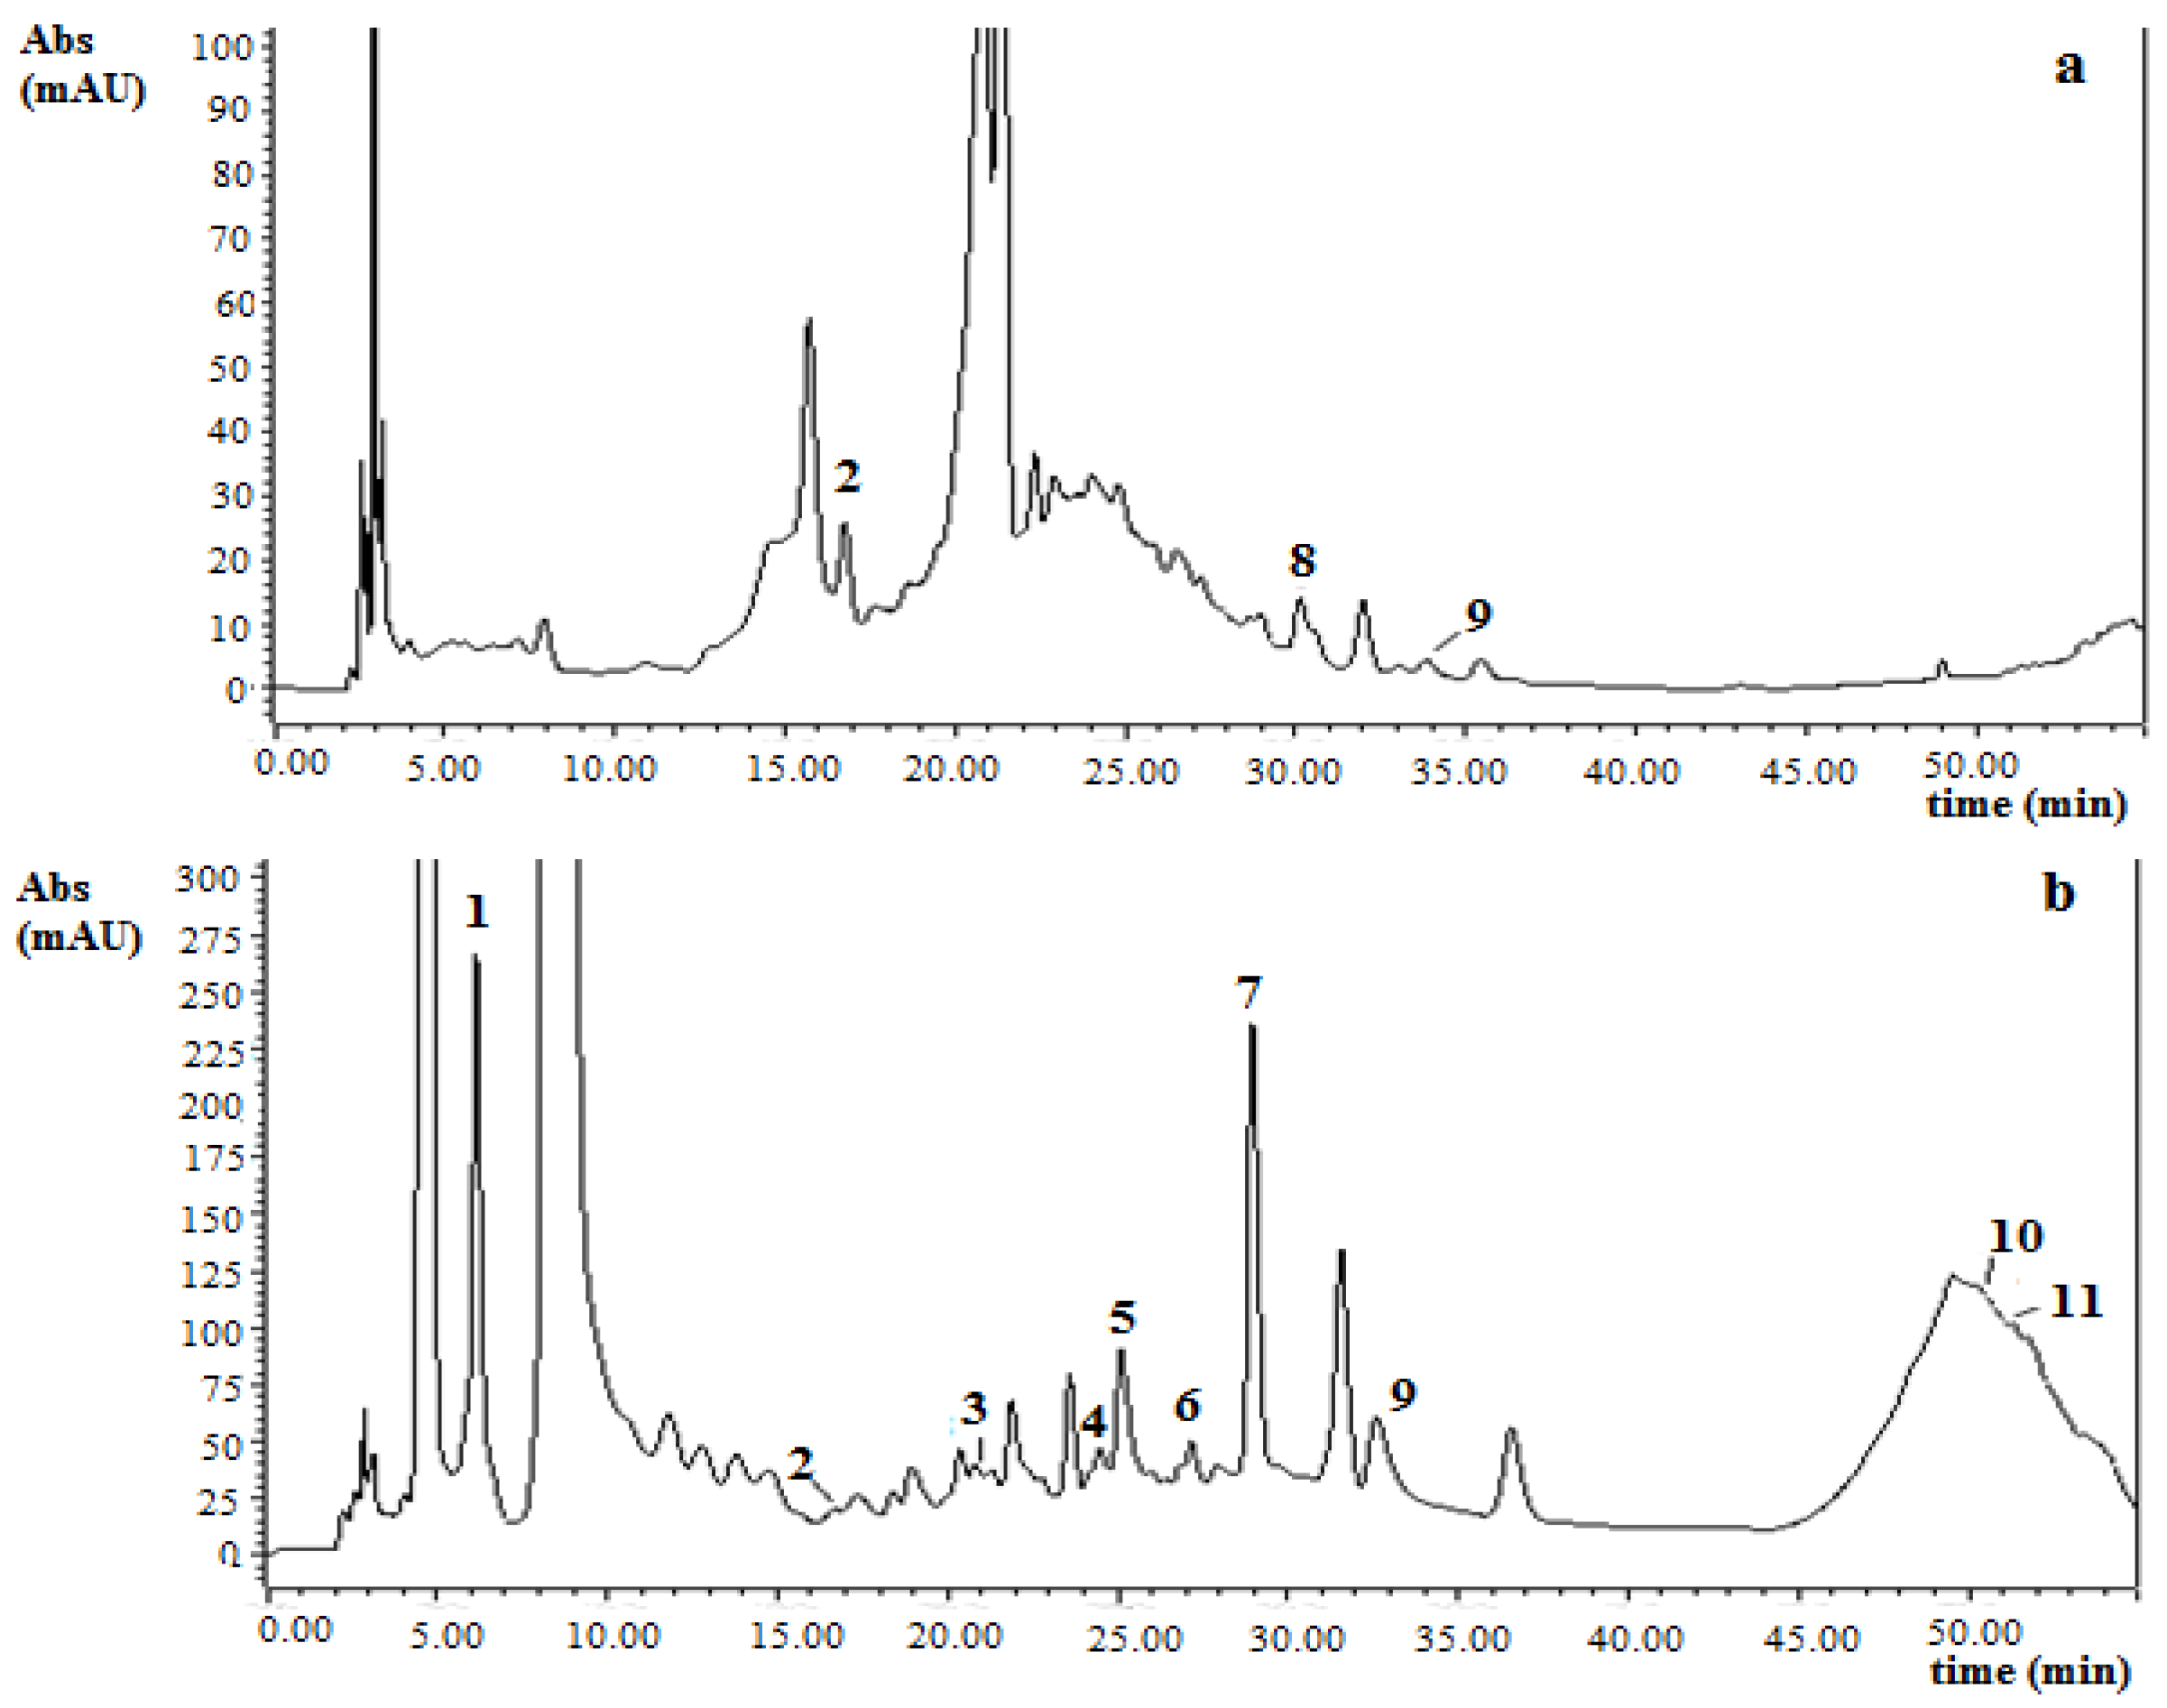
3.2. Phenolic Compounds Content

The total phenolic (TP) content and the total anthocyanin (TA) content of Camarosa and Selva strawberries are shown in Table 1. Total phenolic content (ranged from 250.0 to 324.2 mg/100 g FW) and total anthocyanin content (ranged from 27.1 to 47.0 mg/100 g FW) of Camarosa strawberries were higher than the values observed in Selva strawberries (TP ranged from 205.3 to 292.4 mg/100 g FW and TA ranged from 19.0 to 25.1 mg/100 g FW). Like vitamin C, the phenolic content in strawberries is also dependent on the cultivar and the ripening degree [1].
The HPLC phenolic compounds profiles for both strawberry cultivars are shown in Table 2. Figure 1, Figure 2 illustrate a typical chromatogram at 280 nm before and after hydrolysis for Camarosa and Selva strawberries. As explained in Section 2.6, phenolic compounds obtained before acid hydrolysis represent free aglycones or nonconjugated or noncondensed phenolic compounds naturally present in the strawberry extracts. On the other hand, the phenolic compounds obtained after acid hydrolysis represent total aglycones from glycosylated phenolics or conjugated or condensed phenolic compounds in the strawberry extracts.
Table 2. Phenolic compounds concentration before and after acid hydrolysis in two strawberry cultivars.
Phenolic compoundConcentration before acid hydrolysisConcentration after acid hydrolysis
CamarosaSelvaCamarosaSelva
Gallic acid1.36 ± 0.05-14.28 ± 1.35 a17.21 ± 1.30 b
Catechin1.70 ± 0.17 a3.35 ± 0.42 b0.48 ± 0.09 a0.67 ± 0.10 a
Epicatechin--4.02 ± 0.28 b0.84 ± 0.20 a
Ferulic acid--3.44 ± 0.32 b2.75 ± 0.41 a
Coumaric acid--1.69 ± 0.20 a1.96 ± 0.18 a
Cyanidin--4.46 ± 0.23 a5.28 ± 0.29 b
Pelargonidin--25.20 ± 1.11 b18.67 ± 1.09 a
Rutin1.0 ± 0.10 a1.84 ± 0.17 b0.09 ± 0.01 a0.10 ± 0.02 a
Ellagic acid0.61 ± 0.09 a0.65 ± 0.07 a6.67 ± 0.46 a11.87 ± 2.00 b
Quercetin--0.36 ± 0.09 b0.18 ± 0.04 a
Kaempferol--0.09 ± 0.02 a0.62 ± 0.09 b
Total phenolics 14.66 ± 0.30 a5.82 ± 0.60 b60.79 ± 1.90 a60.20 ± 2.40 a
Mean ± S.D., n = 9; Results expressed as mg/100 g FW; 1 Sum of the phenolic compound contents; -, Not detected; Different superscript lowercase letters indicate significant differences between strawberry cultivars (p ≤ 0.05) by t-test.
Figure 1. HPLC-DAD chromatograms of a Camarosa strawberry extract before (a) and after (b) acid hydrolysis (4 mol/L HCl, 50 min at 90 °C) at 280 nm. Peak identification: 1, gallic acid; 2, (±)-catechin; 3, (−)-epicatechin; 4, ferulic acid; 5, p-coumaric acid; 6, cyanidin; 7, pelargonidin; 8, rutin; 9, ellagic acid; 10, quercetin; 11, kaempferol.
Foods 02 00120 g001
Figure 2. HPLC-DAD chromatograms of a Selva strawberry extract before (a) and after (b) acid hydrolysis (4 mol/L HCl, 50 min at 90 °C) at 280 nm. Peak identification: 1, gallic acid; 2, (±)-catechin; 3, (−)-epicatechin; 4, ferulic acid; 5, p-coumaric acid; 6, cyanidin; 7, pelargonidin; 8, rutin; 9, ellagic acid; 10, quercetin; 11, kaempferol.
Foods 02 00120 g002
For Camarosa cultivar, gallic acid, catechin, rutin, and ellagic acid were the phenolic compounds found before acid hydrolysis (Table 2). For Selva cultivar, higher catechin and rutin contents were determined but gallic acid was not detected prior to hydrolysis.
Phenolics compounds which were detected and quantified in the nonhydrolyzed strawberry extracts were lower than the content obtained after subsequent hydrolysis (Table 2). In contrast, catechin was affected by hydrolysis conditions and the content was lower in the hydrolyzed extracts.
The remaining percentage of rutin in the hydrolyzed samples was used as a measure of the hydrolysis efficiency [9]. It was defined as the rutin concentration before acid hydrolysis minus the concentration after acid hydrolysis, divided by the concentration before acid hydrolysis. The hydrolysis efficiencies (%) were 91 % for Camarosa and 94.5 % for Selva strawberries. These results point out efficient hydrolysis in both strawberry extracts.
Flavonols (quercetin and kaempferol) were found at low concentrations in the hydrolyzed strawberry extracts (Table 2). Although quercetin content was higher in Camarosa strawberries, kaempferol content was found at a lower level in this cultivar. Häkkinen and Törrönen [18] reported that quercetin ranged from 0.3 to 0.4 mg/100 g FW; and kaempferol ranged from 0.6 to 0.9 mg/100 g FW) for different strawberry cultivars from Poland and Finland.
Concerning hydroxycinnamic acid derivatives (ferulic and coumaric acid), coumaric acid content (Table 2) was similar for both strawberry cultivars (p > 0.05) and was in a similar range as reported by Häkkinen and Törrönen [18] ranging from 0.7 to 1.8 mg/100 g FW in strawberries from Finland and Poland; and Mattila et al. [19] who reported a mean value of 2.6 mg/100 g FW in strawberries from Finland. However, ferulic acid was not reported from strawberries in these studies. In our case, ferulic acid content was 20% higher in Camarosa than Selva strawberries (Table 2).
Free ellagic acid levels (before samples hydrolysis) are generally low, although substantial quantities of this compound can be detected after acid hydrolysis of extracts, as a result of ellagitannin breakdown [2,20]. The free ellagic acid concentrations (Table 2) were similar for both studied strawberry cultivars (p > 0.05), and were in agreement with those reported for seven Brazilian strawberries (0.6 to 2.6 mg/100 g FW) by da Silva Pindo et al. [2]. Total ellagic acid content (hydrolyzed samples) was higher in Selva than in Camarosa strawberries (Table 2). The content of total ellagic acid in Camarosa was in agreement with the data reported by Williner et al. [21] for the same strawberry variety from Coronda, Argentina (mean value: 6.16 mg/100 g FW). Moreover, total ellagic content in both strawberry cultivars was slightly lower than those reported by da Silva Pinto et al. [2] ranging from 17 to 47 mg/100 g FW.
Anthocyanidins content can be considered as an approximate amount of the anthocyanins content (anthocyanidins in their glycoside form). In this sense, the main anthocyanins found in strawberries are pelargonidin-3-glucoside, and pelargonidin-3-rutinoside and cyanidin-3-glucoside present as minor components [2]. In this test, pelargonidin was the highest anthocyanidin found in both strawberry cultivars, with Camarosa concentrations being the highest (p ≤ 0.05). Pelargonidin content in both Argentinian strawberry cultivars (Table 2) were found to be approximately in the same range as those obtained by Giné Bordonaba et al. [22] who reported pelargonidin-3-glucoside concentrations from 25.4 to 40.4 mg/100 g in three strawberry cultivars (Antea, Clery and Matis) from Switzerland. Cyanidin concentrations obtained in this study were slightly higher than values reported by the aforementioned authors (cyanidin-3-glucoside ranged from 1.3 to 1.4 mg/100 g). Moreover, cyanidin concentration in Selva strawberries was higher than the value in Camarosa cultivar (Table 2). Total anthocyanidin contents (pelargonidin plus cyanidin) were 29.7 and 24.0 mg/100 g FW for Camarosa and Selva, respectively; which represent 48.8% and 39.8% of the sum of all phenolic compounds, respectively (Table 2). Our results were in agreement with Castro et al. [23] who analyzed the total anthocyanin content in Selva and Camarosa strawberries from Portugal and Spain, respectively. Authors reported that the total anthocyanin concentration in Camarosa was higher than in Selva.
Total phenolics content was measured by the Folin-Ciocalteu method and the sum of each phenolic compound analyzed by HPLC-DAD in both strawberry cultivars. Results were different for both methodologies (Table 1, Table 2). As can be seen, total phenolics analyzed by Folin-Ciocalteu assay were higher than those obtained as the sum of phenolic compounds obtained by HPLC-DAD. It is known that Folin-Ciocalteu assay suffers from a number of interfering substances (particularly sugars, aromatic amines, sulfur dioxide, ascorbic acid, organic acid, and Fe (II)) which may also react with the reagent to give greater apparent phenolic concentrations [24]. Total phenolics content was 10% higher in Camarosa cultivar by the Folin-Ciocalteu method, and did not present differences between cultivars when it was calculated as the sum of phenolic compounds assayed by HPLC-DAD.

3.3. Antioxidant Capacity

The antioxidant activities for both methods in the cultivars are shown in Table 1. Results were in agreement with those reported by Halvonsen et al. [25] for three cultivars from Norway (ranging from 1.85 to 2.34 mmol Fe2+/100 g FW) and Leong and Shui [26], who reported a total antioxidant capacity of approximately 500 mg AA/100 g FW in strawberries from Singapore. The antioxidant capacity in Camarosa was higher than in Selva strawberries (p ≤ 0.05). The anthocyanins and the ellagitannins are the groups with highest contributions to total antioxidant capacity in strawberries, while it was estimated that vitamin C contributes 15% to 30% to this capacity [4,16]. The higher antioxidant capacity determined in Camarosa strawberries was in accordance with the higher anthocyanin content observed for these berries. However, Selva strawberries presented higher ellagic acid content (Table 2), which leads to a good level of antioxidant capacity in this cultivar. Since the strawberries used for this study come from different origins, it could also be possible that the differences found could be due to different culture conditions and not so much to the genetics of the cultivar.

4. Conclusions

The study of two strawberry cultivars from Argentina (Camarosa and Selva) indicated that there were differences in the bioactive compounds content and antioxidant capacity, but both were in the range of other varieties from others countries. The Camarosa cultivar presented higher total phenolic and anthocyanins content, and presented consequently a better antioxidant capacity for DPPH* and FRAP assays. However, the vitamin C content for both cultivars was in the same range. The results indicated that Camarosa strawberries, which are the most cultivated, consumed, and exported berries in Argentina, presented suitable bioactive compound levels with beneficial effects for human health. Moreover, the research points out that the strawberry varieties from Argentina are an interesting source of bioactive compounds comparable to those in other parts of the world.

Acknowledgments

Authors acknowledge to Universidad Nacional del Litoral (Argentina) for financial support through project CAI+D 2009. Franco Van de Velde was supported with a doctoral grant, from CONICET, Argentina and with an internship grant from IILA (Instituto Italolatinoamericano).

Conflicts of Interest

The authors declare no conflict of interest.

References

  1. Cordenunsi, B.R.; Genovese, M.I.; Oliveira do Nascimento, J.R.; Hassimotto, N.M.A.; dos Santos, R.J.; Lajolo, F.M. Effects of temperature on the chemical composition and antioxidant activity of three strawberry cultivars. Food Chem. 2005, 91, 113–121. [Google Scholar] [CrossRef]
  2. Da Silva Pinto, M.; Lajolo, F.; Genovese, M. Bioactive compounds and quantification of ellagic acid in strawberries (Fragaria x ananassa Duch.). Food Chem. 2008, 107, 1629–1635. [Google Scholar] [CrossRef]
  3. Giampieri, F.; Tulipani, S.; Alvarez-Suarez, A.M.; Quiles, J.L.; Mezzetti, B.; Battino, M. The strawberry: Composition, nutritional quality, and impact on human health. Nutrition 2012, 28, 9–19. [Google Scholar] [CrossRef]
  4. Lopes Da Silva, F.; Escribano-Bailón, M.; Pérez Alonso, J.; Rivas-Gonzalo, J.C.; Santos-Buelga, C. Anthocyanin pigments in strawberry. LWT Food Sci. Technol. 2007, 40, 374–382. [Google Scholar] [CrossRef]
  5. Molina, N.; Giménez, L.; Richieri, C. Horticultural Sector Economy of Corrientes. Regional Strawberry Production and Its Relationship to the National Supply and MERCOSUR. 2007. (in Spanish). Available online: http://inta.gob.ar/documentos/economia-del-sector-horticola-de-corrientes.-produccion-frutillera-regional-y-su-relacion-con-la-oferta-nacional-y-del-mercosur (acceded on 14 March 2013).
  6. Saccone, K. Characterization of Coronda Area as a Producer of Strawberries. Secretary for Production and Environment, Municipality of Coronda, Santa Fe, Argentina. 2006. (in Spainsh). Available online: http://64.76.123.202/SAGPYA/economias_regionales/_frutas/_informes/Produccion_de_frutillas_en_coronda.pdf (acceded on 14 March 2013).
  7. Deutsch, M.J. Official Methods of Analysis; Association of Official Agricultural Chemists International: Arlington, VA, USA, 1995. [Google Scholar]
  8. Van De Velde, F.; Pirovani, M.E.; Cámara, M.S.; Güemes, D.R.; Bernardi, C. Optimization and validation of a UV-HPLC method for vitamin C determination in strawberries (Fragaria ananassa Duch.), using experimental designs. Food Anal. Methods 2012, 5, 1097–1104. [Google Scholar] [CrossRef]
  9. Tarola, A.M.; van de Velde, F.; Salvagni, L.; Pretti, R. Determination of phenolic compounds in strawberries (Fragaria ananassa Duch) by high performance liquid chromatography with diode array detection. Food Anal. Methods 2013, 6, 227–237. [Google Scholar] [CrossRef]
  10. Jin-Heo, H.; Yong-Lee, C. Strawberry and its anthocyanins reduce oxidative stress-induced apoptosis in PC12 cells. J. Agric. Food Chem. 2005, 53, 1984–1989. [Google Scholar] [CrossRef]
  11. Singleton, V.L.; Rossi, J.A. Colorimetry of total phenolics with phosphomolybdic-phosphotungstic acid reagents. Am. J. Enol. Vitic. 1965, 16, 144–158. [Google Scholar]
  12. Sánchez-Moreno, C.; Plaza, L.; de Ancos, B.; Cano, M.P. Quantitative bioactive compounds assessment and their relative contribution to the antioxidant capacity of commercial orange juices. J. Sci. Food Agric. 2003, 83, 430–439. [Google Scholar] [CrossRef]
  13. Lim, Y.Y.; Lim, T.T.; Tee, J.J. Antioxidant properties of several tropical fruits: A comparative study. Food Chem. 2007, 103, 1003–1008. [Google Scholar] [CrossRef]
  14. Benzie, I.F.F.; Strain, J.J. Simultaneous automated measurement of the total antioxidant (reducing) capacity and ascorbic acid concentration. Redox. Rep. 1997, 3, 233–238. [Google Scholar]
  15. Tulipani, S.; Mezzetti, B.; Capocasa, F.; Bompadre, S.; Beekwilder, J.; Ric de Vos, C.H.; Capanoglu, E.; Bovy, A.; Battino, M. Antioxidants, phenolic compounds, and nutritional quality of different strawberry genotypes. J. Agric. Food Chem. 2008, 56, 696–704. [Google Scholar] [CrossRef]
  16. Pincemail, J.; Kevers, C.; Tabart, J.; Defraigne, J.O.; Dommes, J. Cultivars, culture conditions, and harvest time influence phenolic and ascorbic acid contents and antioxidant capacity of strawberry (Fragaria x ananassa). J. Food Sci. 2012, 77, 205–210. [Google Scholar] [CrossRef]
  17. Davey, M.W.; van Montagu, M.; Inzé, D.; Sanmartin, M.; Kanellis, A.; Smirnoff, N.; Benzie, I.J.J.; Strain, J.J.; Favell, D.; Fletcher, J. Rview: Plant l-ascorbic acid: chemistry, function, metabolism, bioavailability and effects of processing. J. Sci. Food Agric. 2000, 80, 825–860. [Google Scholar] [CrossRef]
  18. Häkkinen, S.; Törrönen, A. Content of flavonols and selected phenolic acids in strawberries and Vaccinium species: Infuence of cultivar, cultivation site and technique. Food Res. Int. 2000, 33, 517–524. [Google Scholar] [CrossRef]
  19. Mattila, P.; Kumpulainen, J. Determination of free and total phenolic acids in plant-derived foods by HPLC with diode-array detection. J. Agric. Food Chem. 2002, 50, 3660–3667. [Google Scholar] [CrossRef]
  20. Baettie, J.; Crozier, A.; Duthie, G.G. Potential health benefits of berries. Curr. Nutr. Food Sci. 2005, 1, 71–86. [Google Scholar] [CrossRef]
  21. Williner, M.R.; Pirovani, M.E.; Güemes, D.R. Ellagic acid content in strawberries of different cultivars and ripening stages. J. Sci. Food Agric. 2003, 83, 842–845. [Google Scholar] [CrossRef]
  22. Giné Bordonaba, J.; Crespo, P.; Terry, L. A new acetonitrile-free mobile phase for HPLC-DAD determination of individual anthocyanins in blackcurrant and strawberry fruits: A comparison and validation study. Food Chem. 2011, 129, 1265–1273. [Google Scholar] [CrossRef]
  23. Castro, I.; Gonçalves, J.A.; Vicente, A.A. Comparative study of Selva and Camarosa strawberries for the comercial market. J. Food Sci. 2002, 67, 2132–2136. [Google Scholar] [CrossRef] [Green Version]
  24. Prior, R.L.; Wu, X.; Schaich, K. Standardized methods for the determination of antioxidant capacity and phenolics in food and dietary supplements. J. Agric. Food Chem. 2005, 5, 4290–4302. [Google Scholar] [CrossRef]
  25. Halvorsen, B.L.; Holte, K.; Myhrstad, M.C.W.; Barikmo, I.; Hvattum, E.; Remberg, S.F.; Wold, A.B.; Haffner, K.; Baugerød, H.; Andersen, L.F.; et al. A systematic screening of total antioxidants in dietary plants. J. Nutr. 2002, 132, 461–471. [Google Scholar]
  26. Leong, L.P.; Shui, G. An investigation of antioxidant capacity of fruits in Singapore markets. Food Chem. 2007, 79, 69–75. [Google Scholar]

