Article

Saffron Samples of Different Origin: An NMR Study of Microwave-Assisted Extracts

1
Institute of Chemical Methodologies, Magnetic Resonance Laboratory "Annalaura Segre", National Research Council (CNR), Via Salaria km 29.300, 00015 Monterotondo, Rome, Italy
2
Department of Drug Chemistry and Technologies, Sapienza University of Rome, P.le Aldo Moro 5, 00185 Rome, Italy
3
Department of Chemistry, Sapienza University of Rome, P.le Aldo Moro 5, 00185 Rome, Italy
*
Author to whom correspondence should be addressed.
Foods 2014, 3(3), 403-419; https://doi.org/10.3390/foods3030403
Submission received: 23 April 2014 / Revised: 30 May 2014 / Accepted: 16 June 2014 / Published: 8 July 2014
(This article belongs to the Special Issue Foodomics 2013)

Abstract

:
An NMR analytical protocol is proposed to characterize saffron samples of different geographical origin (Greece, Spain, Hungary, Turkey and Italy). A microwave-assisted extraction procedure was developed to obtain a comparable recovery of metabolites with respect to the ISO specifications, reducing the solvent volume and the extraction time needed. Metabolite profiles of geographically different saffron extracts were compared showing significant differences in the content of some metabolites.

Graphical Abstract

1. Introduction

Saffron is a very expensive spice cultivated in few countries (Iran, India, Spain, Greece, Italy and Morocco), and it is mainly used as a food additive and for coloring purposes. The spice is obtained from the dried stigmas of the plant, Crocus sativus L. (Iridaceae). It has recently gained interest as a potential source of pharmacologically bioactive compounds, such as crocetin, picrocrocin and safranal, see Figure 1 [1,2,3,4,5,6]. This finding makes the spice a promising candidate for being a functional food. A functional food is considered a natural or processed food that contains known biologically active metabolites in defined quali-quantitative amounts providing a clinically proven health benefit. However, different drying procedures and post-harvest techniques, based on cultural and geographical traditions, lead to different metabolite patterns and concentrations of its constituents [7]. As a result of this, several analytical techniques have been proposed to discriminate the geographical origin on the basis of the chemical composition of this spice [8,9,10,11,12]. Moreover, its limited production and high price have markedly favored both a large number of commercial adulterations and the concurrent development of strict normative certifying of saffron’s authenticity and quality [13].
Saffron contains several main metabolites analyzed by different methods and instruments, because of their distinct chemical-physical profile. The presence of these compounds is important to achieve the recognized sensorial properties of the spice (color, taste and aroma), and all of them have been tested for potential therapeutic applications. Crocins are a group of glycosides (mono-glycosyl or di- glycosyl esters) of a C20 carotenoid aglycone crocetin (Figure 1). The most abundant glycoside is the crocetin digentiobiosyl ester (all trans-crocin), completely water-soluble compared to its parent compound. Crocetin and its esters are routinely analyzed by HPLC/UV-Vis, Raman spectroscopy and a non-aqueous capillary electrophoresis method [14]. The main component responsible for the bitter taste of saffron is picrocrocin, a quite polar terpenoid glycoside, present in an amount of 1%–13% in the stigmas. The characteristic odor of saffron is attributed to safranal (the main component of the volatile fraction and the product of natural deglycosylation of picrocrocin) and to other carotenoid breakdown products with a similar structure, typically determined by GC or GC/MS [15].
Figure 1. The chemical structure of the main bioactive compounds from the dried stigmas of Crocus sativus L.
Foods 03 00403 g001
Techniques reported in the literature for the isolation of specific bioactive compounds, reported in Figure 1 (targeted analysis), differ from each other on the basis of the chemical-physical characteristics (i.e., molecular weight, polarity, water solubility, volatility) of the metabolite considered. In general, conventional extraction with solvents and ultrasound-assisted extraction have been preferred for polar compounds, whereas steam distillation and supercritical fluid extraction have been chosen for volatile components. The extraction is, therefore, one of the most crucial steps for the complete recovery of all valuable plant secondary metabolites. To the best of our knowledge, automatic microwave-assisted extraction has never been applied to Crocus sativus L. stigmas and its well-known advantages (reduced solvent volume and extraction time, pressurized and sealed vials to reduce loss of volatile components, strict control of multiple parameters, such as temperature, pressure and irradiation power) make it an interesting method to achieve an exhaustive extract of this plant [16]. Finally, this technique provides, in general, a better isolation of secondary metabolites, due to the complete swelling of the subcellular structures under microwave irradiation, which leads to a deeper penetration of the solvent and an easier release of intracellular metabolites.
NMR methodology is one of the most suitable methodologies to obtain ‘‘high-throughput’’ spectroscopic/structural information on a wide range of compounds with a high analytical precision. It has been applied to the analysis of food following different approaches, that is target analysis, metabolic profiling and metabolic fingerprinting [17]. Several foodstuffs have been investigated to obtain information on varieties, geographical origin, quality, adulteration, and so on [18,19,20,21,22,23].
Yilmaz el al. [12] have used the 1H NMR metabolic fingerprinting approach, which does not require a detailed spectral assignment, to assess the quality of Iranian saffron using also an unsupervised classification method to detect adulteration.
Here, the 1H-based metabolic profiling of microwave-assisted saffron extracts is reported. The assignment of some compounds is reported in more detail with respect to literature data [12,24,25,26]. A simple and environmentally-friendly microwave-assisted extraction (MAE) requiring only a minimal amount of these expensive dried stigmas is proposed to obtain the major number of metabolites. Finally, a comparison of the 1H metabolic profiling of saffron samples of different geographical origin was carried out.

2. Experimental Section

2.1. Materials

Deuterated solvent (CD3OD, 99.8 atom% of deuterium) was purchased from Euriso-Top (Saclay, France). Saffron samples (300 mg) from Greece, Spain, Turkey, Italy (three different regions) and Hungary (see Table 1 for details) belonging to the same harvest (2012) were purchased from local producers and markets and kept at 4 °C in the dark until the analysis.
Table 1. Saffron samples used in the study.
Sample CodeCountry (region)Producer
ABItaly (Abruzzi) PDO*Agricultural company “Matergia”, Barisciano (Aquila)
GRGreeceLocal market
LAItaly (Latium)Agricultural company “Roncaglia”, Ronciglione (Viterbo)
SA1Italy (Sardinia)Local market
SA2Italy (Sardinia)“Zafferano Monreale snc” San Gavino Monreale, (Cagliari)
SA3Italy (Sardinia)Agricultural company “Curreli Franco” San Gavino Monreale, (Cagliari)
SA4Italy (Sardinia) PDOAgricultural company “Itria”, Turri (VS)
SP1Spain“Don Jerez”
SP2Spain“Cameo Zafferano Red”
TKTurkeyLocal market
HUHungary“Nehéz Gyula”
* PDO, Protected Designation of Origin.

2.2. Microwave-Assisted and Conventional Extractions

All dried samples were ground manually in a mortar and sifted to obtain a more uniform granulometry before performing the microwave-assisted extraction.
Microwave-assisted extraction (MAE) was performed by an automatic Biotage Initiator™ 2.0 (Uppsala, Sweden; 2.45 GHz high-frequency microwaves; power range: 0–300 W). The internal vial temperature was controlled by an IR sensor probe. Manually-ground saffron (10 mg) was placed in a 10-mL sealed vessel suitable for an automatic single-mode microwave reactor, and 0.8 mL of CD3OD were added to the sample to form a yellow-orange suspension. The sample was heated by microwave irradiation for 10, 19 and 30 min at 40 °C, followed by cooling with pressurized air. An internal standard (3-(trimethylsilyl)-propionic-2,2,3,3-d4 acid sodium salt, TSP, 1 mM) was added, and the suspension was stirred magnetically for 1 min in the dark. The liquid phase was carefully separated from the solid precipitate for the NMR analysis.
For comparison, conventional extraction was performed with 10 mg of manually-ground saffron placed in a 10-mL sealed vessel and 0.8 mL of CD3OD to form a yellow-orange suspension. The sample was magnetically stirred for 30 min in the dark at room temperature. Then, the internal standard (TSP, 1 mM) was added, and the suspension was magnetically stirred for 1 min in the dark. The liquid phase was carefully separated from the solid precipitate for the NMR analysis.

2.3. High-Resolution NMR Measurements

The NMR spectra of saffron samples were recorded in CD3OD at 27 °C on a Bruker AVANCE 600 NMR spectrometer operating at a proton frequency of 600.13 MHz and equipped with a Bruker multinuclear z-gradient inverse probe head capable of producing gradients in the z-direction with a strength of 55 G cm−1. 1H spectra were referenced to the methyl signal of TSP at 0.00 ppm, whereas 13C spectra were referenced to the CD3 resonance of deuterated methanol (δ = 49.0 ppm).
1H spectra of methanol extracts were acquired by coadding 128 transients with a recycle delay of 9 s. The experiment was carried out by using a 45° pulse, 32 K data points. Presaturation of the HDO signal with a soft pulse during 2 s just before acquisition was applied using a modified zgpr Bruker pulse sequence.
2D NMR experiments, namely 1H-1H TOCSY, 1H-13C heteronuclear single quantum coherence (HSQC) and 1H-13C heteronuclear multiple-bond correlation (HMBC) [27] were performed using the same experimental conditions previously reported [28]. The mixing time for the 1H-1H TOCSY was 80 ms. The HSQC experiments were performed using a coupling constant 1JC–H of 150 Hz, and the 1H-13C HMBC experiments were performed using a delay for the evolution of long-range couplings of 80 ms.
The diffusion ordered spectroscopy (DOSY) experiment [29] was performed using double stimulated echo and LED (dstegp3s pulse sequence in Bruker pulse library) with a sine-shaped gradient of different intensities. The gradient strength was logarithmically incremented in 32 steps from 2% up to 95% of the maximum gradient strength (55 G cm−1). The following experimental settings were used: diffusion time, Δ, was 100 ms; gradient duration, δ, was 2.6 ms; the longitudinal eddy current delay was 25 ms; the gradient pulse recovery time was set to 0.1 ms. After Fourier transformation and baseline correction, the diffusion dimension was processed by means of the Bruker TOPSPIN software (version 1.3).

2.4. Measurement of the Metabolic Content and Statistical Analysis

Using the Bruker TOPSPIN 1.3 software and defined integral regions, the integrals of selected 1H resonances were measured with respect to the integral of TSP CH3 signal at 0.00 ppm normalized to 100 and used as the internal standard. The measured resonances (see Table 2) are due to fatty acids (FA) (0.90 ppm), acetic acid (AcOH) (1.91 ppm), picrocrocin (PCROC) (2.15 ppm), linoleic fatty acid (C18:2) (2.78 ppm), linolenic fatty acid (C18:3) (2.81 ppm), β-glucose (βGLC) (3.12 ppm), α-glucose (αGLC) (5.10 ppm), all double bonds in fatty acids (DB) (5.34 ppm), β-d-gentiobiosyl moiety in crocins (GB-CROC) (5.54 ppm), β-d-glucosyl moiety in crocins (βGLC-CROC) (5.56 ppm), all-trans- crocetin moiety in crocins (DBtCROC) (7.44 ppm) and 13-cis-crocetin moiety in crocins (DBcCROC) (7.51 ppm).
The statistical processing of NMR data was performed using the STATISTICA package for Windows (version 5.1, 1997) and by in-house routines written in MATLAB (The Mathworks, Natick, MA, USA). Before performing the statistical analysis, the selected variables were mean-centered, and each variable was divided by its standard deviation (autoscaling). Principal component analysis (PCA) was performed on the 12 selected variables: the percentage of variance for each specific principal component is reported. PCA results are shown reporting the scores of principal components and also as a plot of variable loadings.

3. Results and Discussion

3.1. Microwave-Assisted Extraction

Saffron stigmas contain metabolites of a wide polarity spectrum. For instance, picrocrocin and crocins are glycosides and, therefore, dissolve excellently in water, whereas aromatic compounds and lipids are immiscible in water, but soluble in organic solvents. Methanol has been suggested as a good compromise to obtain an untargeted metabolic profiling, including polar, as well as non-polar constituents [12].
It was preliminary found that the metabolite concentration vs. extraction time followed a saturation curve. Plant material visibly lost the natural color after 30 min, and the 30-min extract showed a major amount of metabolites with respect to the 10- and 19-min extracts, respectively, according to the NMR profiling spectra.
In order to study the influence of temperature on the extraction process and on the product recovery and stability, a comparison between the conventional and the microwave-assisted extraction (MAE) technique was performed. A temperature of 40 °C (MAE) did not enhance metabolite degradation and was found to be as efficient as the conventional extraction at room temperature (by means of a direct comparison of their NMR metabolite profiling). Better results were achieved with respect to the reported ISO specifications regarding the limited volume of the extraction solvent for the analysis (0.8 mL of methanol), the reduced time of extraction (30 min vs. 60 min) and the possibility to work with small amounts (10 mg) of this expensive spice. In addition, the microwave-assisted extraction directly provides the sample for the NMR analysis without any further pre-treatment, avoiding the loss and/or degradation of natural constituents (i.e., volatile fraction) and enhancing the automation of the process.

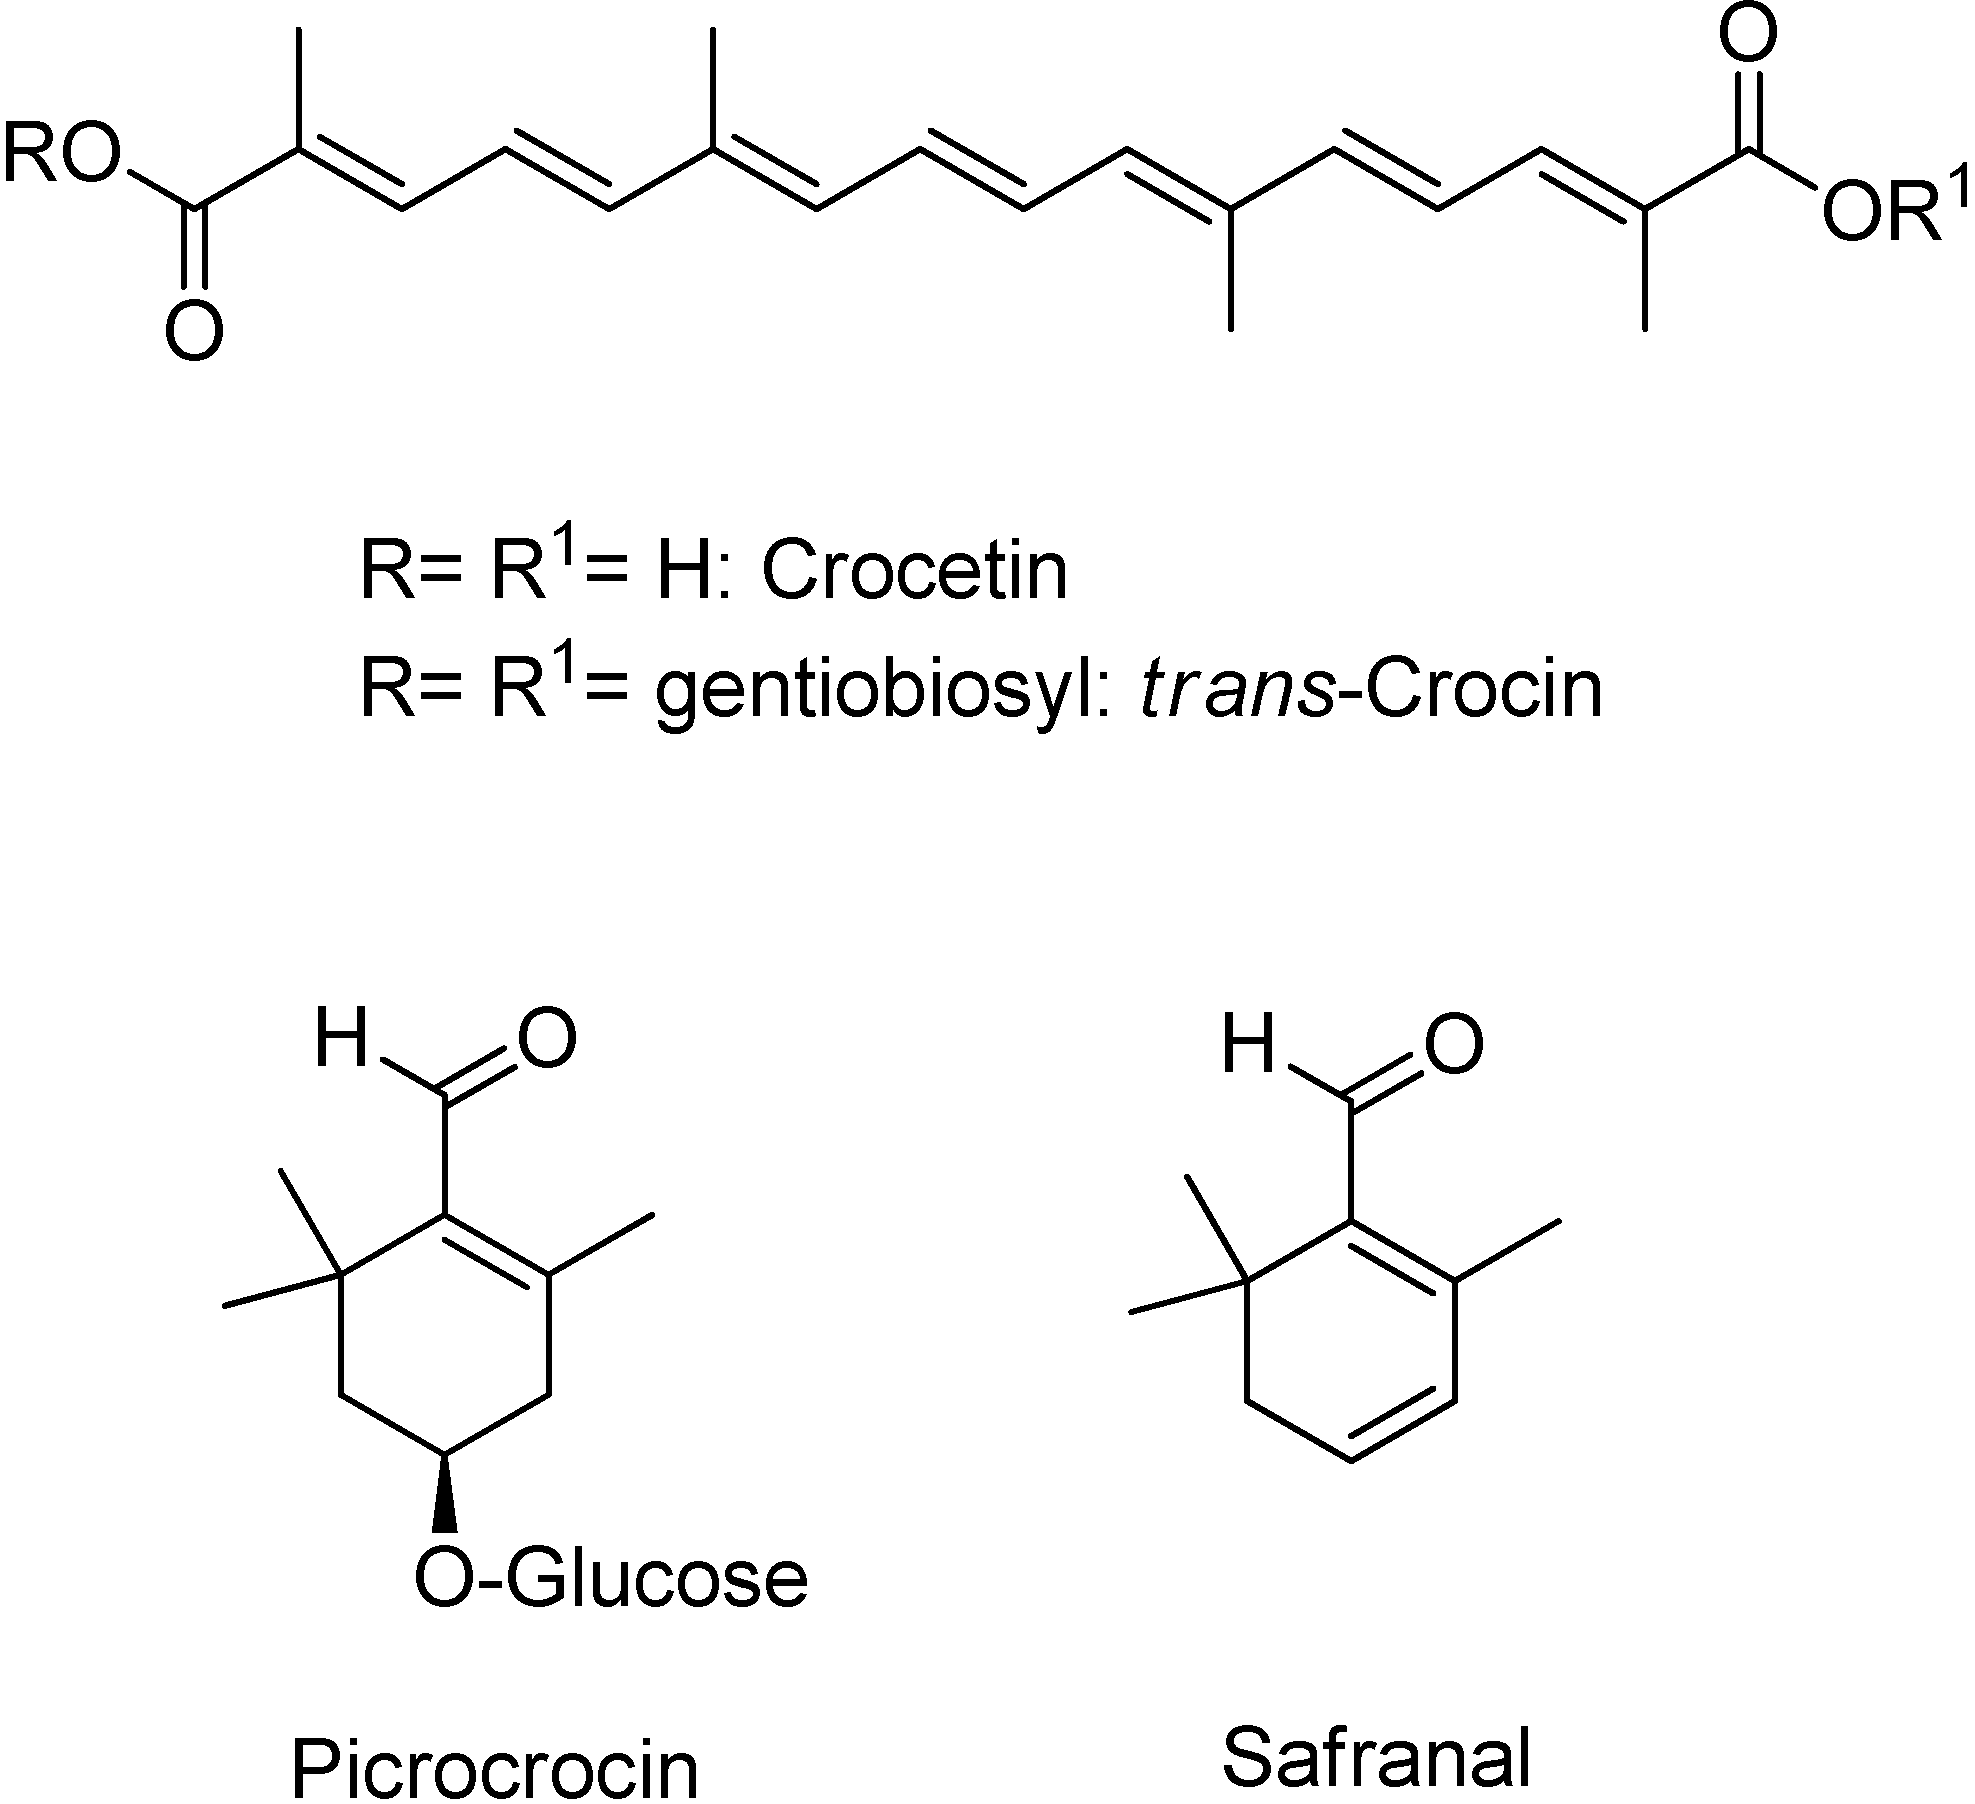
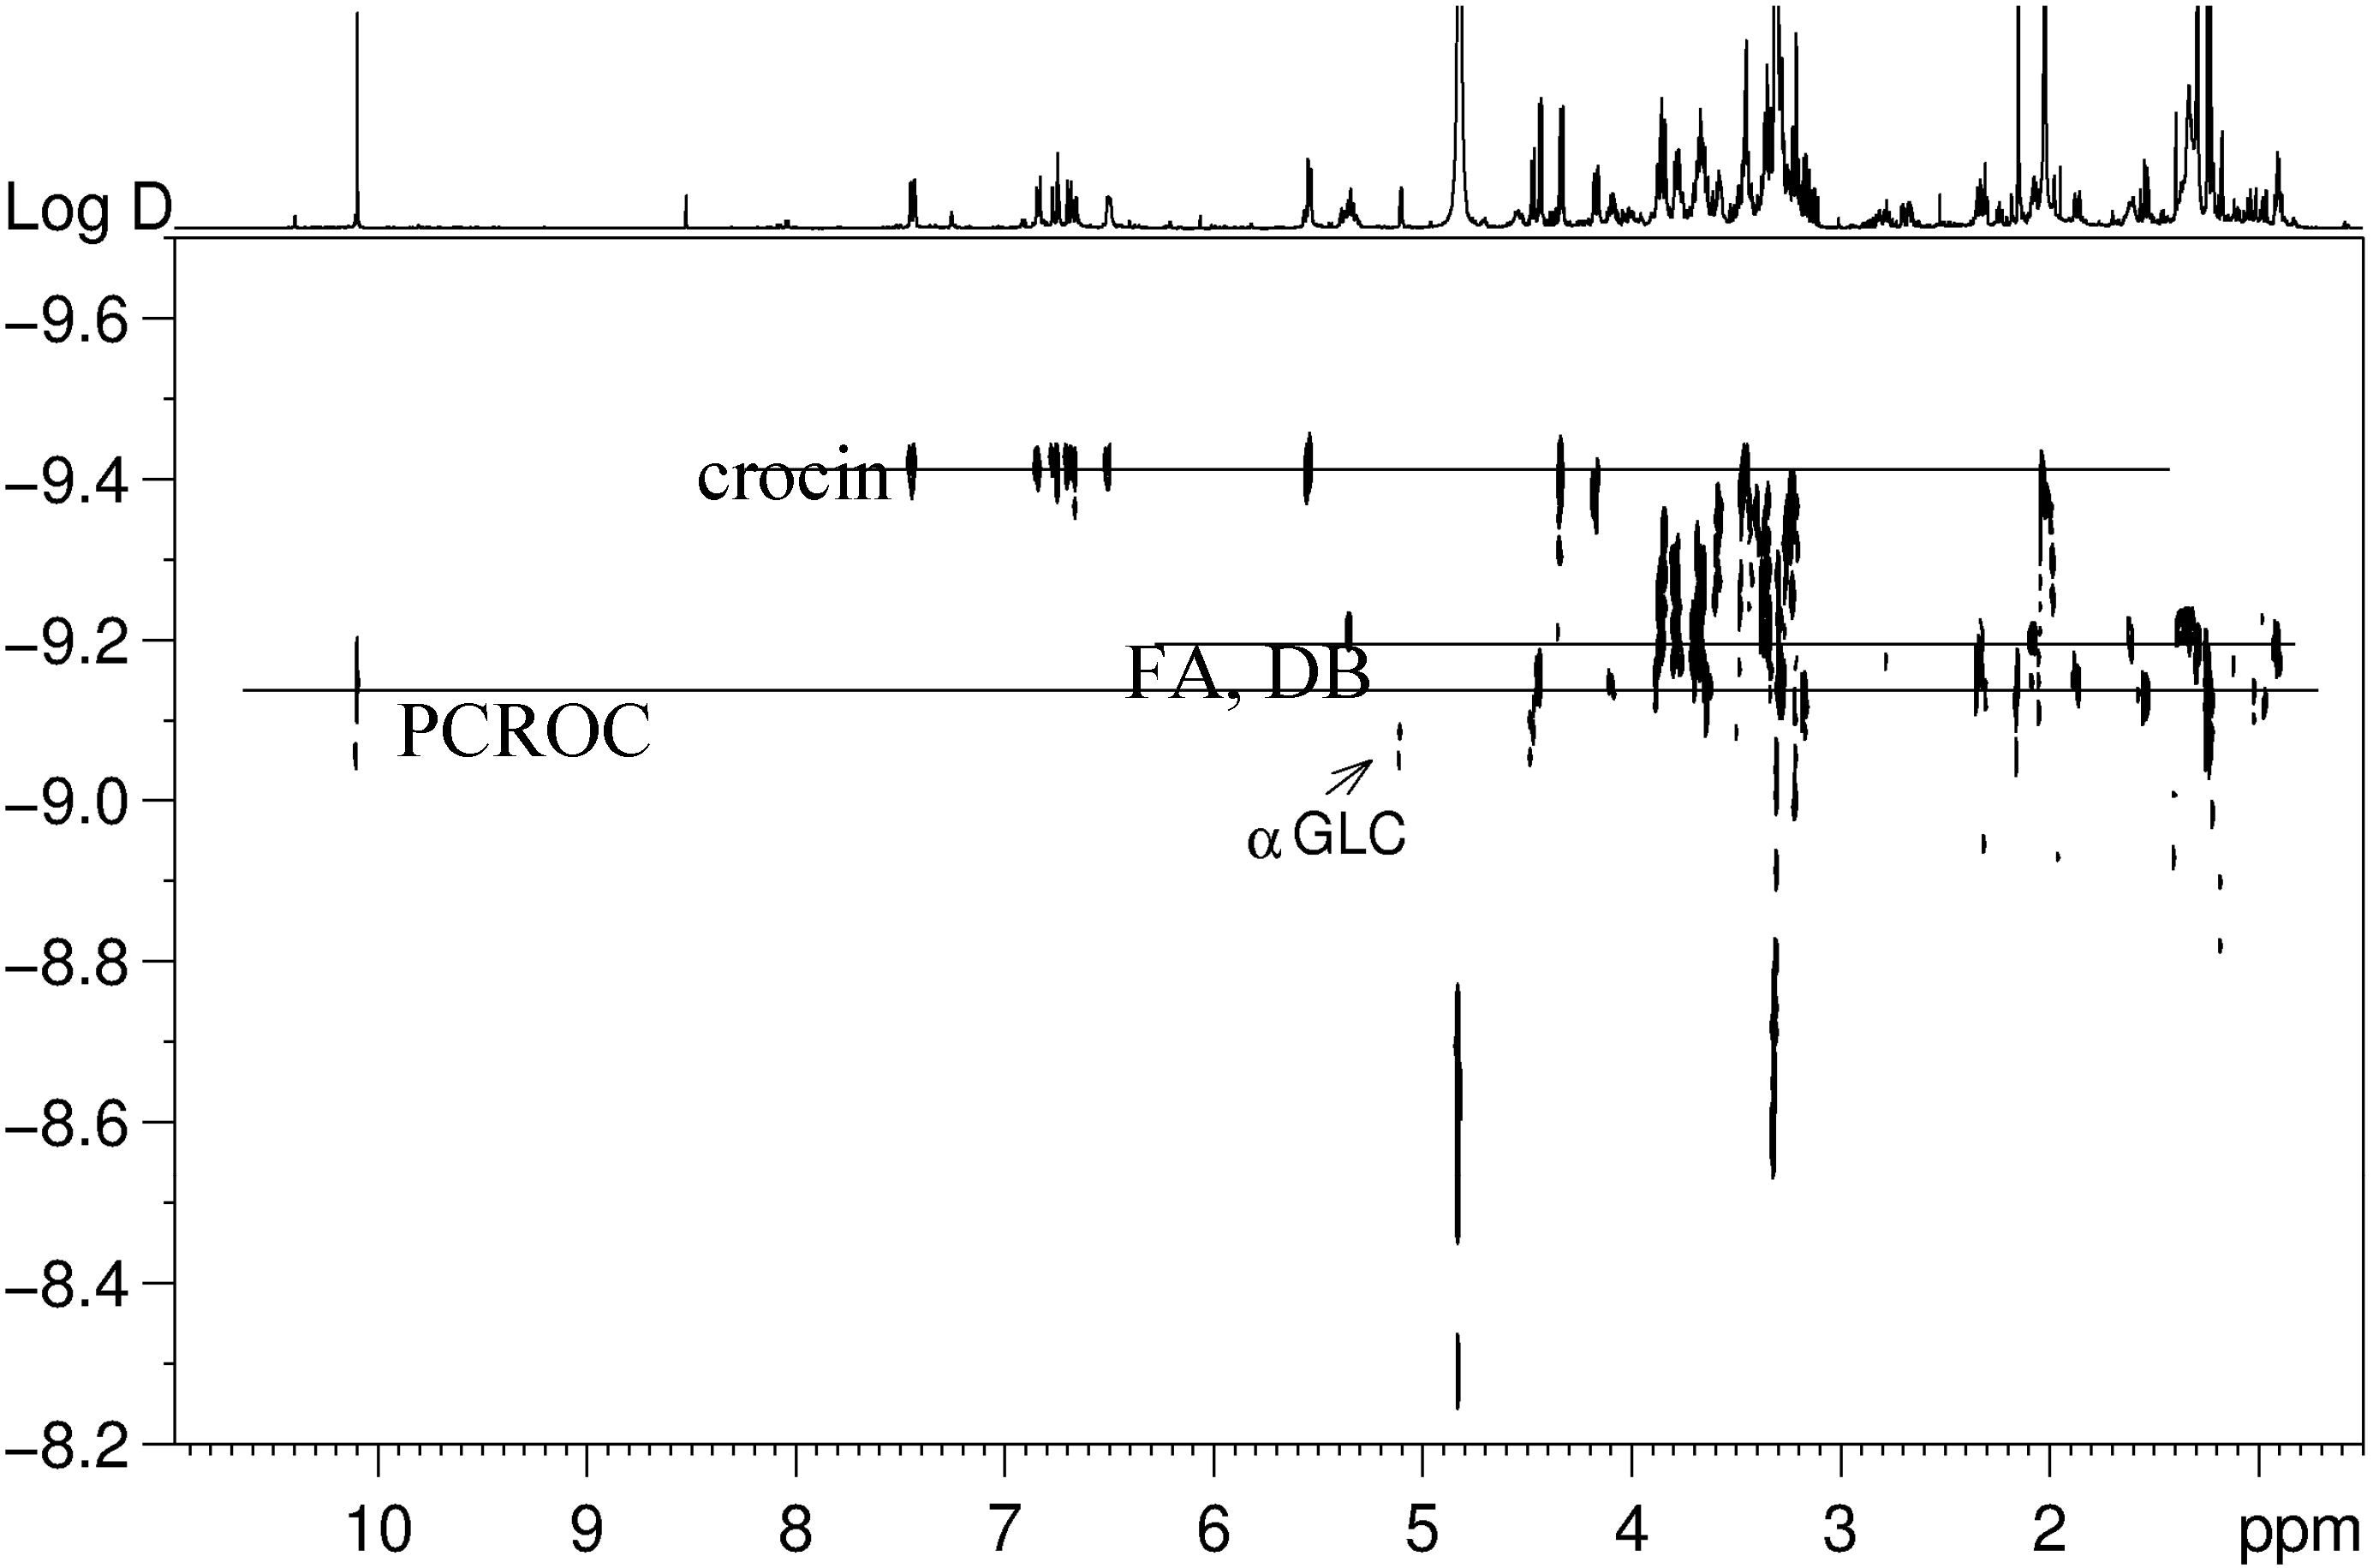
3.2. NMR Analysis of Saffron Extracts
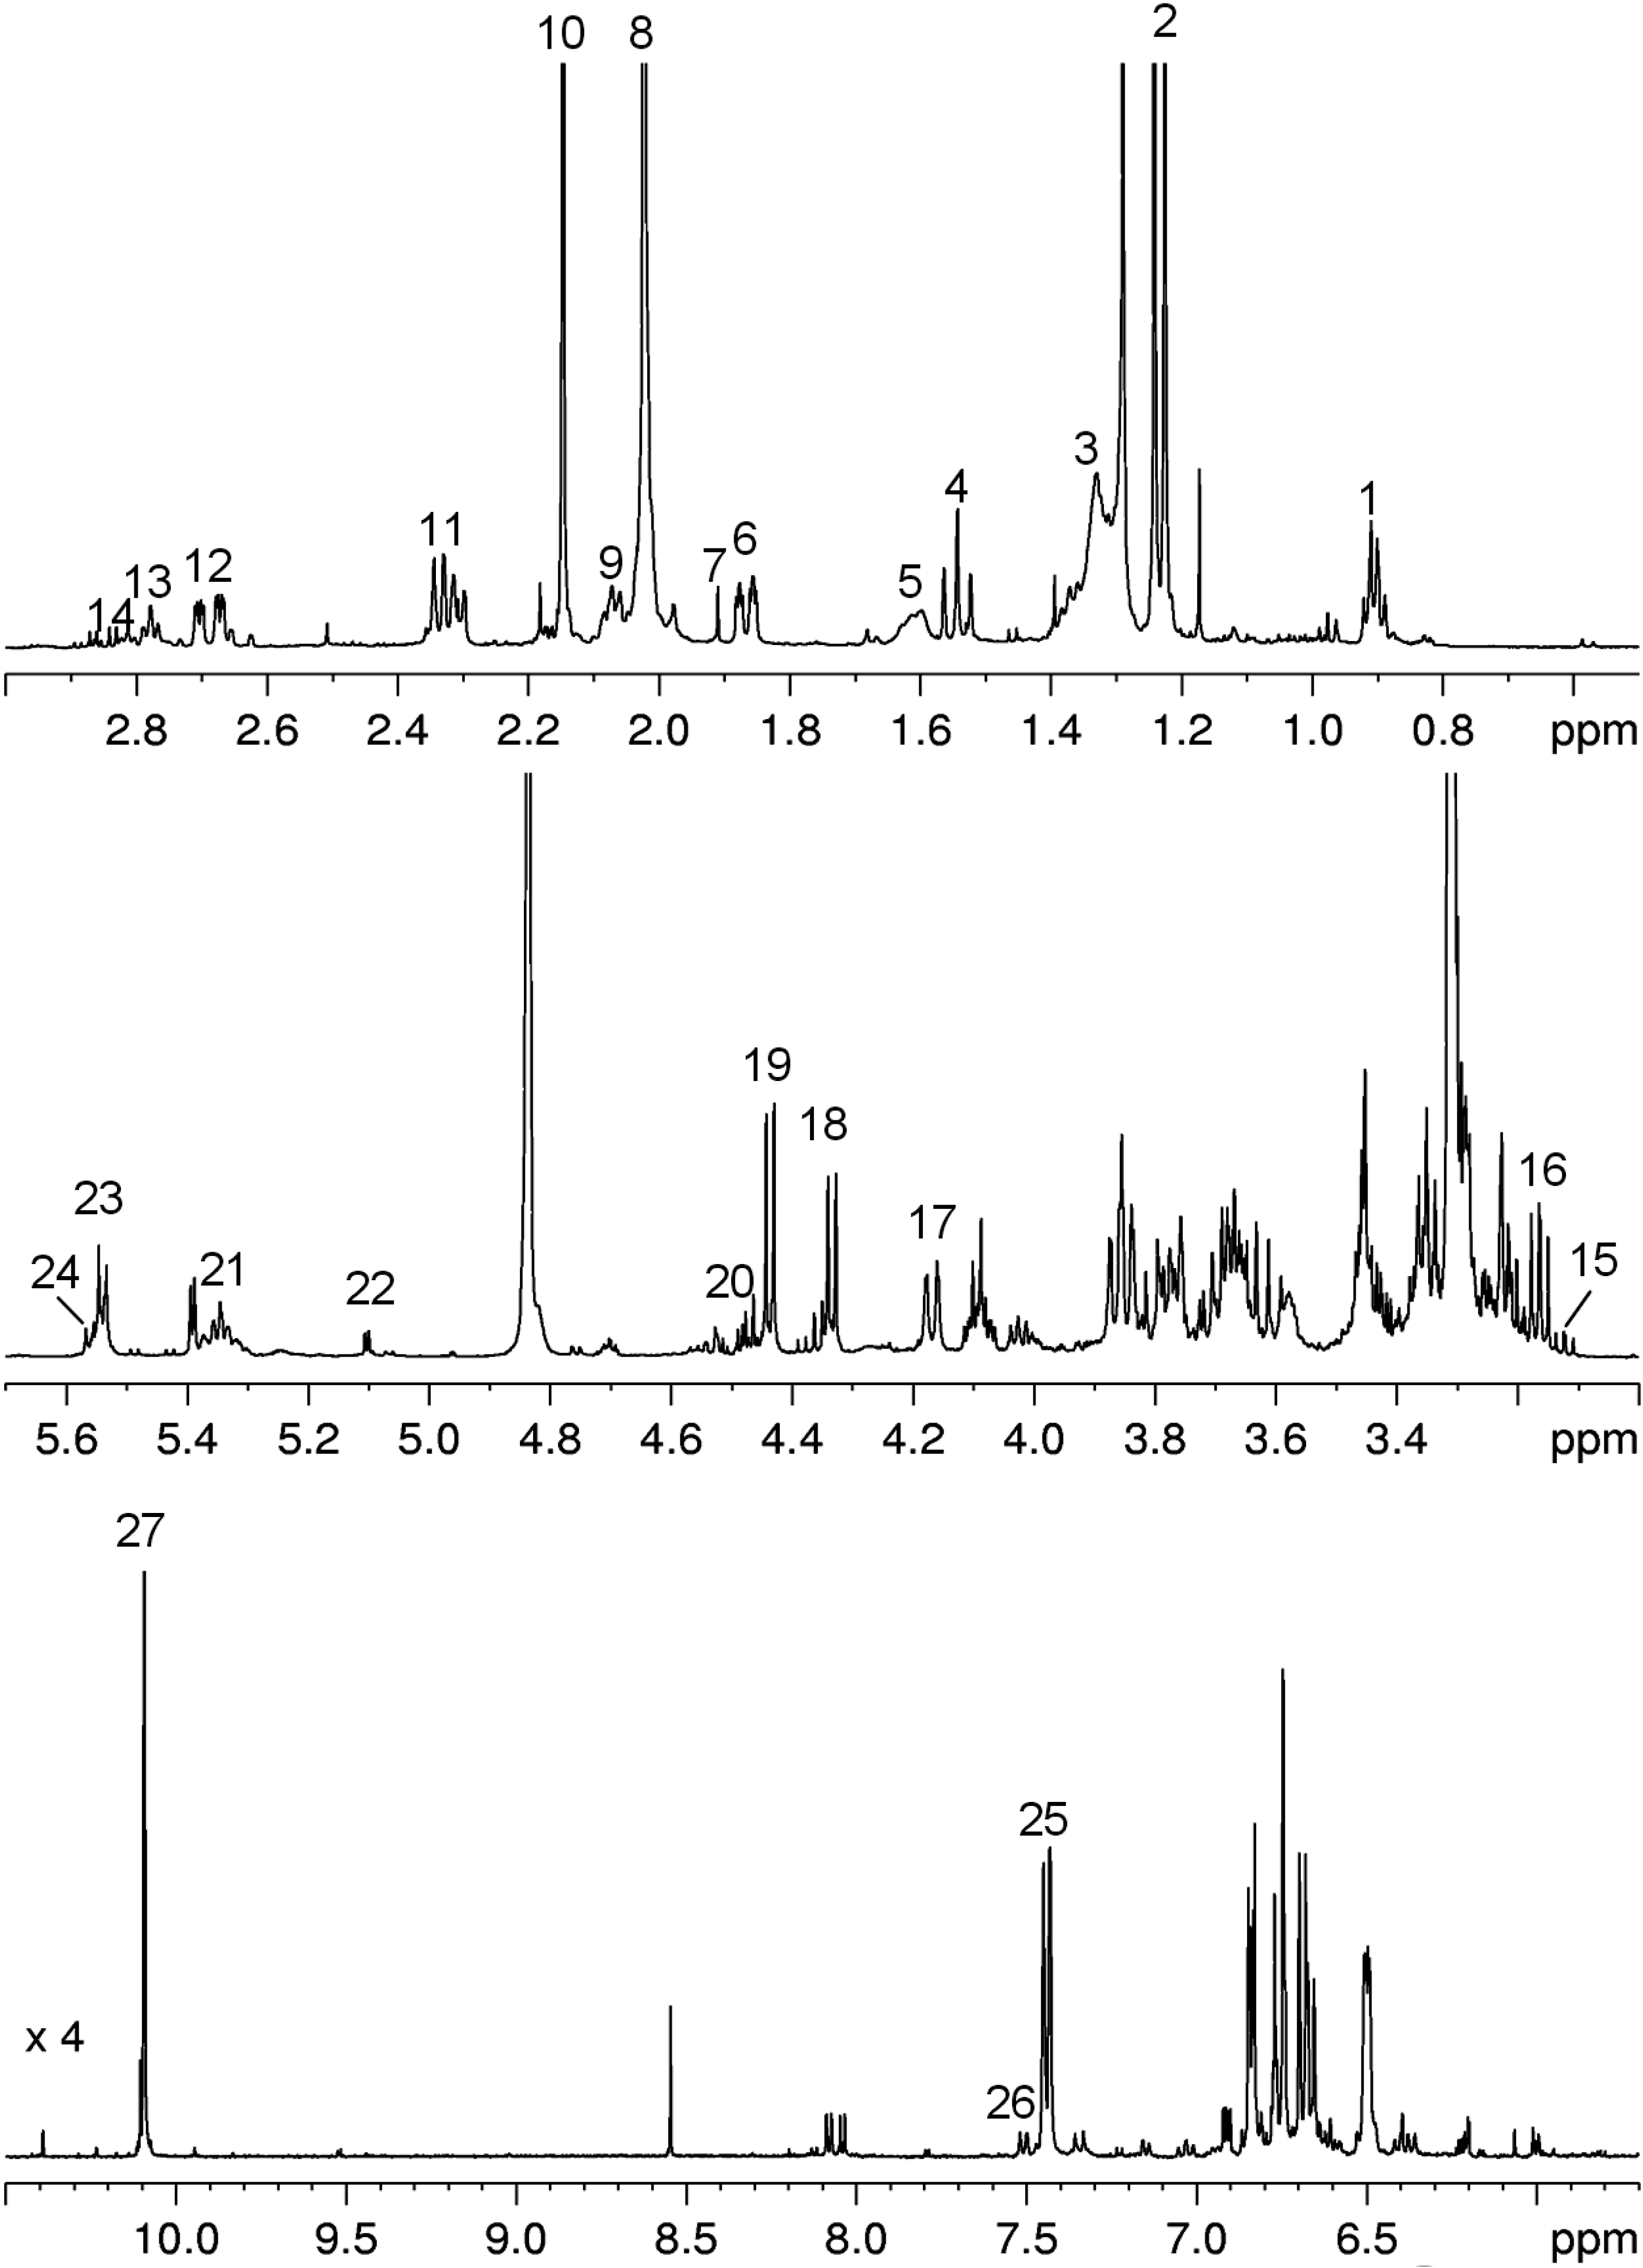
The 1H spectrum of microwave-assisted saffron extract is reported in Figure 2. The 1H and 13C assignments were obtained by literature data [12,24,25,26,30] and 1D and 2D NMR experiments; see Table 2. In particular, the assignment of 13C signals from the all-trans-crocin (sugar and aglycone moieties) and picrocrocin was obtained directly in the CD3OD extract using the 1H-13C HSQC experiment, whereas it was previously reported only in the case of isolated compounds and in other solvents.
The 1H spectrum shows not only signals of crocin and picrocrocin typical of saffron, but also signals of other compounds, such as lipids and sugars. In particular, linolenic and linoleic fatty acids and phosphatidylcholine were detected together with glucose present in α and β forms. Interesting information on the saffron extract can be obtained analyzing the DOSY map reported in Figure 3. DOSY is a particularly convenient way of displaying the molecular self-diffusion information in a bi- dimensional array, with the NMR spectrum in one dimension and the self-diffusion coefficient in the other one [29]. As expected for a mixture, also in the case of the saffron extract, many signals with different self-diffusion coefficients and, therefore, with different molecular weights are present, due to different metabolites; on the other hand, signals from the same molecule show the same self-diffusion coefficient. The DOSY map shows clearly the presence of all-trans-crocin, having the same diffusion coefficients for the aglycone moiety and sugars (glucose and gentiobiose), whereas crocetin seems not to be present. Picrocrocin was also observable, the aldehydic signal and the sugars signals having the same diffusion coefficient. Finally, free glucose with the highest self-diffusion coefficient value was easily detected.
Figure 2. 1H NMR spectrum of saffron extract in CD3OD at 27°C. Assignments: 1, CH3 FA; 2, CH3-7,8 PCROC (picrocrocin); 3, CH2 FA; 4, CH2-5PCROC; 5, CH2-3 FA; 6, CH2-5 PCROC; 7, CH3 AcOH; 8, CH3-19,20 crocetin; 9, CH2-2 FA; 10, CH3-9 PCROC; 11 and 12, CH2-3 PCROC; 13, CH2-11 C18:2; 14, CH2-11 C18:3; 15, CH-2 β-glucose (βGLC); 16, CH-2′ PCROC; 17, CH2-6 GB-CROC; 18, CH-1′ GB-CROC; 19, CH-1′ βGLC-CROC; 20, CH-1 β-glucose; 21, DB (double bond); 22, CH-1 α-glucose; 23, CH-1 GB-CROC; 24, CH-1 βGLC-CROC; 25, CH-10,10′ all-trans-crocin; 26, CH-10 13-cis-crocin; 27, CHO-10 PCROC.
Foods 03 00403 g002
Table 2. Summary of the metabolites identified in the 600 MHz 1H spectrum of the microwave-assisted extract of saffron. * Indicate the signals selected for statistical analysis.
CompoundAssignment¹H, ppmMultiplicity, JH–H, Hz¹³C, ppm
Linoleic acid
C18:2
CH2-22.33
CH2-31.61
CH2-41.34
CH2-8,142.07t: 7.4
CH-9,10,12,135.34 *
CH2-112.78 *t: 6.8
CH2-15,16,171.32
CH3-180.91t: 7.0
Linolenic acid
C18:3
CH2-1,4,5,6,71.34
CH2-22.33
CH2-31.61
CH2-82.08t: 7.4
CH-9,10,12,135.34
CH2-11,142.81 *t: 6.8
CH-155.30 *
CH-165.38 *
CH2-172.08t: 7.4
CH3-180.97t: 7.0
Phosphatidylcholine(CH3)3N3.21s54.6
Acetic acid AcOHCH31.91 *s
All fatty acids except C18:3, FACH30.90 *t: 6.714.6–14.4
All-trans-crocin DBtCROC (aglycone)C-8,8′ 168.6
C-9,9′ 126.5
CH-10,10′7.44 *dm: 11.3141.9
CH-11,11′6.68dd: 15.0; 11.4124.7
CH-12,12′6.76d: 15.0146.2
C-13,13′ 138.1
CH-14,14′6.50dm: 7.7137.4
CH-15,15′6.84dd: 7.8; 2.9133.0
CH3-19,202.02s12.6; 12.9
13-cis-crocin DBcCROC (aglycone)CH-107.51 *d: 11.8
CH-10′7.44
CH-11,11′6.68
CH-127.34d: 14.8
CH-12′6.76
CH-146.37d: 12.2
CH-14′6.50
CH-157.03dd: 13.4; 12.8
CH-15′6.74
(β-d-gentiobiosyl)
(GB-CROC)
CH-15.54 *d: 7.795.9
CH-23.45 77.8
CH-3,4,53.56–3.39
CH2-64.17dd: 11.5; 269.5
3.78 69.5
CH-1′4.33d: 7.8104.5
CH-2′3.23 75.1
CH-3′3.34
CH2-6′,6′3.85m62.7
3.66m62.7
(β-d-glucosyl)CH-15.56 *d: 7.796.0
(βGLC-CROC)CH2-6, 63.84; 3.69 62.7
Picrocrocin (PCROC) (aglycone)C-1 141.1
C-2 155.6
CH2-3,32.69ddd: 18.7; 5.5; 2.242.4
2.31ddm: 18.7; 942.4
CH-44.09m72.0
CH2-5,51.87ddd: 12.6; 3.3; 2.248.3
1.55t: 12.248.3
C-6 36.6
CH3-7,81.23s27.9
CH3-7,81.24s29.3
CH3-92.15 *d < 1 Hz19.3
CHO-1010.09s
(β-d-glucosyl)CH-1′4.44d: 7.8102.6
CH-2′3.16dd: 9.2; 7.875.2
CH-3′3.35m78.1
CH-4′3.28m78.0
CH-5′3.29m71.7
CH2-6′,6′3.67m62.7
3.86t: 11.2
α-Glucose
αGLC
CH-15.10 *d: 3.794.0
CH-23.35dd: 9.6; 3.773.9
CH-33.67dd: 9.6; 9.074.9
CH-43.30m71.9
CH-53.77 73.0
CH2-6, 63.78; 3.69 62.8
β-Glucose
βGLC
CH-14.47d: 7.898.3
CH-23.12 *dd: 9.2; 7.876.3
CH-33.33 78.2
CH-53.27 78.1
CH2-6,63.85; 3.65 62.9
Figure 3. 2D DOSY map of saffron extract in CD3OD at 27°C. All signals from a given molecule show the same diffusion coefficient as indicated for the case of crocin, fatty cids and picrocrocin.The 1H spectrum of the extract is also reported as a horizontal projection.
Foods 03 00403 g003

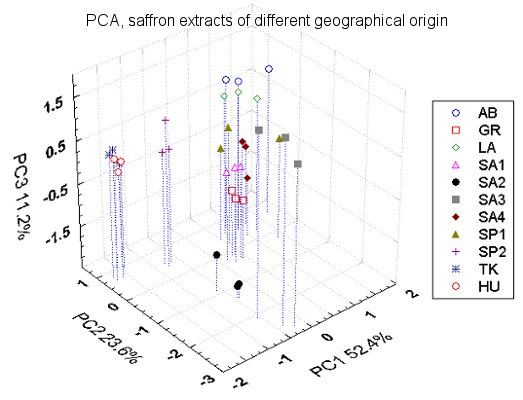
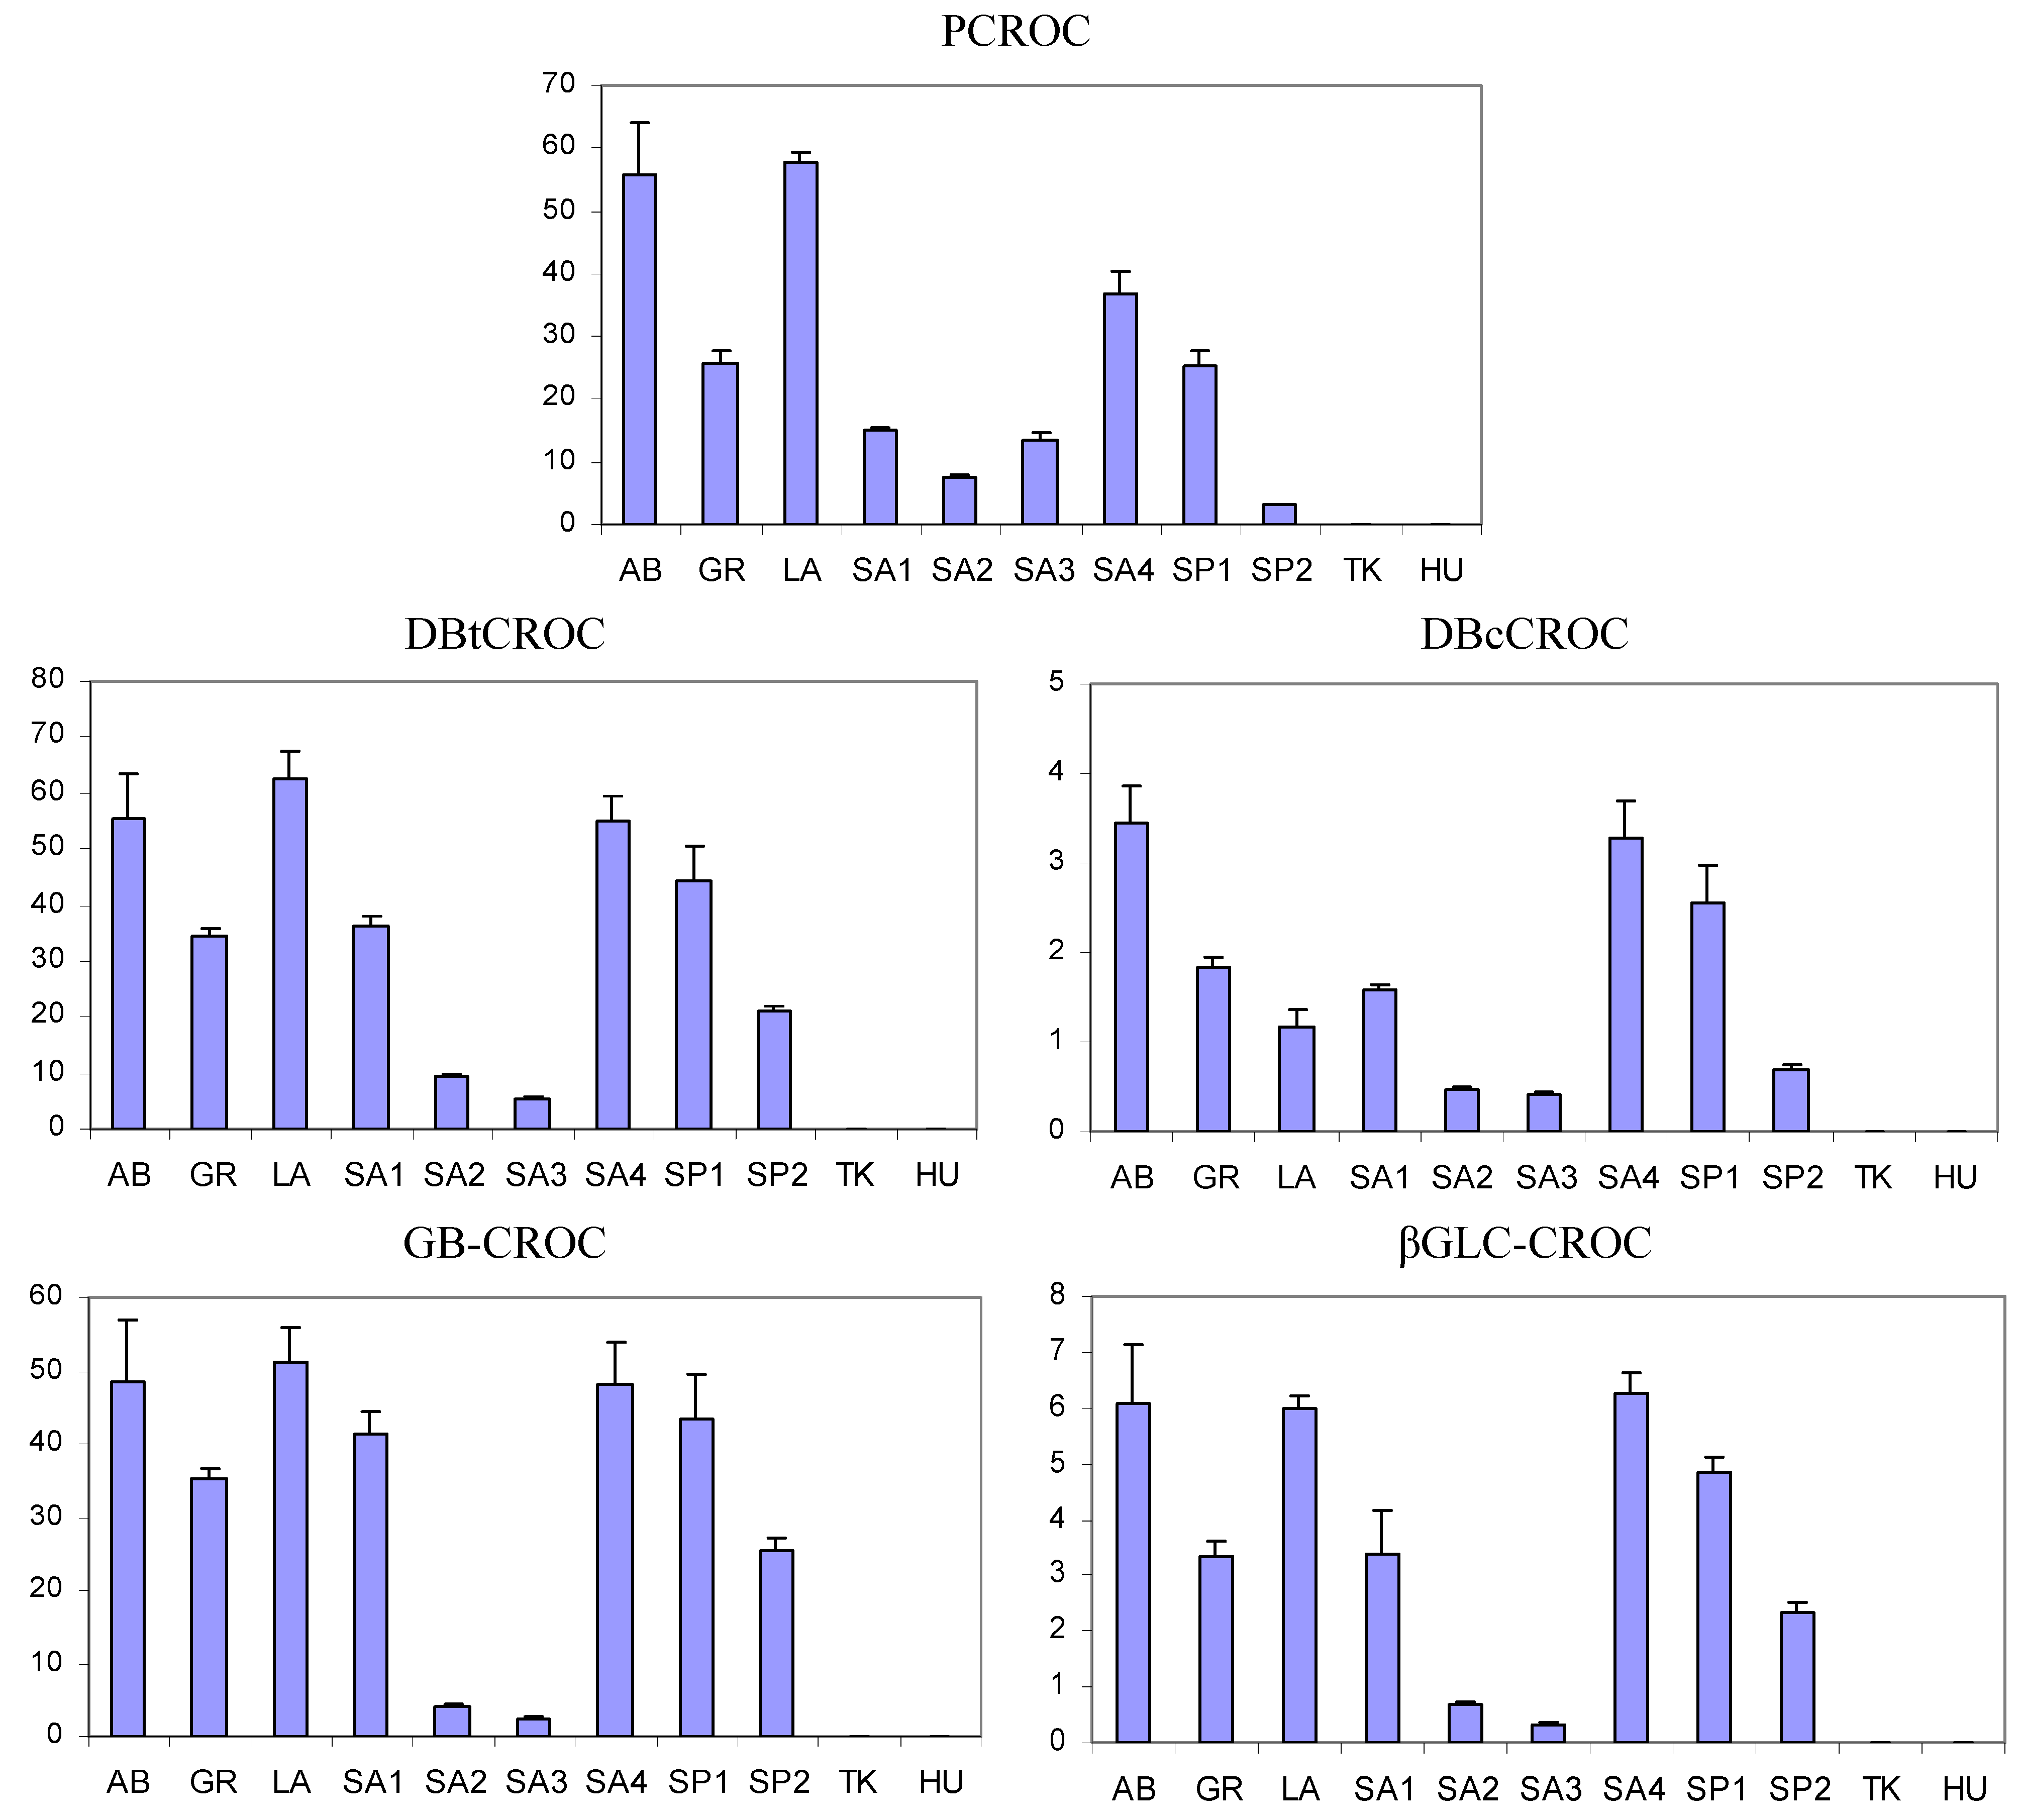
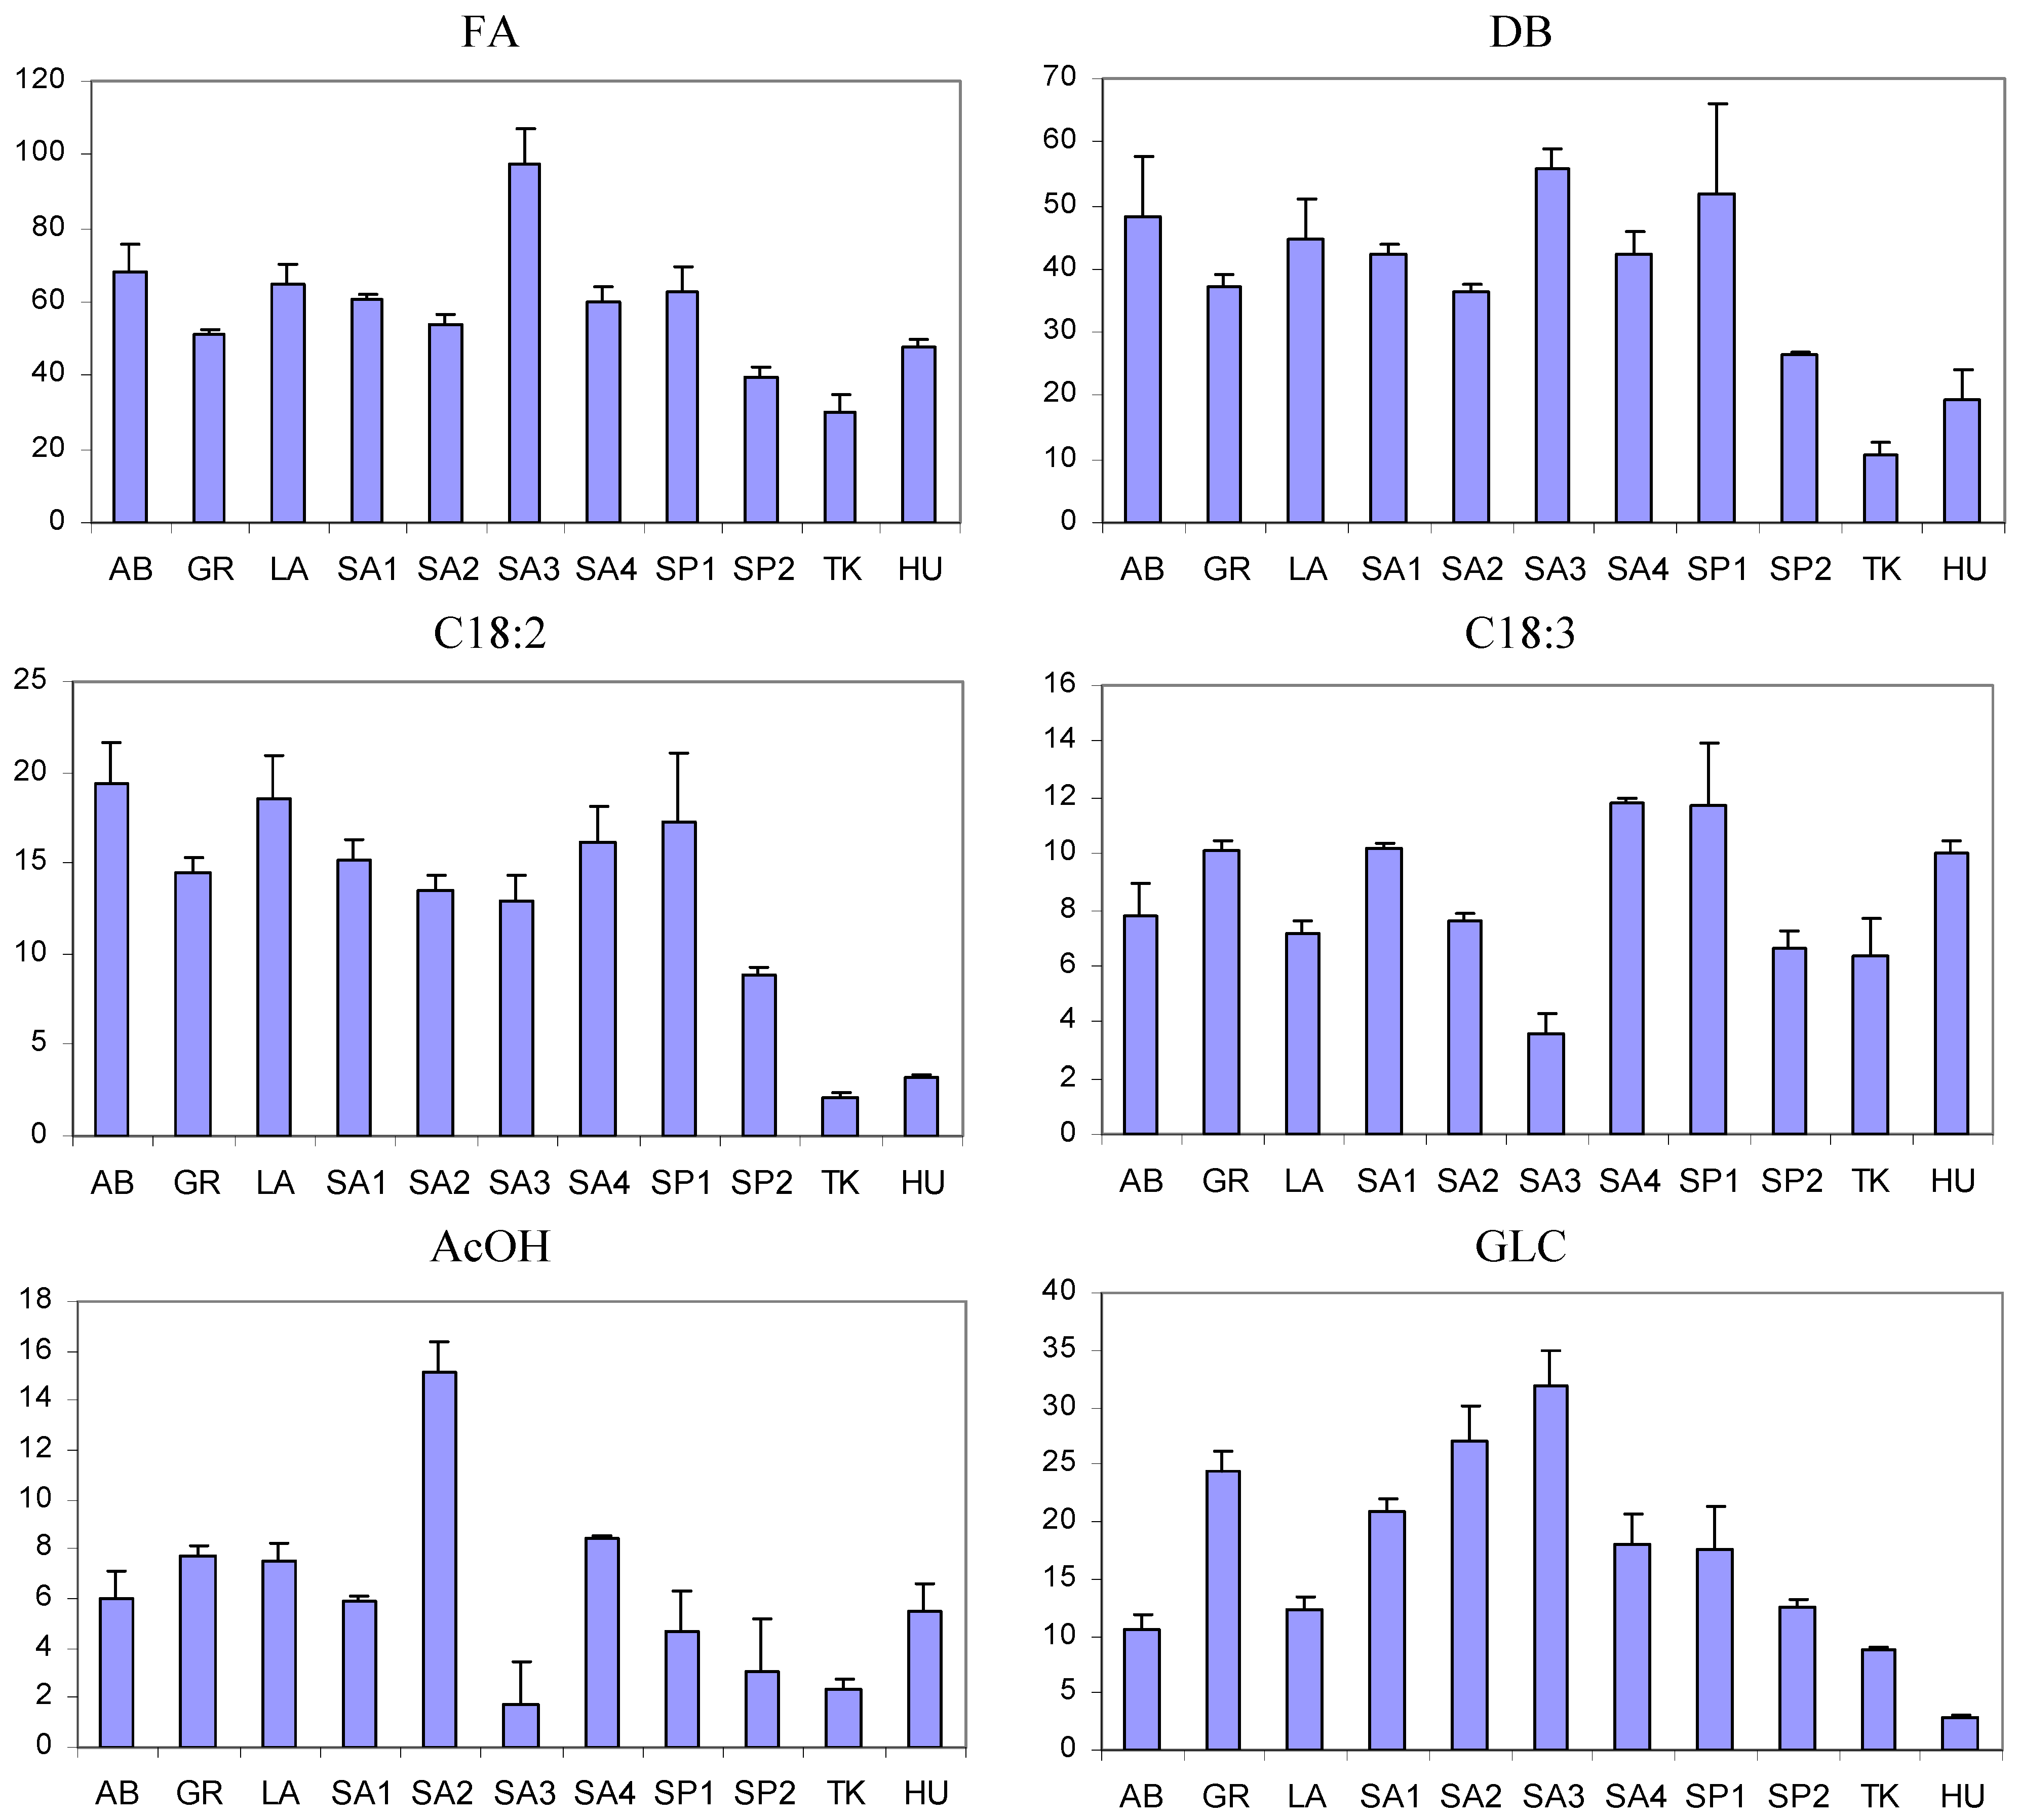
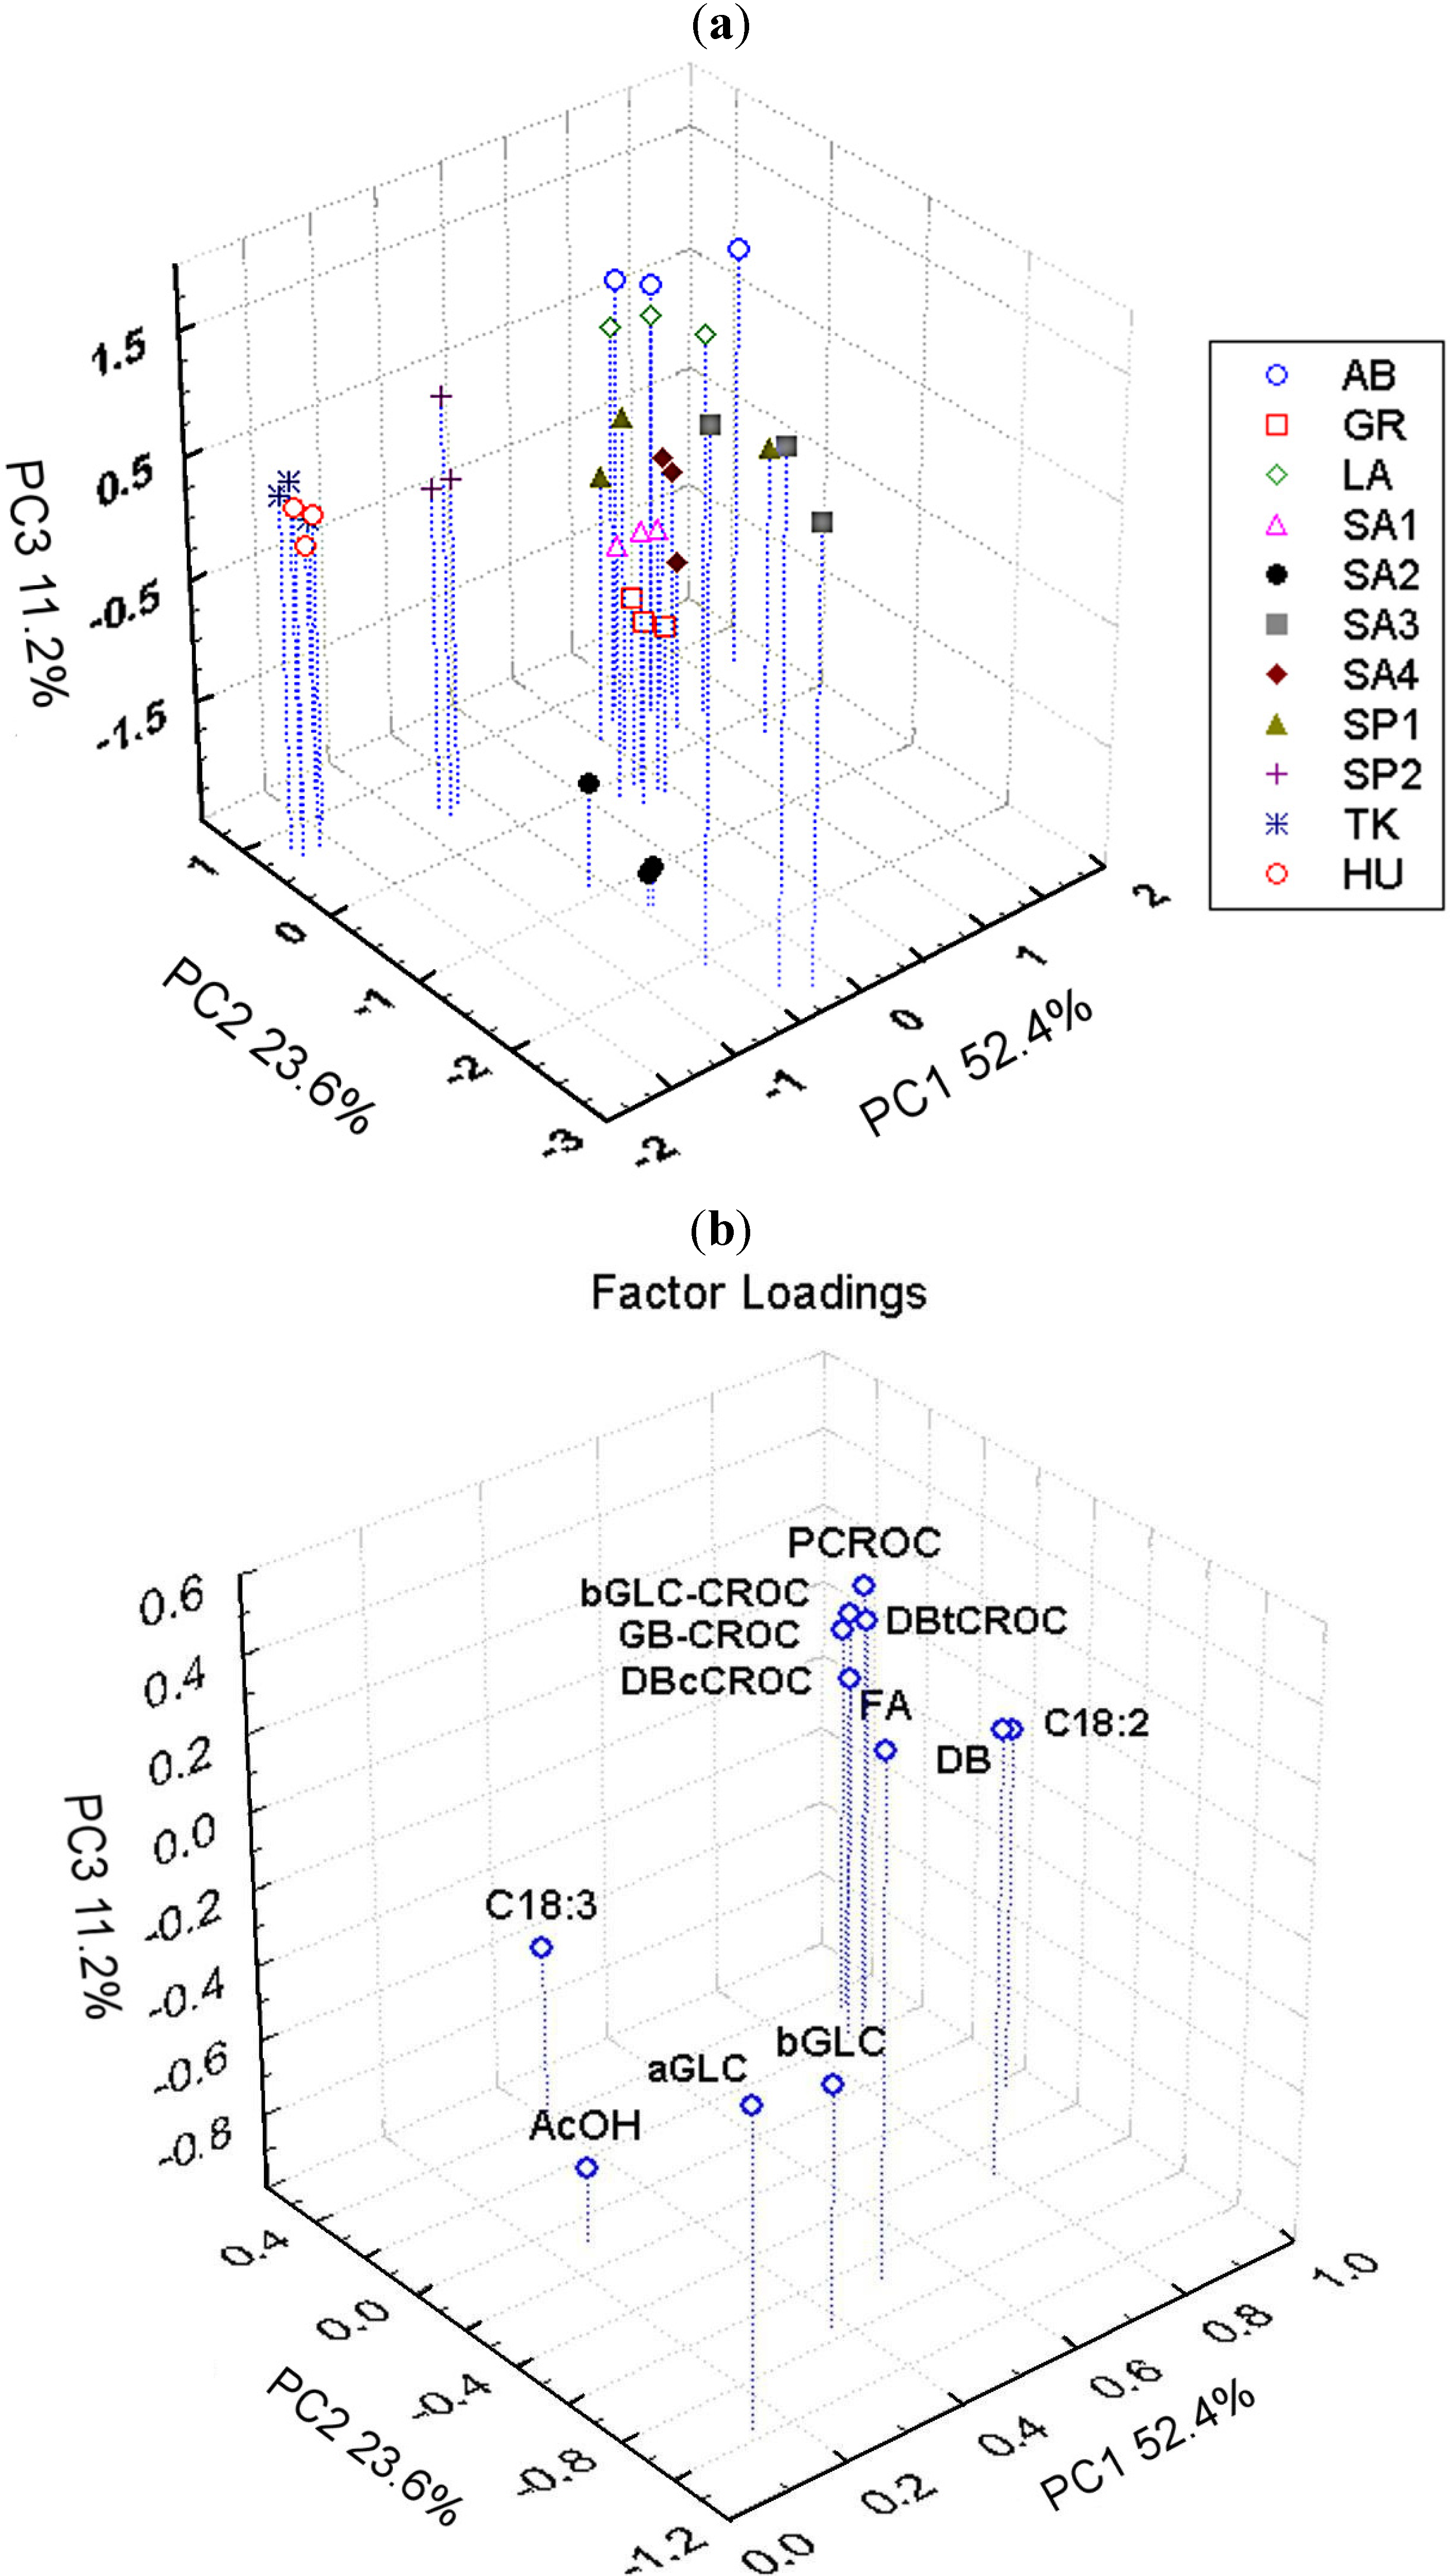
3.3. Comparison between Saffron Samples of Different Geographical Origin

The metabolic profiles of saffron extracts of different geographical origin and distinct production showed important dissimilarities, as evidenced in the histograms reported in Figure 4 and Figure 5 and in the PCA plots reported in Figure 6. In particular, as far as PCA is concerned, three components were evaluated to be significant according to an 11-fold cross-validation procedure, where, in each split, all the replicates of each sample were left out. The PCA applied to the integral of 12 selected 1H resonances shows that samples are grouped according to their geographical origin and specific production sites. The first three PCs account for 87.2% of the variability within the data, PC1 providing 52.4%, PC2 23.6% and PC3 11.2%.
The distribution of sample scores along the PC1 axis (the most important variability factor) seems to be reflected by the content of picrocrocin and crocetin esters (crocins), the main components of genuine saffron spice. In fact, saffron samples with the lowest PC1 scores are from Hungary (HU) and Turkey (TK), where these components were not detected, and they are well separated from all other samples. It is possible to hypothesize that HU and TK samples are not saffron samples. The samples with the highest PC1 scores were the certified AB (Abruzzi) PDO samples, commercial LA (Latium) ones and PDO samples SA4 (Sardinia) with the highest content of picrocrocin and crocins; see Figure 4. Other samples from Sardinia, Greece and Spain are in between these extremes.
The distribution of samples along PC2 and PC3 axes was due to the different content of other metabolites, such as glucose, AcOH and FA. FA and GLC are particularly abundant in the SA3 sample, which, in turn, is poor in AcOH, PCROC and crocins; see Figure 4, Figure 5 and Figure 6b. The samples from the same geographical area (Sardinia or Spain), but from different local producers were also separated in PCA plots, suggesting the importance of crop production technology together with environmental factors for the metabolite composition.
Figure 4. Histograms relative to the intensity of the selected metabolites (arbitrary units); see Table 1 and Table 2 for the abbreviations. Mean values and standard deviations for each metabolite are reported.
Foods 03 00403 g004
The analysis of histograms in Figure 4 showed that five variables due to picrocrocin and crocins were highly correlated. The correlation is also evidenced by the closeness of the PCA loadings of these five variables; see Figure 6b. The correlation between DBtCROC, DBcCROC, GB-CROC and bGLC- CROC due to the aglycone and glycosidic moieties of crocins was expected, because they in fact belong to the same type of molecules, i.e., glycosyl esters of crocetin. The correlation of DBtCROC, DBcCROC, GB-CROC, bGLC-CROC with picrocrocin is quite unexpected. This probably indicates the correlated metabolic pathways of biosynthesis of picrocrocin and crocins. The correlation between all trans crocetin and 13-cis-crocetin moieties of crocins is not perfect, as can be seen from the ratio DBtCROC/DBcCROC reported in Table 3. In the case of LA samples, this ratio is two or three times higher than in other samples.
The results of NMR analysis and PCA can be applied to the estimation of the quality of saffron samples. According to ISO specifications [13], there are four quality categories of spice, ranging mainly according to the content of picrocrocin and crocins measured by UV-Vis spectrophotometry. The first category, with the highest quality, is characterized by the highest contents of these specific components. The content of picrocrocin and crocins can be directly measured by NMR spectroscopy, and therefore, the NMR analysis is suitable for spice quality determination, as well. The samples analyzed in this study can be ranked according to picrocrocin and crocins content and, therefore, their quality. AB PDO samples, LA ones and PDO samples SA4 have higher quality than other samples. HU and TK samples where no picrocrocin or crocins were detected were probably adulterated.
Figure 5. Histograms relative to the intensity of selected metabolites (arbitrary units); see Table 1 and Table 2 for abbreviations. Mean values and standard deviations for each metabolite are reported.
Foods 03 00403 g005
Figure 6. (a) PCA performed on 12 metabolite levels measured in saffron extracts of different geographical origin sample scores plot; (b) PCA plot of loadings.
Foods 03 00403 g006
Table 3. Medium DBtCROC/DBcCROC ratio.
Sample codeDBtCROC/DBcCROC
AB16.0
GR18.7
LA54.2
SA122.8
SA219.8
SA312.8
SA417.3
SP117.3
SP230.2
TKn.d.
HUn.d.
n.d.: not determined.

4. Conclusions

An NMR-based approach is proposed to characterize saffron extracts of different origin after microwave-assisted extraction. Taking into account the higher variability of the content of the spice constituents, which is probably influenced by the environment and the crop production technology, a proper analytical method is important for monitoring the quality of the product. Metabolite profiling could be used by the producer, either to standardize the production in order to obtain the same product every year or to optimize the crop production conditions.

Acknowledgments

This work has been carried out within the Ateneo2013 project “Alimenti di origine vegetale a elevato valore nutrizionale-funzionale: analisi del profilo metabolico e studio della digestione e degli effetti di trattamenti tecnologici di produzione sul contenuto di nutrienti e nutraceutici” using the facilities of MetabUnit-Rome.

Author Contributions

Luisa Mannina wrote the manuscript. Anatoly P. Sobolev did the NMR assignment of NMR spectra and optimized the setup spectral condition. Simone Carradori did the MAE extraction. Donatella Capitani was responsible for the Laboratory of Magnetic Resonance “Annalaura Segre” and was the supervisor of NMR section. Silvia Vista and Agata Trella did the NMR spectra and statistical analysis. Federico Marini supervised the chemometric data analysis.

Conflicts of Interest

The authors declare no conflict of interest.

References

  1. Melnyk, J.P.; Wang, S.; Marcone, M.F. Chemical and biological properties of the world’s most expensive spice: Saffron. Food Res. Int. 2010, 43, 1981–1989. [Google Scholar] [CrossRef]
  2. De Monte, C.; Carradori, S.; Chimenti, P.; Secci, D.; Mannina, L.; Alcaro, F.; Petzer, A.; N’Da, C.I.; Gidaro, M.C.; Costa, G.; et al. New insights into the biological properties of Crocus sativus L.: Chemical modifications, human monoamine oxidases inhibition and molecular modeling studies. Eur. J. Med. Chem. 2014, 82, 164–171. [Google Scholar] [CrossRef]
  3. Moshiri, M.; Vahabzadeh, M.; Hosseinzadeh, H. Clinical applications of Saffron (Crocus sativus) and its constituents: A review. Drug Res. (Stuttg.) 2014, in press. [Google Scholar]
  4. Bisti, S.; Maccarone, R.; Falsini, B. Saffron and retina: Neuroprotection and pharmacokinetics. Vis. Neurosci. 2014, in press. [Google Scholar]
  5. Samarghandian, S.; Borji, A. Anticarcinogenic effect of saffron (Crocus sativus L.) and its ingredients. Pharmacognosy Res. 2014, 6, 99–107. [Google Scholar] [CrossRef]
  6. Kim, S.H.; Lee, J.M.; Kim, S.C.; Park, C.B.; Lee, P.C. Proposed cytotoxic mechanisms of the saffron carotenoids crocin and crocetin on cancer cell lines. Biochem. Cell Biol. 2014, 92, 105–111. [Google Scholar]
  7. Maggi, L.; Carmona, M.; del Campo, C.P.; Kanakis, C.D.; Anastasaki, E.; Tarantilis, P.A.; Polissiou, M.G.; Alonso, G.L. Worldwide market screening of saffron volatile composition. J. Sci. Food Agric. 2009, 89, 1950–1954. [Google Scholar] [CrossRef]
  8. Zalacain, A.; Ordoudi, S.A.; Díaz-Plaza, E.M.; Carmona, M.; Blázquez, I.; Tsimidou, M.Z.; Alonzo, G.L. Near-Infrared spectroscopy in saffron quality control: Determination of chemical composition and geographical origin. J. Agric. Food Chem. 2005, 53, 9337–9341. [Google Scholar]
  9. Zougagh, M.; Ríos, A.; Valcárcel, M. Determination of total safranal by in situ acid hydrolysis in supercritical fluid media: Application to the quality control of commercial saffron. Anal. Chim. Acta 2006, 578, 117–121. [Google Scholar] [CrossRef]
  10. Zougagh, M.; Simonet, B.M.; Ríos, A.; Valcárcel, M. Use of non-aqueous capillary electrophoresis for the quality control of commercial saffron samples. J. Chromatogr. A 2005, 1085, 293–298. [Google Scholar] [CrossRef]
  11. Maggi, L.; Carmona, M.; Kelly, S.D.; Marigheto, N.; Alonso, G.L. Geographical origin differentiation of saffron spice (Crocus sativus L. stigmas)—Preliminary investigation using chemical and multi-element (H, C, N) stable isotope analysis. Food Chem. 2011, 128, 543–548. [Google Scholar]
  12. Yilmaz, A.; Nyberg, N.T.; Mølgaard, P.; Asili, J.; Jaroszewski, J.W. 1H NMR metabolic fingerprinting of saffron extracts. Metabolomics 2010, 6, 511–517. [Google Scholar]
  13. International Organization for Standardization (ISO). Saffron (Crocus sativus Linnaeus). Pt 1: Specifications. Pt 2: Test Methods; ISO: Geneva, Switzerland, 1993. [Google Scholar]
  14. Caballero-Ortega, H.; Pereda-Miranda, R.; Abdullaev, F.I. HPLC quantification of major active components from 11 different saffron (Crocus sativus L.) sources. Food Chem. 2007, 100, 1126–1131. [Google Scholar]
  15. Koulakiotis, N.S.; Pittenauer, E.; Halabalaki, M.; Tsarbopoulos, A.; Allmaier, G. Comparison of different tandem mass spectrometric techniques (ESI-IT, ESI- and IP-MALDI-QRTOF and vMALDI-TOF/RTOF) for the analysis of crocins and picrocrocin from the stigmas of Crocus sativus L. Rapid Commun. Mass Spectrom. 2012, 26, 670–678. [Google Scholar] [CrossRef]
  16. Zhang, H.-F.; Yang, X.-H.; Wang, Y. Microwave assisted extraction of secondary metabolites from plants: Current status and future directions. Trends Food Sci. Technol. 2011, 22, 672–688. [Google Scholar] [CrossRef]
  17. Mannina, L.; Sobolev, A.P.; Viel, S. Liquid state 1H high field NMR in food analysis. Progr. Nucl. Magn. Reson. Spectrosc. 2012, 66, 1–39. [Google Scholar] [CrossRef]
  18. Capitani, D.; Mannina, L.; Proietti, N.; Sobolev, A.P.; Tomassini, A.; Miccheli, A.; di Cocco, M.; Capuani, G.; de Salvador, F.R.; Delfini, M. Monitoring of metabolic profiling and water status of Hayward kiwifruits by nuclear magnetic resonance. Talanta 2010, 82, 1826–1838. [Google Scholar] [CrossRef]
  19. Capitani, D.; Sobolev, A.P.; Tomassini, A.; Sciubba, F.; de Salvador, F.R.; Mannina, L.; Delfini, M. Peach fruit: Metabolic comparative analysis of two varieties with different resistances to insect attacks by NMR spectroscopy. J. Agric. Food Chem. 2013, 61, 1718–1726. [Google Scholar] [CrossRef]
  20. Capitani, D.; Sobolev, A.P.; Delfini, M.; Vista, S.; Antiochia, R.; Proietti, N.; Bubici, S.; Ferrante, G.; Carradori, S.; de Salvador, F.R.; Mannina, L. NMR methodologies in the analysis of blueberries. Electrophoresis 2014, 35, 1615–1626. [Google Scholar] [CrossRef]
  21. Mannina, L.; Sobolev, A.P. High resolution NMR characterization of olive oils in terms of quality, authenticity and geographical origin. Magn. Reson. Chem. 2011, 49, S3–S11. [Google Scholar] [CrossRef]
  22. Mannina, L.; Sobolev, A.P.; Capitani, D.; Iaffaldano, N.; Rosato, M.P.; Ragni, P.; Reale, A.; Sorrentino, E.; D’Amico, I.; Coppola, R. NMR metabolic profiling of organic and aqueous sea bass extracts: Implications in the discrimination of wild and cultured sea bass. Talanta 2008, 77, 433–444. [Google Scholar] [CrossRef]
  23. Savorani, F.; Picone, G.; Badiani, A.; Fagioli, P.; Capozzi, F.; Engelsen, S.B. Metabolic profiling and aquaculture differentiation of gilthead sea bream by 1H NMR metabonomics. Food Chem. 2010, 120, 907–914. [Google Scholar] [CrossRef]
  24. Straubinger, M.; Bau, B.; Eckstein, S.; Fink, M.; Winterhalter, P. Identification of novel glycosidic aroma precursors in saffron (Crocus sativus L.). J. Agric. Food Chem. 1998, 46, 3238–3243. [Google Scholar] [CrossRef]
  25. Assimiadis, M.A.; Tarantilis, P.A.; Polissiou, M.G. UV-Vis, FT-Raman, and 1H NMR spectroscopies of cis-trans carotenoids from saffron (Crocus sativus L.). Appl. Spectros. 1998, 52, 519–522. [Google Scholar] [CrossRef]
  26. Van Calsteren, M.R.; Bissonnette, M.C.; Cormier, F.; Dufresne, C.; Ichi, T.; LeBlanc, J.C.Y.; Perreault, D.; Roewer, I. Spectroscopic characterization of crocetin derivatives from Crocussativus and Gardenia jasminoides. J. Agric. Food Chem. 1997, 45, 1055–1061. [Google Scholar]
  27. Braun, S.; Kalinowski, H.O.; Berger, S. 150 and More Basic NMR Experiments, 2nd ed.; Wiley-VCH: Weinheim, Germany, 1998. [Google Scholar]
  28. Mannina, L.; Cristinzio, M.; Sobolev, A.P.; Ragni, P.; Segre, A.L. High-field NMR study of truffles (Tuber aestivum vittadini). J. Agric. Food Chem. 2004, 52, 7988–7996. [Google Scholar] [CrossRef]
  29. Johnson, C.S., Jr. Diffusion ordered nuclear magnetic resonance spectroscopy: Principles and applications. Progr. Nucl. Magn. Reson. Spectrosc. 1999, 34, 203–256. [Google Scholar] [CrossRef]
  30. Lage, M.; Cantrell, C.L. Quantification of saffron (Crocus sativus L.) metabolites crocins, picrocrocin and safranal for quality determination of the spice grown under different environmental Moroccan conditions. Sci. Hortic. 2009, 121, 366–373. [Google Scholar] [CrossRef]

