Composition and Statistical Analysis of Biophenols in Apulian Italian EVOOs

 , and
, and 
Abstract
:
1. Introduction
2. Materials and Methods
2.1. Chemicals
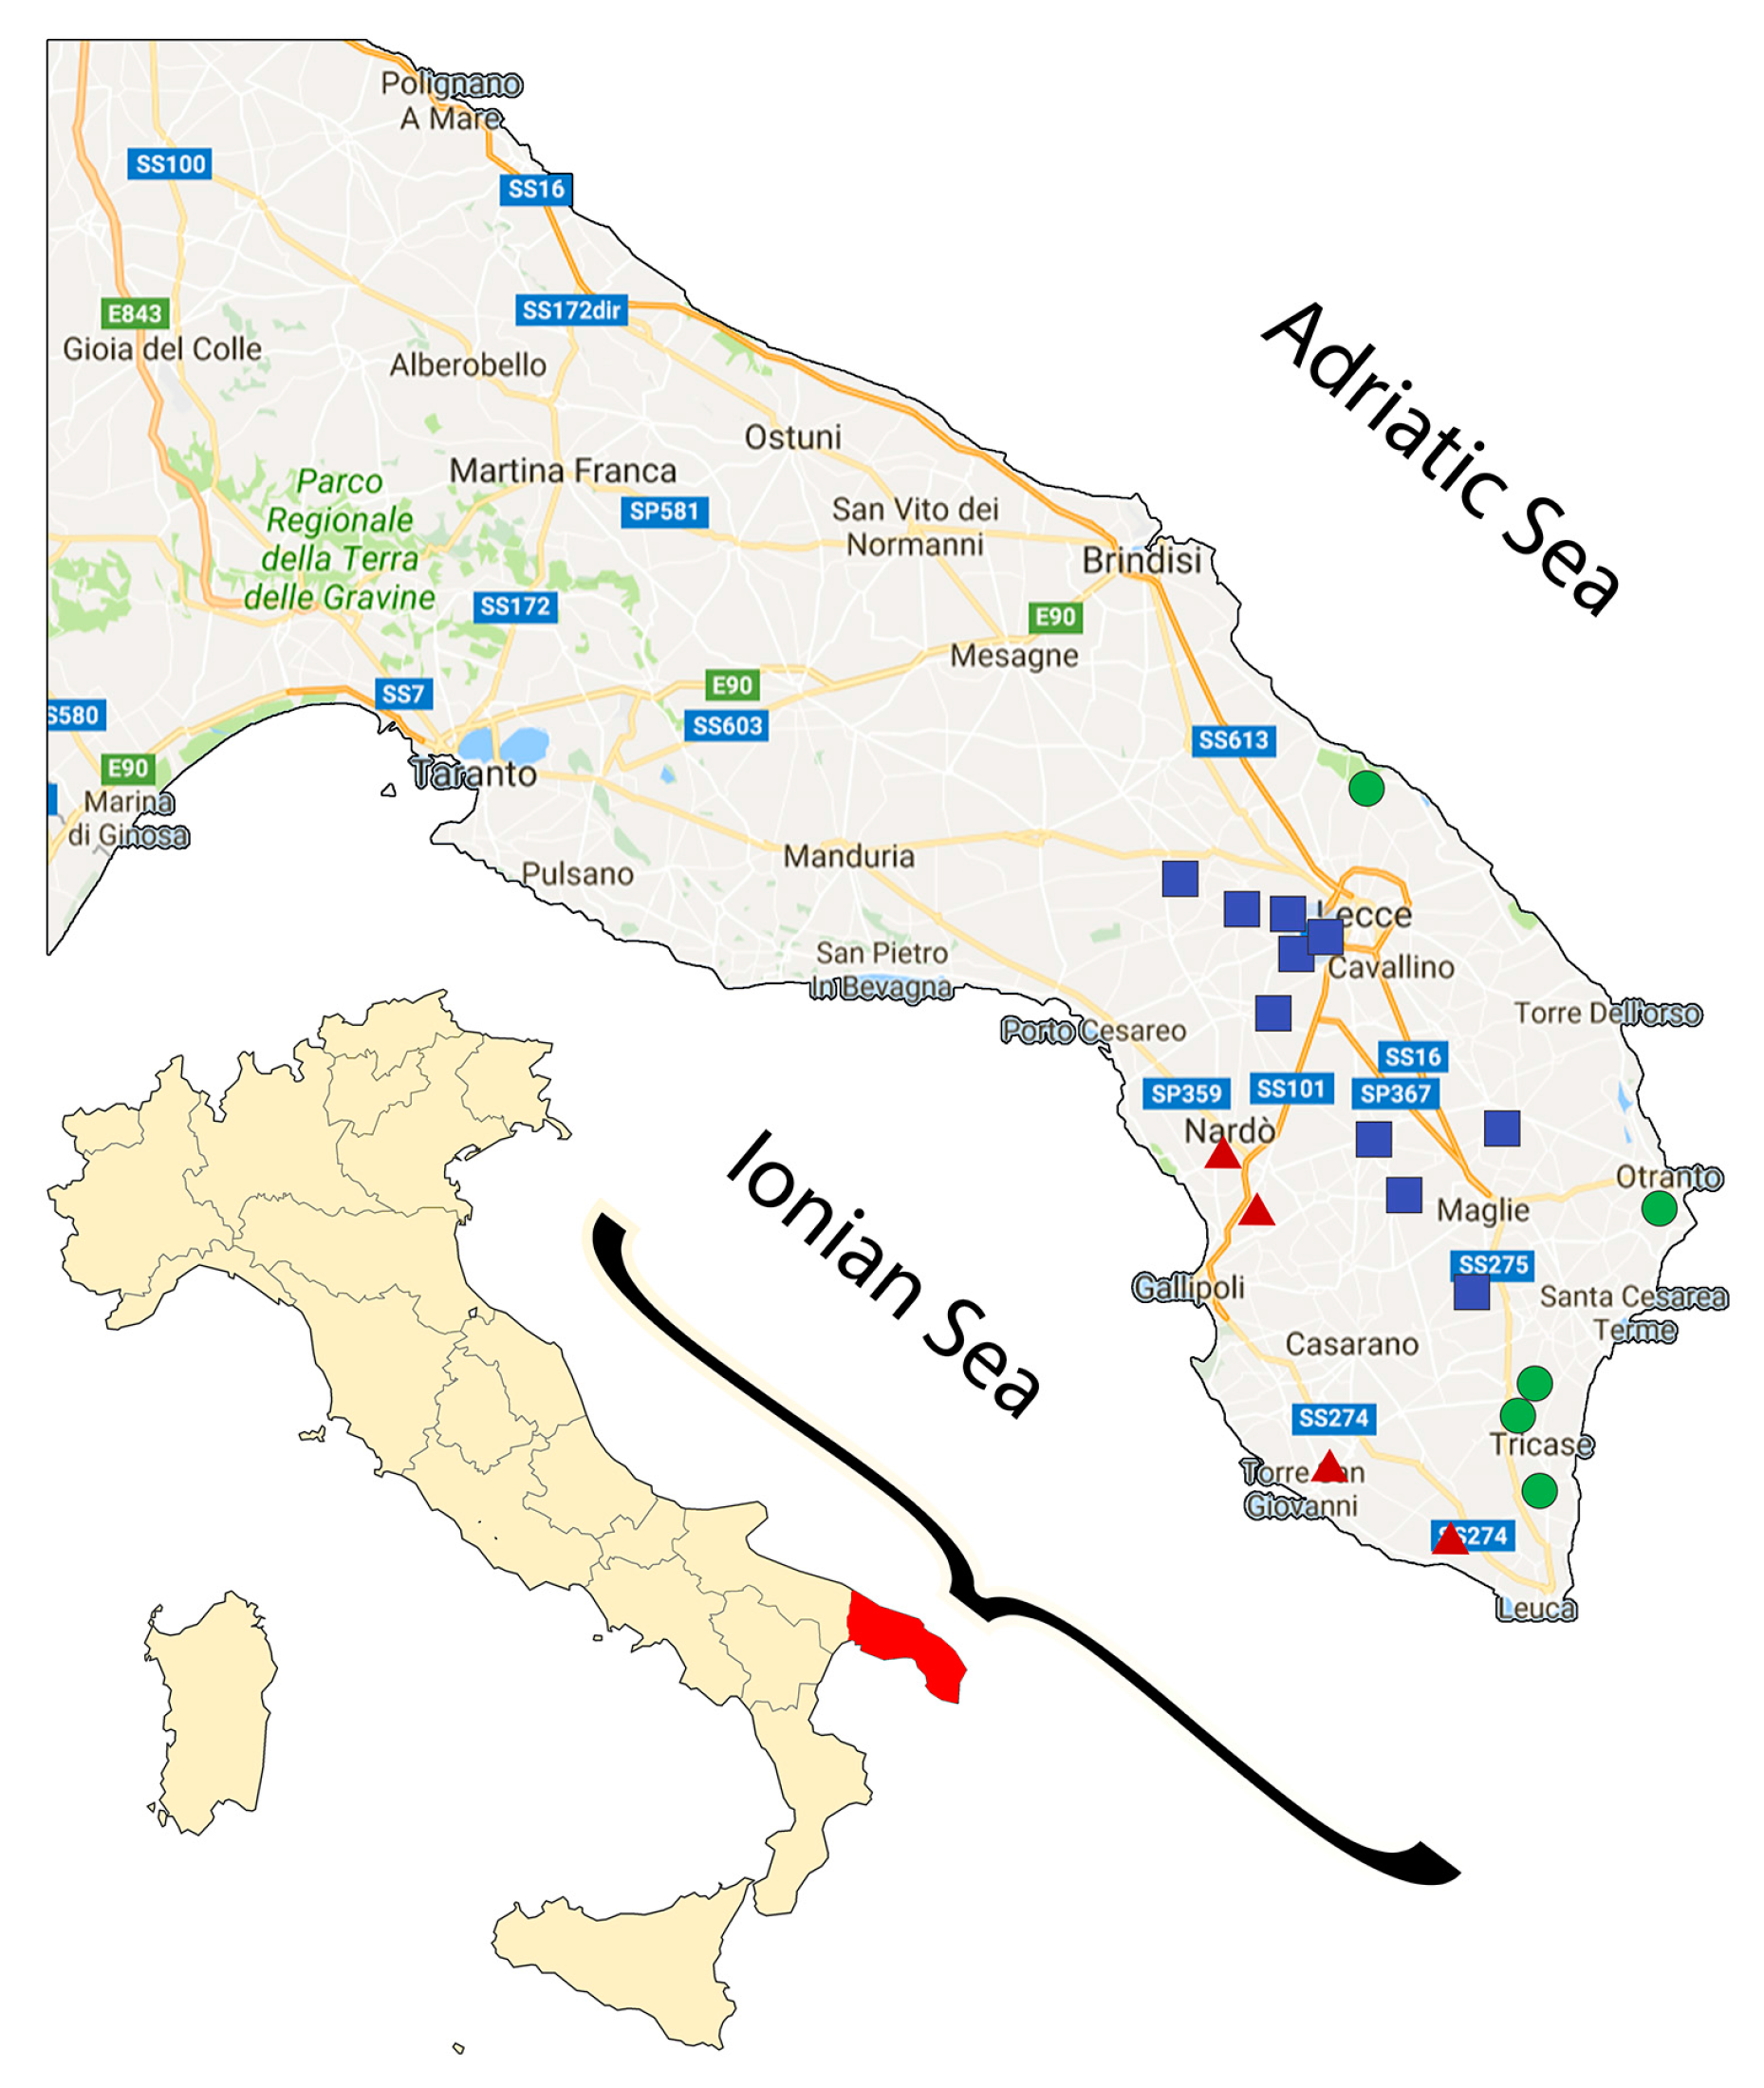
2.2. Samples
2.3. HPLC Analysis
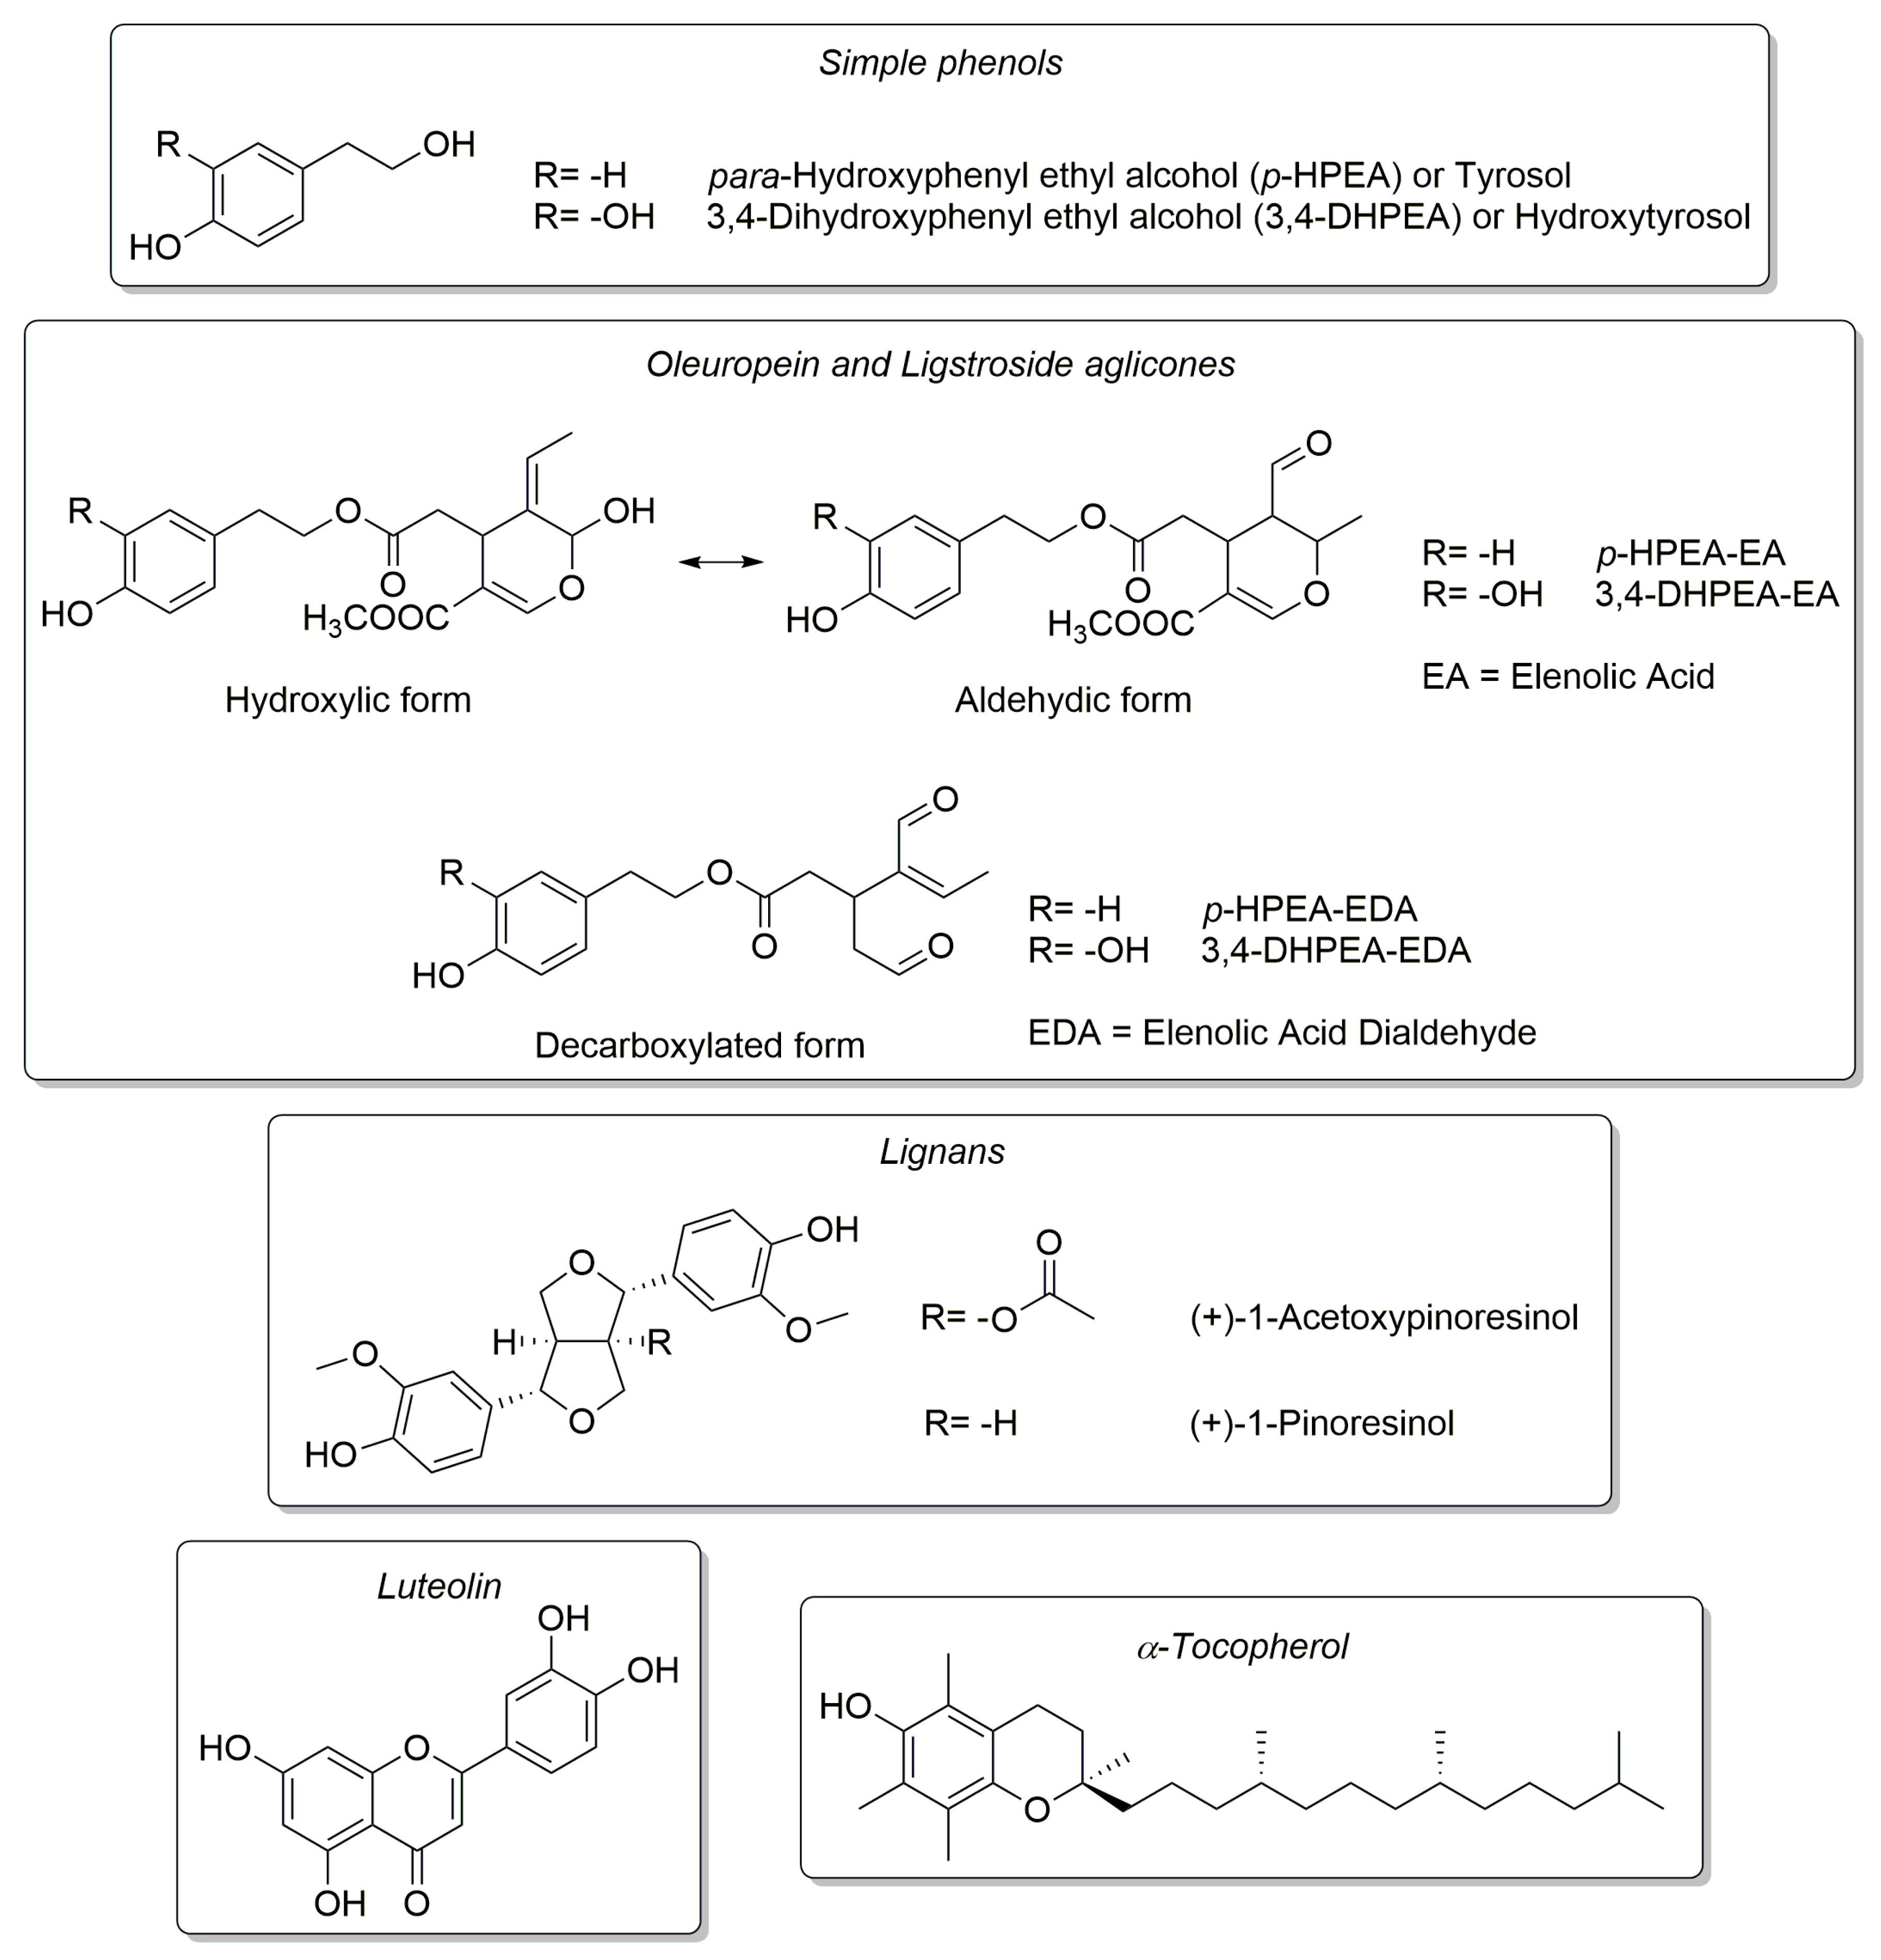
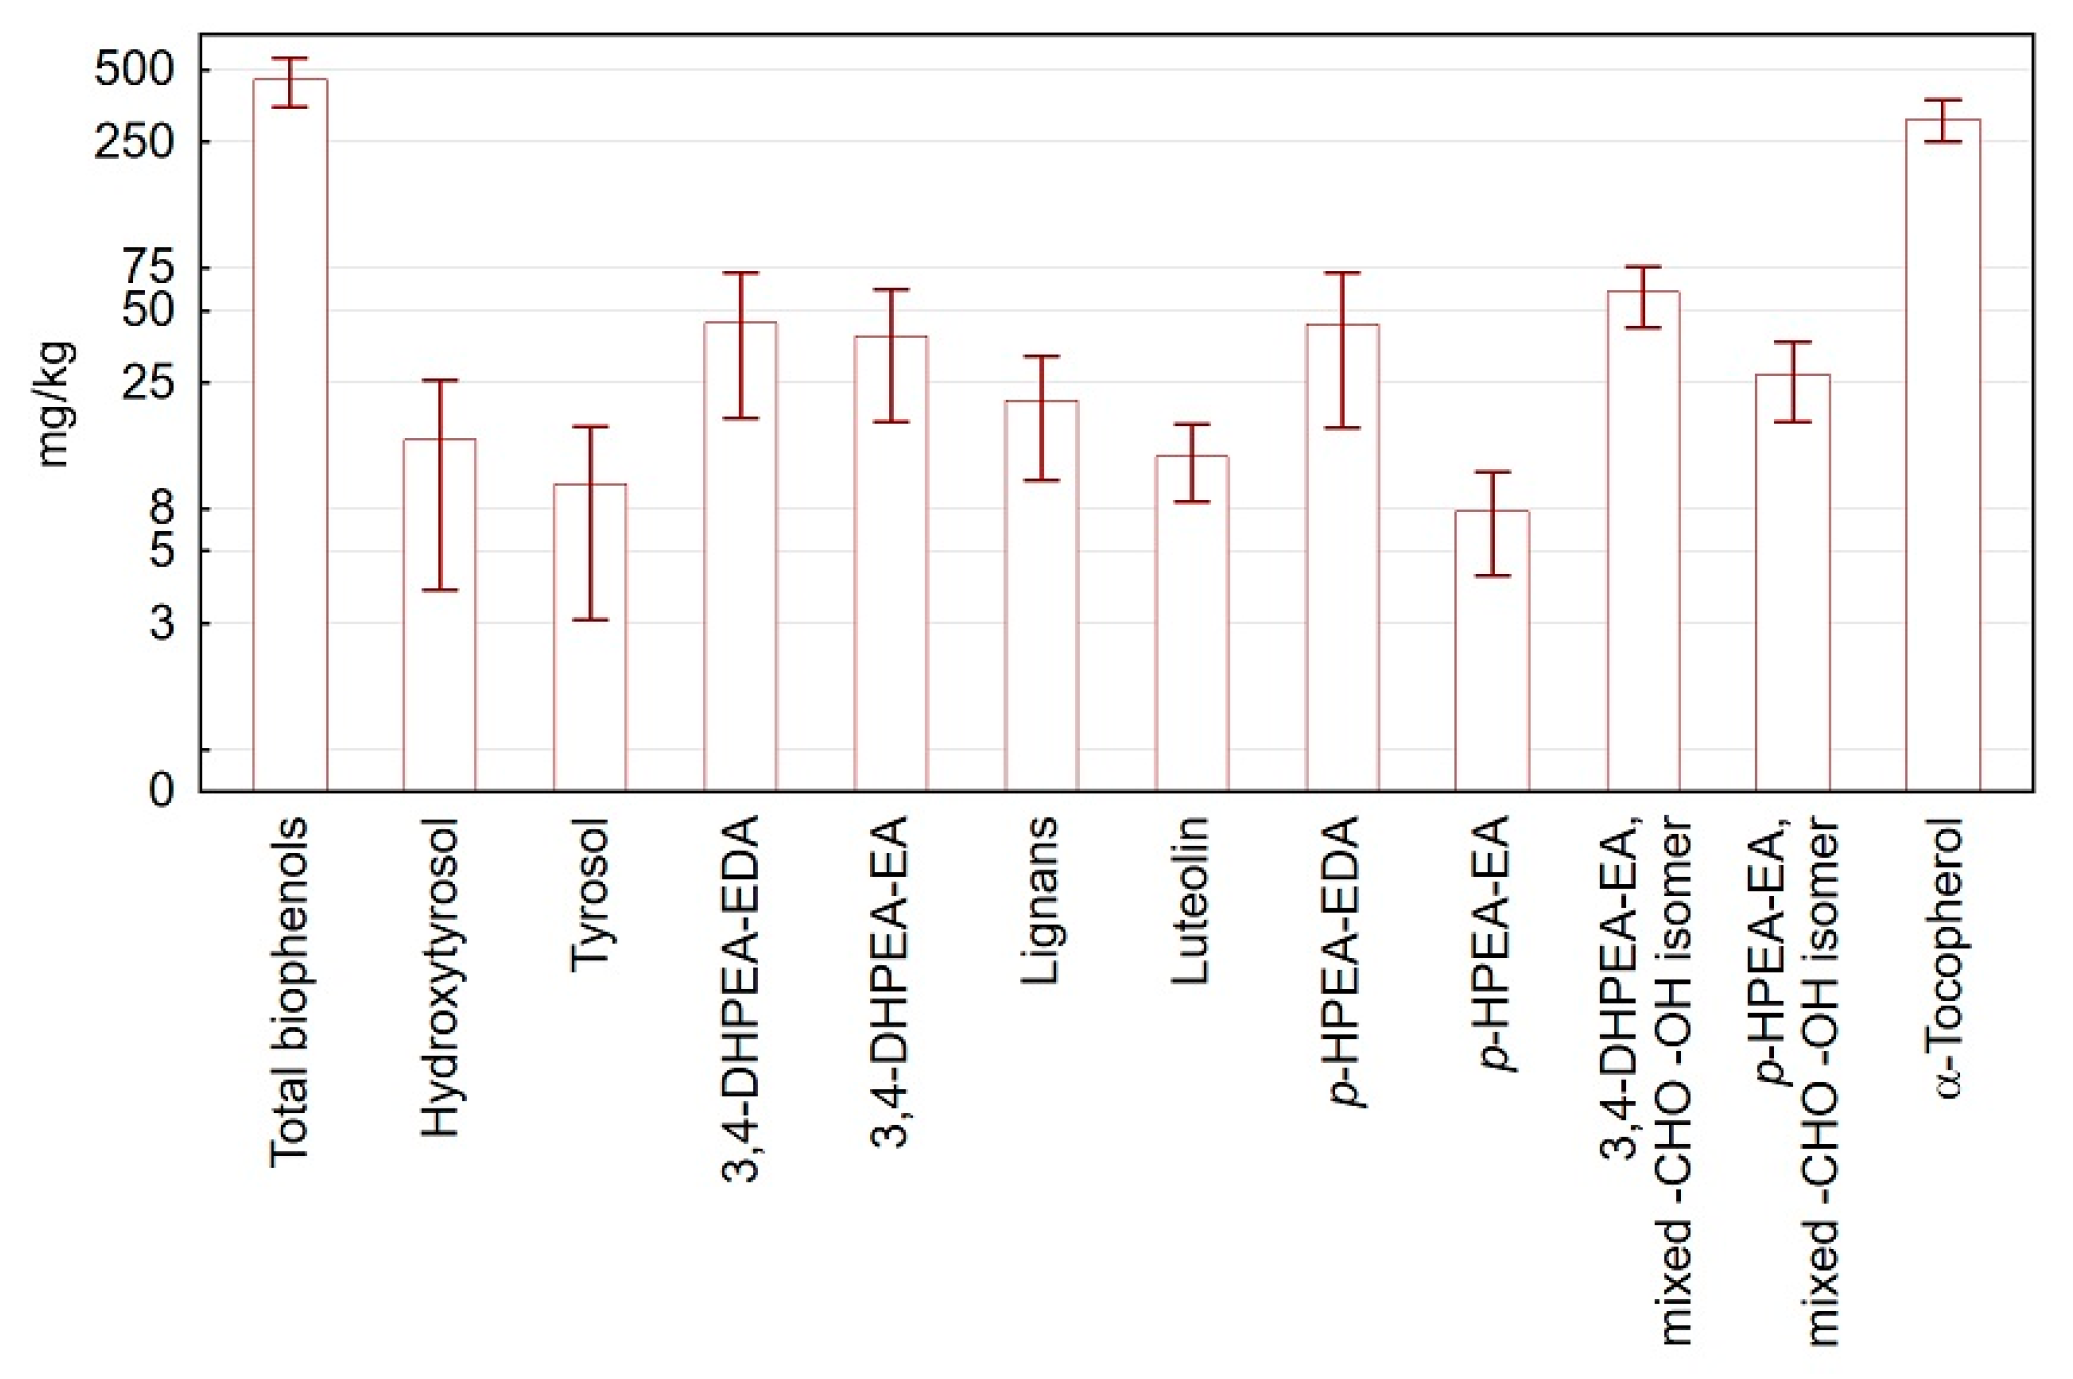
2.3.1. Analysis of the Phenolic Compounds
2.3.2. Analysis of α-Tocopherol
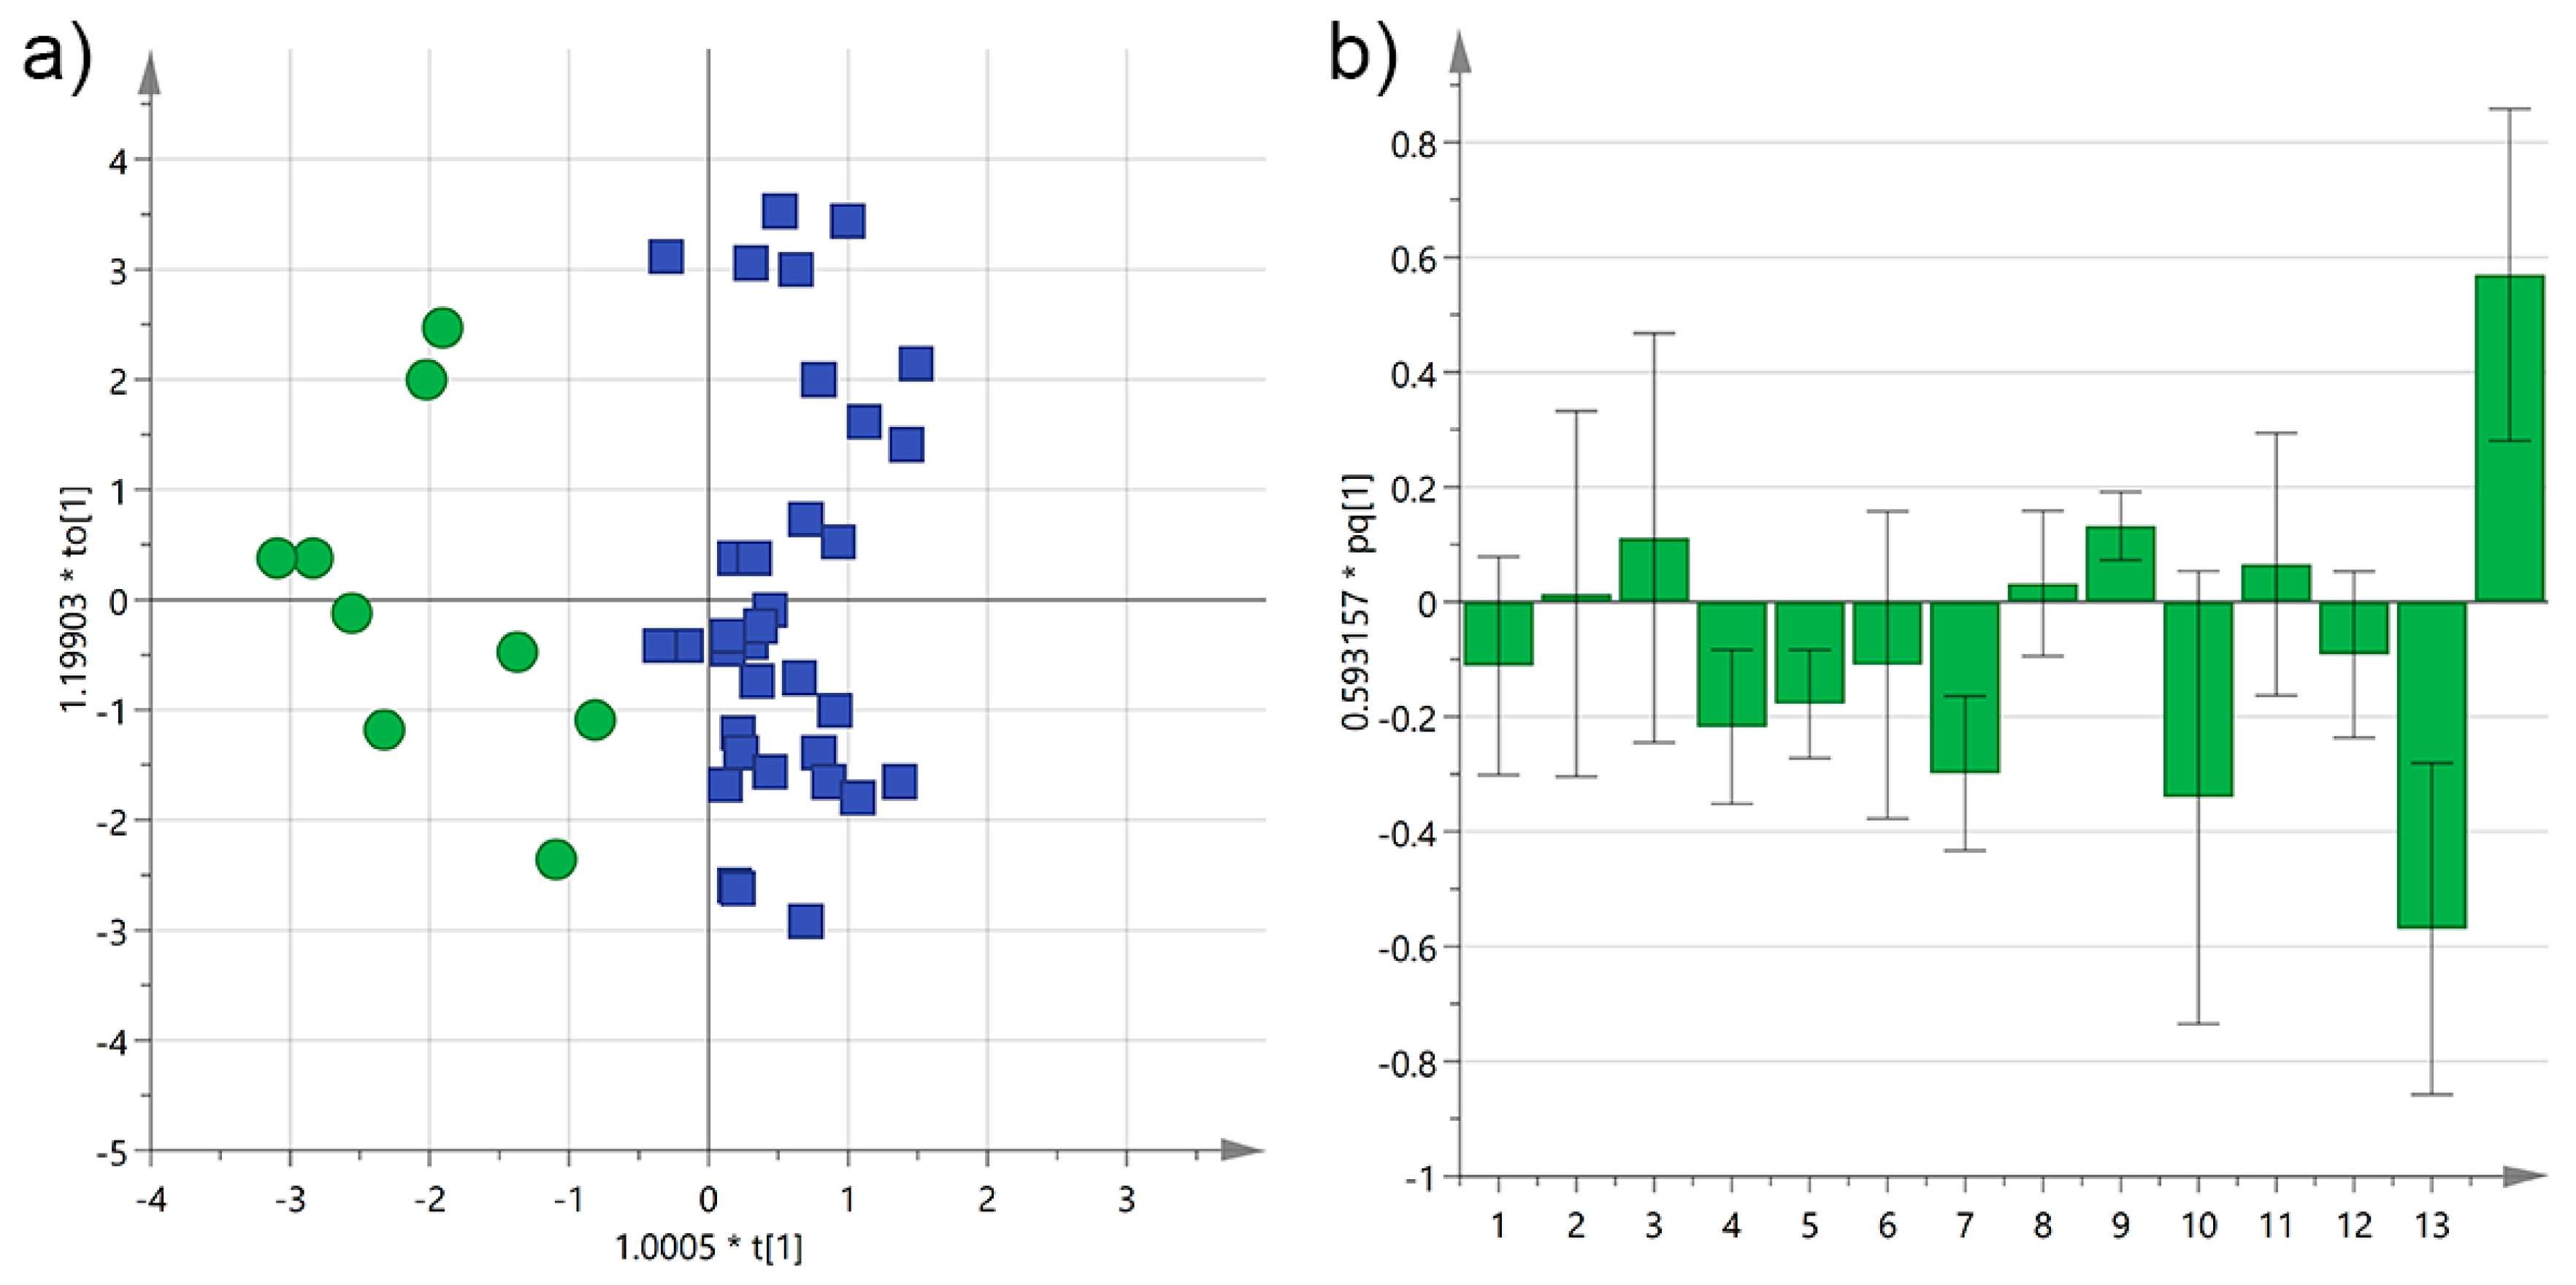
2.4. Statistical Analysis
3. Results and Discussion
3.1. Analysis by Cultivar
3.2. Analysis by Interval Time between Harvesting and Milling
3.3. Analysis by the Age of the Olive Trees
3.4. Analysis by the Cultivation Area
3.5. Analysis by PDO Certification
4. Conclusions
Acknowledgments
Author Contributions
Conflicts of Interest
References
- Obied, H.K.; Prenzler, P.D.; Omar, S.H.; Ismael, R.; Servili, M.; Esposto, S.; Taticchi, A.; Selvaggini, R.; Urbani, S. Pharmacology of olive biophenols. In Advances in Molecular Toxicology; Fishbein, J.C., Heilman, J.M., Eds.; Elsevier: Amsterdam, The Netherlands, 2012; pp. 195–242. ISBN 1872-0854. [Google Scholar]
- Boskou, D.; Blekas, G.; Tsimidou, M. Olive Oil Composition. In Olive Oil: Chemistry and Technology; Boskou, D., Ed.; AOCS Press: Champaign, IL, USA, 2006; pp. 41–72. ISBN 978-1893997882. [Google Scholar]
- Cunha, S.C.; Amaral, J.S.; Fernandes, J.O.; Oliveira, M.B.P.P. Quantification of tocopherols and tocotrienols in Portuguese olive oils using HPLC with three different detection systems. J. Agric. Food Chem. 2006, 54, 3351–3356. [Google Scholar] [CrossRef] [PubMed]
- Baldioli, M.; Servili, M.; Perretti, G.; Montedoro, G.F. Antioxidant activity of tocopherols and phenolic compounds of virgin olive oil. J. Am. Oil Chem. Soc. 1996, 73, 1589–1593. [Google Scholar] [CrossRef]
- Del Coco, L.; Schena, F.P.; Fanizzi, F.P. 1H Nuclear magnetic resonance study of olive oils commercially available as Italian products in the United States of America. Nutrients 2012, 4, 343–355. [Google Scholar] [CrossRef] [PubMed]
- Caponio, F.; Alloggio, V.; Gomes, T. Phenolic compounds of virgin olive oil: Influence of paste preparation techniques. Food Chem. 1999, 64, 203–209. [Google Scholar] [CrossRef]
- Caponio, F.; Summo, C.; Paradiso, V.M.; Pasqualone, A. Influence of decanter working parameters on the extra virgin olive oil quality. Eur. J. Lipid Sci. Technol. 2014, 116, 1626–1633. [Google Scholar] [CrossRef]
- Longobardi, F.; Ventrella, A.; Casiello, G.; Sacco, D.; Catucci, L.; Agostiano, A.; Kontominas, M.G. Instrumental and multivariate statistical analyses for the characterisation of the geographical origin of Apulian virgin olive oils. Food Chem. 2012, 133, 579–584. [Google Scholar] [CrossRef] [PubMed]
- Longobardi, F.; Ventrella, A.; Napoli, C.; Humpfer, E.; Schütz, B.; Schäfer, H.; Kontominas, M.G.; Sacco, A. Classification of olive oils according to geographical origin by using 1H NMR fingerprinting combined with multivariate analysis. Food Chem. 2012, 130, 177–183. [Google Scholar] [CrossRef]
- Gambacorta, G.; Faccia, M.; Trani, A.; Lamacchia, C.; Gomes, T. Phenolic composition and antioxidant activity of Southern Italian monovarietal virgin olive oils. Eur. J. Lipid Sci. Technol. 2012, 114, 958–967. [Google Scholar] [CrossRef]
- Papadia, P.; Del Coco, L.; Muzzalupo, I.; Rizzi, M.; Perri, E.; Cesari, G.; Simeone, V.; Mondelli, D.; Schena, F.P.; Fanizzi, F.P. Multivariate analysis of 1H-NMR spectra of genetically characterized extra virgin olive oils and growth soil correlations. J. Am. Oil Chem. Soc. 2011, 88, 1463–1475. [Google Scholar] [CrossRef]
- Del Coco, L.; Perri, E.; Cesari, G.; Muzzalupo, I.; Zelasco, S.; Simeone, V.; Schena, F.P.; Fanizzi, F.P. NMR-based metabolomic approach for EVOO from secular olive trees of Apulia region. Eur. J. Lipid Sci. Technol. 2013, 115, 1043–1052. [Google Scholar] [CrossRef]
- Del Coco, L.; De Pascali, S.A.; Iacovelli, V.; Cesari, G.; Schena, F.P.; Fanizzi, F.P. Following the olive oil production chain: 1D and 2D NMR study of olive paste, pomace, and oil. Eur. J. Lipid Sci. Technol. 2014, 116, 1513–1521. [Google Scholar] [CrossRef]
- Girelli, C.R.; Del Coco, L.; Papadia, P.; De Pascali, S.A.; Fanizzi, F.P. Harvest year effects on Apulian EVOOs evaluated by 1H NMR based metabolomics. PeerJ 2016, 4, e2740. [Google Scholar] [CrossRef] [PubMed]
- Gallo, V.; Intini, N.; Mastrorilli, P.; Latronico, M.; Scapicchio, P.; Triggiani, M.; Bevilacqua, V.; Fanizzi, P.; Acquotti, D.; Airoldi, C.; et al. Performance Assessment in Fingerprinting and Multi Component Quantitative NMR Analyses. Anal. Chem. 2015, 87, 6709–6717. [Google Scholar] [CrossRef] [PubMed]
- Piccinonna, S.; Ragone, R.; Stocchero, M.; Del Coco, L.; De Pascali, S.A.; Schena, F.P.; Fanizzi, F.P. Robustness of NMR-based metabolomics to generate comparable data sets for olive oil cultivar classification. An inter-laboratory study on Apulian olive oils. Food Chem. 2016, 199, 675–683. [Google Scholar] [CrossRef] [PubMed]
- Del Coco, L.; Mondelli, D.; Mezzapesa, G.N.; Miano, T.; De Pascali, S.A.; Girelli, C.R.; Fanizzi, F.P. Protected Designation of Origin Extra Virgin Olive Oils Assessment by Nuclear Magnetic Resonance and Multivariate Statistical Analysis: “Terra di Bari”, an Apulian (Southeast Italy) Case Study. J. Am. Oil Chem. Soc. 2016, 93, 373–381. [Google Scholar] [CrossRef]
- Binetti, G.; Del Coco, L.; Ragone, R.; Zelasco, S.; Perri, E.; Montemurro, C.; Valentini, R.; Naso, D.; Fanizzi, F.P.; Schena, F.P. Cultivar classification of Apulian olive oils: Use of artificial neural networks for comparing NMR, NIR and merceological data. Food Chem. 2017, 219, 131–138. [Google Scholar] [CrossRef] [PubMed]
- Del Coco, L.; De Pascali, S.A.; Fanizzi, F.P. NMR-metabolomic study on monocultivar and blend salento EVOOs including some from secular olive trees. Food Nutr. Sci. 2014, 5, 89–95. [Google Scholar] [CrossRef]
- Ragusa, A.; Centonze, C.; Grasso, M.; Latronico, M.; Mastrangelo, P.; Sparascio, F.; Fanizzi, F.; Maffia, M. A Comparative Study of Phenols in Apulian Italian Wines. Foods 2017, 6, 24. [Google Scholar] [CrossRef] [PubMed]
- “Register of Protected Designations of Origin and Protected Geographical Indications”, D.M. 6 August 1998-GURI n. 193, within the Meaning of Reg. CE 1065/97. 2011. Available online: http://www.le.camcom.gov.it/uploaded/Generale/PromozioneTerritorio/Olio dop terra d_otranto/2011feb28_Modifica_Disciplinare_Terra_di_Otranto.pdf (accessed on 15 September 2017).
- Determinazione dei Biofenoli Mediante HPLC. COI/T.20/Doc. n. 29. 2009. Available online: www.internationaloliveoil.org/documents/viewfile/4144-met29it (accessed on 15 September 2017).
- “Tutela e Valorizzazione del Paesaggio Degli Ulivi Monumentali della Puglia”, Legge Regionale 4 Giugno 2007, n. 14; Bollettino Ufficiale della Regione Puglia—n. 83 suppl. del 7-6-2007. 2007. Available online: http://www.regione.puglia.it/documents/10192/7080382/L_14_04_06_2007.pdf (accessed on 15 September 2017).
- Publication of an amendment application pursuant to Article 50(2)(a) of Regulation (EU) No 1151/2012 of the European Parliament and of the Council on Quality Schemes for Agricultural Products and Foodstuffs. Official Journal of the European Union, C 237/3. 2013. Available online: http://eur-lex.europa.eu/LexUriServ/LexUriServ.do?uri=OJ:C:2013:237:0036:0039:EN:PDF (accessed on 15 September 2017).


| Cultivar | n of Samples | PDO “Terra d’Otranto“ Certification 2 | Cultivation Area 3 | Interval Time between Harvesting and Milling (h) 4 | Age of Olive Trees (year) | |||||
|---|---|---|---|---|---|---|---|---|---|---|
| Yes | No | Ionian | Center | Adriatic | ≤12 | >12 | ≤100 | >100 | ||
| Ogliarola salentina | 25 | 19 | 2 | 10 | 13 | 2 | 25 | - | 2 | 15 |
| Cellina di Nardò | 20 | 17 | 1 | 5 | 8 | 6 | 13 | 7 | 7 | 11 |
| Leccino | 4 | - | - | 2 | 2 | - | 3 | 1 | 1 | - |
| Picholine | 2 | - | - | 2 | - | - | 2 | - | - | - |
| Frantoio | 2 | - | - | 2 | - | - | 2 | - | - | - |
| Cima di Melfi | 1 | - | - | 1 | - | - | 1 | - | - | - |
| Blend | 14 | 8 | 6 | 5 | 5 | 2 | 9 | 4 | 2 | 7 |
| Total | 68 | 44 | 9 | 27 | 28 | 10 | 55 | 12 | 12 | 33 |
| Cultivar | Total Biophenols | Hydroxytyrosol | Tyrosol | 3,4-DHPEA-EDA | 3,4-DHPEA-EA | Lignans | Luteolin | p-HPEA-EDA | p-HPEA-EA | 3,4-DHPEA-EA, Mixed Isomer | p-HPEA-EA, Mixed Isomer | α-Tocopherol |
|---|---|---|---|---|---|---|---|---|---|---|---|---|
| Content in mg/kg 1 | ||||||||||||
| Ogliarola salentin | 468.7 ± 111.4 | 14.4 ± 8.9 | 8.2 ± 4.3 | 39.1 ± 26.7 | 30.4 ± 18.1 | 17.8 ± 6.4 | 12.7 ± 3.8 | 61.0 ± 32.2 | 7.9 ± 3.1 | 61.8 ± 17.4 | 26.8 ± 8.2 | 322.5 ± 39.4 |
| Cellina di Nardò | 449.1 ± 101.6 | 14.0 ± 11.6 | 8.6 ± 6.0 | 55.1 ± 26.6 | 44.9 ± 15.8 | 23.2 ± 11.0 | 14.8 ± 5.2 | 34.5 ± 17.4 | 6.1 ± 2.6 | 61.9 ± 21.8 | 25.4 ± 7.4 | 351.2 ± 52.6 |
| Leccino | 379.3 ± 35.8 | 13.8 ± 20.2 | 6.8 ± 5.6 | 44.0 ± 14.7 | 34.5 ± 11.2 | 16.5 ± 11.2 | 11.3 ± 1.3 | 14.8 ± 2.1 | 4.3 ± 2.2 | 63.8 ± 3.8 | 30.0 ± 7.7 | 297.8 ± 41.0 |
| Picholine | 463.0 ± 62.2 | 7.0 ± 2.8 | 6.9 ± 1.4 | 40.2 ± 22.6 | 47.5 ± 3.5 | 9.0 ± 9.9 | 11.1 ± 0.2 | 38.0 ± 17.0 | 4.5 ± 0.7 | 58.5 ± 2.1 | 52.3 ± 5.7 | 265.1 ± 13.1 |
| Frantoio | 308.0 ± 83.4 | 23.0 ± 26.9 | 20.2 ± 22.6 | 12.5 ± 2.1 | 16.0 ± 1.4 | 43.4 ± 7.1 | 7.3 ± 2.8 | 20.1 ± 5.7 | 5.0 ± 1.4 | 32.5 ± 7.8 | 24.5 ± 2.1 | 189.6 ± 25.1 |
| Cima di Melfi | 478.9 | 4.8 | 6.1 | 65.7 | 62.0 | 59.3 | 11.9 | 37.4 | 6.7 | 43.8 | 19.2 | 233.9 |
| Blend | 462.4 ± 96.8 | 16.2 ± 10.9 | 12.2 ± 8.5 | 40.3 ± 26.6 | 44.4 ± 28.6 | 20.9 ± 11.1 | 10.1 ± 3.4 | 38.1 ± 21.3 | 9.9 ± 3.9 | 54.9 ± 5.1 | 27.6 ± 12.6 | 280.4 ± 74.8 |
| Avg total | 451.6 ± 102.4 | 14.4 ± 11.2 | 9.3 ± 6.8 | 43.9 ± 26.4 | 38.2 ± 20.6 | 21.0 ± 11.3 | 12.5 ± 4.4 | 43.5 ± 27.6 | 7.4 ± 3.4 | 59.3 ± 16.9 | 27.3 ± 9.7 | 313.9 ± 61.9 |
© 2017 by the authors. Licensee MDPI, Basel, Switzerland. This article is an open access article distributed under the terms and conditions of the Creative Commons Attribution (CC BY) license (http://creativecommons.org/licenses/by/4.0/).
Share and Cite
Ragusa, A.; Centonze, C.; Grasso, M.E.; Latronico, M.F.; Mastrangelo, P.F.; Fanizzi, F.P.; Maffia, M. Composition and Statistical Analysis of Biophenols in Apulian Italian EVOOs. Foods 2017, 6, 90. https://doi.org/10.3390/foods6100090
Ragusa A, Centonze C, Grasso ME, Latronico MF, Mastrangelo PF, Fanizzi FP, Maffia M. Composition and Statistical Analysis of Biophenols in Apulian Italian EVOOs. Foods. 2017; 6(10):90. https://doi.org/10.3390/foods6100090
Chicago/Turabian StyleRagusa, Andrea, Carla Centonze, Maria Elena Grasso, Maria Francesca Latronico, Pier Francesco Mastrangelo, Francesco Paolo Fanizzi, and Michele Maffia. 2017. "Composition and Statistical Analysis of Biophenols in Apulian Italian EVOOs" Foods 6, no. 10: 90. https://doi.org/10.3390/foods6100090