Optimization of Baker’s Yeast Production on Date Extract Using Response Surface Methodology (RSM)

Abstract
:1. Introduction
2. Materials and Methods
2.1. Origin and Reactivation of theYeast S. cerevisiae
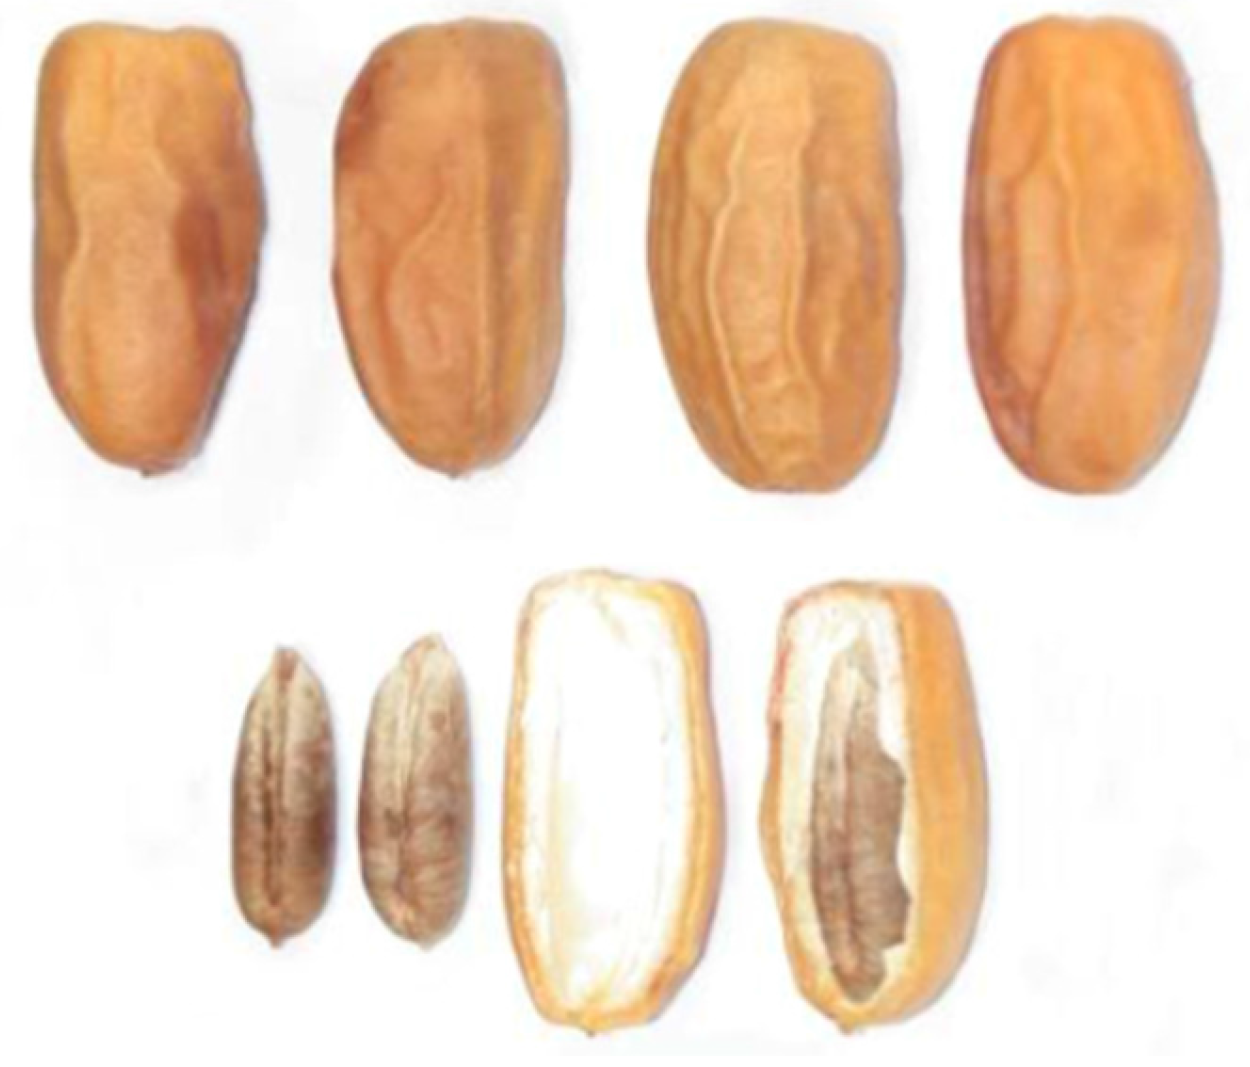
2.2. Preparation of Dates Extract
2.3. Preparation of Culture Medium Based on the Dates Extract and Inoculums
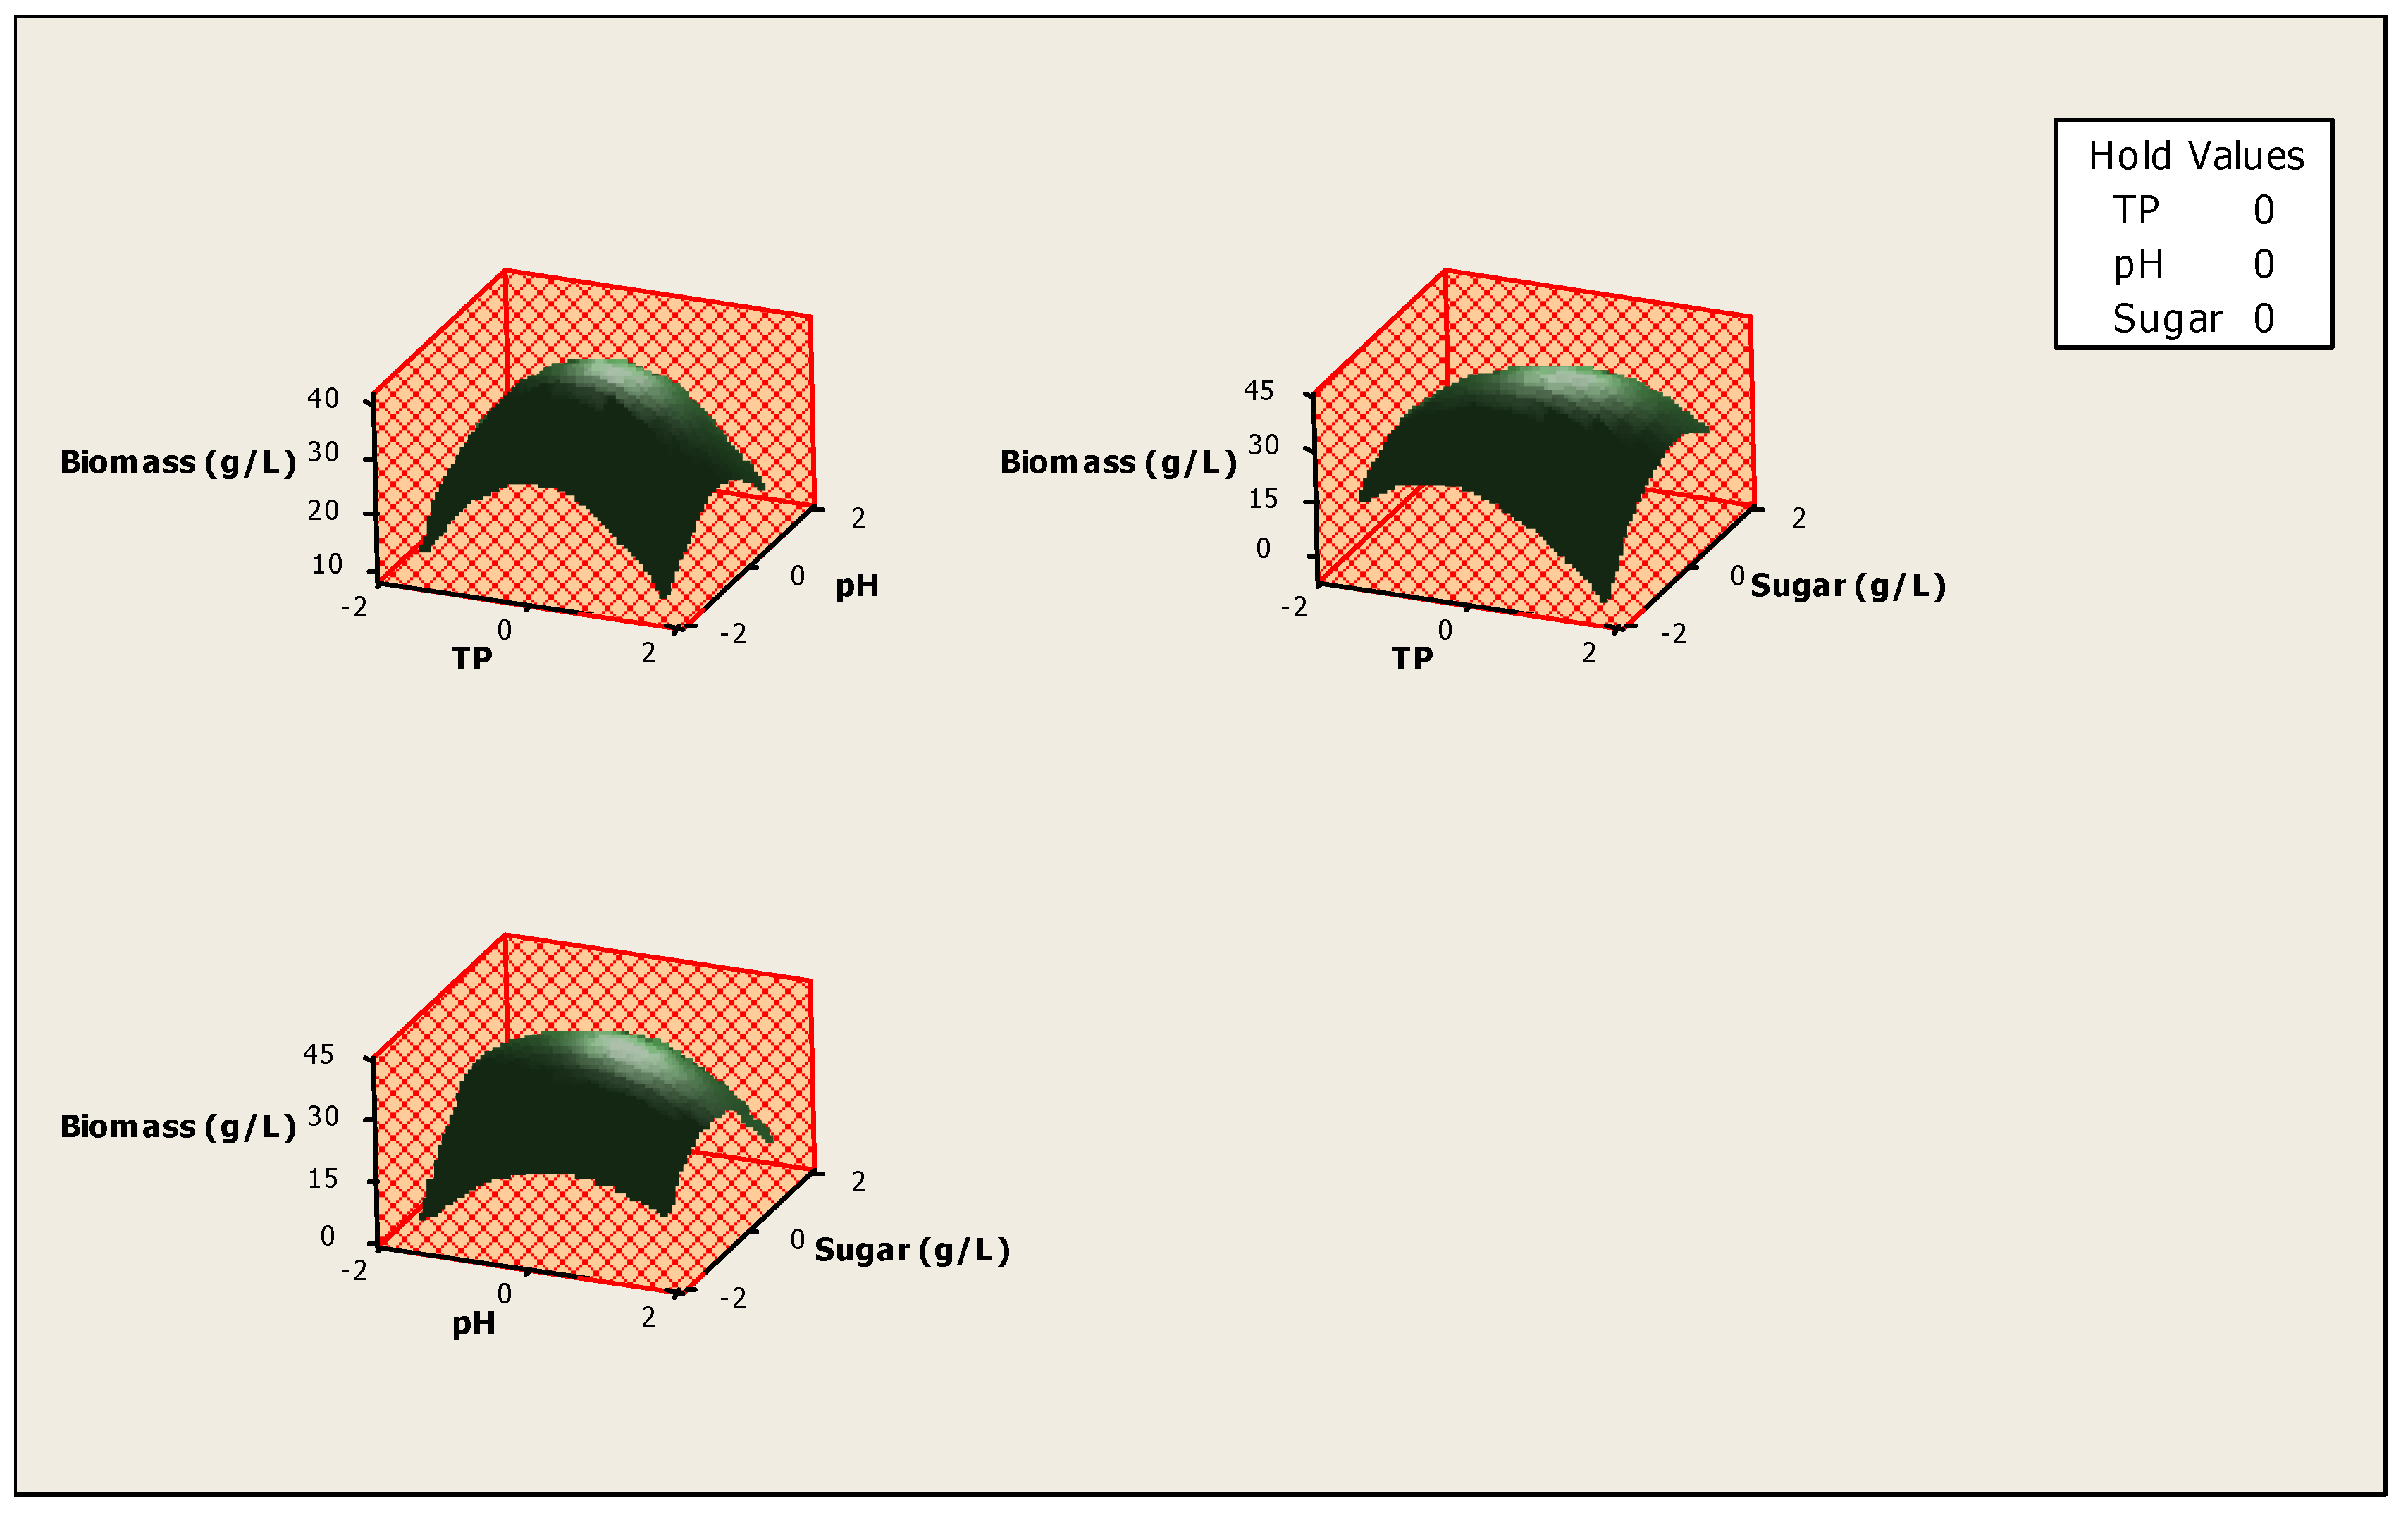
2.4. Statistical Design of Experiments
2.4.1. Factor Selection and Organization of Experiments
2.4.2. Effect Estimation
2.4.3. Statistical Analysis
2.5.Validation of Biomass Production in Optimum Medium
2.6. Analytical Techniques
2.6.1. Determination of Total Reducing Sugars
2.6.2. Determination of Biomass Concentration
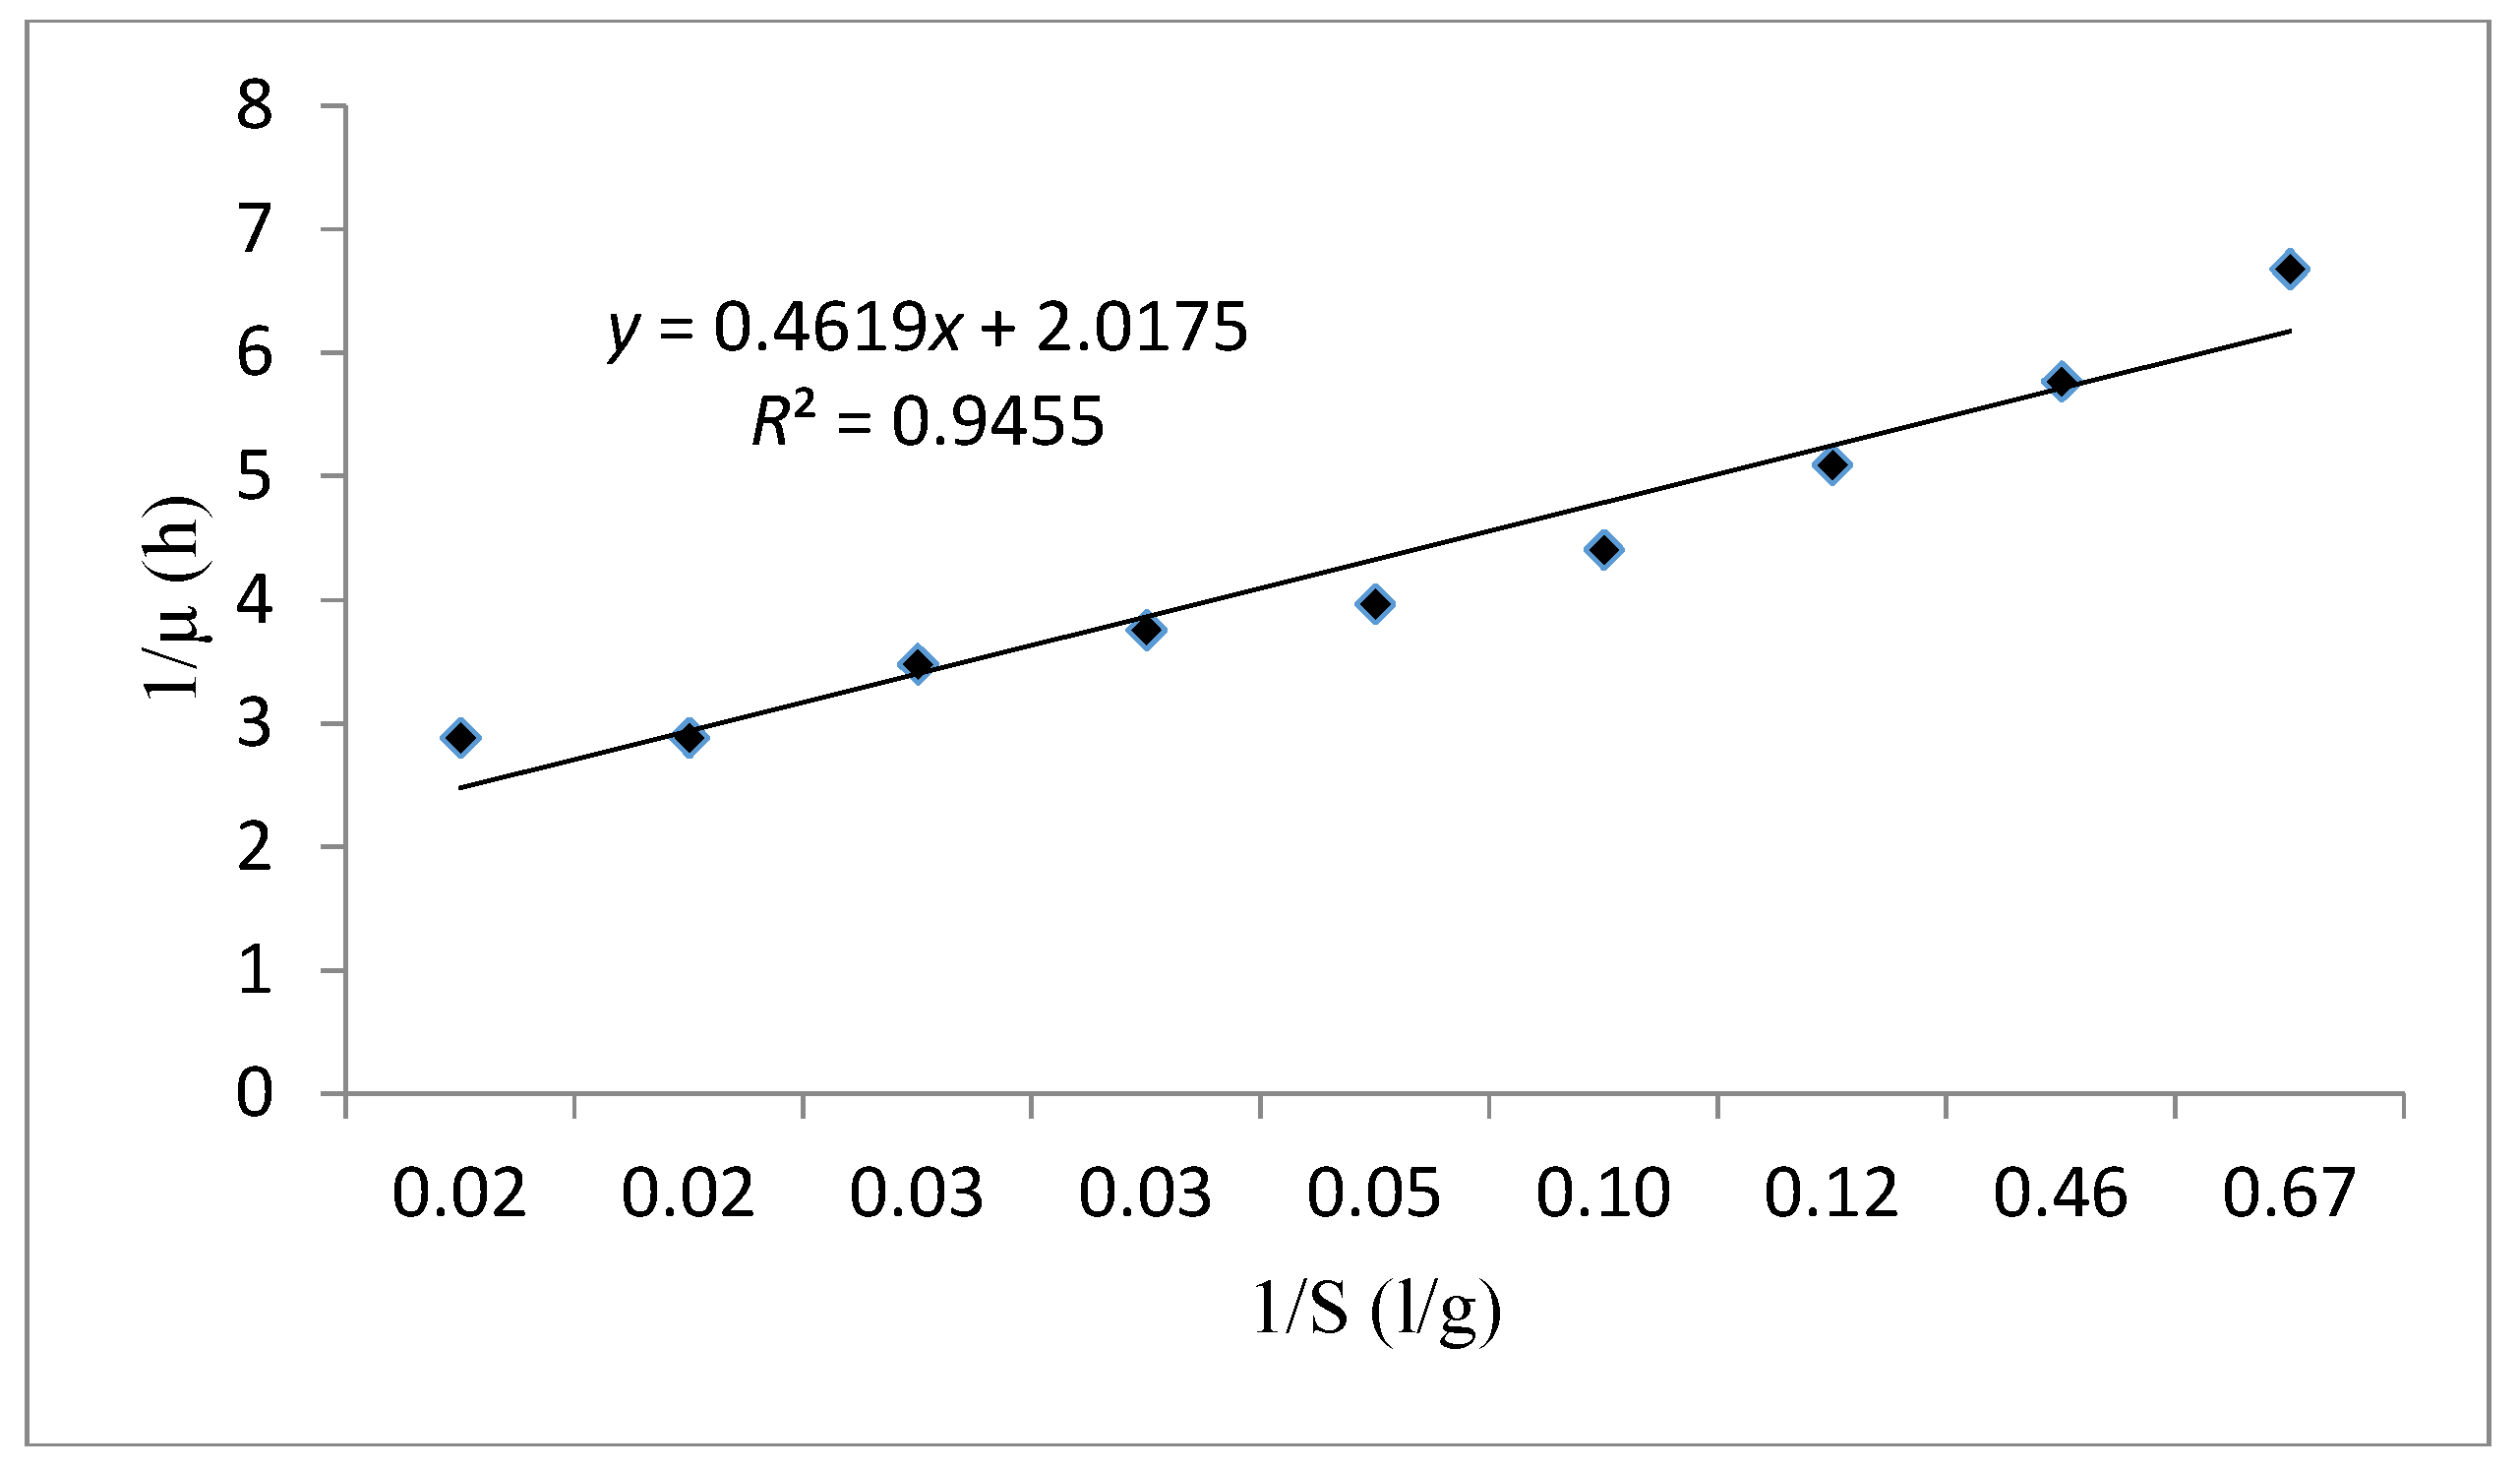
2.7. Modeling
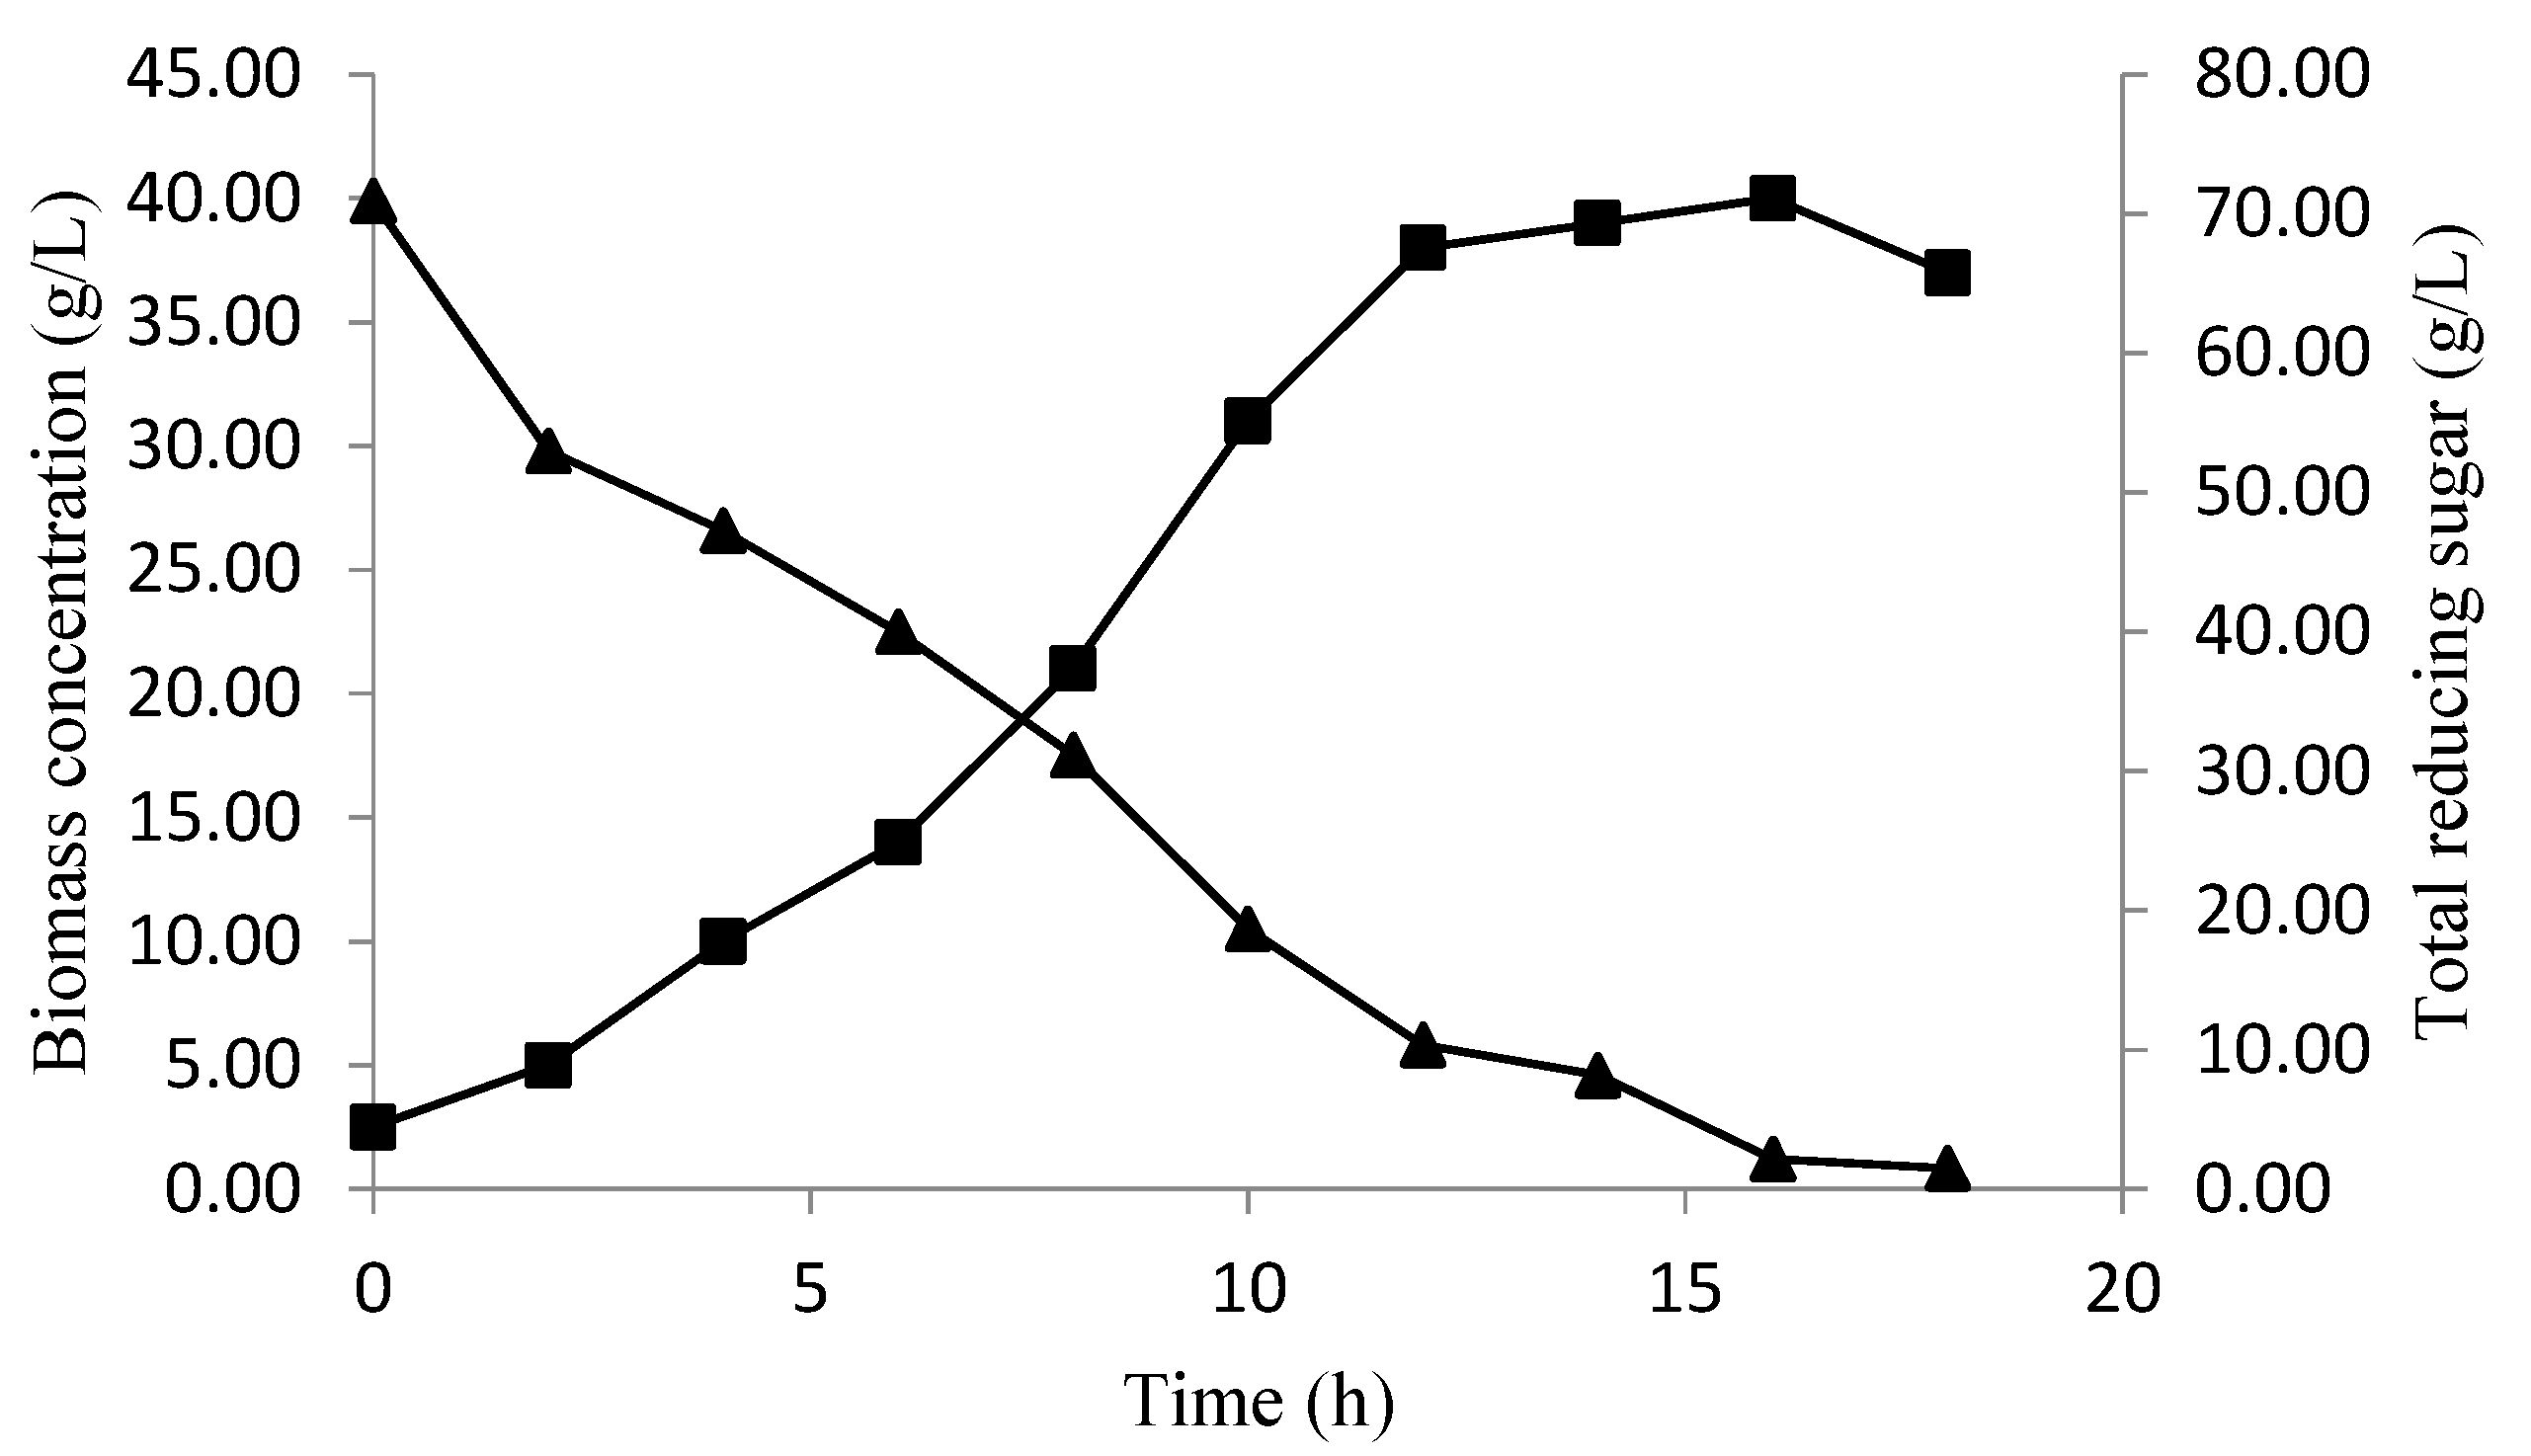
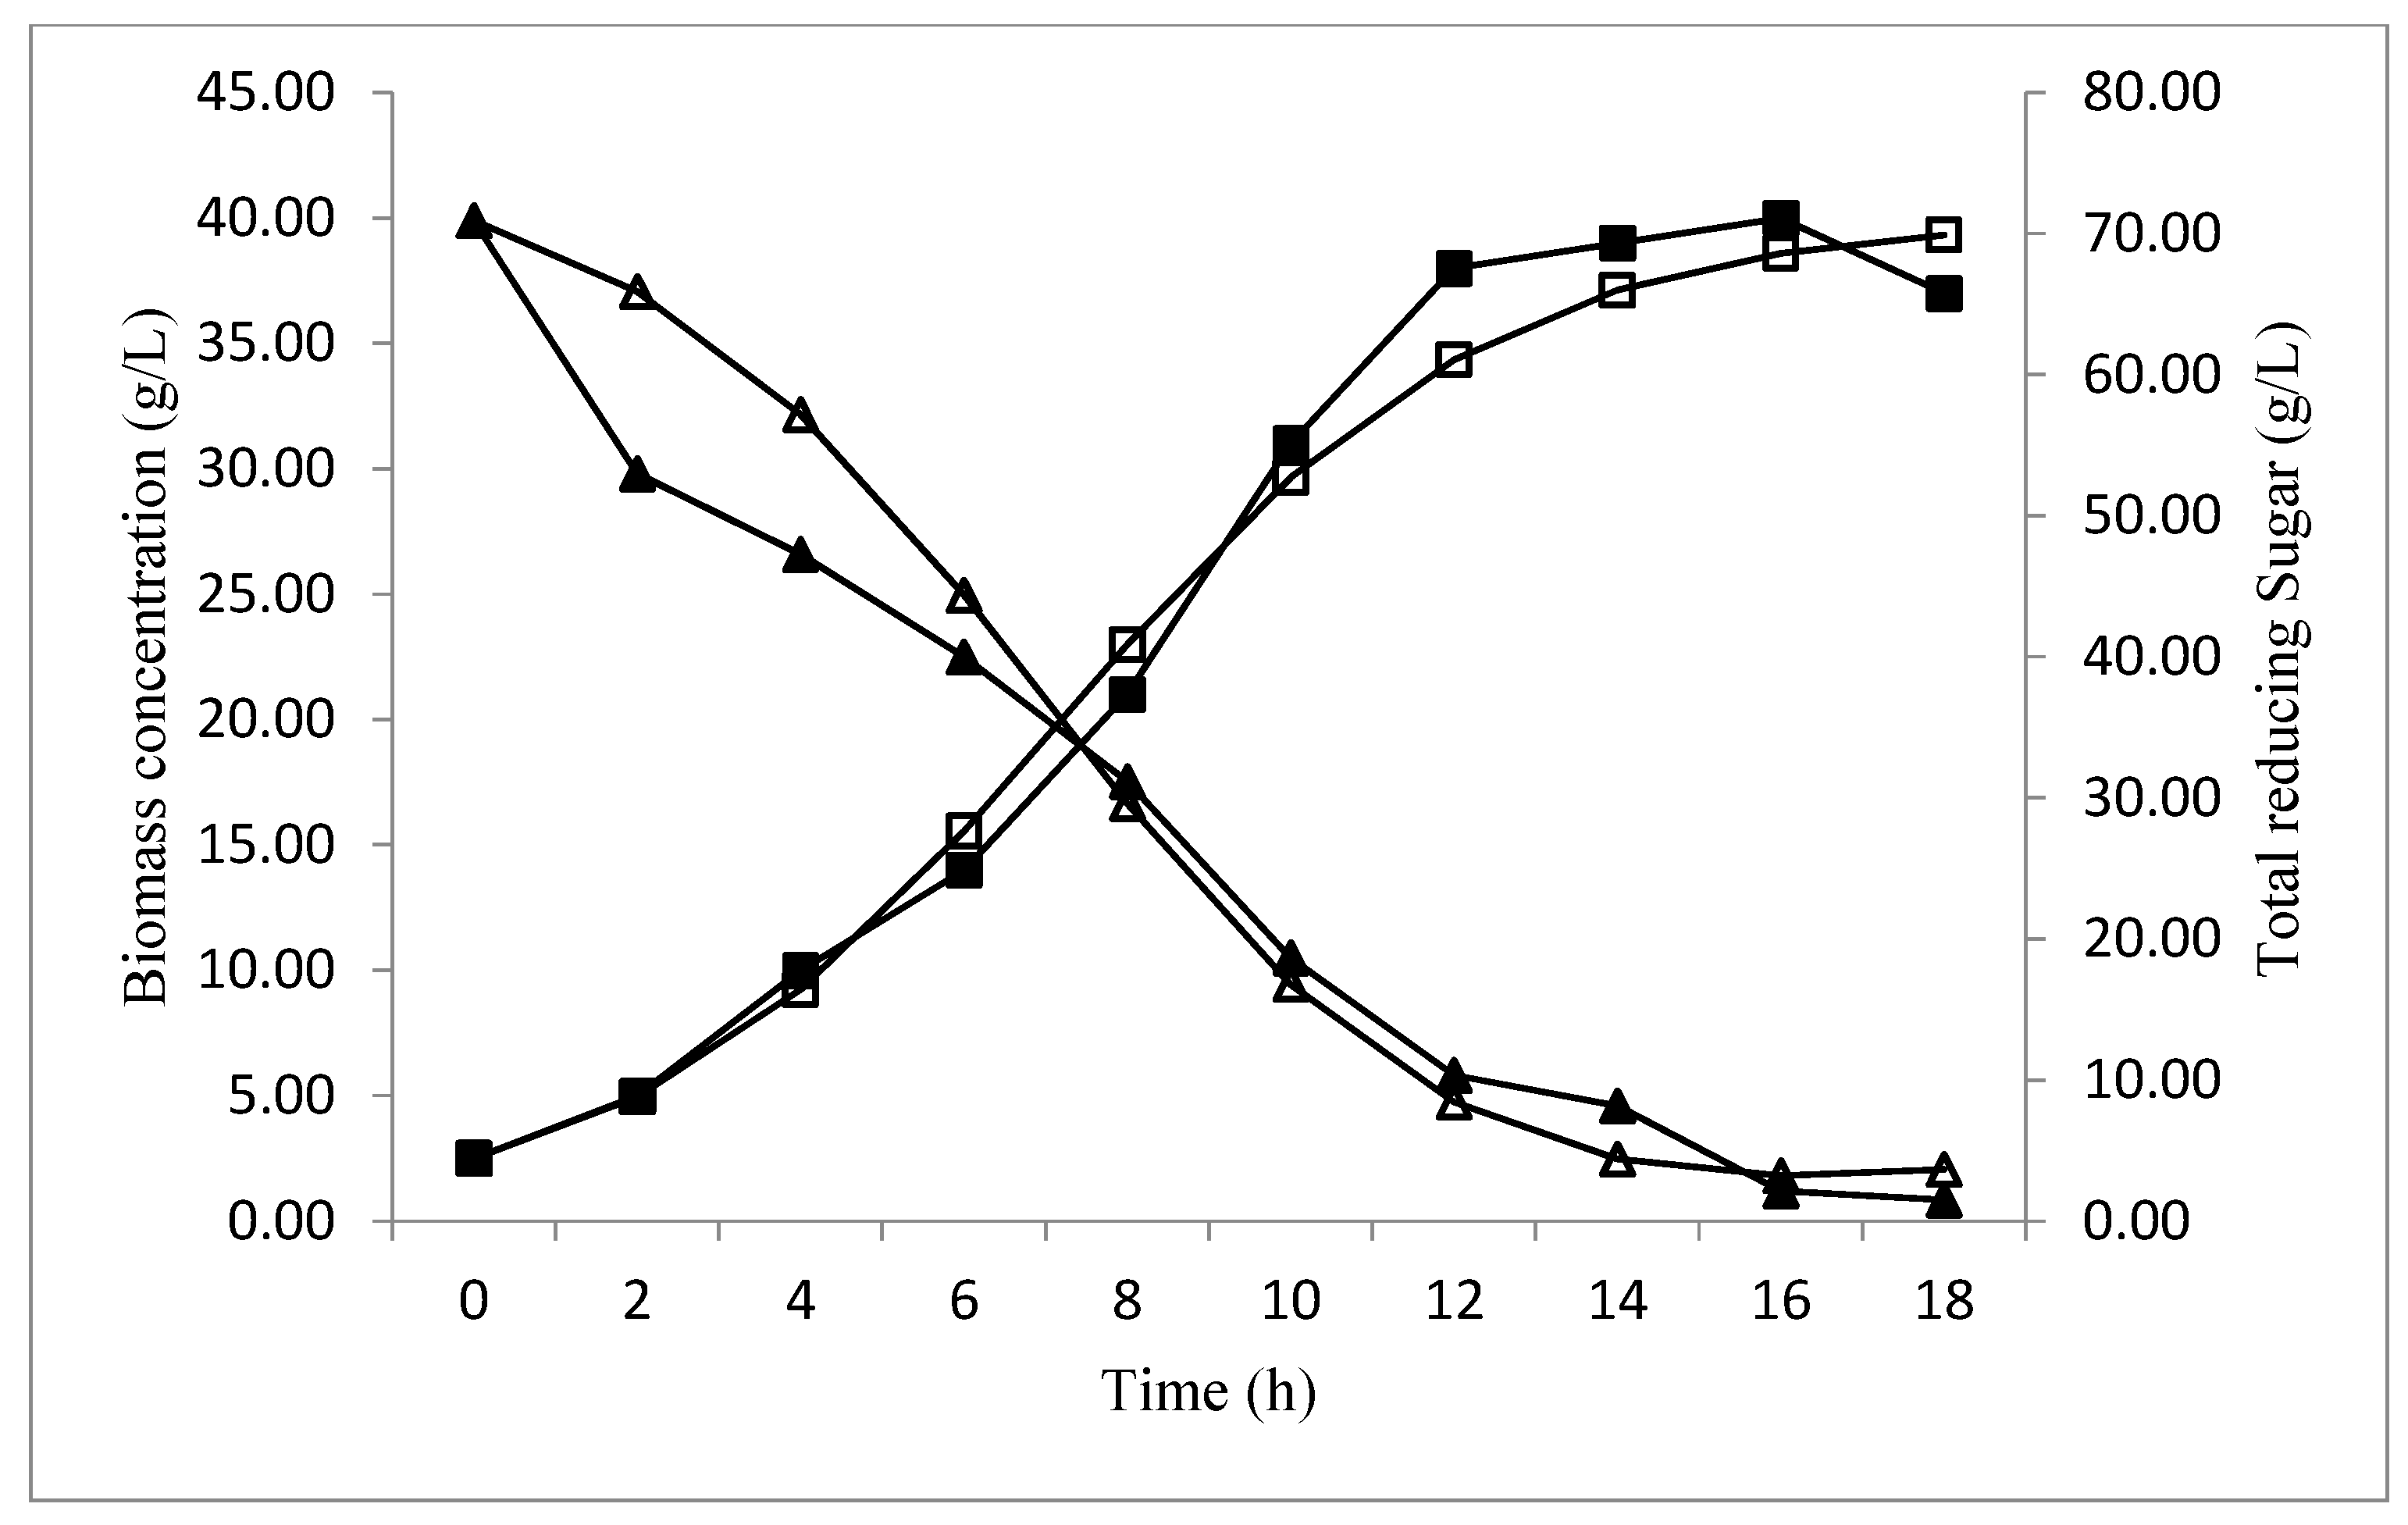
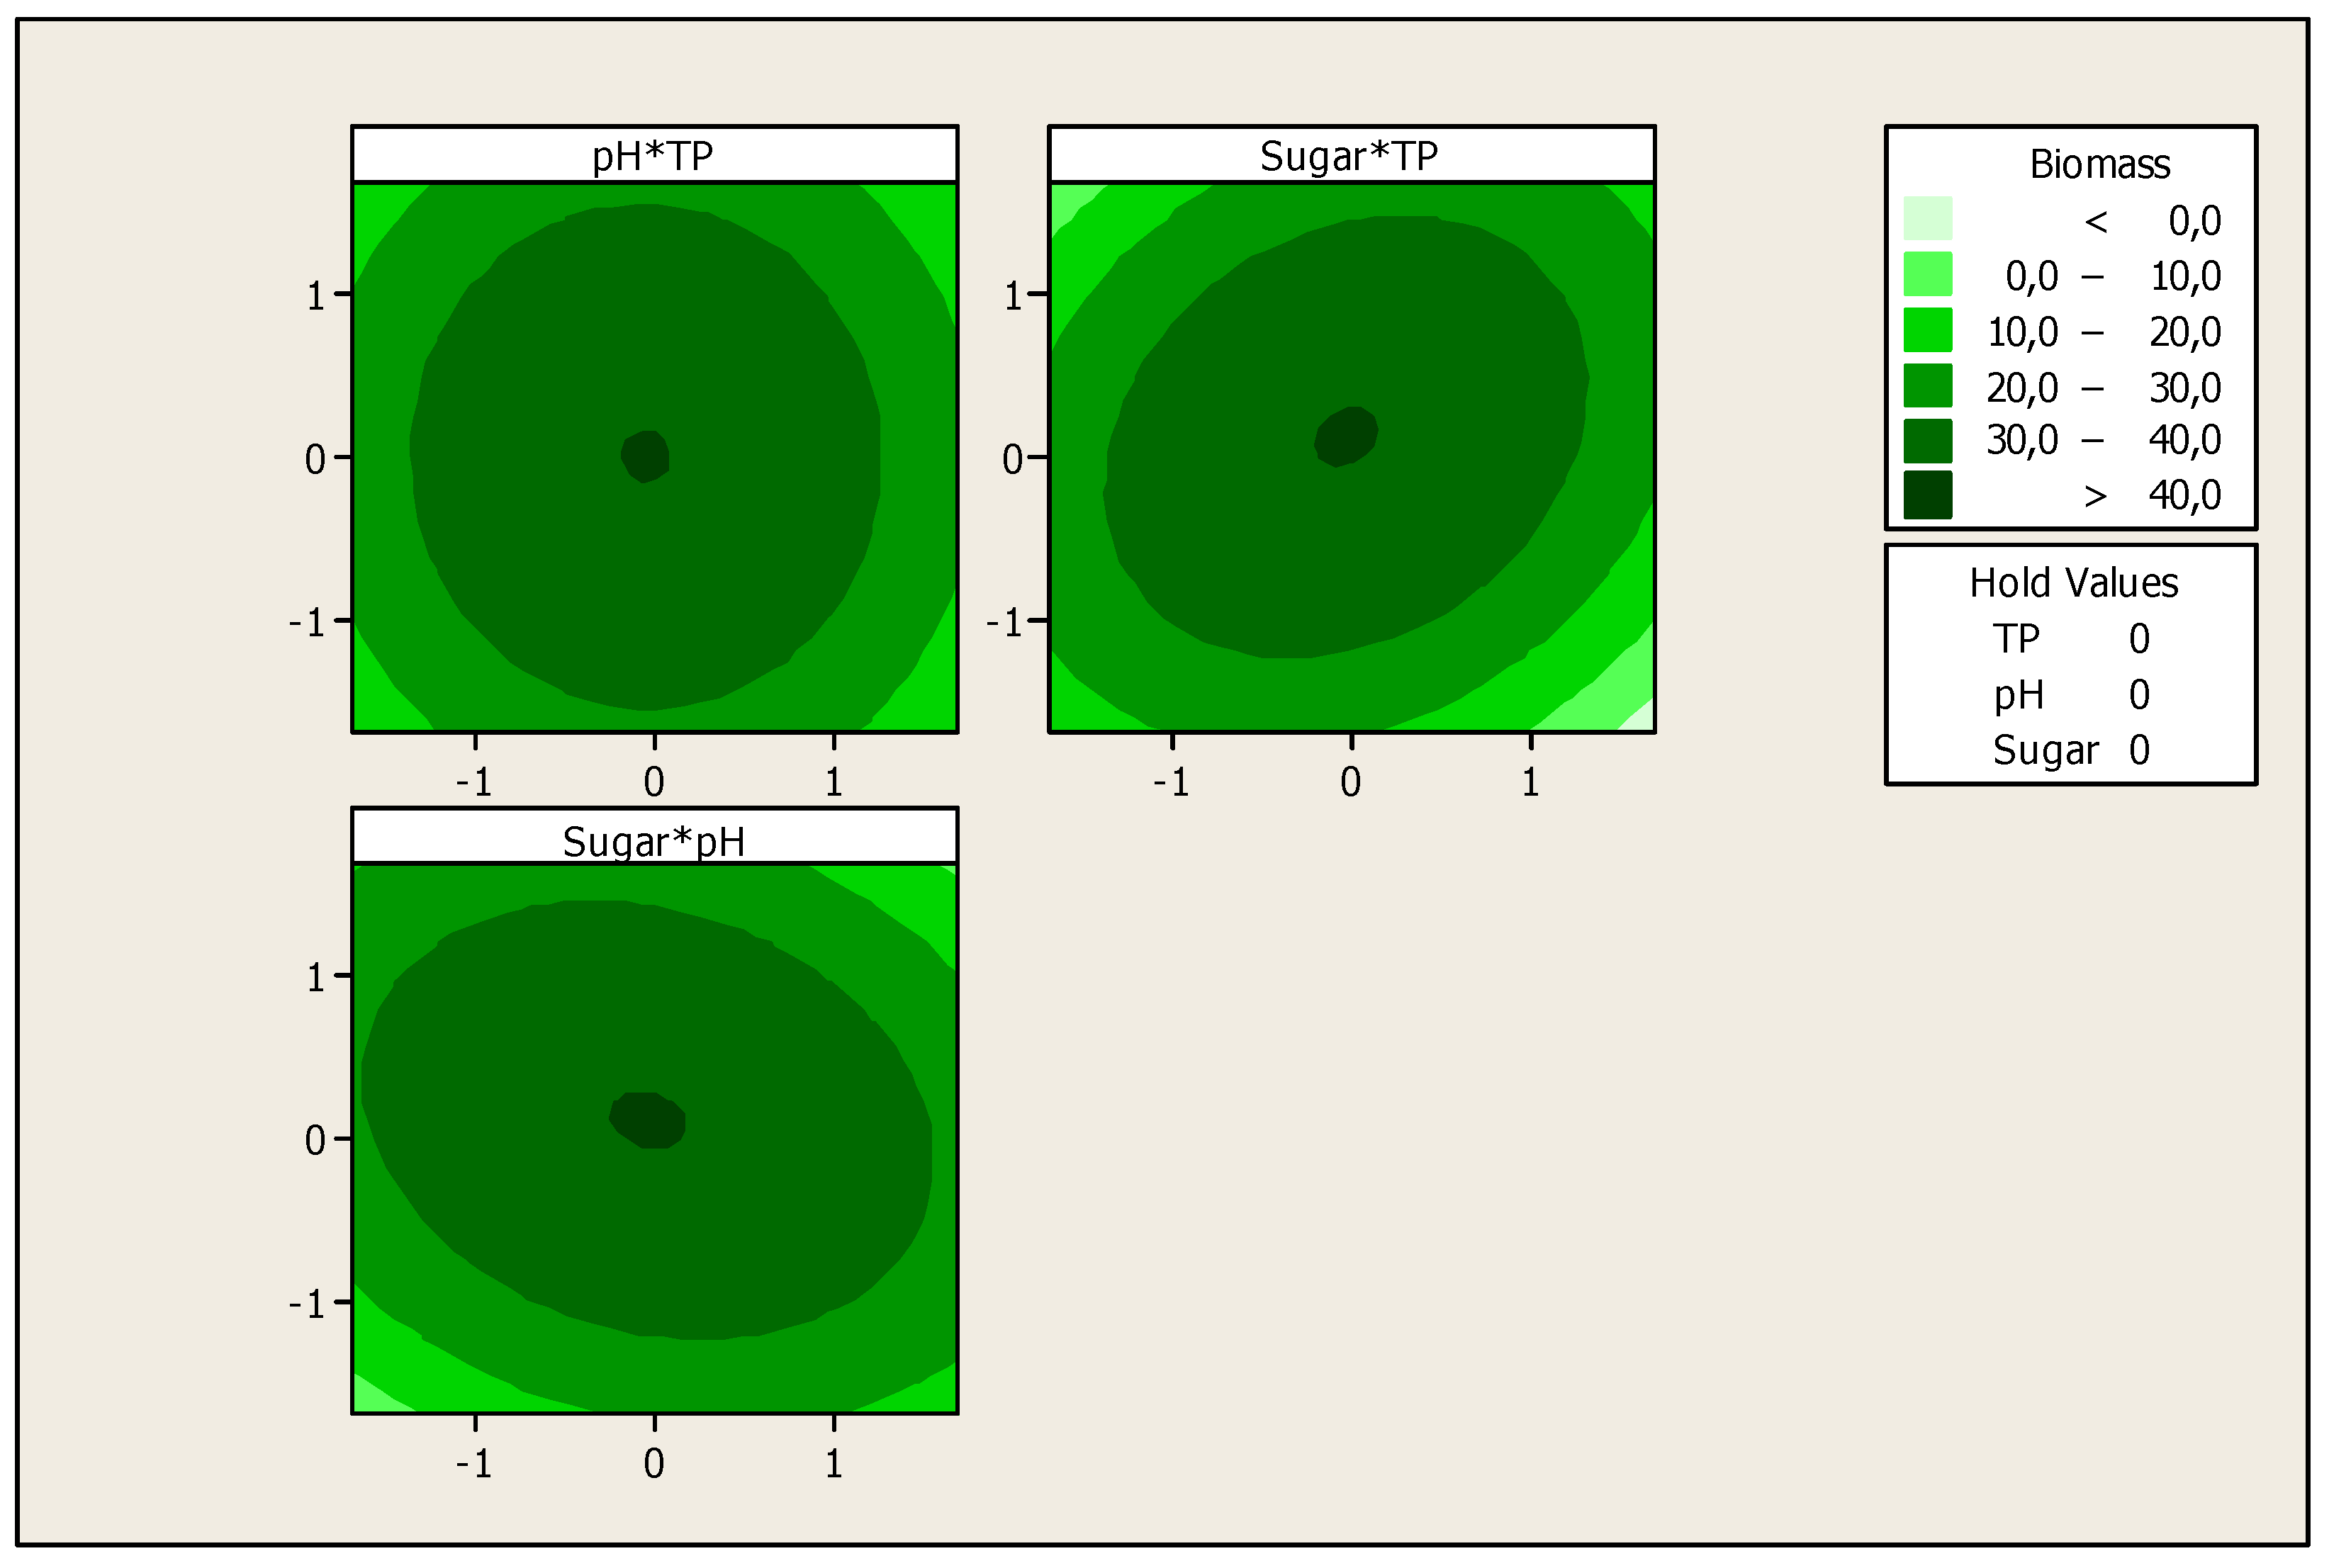
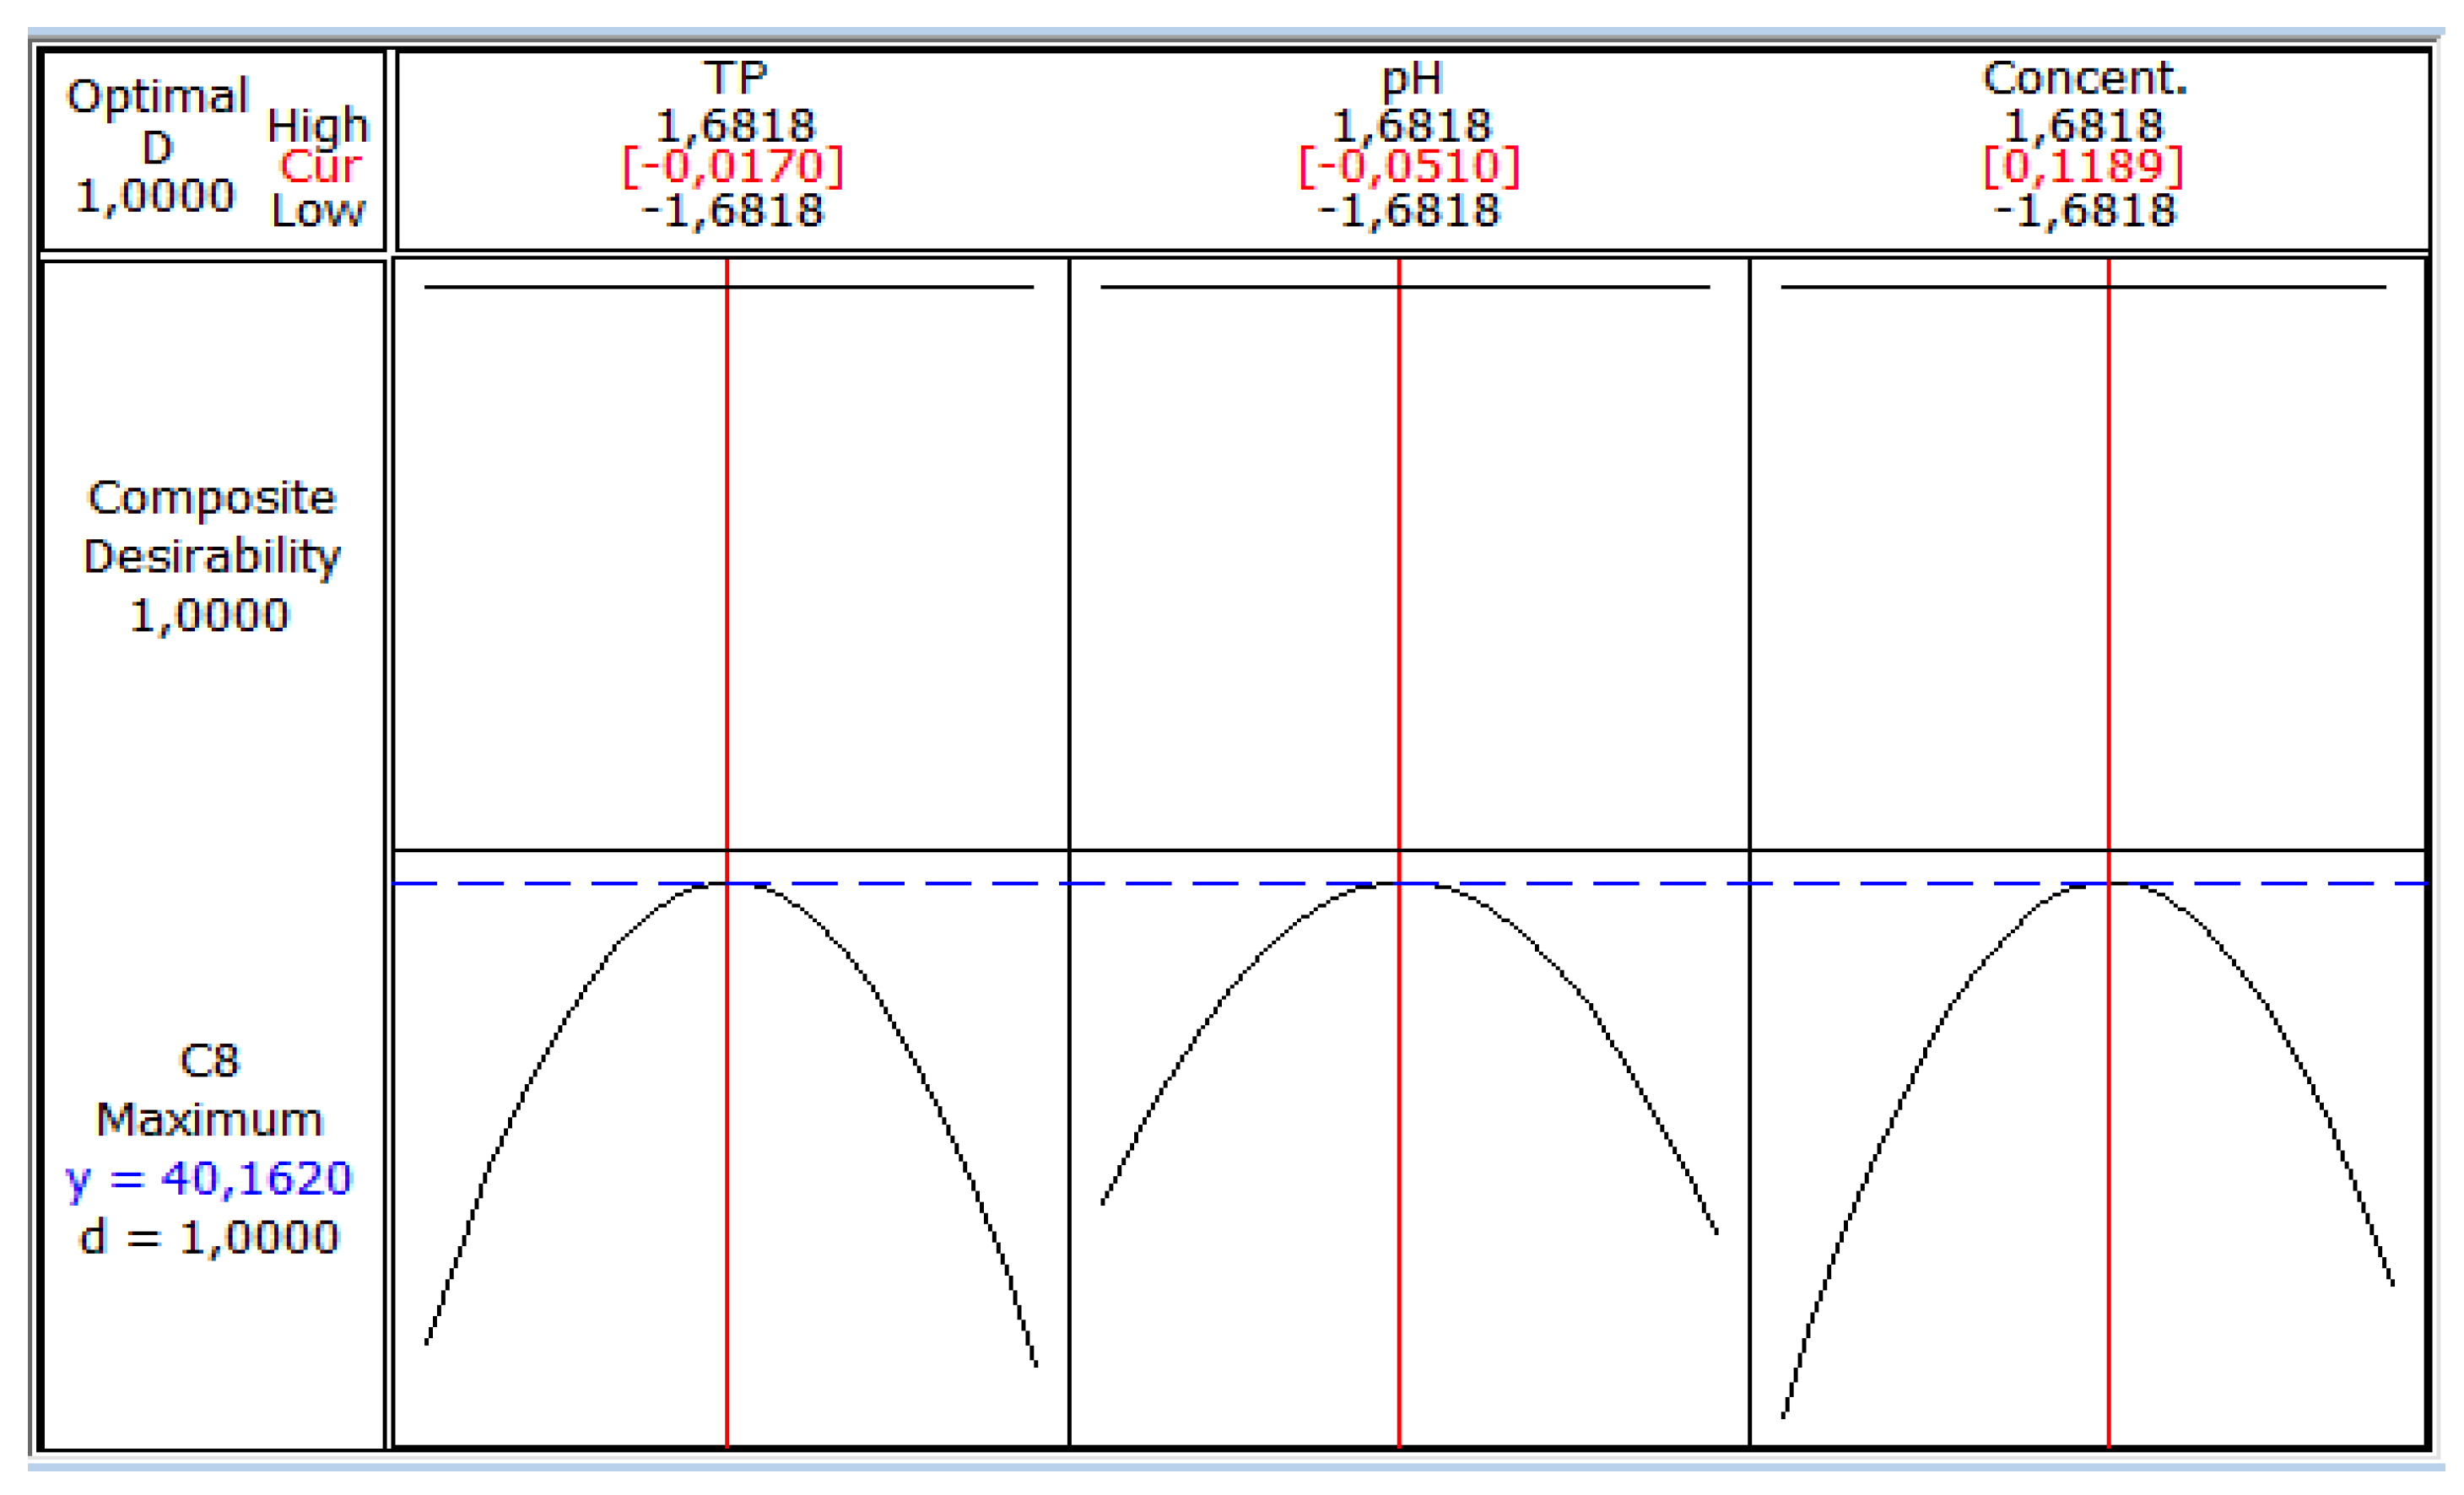
Profile Prediction of Biomass and Substrate Concentration
3. Results and Discussion
4. Conclusions
Acknowledgments
Author Contributions
Conflicts of Interest
References
- Pandey, A.; Soccol, C.R.; Selvakumar, P.; Soccol, V.T.; Krieger, N.; Fontana, J.D. Recent developments in microbial inulinases, its production, properties and industrial applications. Appl. Biochem. Biotechnol. 1999, 81, 35–52. [Google Scholar] [CrossRef]
- Richelle, A.; Ben Tahar, I.; Hassouna, M.; Bogaerts, P.H. Macroscopic modelling of bioethanol production from potato peel wastes in batch cultures supplemented with inorganic nitrogen. Bioprocess Biosyst. Eng. 2015, 38, 1819–1833. [Google Scholar] [CrossRef] [PubMed]
- Tang, L.; Wang, W.; Zhou, W.; Cheng, K.; Yang, Y.; Liu, M.; Cheng, K.; Wang, W. Three-pathway combination for glutathione biosynthesis in Saccharomyces cerevisiae. Microb. Cell Fact. 2015, 14, 139. [Google Scholar] [CrossRef] [PubMed]
- Lin, Y.; Tanaka, S. Ethanol fermentation from biomass resources: current state and prospects. Appl. Microbiol. Biotechnol. 2006, 69, 627–642. [Google Scholar] [CrossRef] [PubMed]
- Martin, C.; Galbe, M.; Wahlbom, C.F.; Hahn-Hagerdal, B.; Jonsson, L.F. Ethanol production from enzymatic hydrolysates of sugarcane bagasse using recombinant xylose utilizing Saccharomyces cerevisiae. Enzyme Microb. Technol. 2012, 31, 274–282. [Google Scholar] [CrossRef]
- Neagu, C.B.; Bahrim, G. Comparative study of different methods of hydrolysis and fermentation for bioethanol obtaining from inulin and inulin rich feedstock. Food Ind. 2012, 13, 63–68. [Google Scholar]
- Mussato, S.I.; Machado, E.M.S.; Carneiro, L.M.; Teixeira, J.A. Sugar metabolism and ethanol production by different yeast strains from coffee industry wastes hydrolysates. Appl. Energy 2012, 92, 763–768. [Google Scholar] [CrossRef] [Green Version]
- Chibane, H.; Benamara, S.; Noui, Y.; Djouab, A. Some Physichemical and Morphological Characterizations of Three Varietes of Algerian Common Dates. Eur. J. Sci. Res. 2007, 18, 134–140. [Google Scholar]
- Kacem-Chaouche, N.; Dehimat, L.; Meraihi, Z.; Destain, J.; Kahlat, K.; Thonart, P.H. Decommissioned dates: chemical composition and fermentation substrate for the production of extracellular catalase by an Aspergillus phoenicis mutant. Agric. Biol. J. N. Am. 2013, 4, 41–47. [Google Scholar] [CrossRef]
- Peyron, G. Cultiver le Palmier Dattier; Technical Centre for Agricultural and Rural Cooperation (CTA): Wageningen, The Netherlands, 2000; p. 110. [Google Scholar]
- Alexeeva, Y.V.; Ivanova, E.P.; Bakunina, I.Y.; Zvaygintseva, T.N.; Mikhailov, V.V. Optimization of glycosidases production by Pseudoalteromonasissachenkonii. KMM 3549T. Lett. Appl. Microbiol. 2002, 35, 343–346. [Google Scholar] [CrossRef] [PubMed]
- Patidar, P.; Agrawal, D.; Banerjee, T.; Patil, S. Chitinase production by Beauveriafelina. RD 101: Optimization of parameters under solid substrate fermentation conditions. World J. Microbiol. Biotechnol. 2005, 21, 93–95. [Google Scholar] [CrossRef]
- Rajendhran, J.; Krishnakumar, V.; Gunasekaran, P. Optimization of a fermentation medium for the production of Penicillin G acylase from Bacillus sp. Lett. Appl. Microbiol. 2002, 35, 523–527. [Google Scholar] [CrossRef] [PubMed]
- Schmidt, F.R. Optimization and scale up of industrial fermentation processes. Appl. Microbiol. Biotechnol. 2005, 68, 425–435. [Google Scholar] [CrossRef] [PubMed]
- Singh, B.; Satyanarayana, T.A. Marked enhancement in phytase production by a thermophilic mould Sporotrichum thermophile using statistical designs in a cost-effective cane molasses medium. J. Appl. Microbiol. 2006, 101, 344–352. [Google Scholar] [CrossRef] [PubMed]
- Sayyad, S.A.; Panda, B.P.; Javed, S.; Ali, M. Optimization of nutrient parameters for lovastatin production by Monascus purpureus MTCC 369 under submerged fermentation using response surface methodology. Appl. Microbiol. Biotechnol. 2007, 73, 1054–1058. [Google Scholar] [CrossRef] [PubMed]
- Kennedy, M.; Krouse, D. Strategies for improving fermentation medium performance: A review. J. Ind. Microbiol. Biotechnol. 1999, 23, 456–475. [Google Scholar] [CrossRef]
- Chakravarti, R.; Sahai, V. Optimization of compaction production in chemically defined production medium by Penicilium citrinum using statistical methods. Process Biochem. 2002, 38, 481–486. [Google Scholar] [CrossRef]
- Kar, B.; Banerjee, R.; Bhattachaaryya, B.C. Optimization of physicochemical parameters for gallic acid production by evolutionary operation-factorial design techniques. Process Biochem. 2002, 37, 1395–1401. [Google Scholar] [CrossRef]
- Naveena, B.J.; Altaf, M.; Bhadriah, K.; Reddy, G. Selection of medium components by Plackett-Burman design for production of L(+) lactic acid by Lactobacillus amylophilus GV6 in SSF using wheat bran. Bioresour. Technol. 2005, 96, 485–490. [Google Scholar] [CrossRef] [PubMed]
- Shafaghat, H.; Najafpour, G.D.; Rezaei, P.S.; Sharifzadeh, M. Optimal growth of saccharomyces cerevisiae (ptcc 24860) on pretreated molasses for the ethanol production: The application of the response surface methodology. Chem. Ind. Chem. Eng. Q. 2010, 16, 199–206. [Google Scholar] [CrossRef]
- Boudjema, K.; Fazouane-naimi, F.; HellaL, A. Optimization of the Bioethanol Production on Sweet Cheese Whey by Saccharomyces cerevisiae DIV13-Z087C0VS using Response Surface Methodology (RSM). Rom. Biotech. Lett. 2015, 20, 10814–10825. [Google Scholar]
- Montgomery, D.C. Design and Analysis of Experiments, 5th ed.; John Wiley & Sons, Inc.: New York, NY, USA, 2009. [Google Scholar]
- Bouhadi, D.; Raho, B.; Hariri, A.; Benattouche, Z.; Sahnouni, F.; OuldYerou, K.; Bouallam, S.A. Utilization of Date Juice for the Production of Lactic Acid by Streptococcus Thermophilus. J. Appl. Biotechnol. Bioeng. 2017, 3, 00071. [Google Scholar]
- Kocher, G.S.; Uppal, S. Fermentation variables for the fermentation of glucose and xylose using Saccharomyces cerevisiae Y-2034 and Pachysolan tannophilus Y-2460. Indian J. Biotechnol. 2013, 12, 531–536. [Google Scholar]
- Dubois, M.; Gilles, K.A.; Hamilton, J.K.; Rebers, P.A.; Smith, F. Colorimetric Method for Determination of Sugars and Related Substances. Anal. Chem. 1956, 28, 350–356. [Google Scholar] [CrossRef]
- Jiménez-Islas, D.; Páez-Lerma, J.; Soto-Cruz, N.O.; Gracida, J. Modelling of Ethanol Production from Red Beet Juice by Saccharomyces cerevisiae under Thermal and Acid Stress Conditions. Food Technol. Biotechnol. 2014, 52, 93–100. [Google Scholar]
- Juska, A. Minimal models of growth and decline of microbial populations. J. Theor. Biol. 2011, 269, 195–200. [Google Scholar] [CrossRef] [PubMed]
- Le Man, H.; Behera, S.K.; Park, H.S. Optimization of operational parameters for ethanol production from Korean food waste leachate. Int. J. Environ. Sci. Tech. 2010, 7, 157–164. [Google Scholar] [CrossRef]
- Rene, E.R.; Jo, M.S.; Kim, S.H.; Park, H.S. Statistical analysis of main and interaction effects during the removal of BTEX mixtures in batch conditions using wastewater treatment plant sludge microbes. Int. J. Environ. Sci. Technol. 2007, 4, 177–182. [Google Scholar] [CrossRef]
- Annuar, M.S.M.; Tan, I.K.P.; Ibrahim, S.; Ramachandran, K.B. A Kinetic Model for Growth and Biosynthesis of Medium-Chain-Length Poly-(3-Hydroxyalkanoates) in Pseudomonas putida. Braz. J. Chem. Eng. 2008, 25, 217–228. [Google Scholar] [CrossRef]
- Bennamoun, L.; Hiligsmann, S.; Dakhmouche, S.; Ait-Kaki, A.; Labbani, F.Z.K.; Nouadri, T.; Meraihi, Z.; Turchetti, B.; Buzziniand, P.; Thonart, P. Production and Properties of a Thermostable, pH—Stable Exo-Polygalacturonase Using Aureobasidium pullulans Isolated from Saharan Soil of Algeria Grown on Tomato Pomace. Foods 2016, 5, 72. [Google Scholar] [CrossRef] [PubMed]
- Nancib, N.; Nancib, A.; Boudrant, J. Use of waste date products in the formation of baker’s yeast biomass by Saccharomyces cerevisiae. Bioresour. Technol. 1997, 60, 67–71. [Google Scholar] [CrossRef]
- Khan, J.A.; Abulnaja, K.O.; Kumosani, T.A.; Abou-Zaid, A.A. Utilization of Saudi date sugars in production of baker’s yeast. Bioresour. Technol. 1995, 53, 63–66. [Google Scholar] [CrossRef]
- Al Obaidi, Z.S.; Mohamed, N.A.; Hasson, N.A.; Jassem, M.A. Semi-Industrial production of Baker’s yeast using date extract and molasses. J. Agric. Water Resour. Res. 1986, 5, 162–174. [Google Scholar]
- Bhushan, S.; Joshi, V.K. Baker’s yeast production under fed-batch culture from apple pomace. J. Sci. Ind. Res. 2006, 65, 72–76. [Google Scholar]
- Ardestani, F.; Shafiei, S. Non-Structured Kinetic Model for the Cell Growth of Saccharomyces cerevisiae in a Batch Culture. Iranica J. Energy Environ. 2014, 5, 8–12. [Google Scholar] [CrossRef]
- Ardestani, F.; Kasebkar, R. Non-Structured Kinetic Model of Aspergillus niger Growth and Substrate Uptake in a Batch Submerged Culture. Br. Biotechnol. J. 2014, 4, 970–979. [Google Scholar] [CrossRef]
- Kara Ali, M.; Hiligsmann, S.; Outili, N.; Cherfia, R.; KacemChaouche, N. Kinetic models and parameters estimation study of biomass and ethanol production from inulin by Pichiacaribbica (KC977491). Afr. J. Biotechnol. 2017, 16, 124–131. [Google Scholar] [CrossRef]
- Zajšek, K.; Goršek, A. Modelling of batch kefir fermentation kinetics for ethanol production by mixed natural microflora. Food Bioprod. Process. 2010, 88, 55–60. [Google Scholar] [CrossRef]
- Pazouki, M.; Najafpour, G.; Hosseini, M.R. Kinetic models of cell growth, substrate utilization and bio-decolorization of distillery wastewater by Aspergillus fumigatus UB260. Afr. J. Biotechnol. 2008, 7, 1369–1376. [Google Scholar] [CrossRef]


| Variables | Coded Levels | ||||
| −α | −1 | 0 | +1 | +α | |
| Real Values | |||||
| X1 = Temperature (°C) | 27 | 29 | 33 | 37 | 39 |
| X2 = Initial pH | 2.4 | 3.6 | 5.5 | 7.3 | 8.6 |
| X3 = concentration of sugars (g/L) | 1 | 44.1 | 107.5 | 170.9 | 214 |
| Experiments | Coded Levels | ||
|---|---|---|---|
| X1 | X2 | X3 | |
| 01 | −1 | −1 | −1 |
| 02 | +1 | −1 | −1 |
| 03 | −1 | +1 | −1 |
| 04 | +1 | +1 | −1 |
| 05 | −1 | −1 | +1 |
| 06 | +1 | −1 | +1 |
| 07 | −1 | +1 | +1 |
| 08 | +1 | +1 | +1 |
| 09 | −1.68 | 0 | 0 |
| 10 | +1.68 | 0 | 0 |
| 11 | 0 | −1.68 | 0 |
| 12 | 0 | +1.68 | 0 |
| 13 | 0 | 0 | −1.68 |
| 14 | 0 | 0 | +1.68 |
| 15 | 0 | 0 | 0 |
| 16 | 0 | 0 | 0 |
| 17 | 0 | 0 | 0 |
| 18 | 0 | 0 | 0 |
| 19 | 0 | 0 | 0 |
| 20 | 0 | 0 | 0 |
| Experiments | Actual Values | ||
|---|---|---|---|
| Temperature (°C) | Initial pH | Sugars Concentration (g/L) | |
| 01 | 29 | 3.6 | 44.1 |
| 02 | 37 | 3.6 | 44.1 |
| 03 | 29 | 7.3 | 44.1 |
| 04 | 37 | 7.3 | 44.1 |
| 05 | 29 | 3.6 | 170.9 |
| 06 | 37 | 3.6 | 170.9 |
| 07 | 29 | 7.3 | 170.9 |
| 08 | 37 | 7.3 | 170.9 |
| 09 | 27 | 5.5 | 107.5 |
| 10 | 39 | 5.5 | 107.5 |
| 11 | 33 | 2.4 | 107.5 |
| 12 | 33 | 8.6 | 107.5 |
| 13 | 33 | 5.5 | 1 |
| 14 | 33 | 5.5 | 214 |
| 15 | 33 | 5.5 | 107.5 |
| 16 | 33 | 5.5 | 107.5 |
| 17 | 33 | 5.5 | 107.5 |
| 18 | 33 | 5.5 | 107.5 |
| 19 | 33 | 5.5 | 107.5 |
| 20 | 33 | 5.5 | 107.5 |
| Kinetic Models | Equations | Linearized Form | Description | Symbols |
|---|---|---|---|---|
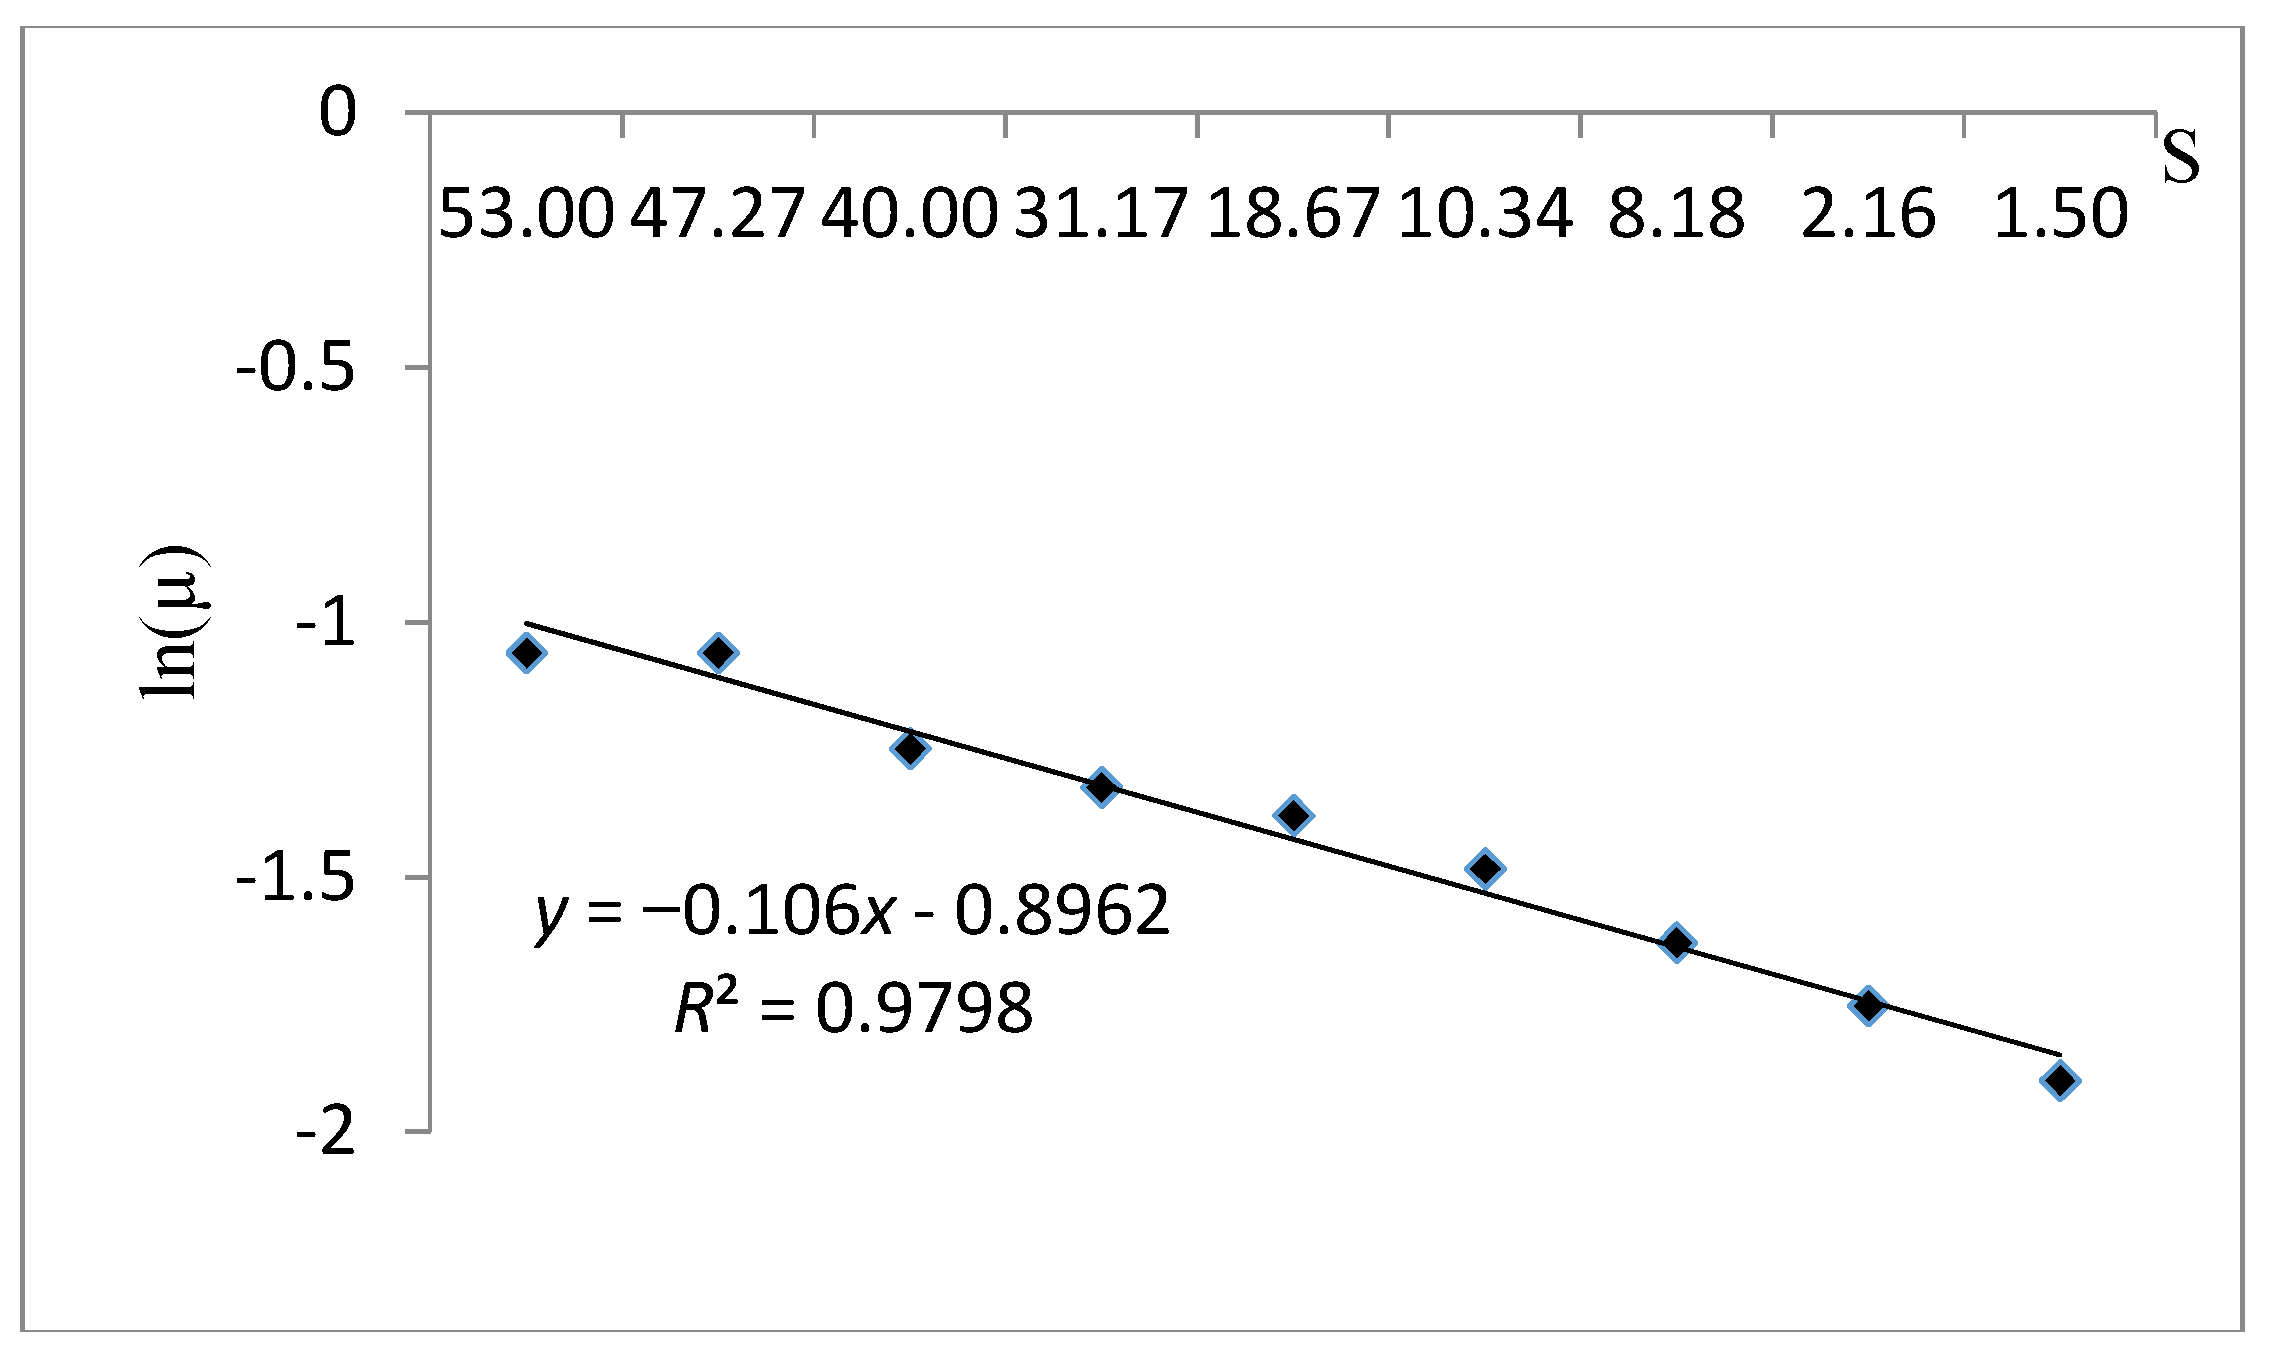
| Monod | Monod kinetic model is a substrate concentration dependent. | : is the specific growth rate (h−1). : is the maximum specific growth rate (h−1). : is the half-saturation constant (g/L). S: is the concentration in limiting substrate (g/L). : is the biomass concentration (g/L). : is the Maximum biomass concentration (g/L). | ||
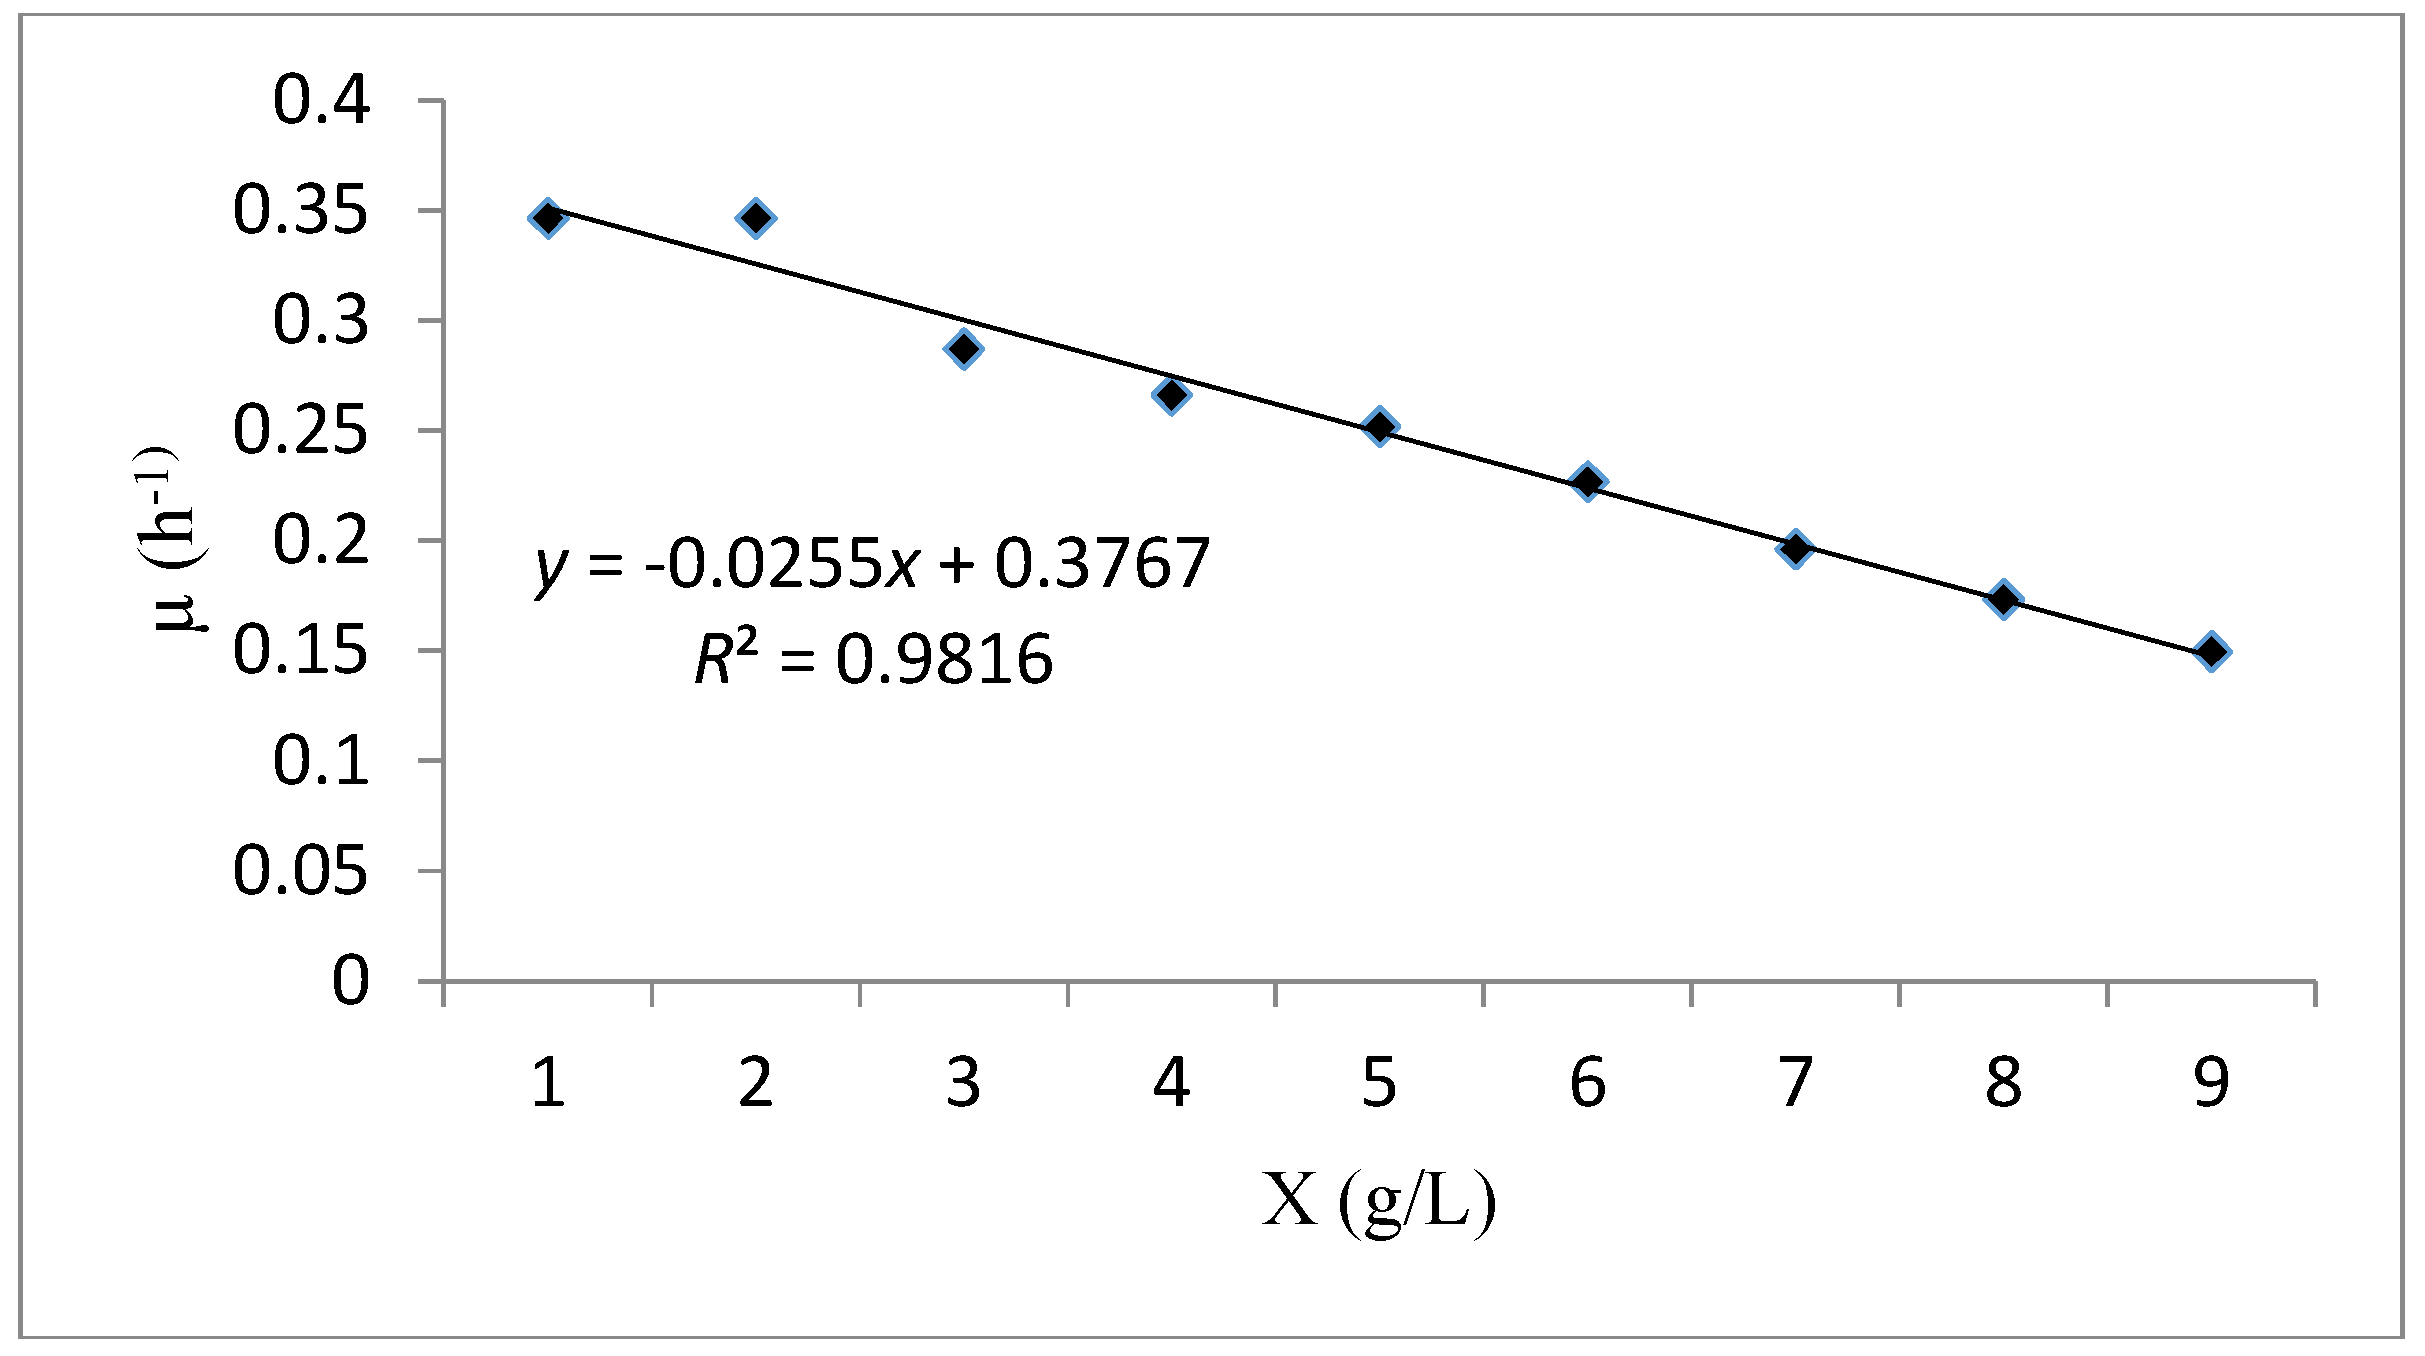
| Verhulst | Verhulst kinetic model is an unstructured model depends on biomass concentration. | |||
| Tessier | Tessier is an unstructured model for a substrate concentration dependent. |
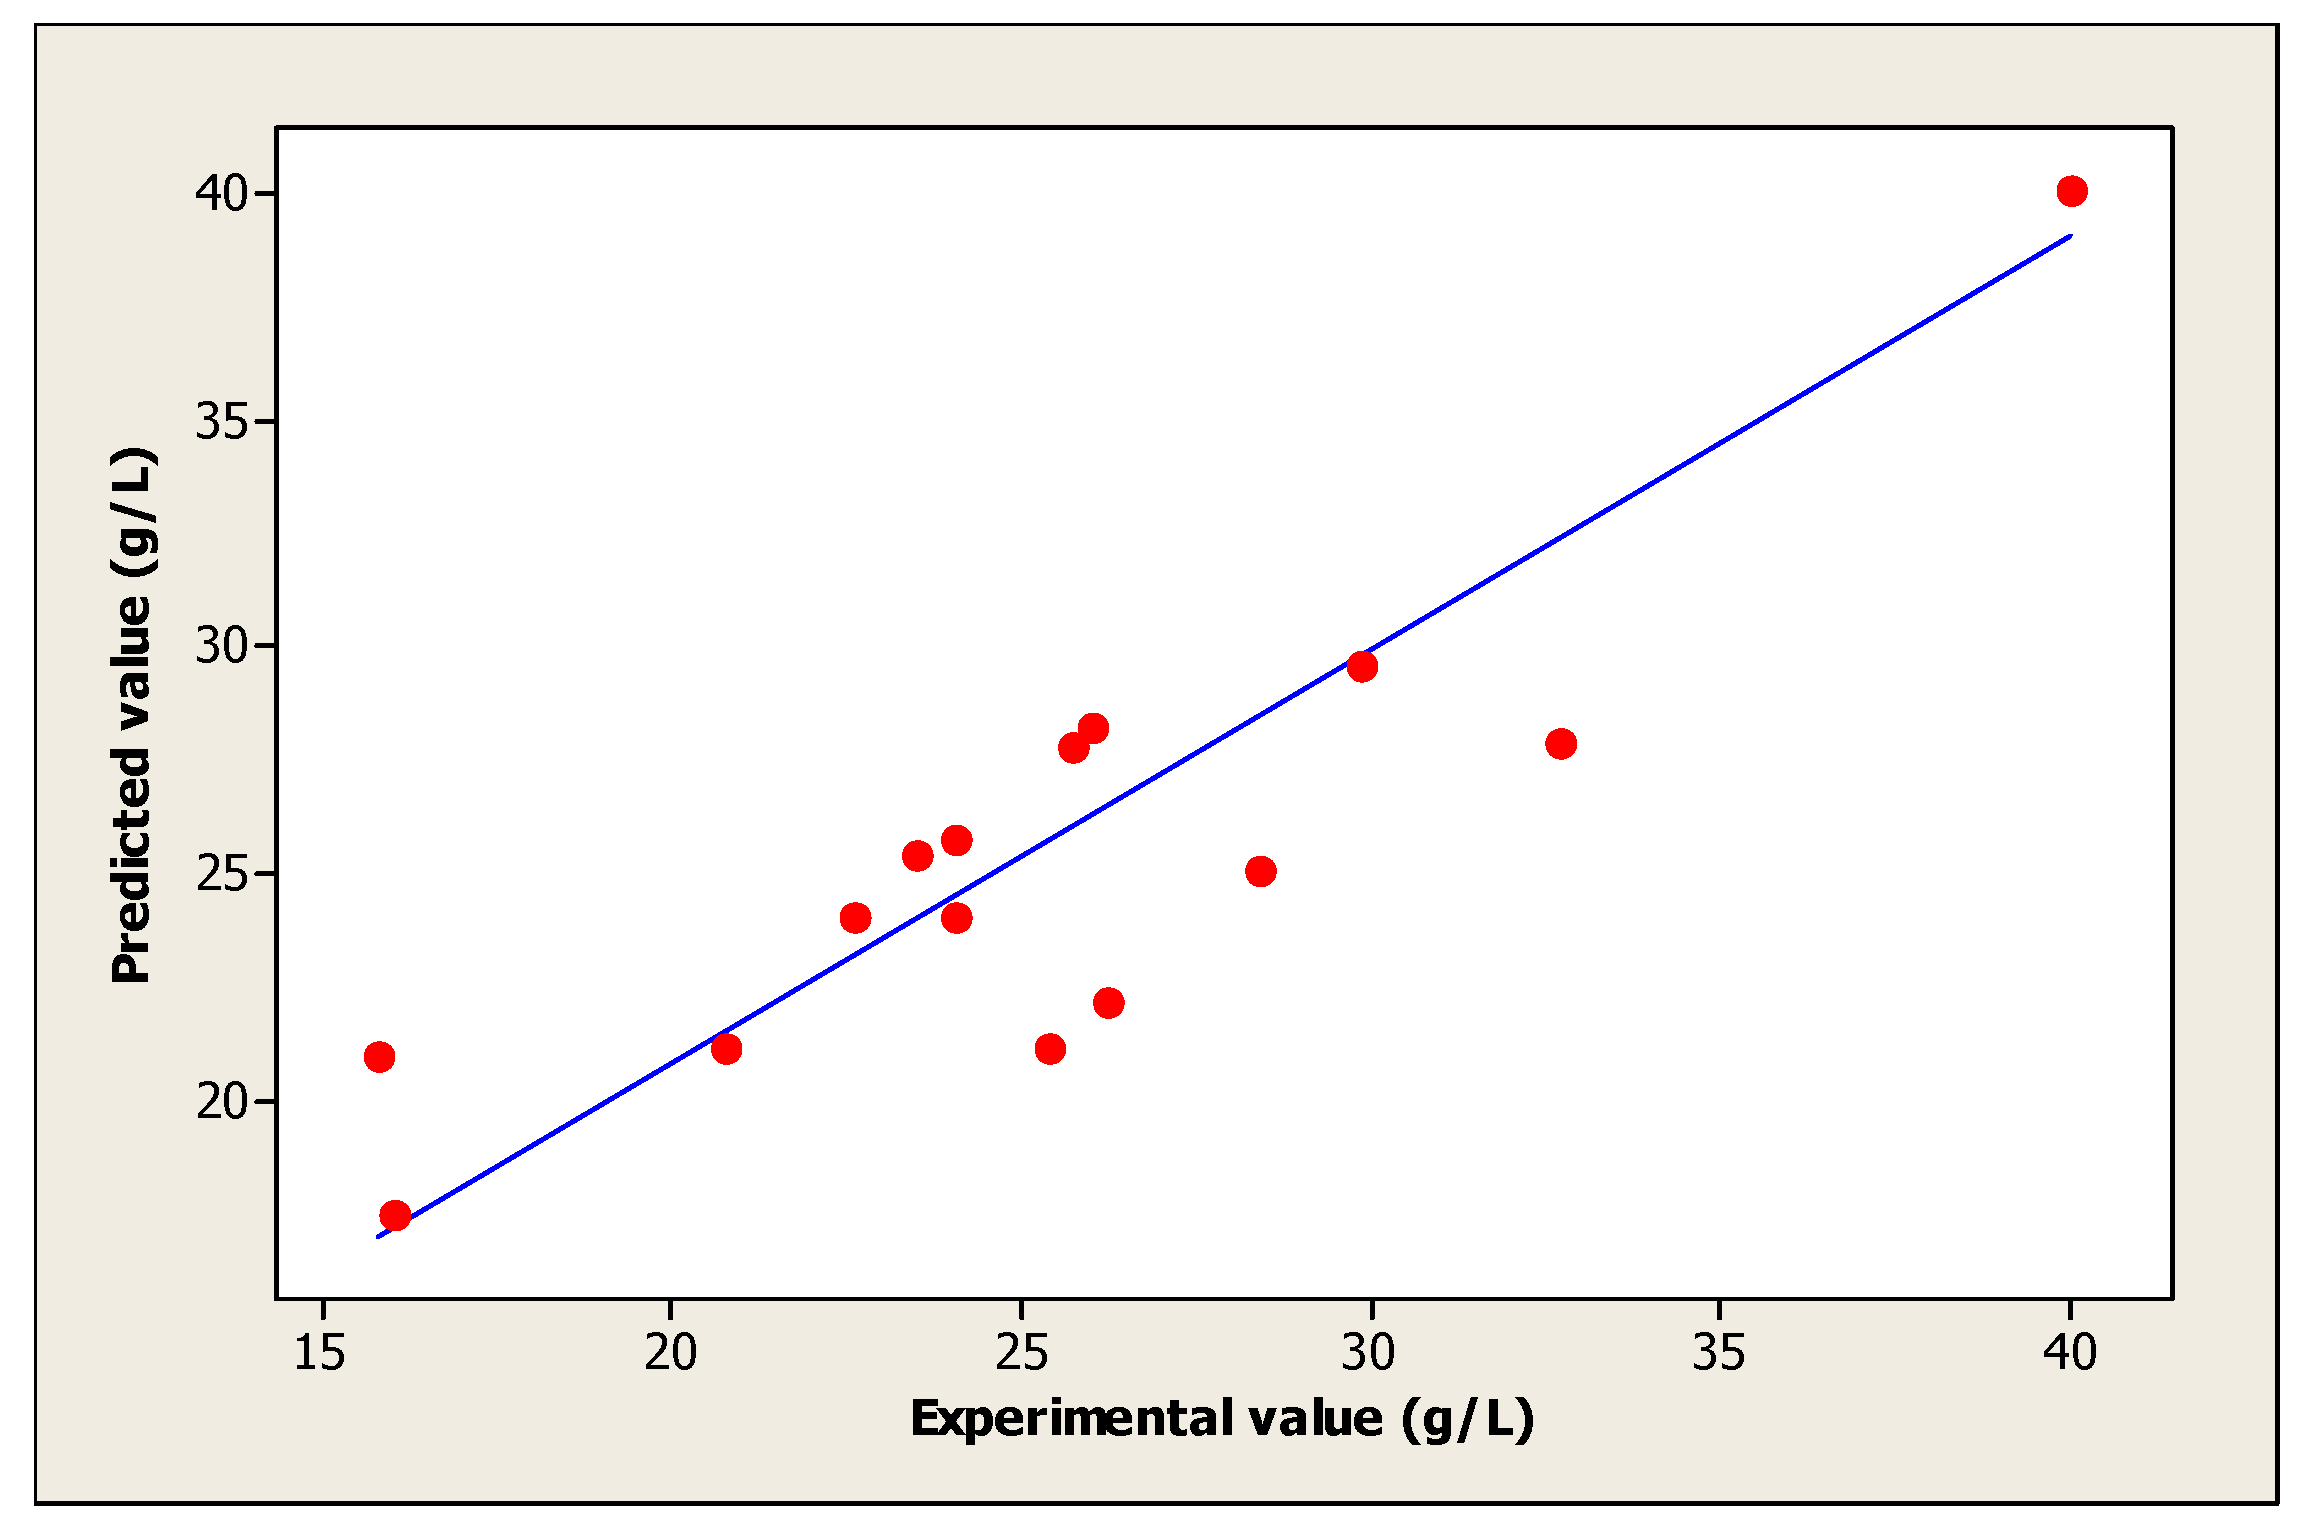
| Experiments | Coded Levels | Real Values | (Yi): Biomass (g/L) | |||||
|---|---|---|---|---|---|---|---|---|
| X1 | X2 | X3 | Temperature (°C) | Initial pH | Concentration of Sugar (g/L) | Observed Mean Values * | Predicted Values | |
| 01 | −1 | −1 | −1 | 29 | 3.6 | 44.1 | 24.07 | 23.99 |
| 02 | +1 | −1 | −1 | 37 | 3.6 | 44.1 | 15.99 | 17.45 |
| 03 | −1 | +1 | −1 | 29 | 7.3 | 44.1 | 25.70 | 27.80 |
| 04 | +1 | +1 | −1 | 37 | 7.3 | 44.1 | 15.79 | 20.98 |
| 05 | −1 | −1 | +1 | 29 | 3.6 | 170.9 | 28.40 | 25.05 |
| 06 | +1 | −1 | +1 | 37 | 3.6 | 170.9 | 29.86 | 29.59 |
| 07 | −1 | +1 | +1 | 29 | 7.3 | 170.9 | 20.78 | 21.16 |
| 08 | +1 | +1 | +1 | 37 | 7.3 | 170.9 | 23.51 | 25.42 |
| 09 | −1.68 | 0 | 0 | 27 | 5.5 | 107.5 | 22.61 | 24.06 |
| 10 | +1.68 | 0 | 0 | 39 | 5.5 | 107.5 | 26.20 | 22.15 |
| 11 | 0 | −1.68 | 0 | 33 | 2.4 | 107.5 | 26.00 | 28.21 |
| 12 | 0 | +1.68 | 0 | 33 | 8.6 | 107.5 | 32.72 | 27.90 |
| 13 | 0 | 0 | −1.68 | 33 | 5.5 | 1 | 25.37 | 21.09 |
| 14 | 0 | 0 | +1.68 | 33 | 5.5 | 214 | 24.04 | 25.71 |
| 15 | 0 | 0 | 0 | 33 | 5.5 | 107.5 | 40.00 | 40.07 |
| 16 | 0 | 0 | 0 | 33 | 5.5 | 107.5 | 40.00 | 40.07 |
| 17 | 0 | 0 | 0 | 33 | 5.5 | 107.5 | 40.00 | 40.07 |
| 18 | 0 | 0 | 0 | 33 | 5.5 | 107.5 | 40.00 | 40.07 |
| 19 | 0 | 0 | 0 | 33 | 5.5 | 107.5 | 40.00 | 40.07 |
| 20 | 0 | 0 | 0 | 33 | 5.5 | 107.5 | 40.00 | 40.07 |
| Terms | Coefficients | Square Error | t-Value | p |
|---|---|---|---|---|
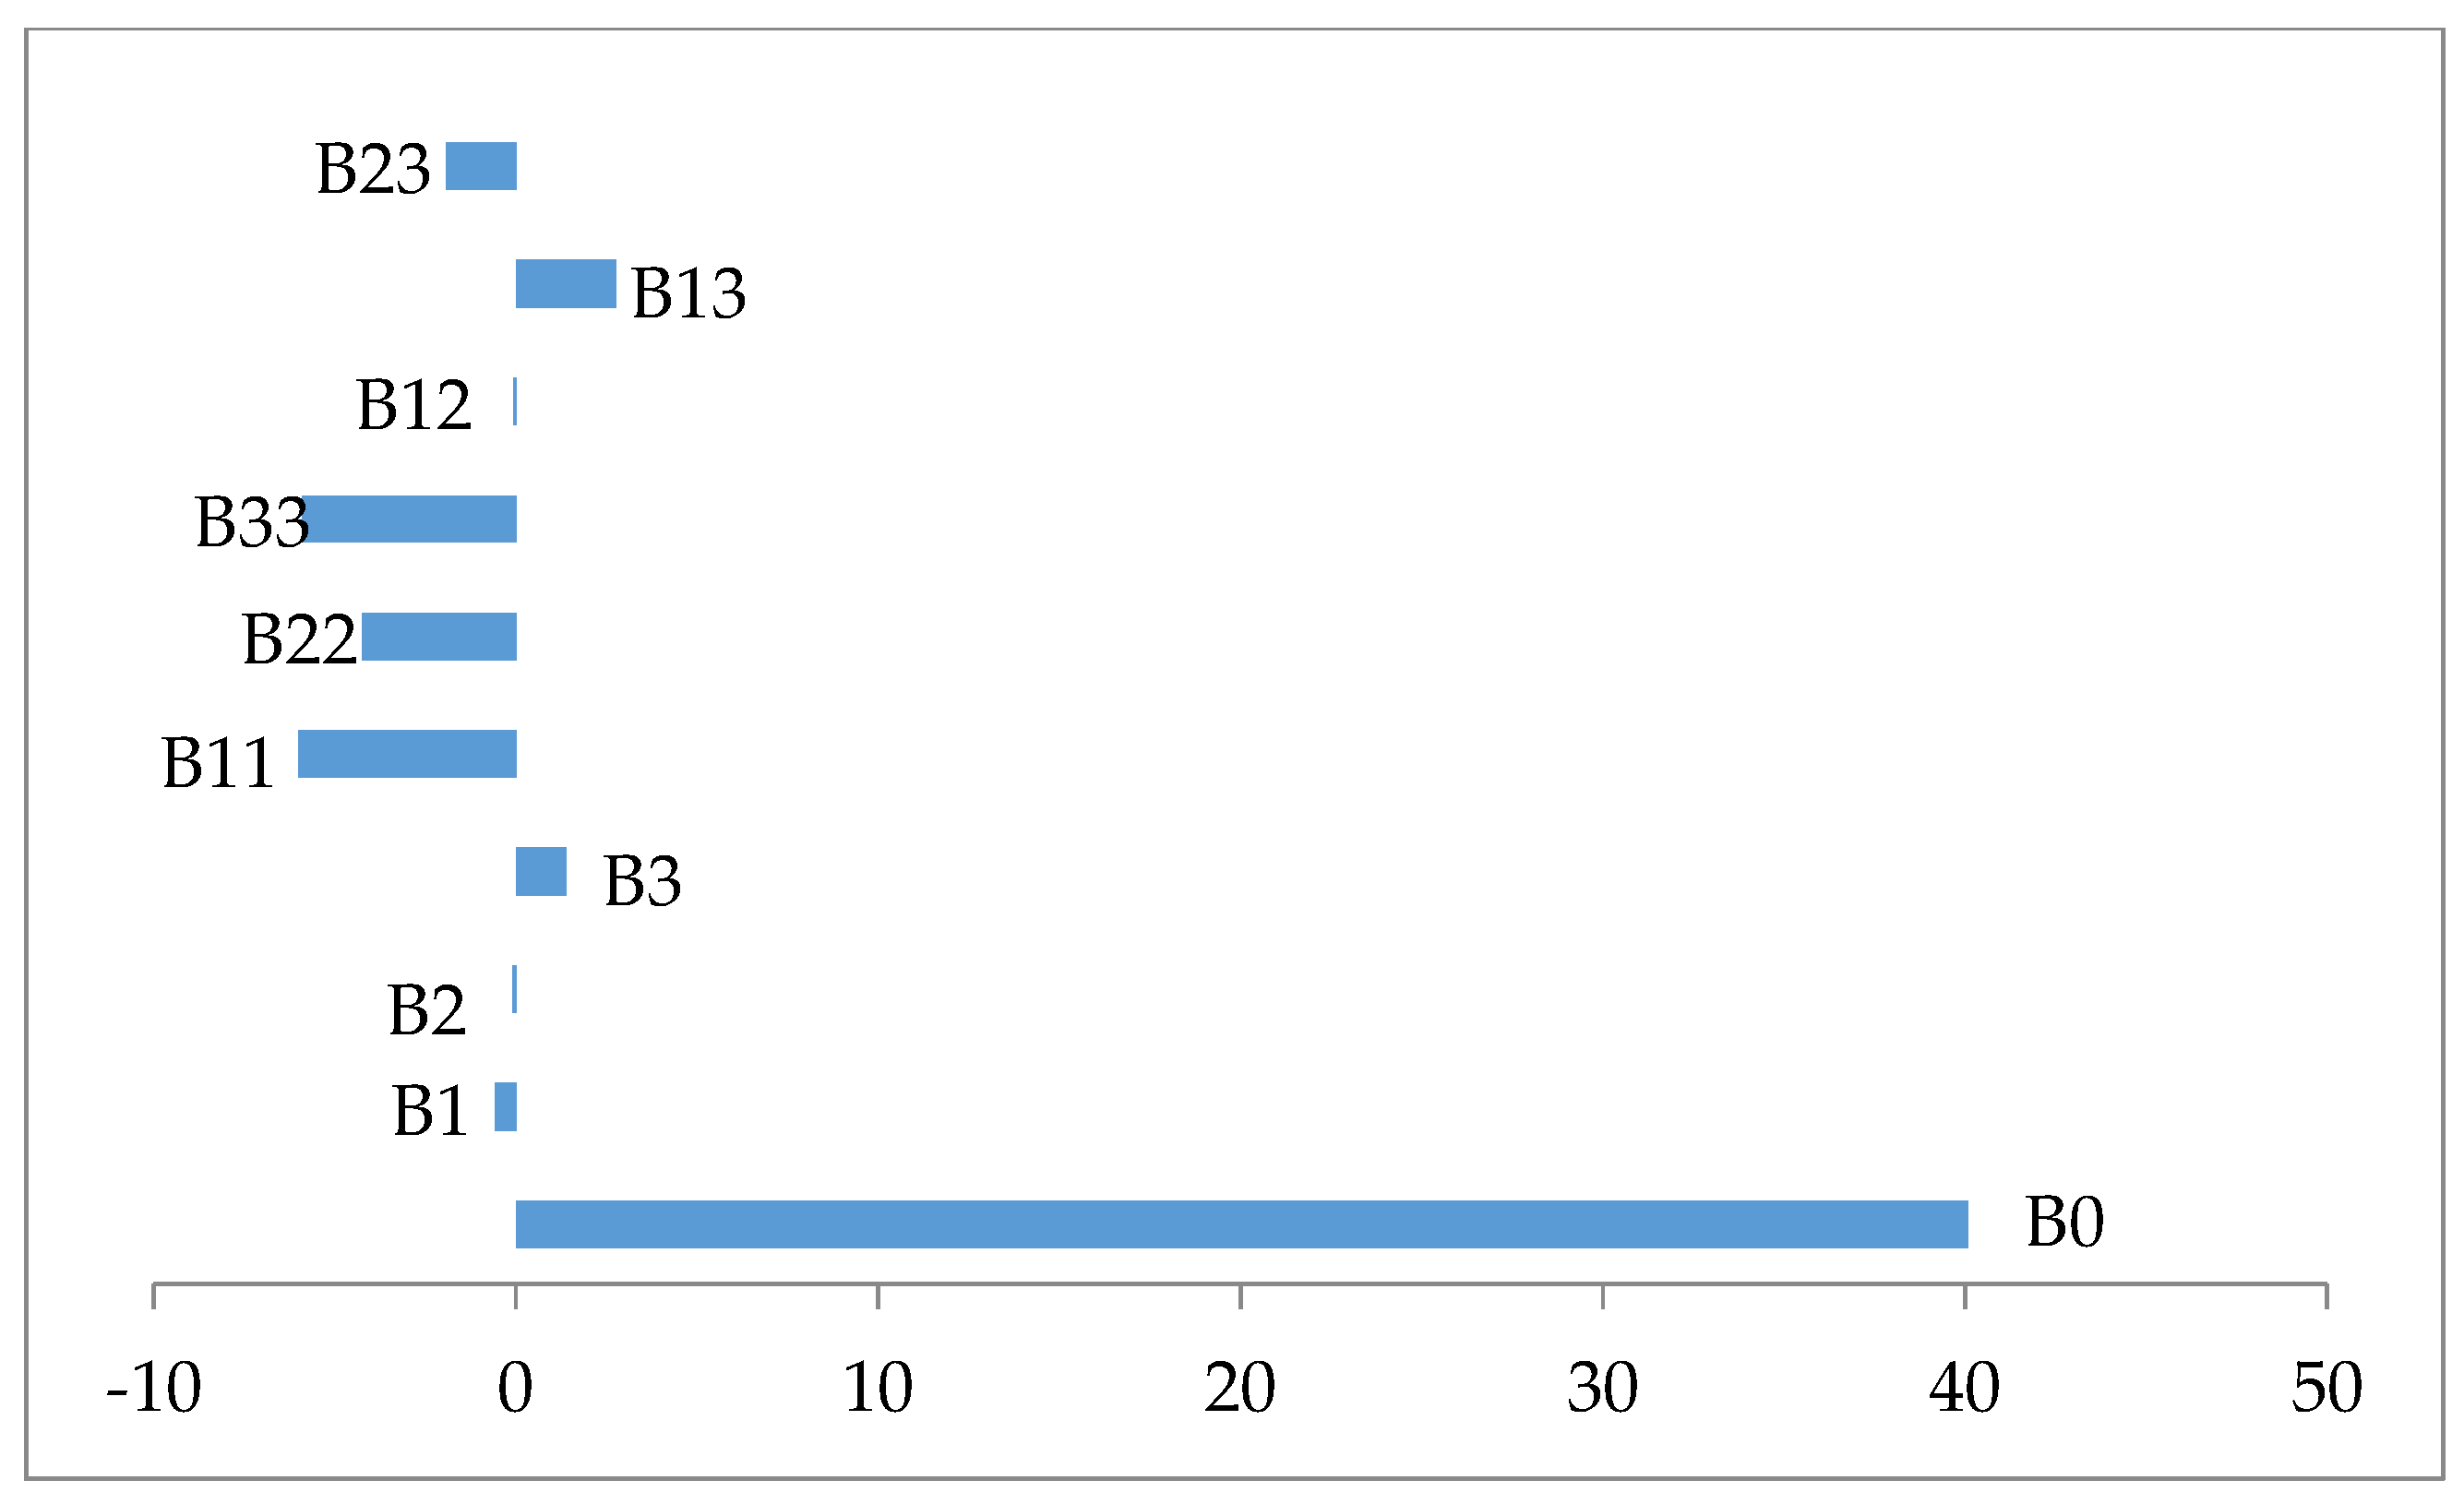
| β0 | 40.0744 | 1.3912 | 28.806 | 0.000 |
| β1 | −0.5684 | 0.9230 | −0.616 | 0.552 |
| β2 | −0.0907 | 0.9230 | −0.098 | 0.924 |
| β3 | 1.3739 | 0.9230 | 1.488 | 0.167 |
| β11 | −6.0000 | 0.8985 | −6.677 | 0.000 |
| β22 | −4.2481 | 0.8985 | −4.728 | 0.001 |
| β33 | −5.8939 | 0.8985 | −6.559 | 0.000 |
| β12 | −0.0700 | 1.2060 | −0.058 | 0.955 |
| β13 | 2.7725 | 1.2060 | 2.299 | 0.044 |
| β23 | −1.9250 | 1.2060 | −1.596 | 0.142 |
| Source | DF | Seq SS | Adj SS | Adj MS | F | p |
|---|---|---|---|---|---|---|
| Regression | 9 | 1196.65 | 1196.65 | 132.961 | 11.43 | 0.000 |
| Linear | 3 | 30.30 | 30.30 | 10.101 | 0.87 | 0.489 |
| A | 1 | 4.41 | 4.41 | 4.412 | 0.38 | 0.552 |
| B | 1 | 0.11 | 0.11 | 0.112 | 0.01 | 0.924 |
| C | 1 | 25.78 | 25.78 | 25.779 | 2.22 | 0.167 |
| Square | 3 | 1075.17 | 1075.17 | 358.390 | 30.80 | 0.000 |
| A*A | 1 | 379.27 | 518.80 | 518.799 | 44.59 | 0.000 |
| B*B | 1 | 195.28 | 260.07 | 260.071 | 22.35 | 0.001 |
| C*C | 1 | 500.62 | 500.62 | 500.618 | 43.03 | 0.000 |
| Interaction | 3 | 91.18 | 91.18 | 30.393 | 2.61 | 0.109 |
| A*B | 1 | 0.04 | 0.04 | 0.039 | 0.00 | 0.955 |
| A*C | 1 | 61.49 | 61.49 | 61.494 | 5.29 | 0.044 |
| B*C | 1 | 29.64 | 29.64 | 29.645 | 2.55 | 0.142 |
| Residual Error | 10 | 116.35 | 116.35 | 11.635 |
| Kinetic Models | Parameters Estimation | |||
|---|---|---|---|---|
| R2 | Ks (g/L) | μmax (h−1) | Xm | |
| Monod | 0.945 | 0.228 | 0.496 | - |
| Verhulst | 0.981 | - | 0.376 | 15.04 |
| Tessier | 0.979 | −9.434 | 0.408 | |
© 2017 by the authors. Licensee MDPI, Basel, Switzerland. This article is an open access article distributed under the terms and conditions of the Creative Commons Attribution (CC BY) license (http://creativecommons.org/licenses/by/4.0/).
Share and Cite
Kara Ali, M.; Outili, N.; Ait Kaki, A.; Cherfia, R.; Benhassine, S.; Benaissa, A.; Kacem Chaouche, N. Optimization of Baker’s Yeast Production on Date Extract Using Response Surface Methodology (RSM). Foods 2017, 6, 64. https://doi.org/10.3390/foods6080064
Kara Ali M, Outili N, Ait Kaki A, Cherfia R, Benhassine S, Benaissa A, Kacem Chaouche N. Optimization of Baker’s Yeast Production on Date Extract Using Response Surface Methodology (RSM). Foods. 2017; 6(8):64. https://doi.org/10.3390/foods6080064
Chicago/Turabian StyleKara Ali, Mounira, Nawel Outili, Asma Ait Kaki, Radia Cherfia, Sara Benhassine, Akila Benaissa, and Noreddine Kacem Chaouche. 2017. "Optimization of Baker’s Yeast Production on Date Extract Using Response Surface Methodology (RSM)" Foods 6, no. 8: 64. https://doi.org/10.3390/foods6080064