The Social Investment Capital and the Cargo Volume Transported by Sea: A VAR Approach for Vietnam

1
Division of Basic Economics, Economics Faculty, Vietnam Maritime University, 384 Lach Tray Street, Hai Phong City 180000, Vietnam
2
Division of Global Studies and Maritime Affairs, Economics Faculty, Vietnam Maritime University, 384 Lach Tray Street, Hai Phong City 180000, Vietnam
3
Division of International Trade, Economics Faculty, Vietnam Maritime University, 384 Lach Tray Street, Hai Phong City 180000, Vietnam
*
Authors to whom correspondence should be addressed.
Logistics 2017, 1(2), 8; https://doi.org/10.3390/logistics1020008
Submission received: 6 March 2017
/
Revised: 8 September 2017
/
Accepted: 14 September 2017
/
Published: 26 September 2017
(This article belongs to the Special Issue Sharing Economics and the Innovation of Asian Shipping and Logistics Industry—Selected Papers from the 9th International Conference of Asian Shipping and Logistics)
Abstract
:Social investment capital is one of the factors in Vietnam’s economic growth. It also has a broad impact on many manufacturing and service sectors in the national economy, including maritime transport. This article will apply a quantitative method named vector autoregression (VAR) to define the impacts of social investment capital on the quantity of cargo transported by sea. Special attention will be paid to investment from the government and foreign investors. Recommendations will be suggested to improve the current situation of shipping companies in particular, and the shipping industry in general in Vietnam.
1. Introduction
Many authors have written about sea transported volume (or seaborne trade volume). Those papers focus on the relationship between the national or international sea transported volume and some main national industries or factors. Tsung-Chen Lee, Chia-Hsuan Wu, and Paul T.-W. Lee have cited their analysis in the paper “Impacts of the ECFA on seaborne trade volume and policy development for shipping and port industry in Taiwan” (2011) [1]. This paper used a global computable general equilibrium model, a global trade analysis project, and a value-to-volume conversion to arrive at quantitative estimates of the new seaborne cargo volumes resulting from a free trade agreement between Taiwan and China—namely, the Economic Cooperation Framework Agreement (ECFA). The approach was designed to model asymmetric impacts of tariff removal and economy-wide interactions caused by the ECFA arriving at estimation in cargo value flows. Then, a scientific approach was developed to convert the estimated cargo value flows into volume flows. The paper also regarded the converted trade volume, the exports of non-containerized and containerized cargo to China. Another paper is “An Evaluation of Nigeria’s Seaborne Trade and Demand for Sea Transport” by Onwuegbuchunam Donatus and Okeudo Geraldine (2012) [2]. The authors mentioned the strategic objective of maritime nations to develop and sustain an indigenous merchant marine to be able to participate in cargo lifting in the international seaborne shipping trade, and thus to earn shipping freight revenues. Successful implementation and appraisal of these policies arguably depend on quantitative estimation of shipping tonnage demand and other freight market indices. This paper attempts an exploratory analysis of shipping tonnage demand in Nigeria’s non-oil freight market. Based on shipment level data obtained from port terminals’ records, we conducted a parametric analysis to determine the demand for shipping tonnage and shipping routes showing intense transport demand. Trend analysis of aggregated trade volumes was conducted to examine the viability of Nigeria’s seaborne trade in the short-term. Policy framework aimed at the development of indigenous shipping tonnage capacity, trade facilitation, and sustenance is proposed. Another paper, “Creating Social Capital in Russia: The Novgorod Model”, was written by Nicolai N Petro, (2001) [3]. The Novgorod region of Russia displays high levels of economic performance, trust in government, and associational activity—three common indicators of high levels of social investment capital. This paper traces the high level of social investment capital in the region to local government’s efforts to promote an historical image of the region’s success and to show that even in the absence of a national consensus, local governments can do much to establish common social values and priorities for their communities.
Many researchers have written about social investment capital. However, most of the papers relate to their country’s social capital; for example, José Ramon Montero and Mariano Torcal in the paper “Political Dissatisfaction in Contemporary Democracies: Social capital, institutions, and politics” (2012) [4]; “The Otavalo trade diasporas: social capital and transnational entrepreneurship” of David Kyle (2011) [5]; “Social capital and the transition to democracy” of Gabriel Badescu and Eric M. Uslaner”(2003) [6]; “Stakeholder relations as social capital in early modern international trade” by Jari Ojala and Vilma Lounma-aho (2008) [7]; and “Social capital, institutional innovation and Atlantic trade before 1800” by Robin Pearson and David Richardson [8]. In Vietnam, there are also some papers which are listed hereby: “Enhancing the effects of social capital allocation in farming industry of Thua Thien—Hue Province” (2015, Tran Viet Nguyen) [9]; “The fact of the public social capital” (2013, Trinh Mai Van, Nguyen Van Dai) [10]; “Administrating the social capital for infrastructure” (2014, Ho Thi Mai Huong) [11].
There are many authors from developed countries such as Australia, Norway, America, Germany, etc. and developing ones as well like Romania, Sri Lanka, China, etc. who have been using VAR models for their research. “A VAR Model for monetary policy analysis in a small open economy” (1999) from the authors Tor Jacobson, Per Jansson, Anders Vredin, Anders Warne; “A structure VAR Model of the Australian Economy” (1999) from Mardi Dungey and Adrian Pagan applied a VAR model to analyze the relationship between the macro variables of monetary policy and the small–sized opened economy [12,13]. Another papers used VAR named “VAR Models in Macroeconomic Research” (2000) of Hilde Christiane Bjornland [14] and “Monetary Policy and the Real Economy: A structural VAR approach for Sri Lanka” (2013) of Thanabalasingam Vinayagathasan. The authors have emphasized the important role of monetary policy in economic growth [15]. “Exports and Economic Growth in Saudi Arabia: A VAR Model Analysis” (2006), Hasan Alhajhoj stated that export and economic growth have a mutual relation [16]. Another paper that also used VAR model to cite the influence of foreign direct investment to economic growth in Romania is “A VAR analysis of the connection between FDI and economic growth in Romania” (2012) by Bianca Maria Ludosean [17].
Indeed, there is no paper mentioning the relationship between social investment capital and the sea transported volume, especially in Vietnam. This paper analyses the impacts of foreign direct investment, as well as public and private investment capital to the total cargo volume of seaborne trade.
2. Current State of Carriage of Goods by Sea and Social Investment Capital in Vietnam
2.1. Current State of Carriage of Goods by Sea
International trade in Vietnam has been growing significantly over the past 15 years, especially as Vietnam became the 150th member of the World Trade Organization (WTO).
In recent years, Vietnam’s economy has witnessed a steady growth of 8%, and the volume of foreign trade goods increased rapidly. Imported and exported goods in Vietnam are mainly transported by sea, accounting for about 80%.
Sea transport of cargo by the Vietnamese fleet has many advantages compared with other modes of transport, because of the favorable geographical location, low transportation cost, a large volume capability, and wide range of transport. Therefore, transporting cargo by sea has been constantly growing, and has been contributing significantly to the economic development of the country.
2.1.1. Volume of Sea Transport of Shipping Companies in Vietnam
In the period from 2000 to 2015, the volume of cargo transported by sea via Vietnam shipping companies grew by an average of 10.9 percent per year. Regarding the total shipping volume in the period from 2002 to 2012, domestic sea transport accounted for about 30%, whereas foreign sea transport comprised around 70%; however, from 2013 onwards, the output of domestic sea transport has been increasing dramatically, meanwhile the output of foreign sea transport declined. Until 2014, the output of domestic sea transport accounted for 70%, and the rest was foreign sea transport, being about 30% of the total output of Vietnam sea transport.
2.1.2. Shipping Fleet
The number of vessels has grown rapidly in terms of number, tonnage, and type of ship. The number of vessels experienced a massive development in the early years of the 20th century; the majority are unspecialized small-sized vessels. The majority of Vietnam’s fleet structure is bulk carriers, whereas container ships account for only 5%. The average age of the Vietnam fleet at present is 17 years old, which is relatively high compared to the average age of effective operation of the world fleet (around 10 years old); this affects the technical features, the modernity level, and the ability to ensure the safety and efficiency of fleet operation [18] (see Table 1)
2.1.3. Shipping Market Share
Shipping companies in Vietnam are now facing difficulties in gaining market share in their home market. The ocean shipping market is experiencing very fierce competition. Vietnam’s fleet mainly serves Asian or domestic routes or serves as feeders for major carriers. European and American trade routes are dominated by foreign fleet. This is partly due to the trading custom of purchasing and selling under CIF (Cost, Insurance, Freight) and FOB (Free on Board) conditions under Incoterms of International Chamber of Commerce (ICC), respectively. In recent years, Vietnam’s fleet is struggling to gain overseas freight.
With over 80% of Vietnam’s import and export cargo volume, the Vietnamese fleet can carry out approximately 10 to 12% of the above volume. The Vietnamese fleet handles the entire domestic carriage by sea. However, for import and export transportation, 10% to 12% market share is too small compared to our fleet’s potential. Current maritime transport accounts for only 17% to 19% compared with other modes of transport, and maritime passenger transport is almost negligible. This does not reflect our comparative advantages and maritime transport’s potential, nor does it positively reduce the workload for road transport (currently accounting for 74%).
The above results show that Vietnam’s maritime transport holds an important role in the maritime sector and transport. It has made great contribution to the development of the maritime sector and our national development.
2.2. Current State of Total Social Investment Capital in Vietnam
Investment capital in social development is one of the physical factors directly affecting economic growth, stability, and social development, as well as environmental protection and improvement—that is, the capital spending (expenditure) to increase or maintain production capacity and resources to improve the physical and spiritual life of the entire society in a given period (month, quarter, year). The nature of total investment for social development includes investment from the public sector, private sector, and foreign direct investment.
Over the last 30 years, investment for social development has positioned itself as the key factor in the economic growth of Vietnam. In the early years of innovation, from a low base with negligible accumulation of capital, a rapid increase in investment has generated a large number of jobs, improved labor productivity, and contributed significantly to the economic development of Vietnam. Recognizing the importance of investment for the development of the national economy, the government of Vietnam has implemented a series of policies to attract investment from all economic sectors.
In 2000, the State sector had significant importance, occupying 59% of the total investment. However, since 2007, thanks to strong growth, investment from the private sector has reached 40%.
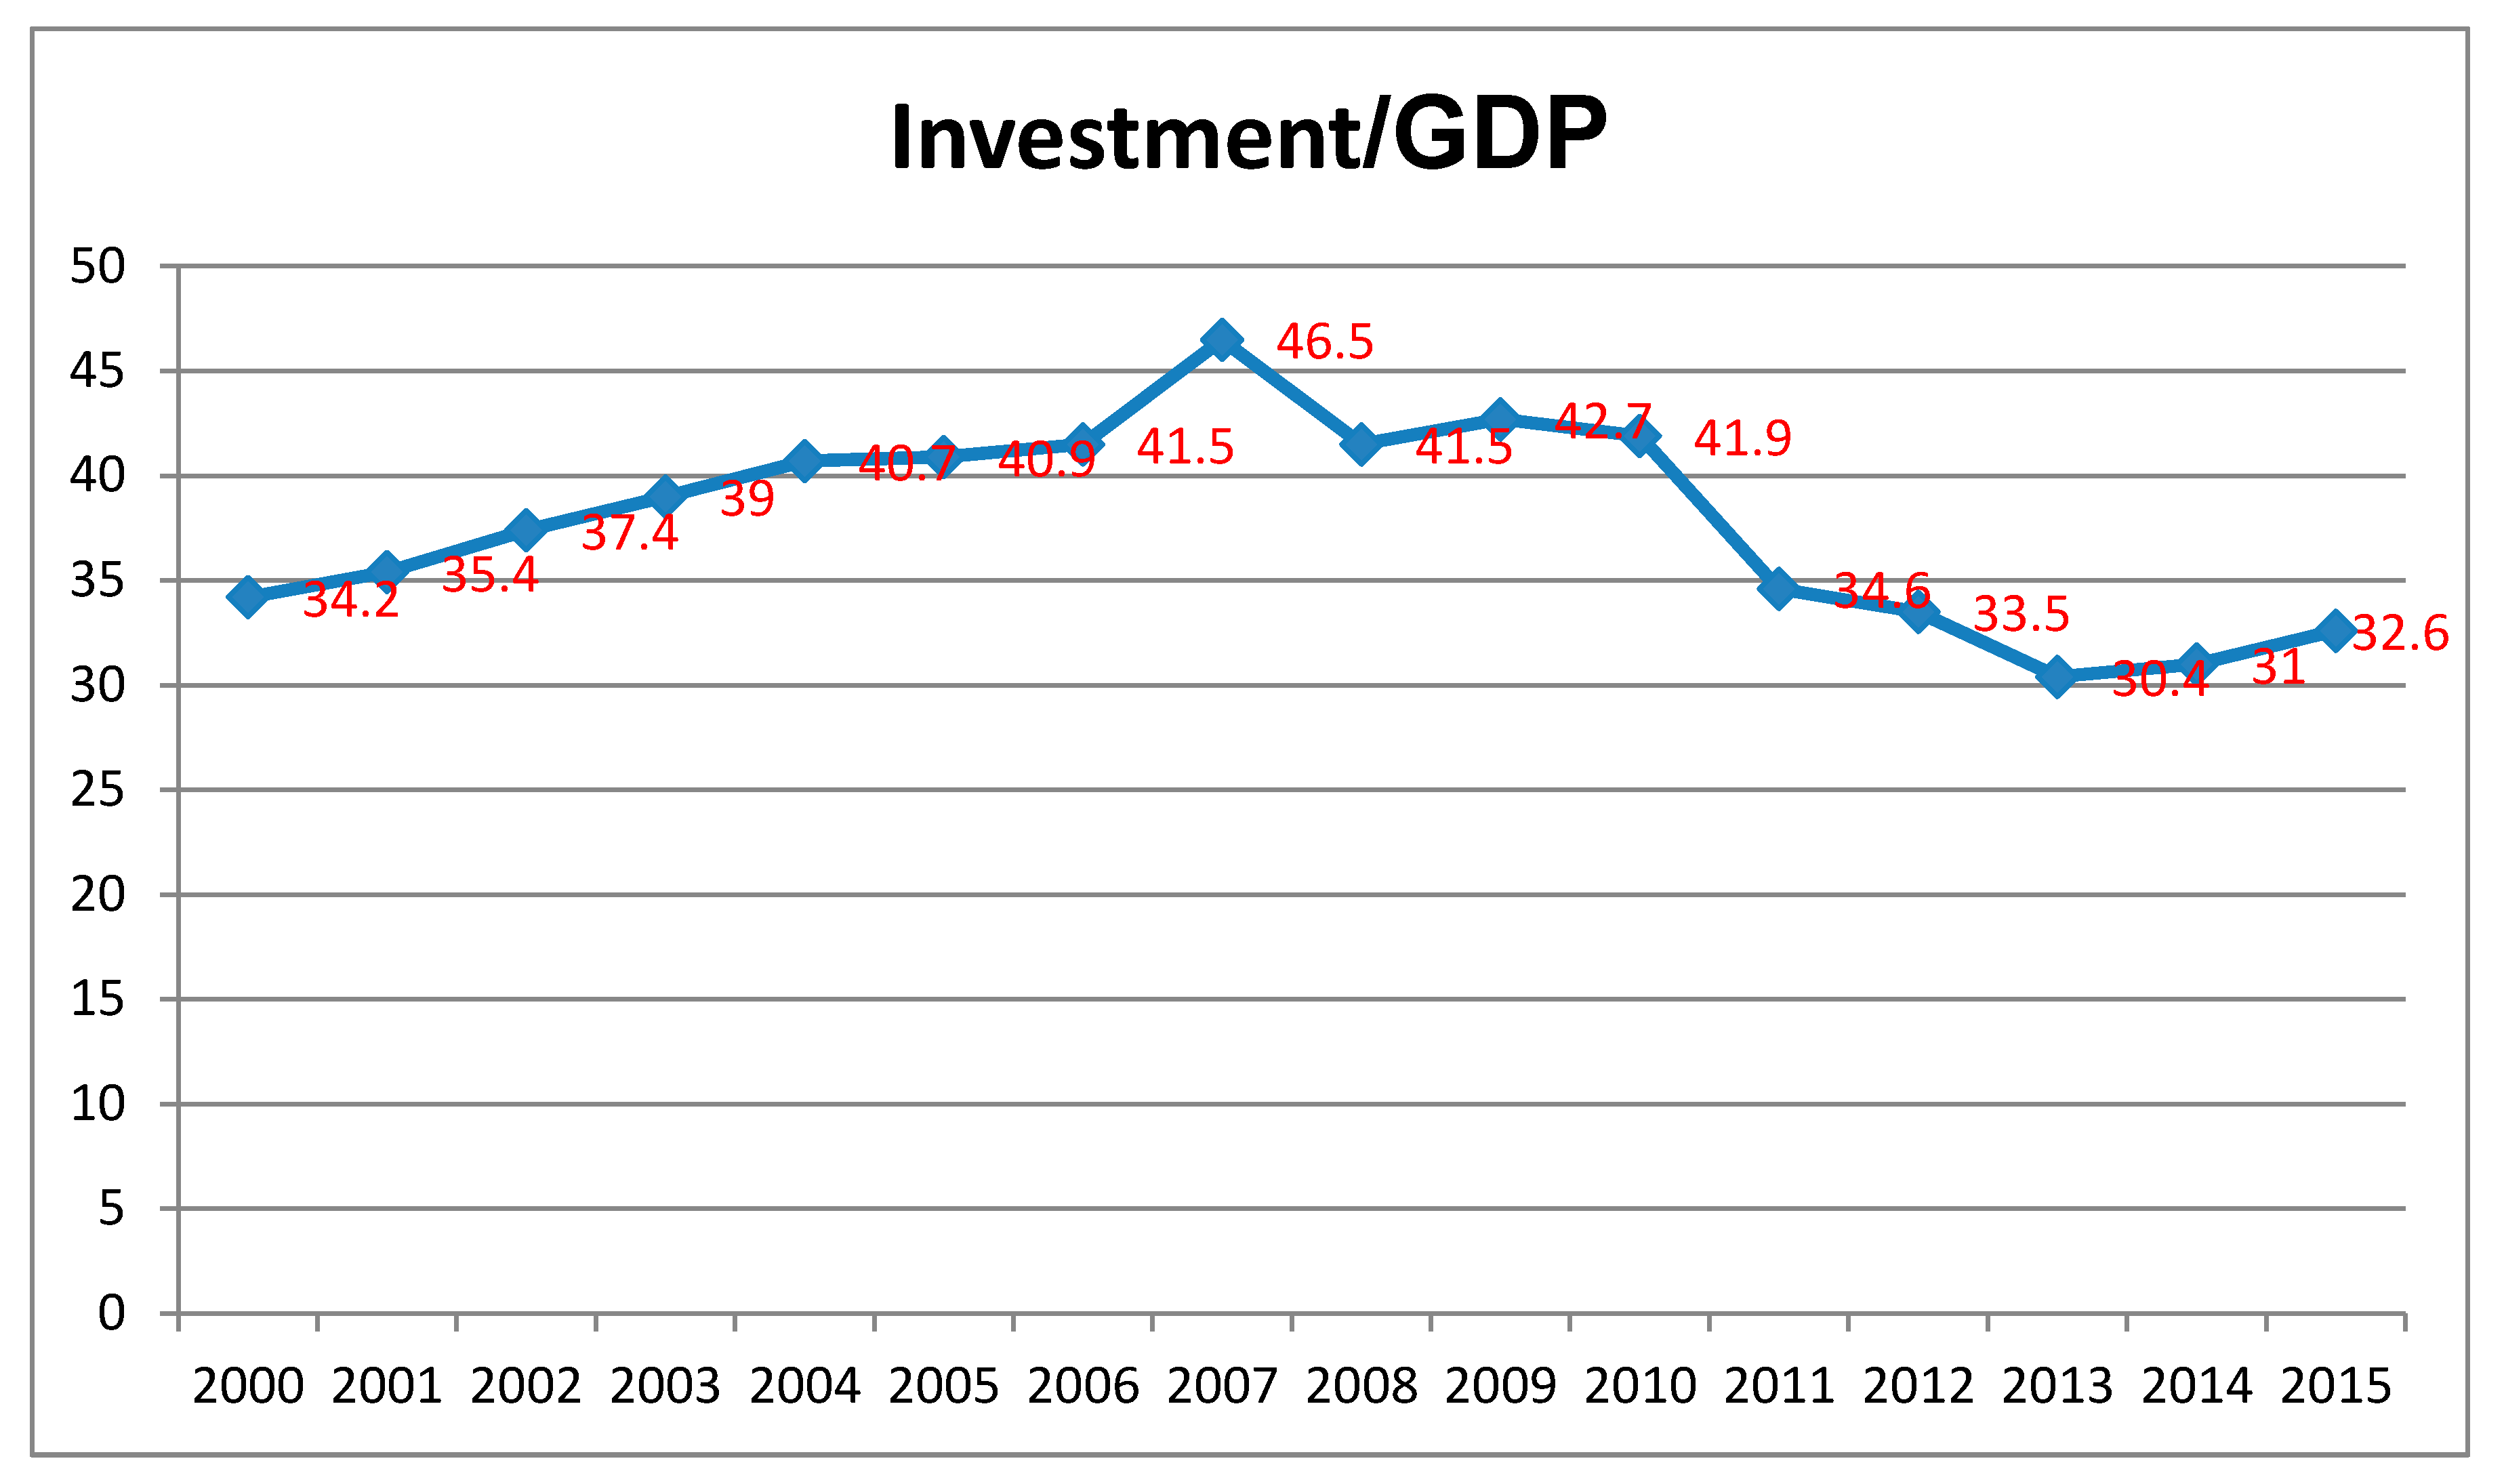
During the period of 2000–2007, social investment per GDP followed an upward trend and reached 46.5% in 2007. On the other hand, the economic crisis in 2008 slowed down this rate due to the impacts of a decrease in foreign direct investment and the Vietnamese Government’s adjustment of capital for initial investment. In 2015, social investment fell to one-third of the GDP. Following the recovery of the economy, the rate of capital per GDP increased, showing a positive sign of the economic development in the future (see Table 2 and Figure 1).
In terms of capital utilization, for different reasons, from the year of 2000 up to the present there has been a lack of effectiveness in managing and spending investment in comparison to the initial stage that can be seen via the fact that the ICOR (incremental capital–output ratio) has been higher than other countries in the region (see Table 3).
In the current economic situation, despite having new roles, the State sector still receives more favor in using economic resources and benefits (in terms of getting loans and documentation procedures) despite the lowest effectiveness in capital spending among economic sectors. Regarding the ICOR, the rate of State sector is always 1.5 times higher than the average.
3. Proposed Hypothesis and Model
The analyses and assessments above show that the investments have a significant influence on the development of the national economy in general, and the development of the manufacturing sector in particular. This may have a far-reaching impact on many service activities in the economy, including the transport of goods by sea. The increase in investment has stimulated the demand for the transport of raw materials and finished products from the place of manufacture to points of consumption, creating a large output of work for the fleet of Vietnam in recent years. In order to scientifically recognize and evaluate the relationship between the size of investment with shipping output, we select two quantitative methods in this article.
The first method is ordinary least squares (OLS) by Carl Friedrich Gauss with a two-variable regression model including the total value of social investment capital and transport output [20].
Generalized regression function:
and
ln(Q) = α0 + α1ln(tinv) + u
ln(Ql) = β0 + β1ln(tinv) + u
Note:
Q, Ql: Quantity of cargo transported by sea in ton, in ton-km;
tinv: Total social investment capital;
u: Noise;
α1: Model parameter of the relationship between social capital and the cargo volume;
β1: Model parameter of the relationship between social capital and cargo volume in ton-km;
ln: natural logarithm;
Expected sign α1 > 0 and β1 > 0.
The second model is an econometric one: vector autoregression (VAR) by Christopher Sims. This model is a combination of two methods: univariate autoregression (AR) and simultaneous equations (Ses) [21]. The formula of VAR applied here is:
Yt = C + Ф1Yt−1 +…+ ФnYt−n + εt
Note: Ф1,…, Фn are (n × n) coefficient matrices. εt is an (n × 1) unobservable zero mean white noise vector process.
3.1. Data and Data Survey to Meet the Requirements of the Model
The article uses secondary data, including 64 observations collected quarterly from the year 2000 to the end of 2015. The data on the total social investment capital(tinv), government investment (gov), foreign investment (for), private investment (pri), sea transport output (sto) (seaborne trade volume), rotating sea transport output (rsto) (seaborne trade volume) are taken from the official website of the Vietnam General Statistics Office.
The results of the regression show the existence of a relationship between volume of cargo transported by sea in tons and in ton-km with total social investment capital in Vietnam. Namely, when the total social investment capital increased by 1 %, the volume of cargo transported by sea in tons increased by approximately 0.56% and the volume of cargo transported by sea in ton-km increased by approximately 0.71%.
One of the conditions of the model is that the time series must be stationary. Inspection of all six strings of stationary figures shows that these series are not stationary. However, the Box–Jenkins method with the first differential shows that the chains are stationary at 1% or 5% [22]. (see Table 4).
The results show that latency is 5 (see Table 5).
No root lies outside the unit circle. Vector autoregression (VAR) satisfies the stability condition (see Table 6).
All of the roots lie inside the unit circle. Thus, the VAR model is stable and model fulfils all stationary conditions and the determined latency is 5. The correlation of residues of the equation provides a shock to one variable, the remaining variables will be then affected (see Table 7).
3.2. Causes–Effects
Combining the results of the Granger causes–effects check with the independent variable (rotation output), we have (Table 8):
3.3. Variance Decomposition
Table 9 displays the results of variance decomposition.
It is clear that variation in output depends on the sizes of government investment, foreign investment, and the historical values. The impact of foreign investment has a lag of about one quarter, and increases continuously in the next quarters. After the 10th quarter (about 2.5 years), the influence of foreign investment increases to more than 30%. Government investment, which has a smaller degree of influence, also tends to increase over time.
4. Conclusions
By the VAR quantitative analysis, the cargo volume of sea transport in Vietnam is affected by the size of total social investment capital. Increasing investment from government and foreign countries will increase the cargo transported by sea. Hence, policies attracting these capitals will have great impacts on shipping activities in Vietnam. The Vietnamese Government should offer more favorable conditions in law, administration procedures, loaning interest, and also tax to attract more investment capital, especially from the private and foreign business sectors.
Besides, the following suggestions on current policies should be taken into consideration. The Vietnamese ship fleet should have the right to carry raw materials and products from and to foreign investment companies. The government should encourage entrepreneurs to use the Vietnamese ship fleet as the first choice when transporting goods in order to make profit for enterprises and contribute to national state budget as well.
Finally, restructuring or reorganizing the shipping fleet by reducing the average age of fleet, increasing the size of ships, and investing the specified vessels are great concerns to meet the high-quality transport requirements of foreign investors and the customers’ satisfaction.
Acknowledgments
This work was supported by Vietnam Maritime University.
Author Contributions
Nguyen Thuy Hong built the VAR model and did data analysis and evaluation with EVIEWS. The other parts were carried out by Hoang Thi Lich and Bui Thi Thanh Nga.
Conflicts of Interest
The authors declare no conflict interest.
References
- Lee, T.-C.; Wu, C.-H.; Lee, P.T.-W. Impacts of the ECFA on seaborne trade volume and policy development for shipping and port industry in Taiwan. Marit. Policy Manag. 2011, 38, 169–189. [Google Scholar] [CrossRef]
- Donatus, O.; Geraldine, O. An Evaluation of Nigeria’s Seaborne Trade and Demand for Sea Transport. Eur. J. Bus. Manag. 2012, 4, 4–16. [Google Scholar]
- Petro, N.N. Creating Social Capital in Russia: The Novgorod Model. World Dev. 2001, 29, 229–244. [Google Scholar] [CrossRef]
- Montero, J.R.; Torcal, M. Political Dissatisfaction in Contemporary Democracies: Social Capital, Institutions, and Politics; Routledge: Oxfordshire, UK, 2012. [Google Scholar]
- Kyle, D. The Otavalo trade diaspora: Social capital and transnational entrepreneurship. Ethn. Racial Stud. 2011, 22, 422–466. [Google Scholar] [CrossRef]
- Badescu, G.; Uslaner, E.M. Social Capital and the Transition to Democracy; Routledge: Oxfordshire, UK, 2004. [Google Scholar]
- Ojala, J.; Lounma-aho, V. Stakeholder relations as social capital in early modern international trade. Bus. Hist. 2008, 50, 749–764. [Google Scholar] [CrossRef]
- Pearson, R.; Richardson, D. Social capital, institutional innovation and Atlantic trade before 1800. Bus. Hist. 2008, 50, 765–780. [Google Scholar] [CrossRef]
- Nguyen, T.V. Enhancing the Effectiveness of Social Capital Allocation in Agriculture Development of Thua Thien—Hue. Ph.D. Thesis, Hue University, Hue Province, Vietnam, 2015. [Google Scholar]
- Van Mai, T.; van Dai, N. The Fact of the Public Social Capital. Available online: http://tapchitaichinh.vn/kinh-te-vi-mo/kinh-te-dau-tu/thuc-trang-dau-tu-tu-nguon-von-nha-nuoc-o-viet-nam-39953.html (accessed on 19 September 2017).
- Thi, H.; Huong, M. Administrating the Social Capital for Infrastructure. Ph.D. Thesis, Ho Chi Minh National Political Academy, Hanoi, Vietnam, 2014. [Google Scholar]
- Jacobson, T.; Jansson, P.; Vredin, A.; Anders, W. A VAR Model for Monetary Policy Analysis in a Small Open Economy. Available online: http://www.riksbank.se/Upload/Dokument_riksbank/Kat_publicerat/WorkingPapers/WP_77.pdf (accessed on 19 September 2017).
- Dungey, M.; Pagan, A. A structure VAR Model of the Australian Economy. Econ. Rec. 2000, 76, 321–342. [Google Scholar] [CrossRef]
- Bjornland, H.C. VAR Models in Macroeconomic Research; Statistics Norway Research Department: Oslo, Norway, 2000. [Google Scholar]
- Vinayagathasan, T. Monetary Policy and the Real Economy: A Structural VAR Approach for Sri Lanka; National Graduate Institute for Policy Studies: Tokyo, Japan, 2013. [Google Scholar]
- Alhajhoj, H. Exports and Economic Growth in Saudi Arabia: A VAR Model Analysis. J. Appl. Sci. 2006, 7, 3649–3658. [Google Scholar]
- Ludosean, B.M. A VAR analysis of the connection between FDI and economic growth in Romania. Theor. Appl. Econ. 2012, 10, 115–130. [Google Scholar]
- Vietnam Maritime Administration. Annual Report on Maritime Domain in Vietnam, 2000–2015; Vietnam Maritime Administration: Hanoi, Vietnam, 2016.
- General Statistics Office of Vietnam. Annual Abstracts of Statistics; Publish House of Statistics, 2000–2015; General Statistics Office of Vietnam: Hanoi, Vietnam, 2016.
- Dong, N.Q.; Minh, N.T. Econometrics; Public House of National Economics University: Hanoi, Vietnam, 2013; Volume 3, pp. 35–86. [Google Scholar]
- Anh, P.T. Applied Econometrics in Analyzing Time Series; Publish House of Nha Trang University: Nha Trang, Vietnam, 2013; Volume 3, pp. 26–68. [Google Scholar]
- Box, G.; Jenkins, G.M.; Reisel, G. Time Serial Analysis: Forecasting and Control, 4th ed.; Practice Hall: Englewoods Cliffs, NJ, USA, 2013; pp. 145, 551–564. [Google Scholar]
Figure 1.
Ratio of total social investment per GDP. Source: General Statistics Office of Vietnam.

Table 1.
Number of Vessels in Vietnam in 2014 *.
| No. | Type of Ship | Quantity | Gross Tonnage | Deadweight Tonnage | |||
|---|---|---|---|---|---|---|---|
| 2013 | 2014 | 2013 | 2014 | 2013 | 2014 | ||
| 1 | Bulk carrier | 165 | 162 | 1,126,594 | 1,130,793 | 1,866,408 | 1,895,132 |
| 2 | General cargo carrier | 1002 | 1043 | 1,575,580 | 1,763,856 | 2,724,981 | 3,045,016 |
| 3 | Container ship | 28 | 32 | 182,874 | 230,203 | 236,673 | 280,540 |
| 4 | Combined carrier | 40 | 45 | 7228 | 7803 | 3063 | 3527 |
| 5 | Express | 8 | 8 | 1076 | 1076 | 307 | 307 |
| 6 | Tanker | 19 | 24 | 105,593 | 185,845 | 202,792 | 281,311 |
| 7 | Oil tanker | 127 | 132 | 970,478 | 1,080,811 | 1,563,044 | 1,695,044 |
| 8 | Liquefied Natural Gas carrier | 10 | 9 | 27,805 | 26,806 | 28,516 | 27,475 |
| 9 | Other | 394 | 385 | 383,987 | 231,298 | 360,706 | 125,753 |
| Total | 1793 | 1840 | 4,381,215 | 4,658,491 | 6,986,490 | 7,354,105 | |
* Updated on 15 December 2014. Source: Vietnam Maritime Administration.
Table 2.
Total social investment capital and structure according to economic sectors in Vietnam from 2000 to 2015 (Unit: billion VND). FDI: foreign direct investment.
Table 2.
Total social investment capital and structure according to economic sectors in Vietnam from 2000 to 2015 (Unit: billion VND). FDI: foreign direct investment.
| Year | Total | Public | Private | FDI |
|---|---|---|---|---|
| 2000 | 151,183 | 89,417 | 34,594 | 27,172 |
| 2001 | 170,496 | 101,973 | 38,512 | 30,011 |
| 2002 | 200,145 | 114,738 | 50,612 | 34,795 |
| 2003 | 239,246 | 126,558 | 74,388 | 38,300 |
| 2004 | 290,927 | 139,831 | 109,754 | 41,342 |
| 2005 | 343,135 | 161,635 | 130,398 | 51,102 |
| 2006 | 404,712 | 185,102 | 154,006 | 65,604 |
| 2007 | 532,093 | 197,989 | 204,705 | 129,399 |
| 2008 | 616,735 | 209,031 | 217,034 | 190,670 |
| 2009 | 708,826 | 287,534 | 240,109 | 181,183 |
| 2010 | 830,278 | 316,285 | 299,487 | 214,506 |
| 2011 | 924,495 | 341,555 | 356,049 | 226,891 |
| 2012 | 1,010,114 | 406,514 | 385,027 | 218,573 |
| 2013 | 1,094,542 | 441,924 | 412,506 | 240,112 |
| 2014 | 1,220,704 | 486,804 | 468,500 | 265,400 |
| 2015 | 1,367,205 | 519,505 | 529,600 | 318,100 |
Source: General Statistics Office of Vietnam.
Table 3.
Incremental capital–output ratio (ICOR) of Vietnam and neighboring countries.
| Nations | 2001 to 2005 | 2006 to 2010 | 2011 to 2015 |
|---|---|---|---|
| China | 4.14 | 6.27 | 11.84 |
| India | 4.23 | 6.37 | 8.88 |
| Indonesia | 4.57 | 7.97 | 11.75 |
| Laos | 2.90 | 5.94 | 5.05 |
| Malaysia | 10.75 | 1.26 | 7.85 |
| Philippines | 5.17 | 7.85 | 6.58 |
| Vietnam | 4.33 | 8.31 | 9.20 |
Source: General Statistics Office of Vietnam [19].
Table 4.
Results of stationary test for variables of the model.
| Variables | First-Order Differential | (ADF) (Augmented Dickey–Fuller Test) | Significance (1%) | Conclusion |
|---|---|---|---|---|
| tinv | Ltinv | −3.5555 | −2.7698 | Stationary |
| gov | Lgov | −10.8173 | −3.5461 | Stationary |
| for | Lfor | −2.9467 | −2.9145 * | Stationary |
| pri | Lpri | −13.7577 | −3.5461 | Stationary |
| sto | Lsto | −10.8090 | −3.5461 | Stationary |
| rsto | Lrsto | −10.7089 | −3.5925 | Stationary |
* With the help of EVIEWS, the author could determine the regression function as follows: Ln (sto) = 2.484046 + 0.561301Ln (tinv) R2 = 0.78 Equation (4). Ln (rsto) = 1.70563 + 0.744969 Ln (tinv) R2 = 0.81 Equation (5). tinv: total social investment; gov: government investment; for: foreign investment; pri: private investment; sto: sea transport output; rsto: rotating sto.
Table 5.
Identify latency under selection criteria AIC.
| Lag | LogL | LR | FPE | AIC | SC | HQ |
|---|---|---|---|---|---|---|
| 0 | −446.5115 | NA | 6.931281 | 16.12541 | 16.30625 | 16.19552 |
| 1 | −182.9866 | 470.5802 | 0.001390 | 7.606664 | 8.691674 * | 8.027320 |
| 2 | −147.4236 | 57.15481 | 0.000974 | 7.229414 | 9.218599 | 8.000617 * |
| 3 | −134.8937 | 17.89991 | 0.001608 | 7.674774 | 10.56813 | 8.796523 |
| 4 | −113.9157 | 26.22244 | 0.002073 | 7.818418 | 11.61595 | 9.290714 |
| 5 | −55.51541 | 62.57176 * | 0.000762 * | 6.625550 * | 11.32726 | 8.448393 |
* indicates lag order selected by the criterion. LR: sequential modified LR test statistic (each test at 5% level). FPE: Final prediction error. AIC: Akaike information criterion. SC: Schwarz information criterion. HQ: Hannan-Quinn information criterion.
Table 6.
Test of stability.
| Root | Modulus |
|---|---|
| 0.983452 | 0.983452 |
| 0.936046 − 0.060540i | 0.938002 |
| 0.936046 + 0.060540i | 0.938002 |
| −0.633877 | 0.633877 |
| 0.421863 − 0.018801i | 0.422282 |
| 0.421863 + 0.018801i | 0.422282 |
| −0.377120 | 0.377120 |
| −0.090931 − 0.275267i | 0.289897 |
| −0.090931 + 0.275267i | 0.289897 |
| −0.033499 | 0.033499 |
Table 7.
Checking the correlation of residues.
| Dlgov | Dlfor | Dlpri | Dlsto | Dlrsto | |
|---|---|---|---|---|---|
| Dlgov | 1.000000 | −0.292791 | −0.047312 | 0.031259 | −0.043880 |
| Dlfor | −0.292791 | 1.000000 | 0.263644 | 0.043577 | 0.064470 |
| Dlpri | −0.047312 | 0.263644 | 1.000000 | −0.016274 | 0.038155 |
| Dlsto | 0.031259 | 0.043577 | −0.016274 | 1.000000 | 0.959590 |
| Dlrsto | −0.043880 | 0.064470 | 0.038155 | 0.959590 | 1.000000 |
Table 8.
Check Granger causes–effects.
| Independent Variable | Chi sq. | p-Value | Conclusion |
|---|---|---|---|
| Dlgov | 5.14403 | 0.00764 | Volume of cargo in ton-mile depends on the total social capital from government |
| Dlfor | 10.5757 | 0.0051 | Volume of cargo in ton-mile depends on the total social capital from foreign investment |
| Dlpri | 1.37675 | 0.5024 | Volume of cargo in ton-km is not dependent on the total social capital from private investment |
Table 9.
Results of variance decomposition.
| Period | S.E. | Dlgov | Dlfor | Dlpri | Dlrsto |
|---|---|---|---|---|---|
| 1 | 0.174121 | 2.515359 | 0.065767 | 1.719826 | 95.69905 |
| 2 | 0.182063 | 2.602686 | 3.205559 | 1.782256 | 92.40950 |
| 3 | 0.194552 | 3.167966 | 7.763320 | 1.560998 | 87.50772 |
| 4 | 0.204751 | 4.861409 | 13.44463 | 1.866218 | 79.82774 |
| 5 | 0.214983 | 6.702189 | 18.70673 | 2.011343 | 72.57973 |
| 6 | 0.225335 | 8.549932 | 22.90152 | 2.484191 | 66.06436 |
| 7 | 0.234840 | 10.06579 | 26.14521 | 2.896525 | 60.89248 |
| 8 | 0.243320 | 11.30770 | 28.41926 | 3.433855 | 56.83919 |
| 9 | 0.250540 | 12.23761 | 30.03473 | 3.946668 | 53.78100 |
| 10 | 0.256522 | 12.93936 | 31.10890 | 4.497034 | 51.45471 |
Cholesky ordering: Dlgov, Dlfor, Dlpri, Dlrsto.
© 2017 by the authors. Licensee MDPI, Basel, Switzerland. This article is an open access article distributed under the terms and conditions of the Creative Commons Attribution (CC BY) license (http://creativecommons.org/licenses/by/4.0/).
Share and Cite
MDPI and ACS Style
Thi Thuy Hong, N.; Thi Lich, H.; Thanh Nga, B.T. The Social Investment Capital and the Cargo Volume Transported by Sea: A VAR Approach for Vietnam. Logistics 2017, 1, 8. https://doi.org/10.3390/logistics1020008
AMA Style
Thi Thuy Hong N, Thi Lich H, Thanh Nga BT. The Social Investment Capital and the Cargo Volume Transported by Sea: A VAR Approach for Vietnam. Logistics. 2017; 1(2):8. https://doi.org/10.3390/logistics1020008
Chicago/Turabian StyleThi Thuy Hong, Nguyen, Hoang Thi Lich, and Bui Thi Thanh Nga. 2017. "The Social Investment Capital and the Cargo Volume Transported by Sea: A VAR Approach for Vietnam" Logistics 1, no. 2: 8. https://doi.org/10.3390/logistics1020008