Assessing Port Governance, Devolution and Terminal Performance in Nigeria


Department of Maritime Management Technology, Federal University of Technology Owerri, Owerri 1526, Nigeria
Logistics 2018, 2(1), 6; https://doi.org/10.3390/logistics2010006
Submission received: 21 October 2017
/
Revised: 16 February 2018
/
Accepted: 21 February 2018
/
Published: 25 February 2018
Abstract
:Concerns about performance and efficiency in port terminals led many national governments to embark on port reforms. The Federal government of Nigeria, for example, adopted the Landlord port model which brought about concessioning of port terminals to private operators. Despite high investments in terminal facilities by the private terminal operators, there are still complaints about level of service offered to port users. This paper applied key performance indicator metrics and parameters of queuing model in assessing performance of Nigeria’s concessioned port terminals. Data for the study were obtained from terminal level records of cargo and ship handling activities for years 2000 to 2015. Major findings indicate that cargo and vessel throughputs improved after the reforms in the six ports examined. However, much variability was observed in trends in ships’ turnround times across all ports after the concession policy implementation. Additional results from the queuing model analysis suggest that the high ships turnround times observed in some ports are associated to delays in ship operation at the berths. The paper recommends that policy interventions be focused on ship operations at the berths as a step in improving service level in the port terminals.
1. Introduction
Ports are critical nodes in international maritime transport and logistics chains. Cargo handling delays occurring at the ports, for instance, could to a great extent alter total transport and logistics costs. Consequently, many maritime nations involved in international seaborne trade constantly evolve strategies and invest significant resources to improve performance in port terminals. In most developing countries, port improvement efforts have been hampered by lack of public finance and managerial resources. These challenges have been exacerbated in the environment of globalization of production and distribution, technological changes in ship design, and cargo handling methods, which have induced considerable demand on port resources. Thus, to provide funding and management philosophy needed to reposition ports in line with the new challenges, the port administration of most countries opted for reforms in the port sector. The focus of these reforms was on identification of optimal financing and managerial models for public ports based on national peculiarities and reform objectives. Consequently, new port governance models were introduced to allow for joint public/private, or private participation in port finance and administration. According to reference [1], the basic port governance models can be classified as Tool port, Service port, Landlord port, and Private port. Specific applications or elaborations of these models have been adopted by different countries ports undergoing reforms and outcomes reported so far vary by country.
1.1. Research Problem and Context
In Nigeria ports, substantial funding (in foreign currency) was required for facility upgrades and investment in new ones. However, dwindling government funding culminated in inadequate port and maritime access infrastructure which, as [2] pointed out, manifested in low levels of efficiency, long ship turnround times, and increased container dwell times in the pre-reform era. Based on assessment of best practices, the ‘Haskoning B.V.’ port study commissioned by the Federal government of Nigeria recommended adoption of the Landlord port model whereby the Nigeria Port Authority (NPA) would be responsible for port planning, regulatory tasks, maintaining ownership of port-related land, and basic infrastructure. The private sector would, however, be responsible for marine and terminal operations, construction, purchase, and ownership of superstructure and equipment. Based on the recommendations of the Haskoning study, terminal infrastructure concession policy was implemented to attract private capital to the port sector. By the year 2006, twenty-six long-term port concession contracts had been awarded to private companies [2].
The specific port performance issues which the reforms are expected to address could, according to [3] be summed thus: (i) increasing efficiency through concession of terminals to private operators, (ii) decreasing the cost of services to the port users by administering price competitive services; and (iii) decreasing government expenditure (public costs) for supporting a viable port sector. The port concession policy of the Federal government has so far yielded the following positive outcomes [4]:
- Substantial investments in physical capital in line with the development plans have been made;
- Injection of managerial expertise and investments leading to productivity improvements;
- Throughput expansion; and
- Reduction in cargo clearance delays.
Specifically, investments in facilities and handling equipment led to a reduction in average waiting times of vessels in Nigerian ports from 2.17 days in 2003 to 1.6 days in 2011 [4]. In spite of achievements made so far, the following constraints still persist in the port sector:
Thus, from the foregoing it is evident that the port reform program has not completely addressed the terminals’ performance problems. This paper poses the question: What are the effects of Nigeria’s port governance model (implemented via the terminal concession policy) on operational performance of Nigeria’s seaport terminals?
1.2. Objectives of the Study
The objectives of this study are to assess the following in pre- and post-port concession regimes:
- Trends in cargo throughputs;
- Trends in vessel throughputs;
- Trends in ships’ turnround times; and
- Level of berth occupancy.
2. Conceptual Framework and Related Studies
2.1. Port Governance Models
The basic models of port governance are stated in The World Bank Port Reform Toolkit (WBPRTK) [1]. These are prescriptions which governments may adopt in reforming their ports. However, [6] contends that The World Bank’s prescribed models only reflect the broad allocation of responsibilities for port activities [7], but do not indicate the complete set of indicators found in a full governance model, which indicates who assumes the risk and what the lines of accountability are. Ferrari, Parola and Tei [8] posit that the difference among the governance models lies in the extent of public and/or private involvement in organizing or managing port operations.
Accordingly, four major types of combinations of port/terminal ownership and port/terminal operations are distinguishable. These are: (i) public/government ownership and public participation in port operations; (ii) public/government ownership and private participation in port/terminal construction, operations, and management; (iii) public/government ownership and private participation in superstructure installation (e.g., cranes) and operations; and (iv) private ownership and operations [1]. As reform options, port administrators should select the strategy that improves port’s effectiveness, comparative advantage and market share [9]. Table 1 shows the formalized port governance models. The Nigeria government opted for the Landlord port model. The Landlord model was implemented through concession agreements between the Nigerian government and private operators.
2.2. Concession as Instruments in Devolution Process
Port devolution is the transfer of rights to operate or allocation responsibilities to private operators in port reform process. The dominant instrument in devolution of rights or functions in the port sector is the terminal concession [11]. Port terminal concession is a permit by a government or its representative authority to a private terminal operator for the provision of specific port services, e.g., cargo handling or nautical services (pilotage and towage). In Nigeria’s case, concession contracts signed between the port authority (PA) and various private terminal operators ranged between 10 and 25 years. During the periods, each operator would operate the facility involved and pay rents to the PA. However, where additional infrastructure or Greenfield developments are required, options are available to structure the responsibilities of the private operator and port authority/government with respect to the construction, financing, and operations of the terminal facility. These include: Build-Lease-Operate (BLO), Build-Operate-Transfer (BOT), Rehabilitate-Operate-Transfer (ROT), Build-Rehabilitate-Operate-Transfer (BROT), and Build-Operate-Share-Transfer (BOST).
To encourage productivity and competitiveness in terminal operations among the terminal operators, minimum tonnage to be achieved by each operator formed part of the obligations in the concession agreements. However, the absence of economic regulator in the early stages of the concession policy implementation led to defaults which manifested in low level of service offered at the ports.
2.3. Measuring Port Performance: Methodology of Most Studies
Port performance indicators are measures of various aspects of port operations [12]. Performance indicators can be applied for benchmarking purposes or observing trends in port performance levels. The Key performance indicators (KPI) applied in this paper were based on UNCTAD (1976) metrics. These include: ships’ turnround times, cargo/vessel throughputs and berth occupancy rates which measure level of: service at the port, output, and utilization of port facilities, respectively. However, reference [13] observes that since ports have developed into platforms for logistics, manufacturing, and other economic activities, new port performance indicators (PPI) are needed to measure the outputs of such functions. Such PPI should account for three products or port outputs, namely, cargo transfer product, logistics product and port manufacturing product.
As shown in Table 2, reference [14] presents taxonomy of generic port performance indicators as well as methodologies for implementing them. According to reference [14], three approaches for measuring port performance are distinguishable viz. performance metrics and productivity index methods, frontier methods, and process approaches. The definition of port performance by reference [14] strictly refers to the comparison of output achieved to input resources utilized. By this definition, the variables vessel and cargo throughputs, ships’ turnround time, and berth occupancy are referred to as snapshot indicators and can only stand as activity measures. However, reference [12] supports the use of snapshot indicators since they provide insight into port management, and can be applied for benchmarking and observing trends in performance levels [12]. The present paper applies both UNCTAD metrics and queuing model to measure performance in Nigeria’s concessioned terminals.
2.4. Studies Based on Parametric and Non-Parametric Frontier Models
Measurement of port performance is frequently done at the level of port terminals where services to ship and cargo owners (the main port customers) are undertaken. Port performance analysis has assumed different methodologies by many researchers depending on the object of research. Two major methodologies feature in most of port performance studies in the literature. These feature parametric and non parametric frontier models in which productivity and efficiency measurement have remained major focus.
The empirical works listed below capture the objectives, methodologies, and findings on performance analysis of seaports undergoing reforms using productivity and efficiency models. In terms of objectives of these papers, some studies were carried out with the object of finding the relative efficiencies in national or international ports. In these papers, relative efficiency scores of ports under consideration were calculated and used to rank them for benchmarking purposes. In some applications, sources of, and factors affecting, efficiency of these ports were identified and measures for improving their competitive positions proffered. Examples of such studies include [15,16,17,18,19,20,21,22,23]. In addition to benchmarking, efficiency studies are also carried out with the object of assessing the effectiveness of reforms that have taken place in many ports across the globe. Notable ones include: [24,25,26,27,28,29,30]. Issues like effects of privatization (ownership structure), environment factors, size of terminal, locations, etc. on terminal efficiency dominate such studies. Examples include: [31,32,33,34,35,36]. Findings vary depending on governance model adopted in each port, scope of study data, and geographical position of the port(s) in question. However, majority of these studies agree on some common grounds. Examining the methodology of these studies, majority of them feature Data Envelopment Analysis (DEA) modelling approach and its variants, investigating such issues as type of returns to scale exhibited by the terminal under investigation. Other studies have applied parametric distance functions and DEA-based Malmquist index models to identify sources of productivity growths in port terminals. The limitations of DEA methods make modelling with stochastic frontier models appealing. However, the stochastic frontier models are limited to single-output port terminal settings and hence cannot be applied for modelling multi-output terminals. However, adaptations of stochastic frontier models, e.g. parametric distance functions, have been applied to overcome the limitations of DEA and regular stochastic frontier models.
The traditional models applied in performance analysis of ports commonly focus on finding the causal relationship existing between the phenomenon of interest or dependent variable and a host of factors or independent variables. In dynamic processes, e.g. in ship-berth cargo operations, use of such models may not account for process changes (which could lead to delays). The usual approach to addressing this constraint is to conduct physical experiment or simulation in order to examine process changes. This research therefore applies a dual approach. It combines key performance indices and analytical queuing model in assessing performance of seaport terminals under concession by the Federal government of Nigeria. Most of the existing studies examined the relationships between performance outcomes (especially throughput changes) and some static factors without identifying the dynamic processes which affect performance. This limitation is, however, overcome using the approach adopted in this paper.
3. Methodology
The data for this study were obtained from terminal-level records from the Nigeria Port Authority. The scope covers ship and cargo handling operations at the berths in six ports, namely, Apapa, Calabar, Onne, Tincan, Warri, and Port-Harcourt ports, over the period from years 2000 to 2015. Other data records for the proceeding years were being collated and could not be used in their present form as at the time of writing. However, the data used for the analysis spanned the pre- and post-concession (reform) regimes and could be considered adequate enough to capture terminal performance outcomes in the regimes which are of interest in this study. Descriptive statistics (bar charts) were applied to examine trends in the performance indicators. In addition, queuing model was also applied to assess further performance outcomes, which were not obvious in the chart displays. The data for the queuing analysis were derived from ship-berth operations carried out at the ports during the study period; excerpts of these can be found in the appendix Table A1.
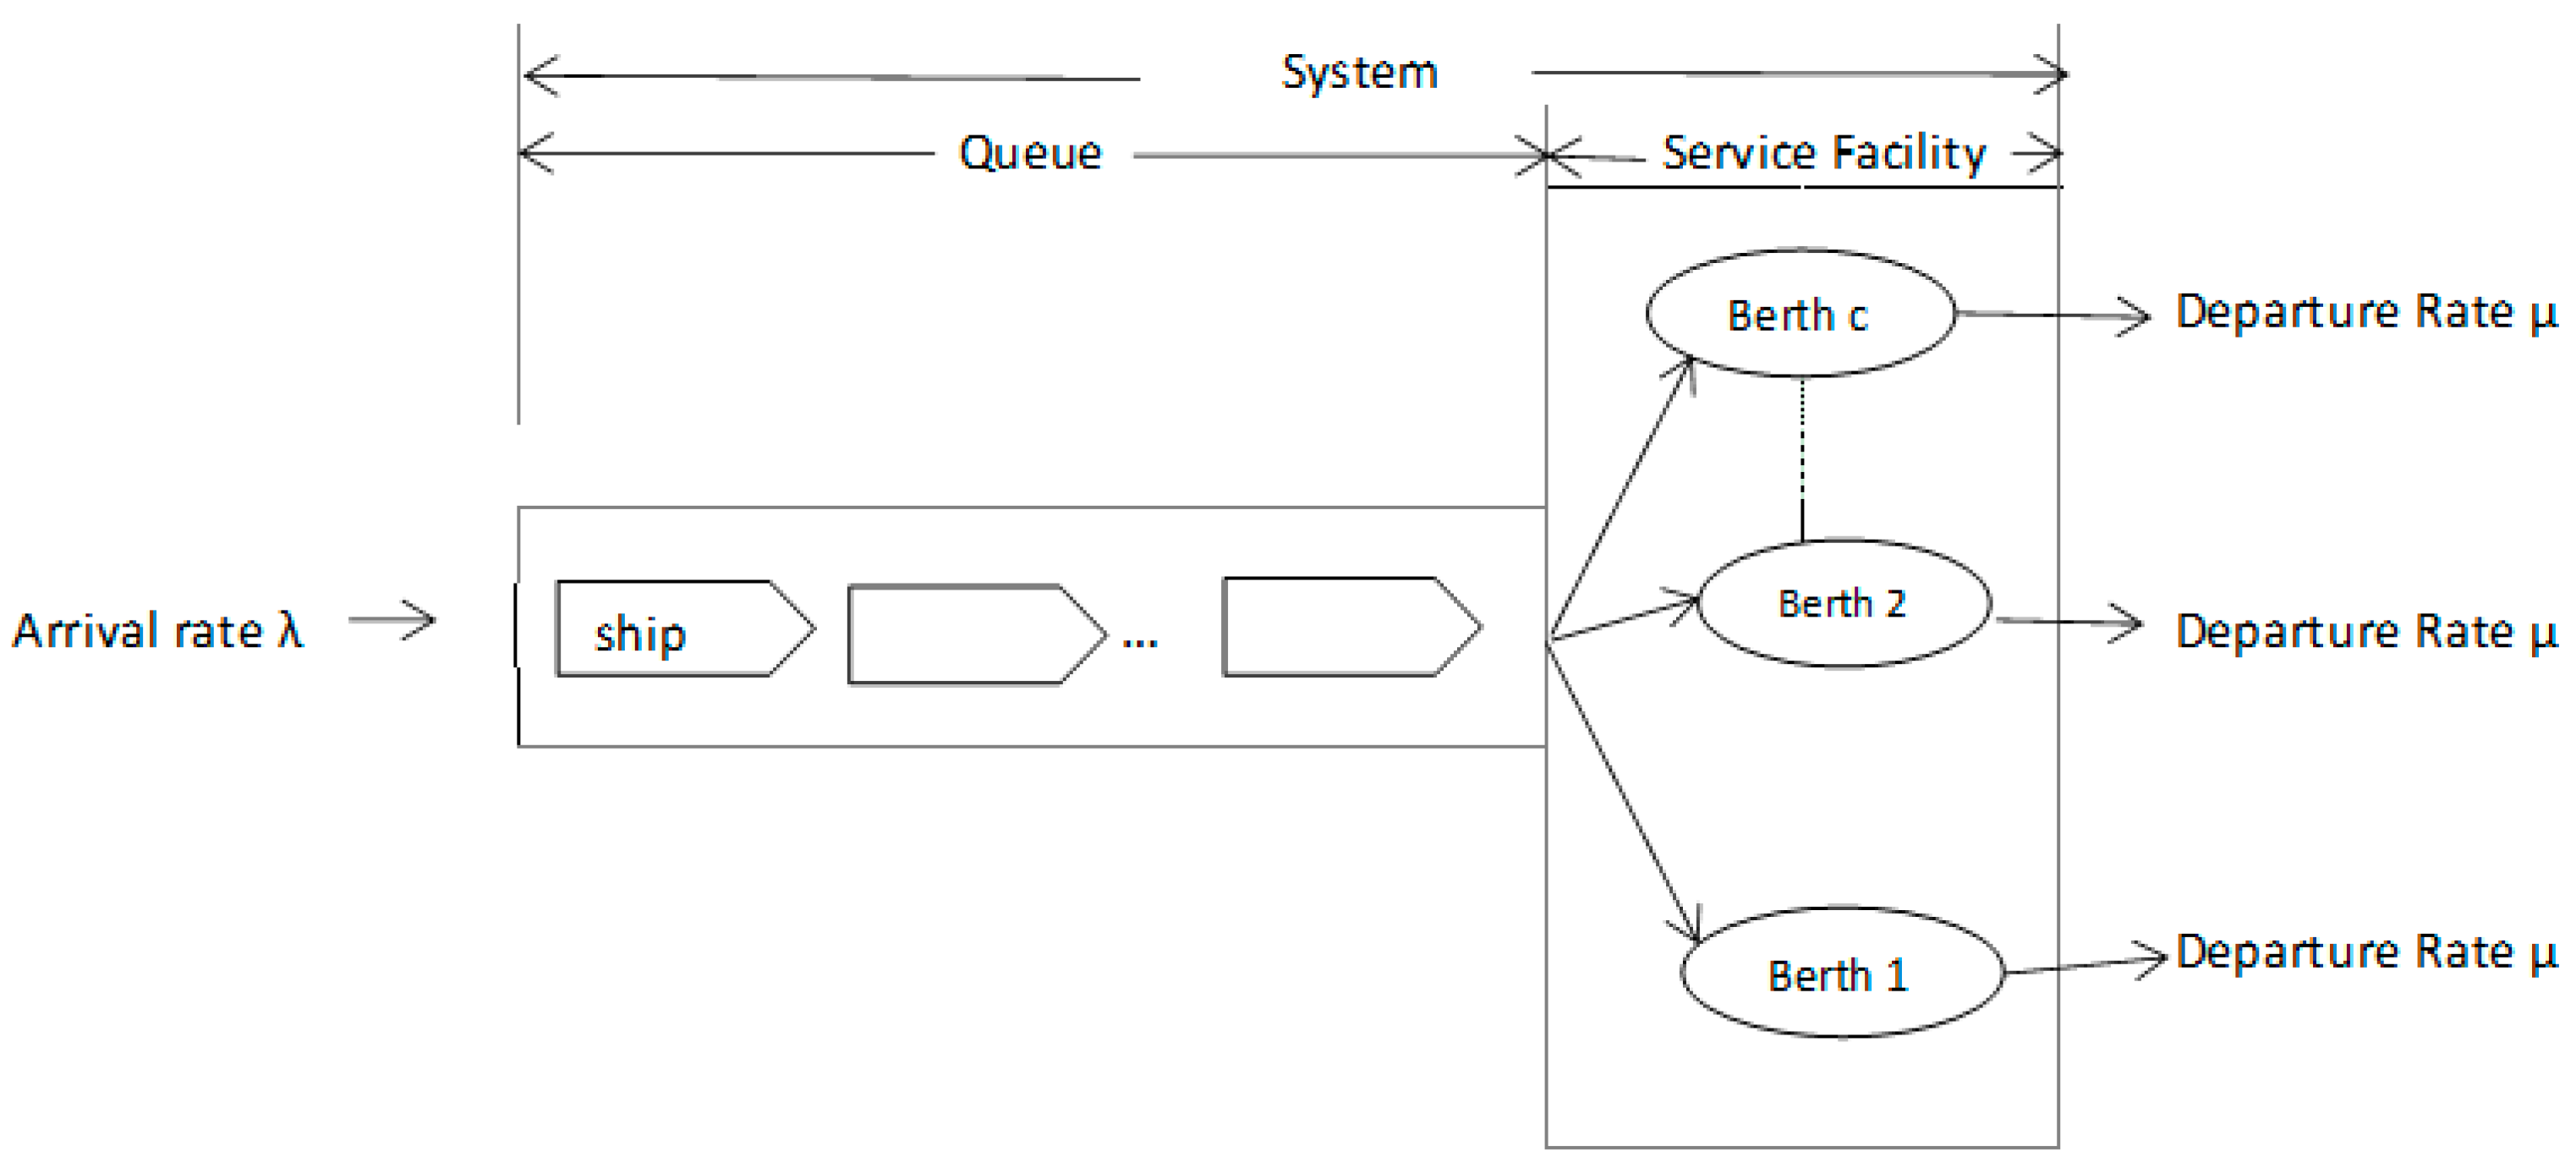
The rationale for applying the queuing model in some aspects of the data analysis was to know how effectively berths were utilized and to also ascertain the less than optimal changes in ships’ turnround time variation observed among the terminals. The application of the queuing model in this paper is considered appropriate since a system of berths in a seaport where ships arrive and are served can be described by queuing model (see Figure 1).
The queuing model applied had the following features: Vessels visiting Nigeria ports as customers, and berths in port terminals as servers. Thus, a multiple-server queuing system was adopted given the many berths in each port terminal under investigation. The queue discipline was FIFO (First In, First Out); an infinite source (vessels always calling for service at port facilities). For simplicity, it was assumed that ship inter-arrival times were Poisson distributed, while departure rates from the berths (or service times) were exponentially distributed. Mathematically, the operating characteristics of ship-berth operations, as depicted in Figure 1, were computed based on Little’s [38] formula as follows:
The probability that there are no vessels in the system (all berths are idle) is given by:
The average number of vessels in the queuing system :
where c = number of cargo handling berths in respective ports under study, λ = number of vessels calling for service per time period, and µ = service rate or number of vessels completing cargo operation at berths per time period (same as departure rates). Other measures include:
The average time a vessel spends in the queuing system (waiting and being served) :
The average number of vessels in the queue :
The average time a vessel spends in the queue, waiting to be served :
The computation of the these measures was done with TORA for Windows software (version 2, Prentice Hall, Inc., Upper Saddle River, NJ, USA) and which results are discussed in the following section.
4. Data Analysis and Discussion
4.1. Descriptive Analysis of Indicators of Output, Service, and Utilization in Nigeria’s Seaports
The descriptive analysis of indicators of port performance carried out in this study was an attempt to explore effects of the terminal concession policy on performance of Nigeria ports under study. According to UNCTAD, port performance indicators, e.g., cargo and vessel throughputs, ships turnround time and berth occupancy rates, designate indicators of outputs, service, and utilization, respectively. They can be applied in measuring the performance of a seaport, as was done in the following paragraphs.
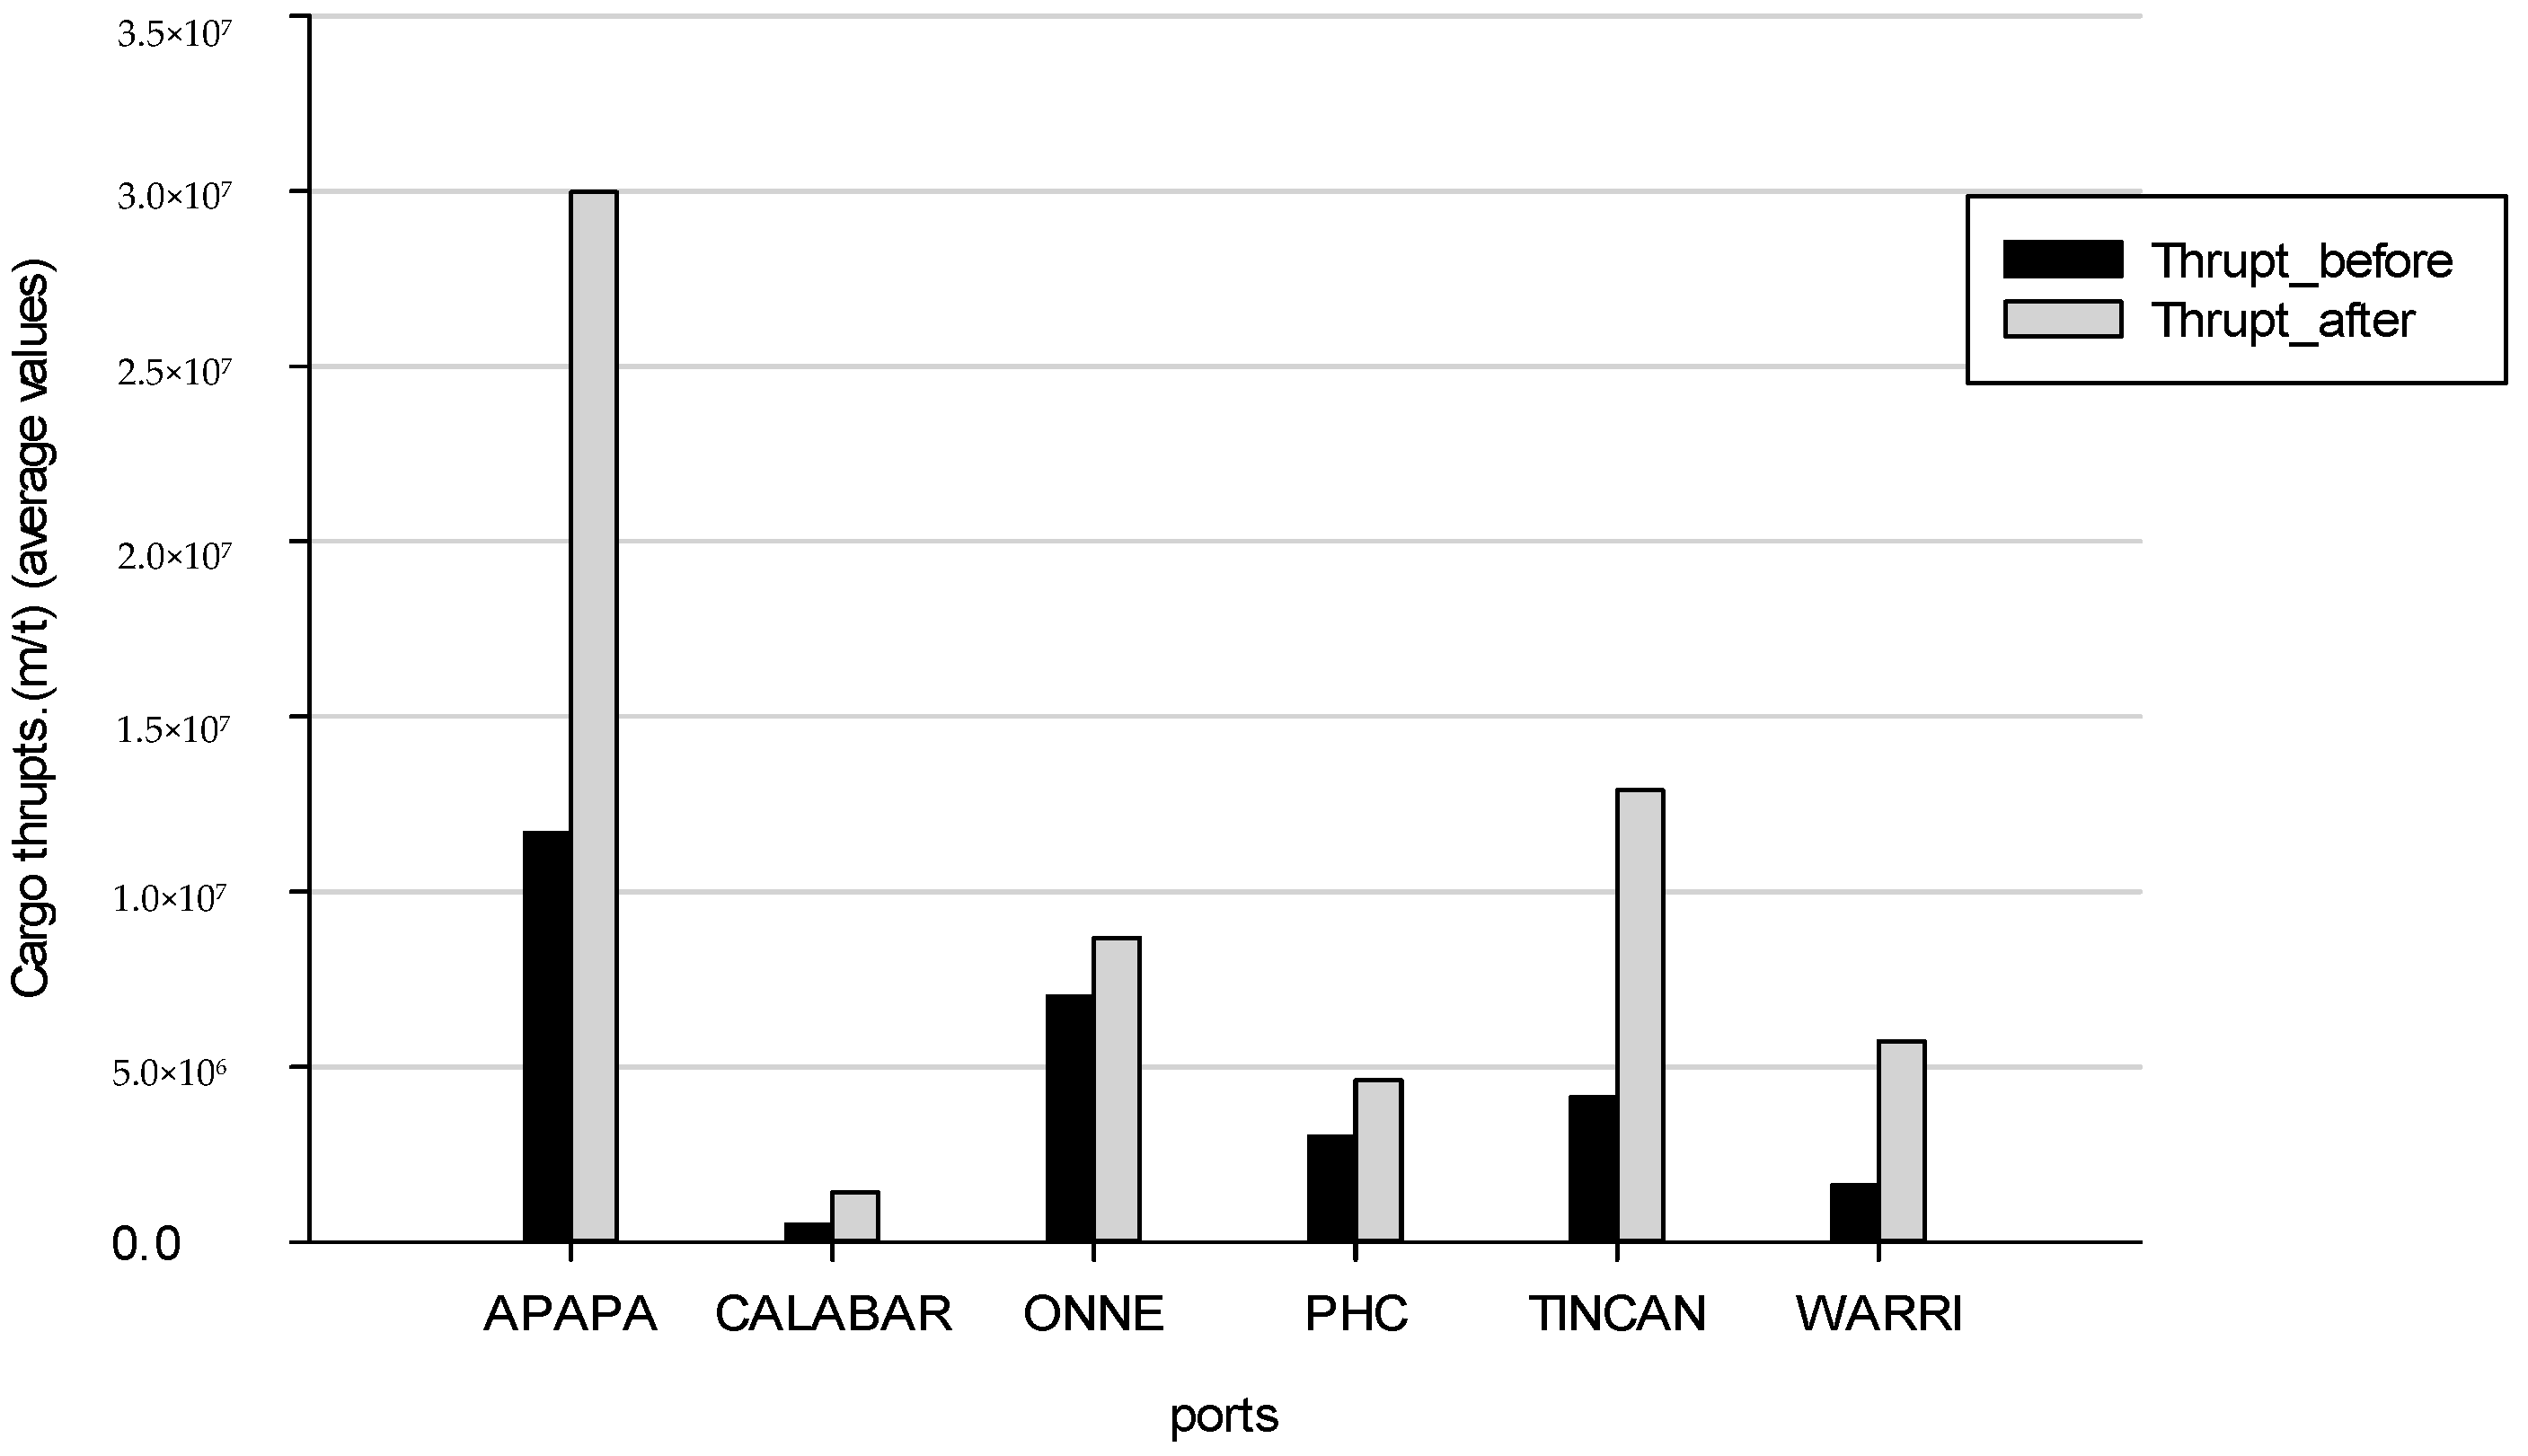
In Figure 2, we note the distribution of cargo throughputs (in metric tonnes) handled in Nigeria seaports from the year 2000 to 2015, and which covers the periods before and after port concession reforms. In the period before the reform (i.e., years 2000 to 2005), Apapa port, for example, recorded an average of 11.7 million metric tonnes (m/t) of cargo throughputs. Tincan Island port handled a little above 4 million metric tonnes on average; while Onne port handled, on average, a little below 7 million m/t of cargo throughputs. The other ports, Calabar, Port Harcourt (PHC), and Warri ports, handled much less cargo in comparison with Apapa, Tincan and Onne ports. However, after the concession reforms which entailed the transfer of cargo handling and infrastructure investment functions from public to private terminal operators, cargo throughputs handled across most of these ports more than doubled. Specifically, the cargo throughputs handled in Apapa port were twice more than what they were before the reforms. This growth in cargo traffic could be attributed to positive effects of the reforms.
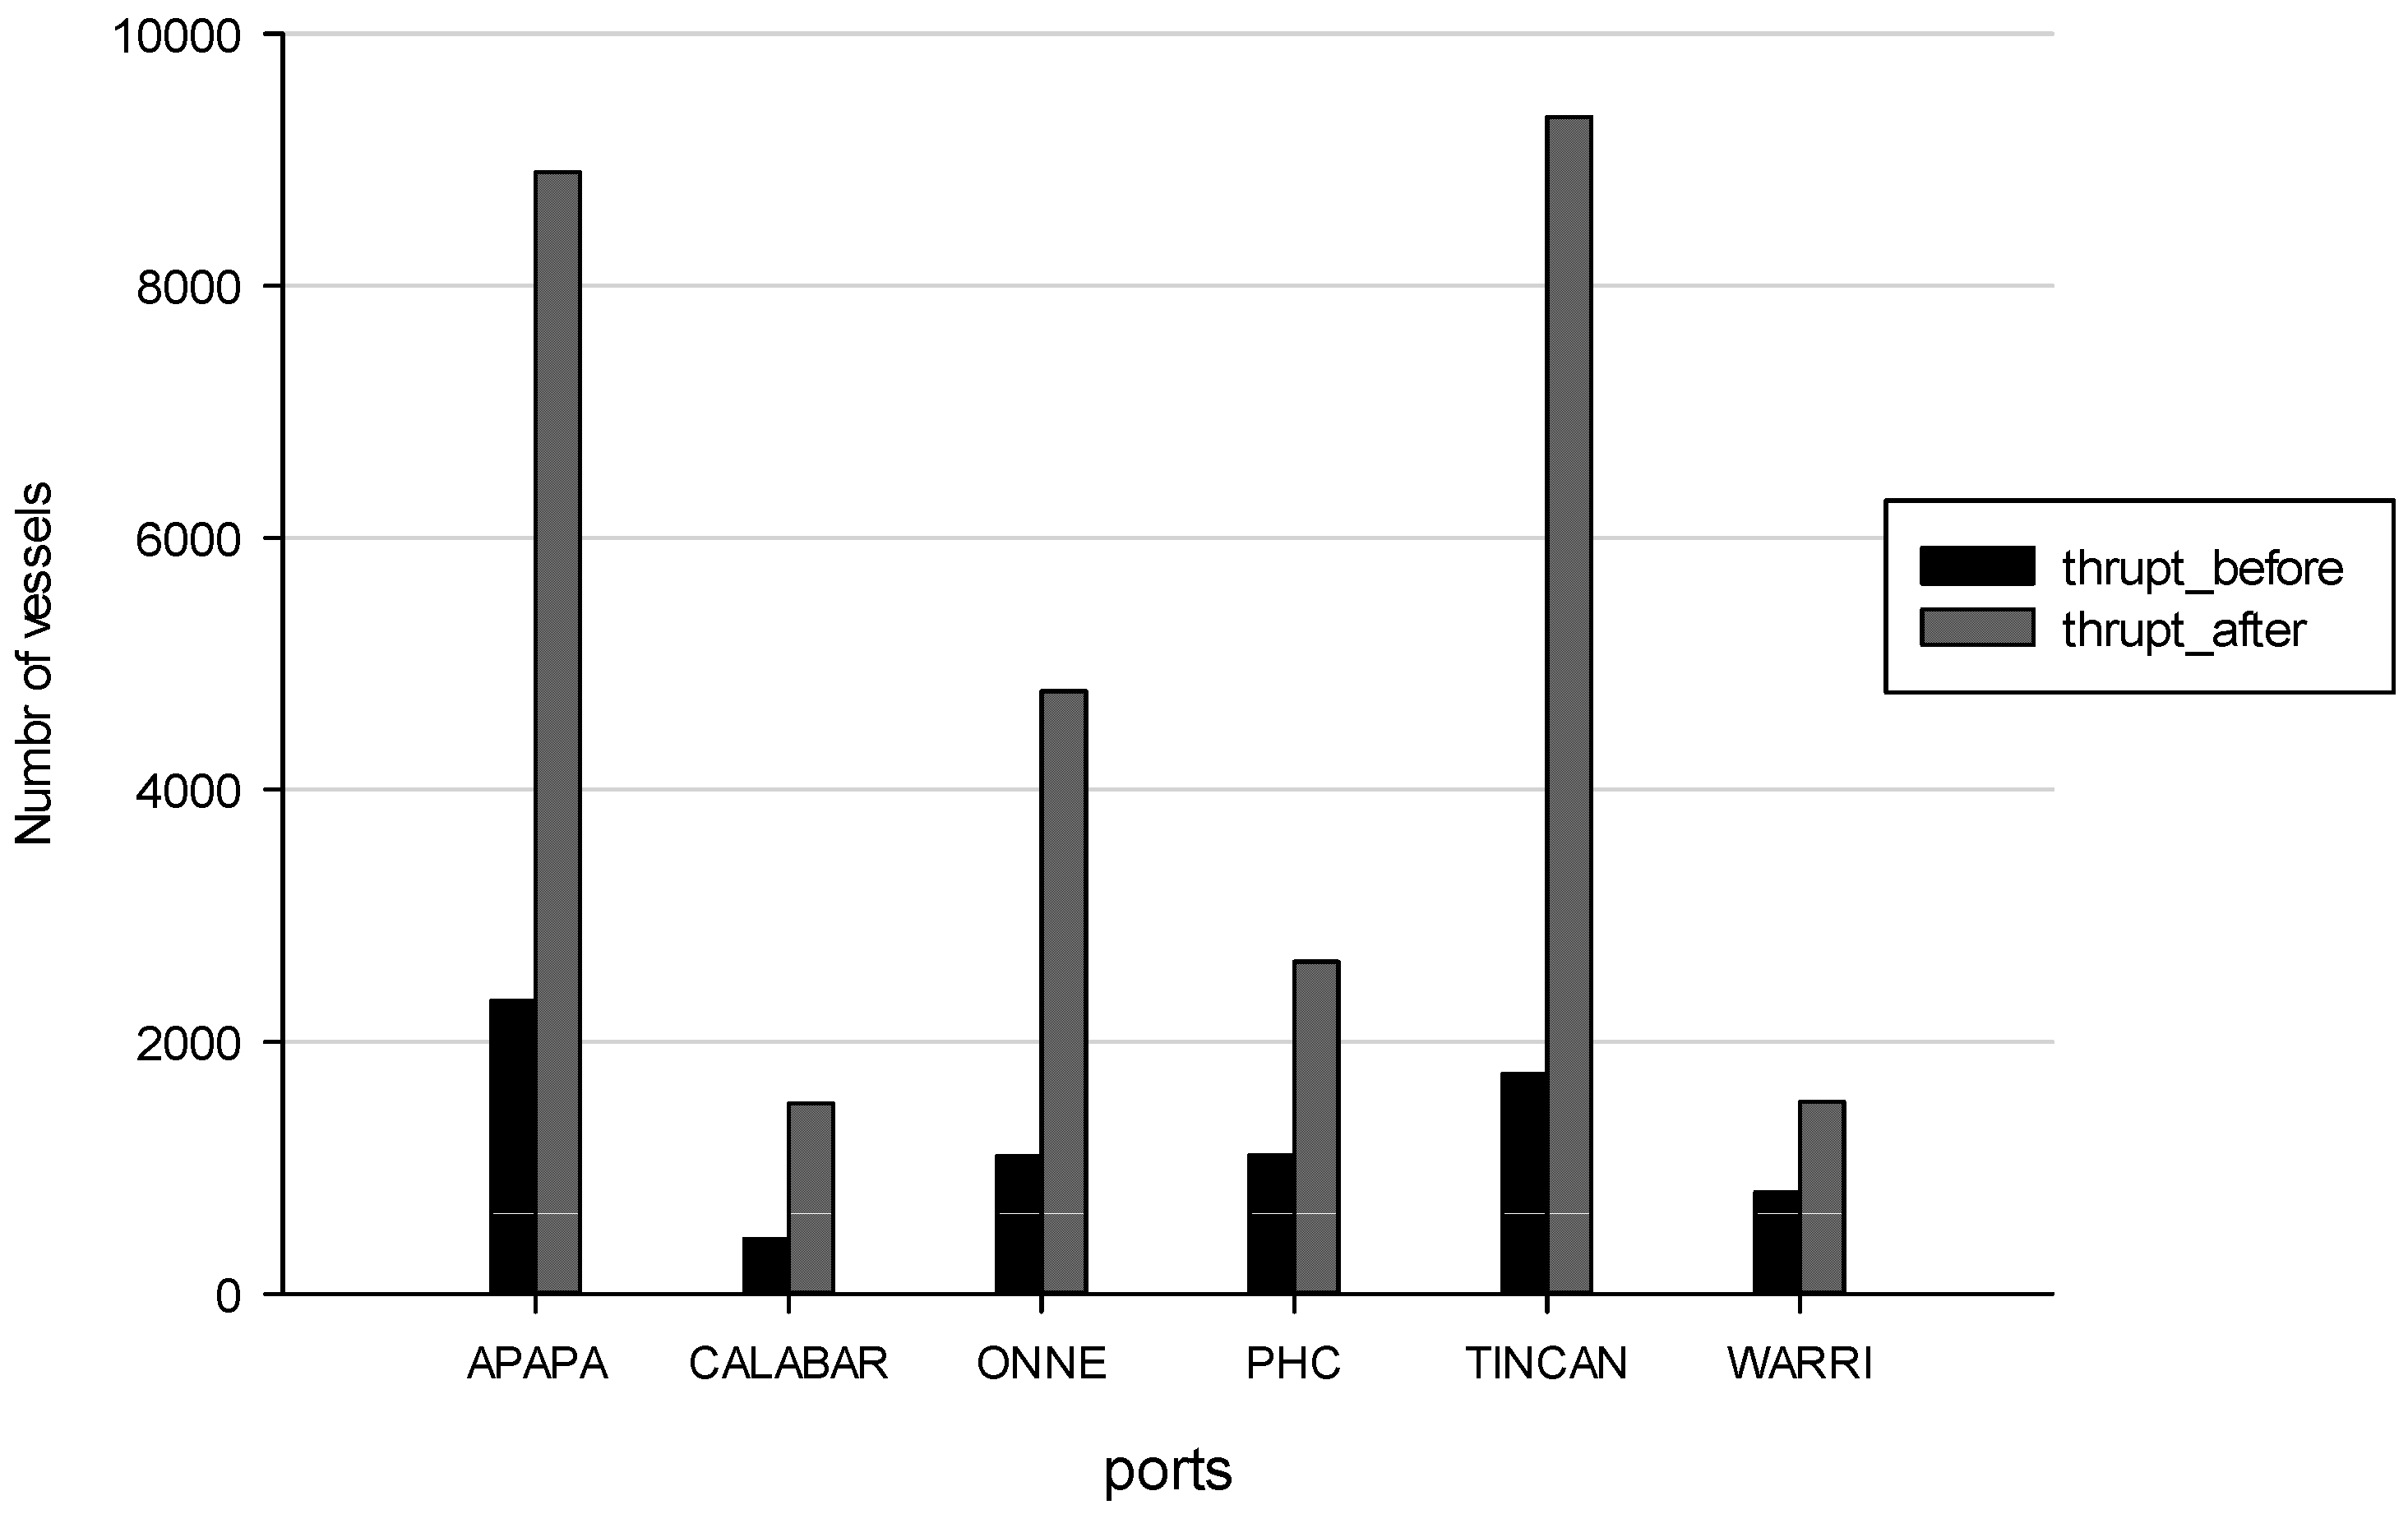
In the same vein, the distribution of vessel traffic in Nigeria ports in the period following concession reforms showed remarkable growth. For example, as Figure 3 indicates, the number of vessels handled in Apapa, Onne, and Tincan ports more than doubled. This growth trend was also observed in the other ports, but to a lesser degree, again implying positive effects of concession reforms on port performance. So far we have seen the effects of concession policy on port performance via the indicators of output. However, if we consider the indicator of service in the ports, for example, ships’ turnround time, from Figure 4 we note that there was a reduction in average time spent by vessels that visited Nigeria ports after the terminal concession program than before it. This is true for all the ports, except Calabar and Warri ports, as shown in the figure.
Interestingly, the marked improvement noticed in vessel and cargo throughput volumes was in contrast with the ships’ turnround times observed across the ports. For example, while the average ships’ turnround times in Apapa and Tincan ports decreased to half their previous values after the concession policy (see Figure 4), that of Onne and Port-Harcourt ports only dropped marginally. Additionally, while ships’ turnround times remained static in Calabar port, it rather increased in Warri port. Therefore, in terms of ships’ turnround times, the level of service offered to vessels in Calabar, Onne, Port-Harcourt, and Warri ports was below optimum. This outcome contrasts with high vessel and cargo throughputs attracted to these ports following the reform program.
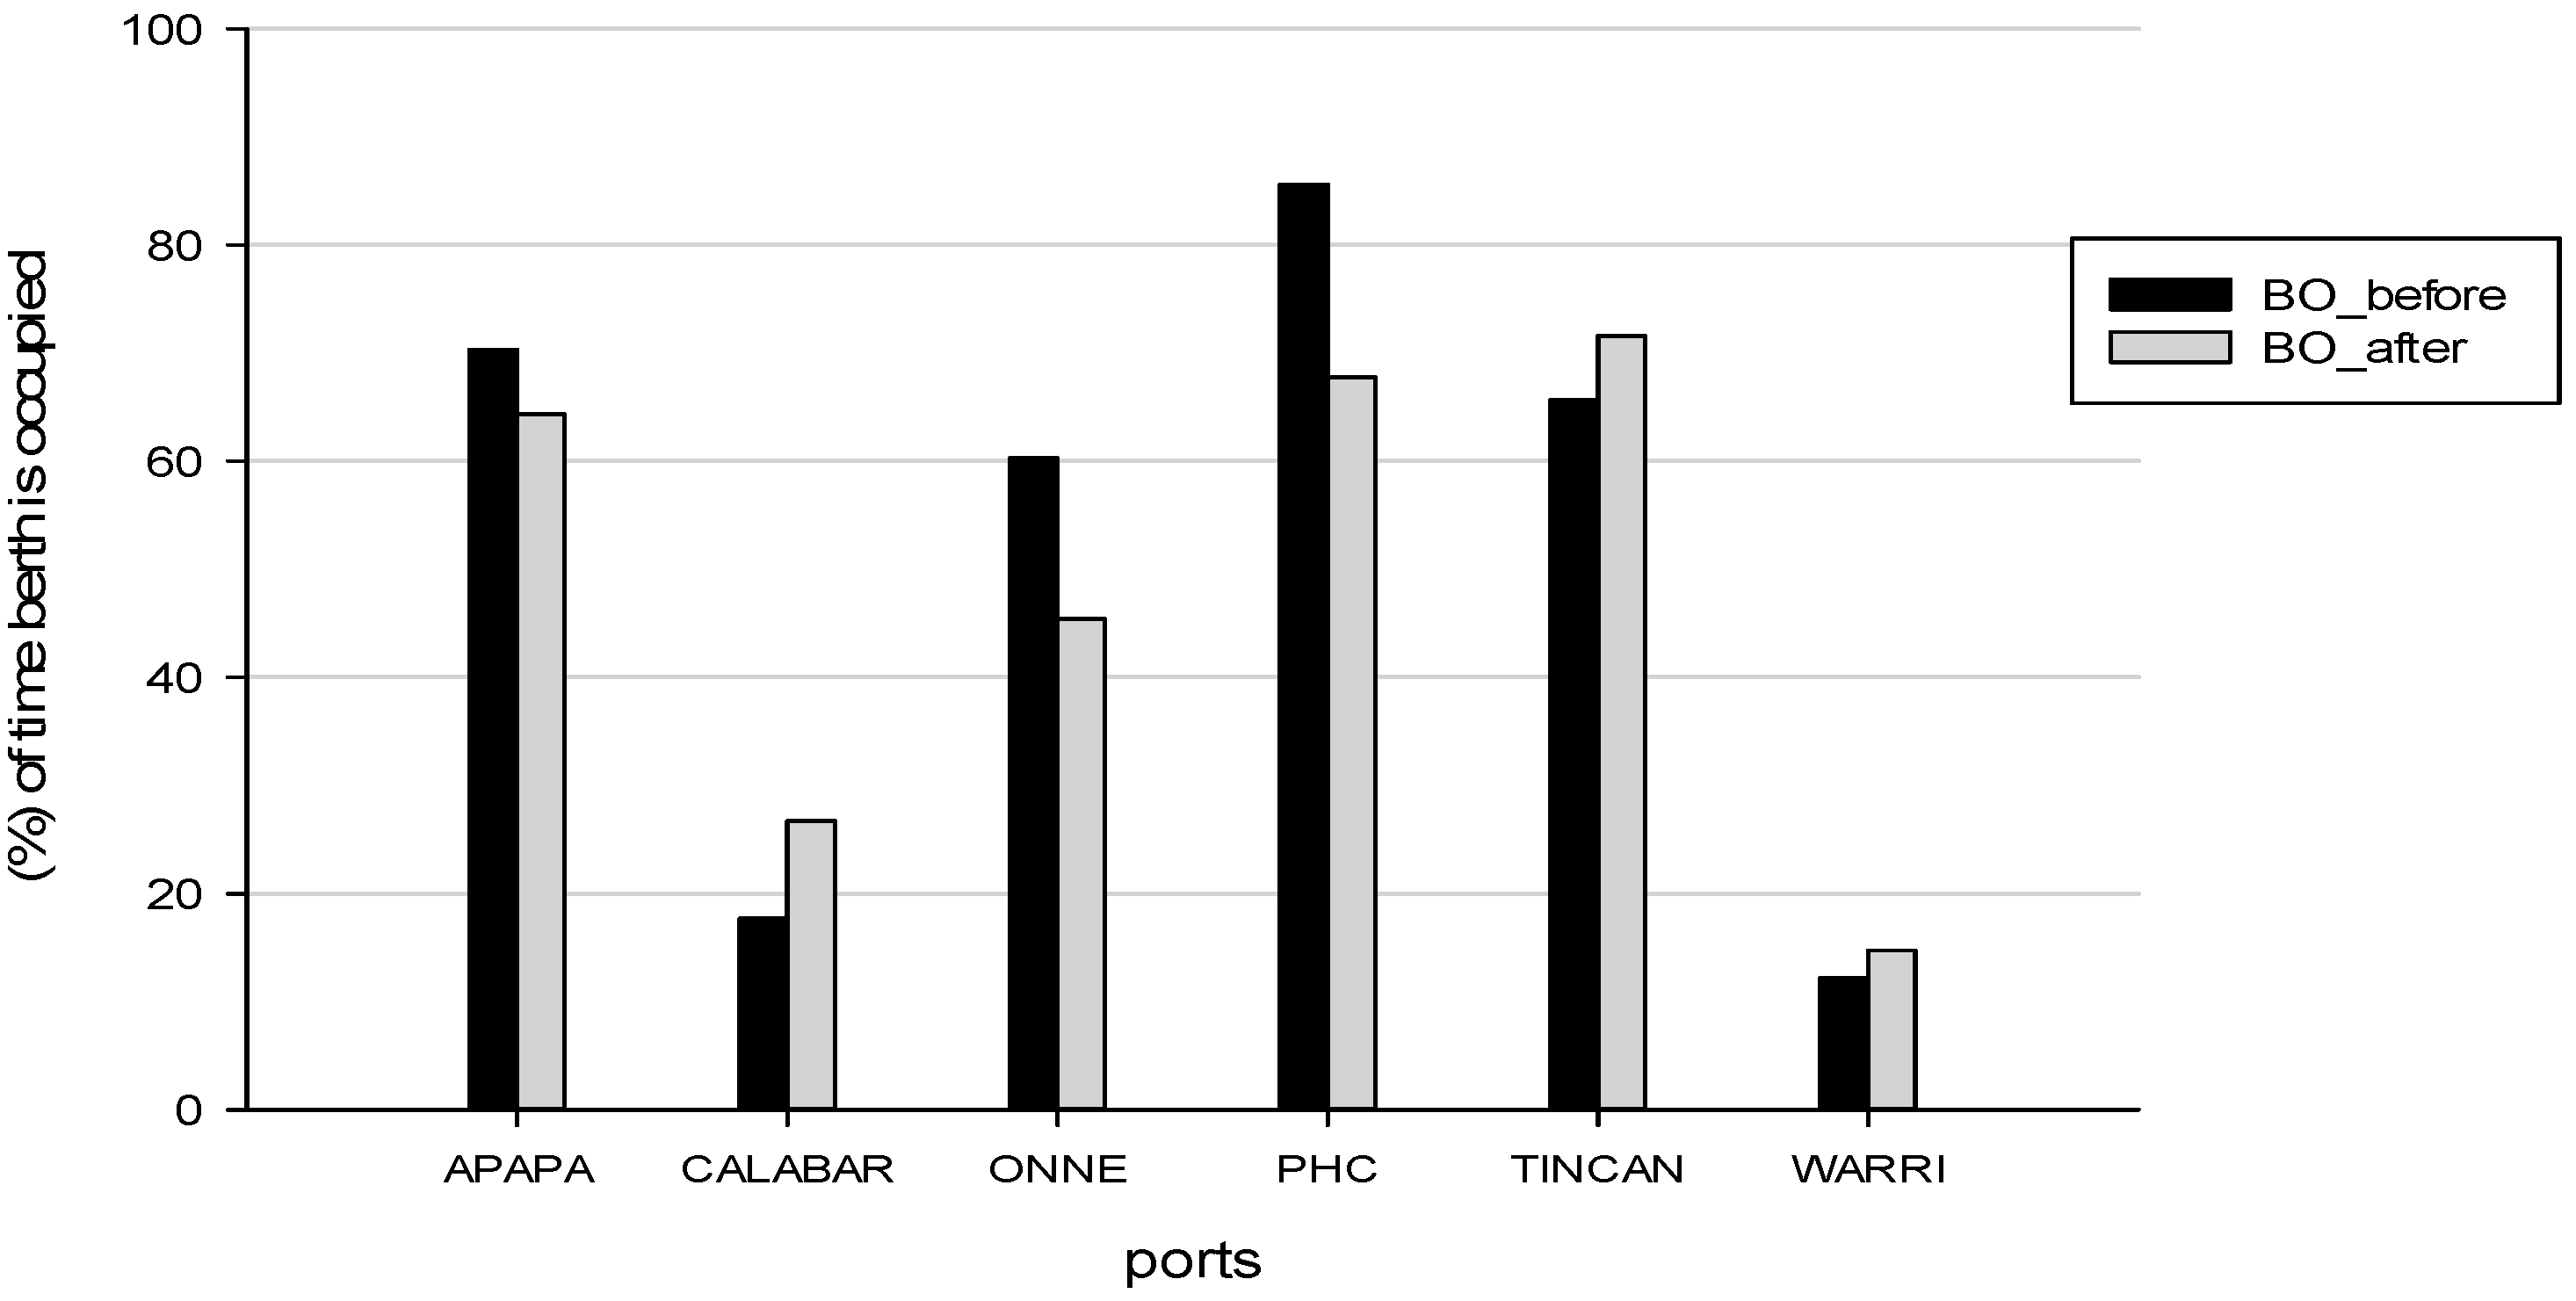
Another metric for assessing port performance is the berth occupancy rate. It is actually an indicator of utilization as it measures how effectively berths are utilized. Based on the mathematical construction of this variable, a high berth occupancy rate in a port terminal may indicate congestion, delay, high level of cargo handling activity and sometimes, a combination of these factors. Thus, in Figure 5, we notice that Apapa, Onne, and Port-Harcourt ports recorded marginal drops in berth occupancies after the concession reforms, while Calabar, Tincan, and Warri ports, in contrast, had marginal increments in berth occupancy rates.
Since we have noted that cargo and vessels’ throughputs increased in these ports after the concession (see Figure 2 and Figure 3), the observed berth occupancy rates could be attributed to high levels of vessel and cargo handling activities at berths in these ports. This observation is also consistent with the observed ships’ turnround times which did not decrease in two ports: Calabar and Warri.
In summary, the results from the trend analyses show that after the implementation of terminal concession policy, positive growth in cargo and vessel throughputs were achieved in about 80% of the ports under investigation and with higher throughputs recorded by Apapa, Onne, and Tincan ports. The observed growth rates were twice the prevailing values before the reforms. However, while we noted growth in throughputs in all ports, we found that, after the reform, Apapa, Port-Harcourt, Tincan, and Onne ports achieved lower ships turnround times than the other ports. Thus, the average value of ships’ turnround times in these ports was above four days (see Figure 4).
In Figure 6, the distribution of plants and equipment across the ports indicates that significant investments were made by the private terminal operators in acquiring new facilities after the concession. Except for Calabar and Tincan ports where marginal growths in new facilities were recorded, the number of plants and equipment for other ports were on average, approximately 50% of their previous values. This finding also indicates that the high berth occupancy observed in Figure 5 may not be attributed to congestion arising from shortage of cargo/vessel handling facilities.
In summary, the implication of these findings is that level of service to vessels visiting ports has not globally improved in Nigeria’s port sector after the reforms. The question thus is; if the Landlord port policy implemented via terminal concessions has attracted more cargo, ship traffic, and additional port facilities from the private terminal operators, what then explains the low level of service obvious from the observed high ships turnround times in some of the ports? Extant studies have shown that delays and congestion at the berths, among other factors, often lead to high ships turnround times. Perhaps further empirical clarification other than the present one is needed to assess ship and cargo handling operations at the terminals. Ship-berth link simulation studies address issues of performance for vessels undergoing cargo operations at berths. As a basis for such study, and to provide preliminary investigation into our research problem, a queuing analysis was carried out, as shown in the subsequent section.
4.2. Queuing Analysis of Nigeria Port Terminals
In Table 3, we present output from waiting line analysis of berths utilized in servicing ships calling at Nigeria port terminals during the study period. The table indicates against each terminal and year; the number of berths utilized; the arrival rates of vessels (λ); and the service rates (µ) of berths or servers. Other parameters of the waiting line model include: the probability of zero vessels in the system (P0) or system capacity utilization, the average number of vessels in the queue (Lq) or waiting for service at the berths, average number of a vessels in the system (Ls) (waiting and being served), average time spent per vessel on queue (Wq), and average time spent per vessel in the system (Ws).
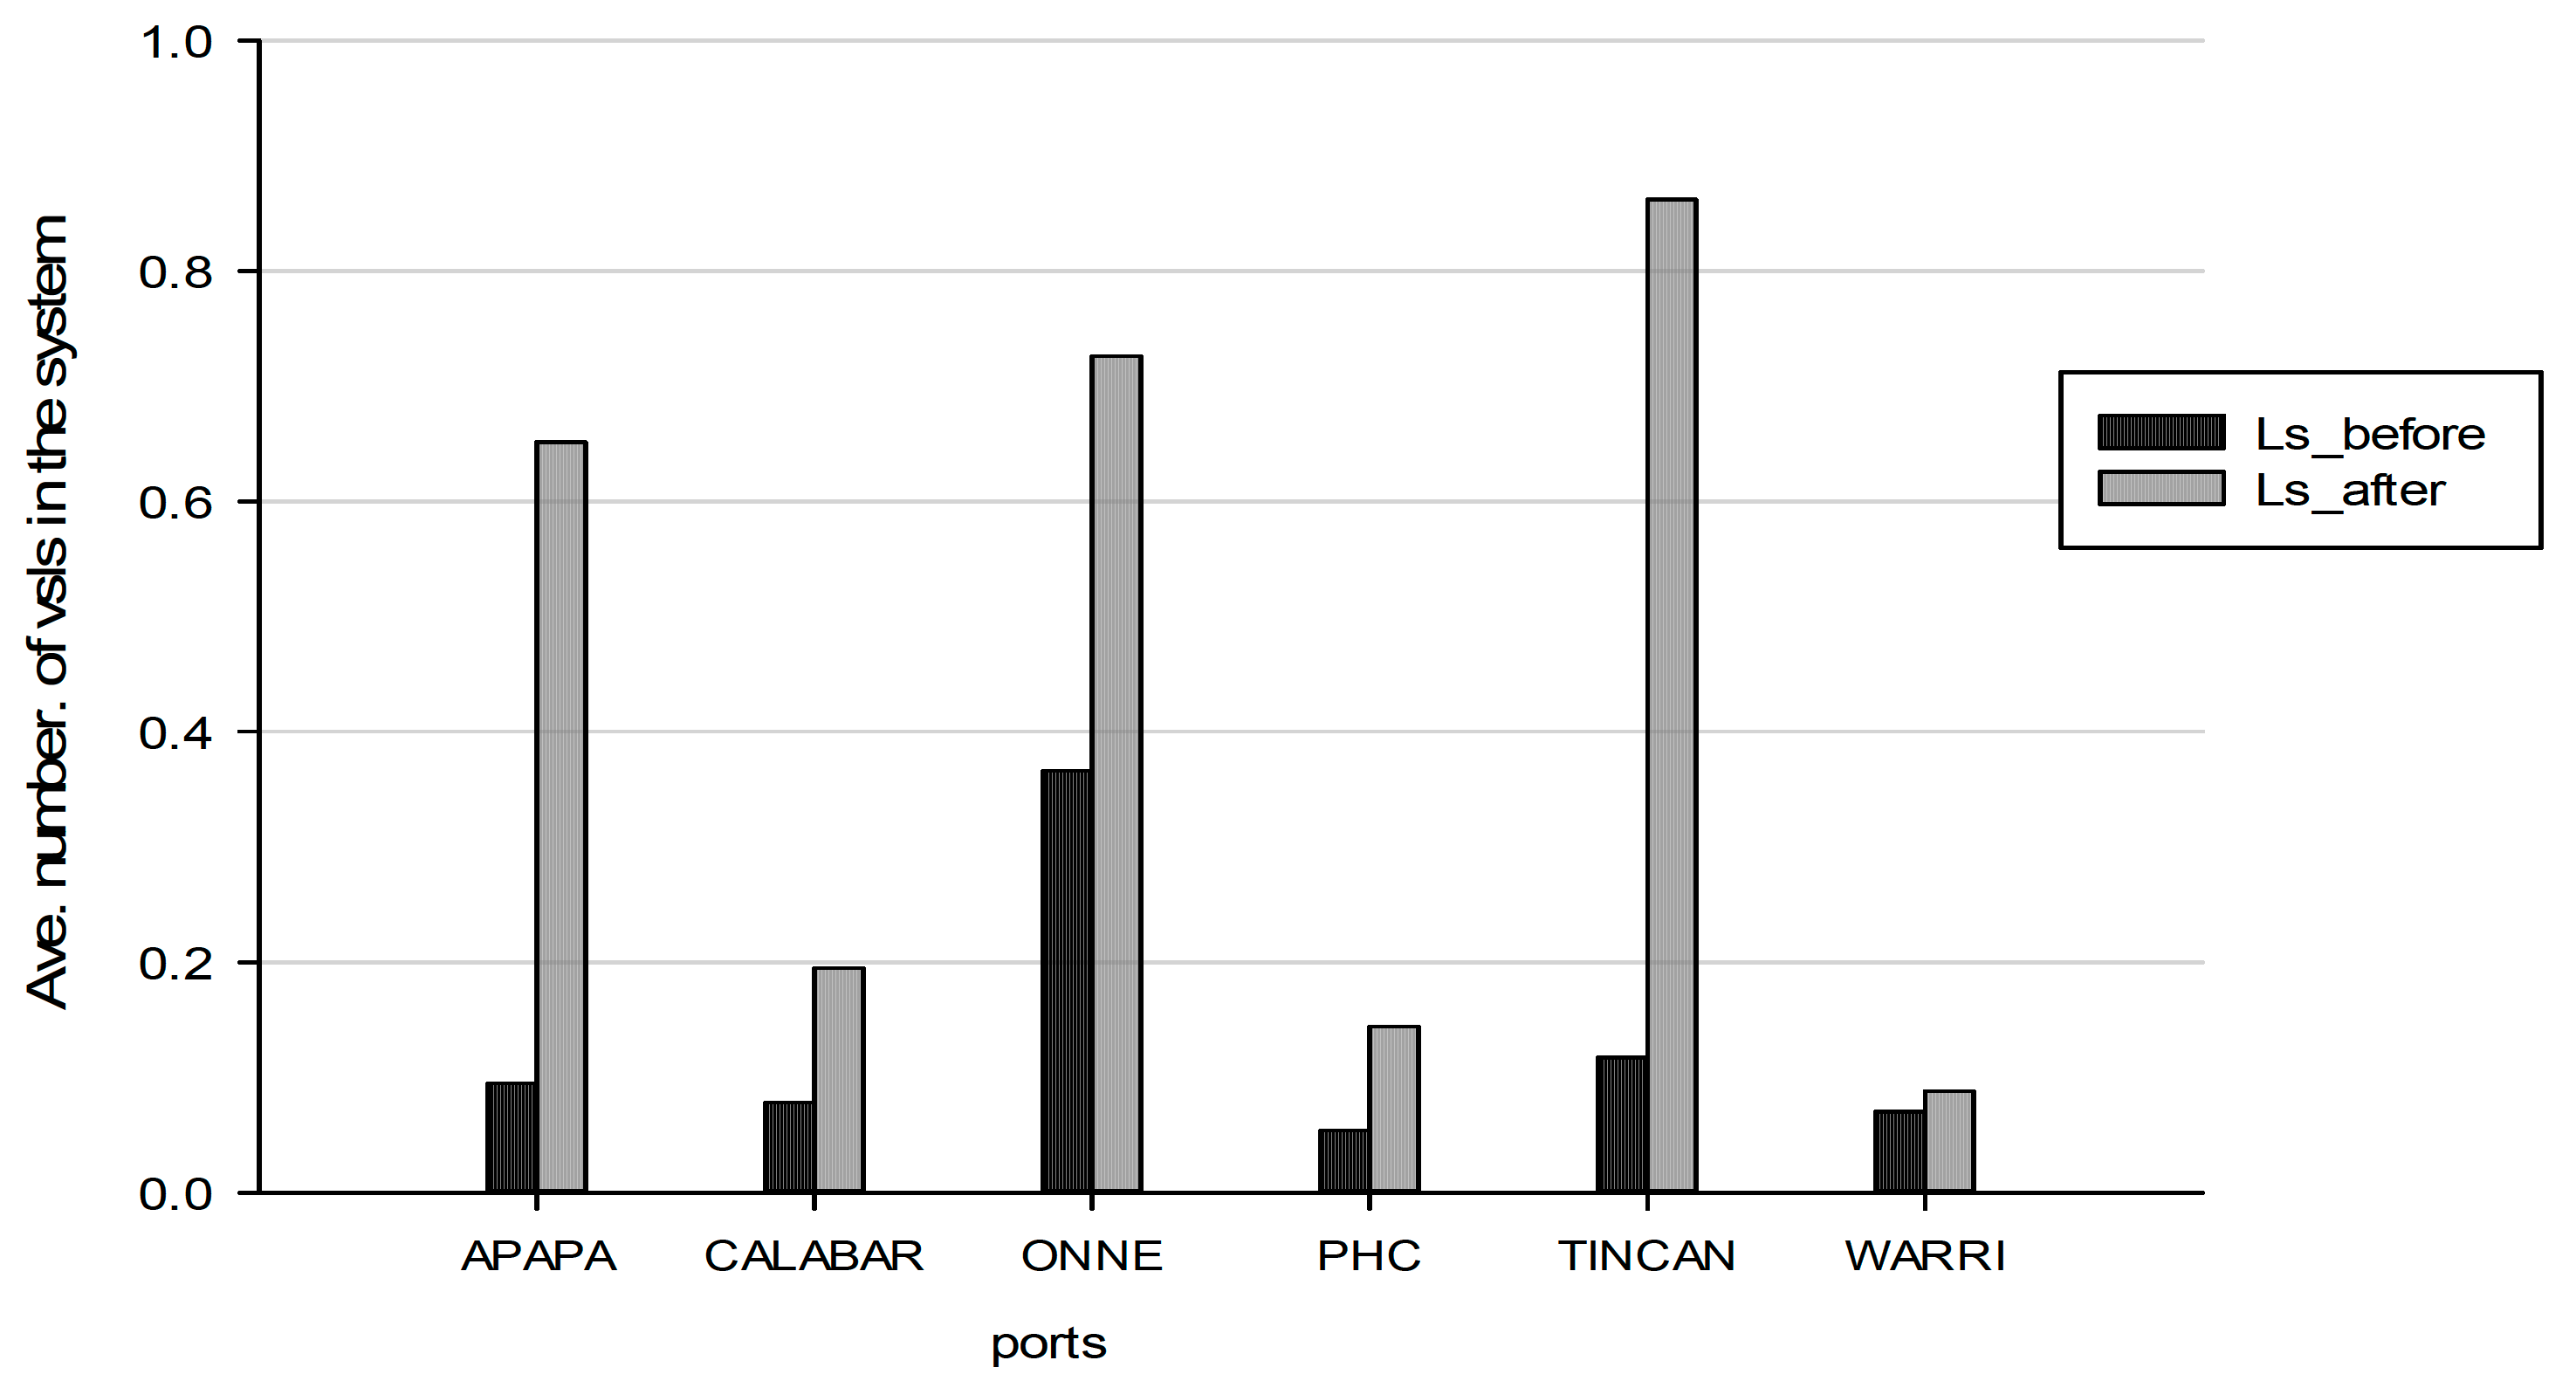
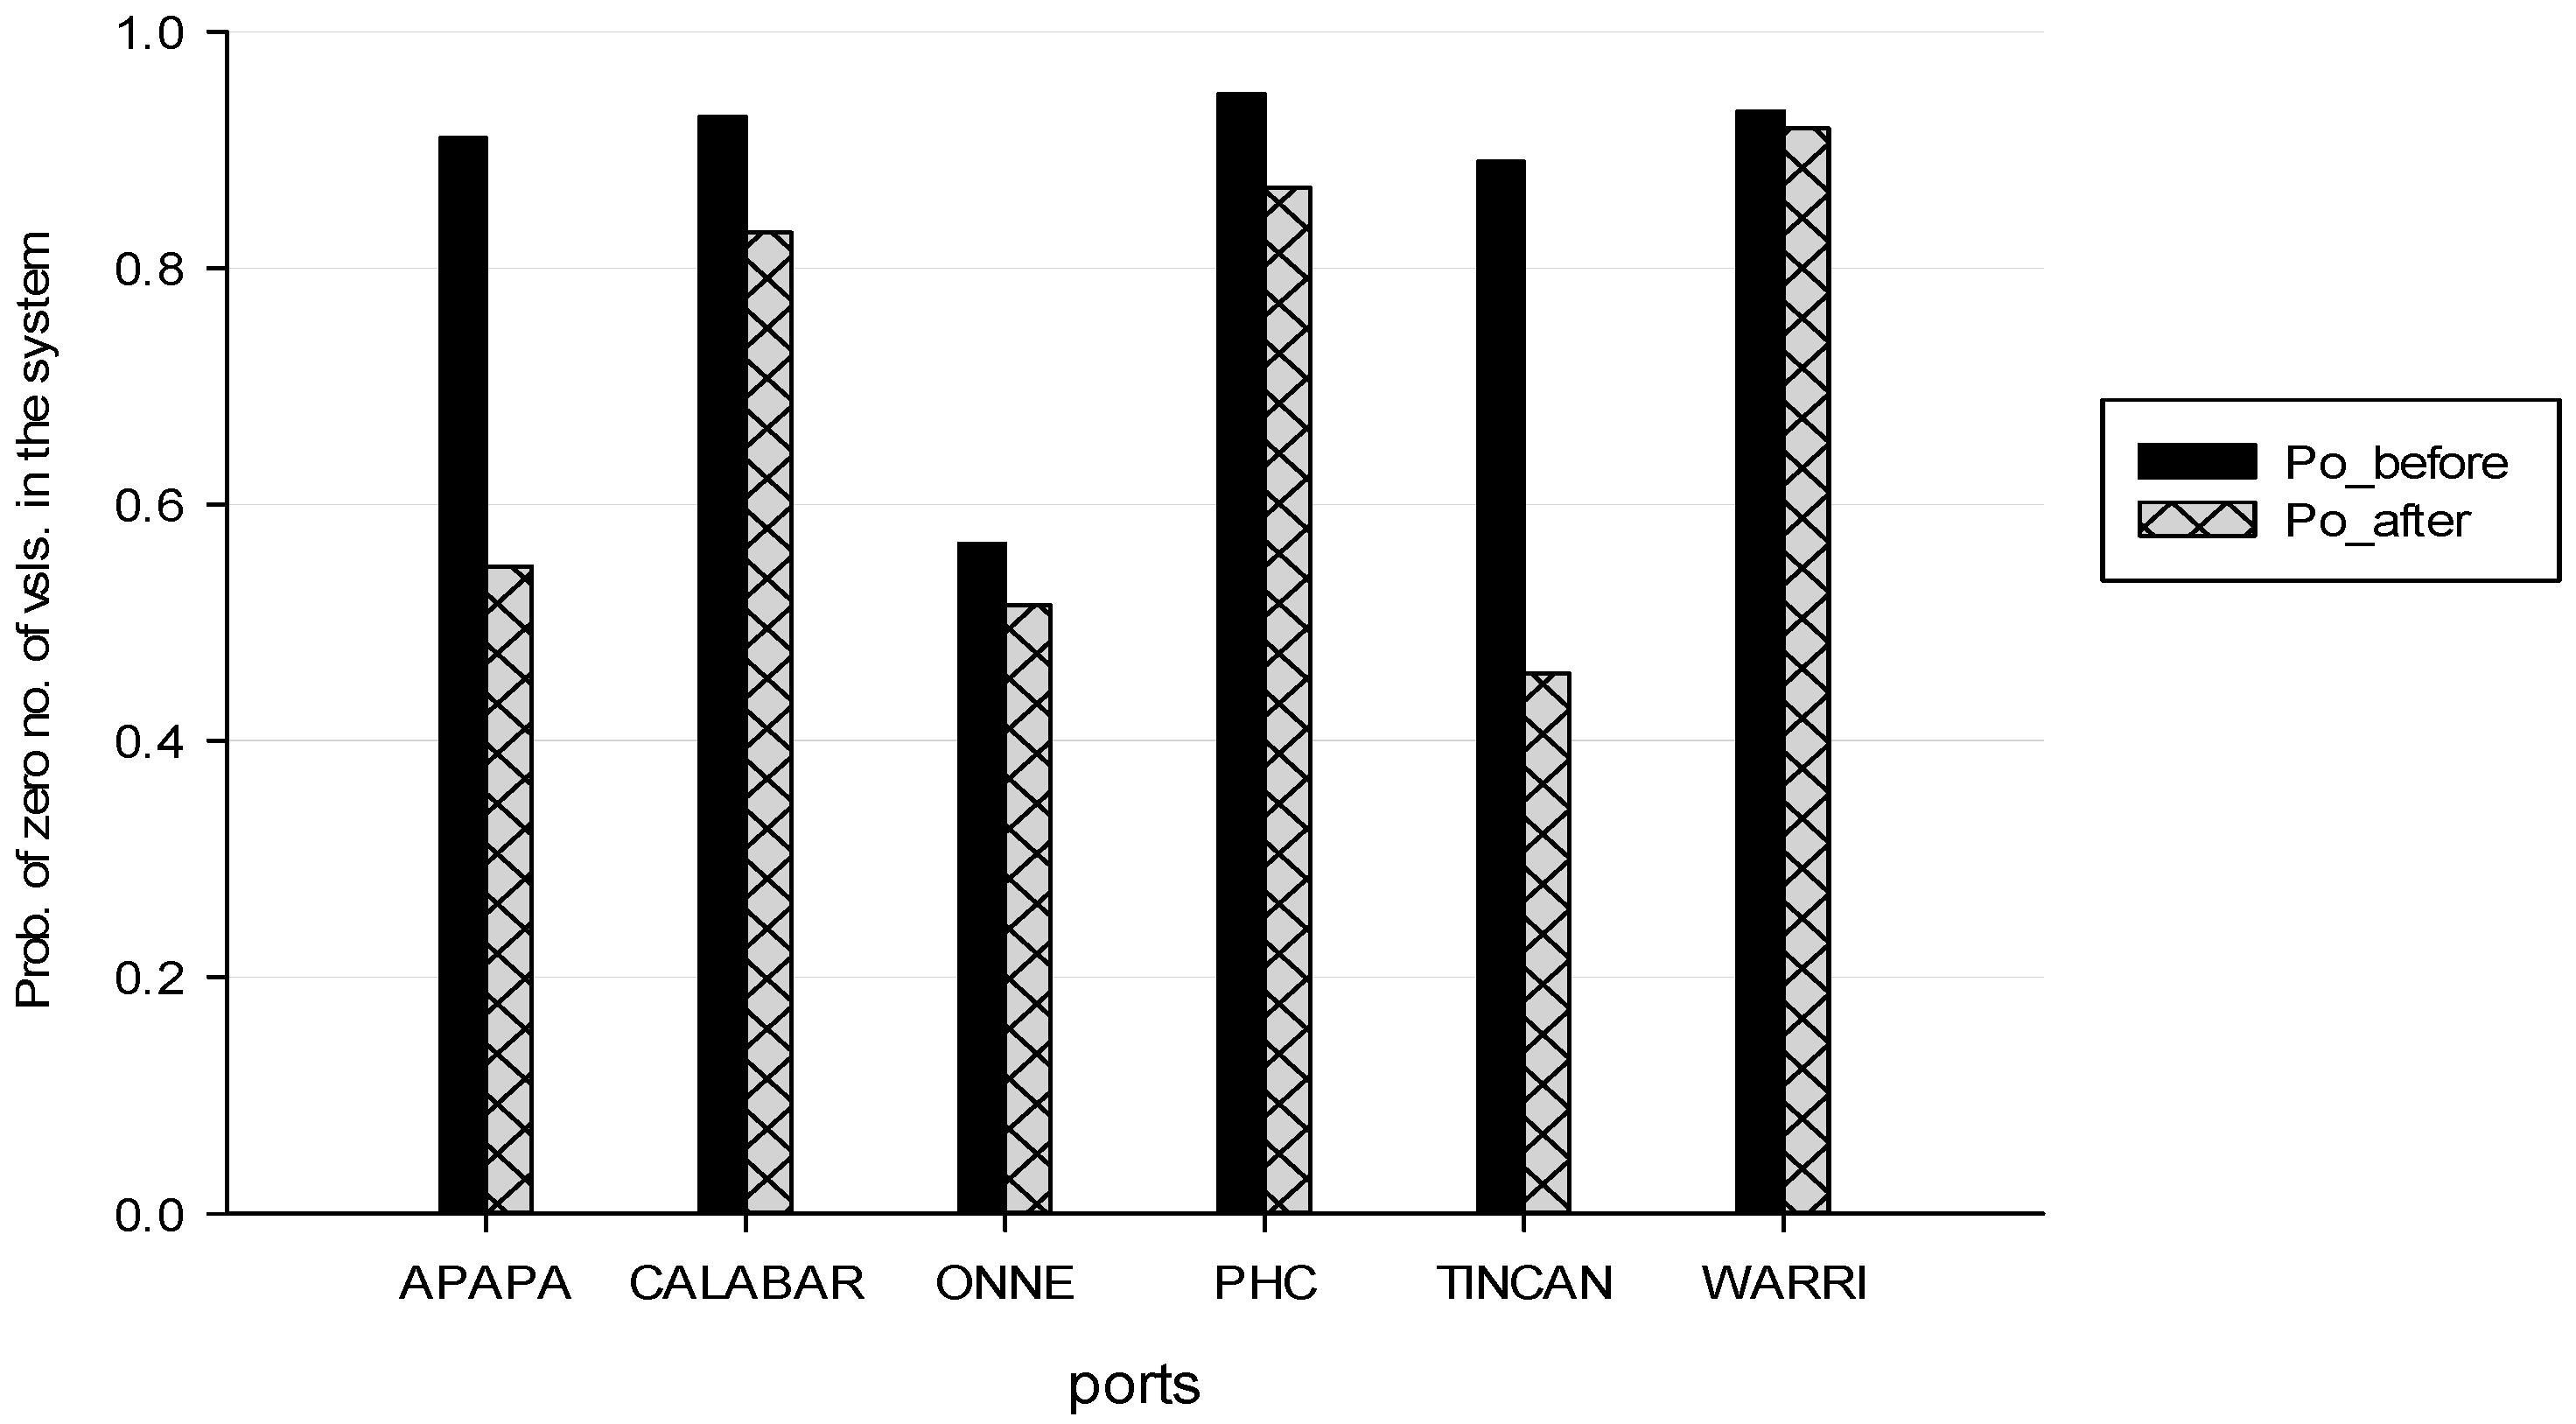
However, for better observation, the operational characteristics of berths in the port terminals under study were presented as barcharts shown in figures below. Some of these characteristics disaggregated by the concession periods (before and after) include probability of zero vessels in the system (same as capacity utilization of the berths) and the average number of vessels in the system. Here, as in queuing theory, vessels in the system refer to those on queue and those being served.
As shown in Table 3, average number of vessels on queue is zero for all the terminals, meaning that, on average, no vessel queued for service on arrival as there were available berths waiting to be occupied. Also, average time spent per vessel on queue (Wq) is zero, according to Table 3. This implies that vessels were probably positioned for ship operation at the berths without delay. It is not obvious from the queuing analysis how immediately vessels were worked upon after being positioned alongside berths. Perhaps there were delays from this point which eventually swelled the average time spent by vessels in the system (i.e., waiting and being served). As can be deduced from Figure 7, in the post-concession regime, average number of vessels in the system was not zero, implying vessels were always calling for service. Again, since vessels spent zero time on queues and the average time spent in the system was not zero, there were probably significant delays on vessels being worked on. Contrasting these findings with the distribution of ship turnround times in Figure 4, the high ships turnround time values observed in (post-concession) Apapa (>8 days), Port Harcourt (>10 days), Tincan (>5 days), and Warri ports (>6 days) are understandable. Therefore, some factors are responsible for the delays experienced by vessels at the berths. This observation varied with the concession policy periods and by terminals. The probability of zero vessels in the system (P0) also varied over time and by terminals (see Figure 8).
5. Conclusion
The descriptive analysis of port performance using key performance indicators showed that cargo and vessel throughputs improved in all ports after the concession reform. However, based on the queuing model analysis, we found, generally, that while vessels visiting the ports were allocated to berths on arrival. There were delays before they were worked (or while being worked) on at the berths as the average number of vessels in the system (Ls) was never zero and the probability of zero vessels in the system (P0) was never zero. These findings may account for less than optimal ships’ turnround times observed in some of the ports. The introduction of Landlord port policy improved cargo and vessel throughputs in the ports studied. This development could be attributed to port patronage attracted by the investment in new facilities (see Figure 6) and managerial skills brought about by the terminal operators. However, results from this research suggest that cargo handling operations are not managed optimally as there are still delays associated with operations at the berths.
The present research effort provides a basic framework for an in-depth study on ship-berth link simulation analysis. In conducting such a study, efforts should be made toward understanding, in a dynamic mode, ship-berth system operation processes especially as they impact on performance outcomes. For example, future research should focus on influence of crane moves per time period, truck positioning times, and duration of cargo transfer to transit storage areas on terminal performance outcomes.
Conflicts of Interest
The author declares no conflict of interest.
Appendix A

Table A1.
Derived Data Values from Ports’ Ship and Cargo Operations Used as Input Values for the Queuing Analysis (Truncated to Conserve Space).
Table A1.
Derived Data Values from Ports’ Ship and Cargo Operations Used as Input Values for the Queuing Analysis (Truncated to Conserve Space).
| S/No | Ports | Year | Ship Calls (nos.) | Ave Arrival Rate per Day | Days Awaiting Berth | Days at Berth | Ave Waiting Time in Days | No. of Berths(c) | Ave Service Time (days) | Berth Occupancy |
|---|---|---|---|---|---|---|---|---|---|---|
| 1 | APAPA | 2000 | 517 | 1.4164 | 25 | 6,679 | 0.0484 | 30 | 12.9188 | 77.43 |
| 2 | APAPA | 2001 | 433 | 1.1863 | 1,204 | 5,301 | 2.7806 | 30 | 12.2425 | 77.74 |
| 3 | APAPA | 2002 | 561 | 1.5370 | 5,788 | 6,856 | 10.3173 | 30 | 12.2210 | 81.69 |
| 4 | APAPA | 2003 | 272 | 0.7452 | 2,382 | 3,252 | 8.7574 | 30 | 11.9559 | 62.05 |
| 5 | APAPA | 2004 | 257 | 0.7041 | 805 | 2,713 | 3.1323 | 30 | 10.5564 | 65.96 |
| 6 | APAPA | 2005 | 286 | 0.7836 | 563 | 2,114 | 1.9685 | 31 | 7.3916 | 57.01 |
| ‘‘ | ‘‘ | ‘‘ | ‘‘ | ‘‘ | ‘‘ | ‘‘ | ‘‘ | ‘‘ | ‘‘ | ‘‘ |
| 17 | CALABAR | 2000 | 206 | 0.5644 | 123 | 422 | 0.5971 | 14 | 2.0485 | 16.75 |
| 18 | CALABAR | 2001 | 28 | 0.0767 | 4 | 158 | 0.1429 | 14 | 5.6429 | 14.71 |
| 31 | CALABAR | 2014 | 159 | 0.4356 | 193 | 873 | 1.6000 | 8 | 3.3700 | 24.6 |
| 32 | CALABAR | 2015 | 197 | 0.5397 | 194 | 812 | 1.6060 | 8 | 3.3800 | 36.7 |
| 33 | ONNE | 2000 | 122 | 0.3342 | 15 | 277 | 0.1230 | 9 | 2.2705 | 36.84 |
| 34 | ONNE | 2001 | 231 | 0.6329 | 28 | 498 | 0.1212 | 9 | 2.1558 | 44.44 |
| 47 | ONNE | 2014 | 861 | 2.3589 | 21 | 2,256 | 0.6120 | 6 | 2.3400 | 32.4 |
| 48 | ONNE | 2015 | 820 | 2.2466 | 22 | 2,345 | 0.6135 | 6 | 2.4560 | 24.6 |
| 49 | PHC | 2000 | 205 | 0.5616 | 340 | 1,914 | 1.6585 | 8 | 9.3366 | 77.57 |
| ‘‘ | ‘‘ | ‘‘ | ‘‘ | ‘‘ | ‘‘ | ‘‘ | ‘‘ | ‘‘ | ‘‘ | ‘‘ |
| 63 | PHC | 2014 | 461 | 1.2630 | 1,516 | 2,897 | 3.5210 | 8 | 6.1710 | 62.3 |
| 64 | PHC | 2015 | 447 | 1.2247 | 1,517 | 2,876 | 3.5432 | 8 | 6.1734 | 47.9 |
| 65 | TINCAN | 2000 | 245 | 0.6712 | 75 | 1,739 | 0.3061 | 13 | 7.0980 | 56.78 |
| 80 | TINCAN | 2015 | 1,725 | 4.7260 | 1,538 | 5,993 | 1.0134 | 18 | 3.4100 | 68.3 |
| 81 | WARRI | 2000 | 120 | 0.3288 | 5 | 591 | 0.0417 | 17 | 4.9250 | 8.97 |
| ‘‘ | ‘‘ | ‘‘ | ‘‘ | ‘‘ | ‘‘ | ‘‘ | ‘‘ | ‘‘ | ‘‘ | ‘‘ |
| 95 | WARRI | 2014 | 357 | 0.9781 | 289 | 673 | 1.5965 | 20 | 6.5600 | 15.4 |
| 96 | WARRI | 2015 | 498 | 1.3644 | 281 | 678 | 1.7987 | 20 | 6.1900 | 11.2 |
| Source: Author compiled data based on field work. | ||||||||||
‘‘ implies continuation of values not shown.
References
- Framework for Port Reform. Available online: https://ppiaf.org/sites/ppiaf.org/files/documents/toolkits/Portoolkit/Toolkit/pdf/modules/01_TOOLKIT_Module1.pdf (accessed on 10 December 2015).
- Leigland, J.; Palsson, G. Port Reform in Nigeria: Upstream Policy Reforms Kick-Start One of the World’s Largest Concession Programs. Gridlines: No. 1, Public-Private Infrastructure Advisory Facility (PPIAF). The World Bank: Washington, DC, USA, 2007. Available online: https://openknowledge.worldbank.org/handle/10986/10717 (accessed on 24 February 2018).
- Gidado, S.U. Port Pricing and Tariff Rates Regime in Nigeria Seaports: Imperatives for Deregulation. Unpublished Ph.D. Thesis, Federal University of Technology, Owerri, Nigeria, December 2008. [Google Scholar]
- United Nations Conference on Trade and Development UNCTAD. How to Utilize FDI to Improve Transport Infrastructure–Ports: Lessons from Nigeria. Best Practices in Investment for Development: Case Studies in FDI. United Nations: Geneva, Switzerland, 2011. Available online: http://unctad.org/en/Docs/diaepcb2011d8_en.pdf (accessed on 10 March 2012).
- Nigeria: Reforming the Maritime Ports. Available online: http://lagoschamber.com/wp-content/uploads/2016/10/Reforming-the-Maritime-Port-New.pdf (accessed on 24 February 2018).
- Brooks, M.R.; Cullinane, K. Governance models defined. In Devolution, Port Governance and Port Performance; Brooks, M.R., Cullinane, K., Eds.; JAI Press (Elsevier): Oxford, UK, 2006; Chapter 18; pp. 405–435. [Google Scholar]
- Baird, A.J. Port Privatization: Objectives, Extent, Process and the UK Experience. Int. J. Marit. Econ. 2000, 2, 177–194. [Google Scholar] [CrossRef]
- Ferrari, C.; Parola, F.; Tei, A. Governance models and port concessions in Europe: Commonalities, critical issues and policy perspectives. Transp. Policy 2015, 41, 60–67. [Google Scholar] [CrossRef]
- Burns, M.G. Port Management and Operations; Taylor & Francis: Boca Raton, FL, USA, 2015. [Google Scholar]
- Port Reform Toolkit PPIAF, World Bank, 2nd ed. Available online: http://ppp.Worldbank.org/public-private-partnership/library/port-reform-toolkit-ppiaf-world-bank-2nd-edition (accessed on 3 May 2011).
- Notteboom, T. Concession agreements as port governance tools. In Devolution, Port Governance and Port Performance; Brooks, M.R., Cullinane, K., Eds.; JAI Press (Elsevier): Oxford, UK, 2006; Chapter 19; pp. 437–455. [Google Scholar]
- United Nations Conference on Trade and Tariffs (UNCTAD). Port Performance Indicators; United Nations: Geneva, Switzerland, 1976; Available online: http://unctad.org/en/PublicationsLibrary/tdbc4d131sup1rev1_en.pdf (accessed on 24 February 2018).
- De Langen, P.; Nijdam, M.; Van der Horst, M. New indicators to measure port performance. J. Marit. Res. 2007, 4, 23–36. [Google Scholar]
- Bichou, K. Port Operations, Planning and Logistics; Informa Law from Rutledge: New York, NY, USA, 2013. [Google Scholar]
- Barros, C.P. A Benchmark Analysis of Italian Seaports Using Data Envelopment Analysis. Marit. Econ. Logist. 2006, 8, 347–365. [Google Scholar] [CrossRef]
- Barros, C.P.; Shunsuke, M. Productivity Drivers in Japanese Seaports. Technical University of Lisbon: Lisbon, Portugal, February 2008. Available online: https://plagiarism.repec.org/barros-managi/barros-managi1.pdf (accessed on 24 February 2018).
- Tongzon, J.; Heng, W. Port privatization, efficiency and competitiveness: Some empirical evidence from container ports (terminals). Transp. Res. Part A 2005, 39, 405–424. [Google Scholar] [CrossRef]
- Dasanayaka, S.W.S.B. Scale of Operations, Productivity Based Profitability and Capacity Utilization in the Colombo Seaports in Sri-Lanka. In Proceedings of the International Conference “Shipping in the Era of Social Responsibility”, Argostoli, Cephalonia, Greece, 14–16 September 2006. [Google Scholar]
- Cullinane, K.; Wang, T.; Song, D.; Ji, P. The Technical Efficiency of Container ports: Comparing Data Envelopment Analysis and Stochastic Frontier Analysis. Transp. Res. Part A 2006, 40, 354–374. [Google Scholar] [CrossRef]
- Simar, L.; Wilson, P.W. Estimation and inference in two-stage, semi-parametric models of production processes. J. Econ. 2007, 136, 31–64. [Google Scholar] [CrossRef]
- Cheon, S. Evaluating Impacts of Institutional Reforms on Port Efficiency Changes: Malmquist Productivity Index for World Container Ports. In Proceedings of the 2nd Annual National Urban Freight Conference, Long Beach, CA, USA, July 2007. [Google Scholar]
- Cullinane, K.; Wang, T. Data Envelopment Analysis (DEA) and Improving Container Port Efficiency; Devolution, Port Governance and Port Performance. Res. Transp. Econ. 2007, 17, 517–566. [Google Scholar] [CrossRef]
- Panayides, P.M.; Maxoulis, C.N.; Wang, T.; Ng, K.Y.A. A Critical Analysis of DEA Applications to Seaport Economic Efficiency Measurement. Transp. Rev. 2009, 29, 183–206. [Google Scholar] [CrossRef]
- Barros, C.P.; Haralambides, H.; Hussain, M.; Peypoch, N. A New Approach in Benchmarking Seaport Efficiency and Technological Change. Int. J. Transp. Econ. 2010, 37, 77–96. [Google Scholar]
- Al-Eraqi, A.S.; Mustafa, A.; Khader, A.T.; Barros, C.P. Efficiency of Middle Eastern and East African Seaports: Application of DEA Using Window Analysis. Eur. J. Sci. Res. 2008, 23, 597–612. [Google Scholar]
- Herrera, S.; Pang, G. Efficiency of Infrastructure: The Case of Container Ports. Rev. Econ. Bras. (DF) 2008, 9, 165–194. [Google Scholar]
- Liu, B.; Liu, W.; Cheng, C. The Efficiency of Container Terminals in Mainland China: An Application of DEA Approach. In Proceedings of the WiCOM 4th International Conference on Wireless Communications, Networking and Mobile Computing, Dalian, China, 12–14 October 2008. [Google Scholar]
- Size and Specialization as Determinant of Iberian Port Performance: New Methodology to Group Different Ports. Available online: http://mpra.ub.uni-muenchen.de/31957/ (accessed on 15 May 2012).
- Measuring Seaports’ Productivity: A Malmquist Productivity Index Decomposition Approach. Available online: http://mpra.ub.uni-muenchen.de/40174/ (accessed on 2 October 2012).
- Munisamy, S.; Singh, G. Benchmarking the efficiency of Asian container ports. Afr. J. Bus. Manag. 2011, 5, 1397–1407. [Google Scholar]
- Lu, B.; Wang, X. Application of DEA on the measurement of operating efficiencies for east-Asia major container terminals. J. Syst. Manag. Sci. 2012, 1, 1–18. [Google Scholar]
- Gonzalez, M.M.; Trujillo, L. Reforms and infrastructure efficiency in Spain’s container ports. Transp. Res. Part A Policy Pract. 2008, 42, 243–257. [Google Scholar] [CrossRef]
- Di-Vaio, A.; Medda, F.R.; Trujillo, L. An Analysis of The Efficiency of Italian Cruise Terminals. Int. J. Transp. Econ. 2011, xxxviii, 29–46. [Google Scholar]
- Kennedy, O.R.; Lin, K.; Yang, H.; Banomyong, R. Sea-Port Operational Efficiency: An Evaluation of Five Asian Ports Using Stochastic Frontier Production Function Model. J. Serv. Sci. Manag. 2011, 4, 391–399. [Google Scholar] [CrossRef]
- Onwuegbuchunam, D.E. Productivity and Efficiency in Nigeria’s Seaports: A Production Frontier Analysis. Unpublished Ph.D. Thesis, Federal University of Technology Owerri, Owerri, Nigeria, 2014. [Google Scholar]
- Akinyemi, Y.C. Port Reform in Nigeria: Efficiency Gains and Challenges. GeoJournal 2015, 81, 681–697. [Google Scholar] [CrossRef]
- Taha, H.A. Operations Research, an Introduction, 8th ed.; Prentice Hall, Inc: Upper Saddle River, NJ, USA, 2007. [Google Scholar]
- Little, J.D.C. A Proof of the Queuing Formular: L = λW. Oper. Res. 1961, 9, 383–387. [Google Scholar] [CrossRef]
Figure 1.
Schematic representation of a queuing system with parallel servers. Source: Adapted from [37].
Figure 1.
Schematic representation of a queuing system with parallel servers. Source: Adapted from [37].

Figure 2.
Cargo throughputs in metric tonnes (mean values) in Nigeria ports (before and after concession).
Figure 2.
Cargo throughputs in metric tonnes (mean values) in Nigeria ports (before and after concession).

Figure 3.
Distribution of Vessel throughputs in Nigeria ports (before & after concession).

Figure 4.
Distribution of Ships’ Turnround Times in Nigeria ports (before & after concession).
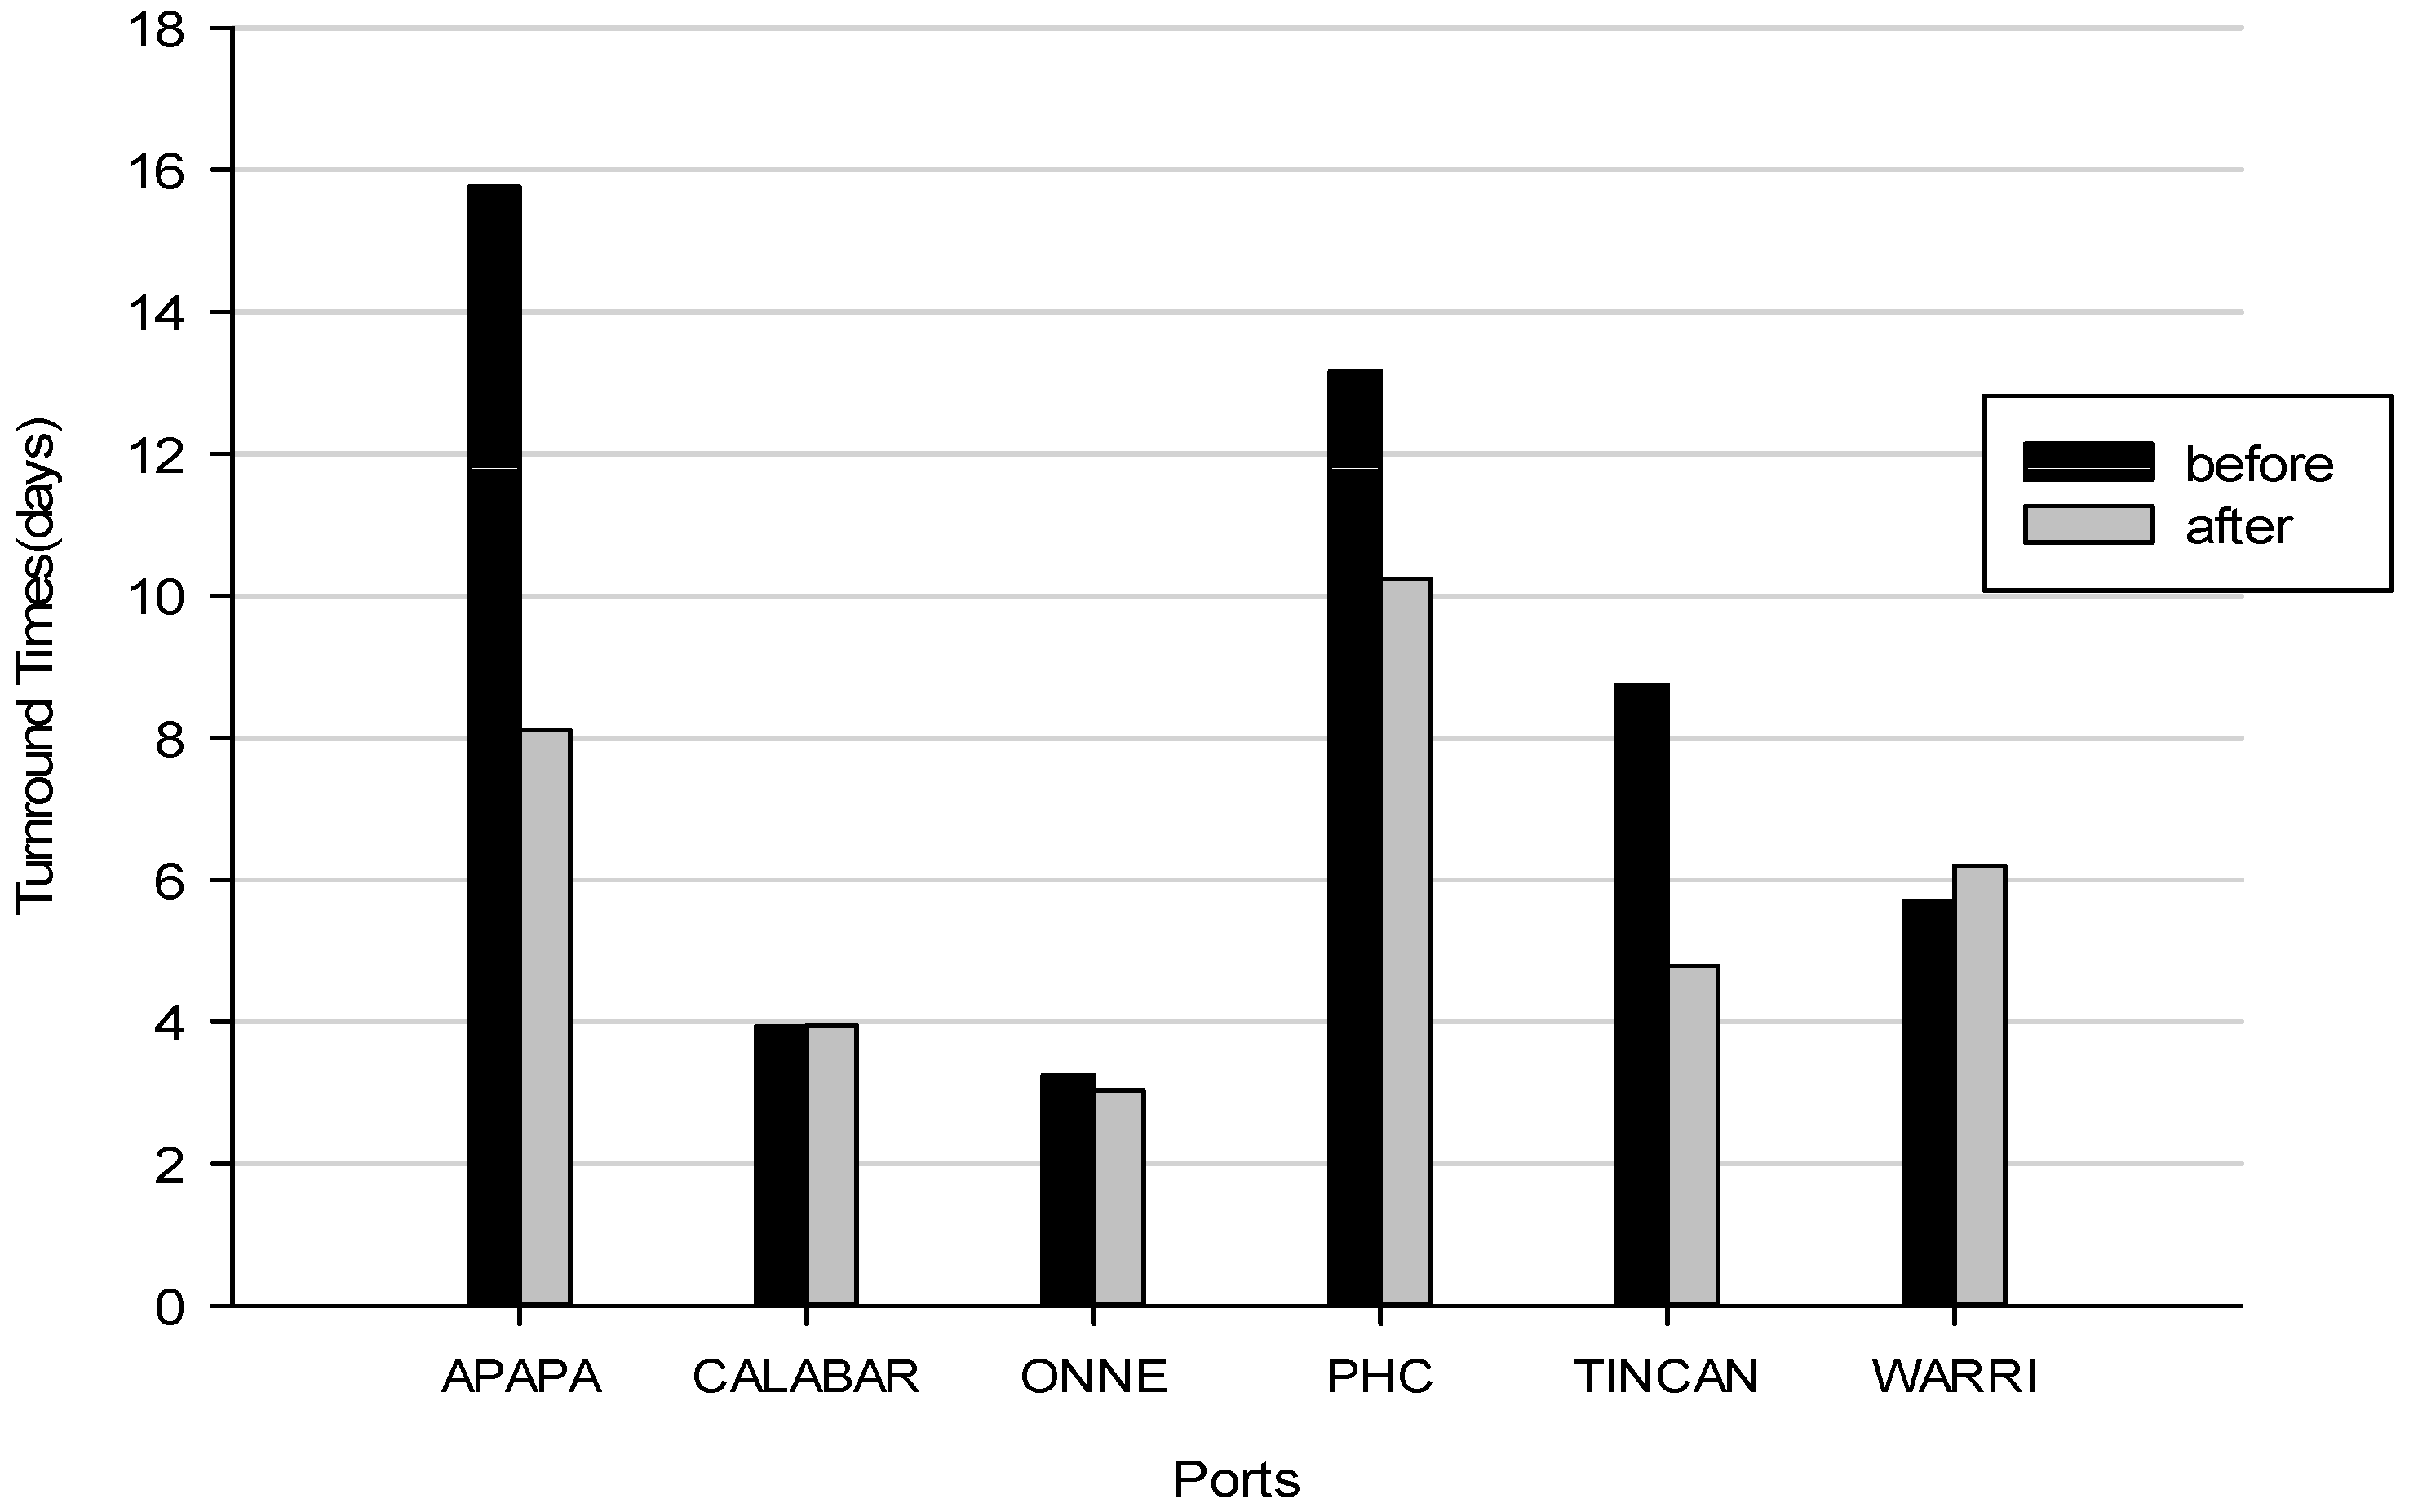
Figure 5.
Berth Occupancy (BO) in Nigeria ports (before & after concession).

Figure 6.
Distribution of plants & equipment in the ports (before and after concession).
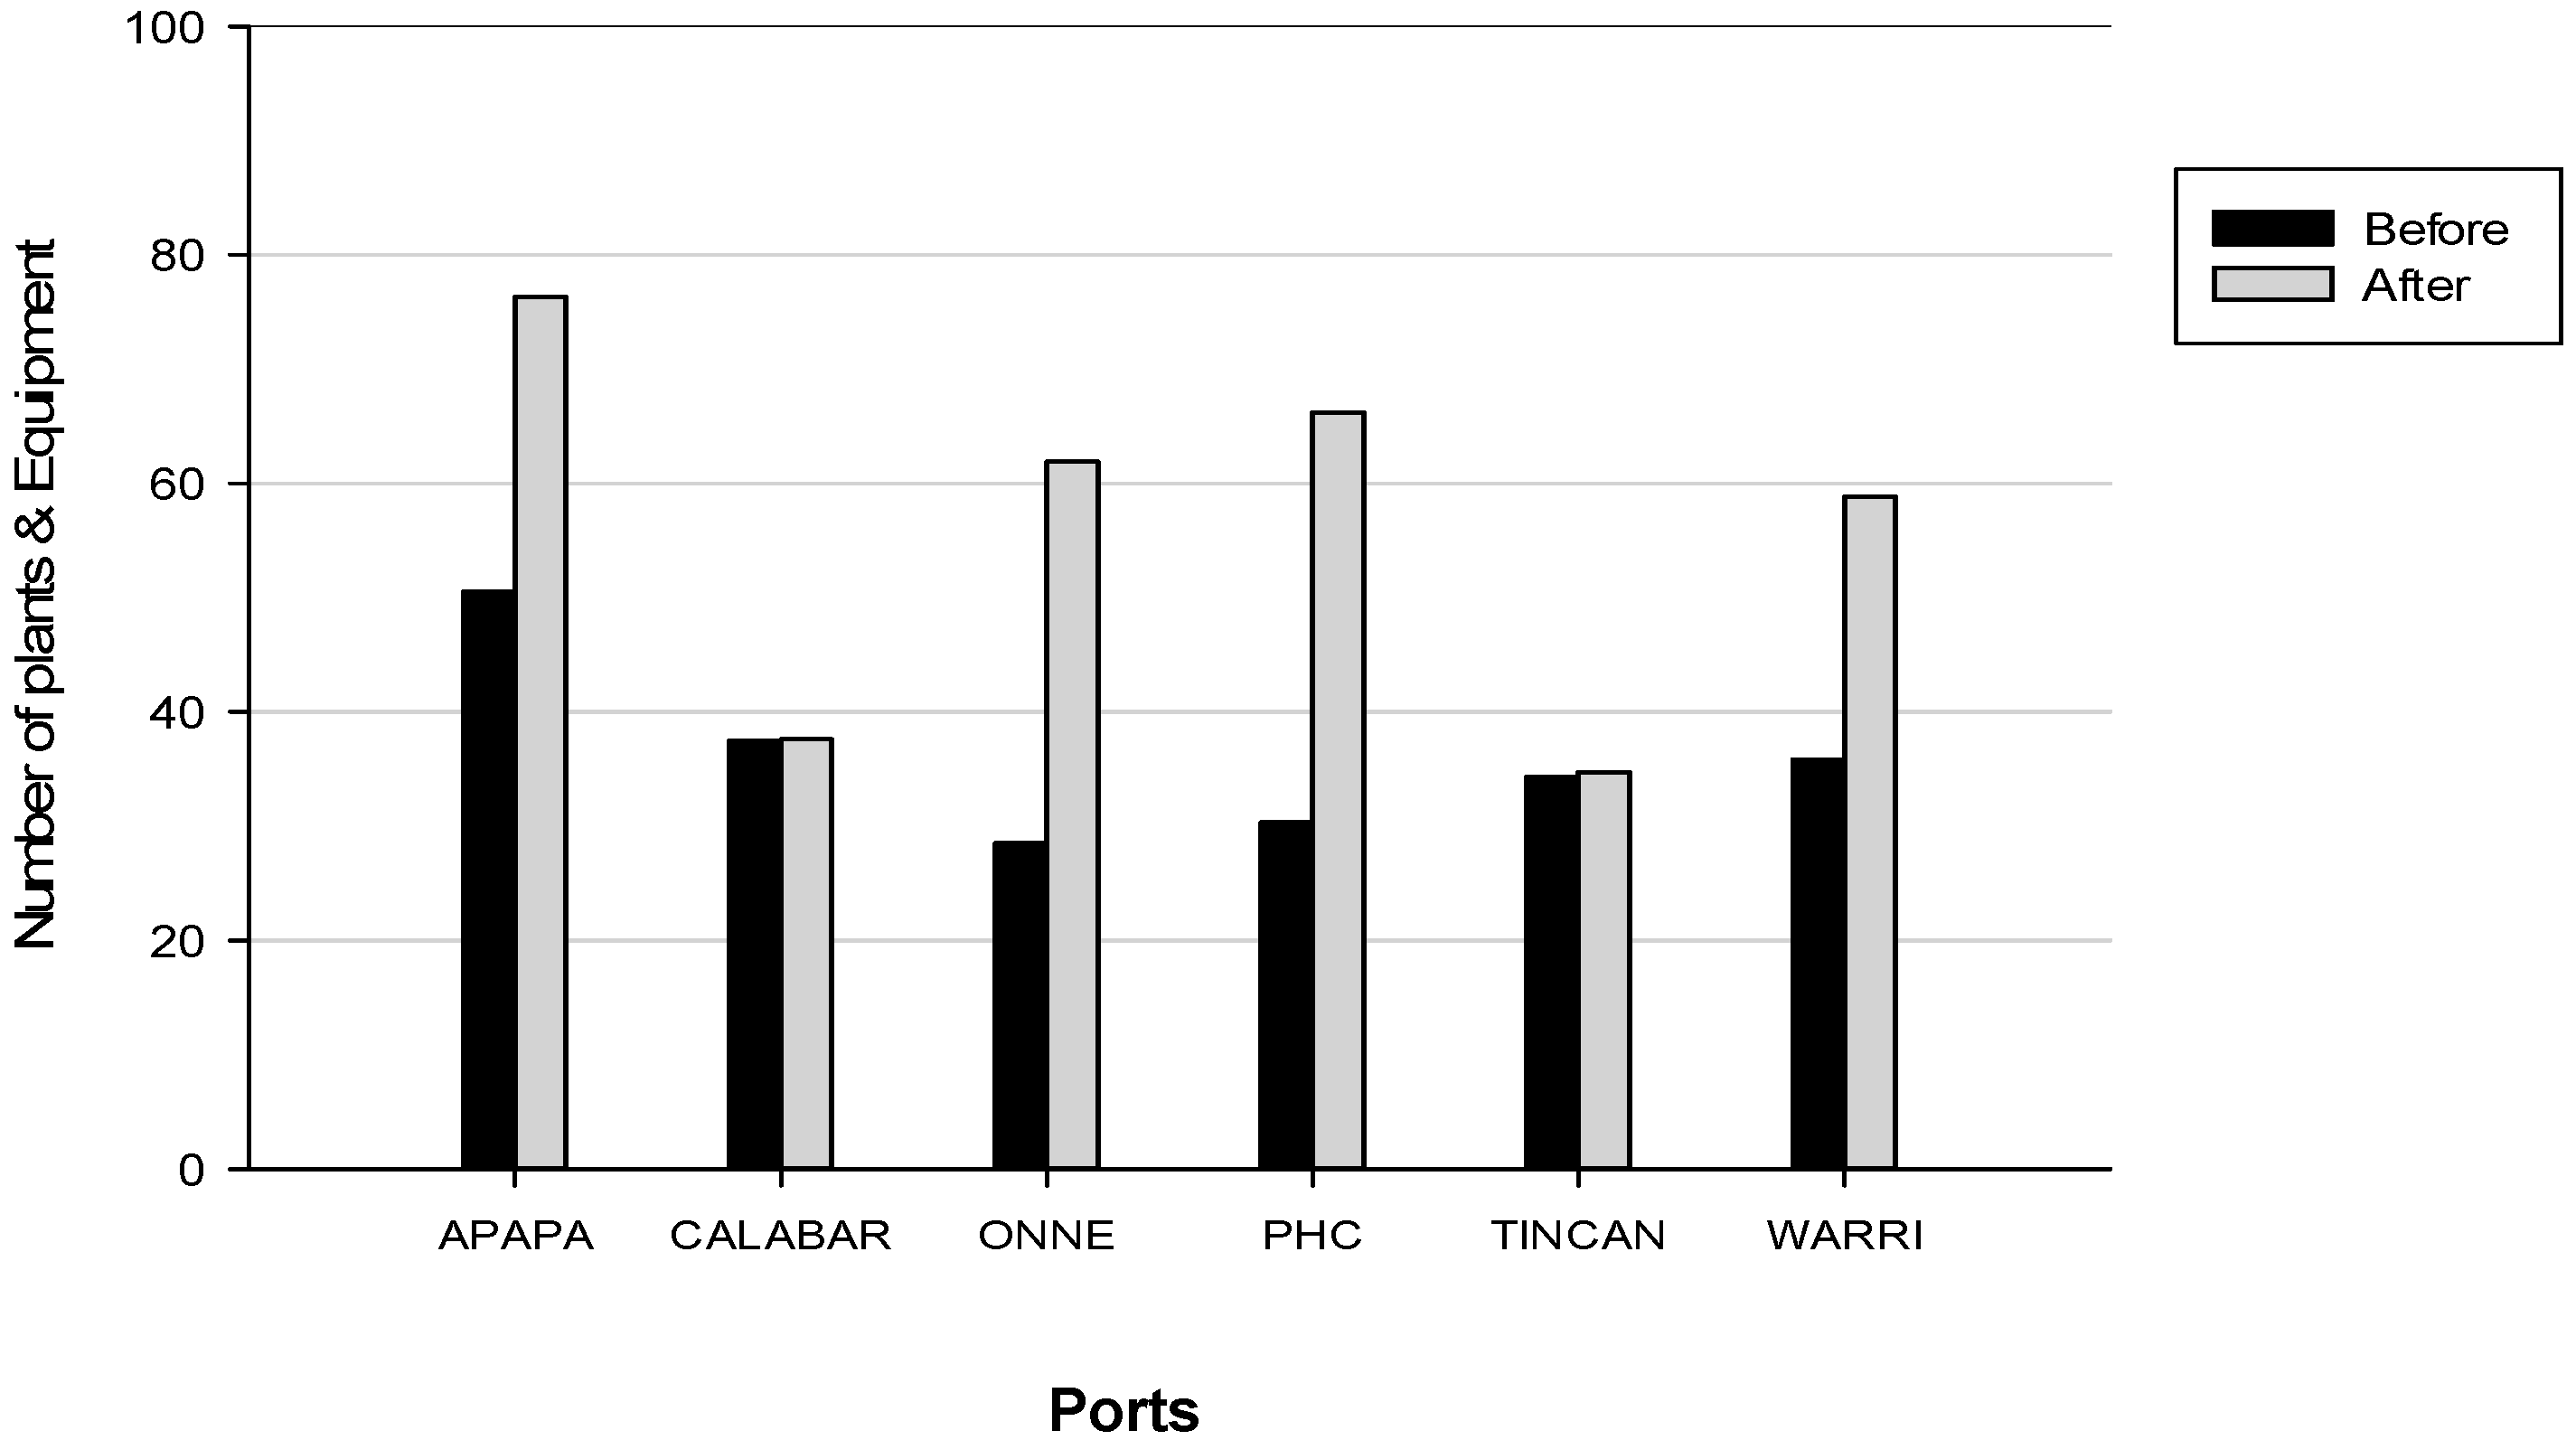
Figure 7.
Average number of vessels in the system (before & after concession).

Figure 8.
Capacity Utilization in Nigeria ports (before and after concession).

Table 1.
Port governance model prototypes. Source: [10].
Table 1.
Port governance model prototypes. Source: [10].
| Type | Infrastructure | Superstructure | Port Labour | Other Functions |
|---|---|---|---|---|
| Public Service Port | Public | Public | Public | Majority Public |
| Tool Port | Public | Public | Private | Public/Private |
| Landlord Port | Public | Private | Private | Public/Private |
| Private Service Port | Private | Private | Private | Majority Public |
Table 2.
Taxonomy of port performance measures. Source: [14].
Table 2.
Taxonomy of port performance measures. Source: [14].
| Classification of Literature | Technique/Methodology | Disadvantages |
|---|---|---|
| Index methods | ||
| • Financial ratios | Financial ratios: NPV, IRR, Gearing ratio, etc. | Financial ratios: Little correlation with the efficient use of resources, focus on short-term profitability, dissimilarity between various port costing and accounting systems, problems with price regulation and access to private equity |
| • Snapshot indicators | Snapshot indicators: Throughput in TEU, total turnround time, service time, cargo dwell time, etc. | Snapshot indicators: Provides an activity measure rather than a performance measure |
| • SFP | SFP: Single output/single input | SFP/PFP: Provides average productivity but does not capture overall productivity. Non-statistical approach |
| • PFP/MFP | PFP: Subset of outputs/subset of inputs | |
| • TFP | TFP: | TFP: Requires estimation of cost, production or distance function (otherwise unable to separate scale effects from efficiency differences). Non-statistical approach |
| • Törnqvist & Fisher (superlative) indexes | ||
| • Malmquist index: Does not require functional form, and can be decomposed into different sources of efficiency | ||
| Frontier analysis | ||
| • Deterministic versus stochastic | • COLS: deterministic/parametric | COLS: Requires functional form and dominated by the position of the frontier firm |
| • Parametric versus non-parametric | • DEA/FDH: deterministic/non-parametric | DEA: Sensitivity to choice of weights attached to input and output variables. No allowance for stochastic factors and measurement errors |
| • SFA: stochastic/parametric | SFA: Requires functional form, specification of exact error terms and probability of their distribution | |
| Process approaches | ||
| • Bottom-up approaches | • Engineering economic analysis (EEA) | EEA: Data intensive, Relies on expert judgement and knowledge of the system |
| • Enterprise modelling (ERP) | BPR/ERP: Expensive to build and maintain | |
| • Benchmarking toolkits | • Process benchmarking (BSC, TQM) | Process benchmarking: Process approach, does not capture operational efficiency component and trends |
| • Expert judgement | • Business process modelling (BPR) | |
| • Perception surveys | • Action research, focus groups, etc. | |
| • Statistical techniques for survey inquiry and hypothesis testing |
Table 3.
Waiting line analysis of Nigeria seaport terminals (2000–2015).
| S/No | Ports | Year | λ | µ | Po | Ls | Lq | Ws | Wq |
|---|---|---|---|---|---|---|---|---|---|
| 1 | APAPA | 2000 | 1.42 | 12.92 | 0.8959 | 0.1099 | 0.0000 | 0.0774 | 0.0000 |
| 2 | APAPA | 2001 | 1.19 | 12.24 | 0.9074 | 0.0972 | 0.0000 | 0.0817 | 0.0000 |
| 3 | APAPA | 2002 | 1.54 | 12.22 | 0.8816 | 0.1260 | 0.0000 | 0.0818 | 0.0000 |
| 4 | APAPA | 2003 | 0.75 | 11.96 | 0.9392 | 0.0627 | 0.0000 | 0.0836 | 0.0000 |
| ‘‘ | ‘‘ | ‘‘ | ‘‘ | ‘‘ | ‘‘ | ‘‘ | ‘‘ | ‘‘ | ‘‘ |
| 16 | APAPA | 2015 | 4.10 | 5.03 | 0.4426 | 0.8151 | 0.0000 | 0.1988 | 0.0000 |
| 17 | CALABAR | 2000 | 0.56 | 2.05 | 0.7610 | 0.2732 | 0.0000 | 0.4878 | 0.0000 |
| 18 | CALABAR | 2001 | 0.08 | 5.64 | 0.9859 | 0.0142 | 0.0000 | 0.1773 | 0.0000 |
| ‘‘ | ‘‘ | ‘‘ | ‘‘ | ‘‘ | ‘‘ | ‘‘ | ‘‘ | ‘‘ | ‘‘ |
| 32 | CALABAR | 2015 | 0.54 | 3.31 | 0.8495 | 0.1631 | 0.0000 | 0.3021 | 0.0000 |
| 33 | ONNE | 2000 | 0.33 | 2.27 | 0.8647 | 0.1454 | 0.0000 | 0.4405 | 0.0000 |
| 34 | ONNE | 2001 | 0.63 | 2.16 | 0.7470 | 0.2917 | 0.0000 | 0.4630 | 0.0000 |
| ‘‘ | ‘‘ | ‘‘ | ‘‘ | ‘‘ | ‘‘ | ‘‘ | ‘‘ | ‘‘ | ‘‘ |
| 47 | ONNE | 2014 | 2.36 | 2.43 | 0.3584 | 1.0261 | 0.0000 | 0.4348 | 0.0000 |
| 48 | ONNE | 2015 | 2.25 | 2.41 | 0.3931 | 1.0261 | 0.0000 | 0.4149 | 0.0000 |
| 49 | PHC | 2000 | 0.56 | 9.34 | 0.9418 | 0.0600 | 0.0000 | 0.1071 | 0.0000 |
| 50 | PHC | 2001 | 0.49 | 9.25 | 0.9484 | 0.0530 | 0.0000 | 0.1081 | 0.0000 |
| ‘‘ | ‘‘ | ‘‘ | ‘‘ | ‘‘ | ‘‘ | ‘‘ | ‘‘ | ‘‘ | ‘‘ |
| 63 | PHC | 2014 | 1.26 | 6.11 | 0.8137 | 0.2062 | 0.0000 | 0.1637 | 0.0000 |
| 64 | PHC | 2015 | 1.22 | 6.12 | 0.8193 | 0.1994 | 0.0000 | 0.1634 | 0.0000 |
| 65 | TINCAN | 2000 | 0.67 | 7.1 | 0.9100 | 0.0944 | 0.0000 | 0.1409 | 0.0000 |
| 66 | TINCAN | 2001 | 0.82 | 9.57 | 0.9179 | 0.0857 | 0.0000 | 0.1045 | 0.0000 |
| ‘‘ | ‘‘ | ‘‘ | ‘‘ | ‘‘ | ‘‘ | ‘‘ | ‘‘ | ‘‘ | ‘‘ |
| 79 | TINCAN | 2014 | 4.41 | 3.88 | 0.3209 | 1.1366 | 0.0000 | 0.2577 | 0.0000 |
| 80 | TINCAN | 2015 | 4.73 | 4.01 | 0.3074 | 1.1796 | 0.0000 | 0.2494 | 0.0000 |
| 81 | WARRI | 2000 | 4.73 | 4.01 | 0.3074 | 1.1796 | 0.0000 | 0.2494 | 0.0000 |
| ‘‘ | ‘‘ | ‘‘ | ‘‘ | ‘‘ | ‘‘ | ‘‘ | ‘‘ | ‘‘ | ‘‘ |
| 95 | WARRI | 2014 | 0.42 | 5.51 | 0.9266 | 0.0762 | 0.0000 | 0.1815 | 0.0000 |
| 96 | WARRI | 2015 | 0.98 | 5.21 | 0.8285 | 0.1881 | 0.0000 | 0.1919 | 0.0000 |
| Source: Author, data analysis using Tora software (version 2, Prentice Hall Inc., Upper Saddle River, NJ, USA) | |||||||||
‘‘ implies continuation of values not shown.
© 2018 by the author. Licensee MDPI, Basel, Switzerland. This article is an open access article distributed under the terms and conditions of the Creative Commons Attribution (CC BY) license (http://creativecommons.org/licenses/by/4.0/).
Share and Cite
MDPI and ACS Style
Onwuegbuchunam, D.E. Assessing Port Governance, Devolution and Terminal Performance in Nigeria. Logistics 2018, 2, 6. https://doi.org/10.3390/logistics2010006
AMA Style
Onwuegbuchunam DE. Assessing Port Governance, Devolution and Terminal Performance in Nigeria. Logistics. 2018; 2(1):6. https://doi.org/10.3390/logistics2010006
Chicago/Turabian StyleOnwuegbuchunam, D. E. 2018. "Assessing Port Governance, Devolution and Terminal Performance in Nigeria" Logistics 2, no. 1: 6. https://doi.org/10.3390/logistics2010006