Unravelling the Complexity of Supply Chain Volatility Management


Chair of Logistics, Technische Universität Berlin, Straße des 17. Juni 135, 10623 Berlin, Germany
Logistics 2018, 2(3), 14; https://doi.org/10.3390/logistics2030014
Submission received: 14 June 2018
/
Revised: 31 July 2018
/
Accepted: 3 August 2018
/
Published: 7 August 2018
Abstract
:Managing supply chain volatility (SCV) is often identified as one of the major challenges of modern supply chain management. While research has predominantly focused on describing the multidimensional areas of SCV and its negative impacts, clear guidelines on how to manage SCV for efficiency, and prioritize the areas on which to focus, are sparse. This study seeks to fill this gap in the research by: (1) assessing the relative impact of SCV sources, and (2) proposing means to deal with them. Based on an Analytical Hierarchy Process conducted with 17 SCM practitioners, the paper assesses the relative impact of sources of SCV, and further contextualizes them according to factors such as product lead time and production strategy, providing more fine-grained insights for SC managers seeking to manage SCV. Subsequently, the paper applies the Nominal Group Technique with the same group of practitioners in order to identify and condense strategies for dealing with the most impactful sources of SCV (intra-organizational misalignment, inaccurate forecasting, long lead times, erratic behavior of decision makers in the supply chain, erratic behavior of customers, and high level of competition), leading to a set of 44 SCV-management strategies.
1. Introduction
Managing global supply chains (SC) is becoming ever more challenging, leading to calls for new concepts to deal with the accompanying turbulence [1,2]. Supply chain volatility (SCV) is one of the most prominent challenges SC managers have to deal with [3]. Because of its practical relevance, researchers have acknowledged volatility as an important area of future supply chain management (SCM) research that remains underrepresented in current research [4].
The severity of volatility affecting SCs manifests itself in the emergence of different SCM practices for dealing with it. Broader management concepts such as SC flexibility [5,6] or SC agility [7,8,9] aim to respond efficiently to volatile changes in upstream or downstream material flows. Even so, Christopher & Holweg [2] argue that existing concepts dealing with volatility are not suitable in periods of emerging turbulence, instead proposing different means to achieve structural flexibility in order to deal with volatility more effectively. In addition, recent advances in heuristic optimization of supply chain coordination have made valuable new approaches available to SC managers who need to improve process efficiency in complex scenarios [10,11].
In general, volatility in SCM is understood as a multidimensional construct that originates not solely from shifts in customer demand, but also from several other sources, such as the growing number of substitute products on the market, short product life-cycles, increasing lead times, governmental regulations, competition, raw material price variations, and others [1,3].
However, practitioners trying to manage SCV efficiently may reasonably question which sources might be most effectively prioritized. With limited resources at hand, practitioners cannot mitigate the impact of them all, and need to know whether to focus on reducing the total lead time in the supply chain, on reducing the number of products offered, or on addressing a completely different source of SCV.
Nitsche & Durach [12] provided a description of the construct by conceptualizing the sources and dimensions of SCV. More specifically, they proposed 20 meta-sources of SCV that belong to five distinct dimensions of SCV. However, managers still need to know how to handle this number of SCV sources efficiently. Consequently, an assessment of the impact of those sources on SCV is a priority.
Taking this into account, the following study seeks to contribute to the assessment of sources of SCV, as well as to provide specific management approaches to guide SC managers in efficiently dealing with the SCV phenomenon. More specifically, it aims at investigating the following research questions (RQs):
- RQ1:
- Which sources of SCV should SC managers prioritize in order to manage SCV efficiently?
- RQ2:
- What management strategies can be implemented to deal with the most impactful sources of SCV?
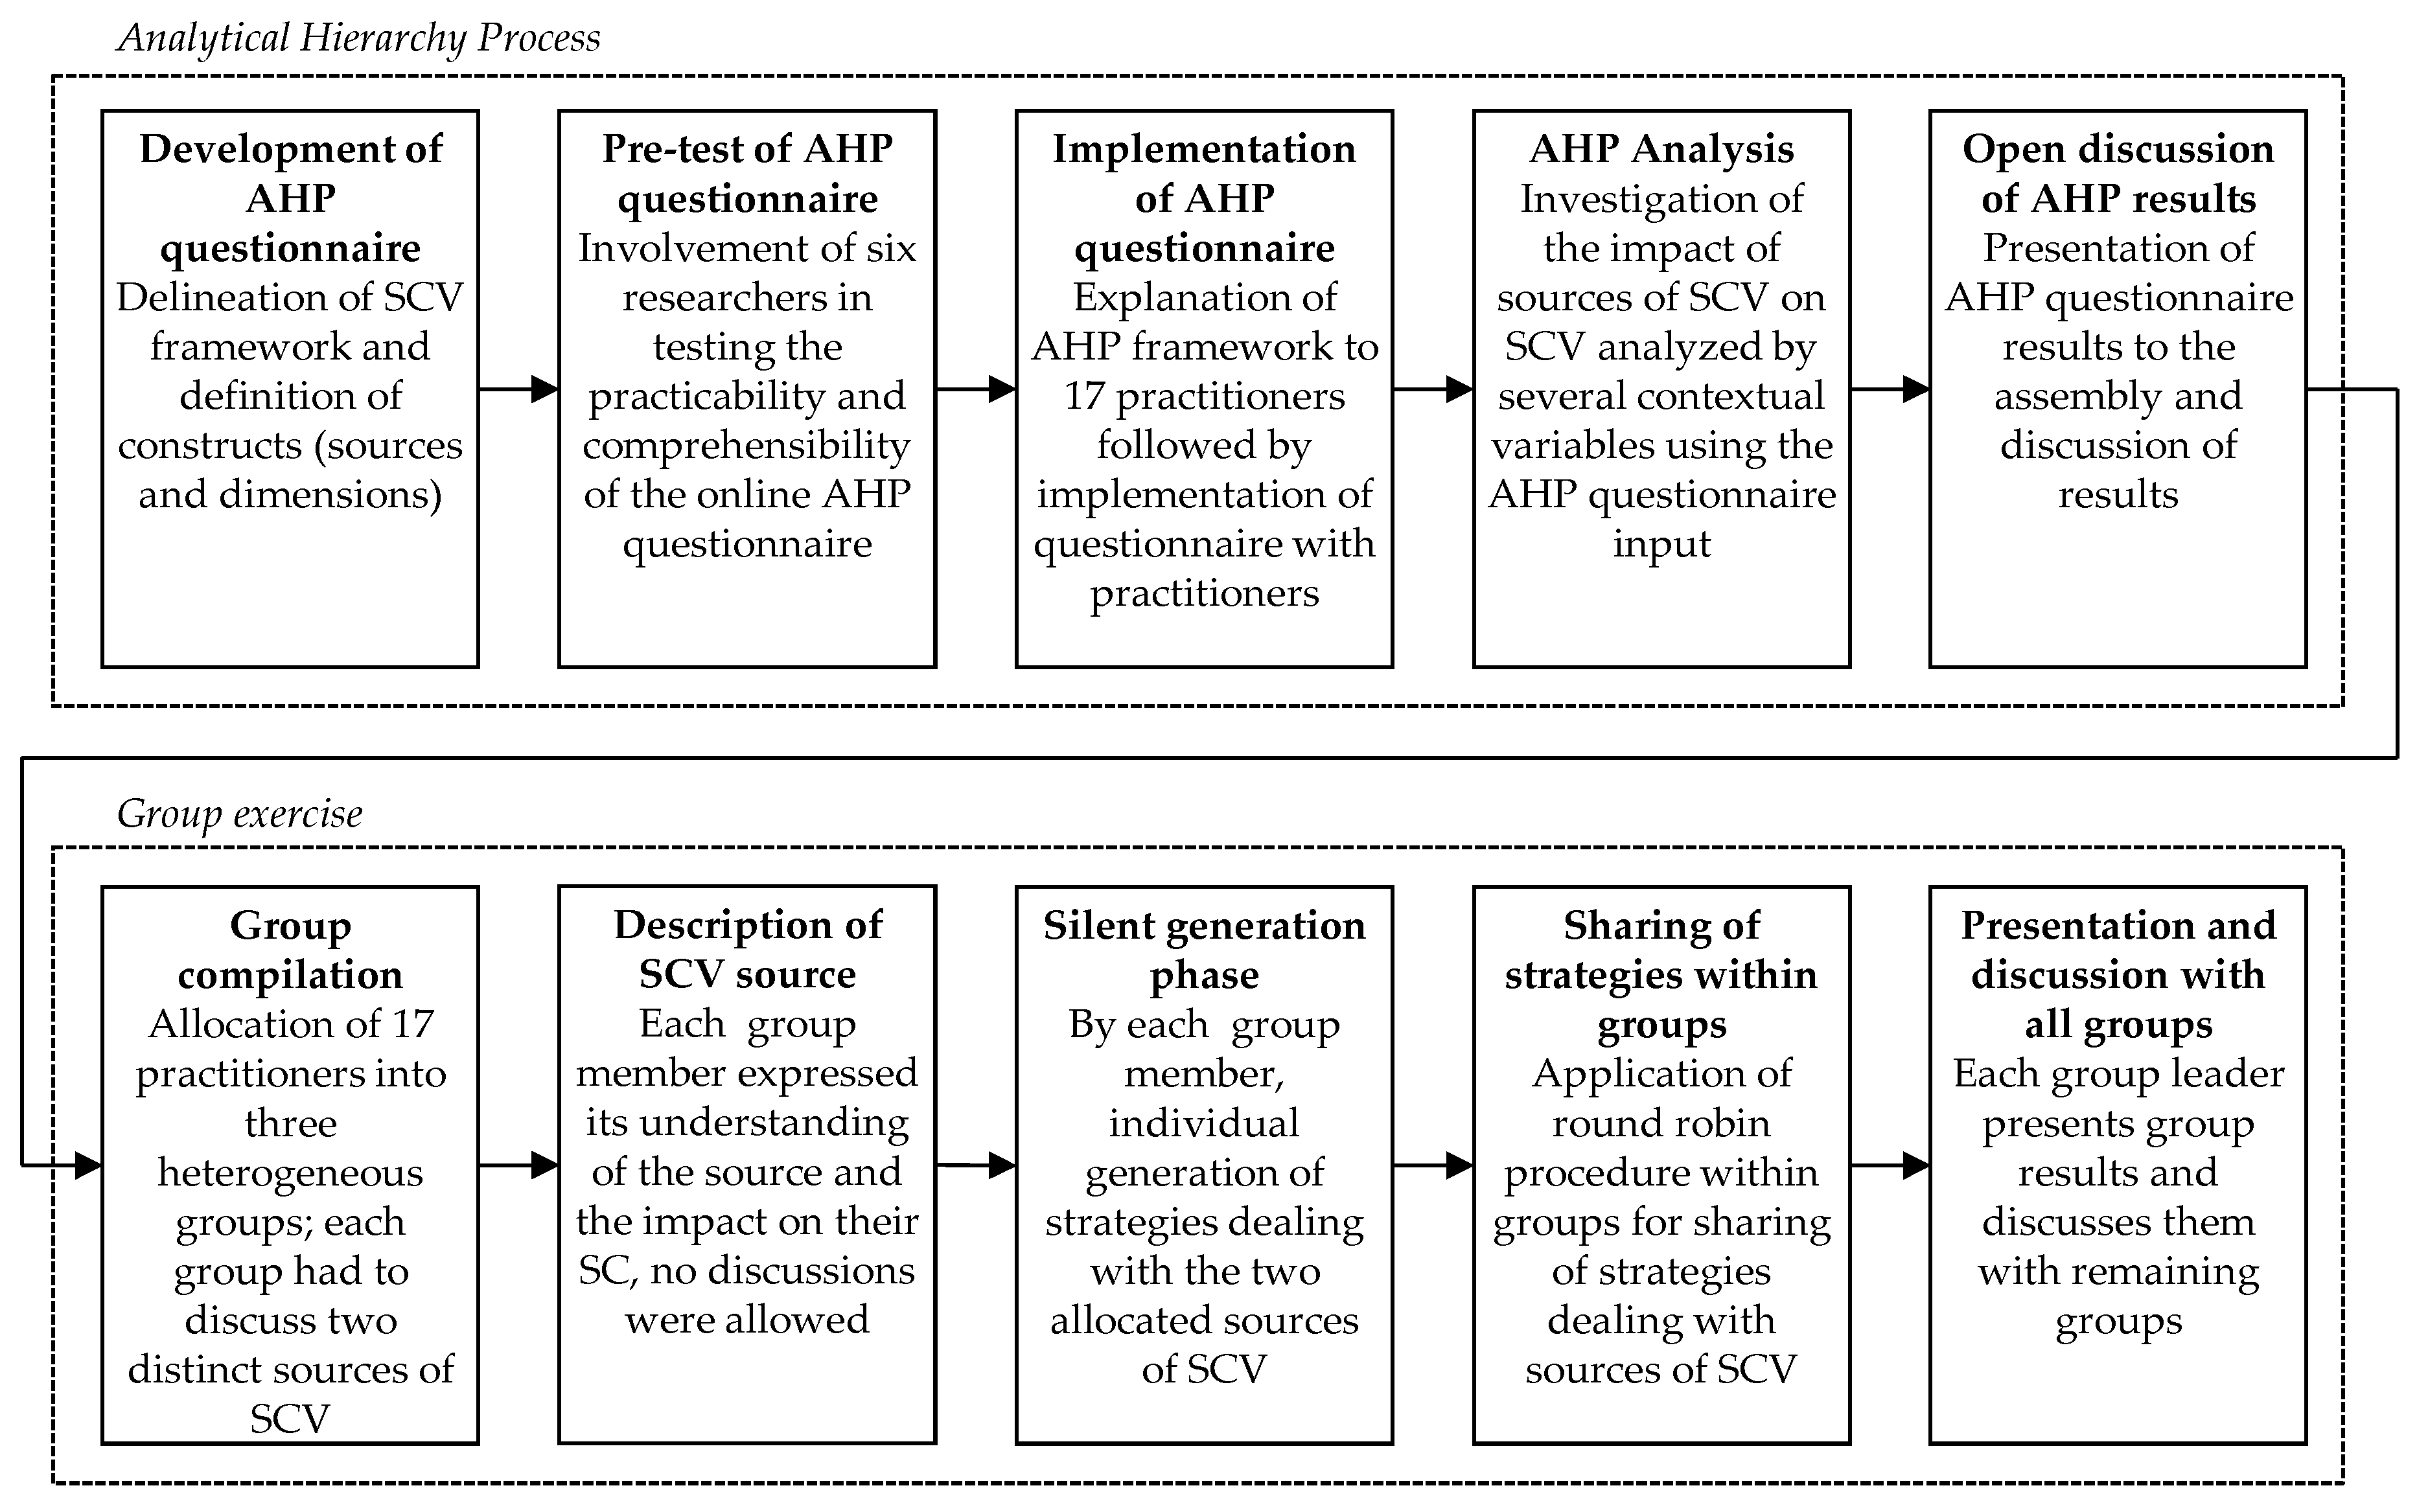
In order to provide an answer to these RQs, the study follows a two-stage research approach. First, with the assistance of a group of 17 SC managers working for manufacturing firms, the study applies the Analytical Hierarchy Process (AHP) to assess identified sources of SCV [13]. The study then analyzes the AHP results in terms of the manufacturers’ production strategies and the total lead times of their products. Second, a group exercise is conducted with the same group of managers, following the Nominal Group Technique (NGT) [14], to synthesize management strategies dealing with the most impactful sources of SCV.
The remainder of the article is structured as follows: Section 2 introduces the framework of SCV sources and dimensions that will form the basis of this research. Section 3 outlines the research design that was deemed appropriate to address the RQs. Section 4 delineates the results, while the Section 5 discusses the results with regard to their implications for practice and research. The paper closes with a summary and a critical assessment of limitations.
2. Theoretical Background and Conceptual Framework of SCV
The term volatility originates from the field of finance, where it is defined as a measure of the uncertainty of stock price movement [15]. This can be measured historically and in terms of implied volatility. Historical volatility is measured via the standard deviation of historic stock prices over a period of time [16], while, in contrast, implied volatility is a calculation that aims to predict the future volatility of stock prices on the market [17]. Since the ground-breaking work by Black & Scholes [17] and Merton [18], the assessment of stock volatility has gained increasing attention in economic research.
In the SCM context, volatility is used to describe the movement of different logistical parameters over a period of time, ranging from unpredictable customer demand changes [19,20], through variable process outputs [21], to uncertain economic developments or market conditions [22,23]. Synthesizing the few existing definitions, this paper defines SCV—from a focal firm point of view—as “the unplanned variation of upstream and downstream material flows resulting in a mismatch of supply and demand at the focal firm” [12].
To dampen volatility in SCs, multiple studies on sources of SCV have been developed. Tracing back the literature on SCV sources inevitably leads to the discovery of the Forrester effect [24]. The Forrester effect describes the increasing variability of orders going upstream in the SC. This phenomenon was later reintroduced as the bullwhip effect (BWE) [25], that emerged as one of the fundamental phenomena in SCM, and kept researchers busy for decades. In this regard, numerous sources of the BWE have been thoroughly investigated. Miragliotta [26] separates research on the sources of the BWE into the System Thinking and the Operations Managers schools. While the first explains the BWE as an irrational reaction of decision makers, focusing mainly on behavioral sources [27,28], the Operations Managers school views it as a rational reaction to single sources, such as order batching, incorrect forecasting, and price fluctuations [25,29].
Although the vast amount of research on sources of the BWE has contributed to an understanding of volatile SCs, it should be noted that the BWE fails to fully explain the occurrence of volatile material flows [30]. A SC regularly faces a number of challenges, such as supply variations [31], variable lead-times [32,33], increasing volatility of global markets [1,2], disruptive events [34,35], and others that cause volatile material flows, leading to a mismatch of supply and demand at the focal firm.
The goal of this study is to assess the relative impact of volatility sources on SCV and to derive suitable management strategies to deal with its most impactful sources. It is therefore necessary to develop a comprehensive framework of volatility sources in order to assess their impact on SCV. Thus, this study is based on the previous research of Nitsche & Durach [12], who proposed a conceptual framework of SCV that outlines the different sources and dimensions of SCV, analyzed from a manufacturer’s perspective. Since this framework is derived from a large-scale systematic literature review combined with practitioners’ insights on the topic, it is considered appropriate as a tool to assist in solving the above-mentioned RQs.
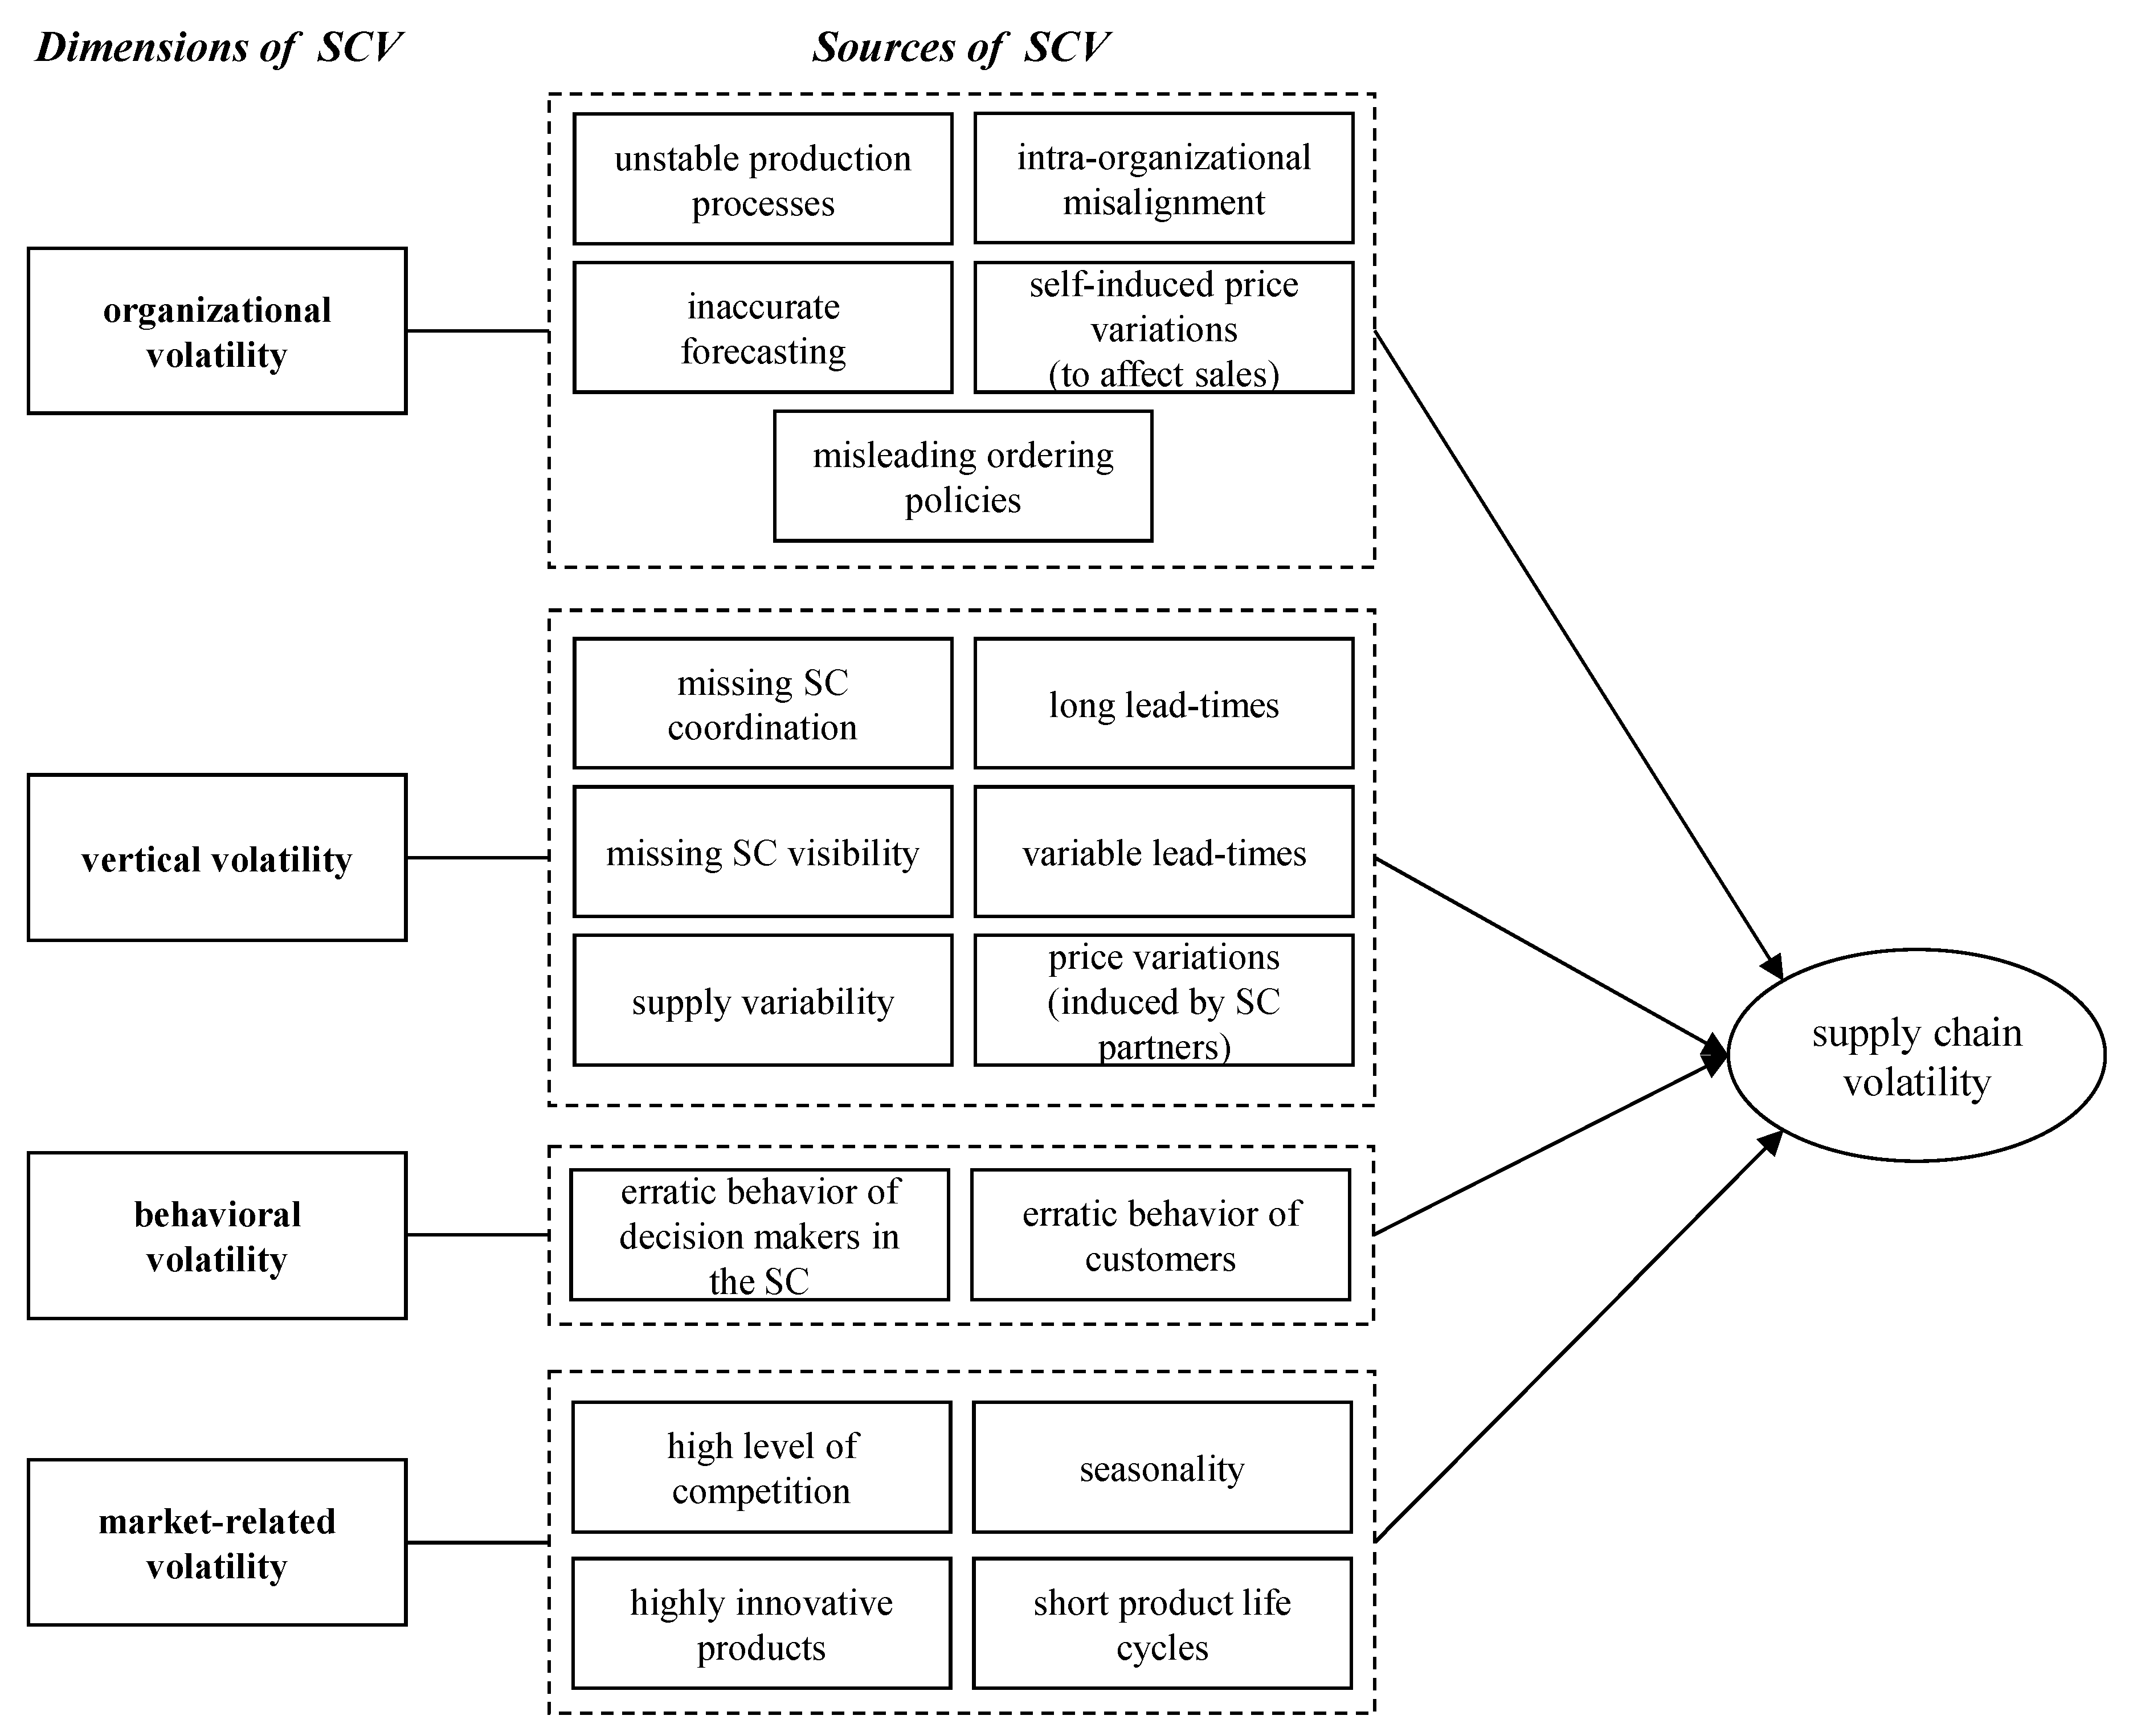
Nitsche & Durach [12] propose 20 meta-sources of SCV that belong to five different dimensions of SCV. These are: (1) organizational volatility, (2) vertical volatility, (3) behavioral volatility, (4) market-related volatility, and (5) institutional and environmental volatility. While organizational volatility is induced by the focal firm itself, vertical volatility arises from sources within the SC. Behavioral volatility originates from behavioral patterns of individuals in the SC (decision makers as well as customers), while market-related volatility is induced by the market in which the product’s SC is located. The fifth dimension includes volatility that is induced by sources that appear exogenous to the SC, such as national economic, financial, political, or legal instability. However, due to the high context-dependency of the fifth dimension, this study uses an adapted version of the framework that focuses only on the first four dimensions. Figure 1 illustrates this adapted SCV framework, while Table 1 provides overview descriptions of all four dimensions of SCV, as well as the 17 sources of SCV. This framework and the descriptions of the variables form the basis for the research procedure, which involved 17 SC practitioners in a moderated workshop setting.
3. Research Design
To address the aforementioned RQs, the researchers conducted a moderated on-site workshop with 17 SC managers, who were invited to discuss the topic of SCV. The workshop followed a two-stage research procedure applying two distinct research methods. In the first stage, designed to investigate which sources of SCV need to be prioritized when trying to manage SCV efficiently (RQ1), the practitioner group was requested to execute an AHP based on the two-tier framework shown in Figure 1 in order to assess the relative impact of SCV sources on SCV. In the second stage, a moderated group exercise was conducted, applying the NGT [14] in order to identify volatility management strategies for dealing with the six most impactful sources of SCV (RQ2).
Figure 2 outlines the overall research procedure applied in this paper.
Since the SCV framework (see Figure 1) outlines sources and dimensions of SCV from a manufacturer’s point of view, the researchers decided to restrict participation in the on-site workshop to SC managers working in manufacturing firms (this particular case is limited to those with a manufacturing site located in Germany). They were employed in logistics, purchasing, or SCM departments, and their average work experience in this field was eight years. Although neither AHP nor NGT prescribes a set minimum sample size, a group size of 15 to 20 people was selected to ensure the feasibility of the moderated workshop setting. The intention was to compile a heterogeneous group of practitioners covering different types of manufacturers, especially covering different production strategies. Table 2 outlines the sample demographics of the workshop participants. The following two subsections will describe the two-stage research approach in detail.
3.1. Analytical Hierarchy Process
The AHP, originally developed by Thomas L. Saaty, is a structured approach to support complex decision-making processes [13]. It assists in deriving weights of factors from a pairwise comparison among them in a hierarchic model. It thereby creates a ranking of factors that are relevant in prioritizing certain factors over others for a decision-making problem. Due to its straightforward nature and formalized applicability to many business processes, making use of techniques such as balanced scorecards, resource allocation problems, benchmarking, and others, the methodology has found wide acceptance in a business context [36].
SCM researchers have applied AHP to solve supplier selection problems [37,38], or to measure performance [39,40]. Other studies have applied AHP to assist in extracting practitioners’ knowledge and perceptions on complex cause and effect relations in SCM problems. Even though, to the best of the author’s knowledge, AHP has not been applied in the context of SCV, researchers have applied it in the area of risk management, a stream of literature with a thematic overlap with the SCV literature [12]. Gaudenzi & Borghesi [41] used an AHP approach to synthesize practitioners’ perceptions of certain risk factors and their effect on various SC goals. Due to AHP’s strengths in extracting experts’ knowledge on a certain topic and the possibility of quantifying and prioritizing the importance of certain factors in a framework, it is considered an appropriate technique to provide answers to RQ1.
This study applied AHP to draw out practitioners’ perceptions of the relative impact of sources of SCV on SCV using the hierarchic framework presented in Figure 1 (1st level of hierarchy: dimensions of SCV; 2nd level of hierarchy: sources of SCV). Although the researcher acknowledges the limitations of this methodology in assessing cause and effect relations (as will be discussed further in the ‘6. Conclusions and Limitations’ section), this is understood as the primary approach to investigate the impacts of sources of SCV and their implications for SCM.
Before performing the AHP with the group of practitioners, an online AHP survey was developed to enable pairwise comparisons between the dimensions of SCV, as well as pairwise comparisons between the sources of SCV within a dimension. This survey also included the description of dimensions and sources of SCV, as outlined in Table 1.
The questionnaire enabled the pairwise comparison of the dimensions of SCV, as well as pairwise comparisons of sources of SCV within their respective dimensions. For pairwise comparisons, each questionnaire participant was required to think of the SC of a product they knew very well, and assess which of the respective sources of the dimensions of SCV had a greater impact on SCV for the SC of that product (e.g., ‘Please state, which of both factors has a bigger impact on supply chain volatility: unstable production processes or intra-organizational misalignment’). This assessment was done on a scale of 1 to 9 in each direction, where 1 indicates equal importance of each source on their respective dimensions, whereas 9 in the direction of one source means that this source has the highest possible directional impact on SCV compared to the other paired source, from the participant’s point of view [42].
After developing the questionnaire, a pre-test of the survey was conducted with six SCM researchers who had not been involved in the research process so far. This group of researchers met at a dedicated on-site meeting, where they were provided with an explanation of the SCV framework and its sources and dimensions, as well as an introduction to the AHP. Subsequently, they were guided step-by-step through the survey, explaining, once again, each source of SCV in its respective dimension.
For the pre-test of the AHP questionnaire, the group result was calculated using the geometric mean, as proposed by Saaty [42]. The consistency ratio (CR) of the AHP group result was calculated at 0.0022, which indicates very good consistency among the answers of individual participants [43]. This also indicates that the description of sources and dimensions of SCV was well understood by the participants in the group exercise. In addition, the pre-test group of researchers was asked for feedback on the accessibility of the questionnaire, as well as the understandability of sources and dimensions. The final questionnaire was compiled incorporating minor amendments based on the feedback received.
For the final study session, the group of 17 SC managers met in a moderated on-site meeting dedicated to the specific topic of managing SCV. They were provided with a definition of SCV, as well as a detailed explanation of the SCV framework, including all dimensions and sources of SCV. Questions were solicited and discussed to generate a common understanding of the SCV framework. Subsequently, the group was asked to fill in the AHP online questionnaire. The moderators of the meeting compiled all answers and analyzed them using a previously prepared template. The analyses were presented to the group, and an open discussion on the results followed. Based on the results, researchers applied the NGT to determine the six most impactful sources of SCV for further investigation in a subsequent group exercise that aimed to identify management strategies for dealing with these sources.
3.2. Nominal Group Technique
After identifying the most impactful sources of SCV, the same group of SC managers participated in a moderated group exercise based on NGT principles [14] in order to derive management strategies for dealing with these sources of SCV. While Delphi group techniques completely eliminate interaction and forbid face-to-face meetings among group members, focus group discussions can induce bias due to strong-willed group members who tend to lead the discussion [44]. The NGT is intermediate between these techniques, allowing on-site meetings of group members, as well as encouraging all group members equally in the idea generation process [45]. The NGT assists in extracting practitioners’ knowledge through a moderated process [46] that has previously demonstrated its advantages in SCM research [47,48].
At the beginning of the group exercise, participants were assigned to three heterogeneous groups of five or six members. Each group had to discuss two out of the six most impactful sources of SCV (intra-organizational misalignment, inaccurate forecasting, long lead times, erratic behavior of customers, erratic behavior of decision makers in the SC, and high level of competition), according to the average AHP result. Before starting the NGT procedure, within the group each group member had to express his/her understanding of the sources the group had to discuss, especially with regard to the impact of these sources on their business.
Initiating the NGT, each group member had time, during a silent generation phase, to individually think of possible management strategies for dealing with one of the sources of SCV. Subsequent to this phase, a process was conducted for sharing strategies within the group, applying a round-robin procedure [49]. Thus, each member of the group had to explain one strategy and its implementation, followed by the explanation of another strategy by the next member, and so on until all strategies had been addressed. The moderators ensured that only questions concerned with comprehension were allowed in this stage, preventing any judgement or discussion. Subsequently, the group synthesized the list of strategies.
The whole process was applied separately for each of the two sources that had to be discussed in each group. After each group completed the generation of strategies, they presented the results to the remaining groups, which also added their ideas on possible strategies, leading to a finalized list of strategies for dealing with six sources of SCV.
4. Results & Discussion
This section outlines the results gathered from the two-stage research approach. First, the relative impact of sources of SCV will be assessed by utilizing the AHP results gathered from the expertise of 17 SC managers. Subsequently, insights into SCV management approaches are given that are derived from a moderated group exercise among the same group of managers.
4.1. Assessing the Impact of Sources of SCV
Before initiating SCV management strategies, SC managers need insights into the effects of SCV sources on SCV. Since the mitigation of all sources of SCV is considered to be challenging, and with heavy cost pressure a reality, management approaches need to tackle the most impactful sources to manage SCV efficiently. To shed light on this area, the AHP aimed to assess the relative impacts of SCV sources to provide managers with a set of guiding principles when they attempt to manage SCV. The overall AHP results are outlined in Table 3. The depicted weights describe the relative impact of the specific source or dimension of SCV on SCV as determined by the workshop participants. For example, it can be seen that, in terms of the group average, 34.1 percent of SCV is generated by the dimension organizational volatility.
The calculation of weights was done by using the geometric mean to combine all participants’ final outcomes with equal weighting, as proposed by Saatyh [42]. In the following discussion, this data will be further analyzed in terms of the total group result, as well as the production strategy and total lead time of the product.
Table 4 provides an overview of the CRs of the AHP analysis. All CRs of the respective dimensions of volatility, as well as the CR among those dimensions, are below 0.1, indicating very high consistency of AHP results [43].
4.1.1. Impact of SCV Sources Analyzed by Group Average
The overall group results (see Table 3) indicate that there are impactful sources of volatility in every dimension of SCV. The dimension of organizational volatility has the largest relative impact on SCV. This is mostly caused by intra-organizational misalignment and inaccurate forecasting. According to the practitioners’ perceptions, within the dimension of vertical volatility, long lead times seem to have the largest relative impact on SCV, while other sources of that dimension such as supply variability do not impact volatility as significantly. Both sources of the behavioral volatility dimension rank among the six most impactful sources of SCV. The dimension of market-related volatility has the lowest impact on SCV compared to the other dimensions. Nevertheless, high level of competition ranks among the six most impactful sources of SCV.
The six most impactful sources of SCV (according to the AHP group result) were discussed further in the group exercise that aimed to develop strategies to deal with them. Before initiating the NGT, participants explained their understanding of these sources, as well as their influence on participants’ businesses (see Figure 2, step Description of SCV source), to create a common understanding. A brief summary of the results of these discussions is given below.
Intra-organizational misalignment: In the group exercise, practitioners expressed that their internal departments do not work closely together, which leads to misalignment. Logistics is not in regular touch with the customer, but is nevertheless responsible for facilitating flexibilities that were discussed between the sales department and the customer. Thus, flexibilities agreed upon between sales and the customer get lost within the organization, or logistics does not have access to information on these (e.g., they were agreed upon via email years ago). Practitioners agreed with the statement of one participant:
Our sales department agrees upon flexibilities with our customers before sealing the contract and without first agreeing with us whether we can handle these flexibilities regarding our capacity. During the contract period, those customers often count on the promises made by the sales department, but we have never known about it until that point, when confronted with the customer.
Additionally, research and development departments plan product changes but do not communicate those changes in a timely fashion; as a consequence, the purchasing department orders too many components that will not be needed in the near future. Previous SCM research also acknowledged the importance of intra-organizational alignment. For example, Wagner et al. [50] state that the adjustment of supply and demand starts with an alignment of all functional departments through a comprehensive sales and operations planning process. This is also supported by others, who propose that companies have to integrate their own company activities before starting to integrate the whole SC [51].
Inaccurate forecasting: Practitioners state that, in general, deviations are acceptable and must be covered by logistics to a certain extent. However, forecasts are considered to be inaccurate whenever deviations exceed certain thresholds that are often are not clearly defined, depending on the individual case. Practitioners also stressed that the main objective of forecasts is to ensure a stable production process, rather than predicting customer demand; this is often misunderstood within the organization. From their point of view, decisions that are made based on forecasts do not necessarily have to be extremely accurate, but after they are made people have to stick with them instead of changing decisions constantly.
Long lead times: The practitioner group responsible for discussing this source mutually agreed that long lead times are challenging in all phases (supply lead time, manufacturing lead time, warehouse lead time, transport lead time, and others) because they decrease plannability, and consequently, induce SCV in an uncertain environment. They also argued that companies try to decrease manufacturing and warehousing lead times, but in a world that is becoming more and more diversified and globalized, supply and transport lead times in particular become longer, with less sign of abatement.
Erratic behavior of decision makers: From the practitioners’ point of view, this was understood as decisions that are perceived as irrational by the recipient of the decision, such as negligent and spontaneous behavior, as well as “gut decisions” that are not comprehensible to others. The decision maker who acts erratically is not necessarily aware of the fact that he/she is seen as acting irrationally from an objective point of view. One practitioner stated an example of erratic behavior of decision makers in his company:
Although we do get forecasts regarding sales and purchasing from our system, there are employees who do not trust these forecasts. As they think they know better, they adjust order quantities or other things on their own authority.
Another example that was expressed indicated that the type of erratic behavior is linked with the personality of the decision maker:
The behavior when ordering is definitely strongly linked to the personality of the buyer. There are people who consistently order less to reduce their stock, which also carries risks. Others order more than necessary, as they are planning with a buffer. This main reason for this is that proposals from the system are often seen just as proposals instead of something you have to stick to.
Such erratic behavior is only visible if it causes problems in the SC. Practitioners explained that, if erratic behavior causes a problem, such erratic behavior is mostly treated as a mistake, instead of being seen as a chance to mitigate a source of process uncertainties in the long run.
Erratic behavior of customers: Practitioners described that the unpredictability of their customers’ demand behavior challenges them on a regular basis, leading to volatility along the SC. In a B2B environment in particular, they argued that their customers regularly change order specifications, mostly quantities, at short notice, leading to unexpected and unplannable expenses at the manufacturing firm. This is underlined by one practitioner who stressed that, according to firm policy, customer wishes have to be realized:
Although we have our customers place their orders three months in advance, this does not prevent them from changing order quantities or even other specifications right before the start of production. We all know that the customer is king, so these wishes are then also realized in most of the cases. The worst thing is that in those cases the customers do not even know what this change request means for our logistics, they do not know that we, for example, have to organize cost-intense short-term air freight. But unfortunately, no one communicates that either.
High level of competition: Group members argued that fierce competition in their respective markets forces them to offer a high number of product variants. This product variety consequently decreases availability at the single part level. Moreover, they also fight for resources such as transport capacity, which is exacerbated during peak seasons (e.g., Chinese New Year). In situations where only one or few competitors exist, the level of competition is even higher, because those competitors fight for production capacity at the same suppliers.
4.1.2. Impact of SCV Sources Analyzed by Length of Lead Time
To analyze the AHP results according to the length of lead time, the practitioner group was split into evenly distributed tertiles. The lead time shown indicates the total lead time of an individual product the questionnaire participant had to think of when filling in the questionnaire. More specifically, the total lead time was described as the total number of days between ordering necessary components at suppliers and delivering the final product to the customer.
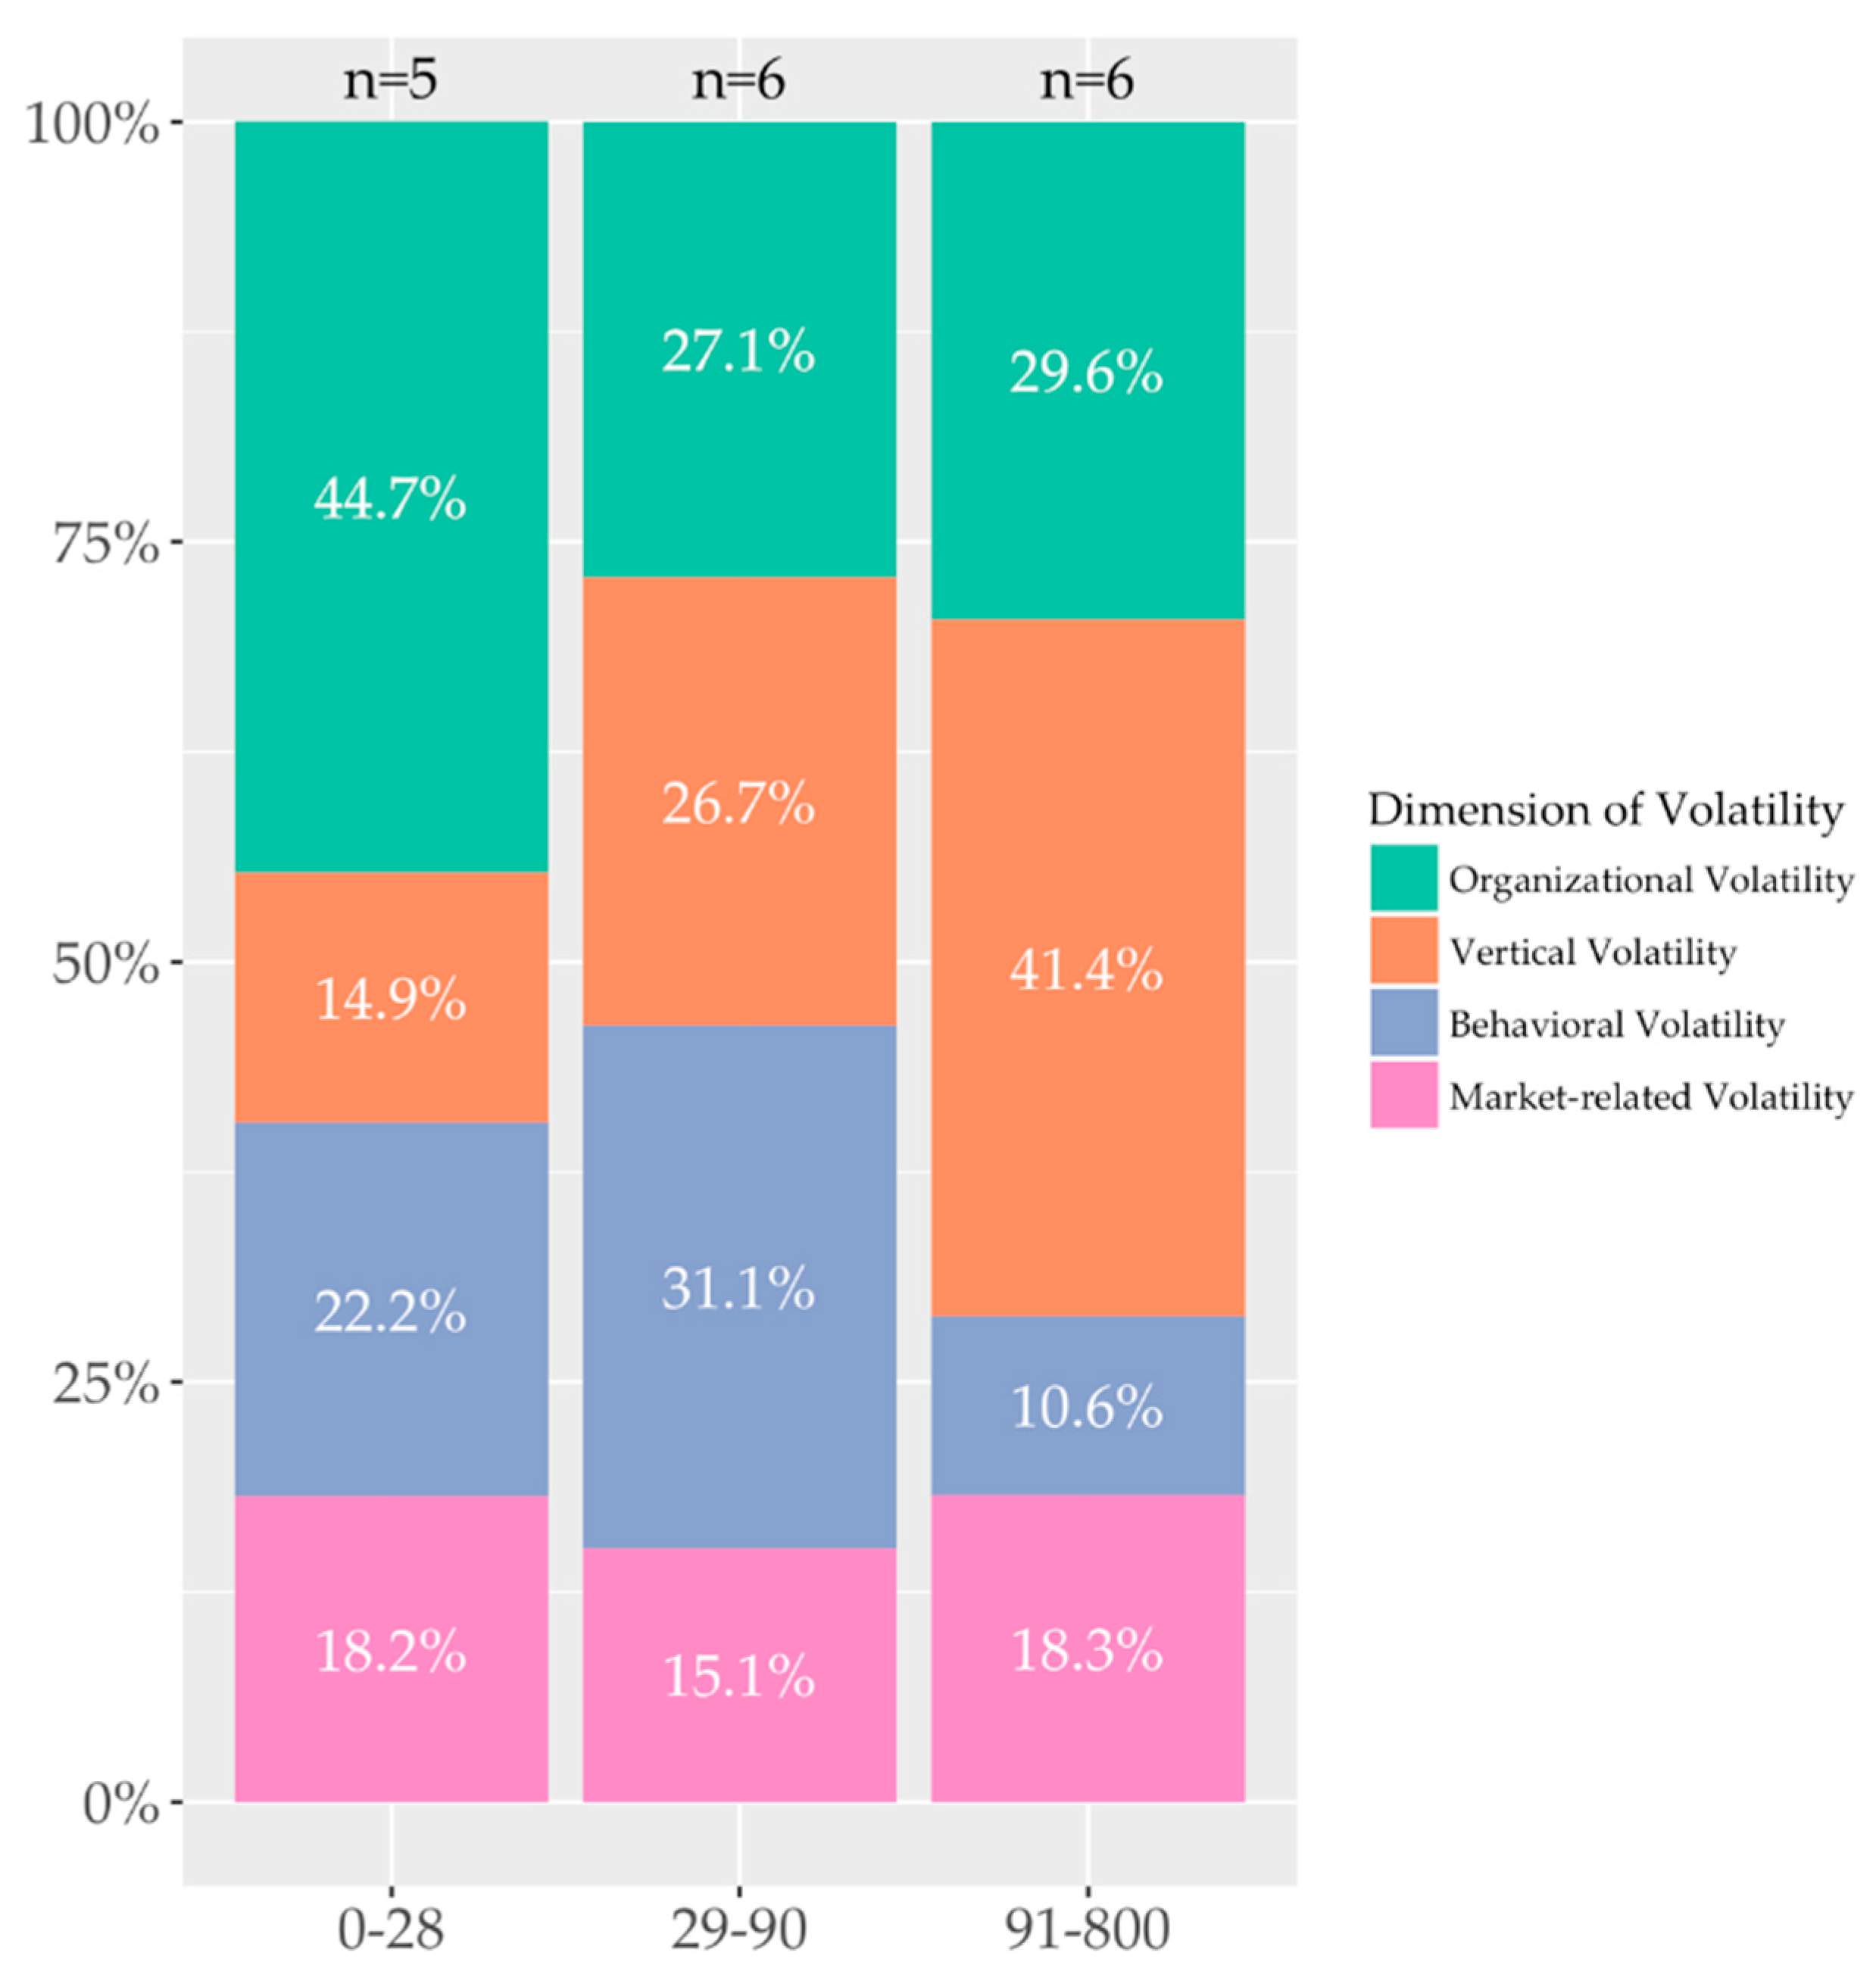
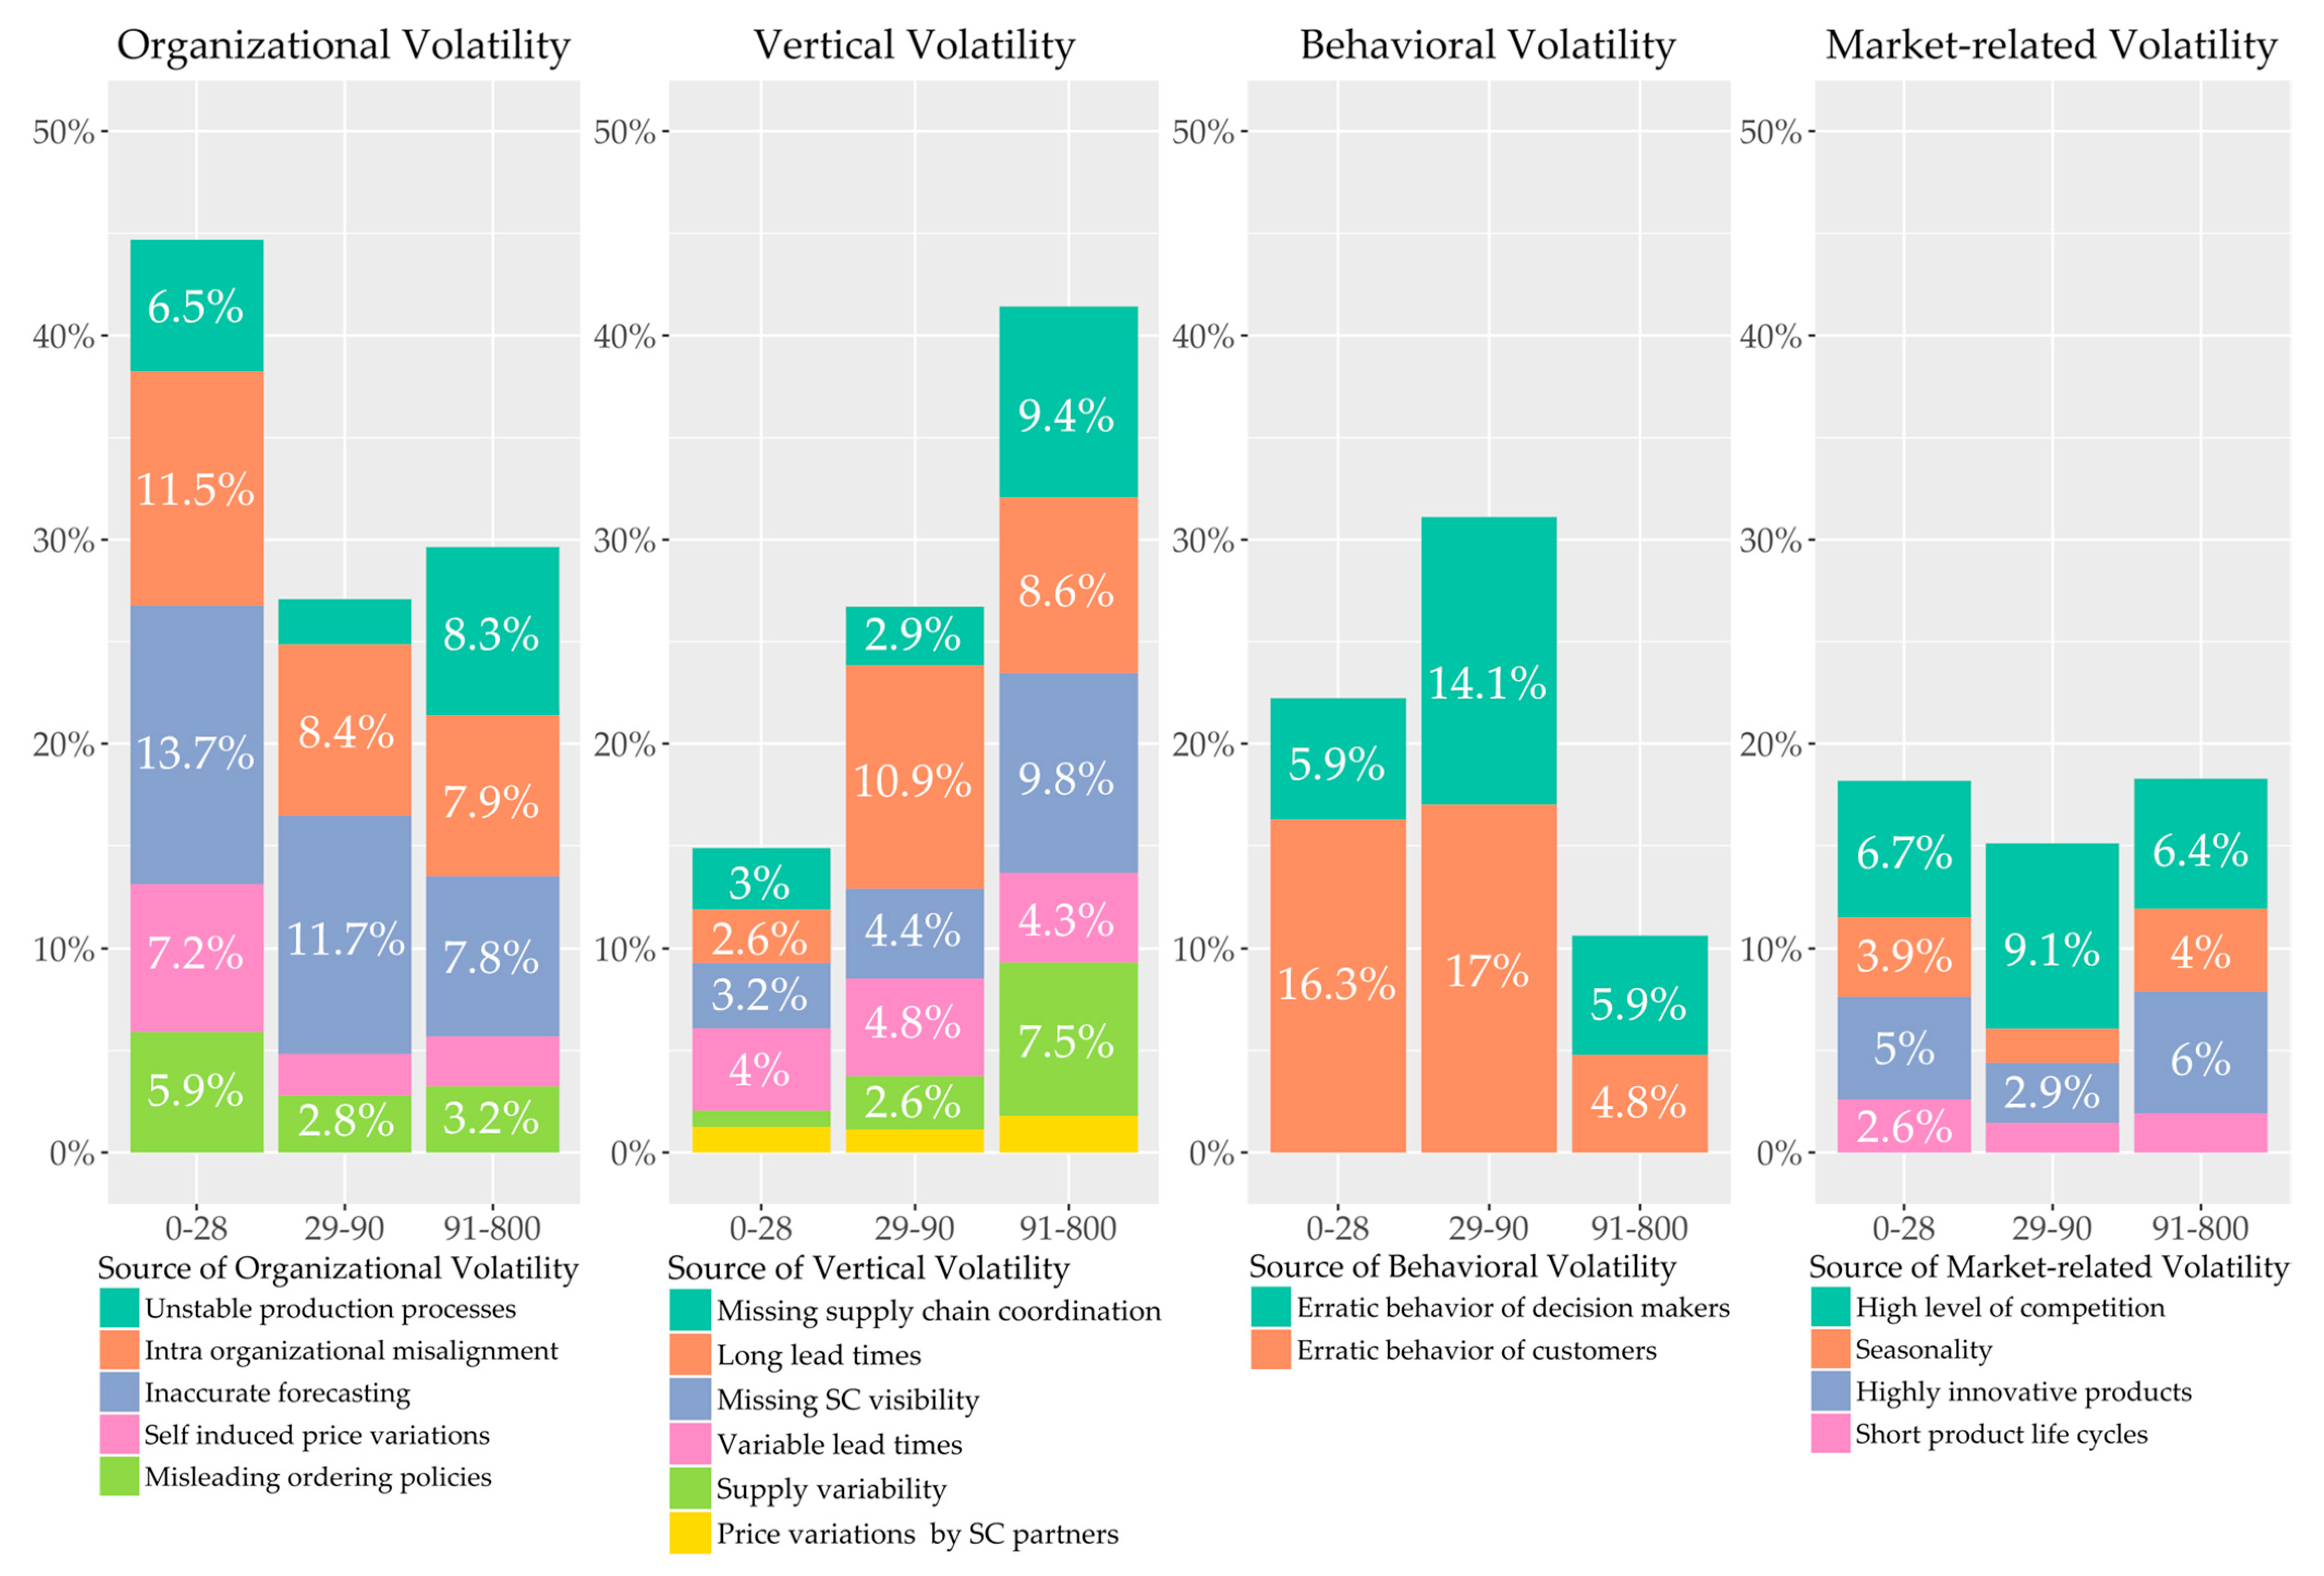
To analyze the relative impact of SCV sources on SCV by the length of lead time, two figures are given to provide a more detailed view on the AHP results. Figure 3 visualizes the assessment on a dimensional level, indicating the relative impact of each dimension of SCV on SCV perceived by the focal firm for each of the three lead time groups shown in three different columns. The percentages shown indicate the relative impact of this dimension of SCV on the volatility perceived at the focal firm (e.g., for total lead times below 28 days, 44.7% of volatility perceived by the focal firm is induced by organizational volatility according to the AHP assessment of the five practitioners in this group). Since AHP assesses the relative importance of a factor, the percentages shown Figure 3 in one column add up to 100% (except for minor rounding errors). Additionally, Figure 4 outlines a more detailed breakdown view of the impact of the individual sources of SCV. Thereby, the relative contribution of each source on the impact of their respective dimension is shown (e.g., in the group of total lead times up to 28 days, 13.7% of SCV perceived by the focal firm is induced by inaccurate forecasting, which thereby is the most impactful source of organizational volatility). To ensure readability, values below 2.5% are not shown in Figure 4, but those values can be found in Table 3.
The analysis of AHP data on the dimensional level (Figure 3) indicates that the relative impact of vertical volatility on SCV, compared to the other dimensions, increases with an increasing lead time. This is supported by previous research that argued that the reduction of lead times supports the management of variability at the supply and/or demand side (here, vertical volatility) and improves SC performance [52]. For products with a relatively short lead time, the vertical dimension seems to have the lowest relative impact on SCV, while the dimension of organizational volatility causes the largest share of SCV, and should receive more attention when managing SCV.
Figure 4 outlines a more detailed view of the relative impact of SCV sources on SCV. As explained previously, the relative impact of vertical volatility increases with increasing lead time. It can be observed that, in particular, the SCV sources supply variability, missing SC coordination, missing SC visibility increase in their relative impact on SCV with an increasing lead time. Especially in light of globalization, where relatively long lead times and complex SCs are often considered as givens, SC coordination and SC visibility become more and more important, but are even harder to achieve [53,54,55,56,57].
The comparatively high ratio of organizational volatility for products with a comparatively short total lead time is, according to the AHP results, mainly caused by a high level of intra-organizational misalignment, as well as inaccurate forecasting. Practitioners involved in the group exercise underlined that, in a situation where the total lead time is comparatively short, customer proximity rises, and the integration of all departments and functions within the company is key to managing SCV efficiently.
4.1.3. Impact of SCV Sources Analyzed by Production Strategy
The group of practitioners involved in the analysis came from different types of manufacturing firms. When filling in the AHP questionnaire, the practitioners were asked to think of one particular product they knew very well that is manufactured by their firm. Dividing the group according to their corresponding production strategies regarding the selected products leads to a reasonably even distribution among the groups: engineer to order (ETO, n = 4); make to order (MTO, n = 7); and make to stock (MTS, n = 6). Analyzing the AHP results for each group led to different results that were discussed with the group.
As in the previous sub-section, two figures will be provided to give a more detailed view on the AHP results.
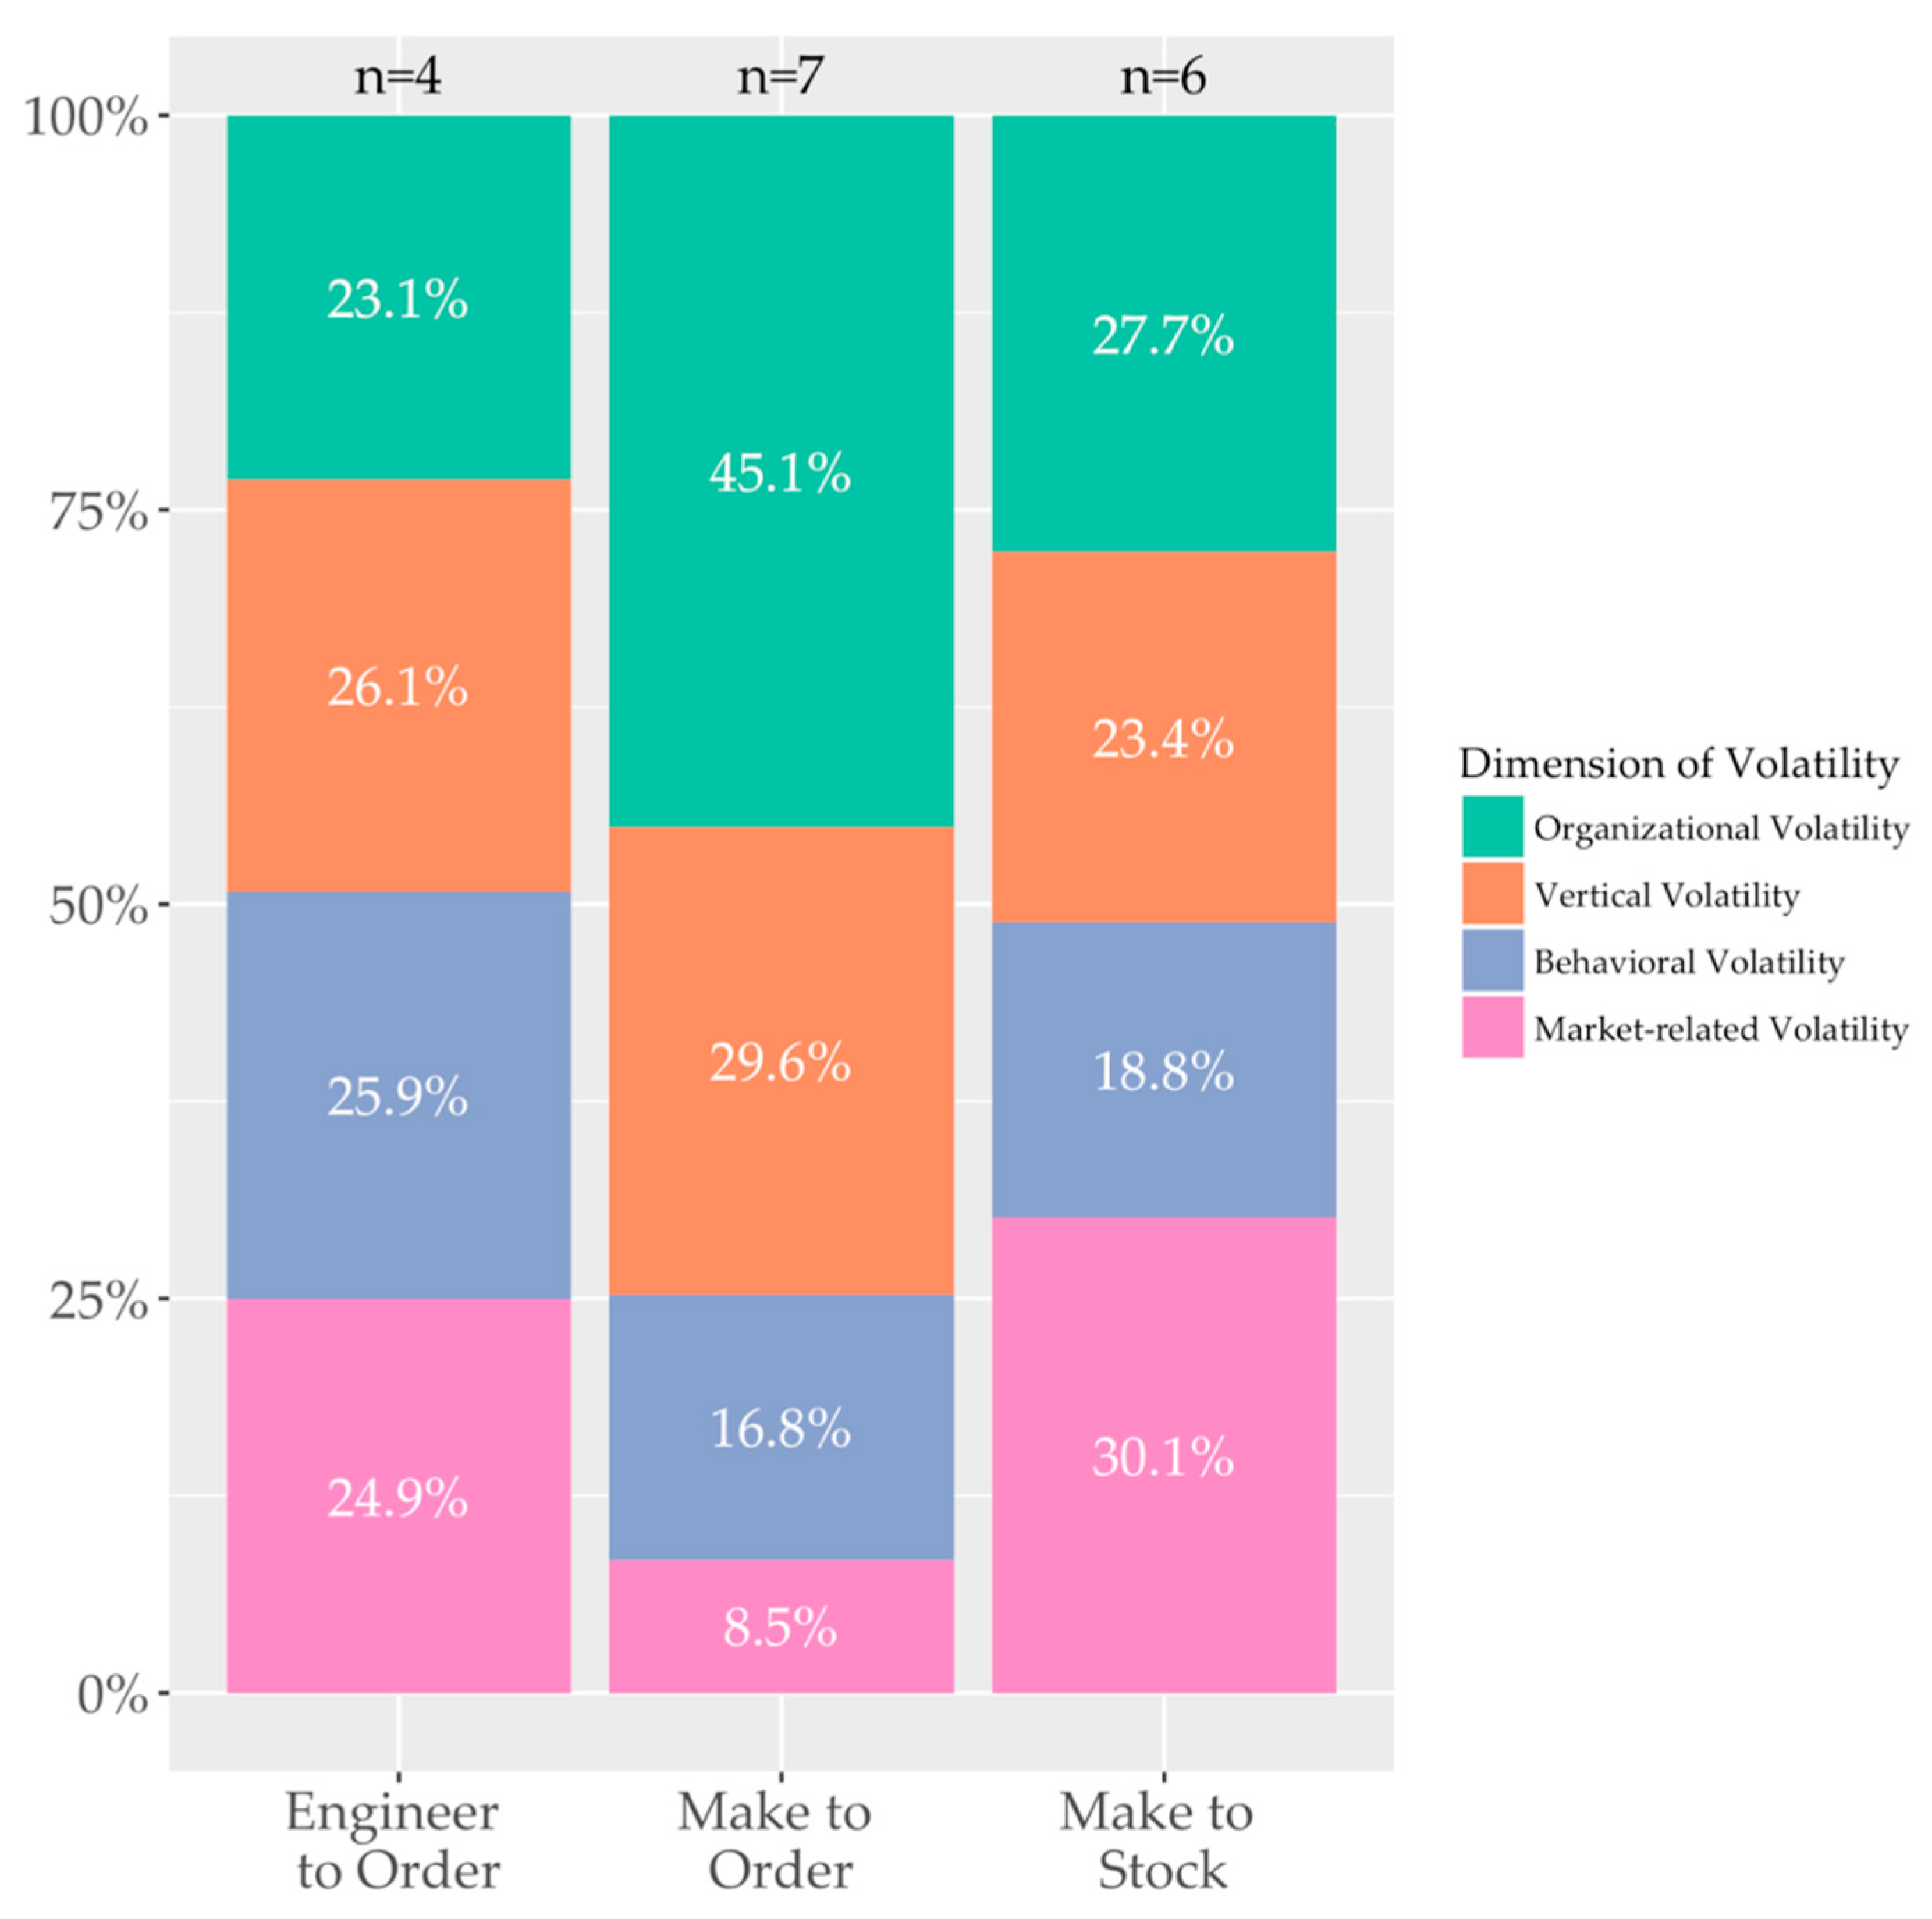
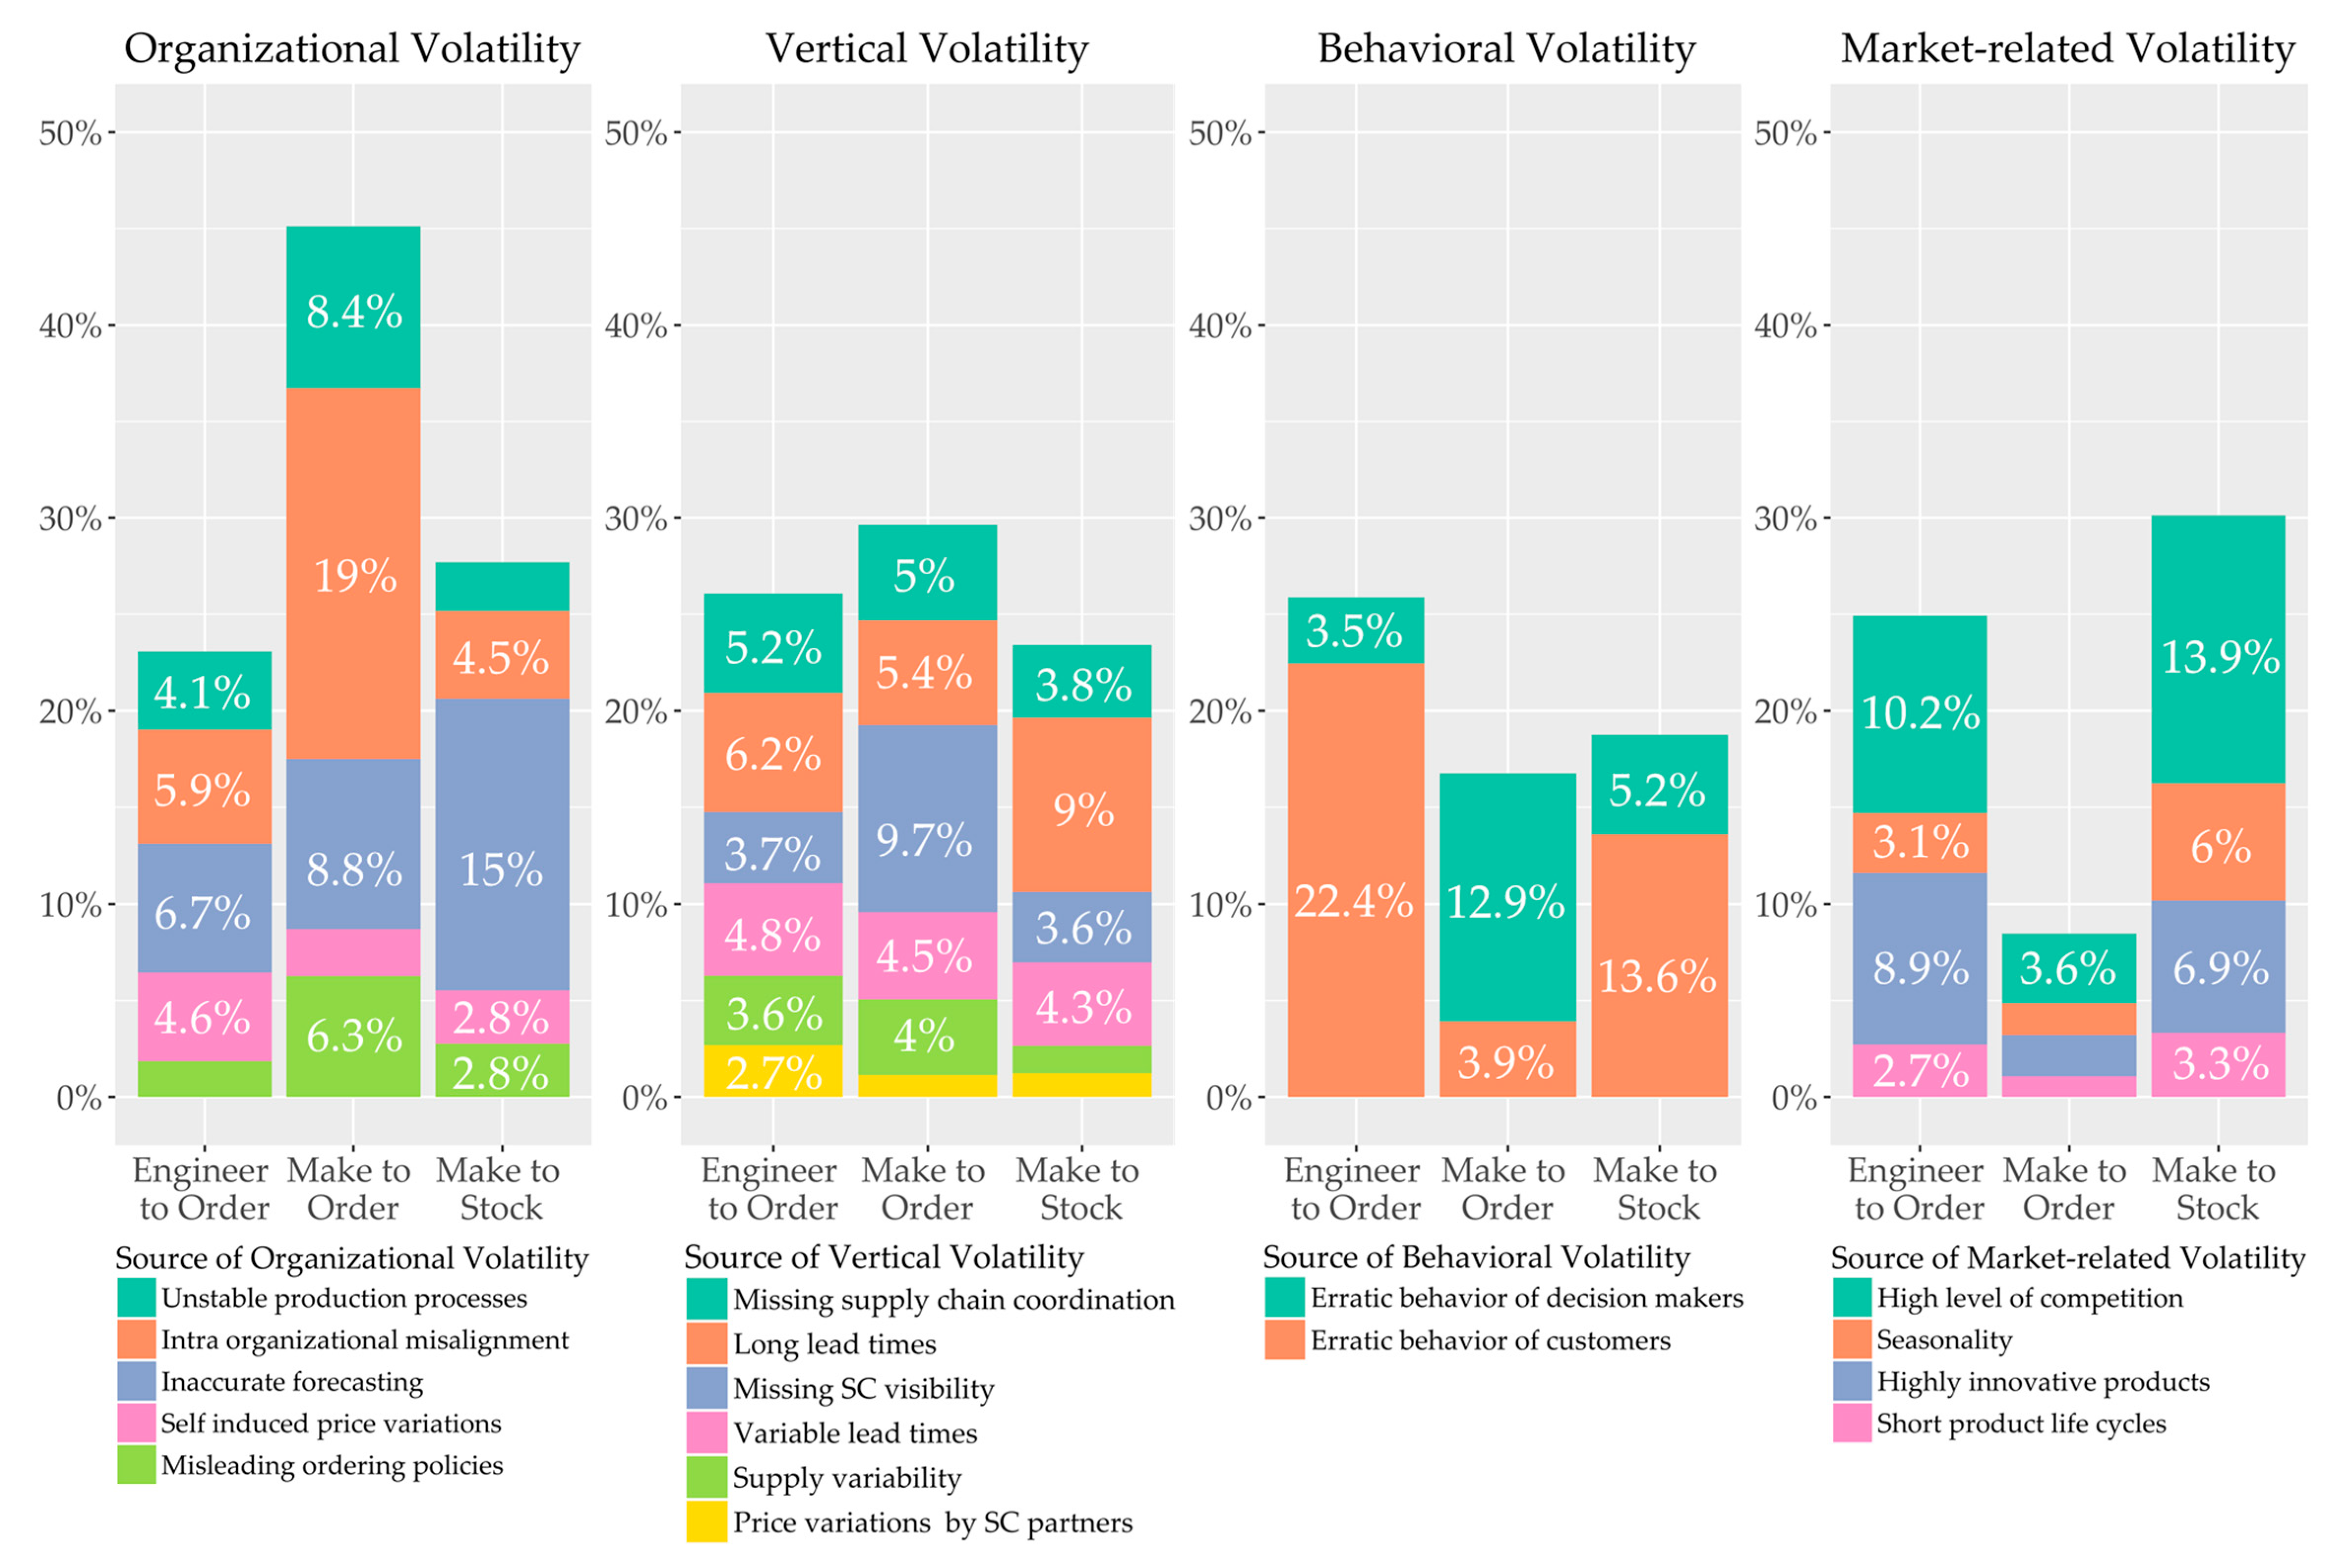
Figure 5 outlines the relative impact of SCV dimensions, while Figure 6 shows the relative impact of the SCV sources in their respective dimensions analyzed by their production strategy. Analyzing the ETO group on a dimensional level (see Figure 5) indicates a comparatively even spread for the relative impact of different dimensions of SCV. However, breaking it down into sources (see Figure 6, in which it can be observed that erratic behavior of customers seems to be by far the most impactful source of SCV for ETO products. At first, this seems counterintuitive, given that companies offering classic ETO products (e.g., cruise liners, gas turbines, or airplanes) experience customer demand mostly years in advance, which does not change drastically. However, the practitioners in this group argued that they receive the customers’ demands very far in advance on a product level, but, during the engineering and manufacturing processes, product specifications often change drastically, leading to high volatility on a component level. This is underlined by the statement of one practitioner, who commented:
We know our customer demand very early in advance since in the business of individualized large-scale machinery lead times can be very long, up to 2 years. Those lead times are roughly the same throughout the industry, including our competitors. The whole thing becomes difficult when certain technical specifications on a single part level change shortly before or in the worst case even after the start of production because the customer’s situation changed. These changes at short notice are the ones that increase our networks volatility. Unfortunately, this is more the norm than the exception.
The second most impactful source for the ETO group is high level of competition. One practitioner of the ETO group stated:
We only have one real competitor. While this might sound great it becomes a problem when it comes to the supplier base, since there are only a few suitable suppliers for castings of this size. Therefore, we compete not only on the demand but also the supply side. Situations arise again and again in which one of us cannot be supplied in time because both of us ordered components at the same supplier at the same time.
Practitioners from the ETO group agreed with this statement, and added that, even in the situation of few competitors, competition is high because they also have the same customers, leading them to intense price competition, which makes the level of competition even fiercer.
For the MTO group, on a dimensional level it can be observed that organizational volatility contributes most to SCV experienced in MTO SCs, while market-related volatility seems to have a much lower relative impact on SCV compared to other production strategies (see Figure 5). Breaking this down on a source level (see Figure 6), it can be observed that intra-organizational misalignment seems to have the largest relative impact on SCV for MTO SCs. Practitioners argued that, especially in MTO scenarios, efficiency of internal coordination is key to success. Compared to ETO products, where the total lead time is relatively long, and MTS products, where internal processes are often clearly defined and highly efficient, MTO products often are partially individual, and according to the practitioner group, internal processes are not as clearly defined.
As stated by a supplier for the automotive industry:
Our basic products are clearly defined but still somewhat customizable as technical specifications, such as coatings and materials, often have to be adapted to the customers’ applications. Unfortunately, we do not have standardized processes [for] how to handle every possible product variant that could be individualized by our customers. So, frankly speaking, we are quite slow when it comes to coordinating between all the involved departments—R&D, production, sales and logistics. As a result, our production processes are not as stable as we would like them to be.
This is underlined by the result that the relative impact of unstable production processes for MTO products is much higher than for ETO and MTS products (see Figure 6). The second most impactful source of SCV is erratic behavior of decision makers. Practitioners stressed that this is mostly because of the argument stated previously: In situations where efficiency and speed are key but product specifications are more vague, decision makers often tend to over- or underestimate signals, leading to SCV.
MTS products are usually characterized by a plan-based ‘push’ production strategy, holding stock of finished goods at the end of the supply chain [58], while manufacturing operations are intended to be highly optimized, applying lean approaches [59]. The results of the analysis of the MTS group support these characteristics; inaccurate forecasting and erratic behavior of customers are the most impactful sources of SCV for MTS products, while unstable production processes, for example, do not seem to impact SCV significantly (see Figure 6). Additionally, a high level of competition is among the most impactful sources of SCV. As described before, a high level of competition is characterized by a very high number of offered product variants at the market, and/or a very high number of competitors. Practitioners particularly stressed that this high number of product variants on the market, combined with a high number of competitors, challenges them in forecasting demand on a product level, leading to high volatility along their SCs. This is underlined by the statement of a SC manager from the confectionary industry:
Taking, for example, the product family chocolate: we offer several hundred variants worldwide, as do our competitors. This huge variety makes forecasting on variant-level nearly impossible. Why? Because we can only take past sales into consideration, but the real customer demand changes much more quickly than we can react to.
4.2. Strategies for Dealing with SCV
After jointly discussing the AHP results, the practitioners split up into three groups. Each group was asked to apply the NGT to identify strategies for dealing with SCV caused by two out of the six most impactful sources. Following the NGT process described in Section 3, the results were presented to the assembly, followed by an open discussion. During this discussion it was proposed to classify the strategies into short-, mid-, and long-term solutions to better guide managers when starting to implement SCV management strategies. Consequently, a total of 44 strategies for dealing with SCV caused by one or more of these sources was compiled (Table 5, Table 6, Table 7, Table 8, Table 9 and Table 10).
To deal with intra-organizational-misalignment (see Table 5), internal transparency is one key to success, starting with transparency of departure and arrival dates of shipments within the organization, instead of leaving these to purchasing alone, followed by a company-wide database on contractual agreements to close the gap between sales and logistics. Additionally, the group argued that internal alignment is only achievable if company and departmental goals are aligned. Instead of creating silo-thinking due to non-aligned departmental goals, shared company goals must be set up.
To decrease volatility created by inaccurate forecasting (see Table 6), companies can expand their databases by implementing data-sharing incentives for customers, in the long-term, to build forecasts that are more sound. The forecast itself should be aligned through the whole organization, avoiding individual departments creating their own forecasts based on their own data. Following this, there should be constant evaluation and adjustment, allowing the process to continually improve by constantly challenging current assumptions made in the forecasting model.
In the short term, the effect of long lead times on SCV (see Table 7) can be mitigated by initiating incentives to the supplier to communicate lead time deviations as early as possible, rather than hiding them until the planned departure date expires. Following this early detection of lead time deviations, clear emergency plans with clear rights and responsibilities have to be defined (e.g., cut-off values for special shipments) to initiate follow-up actions. Moreover, the whole value stream from suppliers through the organization to the customer has to be analyzed and optimized. Practitioners agreed that that processes are often too long and time consuming, because they evolved historically but have not been challenged. Nevertheless, to achieve large lead time reductions, SC redesign actions such as localization, dual sourcing, or increased postponement are necessary.
To mitigate erratic behavior of decision makers in the SC (see Table 8), companies can initiate process reengineering initiatives aiming to implement uninterruptable processes within the company. These must be expanded to include their SC partners, leading to clear, end-to-end processes. To achieve this, a different culture with regard to errors, coupled with organizational learning, can be implemented. Errors are allowed once, but they must be traced back to their roots and eliminated to prevent them from recurring. Therefore, the cultural mindset of an organization often has to be changed to allow open communication of problems and dissemination of the lessons learned.
Erratic behavior of customers (e.g., constantly changing order quantities of already placed orders) can be tackled by introducing customer incentives for not changing orders in the short term (see Table 9). However, the group unanimously agreed that, in a business-to-business context, erratic behavior of customers can often be mitigated by joint communication and discussion of the customer’s demand behavior with the customer. The group stressed that customers are often unaware of their behavior, and change it after understanding its consequences for their supplier.
Practitioners were of the opinion that coping with a high level of competition is challenging, and cannot be addressed by short-term solutions (see Table 10). In general, it is all about achieving and maintaining a competitive advantage, either by a clear focus on cost reduction, or a focus on innovation, to differentiate the manufacturer from its competitors. Therefore, strategic partnerships with competitors can be an option to lower competition and jointly target increased profitability.
5. Implications
This study has sought to advance understanding on the mechanisms that cause SCV by assessing the sources of SCV according to their relative impact, building on an AHP among 17 SCM practitioners. In this way, the study aims to provide SC managers with insights on those SCV sources that should be prioritized when trying to manage SCV efficiently. In addition, building on an NGT group exercise with the same group, strategies are proposed for dealing with the sources of SCV which are identified as most impactful.
For managers, the study provides clear indications of the sources on which they should focus when trying to mitigate SCV. It can be observed that a considerable amount of SCV is generated by the manufacturer itself (organizational volatility). This is noteworthy, taking into account that self-induced volatility seems to be more manageable compared to volatility that is induced by SC partners, or the market in which the manufacturer is operating. Additionally, it appears that, for products with relatively short total lead-times, managers should focus more on mitigating organizational volatility, while managers handling products with comparatively long lead-times should focus on managing the dimension of vertical volatility.
In addition, the study investigated the relative impact of SCV sources according to a product’s production strategy. The results indicate considerable differences between ETO, MTO, and MTS products. While manufacturers operating in an ETO environment should focus more on managing the erratic behavior of customers (e.g., short-term order changes on a regular basis) and a high level of competition, for MTO products, managers should implement strategies aimed at internally aligning the company first, before tackling sources appearing outside the focal firm. In contrast, for MTS products, inaccurate forecasting appears to be the most impactful source of SCV.
To assist managers in coping with SCV, we provide a set of 44 strategies for dealing with the six most impactful sources of SCV (intra-organizational misalignment, inaccurate forecasting, long lead times, erratic behavior of decision makers in the supply chain, erratic behavior of customers, and high level of competition), ranging from short-term solutions that require a comparatively short amount of time to implement, to time- and resource-intensive long-term strategic projects.
Among the identified strategies, a few core concepts and their respective strategies that were repeated by different sources throughout the group exercise stood out. First, transparency in several areas (internal and external) is necessary to initiate efficient actions for dealing with SCV, e.g., transparency about lead-time deviations caused by the supplier; departmental and company goals; contractual agreements with customers; forecasting models used and assumptions made; erratic customer demand behavior; and mistakes that have been made and the lessons that can be learned from them. Second, smart incentive systems can be set up, not only within the company, but also for suppliers and customers, to facilitate transparency. More specifically, certain incentives can trigger suppliers to communicate lead-time deviations well in advance, or for customers to change placed order less frequently; however, the configuration of such incentives remains unclear, and should be investigated further. Third, a continual improvement process should be implemented on a regular basis in several areas to challenge existing structures, such as processes, forecasting models, SC designs, and others. Fourth, to facilitate this improvement process, companies should change their mindset from blaming people for mistakes to a culture of errors, where mistakes are allowed once, but will be discussed openly to mitigate them in the long term.
6. Conclusions and Limitations
By applying an AHP with a group of 17 practitioners of manufacturing firms with an average working experience of eight years, this study has sought to assess the relative impact of sources of SCV on SCV itself. This is further contextualized by analyzing this relative impact of SCV sources according to the total lead time of a product, while at the same time taking into account its production strategy, to guide managers more efficiently. Moreover, by applying the NGT with the same group of practitioners, a total of 44 strategies to deal with the six most impactful sources of SCV have been compiled to provide a set of guiding principles for managers who are aiming to manage SCV.
This is the first study that has sought to assess the relative impact of sources of SCV on SCV. While other studies have mostly stressed the multidimensionality and complexity of volatility in modern SCs [1,2], an assessment of the sources to provide assistance for managers has not previously been provided. However, due to its novelty, the study contains some limitations that need to be pointed out.
First, although it is suitable for an AHP application from a methodological point of view, the sample size of 17 practitioners is comparatively small, especially when it is further contextualized. This is why the results have to be understood as a first attempt at assessing the impact of sources of SCV in order to provide a guiding hand for SC managers. Nevertheless, further large-scale quantitative research is necessary to derive more reliable conclusions, additional insights, and to extend or refine the contextualization that has been made.
Second, AHP results are based on the participants’ perceptions of the SCV sources and their relative impact on their businesses. Relationships that are not directly observable are not easy to detect with this type of approach. In order to investigate underlying mechanisms causing SCV that are not directly observable or completely understood by practitioners, further research is necessary.
Third, the assessment of sources and dimensions of SCV is based on the framework provided by Nitsche & Durach [12]. However, the dimension of institutional and environmental volatility was excluded from the analysis. Further research in this area should take this factor into account, and expand the assessment to all five dimensions to obtain a more holistic picture.
Finally, this study constitutes a call for further research on SCV. Companies are challenged by volatility on a regular basis, but SCM research mostly focuses on managing catastrophic disruption risks, instead of providing guidance for managing the steady state of mismatching demand and supply variations. This study contributes to critical research on SCV, but it only scratches the surface, and SCV assessment requires further quantitative research.
Additionally, the implementation of the proposed SCV management strategies in a specific business environment remains a task for practice that can surely be assisted by further research on particular strategies.
Funding
This research was funded by the Kuehne Foundation, Dorfstr. 80, 8834 Schindellegi, Switzerland.
Acknowledgments
The author would like to thank the Kuehne Foundation for the financial support of this research project.
Conflicts of Interest
The author declares no conflict of interest.
References
- Christopher, M.; Holweg, M. “Supply Chain 2.0”: Managing supply chains in the era of turbulence. Int. J. Phys. Distrib. Logist. Manag. 2011, 41, 63–82. [Google Scholar] [CrossRef]
- Christopher, M.; Holweg, M. Supply chain 2.0 revisited: A framework for managing volatility-induced risk in the supply chain. Int. J. Phys. Distrib. Logist. Manag. 2017, 47, 2–17. [Google Scholar] [CrossRef]
- Handfield, R.B.; Straube, F.; Pfohl, H.-C.; Wieland, A. Trends and Strategies in Logistics and Supply Chain Management: Embracing Global Logistics Complexity to Drive Market Advantage; DVV Media Group: Hamburg, Germany, 2013; ISBN 978-3-87154-481-1. [Google Scholar]
- Wieland, A.; Handfield, R.B.; Durach, C.F. Mapping the landscape of future research themes in supply chain management. J. Bus. Logist. 2016, 37, 205–212. [Google Scholar] [CrossRef]
- Engelhardt-Nowitzki, C. Improving value chain flexibility and adaptability in build-to-order environments. Int. J. Phys. Distrib. Logist. Manag. 2012, 42, 318–337. [Google Scholar] [CrossRef]
- Yi, C.Y.; Ngai, E.W.T.; Moon, K.-L. Supply chain flexibility in an uncertain environment: Exploratory findings from five case studies. Supply Chain Manag. Int. J. 2011, 16, 271–283. [Google Scholar] [CrossRef]
- Gligor, D.M.; Holcomb, M. The road to supply chain agility: An RBV perspective on the role of logistics capabilities. Int. J. Logist. Manag. 2014, 25, 160–179. [Google Scholar] [CrossRef]
- Prater, E.; Biehl, M.; Smith, M.A. International supply chain agility—Tradeoffs between flexibility and uncertainty. Int. J. Oper. Prod. Manag. 2001, 21, 823–839. [Google Scholar] [CrossRef]
- Qrunfleh, S.; Tarafdar, M. Lean and agile supply chain strategies and supply chain responsiveness: The role of strategic supplier partnership and postponement. Supply Chain Manag. Int. J. 2013, 18, 571–582. [Google Scholar] [CrossRef]
- Veres, P.; Bányai, T.; Illés, B. Optimization of in-plant production supply with black hole algorithm. Solid State Phenom. 2017, 261, 503–508. [Google Scholar] [CrossRef]
- Bányai, Á.; Bányai, T.; Illés, B. Optimization of consignment-store-based supply chain with black hole algorithm. Complexity 2017, 2017, 1–12. [Google Scholar] [CrossRef]
- Nitsche, B.; Durach, C.F. Much discussed, little conceptualized: Supply chain volatility. Int. J. Phys. Distrib. Logist. Manag. 2018. [Google Scholar] [CrossRef]
- Saaty, T.L. The Analytic Hierarchy Process: Planning, Priority Setting, Resource Allocation; McGraw-Hill International Book Co.: New York, NY, USA; London, UK, 1980; ISBN 978-0-07-054371-3. [Google Scholar]
- Van de Ven, A.H.; Delbecq, A.L. Nominal versus interacting group processes for committee decision-making effectiveness. Acad. Manag. J. 1971, 14, 203–212. [Google Scholar] [CrossRef]
- Altman, E.I.; Schwartz, R.A. Common stock price volatility measures and patterns. J. Financ. Quant. Anal. 1970, 4, 603–625. [Google Scholar] [CrossRef]
- Pinches, G.E.; Kinney, W.R. The measurement of the volatility of common stock prices. J. Financ. 1971, 26, 119–125. [Google Scholar] [CrossRef]
- Black, F.; Scholes, M. The pricing of options and corporate liabilities. J. Polit. Econ. 1973, 81, 637–654. [Google Scholar] [CrossRef]
- Merton, R.C. Theory of rational option pricing. Bell J. Econ. Manag. Sci. 1973, 4, 141–183. [Google Scholar] [CrossRef]
- Childerhouse, P.; Disney, S.M.; Towill, D.R. On the impact of order volatility in the European automotive sector. Int. J. Prod. Econ. 2008, 114, 2–13. [Google Scholar] [CrossRef] [Green Version]
- Wong, C.Y.; Hvolby, H.-H. Coordinated responsiveness for volatile toy supply chains. Prod. Plan. Control 2007, 18, 407–419. [Google Scholar] [CrossRef]
- Germain, R.; Claycomb, C.; Dröge, C. Supply chain variability, organizational structure, and performance: The moderating effect of demand unpredictability. J. Oper. Manag. 2008, 26, 557–570. [Google Scholar] [CrossRef]
- Bridgman, B. International supply chains and the volatility of trade. Econ. Inq. 2013, 51, 2110–2124. [Google Scholar] [CrossRef]
- Christopher, M.; Lee, H. Mitigating supply chain risk through improved confidence. Int. J. Phys. Distrib. Logist. Manag. 2004, 34, 388–396. [Google Scholar] [CrossRef] [Green Version]
- Forrester, J.W. Industrial dynamics—A major breakthrough for decision makers. Harv. Bus. Rev. 1958, 36, 37–66. [Google Scholar]
- Lee, H.L.; Padmanabhan, V.; Whang, S.J. Information distortion in a supply chain: The bullwhip effect. Manag. Sci. 1997, 43, 546–558. [Google Scholar] [CrossRef]
- Miragliotta, G. Layers and mechanisms: A new taxonomy for the bullwhip effect. Int. J. Prod. Econ. 2006, 104, 365–381. [Google Scholar] [CrossRef]
- Croson, R.; Donohue, K. Behavioral causes of the bullwhip effect and the observed value of inventory information. Manag. Sci. 2006, 52, 323–336. [Google Scholar] [CrossRef]
- Nienhaus, J.; Ziegenbein, A.; Schoensleben, P. How human behaviour amplifies the bullwhip effect. A study based on the beer distribution game online. Prod. Plan. Control 2006, 17, 547–557. [Google Scholar] [CrossRef] [Green Version]
- Barlas, Y.; Gunduz, B. Demand forecasting and sharing strategies to reduce fluctuations and the bullwhip effect in supply chains. J. Oper. Res. Soc. 2011, 62, 458–473. [Google Scholar] [CrossRef]
- Kim, I.; Springer, M. Measuring endogenous supply chain volatility: Beyond the bullwhip effect. Eur. J. Oper. Res. 2008, 189, 172–193. [Google Scholar] [CrossRef]
- Hameri, A.-P.; Palsson, J. Supply chain management in the fishing industry: The case of Iceland. Int. J. Logist. Res. Appl. 2003, 6, 137–149. [Google Scholar] [CrossRef]
- Chaharsooghi, S.K.; Heydari, J. LT variance or LT mean reduction in supply chain management: Which one has a higher impact on SC performance? Int. J. Prod. Econ. 2010, 124, 475–481. [Google Scholar] [CrossRef]
- So, K.C.; Zheng, X. Impact of supplier’s lead time and forecast demand updating on retailer’s order quantity variability in a two-level supply chain. Int. J. Prod. Econ. 2003, 86, 169–179. [Google Scholar] [CrossRef]
- Chopra, S.; Reinhardt, G.; Mohan, U. The importance of decoupling recurrent and disruption risks in a supply chain. Nav. Res. Logist. 2007, 54, 544–555. [Google Scholar] [CrossRef] [Green Version]
- Craighead, C.W.; Blackhurst, J.; Rungtusanatham, M.J.; Handfield, R.B. The severity of supply chain disruptions: Design characteristics and mitigation capabilities. Decis. Sci. 2007, 38, 131–156. [Google Scholar] [CrossRef]
- Bhushan, N.; Rai, K. Strategic Decision Making: Applying the Analytic Hierarchy Process; Springer: London, UK; New York, NY, USA, 2004; ISBN 978-1-85233-864-0. [Google Scholar]
- Ramanathan, R. Supplier selection problem: Integrating DEA with the approaches of total cost of ownership and AHP. Supply Chain Manag. Int. J. 2007, 12, 258–261. [Google Scholar] [CrossRef]
- Shaw, K.; Shankar, R.; Yadav, S.S.; Thakur, L.S. Supplier selection using fuzzy AHP and fuzzy multi-objective linear programming for developing low carbon supply chain. Expert Syst. Appl. 2012, 39, 8182–8192. [Google Scholar] [CrossRef]
- Chan, F.T.S. Performance measurement in a supply chain. Int. J. Adv. Manuf. Technol. 2003, 21, 534–548. [Google Scholar] [CrossRef]
- Sharma, M.K.; Bhagwat, R. An integrated BSC-AHP approach for supply chain management evaluation. Meas. Bus. Excell. 2007, 11, 57–68. [Google Scholar] [CrossRef]
- Gaudenzi, B.; Borghesi, A. Managing risks in the supply chain using the AHP method. Int. J. Logist. Manag. 2006, 17, 114–136. [Google Scholar] [CrossRef]
- Saaty, T.L. Decision making with the analytic hierarchy process. Int. J. Serv. Sci. 2008, 1, 83–98. [Google Scholar] [CrossRef]
- Saaty, T.L. How to make a decision: The analytic hierarchy process. Eur. J. Oper. Res. 1990, 48, 9–26. [Google Scholar] [CrossRef]
- Goodman, C.M. The Delphi technique: A critique. J. Adv. Nurs. 1987, 12, 729–734. [Google Scholar] [CrossRef] [PubMed]
- Green, T.B. An empirical analysis of nominal and interacting groups. Acad. Manag. J. 1975, 18, 63–73. [Google Scholar] [CrossRef]
- Lloyd, S. Applying the nominal group technique to specify the domain of a construct. Qual. Mark. Res. Int. J. 2011, 14, 105–121. [Google Scholar] [CrossRef]
- Durach, C.F.; Glasen, P.C.; Straube, F. Disruption causes and disruption management in supply chains with Chinese suppliers: Managing cultural differences. Int. J. Phys. Distrib. Logist. Manag. 2017, 47, 843–863. [Google Scholar] [CrossRef]
- Schoenherr, T.; Modi, S.B.; Benton, W.C.; Carter, C.R.; Choi, T.Y.; Larson, P.D.; Leenders, M.R.; Mabert, V.A.; Narasimhan, R.; Wagner, S.M. Research opportunities in purchasing and supply management. Int. J. Prod. Res. 2012, 50, 4556–4579. [Google Scholar] [CrossRef] [Green Version]
- Chapple, M.; Murphy, R. The nominal group technique: Extending the evaluation of students’ teaching and learning experiences. Assess. Eval. High. Educ. 1996, 21, 147–160. [Google Scholar] [CrossRef]
- Wagner, S.M.; Ullrich, K.K.R.; Transchel, S. The game plan for aligning the organization. Bus. Horiz. 2014, 57, 189–201. [Google Scholar] [CrossRef]
- Zhao, X.; Huo, B.; Selen, W.; Yeung, J.H.Y. The impact of internal integration and relationship commitment on external integration. J. Oper. Manag. 2011, 29, 17–32. [Google Scholar] [CrossRef]
- De Treville, S.; Shapiro, R.D.; Hameri, A.-P. From supply chain to demand chain: The role of lead time reduction in improving demand chain performance. J. Oper. Manag. 2004, 21, 613–627. [Google Scholar] [CrossRef]
- Kanda, A.; Deshmukh, S.G. Supply chain coordination: Perspectives, empirical studies and research directions. Int. J. Prod. Econ. 2008, 115, 316–335. [Google Scholar] [CrossRef]
- Caridi, M.; Crippa, L.; Perego, A.; Sianesi, A.; Tumino, A. Do virtuality and complexity affect supply chain visibility? Int. J. Prod. Econ. 2010, 127, 372–383. [Google Scholar] [CrossRef]
- Jonsson, P.; Mattsson, S.-A. The value of sharing planning information in supply chains. Int. J. Phys. Distrib. Logist. Manag. 2013, 43, 282–299. [Google Scholar] [CrossRef] [Green Version]
- Wang, E.T.G.; Wei, H.-L. Interorganizational governance value creation: Coordinating for information visibility and flexibility in supply chains. Decis. Sci. 2007, 38, 647–674. [Google Scholar] [CrossRef]
- Williams, B.D.; Roh, J.; Tokar, T.; Swink, M. Leveraging supply chain visibility for responsiveness: The moderating role of internal integration. J. Oper. Manag. 2013, 31, 543–554. [Google Scholar] [CrossRef]
- Kaminsky, P.; Kaya, O. Combined make-to-order/make-to-stock supply chains. IIE Trans. 2009, 41, 103–119. [Google Scholar] [CrossRef] [Green Version]
- Naylor, J.B.; Naim, M.M.; Berry, D. Leagility: Integrating the lean and agile manufacturing paradigms in the total supply chain. Int. J. Prod. Econ. 1999, 62, 107–118. [Google Scholar] [CrossRef] [Green Version]
Figure 1.
Adapted framework of dimensions and sources of SCV.

Figure 2.
Research procedure.

Figure 3.
Impact of SCV dimensions on SCV analyzed by length of lead time (in days).

Figure 4.
Impact of SCV sources on SCV analyzed by length of lead time (in days).

Figure 5.
Impact of SCV dimensions on SCV analyzed by production strategy.

Figure 6.
Impact of SCV sources on SCV analyzed by production strategy.


Table 1.
Description of dimensions and sources of SCV.
| Tier | Variable | Description |
|---|---|---|
| 1st tier—dimensions of SCV | Organizational volatility | Describes that part of SCV that is self-induced by the focal firm. |
| 1st tier—dimensions of SCV | Vertical volatility | Describes that part of SCV that is induced by sources appearing endogenous to the SC. |
| 1st tier—dimensions of SCV | Behavioral volatility | Describes that part of SCV that is induced by behavioral patterns of individuals in the SC. |
| 1st tier—dimensions of SCV | Market-related volatility | Describes that part of SCV that is induced by the market in which the offered product is placed. |
| 2nd tier—sources of SCV | Unstable production processes | Refers to the instability of a production process (e.g., machine breakdowns, inappropriate or volatile production schedules, unstable throughput, capacity constraints). |
| 2nd tier—sources of SCV | Misleading ordering policies | Described as ordering policies that distort actual demand (e.g., order more than you need due to very high MOQs or cost saving targets). |
| 2nd tier—sources of SCV | Intra-organizational misalignment | Plans and actions of different departments within the own organization are not well coordinated (e.g., conflicting goals, competition among different value streams, misaligned organizational plans such as forecasts). |
| 2nd tier—sources of SCV | Inaccurate forecasting | Customer demand forecast does not meet the actual demand and has to be changed constantly. |
| 2nd tier—sources of SCV | Self-induced price variations | Prices are changed by the focal firm itself to influence the customer demand (e.g., promotions). |
| 2nd tier—sources of SCV | Supply variability | Refers to deviations from planned supply (incorrect amount or quality) caused by suppliers (e.g., quality problems, capacity problems, or others caused by suppliers). |
| 2nd tier—sources of SCV | Missing SC coordination | Decisions along the SC are not taken jointly between SC partners (e.g., due to lack of synchronization and weak relationships among SC partners). |
| 2nd tier—sources of SCV | Long lead times | The total amount of days between ordering a component from a supplier and delivering a final product to a customer is very high. |
| 2nd tier—sources of SCV | Price variations induced by SC partners | Prices are changed constantly by SC partners to influence supply and demand on their side. |
| 2nd tier—sources of SCV | Missing SC visibility | Refers to poor availability of data along the SC (e.g., no sharing of actual point of sale demand data). |
| 2nd tier—sources of SCV | Variable lead times | There is an expected lead time that is used to plan supply and demand, but the lead time actually realized varies considerably. |
| 2nd tier—sources of SCV | Erratic behavior of decision makers in the SC | Refers to the degree to which decision makers react irrationally and unpredictably to certain events (e.g., over- or underestimation of demand or supply signals, strategic interactions among SC partners, or a lack of consideration of already placed orders). |
| 2nd tier—sources of SCV | Erratic behavior of customers | Customer demand behavior is very uncertain and hard to predict (e.g., due to short-term order changes). |
| 2nd tier—sources of SCV | Short product life cycles | The period between the beginning and end of life of a product is comparatively short. |
| 2nd tier—sources of SCV | High level of competition | Characterized by a very high number of product variants offered on the market and/or a very high number of competitors. |
| 2nd tier—sources of SCV | Seasonality | The customer demand varies during the year, but this variation is relatively predictable. |
| 2nd tier—sources of SCV | Highly innovative products | Characterized by a poor availability of data along the SC (e.g., no sharing of actual point of sale demand data) |
Table 2.
Sample demographics of participants in on-site workshop.
| Industry Type | Annual Turnover | Total Number of Employees | Production Strategy | Participants’ Management Level | Participants’ Department | Years of Experience |
|---|---|---|---|---|---|---|
| Automotive | >5 bn € | >5000 | MTO | Department manager | SCM | 5 |
| Automotive | >5 bn € | >5000 | MTO | General manager | SCM | 9 |
| Automotive | >5 bn € | >5000 | MTO | Department manager | SCM | 4 |
| Chemicals | >5 bn € | >5000 | MTS | Team member | Purchasing | 3 |
| Chemicals | >5 bn € | >5000 | MTS | Department manager | Logistics | 3 |
| Consumer Goods | 1 bn €–5 bn € | >5000 | MTS | Team member | Logistics | 2 |
| Electronics | 500 m €–1 bn € | >5000 | MTS | Team leader | Logistics | 5 |
| Electronics | 1 bn €–5 bn € | >5000 | ETO | General manager | Logistics & SCM | 20 |
| Electronics | 1 bn €–5 bn € | >5000 | ETO | Team member | SCM | 2 |
| Electronics | 1 bn €–5 bn € | >5000 | MTO | Department manager | Logistics | 25 |
| Electronics | >5 bn € | >5000 | MTS | Team member | SCM | 7 |
| Electronics | 10–50 m € | 51–250 | MTO | Department manager | SCM | 15 |
| Equipment/ Machinery | 500 m €–1 bn € | 501–2000 | MTO | Team member | SCM | 9 |
| Equipment/ Machinery | 100–250 m € | 501–2000 | ETO | General manager | Purchasing | 19 |
| Equipment/ Machinery | 250–500 m € | >5000 | ETO | Team leader | Purchasing | 5 |
| Equipment/ Machinery | >5 bn € | >5000 | MTO | Team member | Logistics | 3 |
| Equipment/ Machinery | >5 bn € | >5000 | MTO | Team leader | SCM | 5 |
Table 3.
Overview of AHP results.
| Source/Dimension of SCV | Group Average (n = 17) | by Production Strategy | by Total Lead Time (in Days) | ||||
|---|---|---|---|---|---|---|---|
| ETO n = 4 | MTO n = 7 | MTS n = 6 | 0–28 n = 5 | 29–90 n = 6 | 91–800 n = 6 | ||
| Unstable production process | 5.2% | 4.1% | 8.4% | 2.6% | 6.5% | 2.2% | 8.3% |
| Misleading ordering policies | 4.0% | 1.8% | 6.3% | 2.8% | 5.9% | 2.8% | 3.2% |
| Intra-organizational misalignment | 10.0% | 5.9% | 19.2% | 4.5% | 11.5% | 8.4% | 7.9% |
| Inaccurate forecasting | 11.5% | 6.7% | 8.8% | 15.1% | 13.6% | 11.6% | 7.8% |
| Self-induced price variations | 3.4% | 4.6% | 2.4% | 2.8% | 7.2% | 2.0% | 2.4% |
| Organizational Volatility * | 34.1% | 23.1% | 45.1% | 27.7% | 44.7% | 27.1% | 29.6% |
| Supply Variability | 3.0% | 3.6% | 4.0% | 1.4% | 0.8% | 2.6% | 7.5% |
| Missing SC coordination | 5.0% | 5.2% | 5.0% | 3.8% | 3.0% | 2.9% | 9.4% |
| Long lead times | 7.3% | 6.2% | 5.4% | 9.0% | 2.6% | 10.9% | 8.6% |
| Price variations (by SC partners) | 1.5% | 2.7% | 1.1% | 1.2% | 1.2% | 1.1% | 1.8% |
| Missing SC visibility | 5.9% | 3.7% | 9.7% | 3.7% | 3.2% | 4.4% | 9.8% |
| Variable lead times | 4.9% | 4.8% | 4.5% | 4.3% | 4.0% | 4.8% | 4.4% |
| Vertical Volatility * | 27.6% | 26.1% | 29.6% | 23.4% | 14.9% | 26.7% | 41.4% |
| Erratic behavior of decision makers | 8.7% | 3.4% | 12.9% | 5.2% | 6.0% | 14.1% | 5.9% |
| erratic behavior of customers | 11.6% | 22.4% | 3.9% | 13.6% | 16.3% | 17.0% | 4,8% |
| Behavioral Volatility * | 20.3% | 25.9% | 16.8% | 18.7% | 22.2% | 31.1% | 10,6% |
| Short product life cycles | 2.1% | 2.7% | 1.1% | 3.3% | 2.6% | 1.5% | 1.9% |
| High level of competition | 7.9% | 10.2% | 3.6% | 13.9% | 6.7% | 9.1% | 6.4% |
| Seasonality | 3.1% | 3.1% | 1.7% | 6.0% | 3.9% | 1.6% | 4.0% |
| Highly innovative products | 4.8% | 8.9% | 2.2% | 6.9% | 5.0% | 3.0% | 6.0% |
| Market-related Volatility * | 17.9% | 24.9% | 8.5% | 30.1% | 18.2% | 15.1% | 18.3% |
* Bold lines represent the impact of the respective SCV dimension on SCV, meaning that they represent the sum of the sources above.
Table 4.
Overview of CRs of AHP.
| Consistency Ratio (CR) | Group Average (n = 17) | by Production Strategy | by Total Lead Time (in Days) | ||||
|---|---|---|---|---|---|---|---|
| ETO n = 4 | MTO n = 7 | MTS n = 6 | 0–28 n = 5 | 29–90 n = 6 | 91–800 n = 6 | ||
| CR Organizational Volatility | 0.008 | 0.010 | 0.028 | 0.044 | 0.065 | 0.030 | 0.038 |
| CR Vertical Volatility | 0.004 | 0.044 | 0.009 | 0.013 | 0.048 | 0.021 | 0.019 |
| CR Market-related Volatility | 0.003 | 0.060 | 0.016 | 0.021 | 0.010 | 0.002 | 0.010 |
| CR Dimensional Level | 0.003 | 0.008 | 0.036 | 0.025 | 0.012 | 0.001 | 0.017 |
Table 5.
SCV management strategies dealing with intra-organizational misalignment.
| Time Horizon | SCV Management Strategies |
|---|---|
| Short-term | Proactive communication of problems
|
| Mid-term | Internal risk assessment
|
| Long-term | Company-wide database on contractual agreements
|
Table 6.
SCV management strategies dealing with inaccurate forecasting.
| Time Horizon | SCV Management Strategies |
|---|---|
| Short-term | Forecasting transparency
|
| Mid-term | Forecasting-process-alignment
|
| Long-term | Statistically sound forecasts
|
Table 7.
SCV management strategies dealing with long lead times.
| Time Horizon | SCV Management Strategies |
|---|---|
| Short-term | Emergency plans
|
| Mid-term | Value stream optimization
|
| Long-term | Localization/Regionalization
|
Table 8.
SCV management strategies dealing with erratic behavior of decision makers in the SC.
| Time Horizon | SCV Management Strategies |
|---|---|
| Short-term | Workload-reduction
|
| Mid-term | Robust processes/process reengineering
|
| Long-term | Organizational learning as a continuous improvement process
|
Table 9.
SCV management strategies dealing with erratic behavior of customers.
| Time Horizon | SCV Management Strategies |
|---|---|
| Short-term | Incentive system
|
| Mid-term | Support of customer in its forecasting
|
| Long-term | Dual sourcing
|
Table 10.
SCV management strategies dealing with high level of competition.
| Time Horizon | SCV Management Strategies |
|---|---|
| Mid-term | Low cost as USP
|
| Long-term | Big Data market research approaches
|
© 2018 by the author. Licensee MDPI, Basel, Switzerland. This article is an open access article distributed under the terms and conditions of the Creative Commons Attribution (CC BY) license (http://creativecommons.org/licenses/by/4.0/).
Share and Cite
MDPI and ACS Style
Nitsche, B. Unravelling the Complexity of Supply Chain Volatility Management. Logistics 2018, 2, 14. https://doi.org/10.3390/logistics2030014
AMA Style
Nitsche B. Unravelling the Complexity of Supply Chain Volatility Management. Logistics. 2018; 2(3):14. https://doi.org/10.3390/logistics2030014
Chicago/Turabian StyleNitsche, Benjamin. 2018. "Unravelling the Complexity of Supply Chain Volatility Management" Logistics 2, no. 3: 14. https://doi.org/10.3390/logistics2030014