Review

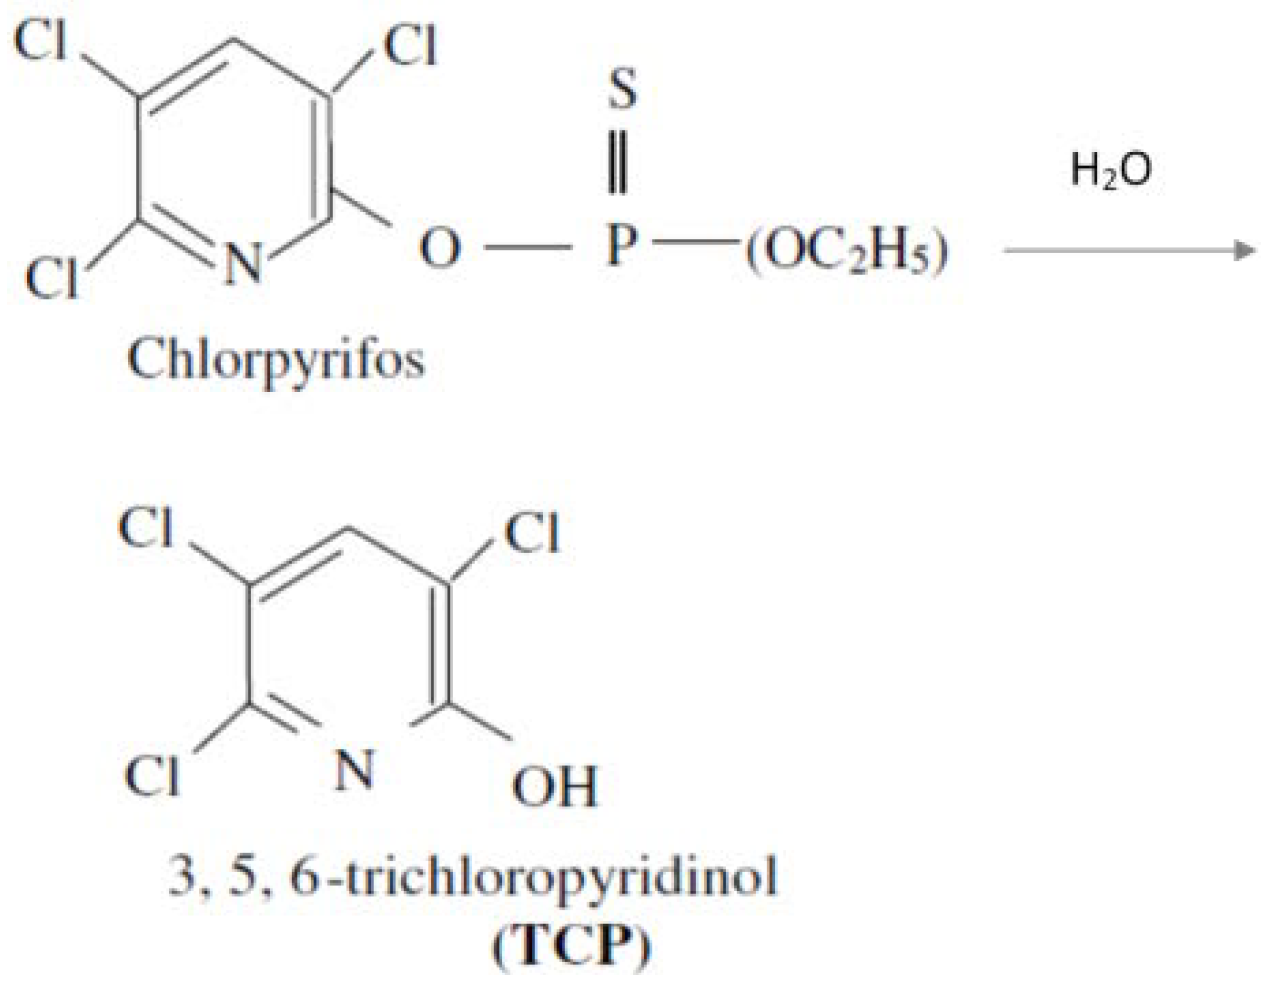
Assessment of Health Risk in Human Populations Due to Chlorpyrifos

1
Griffith School of Engineering, Griffith University, 170 Kessels Road, Nathan, QLD 4111, Australia
2
Griffith School of Environment, Griffith University, 170 Kessels Road, Nathan, QLD 4111, Australia
*
Author to whom correspondence should be addressed.
These authors contributed equally to this work.
Toxics 2014, 2(2), 92-114; https://doi.org/10.3390/toxics2020092
Submission received: 20 November 2013 / Revised: 28 January 2014 / Accepted: 18 March 2014 / Published: 3 April 2014
(This article belongs to the Special Issue Risk Assessment of Environmental Contaminants)

Abstract

:
A wide ranging survey was carried out of the available data from ten different countries on human exposure to chlorpyrifos, in many different occupational and nonoccupational settings. Low levels of chlorpyrifos residues were found to be widely distributed in the global human population, but most of these do not constitute a public health risk, as evaluated using the U.S. Environmental Protection Agency (USEPA) Guidelines. For example, the general populations in USA, Germany and Italy had detectable residue levels well below the guidelines. However, high levels of health risk were apparent in a specific group of pregnant mothers in the USA, at median exposure with a HQ0.50 of 26.6, suggesting that most of this population group was affected. Also the high exposure group (5% most exposed) with occupationally exposed manufacturing workers in the USA had a HQ0.95 of 2.6 to 42.0, and pest control applicators in Australia and the USA both had a HQ0.95 of 5.2. Some farmers in Sri Lanka and Vietnam had a high level of risk after spraying applications, having a HQ0.95 of 2.2 and 19.5 respectively at the high exposure level. These results suggest that there is a possibility of adverse health effects in specific population groups in many different settings throughout the world.

1. Introduction

The organophosphate insecticide, chlorpyrifos, has broad spectrum activity against many arthropod species. It was introduced to the market in 1965 and now plays a major role in controlling a range of pests in agricultural crops (rice, vegetables and fruit crops) and has a variety of other uses in pest control [1]. There are several manufacturers throughout the world and it is common in many countries. It is an acetylcholinesterase inhibiter and considered to incur potential adverse effects as a result of occupational exposure [2].
Chlorpyrifos has a relatively nonpolar molecule (see Figure 1) with low aqueous solubility (2 mg/L), high log Kow (6) and relatively low persistence in the environment. The major metabolite in biological systems is 3,5,6-trichloro-2 pyridinol (TCP) which is passed in the urine of mammals as shown in Figure 1. Its insecticide properties (or its metabolites) are related to its ability to inhibit cholinesterase (AChE) [3] which affects nervous function and leads to severe and often lethal biological damage in organisms [4]. In humans, chlorpyrifos can inhibit the AChE enzyme in the central and peripheral nervous systems, causing adverse effects within hours of exposure [5,6]. Inhibition of plasma cholinesterase damages the central, sympathetic and parasympathetic nervous systems due to its inactivation at the sites of white matter in CNS, pancreas and heart [5]. Guidelines to protect human health have been recommended by many agencies, for example the U.S. Environmental Protection Agency (USEPA) [1].
Figure 1. Chlorpyrifos and its hydrolysis product, trichloropyrridinol (TCP).
Toxics 02 00092 g001
Many instances of occupational exposure to pesticides, including chlorpyrifos, have been recorded [2,7,8,9,10,11] and application of pesticides to fruit and vegetables can also contribute to pesticide exposure through the diet. Use of pesticides can result in residue levels in commodities and in the immediate environments, such as soil, biota and aquatic systems. An extensive data base is now available on human exposure in the scientific literature.
In previous work we have evaluated the health risk due to the use of chlorpyrifos by rice farmers in Vietnam [12]. The exposure levels were found to exceed the acute exposure guidelines of various countries [13]. In addition, the risk was characterised using various probabilistic techniques indicating a health risk [14]. Also we have developed additional methods for the characterisation of health risk using probabilistic distributions [15].
An extensive evaluation of the ecological risk of chlorpyrifos to aquatic environments in North America has been carried out [16]. On the other hand, few human health risk assessments [2] on chronic exposure to low doses of chlorpyrifos have been conducted. Although many exposure evaluations are available, there are no studies that have evaluated the human health risk as a result of dietary exposure to chlorpyrifos. There is therefore a need for an evaluation of the existing data on chlorpyrifos exposure, resulting from occupational and nonoccupational usage, to assess the risk to human health on an international basis.
The aim of this study was to assess the level of risk to human health resulting from exposure to chlorpyrifos with international populations by comparing reported exposure data with established criteria to establish the health risk.

2. Methodology

2.1. Strategy Used for Risk Assessment

The exposure assessment for the human populations in many countries was carried out with reported data from the scientific literature on the occurrence of the chlorpyrifos metabolite and biomarker, 3,5,6-trichloro-2 pyridinol (TCP), in urine (see Figure 1). This data was used to calculate the exposure to chlorpyrifos as the Equivalent Chlorpyrifos Ingested Dose (ECID). This data was plotted as Cumulative Probability Distributions (CPD) with Cumulative Probability plotted versus log ECID. This allowed the segmentation of the exposed population into low exposure group (at the 0.05 cumulative probability exposure level); the median exposure group (0.50 cumulative probability exposure level); and the high exposure group (at the 0.95 cumulative probability level).
Guideline Values for chlorpyrifos have been established by various agencies and are available as measures of the threshold dose for adverse effects (see Table 1). The most comprehensive of these are those developed by the US EPA so it was decided to use these for this assessment. This allowed the calculation of the Hazard Quotient (HQ) values [HQ = Exposure/Guideline Value (GV)] to characterise the health risk. In terms of the exposure group being evaluated the Hazard Quotient for the low exposure group was described as HQ0.05, the median group as HQ0.50 and the high exposure group HQ0.95. But the low exposure group was not evaluated in any population since the other higher exposure groups were considered to represent a conservative evaluation of the health risk in any group.
Units: It was decided to use the same units throughout this paper and the most applicable was ng/kg/day (nanograms/kilogram body weight/day).

2.2. Sources of Exposure Data and Calculation of the Equivalent Chlorpyrifos Ingested Dose (ECID)

2.2.1. Background

A literature survey was carried out on reported data on chlorpyrifos exposure in human populations throughout the world which was available as the TCP levels in urine. The data on the 3,5,6-trichloro-2-pyridinol (TCP) levels in human urine in different populations was used to estimate the Equivalent Chlorpyrifos Ingested Dose (ECID). Eaton et al. [17] point out that with nonoccupationally exposed populations there may be errors due to the possible occurrence of TCP in the urine due to its presence in food and other sources. However this comment is not applicable to acute exposure in an application event where TCP is measured both before and after the event as described below. This comment requires a detailed evaluation of the occurrence of chlorpyrifos and TCP in food and how their toxicokinetics are affected by dietary and physiological factors. TCP is also one of the main metabolites of chlorpyrifos methyl which is used as an insecticide in agriculture with annual usage in the USA of less than 1% of chlorpyrifos [18]. Therefore it can be assumed that chlorpyrifos methyl is unlikely to be a source of significant exposure in the general population. Also the toxicology and public health effects of exposure to TCP from food and water have not been subject to thorough evaluation. Similarly chlorpyrifos oxon may play a role in the exhibited adverse effects of chlorpyrifos [19]. However it is noteworthy that Price et al. [20] have found that a “source to outcome” model relating dietry exposure to chlorpyrifos, as measured by TCP, to health outcomes as reasonably consistent with published results.
The TCP is usually reported in units of µg/L urine or as µg/g creatinine. When measured in units of mass/volume in the urine it is subjected to the variation of daily volume of urine eliminated by the person which can vary with hydration status. However the daily mass of creatinine excreted by a person is considered to be approximately constant [18,21]. Therefore it is assumed that the concentration, with creatinine correction, is a more reliable measurement, despite of the variations with different age groups, ethnicities etc. [21,22].

2.2.2. Exposure from Chronic Nonoccupational Activities

The ingestion of contaminated food & water, dermal contact with contaminated soil and plants and inhalation of contaminated air, are the possible pathways giving the baseline exposure to chlorpyrifos. Based on the half life of excretion of TCP in humans [23] it is assumed that a continuous daily exposure to chlorpyrifos results in a steady state for the TCP levels in urine [4,22]. However it has been suggested by Eaton et al. [17] that levels of TCP present in the food and other sources can lead to estimations of higher concentrations values for chlorpyrifos than actually occur. In this current investigation it is assumed that spontaneous, or spot, urine samples reflect the exposure within the previous 3 to 5 days [23]. An evaluation by Attfield et al. [24] into the use of spot sampling indicates that it requires the use of several sample measurements to achieve an accurate evaluation. This approach is supported by the outcomes of our previous research [12,13]. Results from these samples can be compared to the Guideline Values for chronic exposure in Table 1, eg CRfD. The method used to estimate the daily dose developed by Garabrant et al. [4] was modified to convert TCP levels (ng/g creatinine) in urine into Equivalent Chlorpyrifos Ingested Dose (ECID in ng/kg body weight/day) as expressed by the following equation
ECID = 1.4TCP (CPFMW/TCPMW) CR/BW
where CPFMW and TCPMW are the molecular weights of chlorpyrifos (350.6 g/mole) and 3,5,6 trichloro-2 pyridinol (198.4 g/mole) respectively; CR, the mass of creatinine excreted per day (g/day); BW, the body weight of the subject (kg) and 1.4, a factor to correct for the total amount ingested considering 70% partial absorption of the oral intake [23]. An average body weight of 70 kg was used unless otherwise specified. In general the average adult was considered to have a daily average urine volume of 1.7 L/day with creatinine at a mean concentration of 1.3 g/L [18,25]. Thus the Daily Average Adult Creatinine Excretion (DAACE) is expressed as
DAACE = 1.3 g/L × 1.7 L/day = 2.2 g/day ≈ 2 g/day
Considering the potential low hydration status in the field working environment the average elimination rate of creatinine was considered as (1.3 g/L × 1 L/day = 1.3 g/day) ≈ 1 g/day with the farmers, pest control applicators and manufacturing workers.

2.2.3. Acute Exposure from an Application Event

Evaluation of acute exposure after a chlorpyrifos spraying event was carried out using a modified procedure [26] and using the acute exposure guidelines in Table 1, e.g., ARfD. Urine samples were provided before an event (pre-application) representing the baseline exposure, as well as five daily samples after the event (post-application) representing the exposure due to the event. The samples were analysed for TCP as outlined above with the post-application levels corrected for the baseline (pre-application) and thus they represent the exposure due to the event alone. It is noteworthy that the comment made by Eaton et al [17], mentioned above, regarding occurrence of TCP in the diet and other sources causing over estimation of chlorpyrifos levels is not applicable with this procedure. This is due to the estimation of TCP being corrected for the occurrence of TCP pre-event. The TCP representing overall acute exposure is obtained by summation of the values obtained from the five days post-exposure urine samples [26].

2.3. Guideline Values (GV) Developed by Various Regulatory Agencies

Guideline Values have been established by the U.S. Environmental Protection Agency (USEPA) [1], the World Health Organization (WHO) [27], the Australian Department of Health and Aging (ADHA) [28] and several other agencies representing the critical levels for exposure to chlorpyrifos as in Table 1. The USEPA guidelines are currently under review and may change when finalized [29]. Since these values are expressed in the same units and based on oral intakes, they are comparable with the Equivalent Chlorpyrifos Ingested Doses (ECID) calculated as described above. Generally these Guideline Values (GV) are derived from the No Observed Adverse Effect Levels (NOAEL) of plasma or red blood cells cholinesterase (ChE) inhibition with surrogate animal species (rats, dogs and mice) and humans. The NOAEL is divided by a Safety Factor (SF) or Uncertainty Factor (UF) to establish the Guideline Value. The exceedance of the guideline values set by this procedure represents a health hazard but the specific nature of this hazard is not defined. It should be noted that with the CPAD (Chronic Population Adjusted Dose), the guideline for exposure of children and females from 13 to 50 years of age, no additional biological test data was used but an additional safety factor of 10 was used. Since the USEPA values (see Table 1) are the most comprehensive only these Guideline Values were used in this evaluation. The term general is used in this Table to describe chronic exposure in the general population.
Table 1. Examples of guideline values (GV) developed by various agencies.
Guideline description (applicable population group)AgencyDose (log dose) (ng/kg/day)Reference
ARfD a (acute exposure group)USEPA5.0 × 103 (3.7)[1] USEPA, 2000
APAD b (acute exposure children and females 13–50 years) 0.5 × 10³ (2.7)
CRfD c (general)USEPA0.3 × 103 (2.5)
CPAD d (children and females 13–50 years)USEPA0.03 ×103 (1.5)
ADI e (general)WHO10.0 × 103 (4.0)[27] JMPR, 1999
ADI e (general)ADHA3.0 × 103 (3.5)[28] Australian Government, 2008
a ARfD—Acute Reference Dose; b APAD—Acute Population Adjusted Dose; c CRfD—Chronic Reference Dose; d CPAD—Chronic Population Adjusted Dose; e ADI—Acceptable Daily Intake.

3. Occurrence of Chlorpyrifos in International Populations

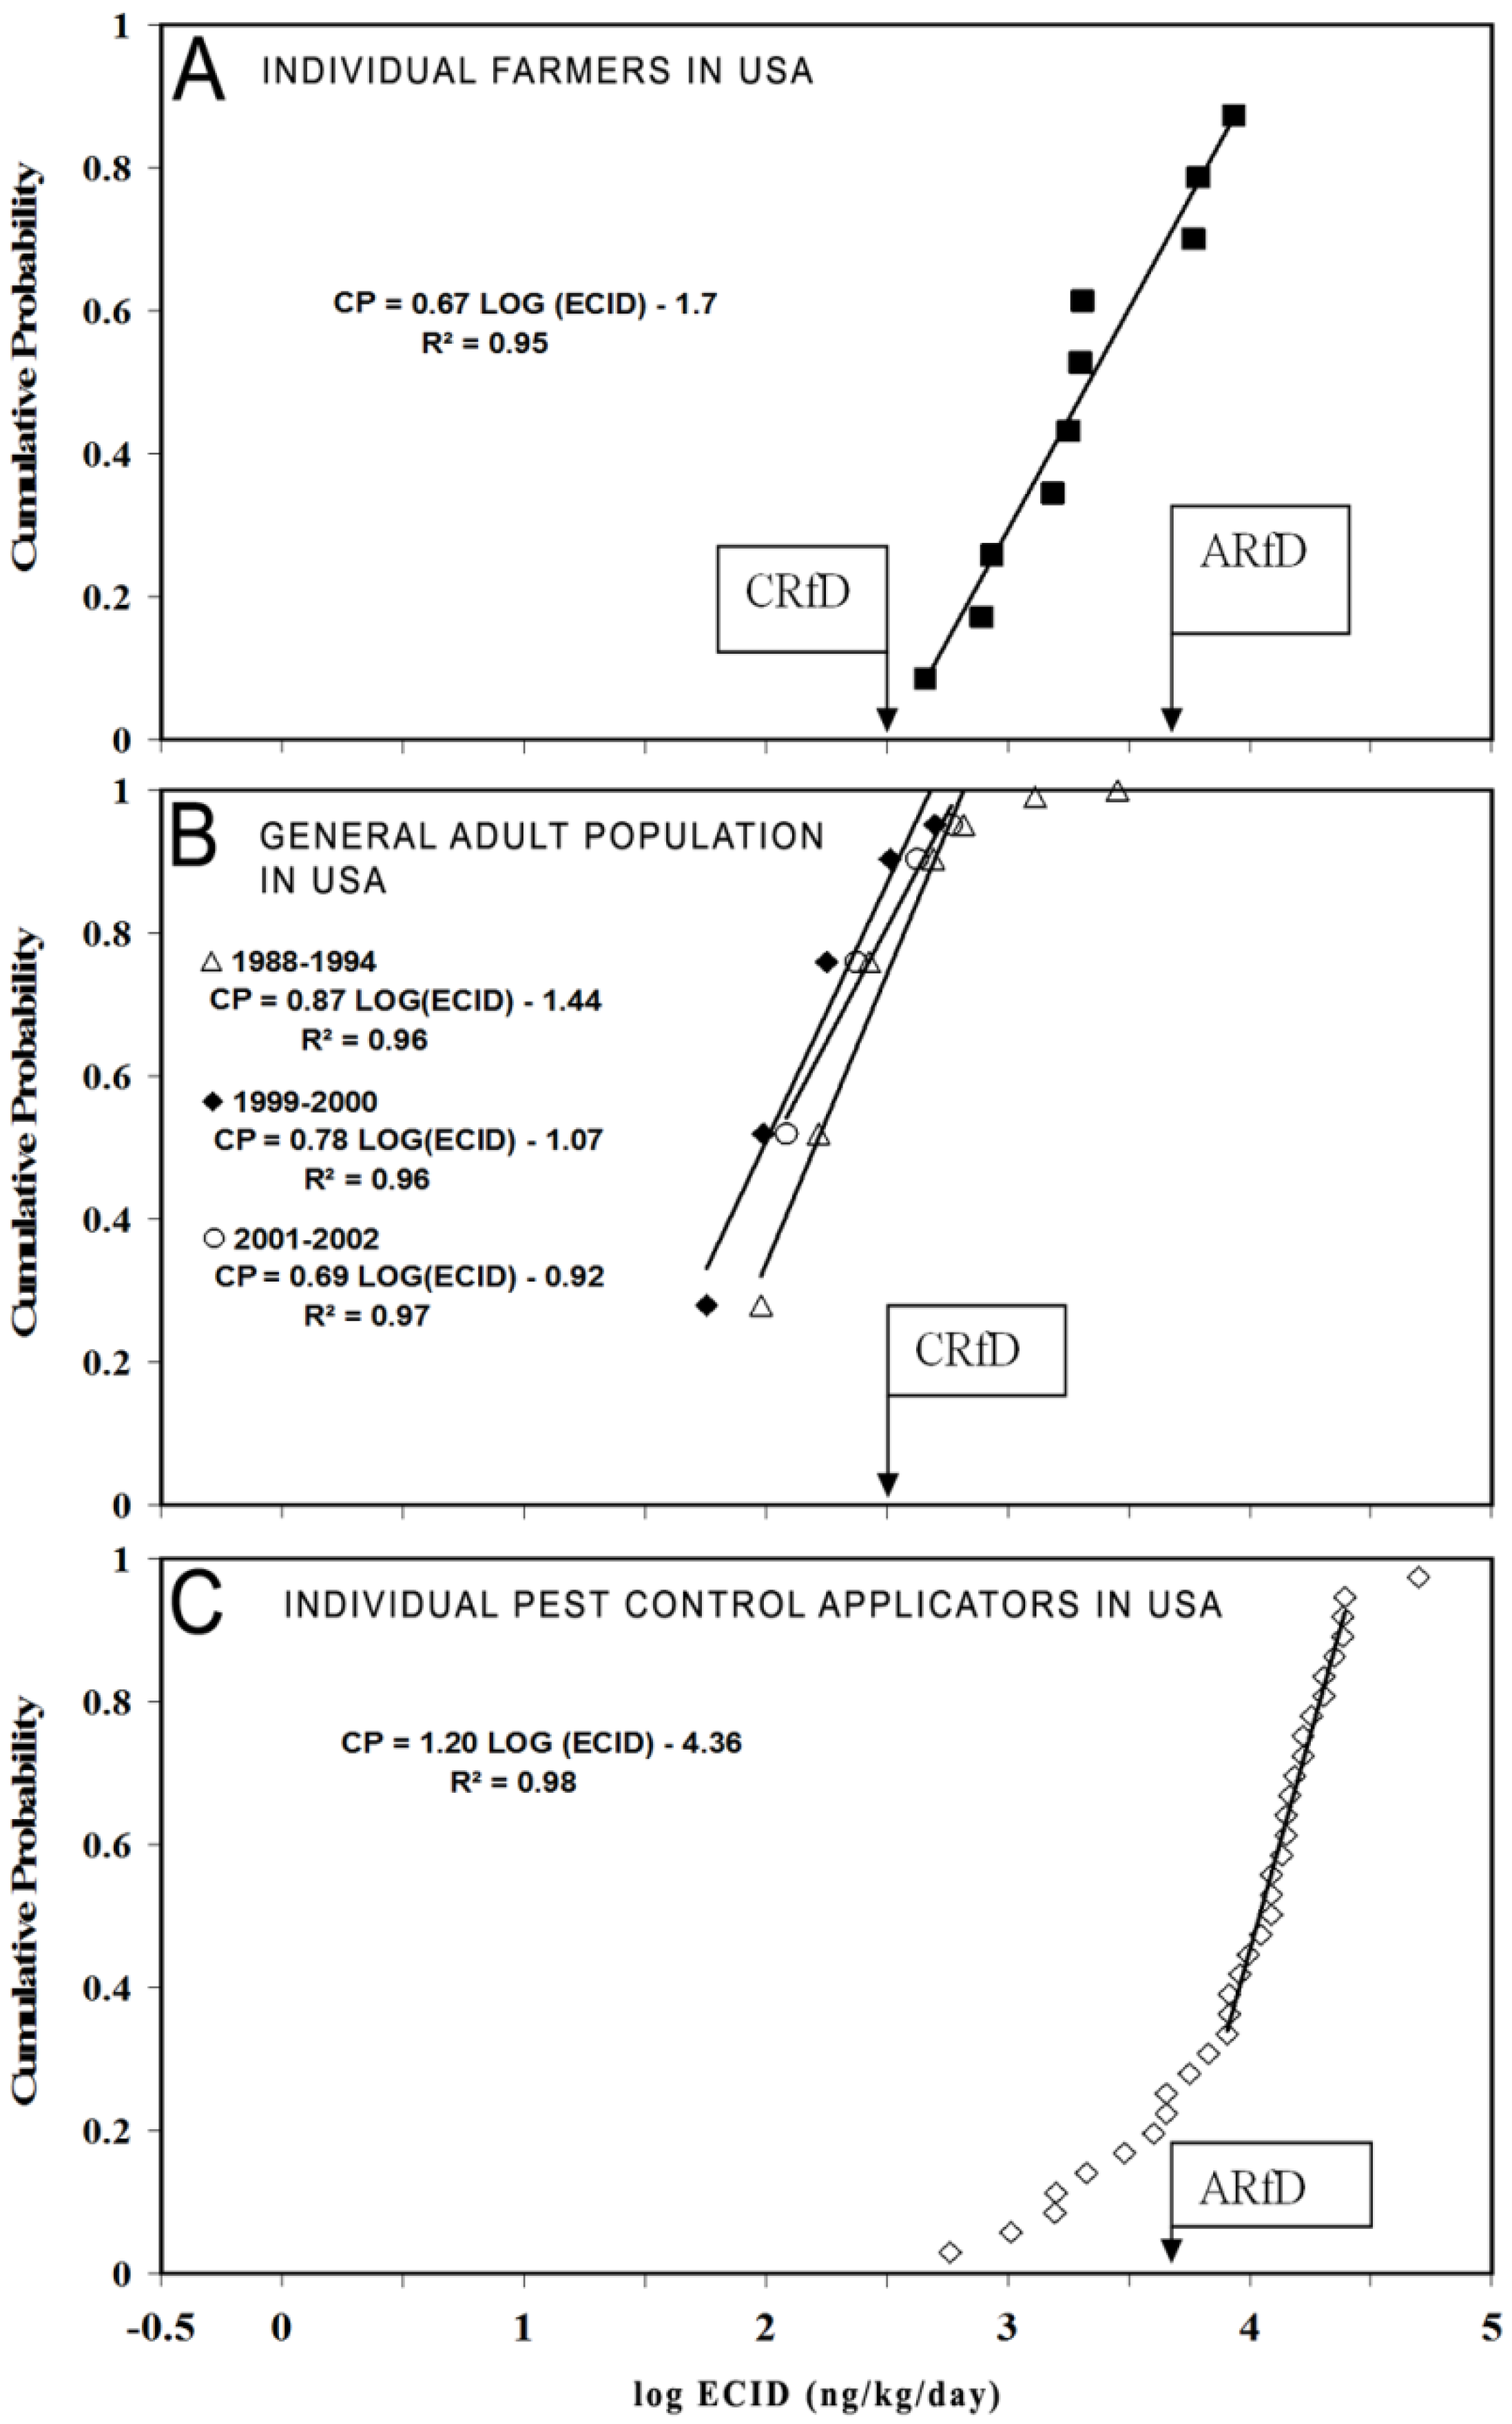
3.1. Equivalent Chlorpyrifos Ingested Dose (ECID) in Populations in the USA

3.1.1. Individual Farmers

Scher et al. [26] reported equivalent chlorpyrifos mass (µg), taken up during a spraying event with twelve farmers in South Carolina and Minnesota. The participants were randomly selected during 2000 and 2001 from licensed pesticide applicators, recruited in a survey known as the Farm Family Exposure Study. The total body absorbed dose (ng) in exposed individual farmers was calculated using TCP levels corrected for the baseline exposure. This data was used in this current study to estimate the ECID, by dividing the mass with an average body weight of an adult as shown in Equation (3). The exposure was assumed to be continuous on a daily basis.
ECID = CEM/(day × BW)
where ECID is in ng/kg body weight/day and CEM, the Chlorpyrifos Equivalent Mass in ng.
The data are presented in Figure 2A with the ARfD and CRfD values for comparison (see Table 1). The ECID levels were distributed between 400 and 7300 ng/kg/day (2.6 and 3.9 log scale) with a slope of 0.7 which represents a relatively narrow distribution.
The USA farmers were reported to use ground booms and tractor-drawn spreaders which gives less chance of direct contact with the pesticide. Scher et al. [26] reported that some farmers were excluded from the study since they operated from an enclosed cab while spraying the pesticide. Further Scher et al. [26] reported that the usage of granular formulations would be expected to result in less exposure.

3.1.2. General Adult Population

The National Health and Nutrition Examination Survey (NHANES) was carried out by the Centers for Disease Control and Prevention in USA to monitor the levels of selected chemicals in urine from the population. The participants were males and females in different age categories resident in different areas of the country. For the analysis of chemicals, including TCP, a spot urine sample was obtained from each volunteer [22]. In the 1988–1994 survey the TCP concentrations of nearly 1000 participants from 26 locations with ages from 20 to 59 years were reported [30]. The detected occurrence of TCP in the urine of participants was at a level of 82%. In the 1999–2000 survey average TCP concentrations of randomly selected adults (832) between 20 and 59 years were reported [31]. The frequency of detections was 89% however the detection limit of 400 ng/L TCP was lower than that of the 1988–1994 survey (1000 ng/L). In the 2000–2001 survey the TCP levels of 1113 participants were reported [18].
Figure 2. Cumulative probability distribution (CPD) for the Equivalent Chlorpyrifos Ingested Dose (ECID) with the following: (A) Individual farmers in the USA after two spraying events in 2000–2001; (B) Adult population aged from 20 to 59 years in the USA from 1988 to 2002 reported in the National Health and Nutrition Examination Survey; (C) Individual pest control applicators from North Carolina, USA in 1998 (see Section 3.1).
Toxics 02 00092 g002
The TCP levels were converted into ECIDs and CPD plots made as shown in Figure 2B. Little difference was observed between the distributions in the three surveys as reflected by the slopes of 0.9, 0.8 and 0.7 in 1988–1994, 1999–2000 and 2001–2002 respectively. But overall the highest ECID levels were observed during the 1988–1994 period and the lowest in 1999–2000.
Chlorpyrifos was introduced as an alternative to chlordane in indoor pest control during 1988–1994, resulting in a higher frequency of exposure [30,32]. Indoor exposure was assumed to be one of the major pathways of exposure in the general population in the USA. Relatively heavy usage of chlorpyrifos was recorded in the late nineties estimated at 9 to 14 million kg for agricultural and nonagricultural pest control purposes [32] while this was reduced to 5 million kg in early 2000 [18].The reduction of chlorpyrifos usage is probably reflected in the distributions from 1988 to 1994 onwards.
The reasons for a lower frequency of detections in NHANES 1999–2000 were discussed in Barr et al. [31]. It was suggested it occurred since there were major changes in the regulations related to chlorpyrifos which resulted in a reduction in usage. In addition there were differences in the study population from that of 1988–1994. Regulatory decisions were taken by USEPA to reduce indoor treatment with chlorpyrifos except for ant and roach baits [33]. Use in termite control at the pre and post construction stages of houses were prohibited by the end of 2005 with a successive phasing out over the previous years. This may have decreased the frequency of exposure among the general public. However the reason for slightly higher ECID levels during 2001–2002 as compared to 1999–2000 is not clear.

3.1.3. Pest Control Applicators

Chlorpyrifos exposure was assessed in 1998 with a group of termiticide applicators in the Piedmont region of North Carolina, USA [32]. The participants were thirty five volunteers between 18 and 54 years of age working as full time licensed applicators applying chlorpyrifos in houses. This study describes the details of chlorpyrifos usage by duration, extent and the amounts used as well as the concentrations of chlorpyrifos in breathing air. Hines et al. [32] monitored TCP in urine samples collected from the workers and presented as creatinine adjusted mean levels. In this current study, the TCP levels were converted to ECID and plotted as a CPD (Figure 2C) together with the ARfD for comparative purposes (see Table 1). The ECID levels were distributed in between 580 (2.8 log scale) and 50,000 ng/kg/day (4.7 log scale, Figure 2C). The slope of the CPD plot in the linear range was 1.2. However a broader distribution was observed below the linear range (2.7 to 3.8 log scale Figure 2C). This may be due to a group of applicators who are less active than would be expected and so exhibit less exposure.

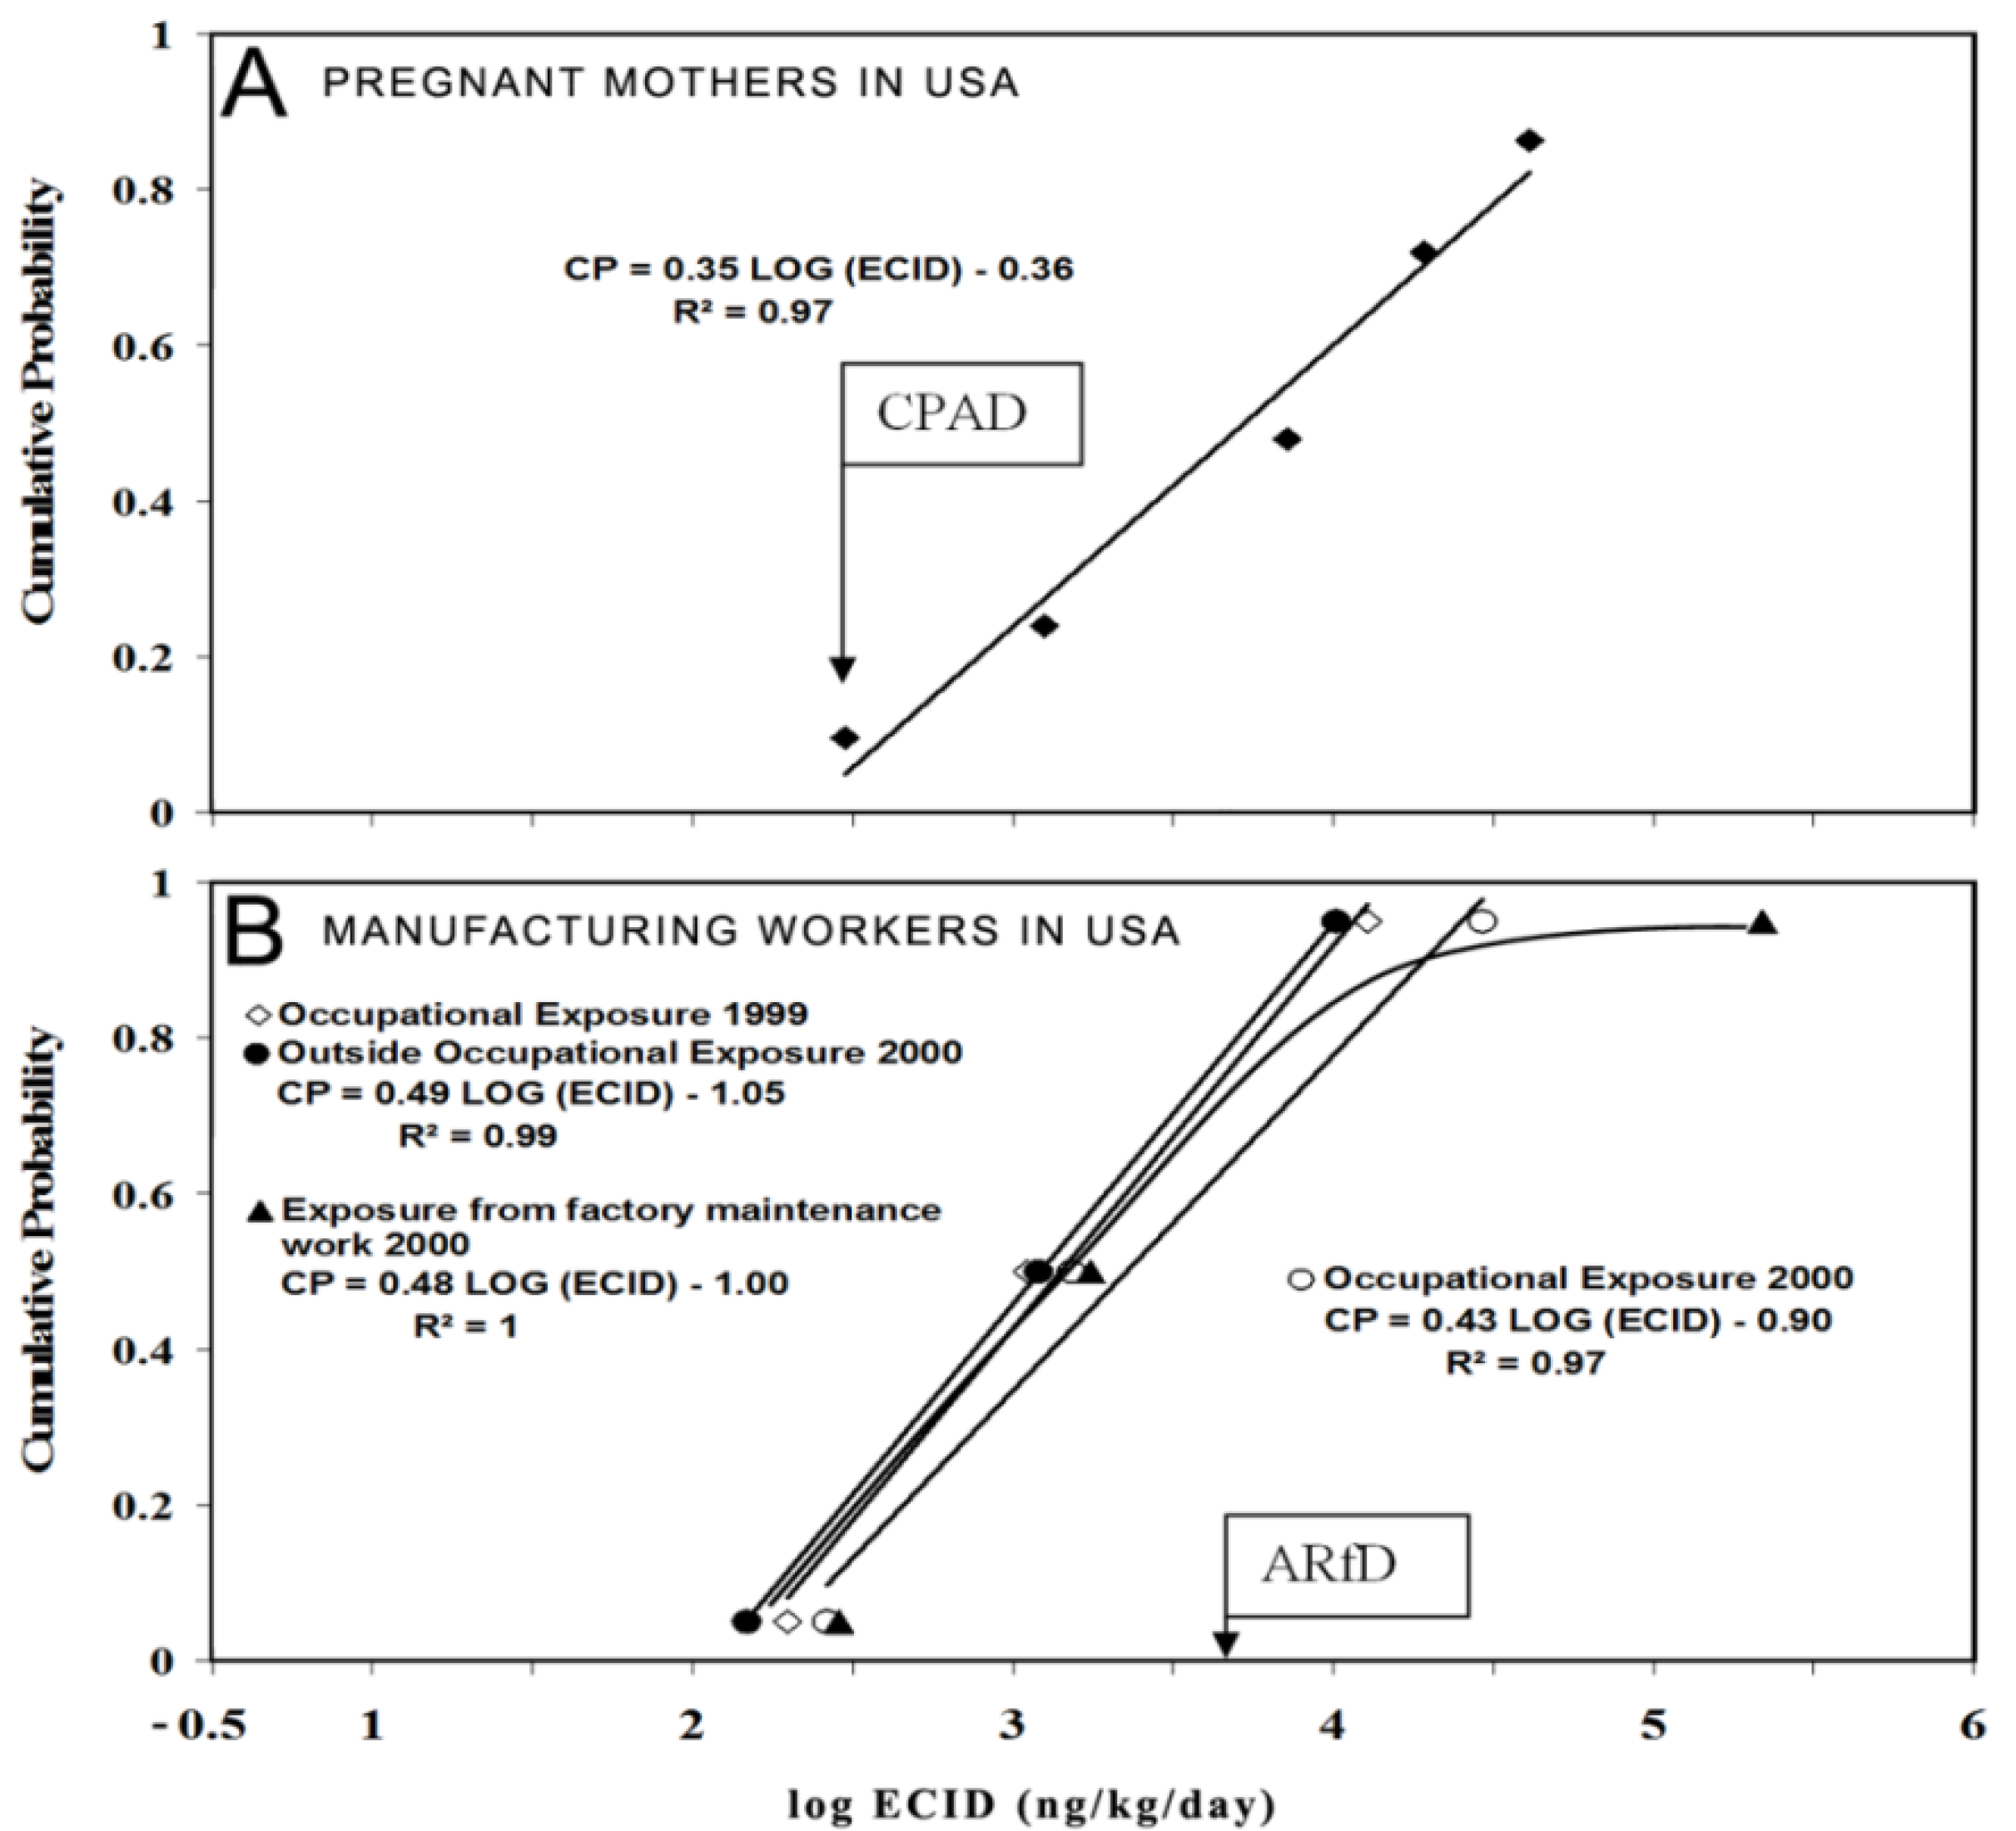
3.1.4. ECID in USA Pregnant Mothers and Children

The exposure to pesticides was assessed in healthy pregnant mothers registered in maternity clinics in New York from 1998 to 2001 [34]. The participants were a group of 365 individuals, of diverse ethnicities, aged around 20 to 30 years with different educational backgrounds and recruited in early pregnancy. Spot urine samples were obtained from the mothers in their last months of the pregnancy for TCP analysis. The individual TCP levels were not reported but the creatinine adjusted TCP levels were reported at various percentiles and converted to ECID levels (Section 2.2) and are presented in Figure 3A. The ECID were distributed in a relatively wide range from 30 to 5200 ng/kg/day (1.5 to 3.7 log scale) with a slope of 0.4 (Figure 3A). The highest level at the 90% probability level is over 170 times than the lowest at the level of 10% probability. This distribution probably reflects the wide range of conditions and circumstances under which exposure occurs.
Figure 3. Cumulative probability distributions (CPD) for the ECID with the following: (A) Pregnant mothers aged about 20 to 30 years during 1998 to 2001 from New York, US (results from 365 individuals reported at the 10, 25, 50, 75 and 90 percent levels) (see Section 2.2 and Section 3.1); (B) Manufacturing workers in the USA on four occasions with 50 to 53 individuals evaluated on each occasion during 1999 to 2000 (results reported for the 5, 50 and 95 percent levels (see Section 3.1).
Toxics 02 00092 g003
Indoor pesticide usage was assumed to be the most common source of chlorpyrifos exposure, according to a questionnaire answered by the participants [34]. Indoor pesticide usage, not exclusively chlorpyrifos, in bait traps, can sprays, gels, boric acid, sticky traps and pest bombs was reported by 72% of the 365 mothers. It was revealed that the relatively highly educated mothers had the highest TCP levels in their urine. However none of the other sociodemographic factors had any consistent relationship with the TCP levels. In addition the potential exposure by other sources such as diet, work place and outdoor environment were not assessed.
Several authors [35,36] have reported on the monitoring of chlorpyrifos in prechildren in the USA. TCP in urine was used which was found not to be a reliable guide to exposure if several sources are involved but exposure to chlorpyrifos and TCP from several sources and through several pathways and routes were identified. Rauh et al. [37] in a longitudinal study have reported that prenatal exposure to chlorpyrifos was associated with neurodevelopmental problems at the age of 3 years and deficits in memory and IQ at 7 years. The USEPA review of the registration of chlorpyrifos [29] recommended the cancelling of uses in schools and parks where children may be exposed.

3.1.5. ECID in Manufacturing Workers from USA

The impact of occupational chlorpyrifos exposure on the urinary TCP levels and blood ChE levels of the workers in a chlorpyrifos manufacturing plant in USA was reported by Garabrant et al. [4]. The ChE levels were analysed in blood together with the TCP levels in urine, obtained on four occasions, with 50 to 53 individuals, during 1999 and 2000. The TCP data was converted to ECID but the results were not reported on individuals but as the 5th, 50th and 95th percentiles which are plotted in Figure 3B.
A considerable difference in the ECID levels can be seen at the 0.95 probability level. The highest ECID was observed in the period when the workers were undertaking factory maintenance work (210,000 ng/kg/day, 5.3 log scale, Figure 3B). This was 21 times higher than the lowest ECID observed at the same probability level. This is most likely due to activities such as cleaning and repairing of equipment which may expose workers to high levels of chlorpyrifos.

3.1.6. Overview of Chlorpyrifos Exposure in Populations of the USA

An overview of the observed ECID levels in the US population is contained in Table 2. All of the ECID—CPD plots were approaching linearity (R2 0.95 to 1.00) suggesting that the statistical distributions were approaching normal. The slopes of these CPD plots are indicative of the range of the exposures to chlorpyrifos in the population. The CPD distribution with the pesticide applicators had the highest slope (1.2) indicating a relative narrow range of exposures reflecting limited and consistent application behaviour within this group. On the other hand the pregnant mothers had the lowest slope (0.4) suggesting the widest diversity of exposure behaviours. The ECID levels for the whole population varied over a wide range from 500 to 210,000 ng/kg/day at the 0.95 level of exposure (see Table 2). The lowest levels were generally observed with the adults who were reported to have only nonoccupational exposure. The highest dose (210,000 ng/bw/day at 0.95 cumulative probability) represented an unusually high exposure situation in an occupational environment with manufacturing workers carrying out maintenance operations.
Table 2. Overview of the ECID in various USA populations at 0.95 Cumulative Probability Exposure.
PopulationECID (ng/kg/day)CPD Plot characteristics a
SlopeInterceptR2
Farmers (2000–2001)8.4 × 1030.7−1.70.95
General population adults
1988–19940.6 × 1030.9−1.40.97
1999–20000.5 × 1030.8−1.10.96
2000–20010.6 × 1030.7−0.90.98
Pest control applicators (1998)26.0 × 1031.2−4.30.98
Manufacturing workers (1999–2000)
Low exposure10.0 × 1030.5−1.01.00
High exposure210.0 × 103NA bN/AN/A b
Pregnant mothers (1998–2001)5.0 × 1030.4−0.40.97
a Cumulative Probability = (slope) (log ECID) + intercept; b NA—Not Available.
The exposure levels with the manufacturing workers in normal working environments (10,000 ng/kg/day at 0.95 probability) were comparable with those of the farmers who were applicators (8400 ng/bw/day). The applicators showed a higher ECID level than in the nonapplicator farmers reflecting their greater involvement with activities related to pesticides. The pregnant mothers showed higher dose levels than were observed in the general adult population suggesting an unusually high exposure in a nonoccupational environment. However the physiological changes that may occur during pregnancy also might have an effect on the rate of creatinine excretion in the pregnant mothers and if so could affect the creatinine adjustment of the chlorpyrifos biomarker (TCP).

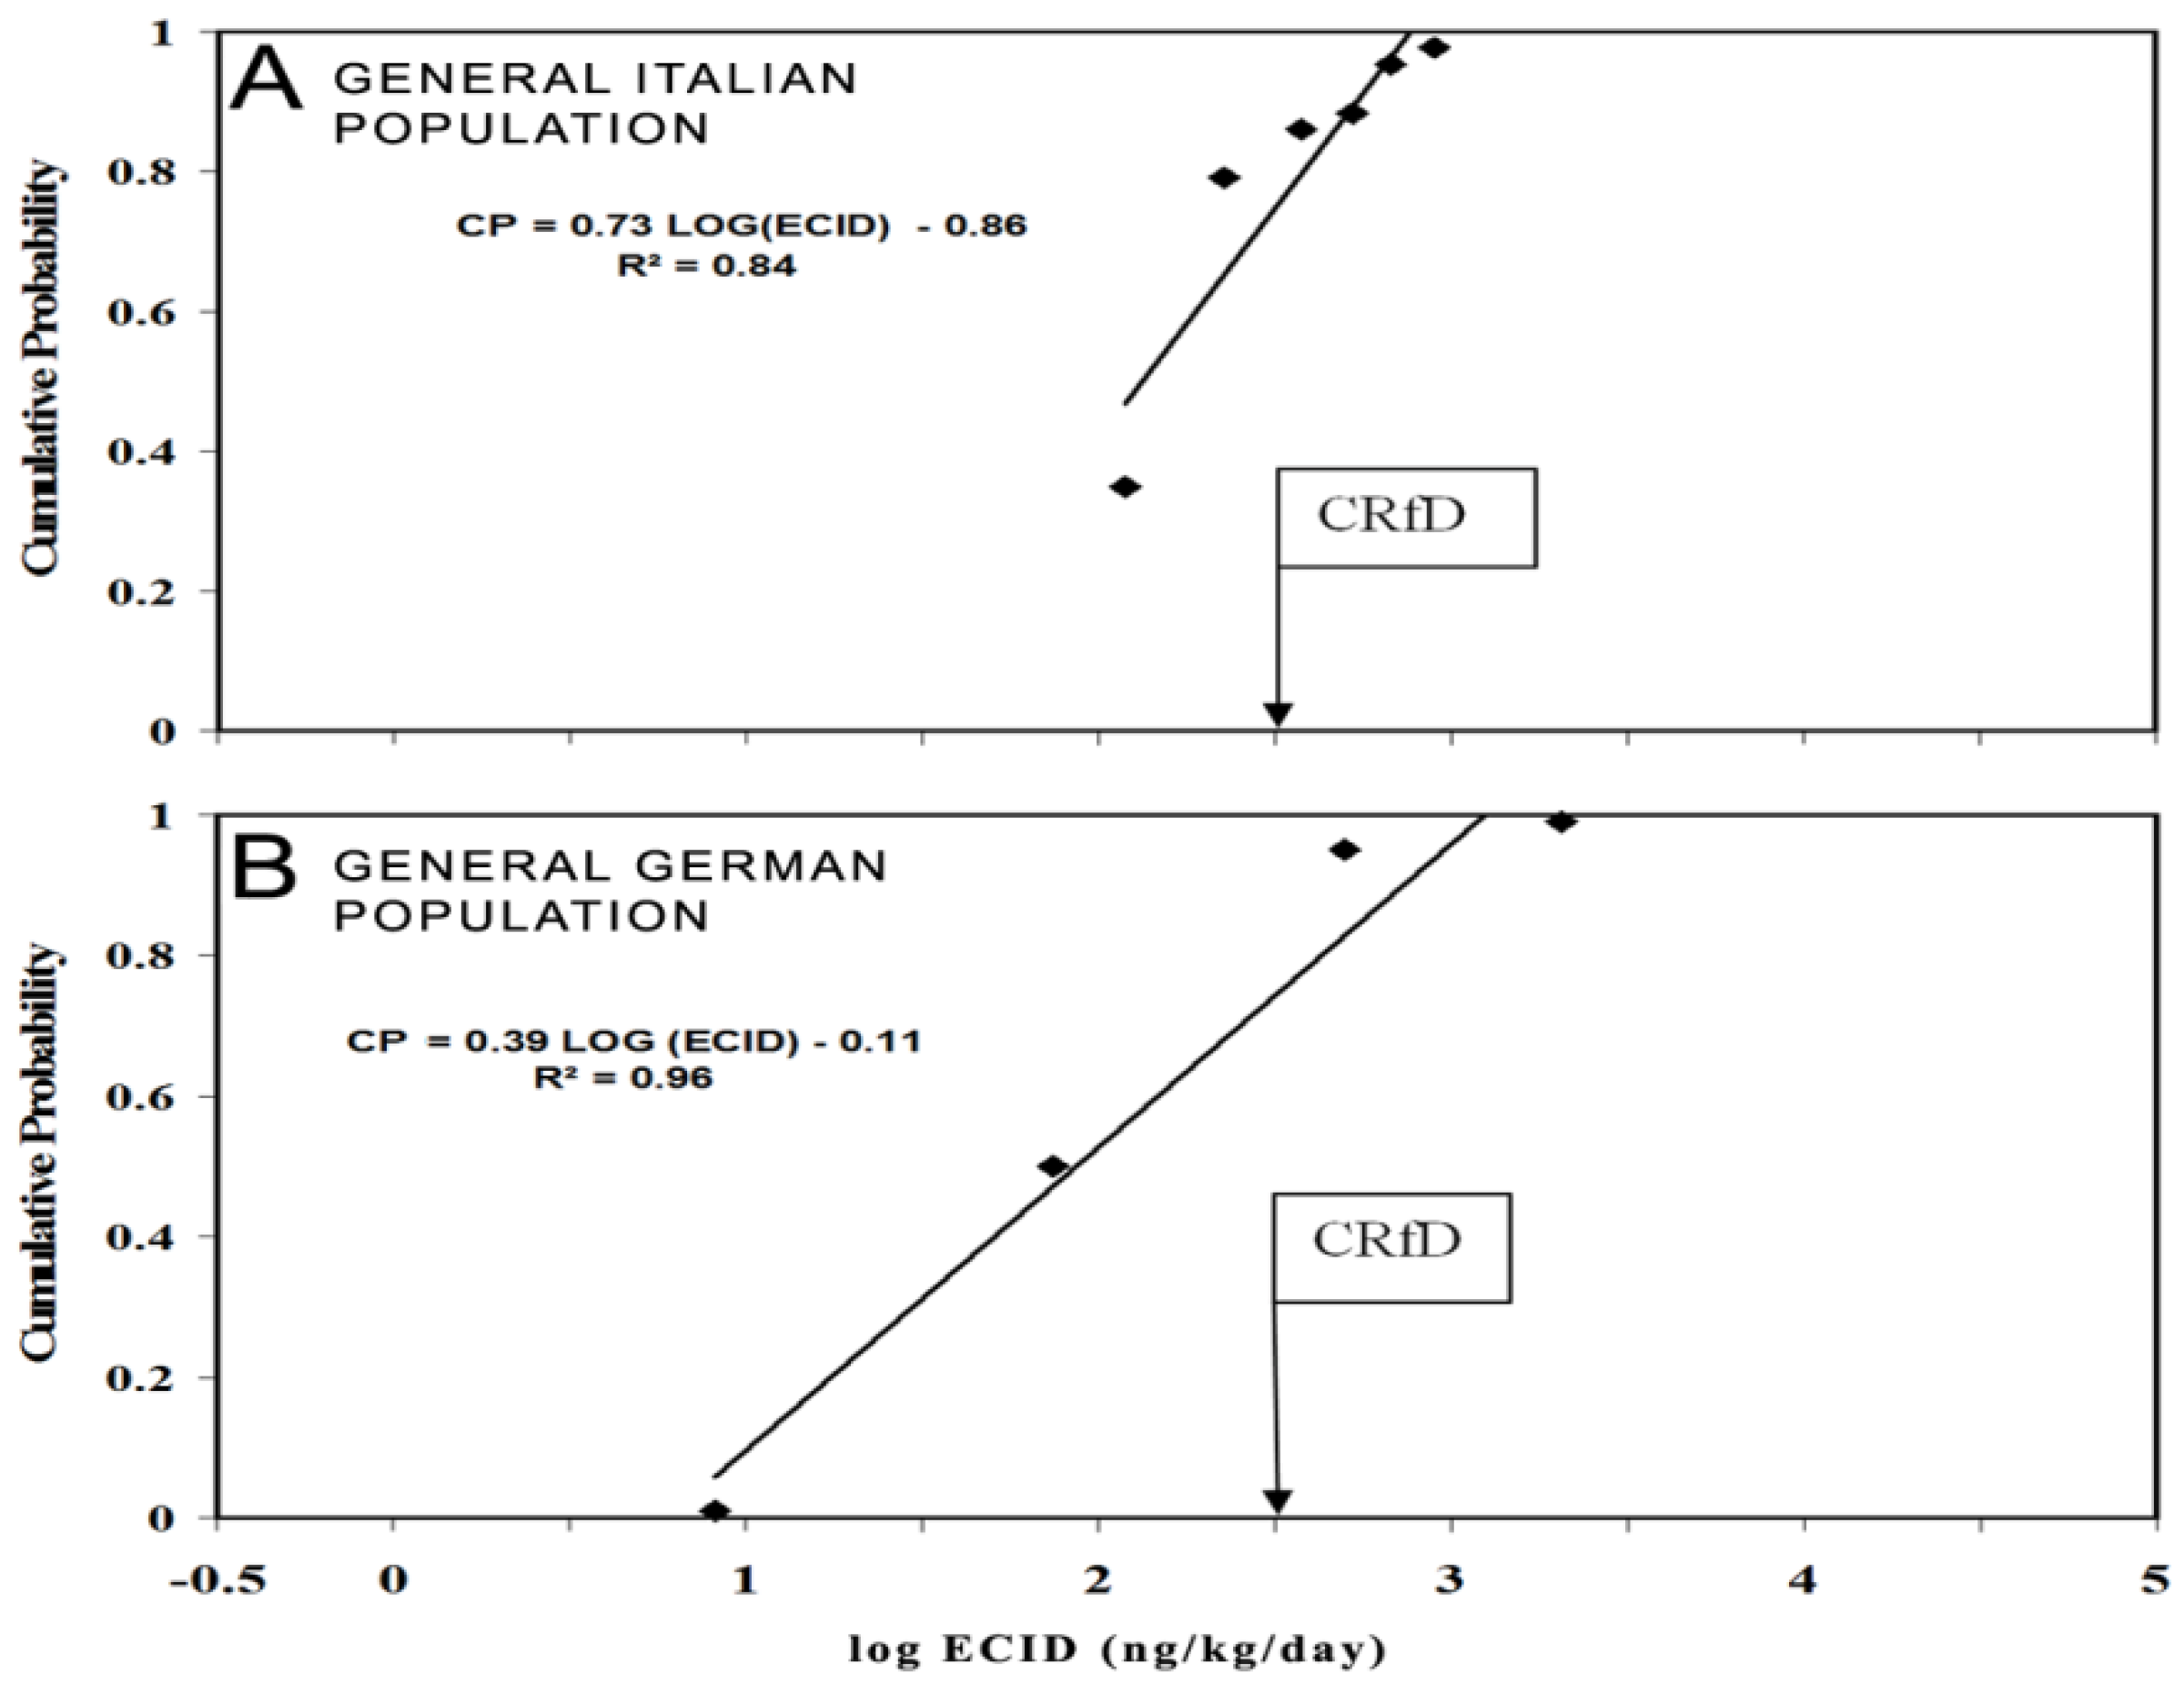
3.2. Equivalent Chlorpyrifos Ingested Doses (ECID) with Populations in Europe

3.2.1. ECID in the General Adult Population in Italy

Aprea et al. [38] assessed the urinary TCP levels in a group of Italian adults (42) with relation to their dietary habits during 1997. The study objectives were to evaluate pesticide exposure resulting from wine and food consumption with the general population. The participants were healthy males and females in the age range of 20 to 60 years, from the Pavia, Siena and Trento regions in Italy and had history of chlorpyrifos exposure. Spot urine samples were analysed for TCP and 88% of the samples had detectable TCP and the creatinine adjusted TCP concentrations were presented as ranges. In this current investigation the mean ECID levels were calculated (see Section 2.2) and plotted in Figure 4A. The observed levels were distributed in a range from 120 ng/kg/day (2.1 log scale) to 900 ng/kg/day (2.95 log scale) with a slope of 0.7. However 12% of the participants had no detectable TCP which means that the actual range of levels was from effectively zero to 900 ng/kg/day.
Figure 4. Cumulative probability distributions (CPD) for the ECID with the following: (A) 42 individuals in the general Italian population in the Pavia, Siena and Trento regions during 1997 (results reported for the ranges of TCP concentrations; (B) 50 individuals in the general German population of Meklenburg-Vorpommern regions (results reported at the maximum, median and 95 percent value) (see Section 3.2).
Toxics 02 00092 g004
A similar study was carried out by Saieva et al. [25] with 69 participants from two regions (Florence and Ragusa) in Italy during 1998. The participants had no history of chlorpyrifos exposure and supplied urine samples for the TCP analysis. The creatinine adjusted TCP levels were reported from which the corresponding ECID levels for the minimum, maximum and mean were calculated (see Section 2.2). The ECID levels were 60 ng/kg/day, 1300 ng/kg/day and 270 ng/kg/day (1.8, 3.1 and 2.4 log scale, data not plotted). These levels are comparable with the ECIDs calculated in the study of Aprea et al. [38] (Figure 4A).
In both studies it was suggested that the exposure is most likely to result from dietary intake. In addition Aprea et al. [38] reported that wine consumption had a significant effect on TCP levels in urine, which would be reflected in the ECID levels. Saieva et al. [25] found a relationship between smoking and high TCP levels in the study group. However, neither of the studies suggests significant exposure through indoor pesticide treatment since this is uncommon in Italy.

3.2.2. ECID in German General Adult Population

Koch et al. [39] assessed the TCP levels in urine from fifty adults in the general population of Meklenburg-Vorpommern in Germany. It was assumed that the TCP levels observed resulted from the intake of food treated with chlorpyrifos and chlorpyrifos methyl pesticides. However, the usage of these pesticides in Germany was not reported. The participants who supplied spot urine samples for analysis were men and women aged 22 to 57 years who had never experienced occupational exposure to organophosphate pesticides. TCP was detected in all the urine samples. The creatinine adjusted minimum and maximum TCP levels together with the levels for the median and 95th percentile were reported. The TCP levels were converted into ECID (see Section 2.2) and these are presented in Figure 4B. The levels ranged from 0.8 to 2100.0 ng/kg/day (0.9 to 3.3 log scale), with a mean dose of 160.0 ng/kg/day (2.2 on log scale) and the CPD had a slope of 0.4 (see Figure 4B).

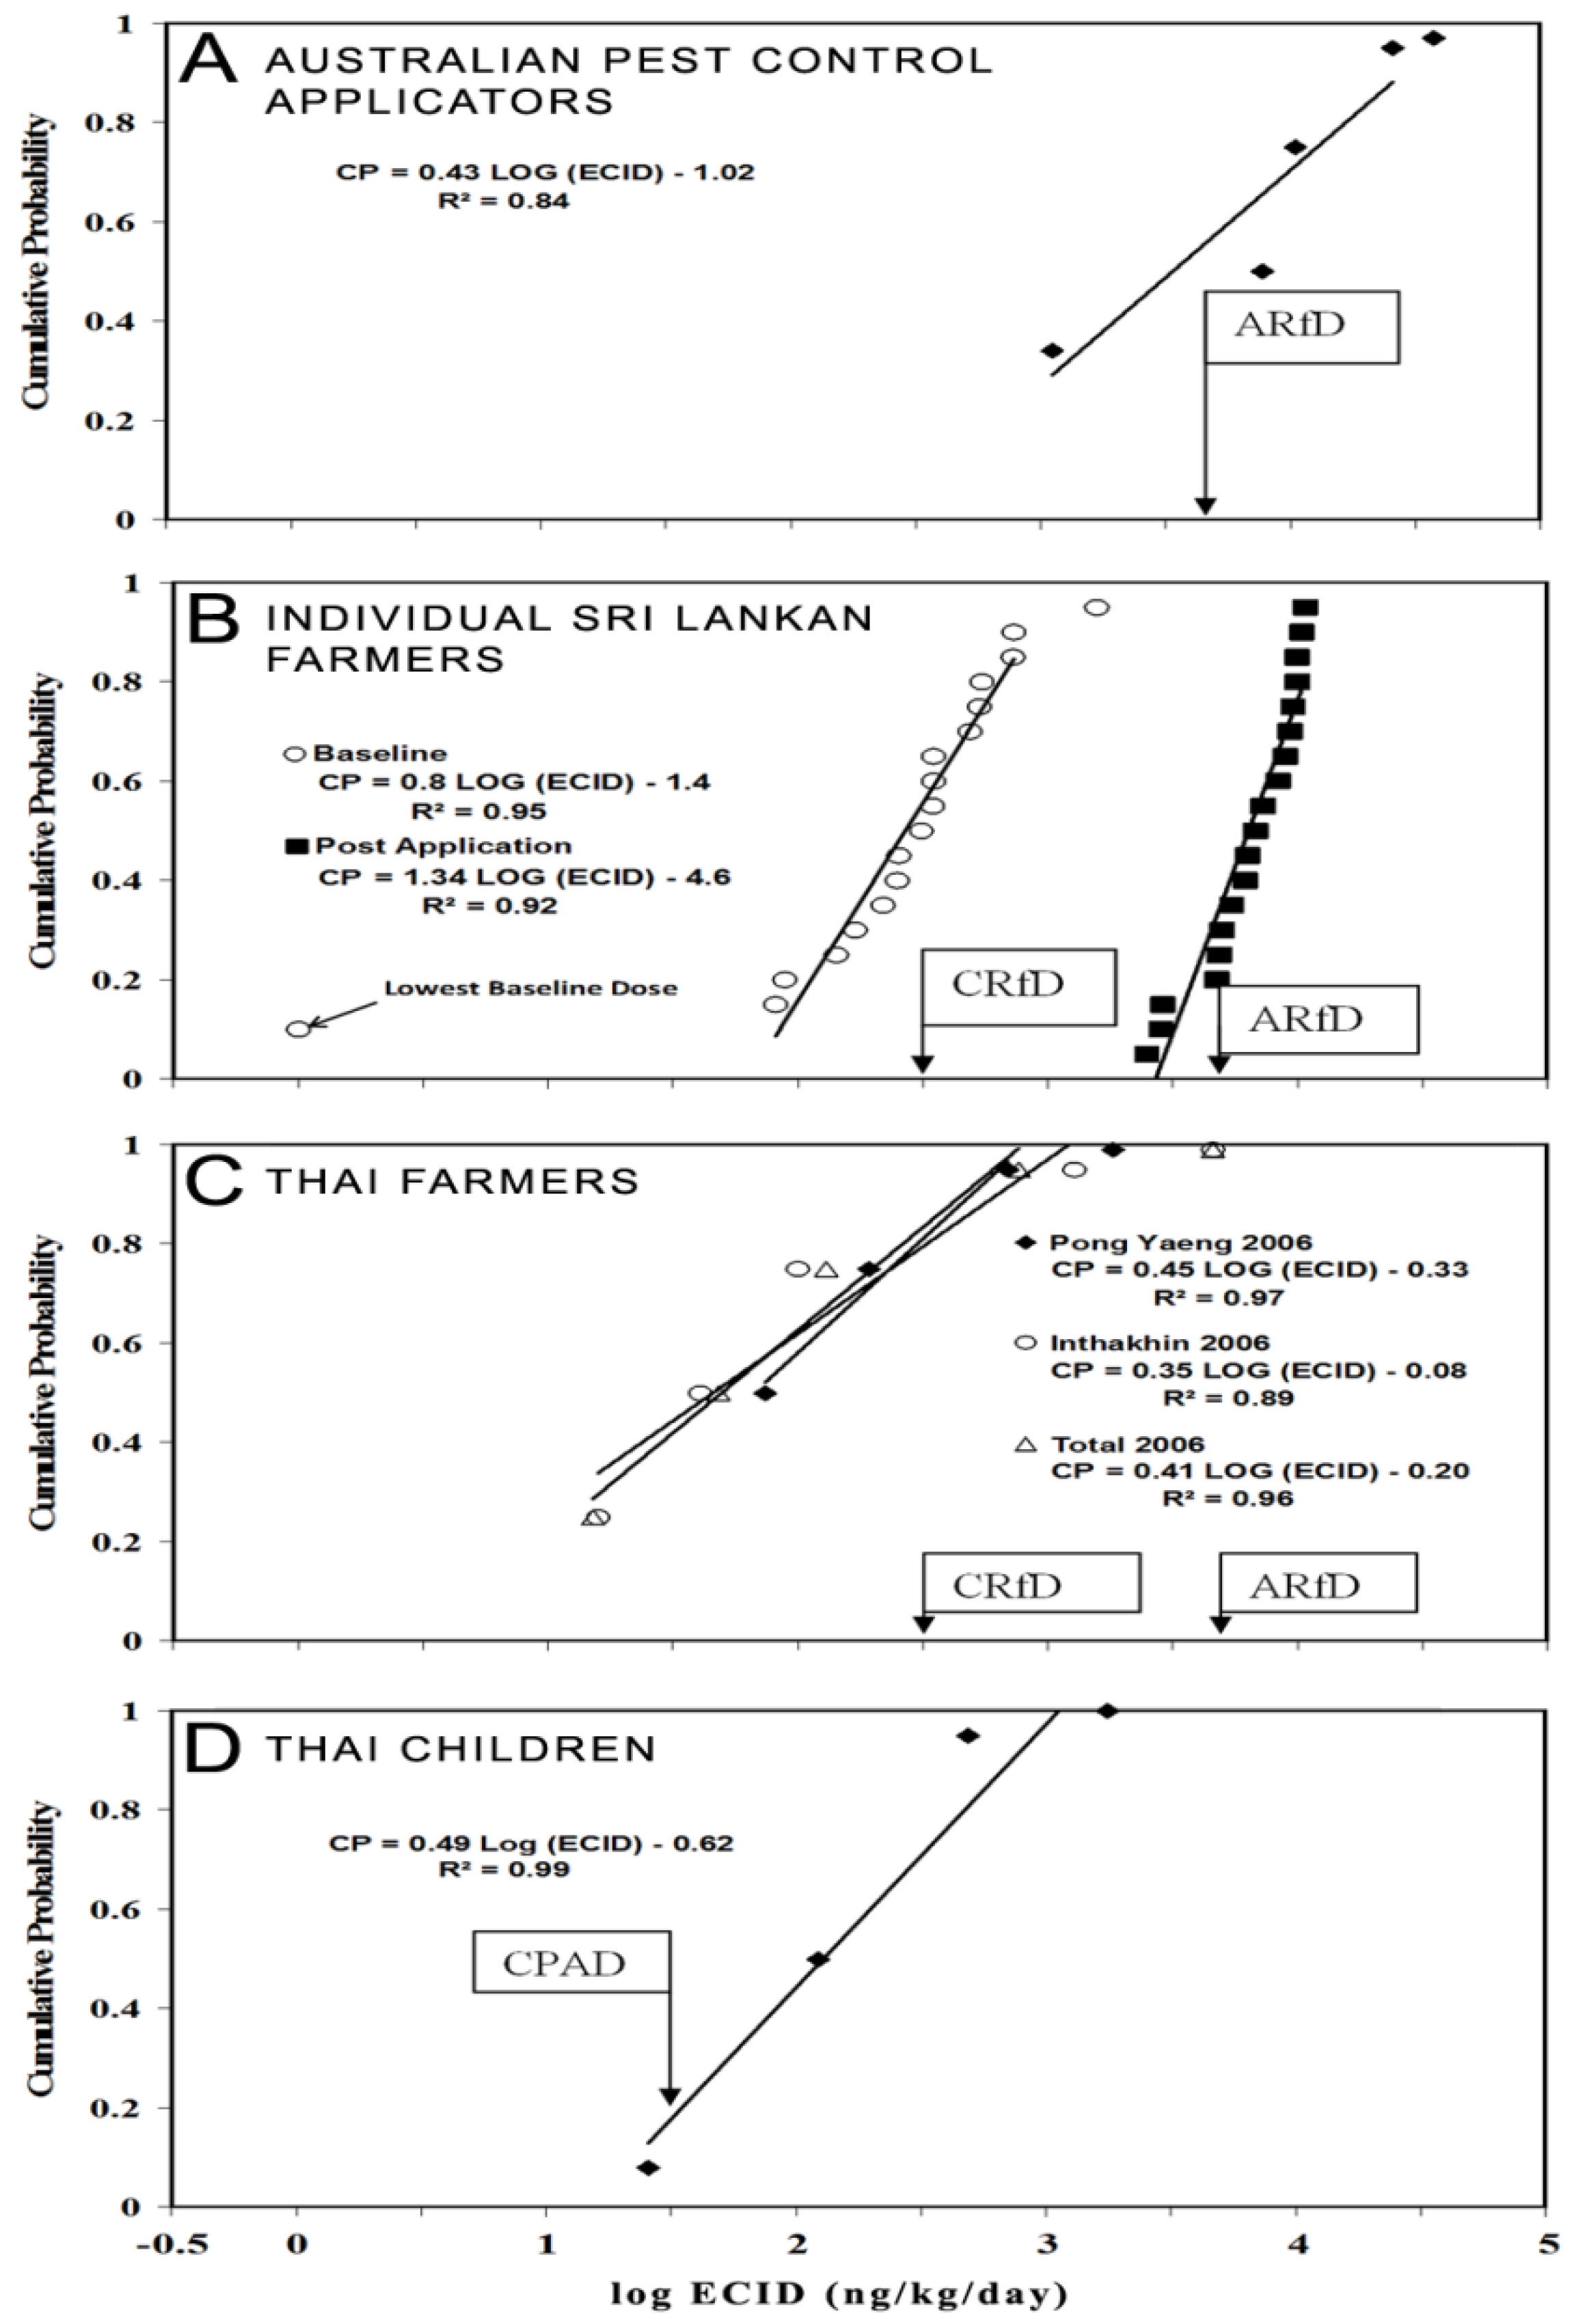
3.3. Equivalent Chlorpyrifos Ingested Doses (ECID) in Australian Pest Control Applicators

During 1998 and 1999 Cattani [40] evaluated the workplace exposure to chlorpyrifos, in a group of pesticide applicators from Perth, Australia. The participants were from a number of licensed pest control companies and had volunteered to participate. Some workers used chlorpyrifos and bifenthrin for termite control purposes while the others used only chlorpyrifos. All were involved in pre-construction, post-construction and underfloor treatments of buildings using similar equipment. Chorpyrifos levels were measured in breathing air and surface wipe samples together with urinary TCP and blood ChE levels. The urine samples were collected from workers (19) before and after a chlorpyrifos application event and were analysed for TCP. The creatinine adjusted TCP concentrations were reported for the minimum, maximum, median, 75th and the 95th percentiles. The post-application TCP levels were converted to ECID levels (see Section 2.2) and are presented in the Figure 5A. The CPD had a slope of 0.4 and the levels ranged from 1100 to 37,000 ng/kg/day (3.0 to 4.6 log scale). The highest ECID was 33 times greater than the lowest level.
Figure 5. Cumulative probability distributions (CPD) for the ECID with the following: (A) 19 Australian pest control applicators after an application event during 1998 to 1999 (results reported as minimum, maximum median, 75 and 95 percent levels. (see Section 3.3); (B) 19 individual Sri Lankan farmers at baseline and post application exposure during 2000. (see Section 3.4); (C) 136 male Thai farmers during 2006 (results reported at the maximum, 25, 50, 75 and 95 percent value) (see Section 3.5); (D) 207 Thai children during 2009 (results reported at the maximum, minimum, median and 95 percent value) (see Section 3.5).
Toxics 02 00092 g005

3.4. Equivalent Chlorpyrifos Ingested Dose (ECID) in Sri Lankan Farmers

Aponso and Manuweera [2] conducted a study to assess chlorpyrifos exposure during a chlorpyrifos spraying event with a group of individual farmers (19) in the Kandy district of Sri Lanka during 2000. The farmers were spraying an overhead canopy with hand operated spraying equipment. The ECID in urine was calculated prior to commencing a typical chlorpyrifos spraying event (pre-exposure) as well as throughout and after the event (post exposure) (see Section 2.2). The pre-exposure data represents the baseline exposure of farmers to chlorpyrifos with additional exposure occurring during spraying events. The farmers had not used chlorpyrifos for at least ten days prior to the study and therefore the baseline TCP in the farmers indicates the exposure to chlorpyrifos from routes other than the spraying event. The CPD plots of this data are shown in Figure 5B.
The doses are in between 1.0 ng/kg/day (0.0 log scale, Figure 5B) and 1600.0 ng/kg/day (3.2 log scale, Figure 5B). The median ECID is 379.0 ng/kg/day (2.6 log scale, Figure 5B) and the slope of the distribution plot is 1.3. The post application ECID levels were distributed in between 2500 and 11,000 ng/kg/day (3.4 and 4.0 log scale, Figure 5B). The slope of the post application CPD was 1.3 as compared to the baseline plot which was 0.8.

3.5. Equivalent Chlorpyrifos Ingested Doses (ECID) in Thai Farmers and Children

3.5.1. ECID in Farmers

Farmers (males, 136 in total) from Chang Mai, Thailand in two communities (Pong Yaeng and Inthakhin) involved in mixed crop cultivation participated in a pesticide exposure evaluation study during 2006 [41]. A number of pesticides were used during the three months prior to the study with chlorpyrifos being the most common. All the farmers used back pack reservoirs with hand pumps to apply the pesticides.
A spot urine sample was collected from each farmer during the study period for TCP analysis. The creatinine adjusted TCP concentrations were reported at maximum, 25th, 50th, 75th and the 95th percentiles. About 77% of the farmers had detectable TCP levels which were converted into ECID (see Section 2.2) and are plotted as a CPD in Figure 5C.
The ECID in Pong Yaeng and Inthakhin farmers [41] ranged from 70.0 to 1800.0 ng/kg/day (1.9 to 3.3 log scale, Figure 5C) and 20.0 to 4600.0 ng/kg/day (1.2 to 3.7 log scale, Figure 5C). At 0.95 cumulative probability levels the farmers from Inthakhin region showed more elevated levels of ECID than the farmers from PongYaeng. Panuwet et al. (2008) reported that the cropping pattern selected by the farmer has an influence on exposure [41].

3.5.2. ECID in Children

Panuwet et al. [42] analysed the urine samples from a group of school children (207) in Chiang Mai, Thailand aged between 12 to 13 years who were identified as having agricultural and nonagricultural family backgrounds. Spot urine samples were analysed for TCP and 92% had detectable levels. The creatinine adjusted TCP levels were reported for the minimum, maximum, median and the 95th percentile. In the present study the TCP levels were converted to ECIDs (see Section 2.2) and are presented in Figure 5D. The ECID ranged from 30.0 to 1800.0 ng/kg/day (1.4 to 3.2 log scale) with the highest from students in an agricultural environment. Dietary exposure was assumed to be the main pathway of exposure with chlorpyrifos being monitored frequently in dietary components in Thailand [42]. It is interesting to contrast this result with that of children in Costa Rica who live in plantations where bags treated with chlorpyrifos are used to protect fruit.

3.6. Equivalent Chlorpyrifos Ingested Doses (ECID) in Vietnamese Farmers

Chlorpyrifos is the most common pesticide used in Vietnam for rice cultivation. Phung et al. [12] collected urine samples (108) both before and after a spraying event from farmers (18) who were pesticide applicators using back pack hand operated sprays. TCP levels were estimated and the ECIDs were calculated using creatinine adjustment. The baseline exposure levels ranged from 30 to 1980 ng/kg/day while the post application levels were 350 to 94,000 ng/kg/day and the data were plotted as CPDs [13]. Exposure at the 0.95 and the 0.50 levels were reported for the baseline (1600 and 30 ng/kg/day respectively) and the post application situations (11,000 and 680 ng/kg/day respectively) (Table 3).
Table 3. Equivalent chlorpyrifos ingested dose (ECID, ng/kg/day) for farmers from various countries.
Cumulative Probability LevelSri Lankan Farmer-Baseline, 2000 a (log dose)Sri Lankan Farmer-Post Application, 2000 a (log dose)Thai Farmer, 2006 b (log dose)US Farmer–Post Application, 2000-2001 c (log dose)Vietnam Farmer–Baseline, 2011 (log dose)Vietnam Farmer–Post Application, 2011 (log dose)
0.500.3 2 × 10³ (2.5)6.8 × 10³ (3.8)0.05 × 10³ (1.7)2.0 × 10³ (3.3)0.24 × 10³ (2.4)19.4 × 10³ (4.3)
0.951.6 × 103 (3.2)11 × 103 (4.0)4.6 × 10³ (3.6)8.4 × 10³ (3.9)9.0 × 10³ (3.95)97.7 × 10³ (5.0)
a see Figure 5B; b see Figure 5C; c see Figure 2A.

4. Overview of Equivalent Chlorpyrifos Ingested Dose (ECID) in Similar International Populations

4.1. Farmers from Sri Lanka, Thailand, USA and Vietnam

The ECID levels for the farmers from Sri Lanka, Thailand, USA and Vietnam were compared at the median (0.50 probability) and high exposure (0.95 probability) levels (see Table 3). It is noteworthy that with the Sri Lankan and Vietnamese farmers the post application levels of ECID (see Figure 5B, Table 3) showed a major increase over the baseline at the 0.95 and the 0.05 levels , ×7 to ×22 (Sri Lankan) and ×11 and 81 (Vietnam).
The baseline levels were estimated immediately before chlorpyrifos application and were not related to pesticide application [2]. It was assumed to be derived from the diet containing contaminated plants and other non-agricultural sources. The median baseline levels (0.50 level , Table 3) with all the farmers were relatively low (0.3 × 10³, 0.05 × 10³, 2.0 × 10³, 0.24 × 10³, 19.4 ng/kg/day) and within a somewhat similar range, except for the Vietnamese farmers, and there was also a similar limited range of values at the 0.95 level (1.6 × 10³, 4.6 × 10³, 8.4 × 10³, 9.0 × 10³, 92.7 ng/kg/day) again with the exception of the Vietnamese farmers.
The ECID with the Thai farmers was probably a reflection of the exposure from various sources including those which occurred during their normal farming activities [41]. However the post application ECIDs were directly related to the chlorpyrifos exposure received from a planned application event [2,13]. In contrast, the Thai farmers exposure was not related to an application event and thus could be expected to be lower [41]. In addition chlorpyrifos was not one of the frequently used pesticides with the Thai farmers.
The USA farmers were shown to have a post application ECID of 8.4 × 10³ ng/kg/day at the 0.95 probability level (see Table 3 and Figure 2A) which was below the level of the Sri Lankan and Vietnamese farmers (see Table 3 and Figure 5B). Most of the Sri Lankan and Vietnamese farmers were not using personal protective equipment and had a greater potential for exposure due use of personal individual hand operated sprayers [2]. In contrast, USA farmers used ground booms and tractor mounted spreaders [26] which provide a higher level of protection to the applicator.

4.2. Pest Control Applicators and Manufacturing Workers in Australia and USA

The Equivalent Chlorpyrifos Ingested Dose (ECID) levels for pest control applicators and manufacturing workers in the USA and Australia were compared at the 0.50 probability and 0.95 probability levels (see Table 4). The USA manufacturing workers have a differing exposure depending on the working cycle at the manufacturing plant. At a low exposure period in the working cycle the exposure at the 0.50 level is 1.1 × 10³ ng/kg/day while at the 0.95 level it is 10.0 × 10³ ng/kg/day (see Table 4). However at the 0.95 probability level there is a much higher level of exposure due to the annual factory shutdown and maintenance period (210 × 103 ng/kg/day, see Table 4) [4]. Interestingly this difference was not observed at the 0.50 probability level with 1.1 × 10³ at median exposure and 1.8 ng/kg/day at high exposure (Table 4).
Table 4. Equivalent chlorpyrifos ingested doses (ECID) in pest control applicators and manufacturing workers in Australia and USA.
Cumulative probability levelUS pest control applicators (1998) a (ng/kg/day) (log dose)US manufacturing workers (1999–2000) b (ng/kg/day)Australian pest control applicators (1998–1999) c (ng/kg/day) (log dose)
Low Exposure (log dose)High Exposure (log dose)
0.5012.0 × 103 (4.1)1.1 × 10³ (3.04)1.8 × 10³ (3.2)7.8 × 10³ (3.9)
0.9526.0 × 103 (4.4)10.0 × 10³ (4.0)210.0 × 10³ (5.3)26.0 × 10³ (4.4)
a see Figure 4; b see Figure 3A; c see Figure 5A.
Pest control applicators in both Australia and the USA were reported to be involved with termite control work using chlorpyrifos [32,40]. Termiticide application normally is a full time occupation carried on throughout the working week, which necessitates handling of pesticides frequently. For example USA applicators were reported to be working more than five days a week during busy periods [32]. In addition most of the applicators were operating in enclosed crawl spaces with comparatively low ventilation. Cattani [40] has described the protective measures taken by the applicators but believed to be insufficient to prevent significant exposure.

4.3. General Populations of Europe, Sri Lanka, Thailand, USA and Vietnam

A comparison was made of the international general populations of adults and some population groups, specifically pregnant mothers in USA and children in Thailand (see Table 5). It is interesting to note that the ECIDs of the general populations of Europe and USA, as well as the baseline level in Sri Lankan and Vietnamese farmers and Thai children, at both the median (0.5 probability) and the high exposure (0.95 probability) levels (0.1 to 0.8 × 10³ ng/kg/day and 0.5 to 9.0 × 10³ ng/kg/day respectively) are similar with all values falling within a relatively narrow range. In these populations there is an absence of direct known sources of exposure.
The adults in USA would be expected to be exposed mainly from indoor environments treated for household pests and the diet [30,31] while with the Italian and German populations the exposure was believed to be through the diet [38,39] . None of the adults were known to have occupational or any other known exposure to the pesticide.
The Thai children were representative of children in agricultural and non- agricultural families [42]. It was assumed that the most common pathway of exposure was through the diet, which was suggested by the frequent detection of chlorpyrifos in food commodities [42]. However in the estimation of ECID in children, the common physiological parameters were used which were believed to be appropriate for the age group (average body weight and average daily creatinine excretion rate (Section 2.2).
The highest ECIDs, among the general populations which was not exposed directly, were observed in the USA pregnant mothers (see Table 5) which was 0.8 × 10³ ng/kg/day at the median level (0.5 probability) and 5.0 × 10³ ng/kg/day at the high exposure level (0.95 probability) (see Table 5 and Figure 3). Most of the mothers were believed to be mainly exposed from indoor usage of household pest control devices [34]. However the dietary and other pathways would also be expected [31]. Nevertheless the levels observed with the mothers are unusual.
Table 5. Equivalent Chlorpyrifos Ingested Doses (ECID) in General and Some Specific Population Groups.
Cumulative Probability LevelSri Lankan Farmer–Baseline (2000) a (ng/kg/day) (log Dose)USA General Population b (2001–2002) (ng/kg/day) (log Dose)European General Population c (ng/kg/day) (log Dose)USA Pregnant Mothers d (1998–2001) (ng/kg/day) (log Dose)Thai Children e (2009) (ng/kg/day) (log Dose)Vietnam Farmer–Baseline (2011) (ng/kg/ day) (log dose)
Italy (1997)Germany (2001)
0.500.3 × 103 (2.5)0.1 × 10³ (2.0)0.1 × 10³ (2.0)0.1 × 10³ (2.0)0.8 × 10³ (2.9)0.24 × 10³ (2.4)0.1 × 10³ (2.0)
0.951.6 × 103 (3.2)0.6 × 10³ (2.8)0.6 (2.8)0.5 (2.7)5.0 × 10³ (3.7)9.0 × 10³ (3.95)0.5 × 10³ (2.7)
a see Figure 5B; b see Figure 2B; c see Figure 4A (Italy) & Figure 4B (Germany); d see Figure 3B; e see Figure 5D.

5. Risk Characterisation using the Hazard Quotient (HQ)

5.1. Background

Guidelines have been developed by various bodies for the evaluation of the adverse health effects due to chlorpyrifos (Table 1). Since the USEPA Guideline Values (GVs) are the most comprehensive it was decided to use these in this investigation. These guidelines also give a common basis for the comparison of health risk in different situations and in different countries. There are included specific guidelines for different population groups (Table 1). Risk to health can be evaluated by calculation of the Hazard Quotient (Exposure Dose/Guideline Value) using the GVs. The guidelines are comprised of the Acute Reference Dose (ARfD) which is used for high level short term exposure in occupational and similar situations; the Chronic Reference Dose (CRfD), applicable to low level repeated exposure usually with nonoccupational situations; the Chronic Population Adjusted Dose (CPAD) for chronic exposure of sensitive populations (females of child bearing age, infants and children1). The GVs of ARfD, CRfD and CPAD as well as the ECID are all in units of ng/kg/day and represent the dose ingested in food and water per day (see Table 1).

5.2. Hazard Quotients (HQ) Calculated Using the US EPA Guideline Values (GVs)

The HQs of the nonoccupationally exposed populations were calculated at the 0.95 (HQ0.95) and 0.50 (HQ0.50) levels using the USEPA Chronic Reference Dose (CRfD). At the 0.50 level the populations of Sri Lankan, Vietnamese and Thai farmers as well as the general populations of USA, Italy and Germany had an acceptable risk with HQs of unity or less. A relatively low potential risk was observed at the 0.95 probability in the general populations of USA, Italy and Germany with HQ0.95 from 1.6 to 2.0. The Sri Lankan and Vietnamese farmers at baseline exposure had a higher risk with a HQ0.95 of 5.3 and 30.
The Hazard Quotients (HQ) of the occupationally exposed populations (Table 6) were calculated using the ECIDs at high exposure (0.95 probability, HQ0.95) and median exposure (0.50 probability levels, HQ0.50) using the Acute Reference Dose (ARfD) of the USEPA (Table 1). The HQs range between 0.2 to 3.9 for the median exposure group, while the high exposure group ranged from 1.7 to 42.0. The highest risk of potential adverse effects was observed with the high exposure group (0.95 probability) with the USA manufacturing workers with HQ0.95 of 42.0 and the Vietnamese farmers at HQ0.95 of 19.5. The Sri Lankan and Vietnamese farmers and the pest control applicators in USA and Australia were at a relatively lower risk at the median level (0.50 probability) with HQ0.50 of 1.3, 3.9, 2.4 and 1.5 respectively (Table 6). The USA farmers were at relatively low risk at the 0.95 probability level with a HQ0.95 of 1.7 (See Table 6) and a HQ0.50 of 0.4.
Table 6. Hazard Quotients (HQ) for occupationally exposed populations based on the ARfD a.
Cumulative ProbabilityHazard Quotients (HQ)Vietnamese farmer-Post Application b
Sri Lankan farmer-Post Application bUS farmer bUS pest control applicator cUS manufacturing worker cAustralian pest control applicator c
Low ExposureHigh Exposure
0.501.30.42.40.20.31.53.9
0.952.21.75.22.642.05.219.5
a see Table 1; b see ECID in Table 3; c see ECID in Table 4.
The HQs for the more sensitive population groups were calculated with the Chronic Population Adjusted Dose (CPAD) (Table 1) for pregnant females and children having repeated exposure. The USA mothers were at high risk having the highest HQ0.95 of 173 and a HQ0.50 of 26.6 both representing a high exposure. The Thai children have a comparatively lower risk having an HQ0.50 of 3.3 and a HQ0.95 of 16.6. It is interesting to contrast this result with that of children in Costa Rica who live in plantations where bags treated with chlorpyrifos are used to protect fruit. With more than half the children their estimated intake dose exceeded the CPAD and some also exceeded the ARfD and the CRfD [43]. In Jianjsu, China, a survey of urinary TCP in 2 year old children revealed that the TCP occurred in 70% of the children. The HQ0.75 was 2.5 suggesting a lower level of risk than the Thai children and the other groups mentioned above [44]. However the CPAD value would require the use of appropriate biological data to confirm the health risk represented by these HQs.

6. Conclusions

These results indicate that chlorpyrifos residues are widely distributed in the global human population. For example, the general population in the USA from 1988 to 2001 had detectable occurrence of residues in 82% to 89% of individuals. The general population in Germany in 2001 had detectable residues in the whole population and Italy, in 1997, in 88% of the population. This exposure is believed to result from pesticide treatment of crops and the resultant occurrence of residues in consumed food, rather than occupational exposure. It resulted in HQ50 values of less than unity and thus not considered to be a public health risk to the global population.
However, there are some specific population groups which have considerably higher exposure than the general population groups. For example, the ECID levels in pregnant mothers in USA during 1998 to 2001, at median exposure, were 26.6 times the exposure represented by the CPAD.
Also, high levels of risk, exceeding ARfD, were apparent in the high exposure group (0.95 level) with the occupationally exposed groups of manufacturing workers in 1999 to 2000 (HQ0.95 2.6 to 42.0) and the pest control applicators in Australia (1998 to 1999), and USA (2000 to 2001) (HQ0.95 5.2). Farmers had a high level of risk at the high exposure level (0.95 level) when the HQ was calculated using the ARfD. Those from Sri Lanka (2000) and Vietnam (2011), after a spraying application, had HQ0.95 at 2.2 and 19.5 respectively; Thailand (2006) at HQ0.95 of 15.3; and USA (2000 to 2001) at HQ0.95 of 1.7.
This review demonstrates that chlorpyrifos exposure often occurs in human populations in levels which exceed the guidelines recommended by the USEPA. Some of the exceedances, and the derived HQs, are relatively high and indicate the possibility of adverse effects in the human populations affected. However, it should be noted that management practices and other factors may have led to changes in exposure since these investigations were made.

Acknowledgments

The authors are grateful for financial support from AusAid and additional funding for research higher degree students provided by Griffith University School of Environment.

Author Contributions

This research was carried out while JM was a M.Phil. candidate at Griffith University with QY and DC as supervisors. JM carried out the work with the supervisors guidance while QY and DC prepared it for publication.

Conflicts of Interest

The authors have no conflict of interest.

References

  1. USEPA. 2000; Chlorpyrifos; Human Health Risk Assessment, Health Effects Division (7509C), Office of Pesticide Programs, U.S. Environmental Protection Agency: Washington, DC, USA.
  2. Aponso, G.L.M.; Manuweera, G.K. Exposure and risk assessment for farmers occupationally exposed to chlorpyrifos. Ann. Sri. Lanka Dep. Agric. 2002, 4, 233–244. [Google Scholar]
  3. Ecobichon, D.J. Organophosphorus Ester Insecticides. In Pesticides and Neurological Diseases; Ecobichon, D.J., Joy, R.M., Eds.; CRC Press: Boca Raton, FL, USA, 1982; pp. 171–250. [Google Scholar]
  4. Garabrant, D.H.; Aylward, L.L.; Berent, S.; Chen, Q.; Timchalk, C.; Burns, C.J.; Hays, S.M.; Albers, J.W. Cholinesterase inhibition in chlorpyrifos workers: Characterization of biomarkers of exposure and response in relation to urinary TCPy. J. Expo. Environ. Epidemiol. 2008, 19, 634–642. [Google Scholar]
  5. Dyro, M. Organophosphates. Neurology, eMedicine. 2006. Available online: http://emedicine.medscape.com (accessed on 18 October 2008).
  6. Lotti, M. Treatment of acute organophosphate poisoning. Med. J. Aust. 1991, 154, 51–55. [Google Scholar]
  7. De Alwis, L.B.L.; Salgado, M.S.L. Agrochemical Poisoning in Sri Lanka. In Pesticides in Sri Lanka: Documentation of Selected Literature and Legal Aspects; Fernando, R., Ed.; Friedrich-Ebert-Stiftung: Berlin, Germany, 1989; pp. 281–304. [Google Scholar]
  8. Jeyaratnam, J. Acute pesticide poisoning: A major global health problem. World Health Stat. Q 1990, 43, 139–144. [Google Scholar]
  9. Sivayoganathan, C.; Gnanachandran, S.; Lewis, J.; Fernando, M. Protective measure use and symptoms among agro pesticide applicators in Sri Lanka. Soc. Sci. Med. 1995, 40, 431–436. [Google Scholar] [CrossRef]
  10. Van Der Hoek, W.; Konradsen, F.; Athukorala, K.; Wanigadewa, T. Pesticide poisoning: A major health problem in Sri Lanka. Soc. Sci. Med. 1998, 46, 495–504. [Google Scholar]
  11. Smit, L.A.M.; Van-Wendel-De-Joode, B.N.; Heederik, D.; Peiris-John, R.J.; Van Der Hoek, W. Neurological symptoms among Sri Lankan farmers occupationally exposed to acetyl cholinesterase-Inhibiting Insecticides. Am. J. Ind. Med. 2003, 44, 254–264. [Google Scholar] [CrossRef]
  12. Phung, D.T.; Connell, D.; Miller, G.; Hodge, M.; Patel, R.; Cheng, R.; Abeyewardene, M.; Chu, C. Biological monitoring of chlorpyrifos exposure to rice farmers in Vietnam. Chemosphere 2012, 87, 294–300. [Google Scholar] [CrossRef]
  13. Phung, D.T.; Connell, D.; Miller, G.; Chu, C. Probabilistic assessment of chlorpyrifos exposure to rice farmers in Viet Nam. J. Expo. Sci. Environ. Epidemiol. 2012, 22, 417–423. [Google Scholar] [CrossRef]
  14. Phung, D.T.; Connell, D.; Yu, Q.J.; Chu, C. Health risk characterization of chlorpyrifos using epidemiological dose-response data and probabilistic techniques: A case study with rice farmers in Vietnam. Risk Anal. 2013, 33, 1596–1607. [Google Scholar] [CrossRef]
  15. Yu, Q.J.; Cao, Q.; Connell, D.W. An overall risk probability-based method for quantification of synergistic and antagonistic effects in health risk assessment for mixtures: Theoretical concepts. Environ. Sci. Pollut. Res. 2012, 19, 2627–2633. [Google Scholar] [CrossRef]
  16. Giesy, J.P.; Solomon, K.R.; Coates, J.R.; Dixon, K.R.; Giddings, J.M.; Kenaga, E.E. Chlorpyrifos: Ecological risk assessment in North American aquatic environments. Rev. Environ. Contam. Toxicol. 1999, 160, 1–129. [Google Scholar]
  17. Eaton, D.L.; Daroff, R.B.; Autrup, H.; Bridges, J.; Buffer, P.; Costa, L.G.; Coyle, J.; Mckhann, G.; Mobley, W.C.; Nadel, L.; et al. Review of the toxicology of chlorpyrifos with an emphases on human exposure and neurodevelopment. Crit. Rev. Toxocol. 2008, S2, 1–125. [Google Scholar]
  18. CDC. Third National Report on Human Exposure to Environmental Chemicals; Department of Health and Human Services, Centers for Disease Control and Prevention: Atlanta, GA, USA, 2005.
  19. Cole, T.B.; Fisher, J.C.; Burbacher, T.M.; Costa, L.G.; Furlong, C.E. Neurobehavioral assessment of mice following repeated postnatal exposure to chlorpyrifos oxon. Neurotoxicol. Teratol. 2012, 34, 311–322. [Google Scholar] [CrossRef]
  20. Price, P.S.; Schnelle, K.D.; Cleveland, C.B.; Bartels, B.J.; Hinderliter, P.M.; Timchalk, C.; Poet, T.S. Application of a source-to-outcome model for the assessment of health impacts from dietary exposures to insecticide residues. Regul. Toxicol. Pharmacol. 2011, 61, 23–33. [Google Scholar]
  21. Mage, D.T.; Allen, R.H.; Kodali, A. Creatinine corrections for estimating children’s and adult’s pesticide intake doses in equilibrium with urinary pesticide and creatinine concentrations. J. Expo. Sci. Environ. Epidemiol. 2008, 18, 360–368. [Google Scholar] [CrossRef]
  22. Mage, D.T.; Allen, R.H.; Gondy, G.; Smith, W.; Barr, D.B.; Needham, L.L. Estimating pesticide dose from urinary pesticide concentration data by creatinine correction in the third National Health and Nutrition Examination Survey (NHANES-III). J. Expo. Anal. Environ. Epidemiol. 2004, 14, 457–465. [Google Scholar] [CrossRef]
  23. Nolan, R.J.; Rick, D.L.; Freshour, N.L.; Saunders, J.H. Chlorpyrifos: Pharmacokinetics in human volunteers. Toxicol. Appl. Pharmacol. 1984, 73, 8–15. [Google Scholar] [CrossRef]
  24. Attfield, K.R.; Hughes, M.D.; Spengler, J.D.; Chensheng, L. Within- and between-child Variation in repeated urinary pesticide metabolite measurements over a 1-year period. Environ. Health Perspect. 2014, 122, 201–206. [Google Scholar]
  25. Saieva, C.; Aprea, C.; Tumino, R.; Masala, G.; Salvini, S.; Frasca, G.; Giurdanella, M.C.; Zanna, I.; Decarli, A.; Sciarra, G.; Palli, D. Twenty four hour urinary excretion of ten pesticide metabolites in healthy adults in two different areas of Italy (Florence and Ragusa). Sci. Total Environ. 2004, 332, 71–80. [Google Scholar] [CrossRef]
  26. Scher, D.P.; Sawchuk, R.J.; Alexander, B.H.; Adgate, J.L. Estimating Absorbed Dose of pesticides in a field setting using biomonitoring data and pharmacokinetic models. J. Toxicol. Environ. Health A 2008, 71, 373–383. [Google Scholar] [CrossRef]
  27. Joint FAO/WHO Meeting on Pesticide Residues (JMPR). Chlopyrifos. In Pesticide Residues in Food-1999 Evaluations 1999 Part II—Toxicological WHO/PCS/00.4; International Programme on Chemical Safety, World Health Organization: Genava, Switzerland, 1999. [Google Scholar]
  28. Australian Department of Health and Aging. ADI List: Acceptable Daily Intakes for Agricultural and Veterinary Chemicals; Australian Government, Office of Chemical Safety, Department of Health and Ageing: Canberra, Australia, 2008.
  29. USEPA. Chlorpyrifos Preliminary Human Health Risk Assessment for Registration Review; Office of Chemical Safety and Pollution Prevention, DP No. D388070; U.S. Environmental Protection Agency: Washington, DC, USA, 2011.
  30. Hill, R.H., Jr.; Head, S.L.; Baker, S.; Gregg, M.; Shealy, D.B.; Bailey, S.L.; Williams, C.C.; Sampson, E.J.; Needham, L.L. Pesticide residues in urine of adults living in the United States: Reference range concentrations. Environ. Res. 1995, 71, 99–108. [Google Scholar] [CrossRef]
  31. Barr, D.B.; Allen, R.; Olsson, A.O.; Bravo, R.; Caltabiano, L.M.; Montesano, A.; Nguyen, J.; Udunka, S.; Walden, D.; Walker, R.D.; et al. Concentrations of selective metabolites of organophosphorous pesticides in the United States population. Environ. Res. 2005, 99, 314–326. [Google Scholar]
  32. Hines, C.; Deddens, J.A. Determinants of chlorpyrifos exposures and urinary 3,5,6-trichloro-2-pyridinol levels among termiticide applicators. Ann. Occup. Hyg. 2001, 45, 309–321. [Google Scholar]
  33. USEPA. Inrerim Reregristration Eligibility for Chlorpyrifos; United States Environmental Protection Agency: Washington, DC, USA, 2002.
  34. Berkowitz, G.S.; Obel, J.; Deych, E.; Lapinsid, R.; Godbold, J.; Liu, Z.; Landrigan, P.J.; Wolf, M.S. Exposure to indoor pesticides during pregnancy in a multiethnic, urban cohort. Environ. Health Perspect. 2003, 111, 79–84. [Google Scholar]
  35. Morgan, M.K.; Sheldon, L.S.; Croghan, C.W.; Jones, P.A.; Robertson, G.L.; Chuang, J.C.; Wilson, N.K.; Lyu, C.W. Exposure of preschool children to chlorpyrifos an its degradation. J. Expo. Anal. Environ. Epidemiol. 2005, 15, 297–309. [Google Scholar] [CrossRef]
  36. Morgan, M.K.; Sheldon, L.S.; Jones, P.A.; Croghan, C.W.; Chuang, J.C.; Wilson, N.K. The reliability of using urinary biomarkers to estimate children’s exposure to chlorpyrifos and diazinon. J. Expo. Sci. Environ. Epidemiol. 2011, 21, 280–290. [Google Scholar] [CrossRef]
  37. Rauh, V.; Arunajadai, S.; Horton, M.; Perera, F.; Hoepner, L.; Barr, D.B.; Wyatt, R. 7-Year neurodevelopmental scores and prenatal exposure to chlorpyrifos, a common agricultural pesticide. Environ. Health Perspect. 2011, 119, 1196–1201. [Google Scholar] [CrossRef]
  38. Aprea, C.; Betta, A.; Catenacci, G.; Lotti, A.; Magnaghi, S.; Barisano, A.; Passini, V.; Pavan, I.; Sciarra, G.; Vitalone, V.; Minola, C. Referene values of urinary 3,5,6-trichloro-2 pyridinol in the Italian population-validation of analytical method and preliminary results (multientric study). J. AOAC Int. 1999, 82, 305–312. [Google Scholar]
  39. Koch, M.; Hardt, J.; Angrer, J. Biological monitoring of exposure of the general population to the organophosphorus pesticides chlorpyrifos and chlorpyrifosmethyl by determination of their specific metabolite 3,5,6-trichloro-2-pyridinol. Int. J. Hyg. Environ. Health 2001, 204, 175–180. [Google Scholar] [CrossRef]
  40. Cattani, M. Exposure and Health Effects among Field Workers Using the Organophosphate Chlorpyrifos. Ph.D. Thesis, School of Environmental Science, Murdoch University, Perth, Western Australia, 2004. [Google Scholar]
  41. Panuwet, P.; Prapamontol, T.; Chantara, S.; Thavornyuthikarn, P.; Montesano, M.A.; Whitehead, R.D., Jr.; Barr, D.B. Concentrations of urinary pesticide metabolites in small-scale farmers in Chiang Mai Province, Thailand. Sci. Total Environ. 2008, 407, 655–668. [Google Scholar]
  42. Panuwet, P.; Prapamontol, T.; Chantara, S.; Barr, D.B. Urinary pesticides metabolites in school students from northern Thailand. Int. J. Hyg. Environ. Health 2009, 212, 288–297. [Google Scholar] [CrossRef]
  43. Van Wendelde Joode, B.; Barraza, D.; Ruepert, C.; Mora, A.M.; Cordoba, L.; Oberg, M.; Wesseling, C.; Mergler, D.; Lindh, C.H. Indigenous children living nearby plantations with chlorpyrifos-treated bags have elevated 3,5,6-trichloro-2-pyridinol (TCPy) urinary concentrations. Environ. Res. 2012, 117, 17–26. [Google Scholar] [CrossRef]
  44. Liu, P.; Wu, C.-H.; Chang, X.-L.; Qi, X.-J.; Zheng, M.-L.; Zhou, Z.-J. Assessment of chlorpyrifos exposure and absorbed daily doses among infants living in an agricultural area of the Province of Jiangsu, China. Int. Arch. Occup. Environ. Health 2013. [Google Scholar] [CrossRef]

