Carbonate Apatite Nanoparticles-Facilitated Intracellular Delivery of siRNA(s) Targeting Calcium Ion Channels Efficiently Kills Breast Cancer Cells

 ,
,  and
and
Abstract
:1. Introduction
2. Materials and Methods
2.1. Reagents
2.2. Design and Reconstitution of siRNAs
2.3. Preparation of CA NPs
2.4. Preparation of siRNA-Bound CA NPs
2.5. Measurement of Particle Size of NPs
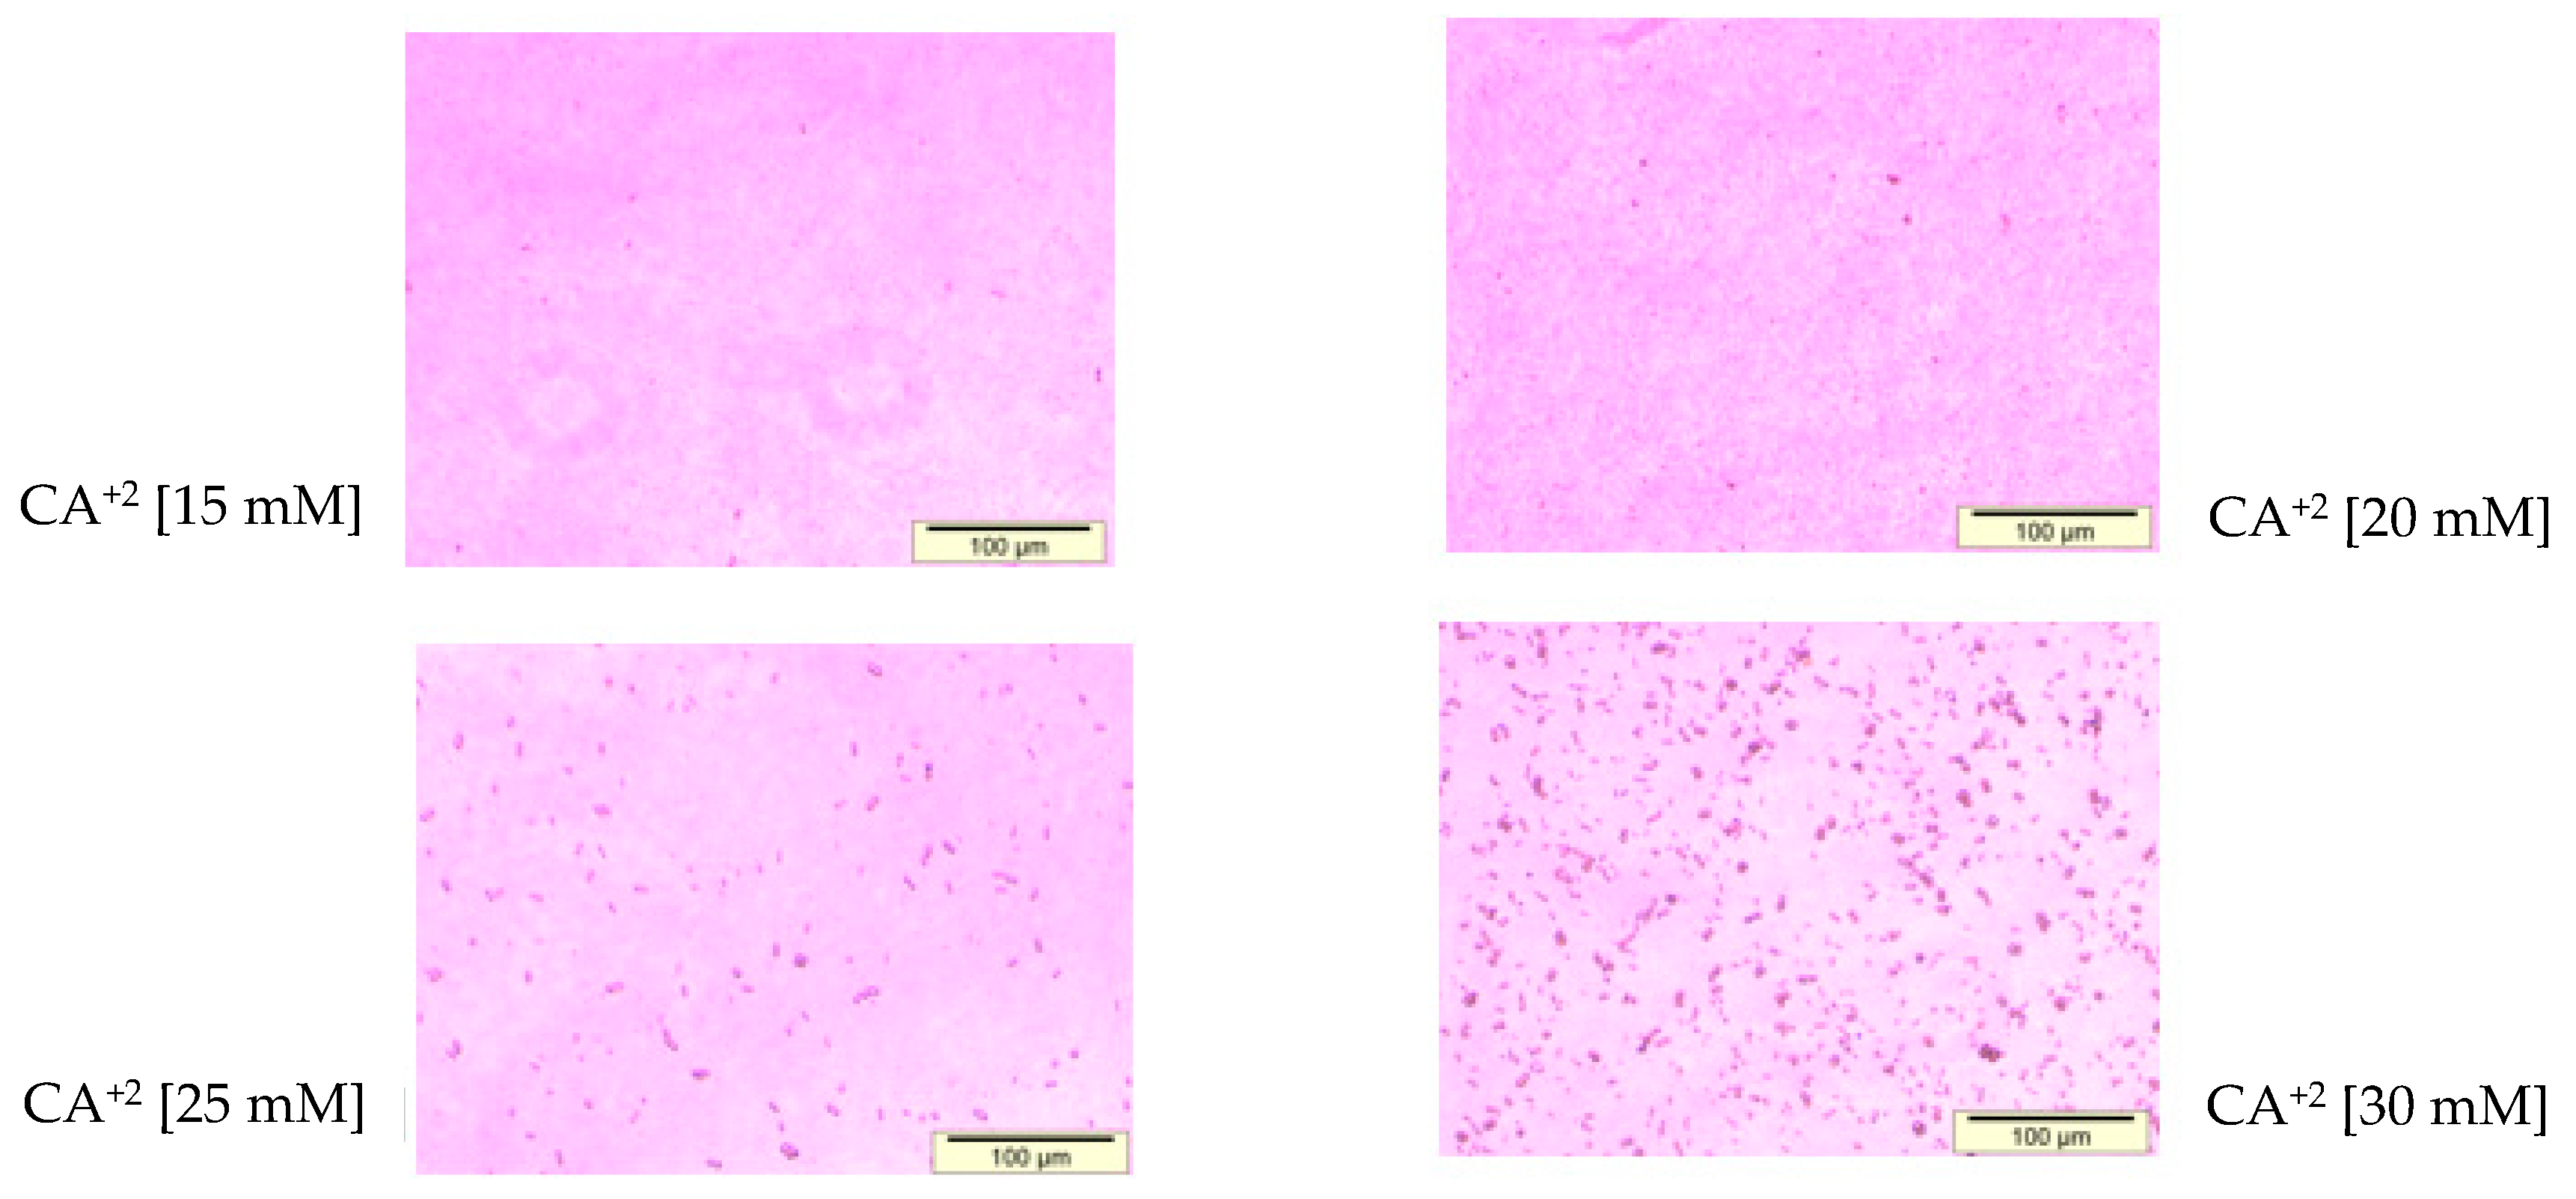
2.6. Microscopic Observation of Aggregated and Nano-Sized Particles
2.7. Cell Culture and Seeding
2.8. Binding Affinity of siRNA towards CA NPs
2.9. Cellular Uptake of Fluorescence-Labeled siRNA Carried by CAs
2.10. Cell Viability Assessment with 3-(4,5-Dimethylthiazol-2-yl)-2,5-diphenyltetrazolium Bromide (MTT) Assay
2.11. Western Blot Analysis
2.12. Data Analysis
2.13. Statistical Analysis
3. Results and Discussion
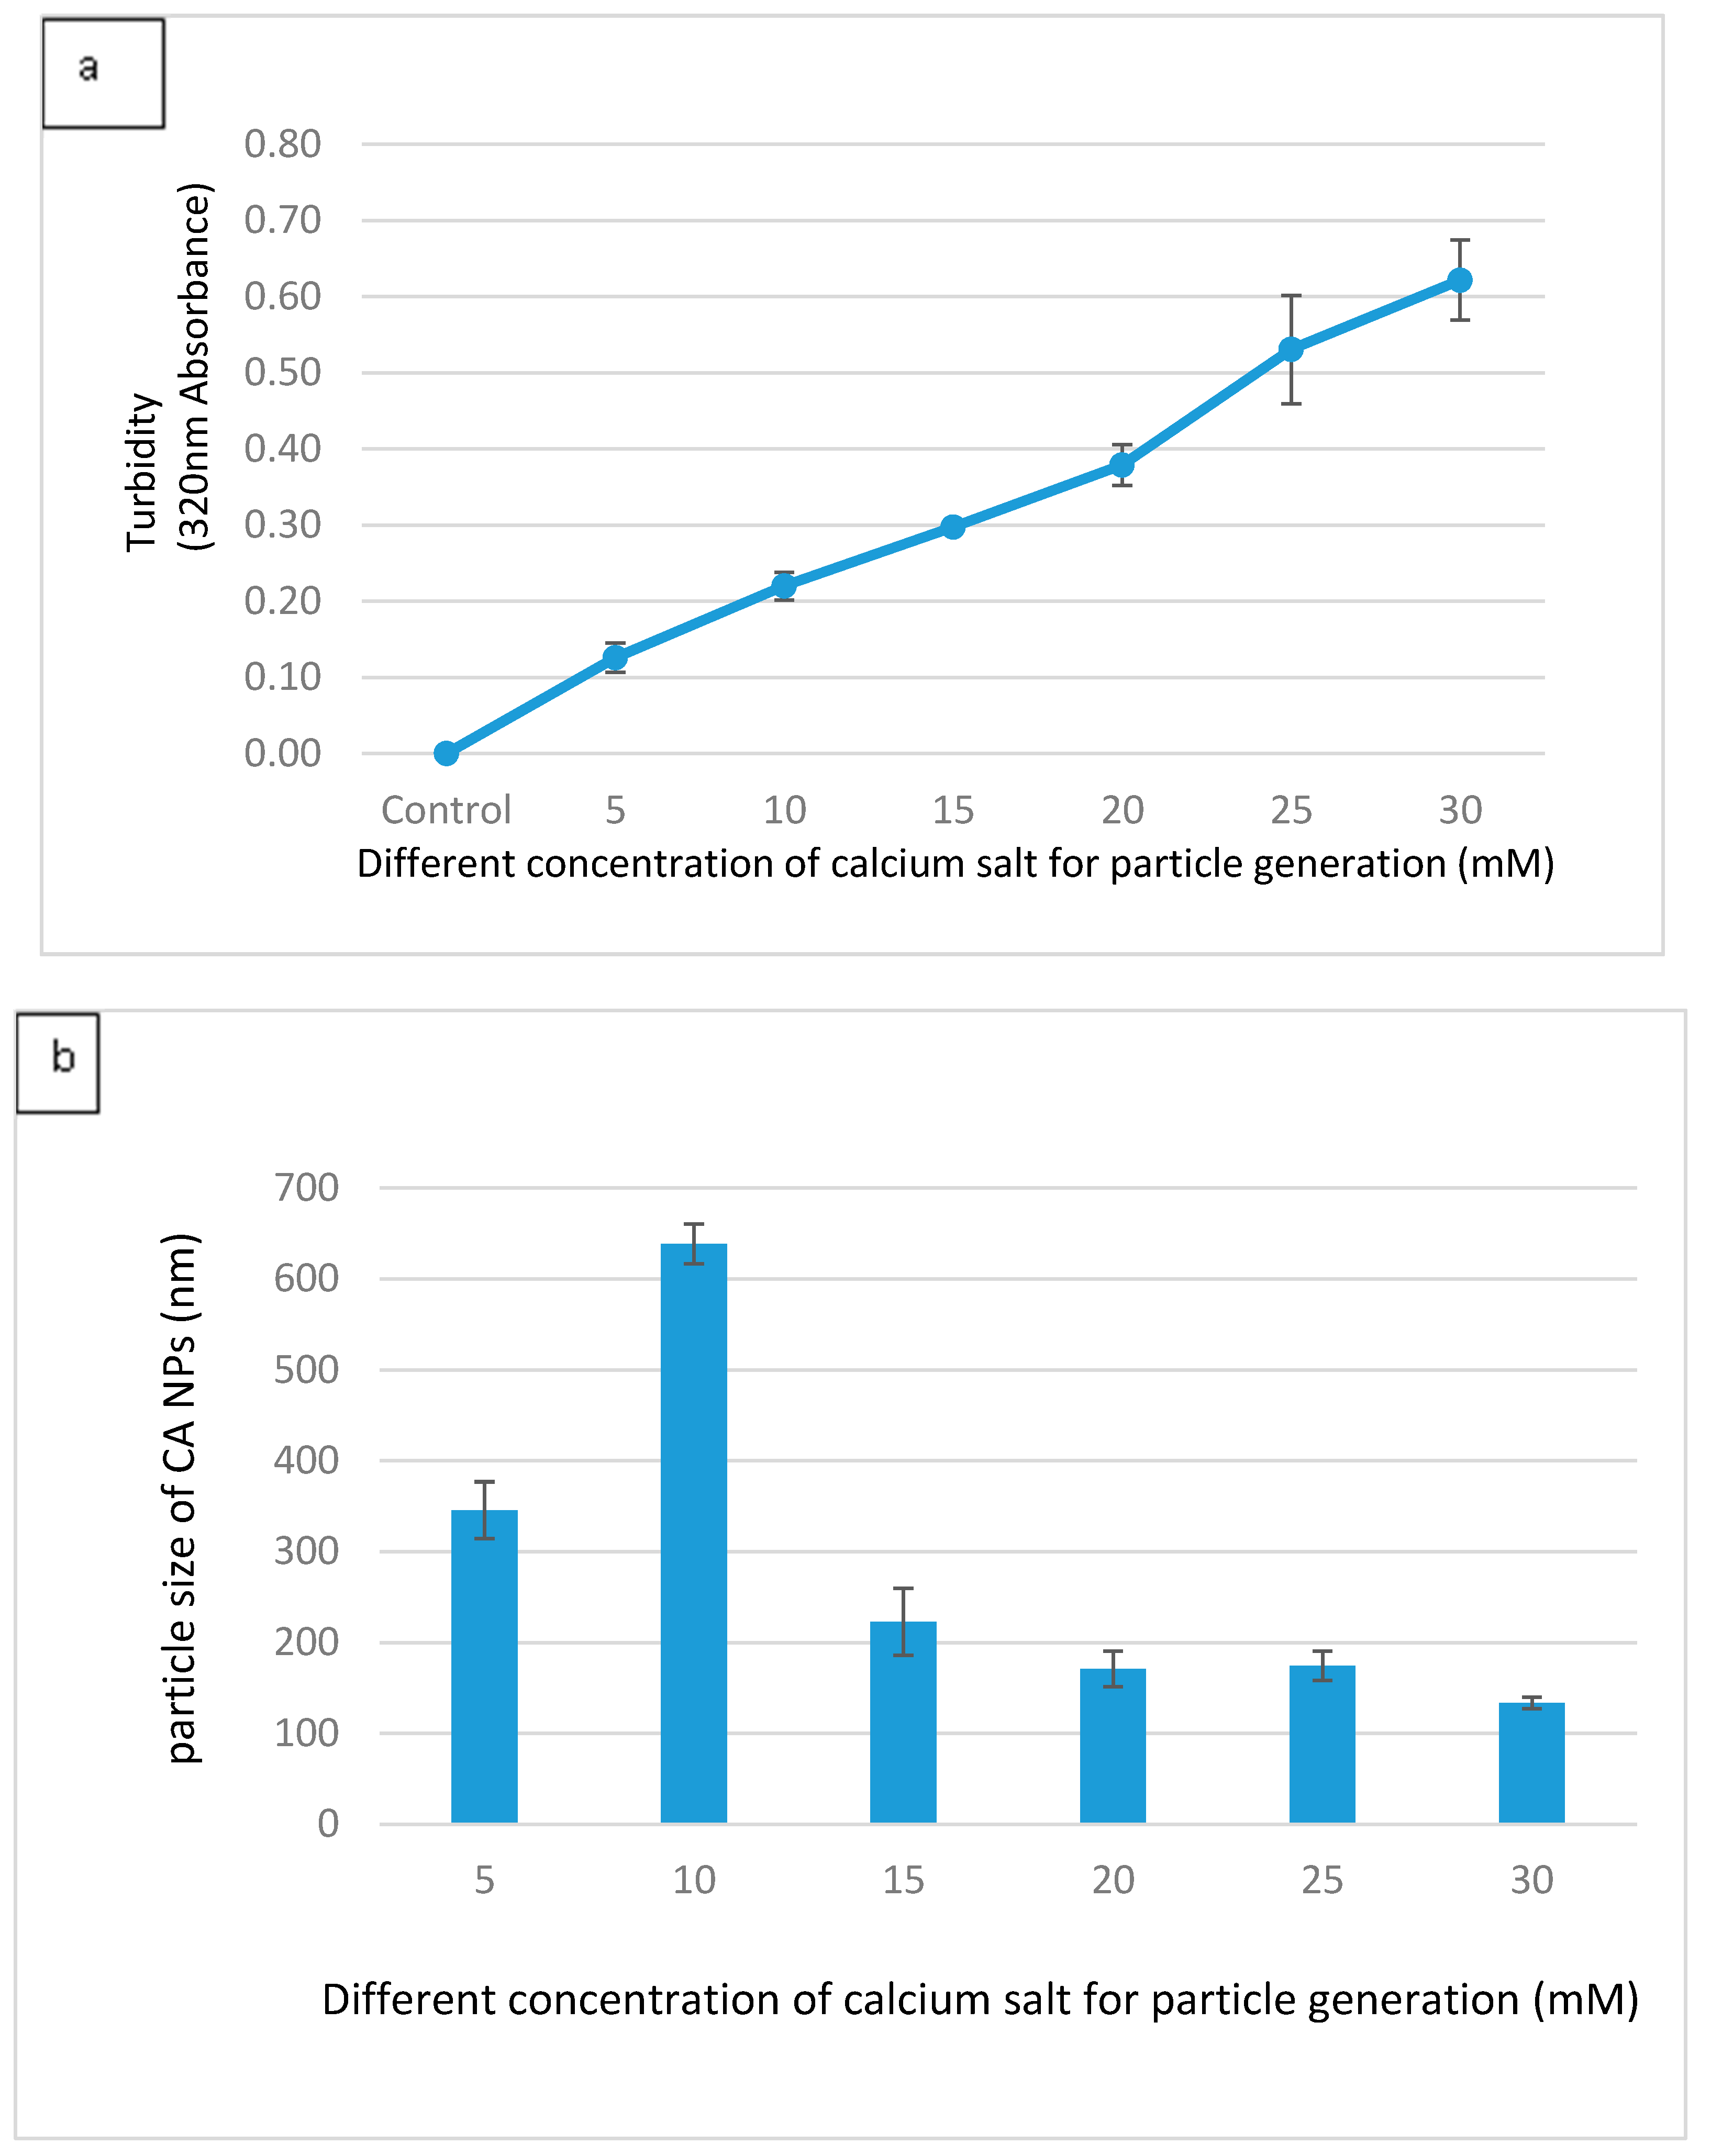
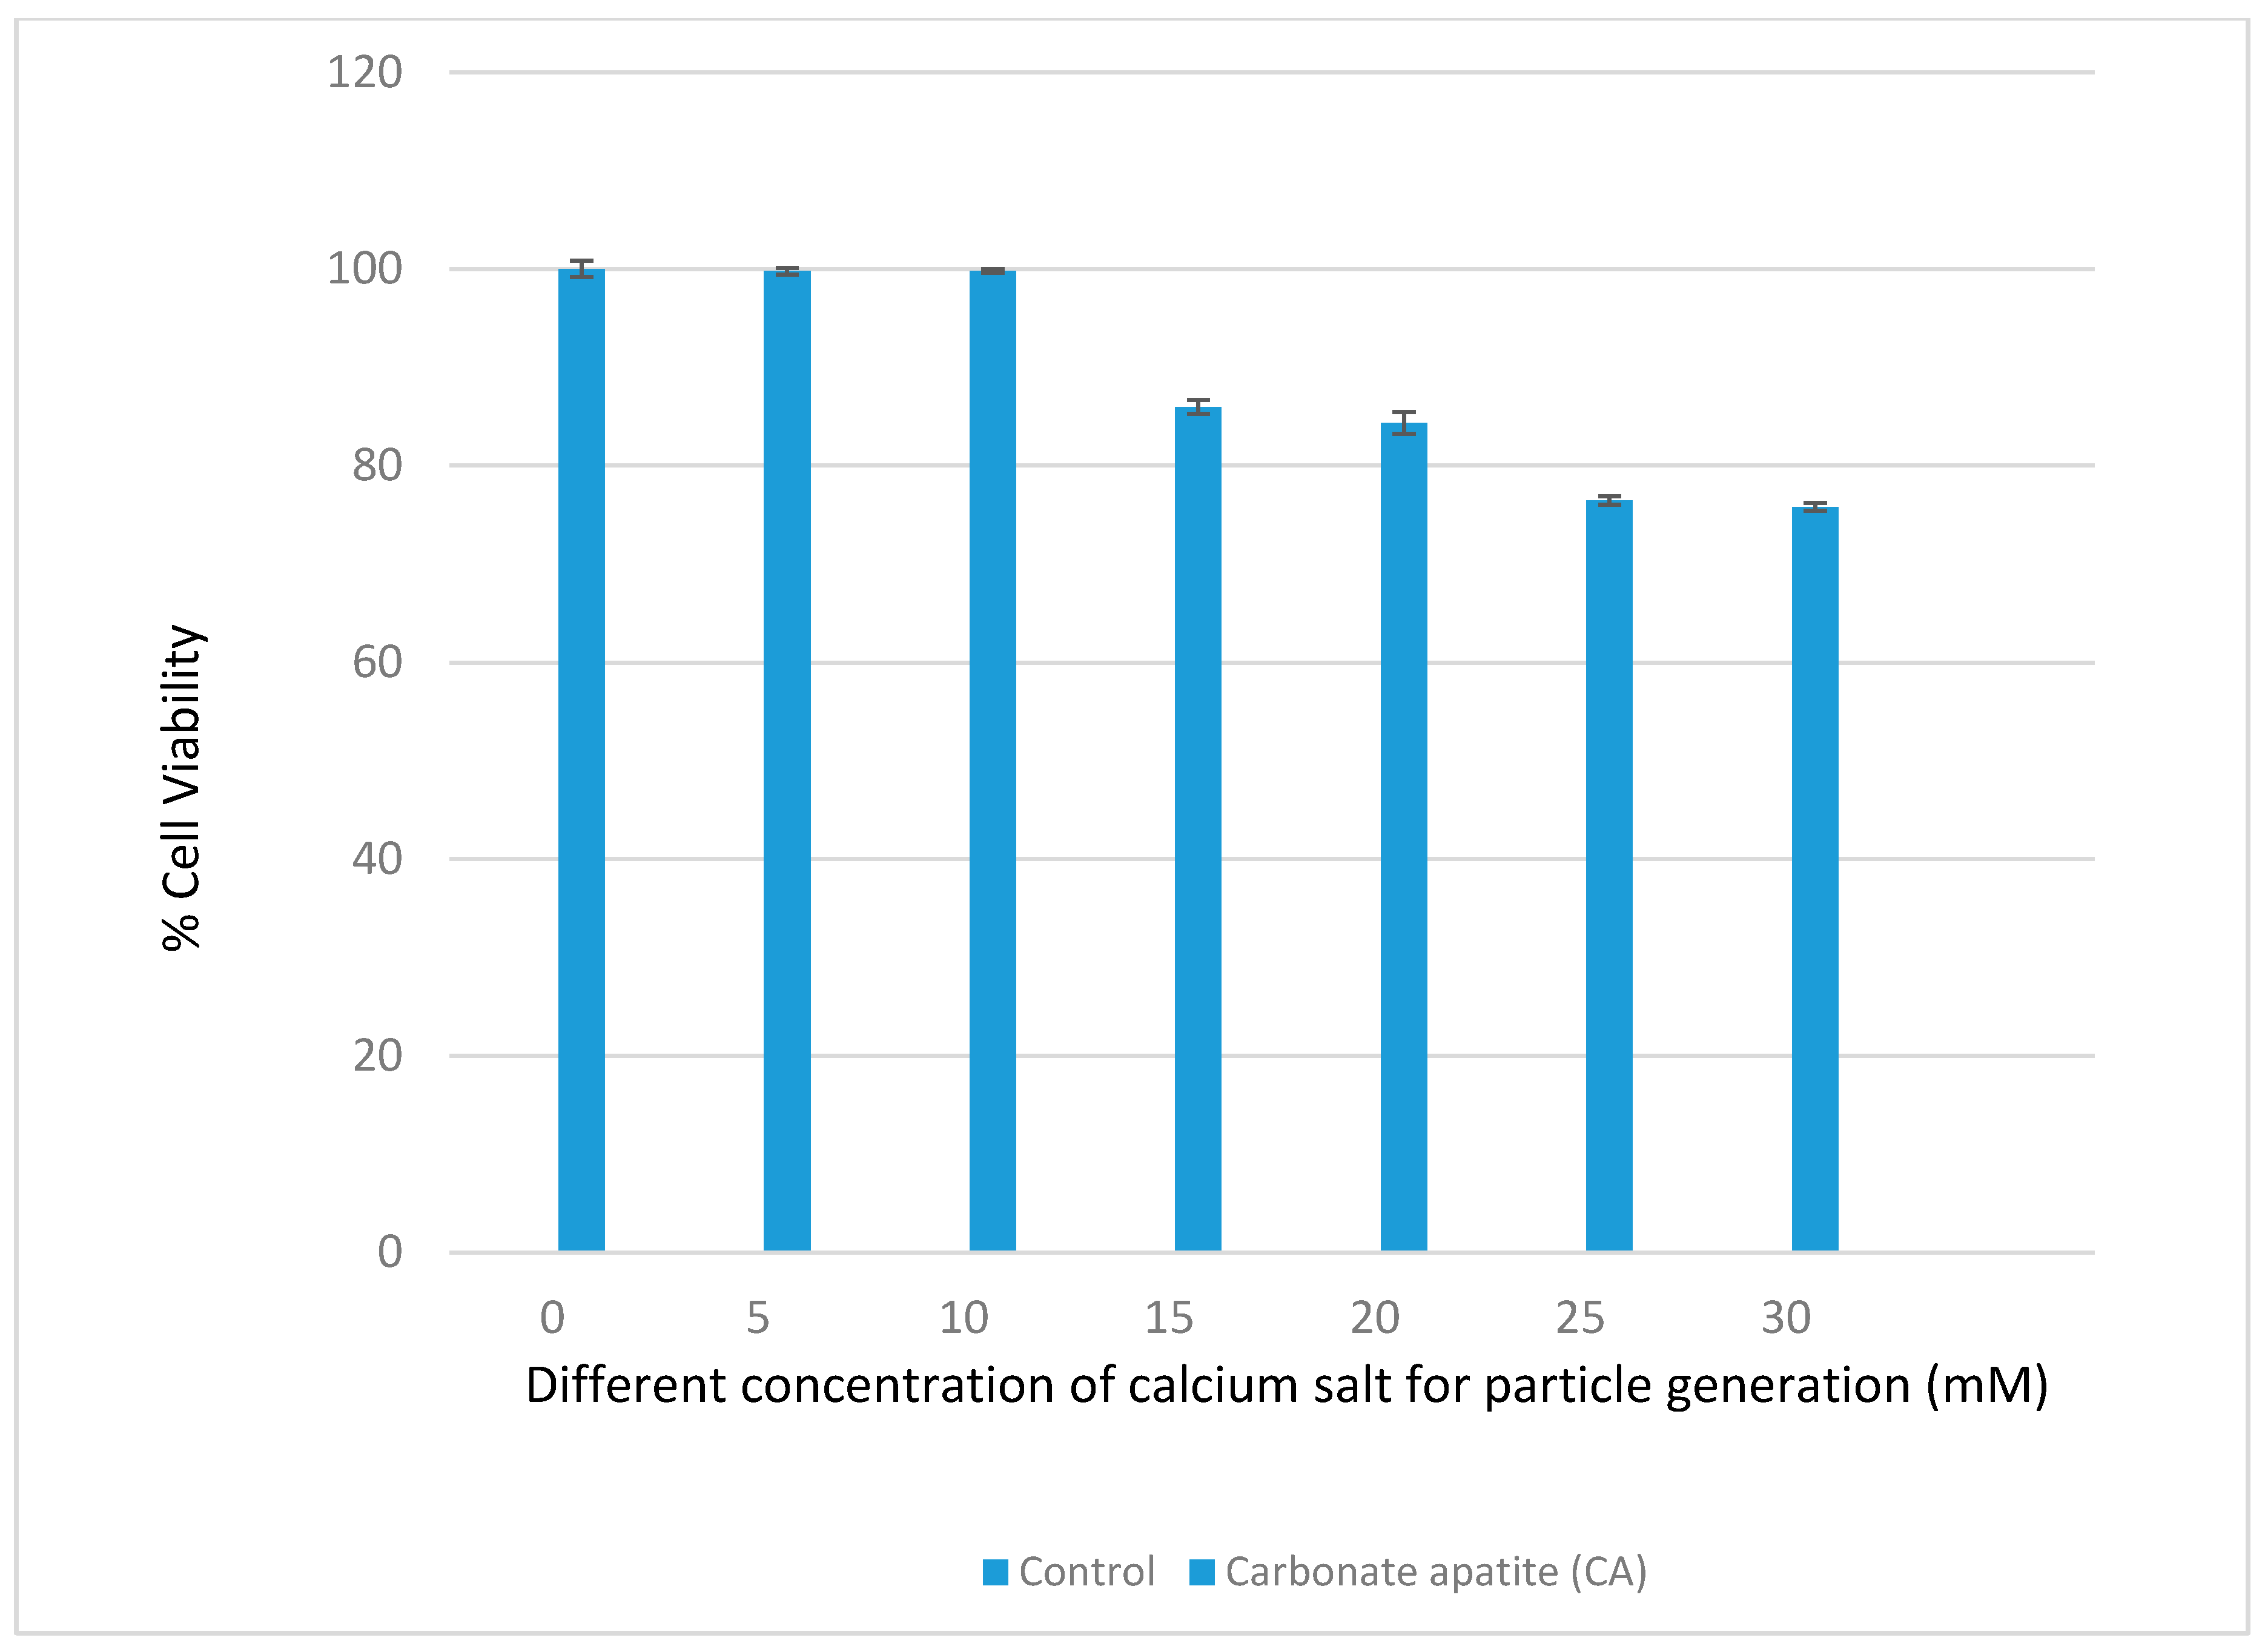
3.1. Optimization of CA NPs Based on Turbidity, Particle Size, and Cytotoxicity Profiling
3.2. Binding Efficiency of Fluorescence-Labeled siRNA-CAs Complex
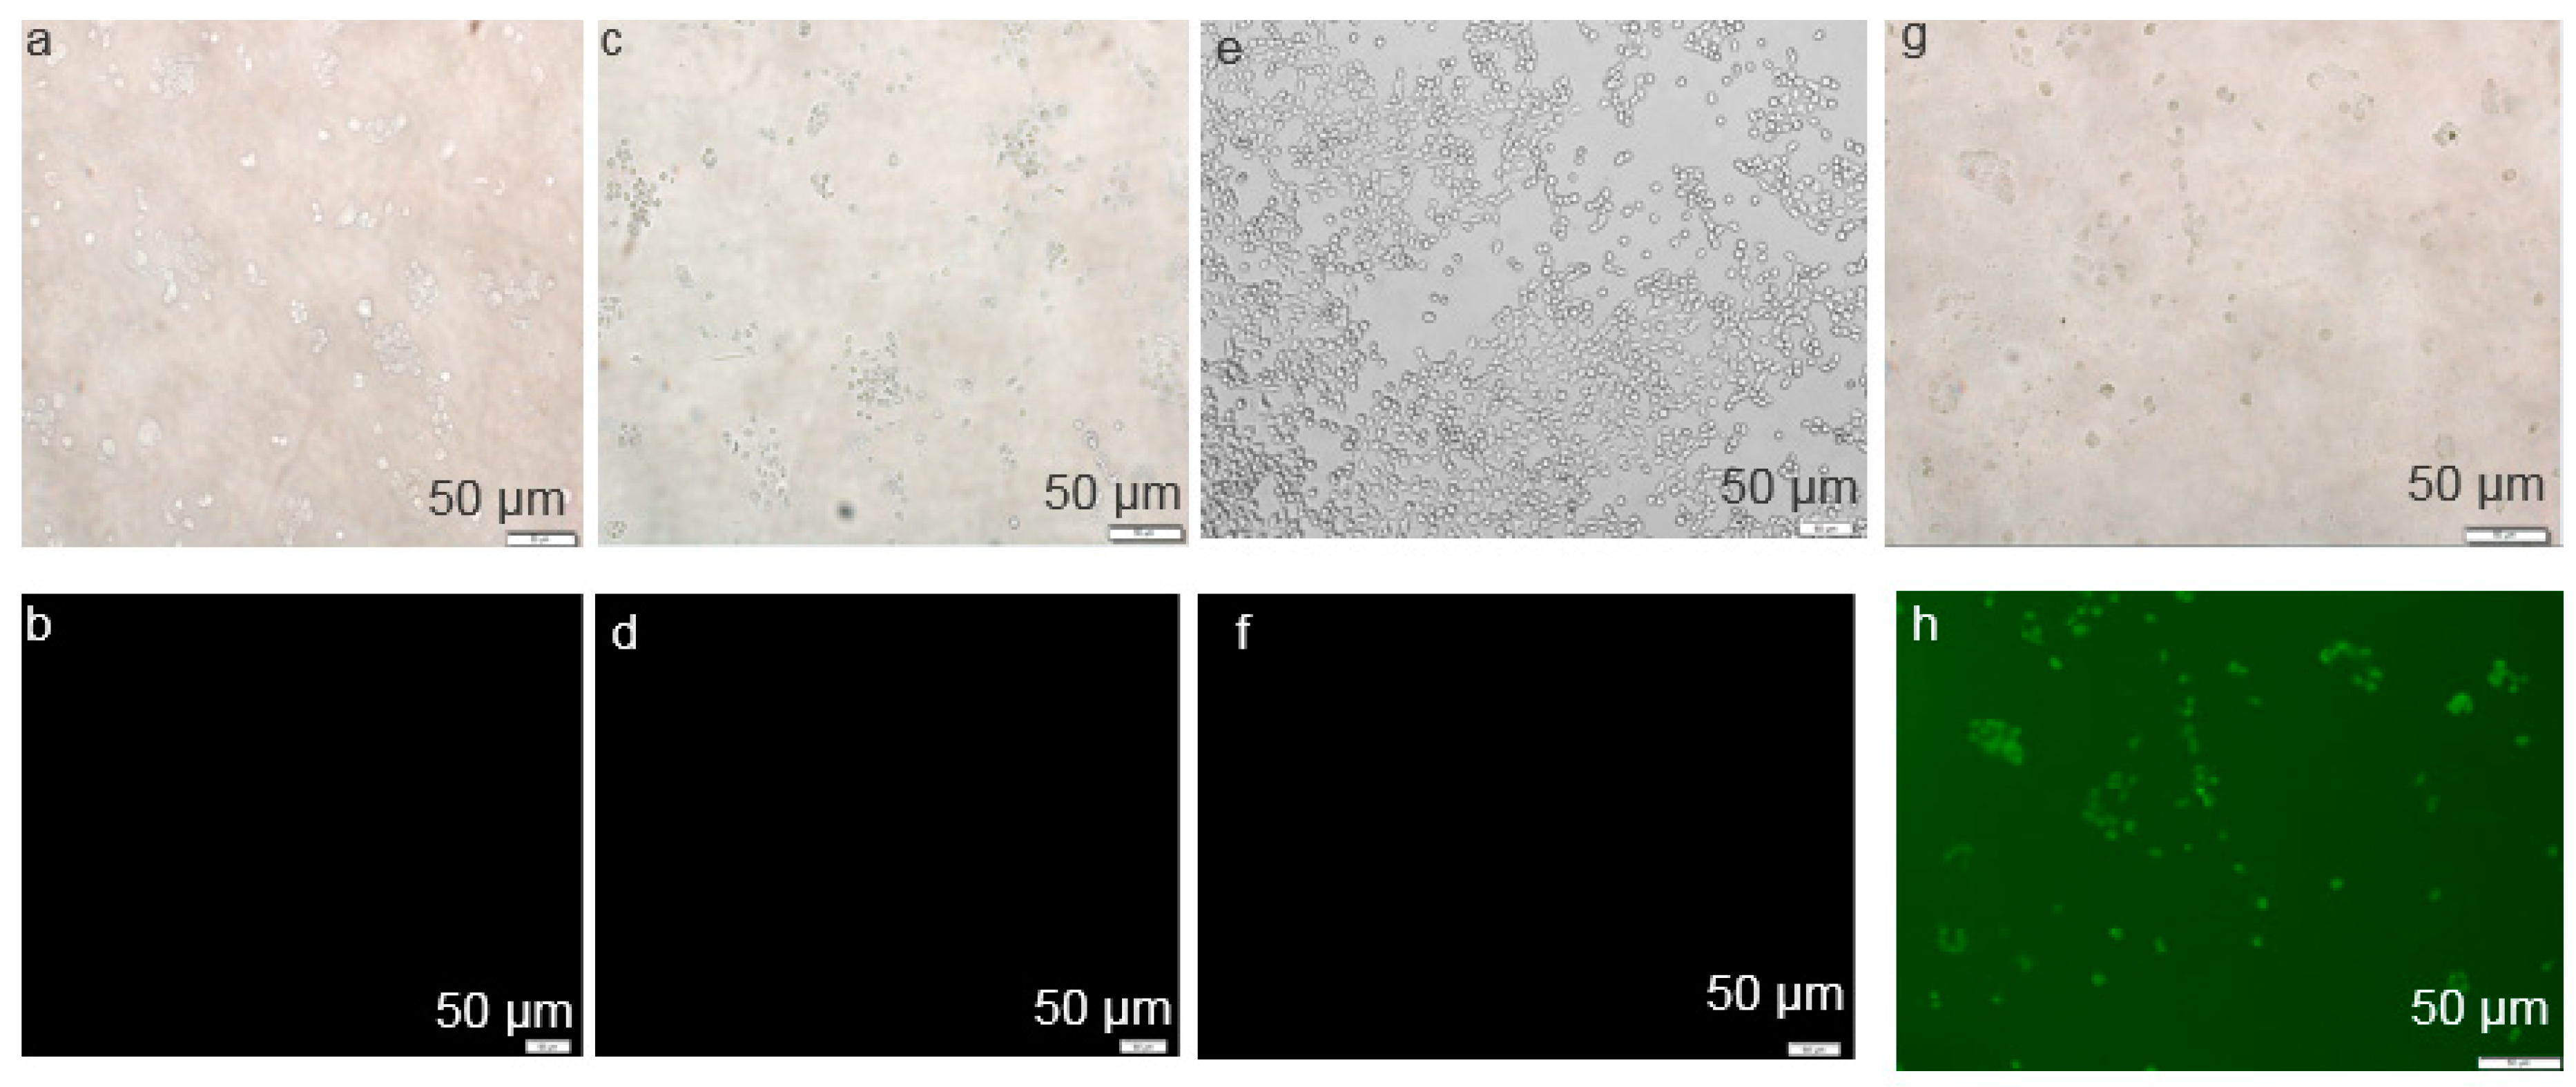
3.3. Cellular Uptake Study of CA NPs by Fluorescence Microscopy
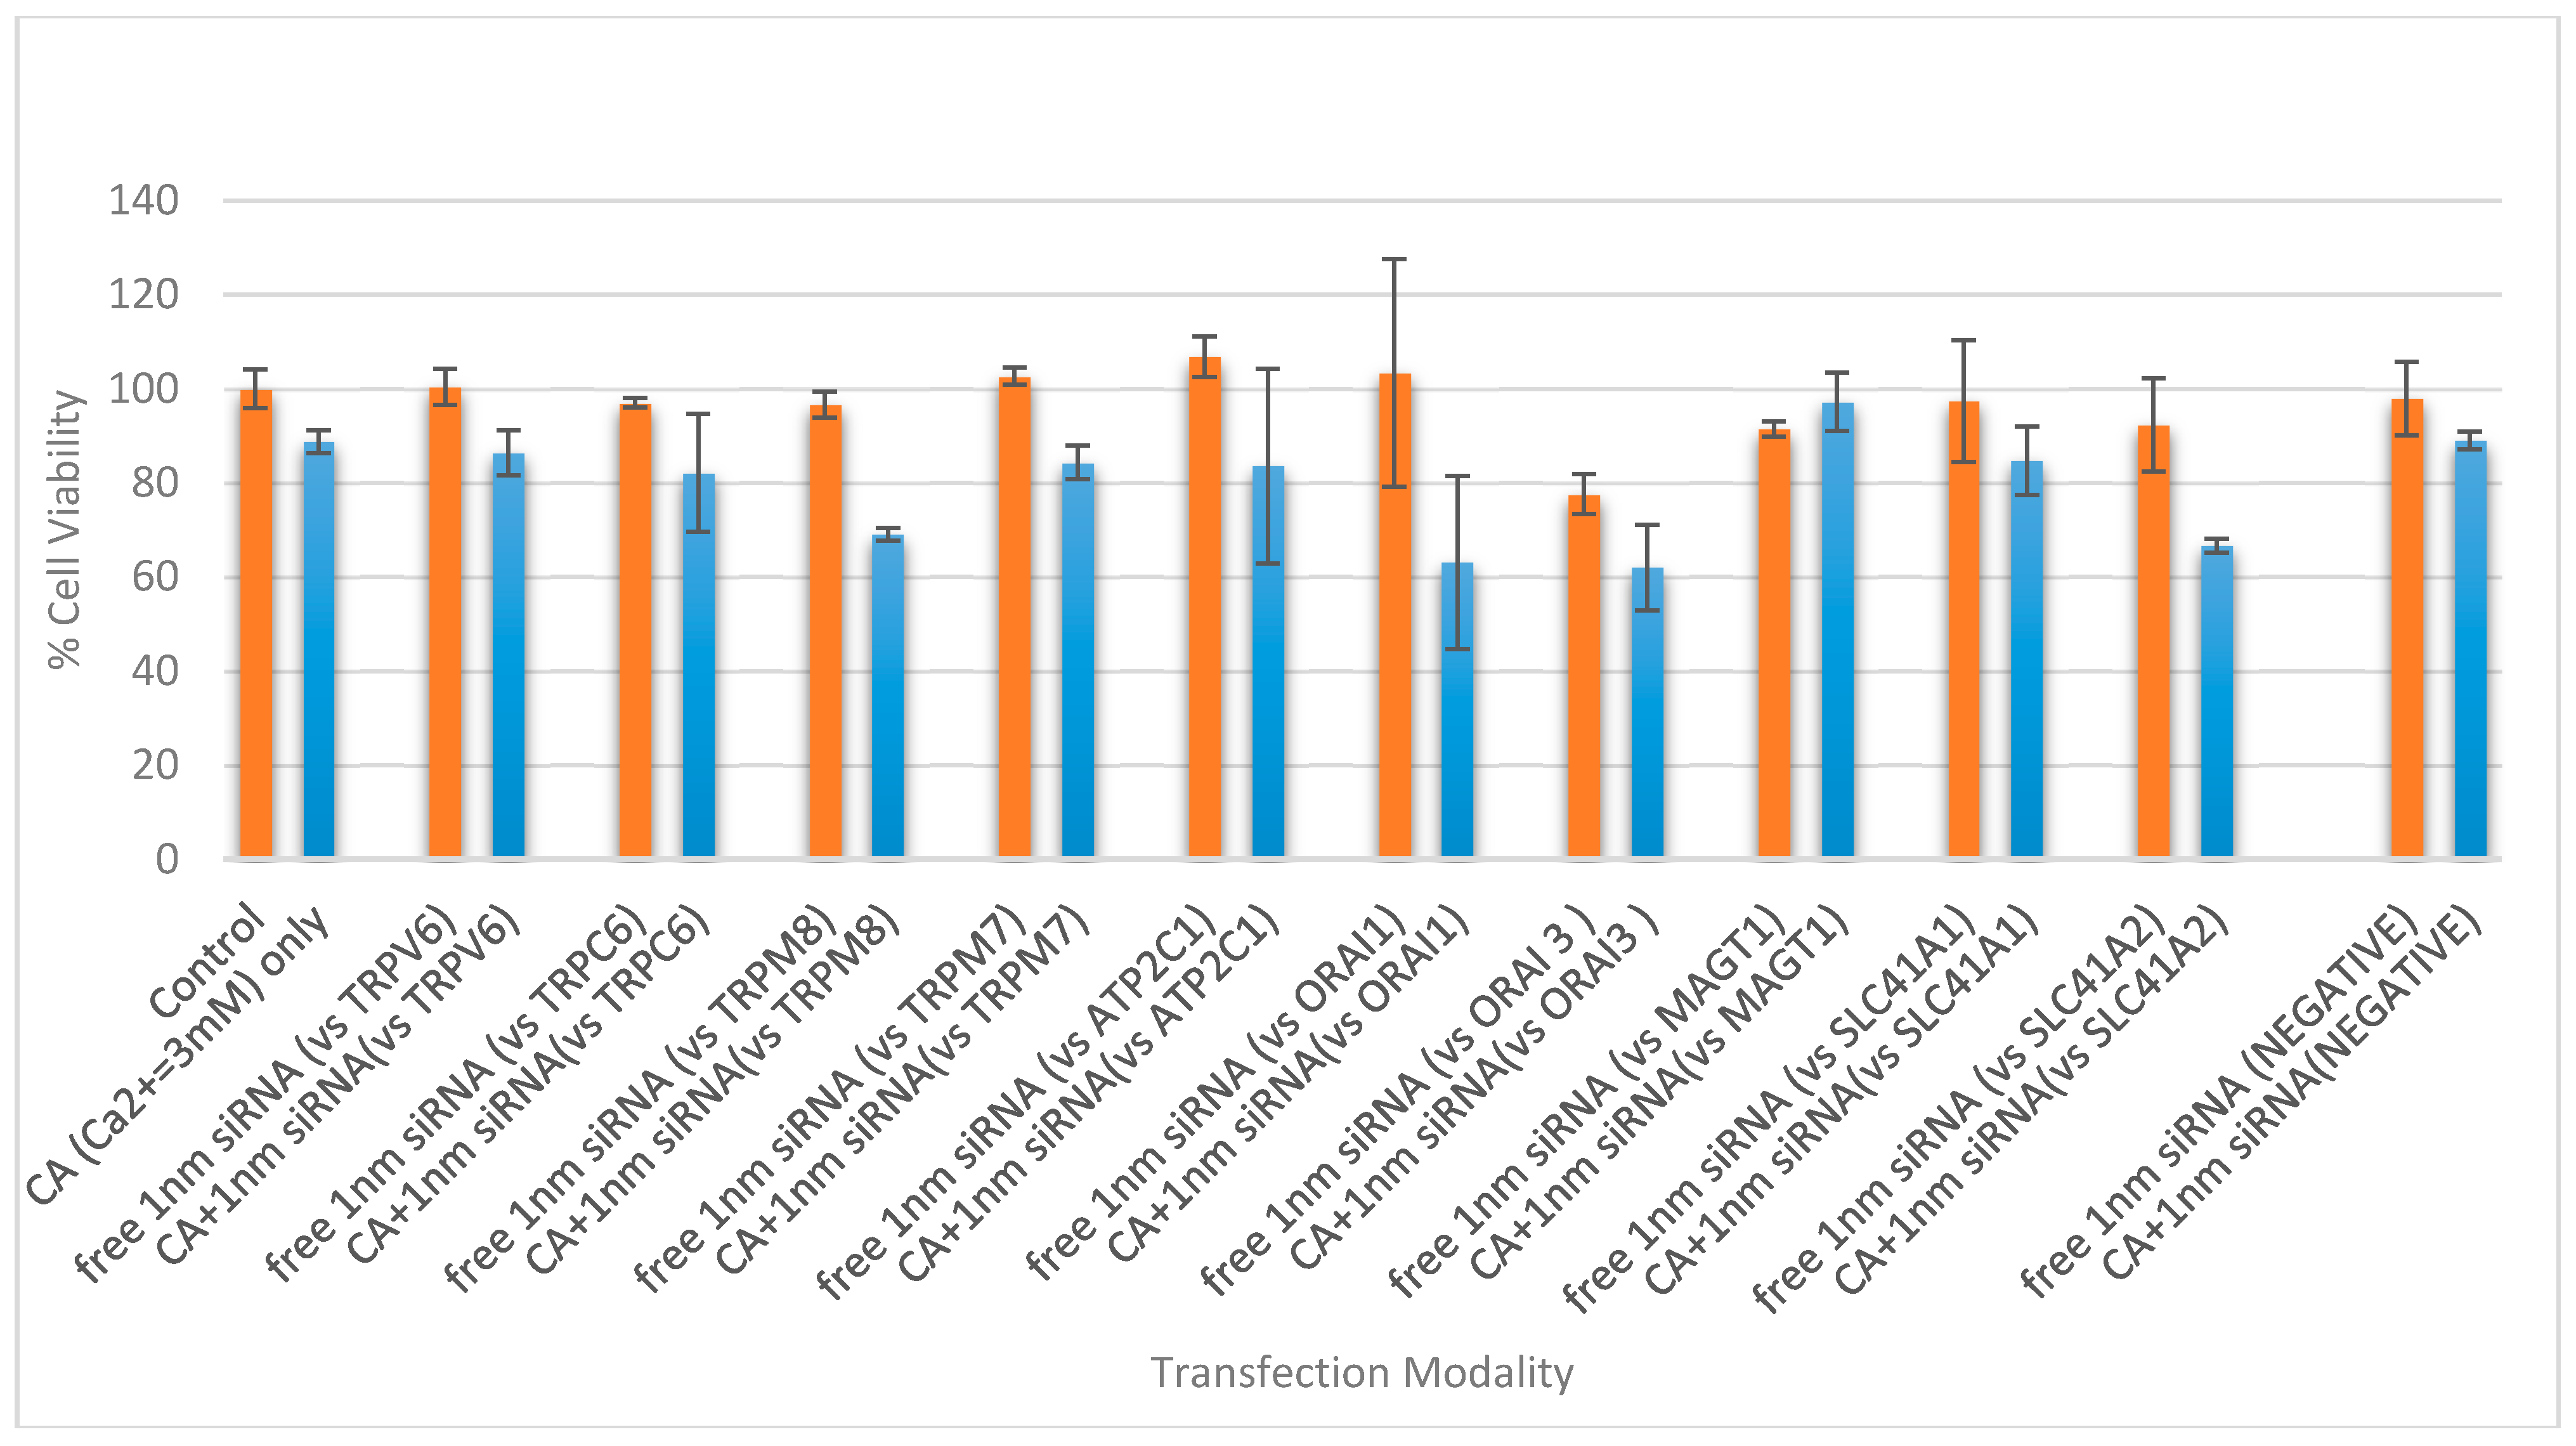
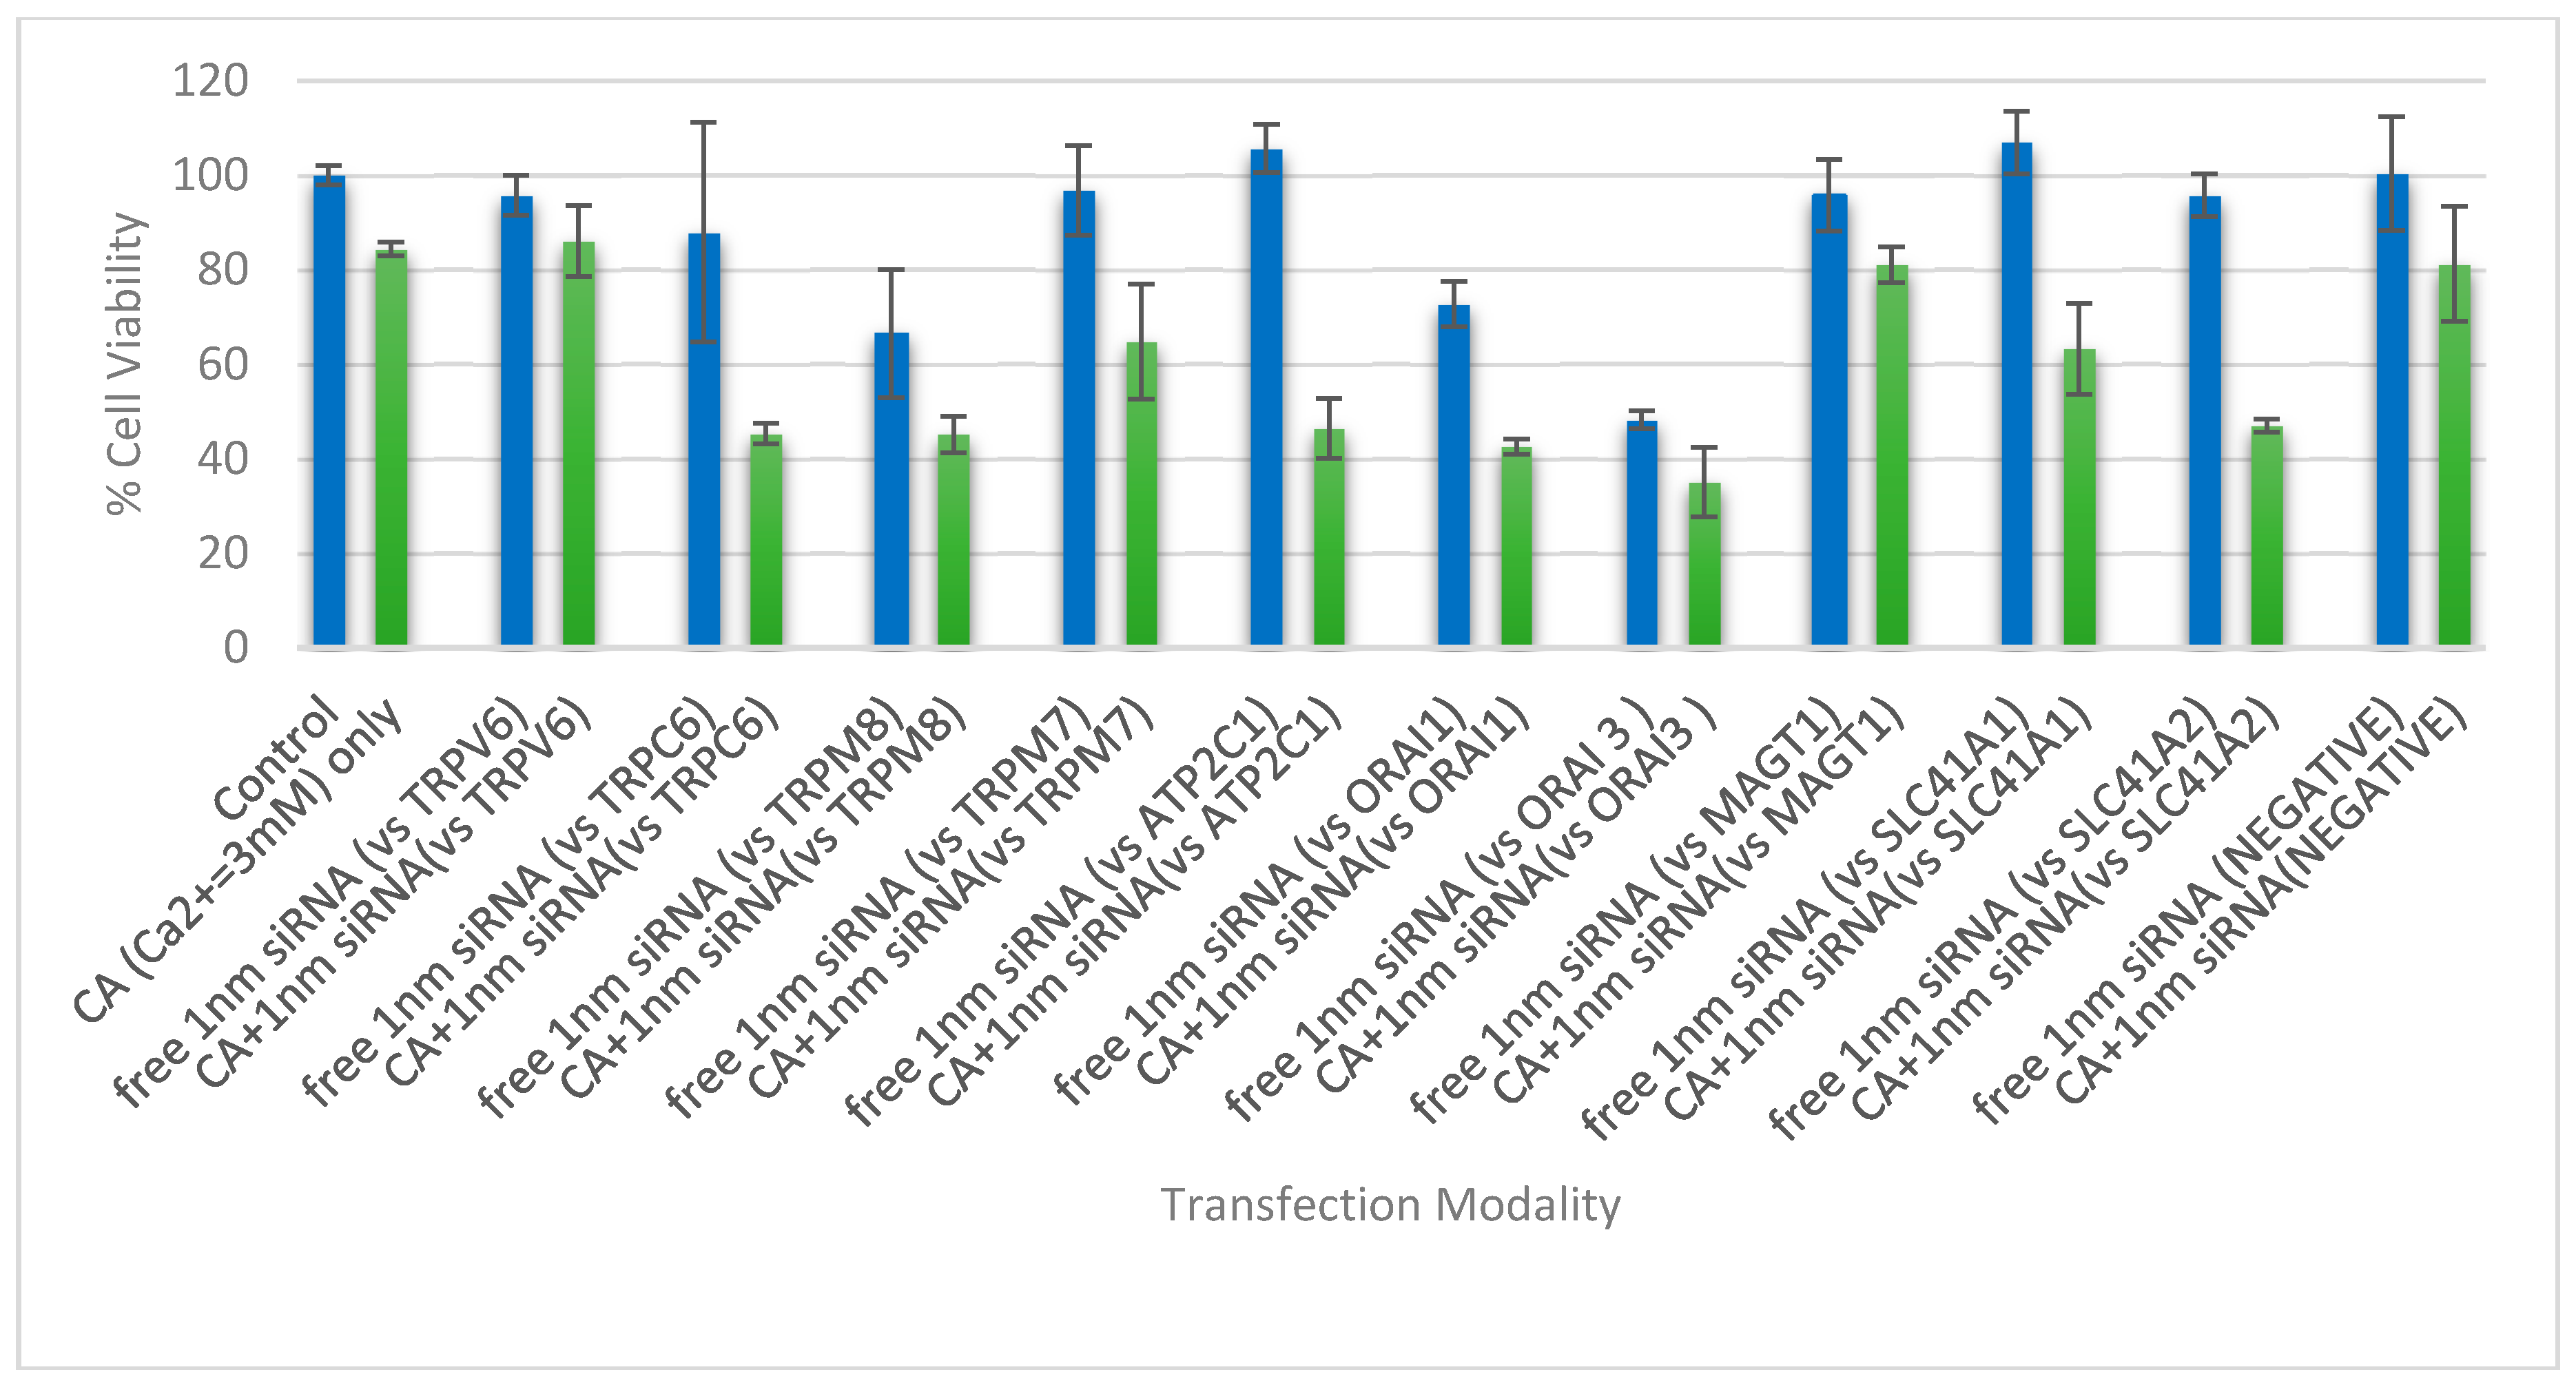
3.4. Cell Viability Assessment Following Intracellular Delivery of Individual siRNAs with CA NPs
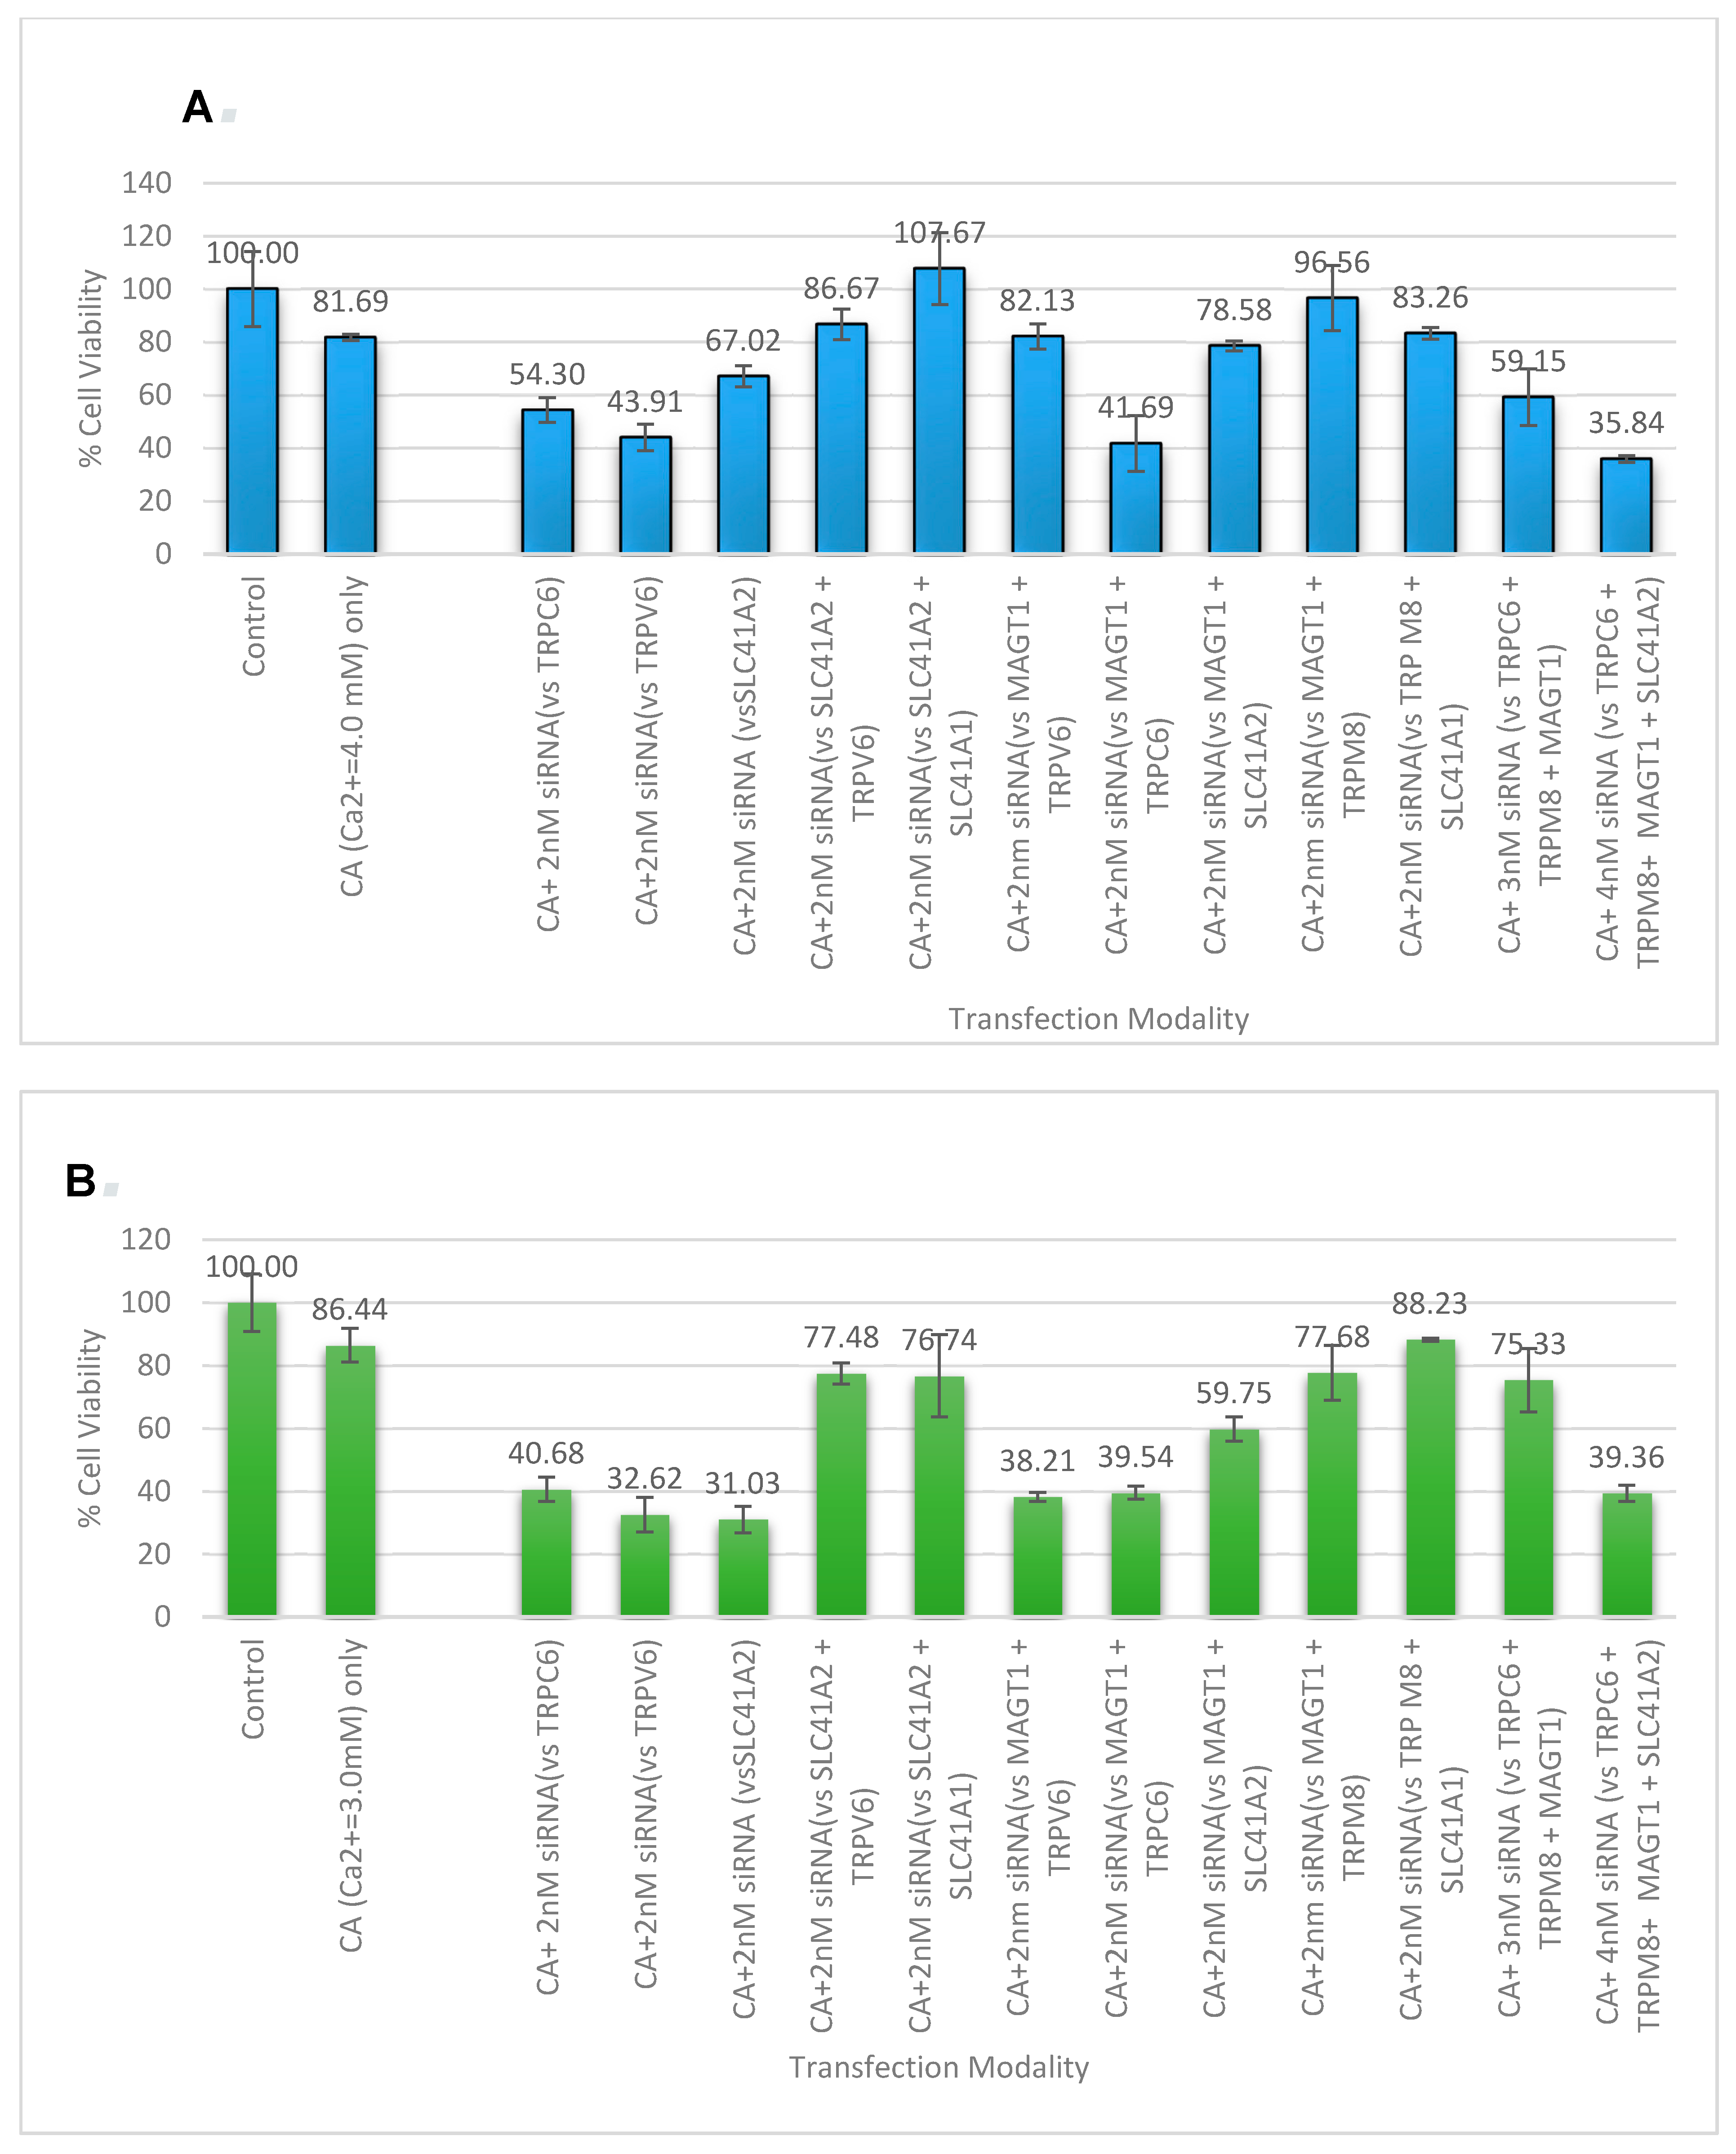
3.5. Cell Viability Study with CA-Multiple siRNAs
3.6. Effects of NP-Facilitated Delivery of siRNAs against Cation Channels and Transporters on MAPK and AKT Activation in MCF-7 Cells
4. Conclusions
Supplementary Materials
Author Contributions
Funding
Conflicts of Interest
References
- Hall, J. Guyton and Hall Textbook of Medical Physiology: Enhanced E-Book; Elsevier Health Sciences: New York, NY, USA, 2010. [Google Scholar]
- Monteith, G.R.; Davis, F.M.; Roberts-Thomson, S.J. Calcium channels and pumps in cancer: Changes and consequences. J. Biol. Chem. 2012, 287, 31666–31673. [Google Scholar] [CrossRef] [PubMed]
- Molee, P.; Adisakwattana, P.; Reamtong, O.; Petmitr, S.; Sricharunrat, T.; Suwandittakul, N.; Chaisri, U. Up-regulation of AKAP13 and MAGT1 on cytoplasmic membrane in progressive hepatocellular carcinoma: A novel target for prognosis. Int. J. Clin. Exp. Pathol. 2015, 8, 9796. [Google Scholar] [PubMed]
- Leanza, L.; Managò, A.; Zoratti, M.; Gulbins, E.; Szabo, I. Pharmacological targeting of ion channels for cancer therapy: In vivo evidences. Biochim. Biophys. Acta Mol. Cell Res. 2016, 1863, 1385–1397. [Google Scholar] [CrossRef] [PubMed]
- Li, M.; Xiong, Z.-G. Ion channels as targets for cancer therapy. Int. J. Physiol. Pathophysiol. Pharmacol. 2011, 3, 156. [Google Scholar] [PubMed]
- Becchetti, A.; Munaron, L.; Arcangeli, A. The role of ion channels and transporters in cell proliferation and cancer. Front. Physiol. 2013, 4, 312. [Google Scholar] [CrossRef] [PubMed]
- Bean, B.P. Classes of calcium channels in vertebrate cells. Annu. Rev. Physiol. 1989, 51, 367–384. [Google Scholar] [CrossRef] [PubMed]
- Lee, J.M.; Davis, F.M.; Roberts-Thomson, S.J.; Monteith, G.R. Ion channels and transporters in cancer. 4. Remodeling of Ca2+ signaling in tumorigenesis: Role of Ca2+ transport. Am. J. Physiol. Cell Physiol. 2011, 301, C969–C976. [Google Scholar] [CrossRef] [PubMed]
- Stewart, T.A.; Yapa, K.T.; Monteith, G.R. Altered calcium signaling in cancer cells. Biochim. Biophys. Acta Biomembr. 2015, 1848, 2502–2511. [Google Scholar] [CrossRef] [PubMed] [Green Version]
- Kamdje, A.H.N.; Etet, P.F.S.; Vecchio, L.; Tagne, R.S.; Amvene, J.M.; Muller, J.-M.; Krampera, M.; Lukong, K.E. New targeted therapies for breast cancer: A focus on tumor microenvironmental signals and chemoresistant breast cancers. World J. Clin. Cases 2014, 2, 769. [Google Scholar] [CrossRef] [PubMed]
- Prevarskaya, N.; Skryma, R.; Shuba, Y. Targeting Ca2+ transport in cancer: Close reality or long perspective? Expert Opin. Ther. Targets 2013, 17, 225–241. [Google Scholar] [CrossRef] [PubMed]
- Déliot, N.; Constantin, B. Plasma membrane calcium channels in cancer: Alterations and consequences for cell proliferation and migration. Biochim. Biophys. Acta Biomembr. 2015, 1848, 2512–2522. [Google Scholar] [CrossRef] [PubMed]
- Brini, M.; Carafoli, E. Calcium pumps in health and disease. Physiol. Rev. 2009, 89, 1341–1378. [Google Scholar] [CrossRef] [PubMed]
- Chen, Y.-F.; Chen, Y.-T.; Chiu, W.-T.; Shen, M.-R. Remodeling of calcium signaling in tumor progression. J. Biomed. Sci. 2013, 20, 23. [Google Scholar] [CrossRef] [PubMed] [Green Version]
- Nielsen, N.; Lindemann, O.; Schwab, A. TRP channels and STIM/ORAI proteins: Sensors and effectors of cancer and stroma cell migration. Br. J. Pharmacol. 2014, 171, 5524–5540. [Google Scholar] [CrossRef] [PubMed]
- Yang, S.; Zhang, J.J.; Huang, X.-Y. Orai1 and STIM1 are critical for breast tumor cell migration and metastasis. Cancer Cell 2009, 15, 124–134. [Google Scholar] [CrossRef] [PubMed]
- Flourakis, M.; Lehen’kyi, V.; Beck, B.; Raphael, M.; Vandenberghe, M.; Abeele, F.V.; Roudbaraki, M.; Lepage, G.; Mauroy, B.; Romanin, C. Orai1 contributes to the establishment of an apoptosis-resistant phenotype in prostate cancer cells. Cell Death Dis. 2010, 1, e75. [Google Scholar] [CrossRef] [PubMed]
- Faouzi, M.; Hague, F.; Potier, M.; Ahidouch, A.; Sevestre, H.; Ouadid-Ahidouch, H. Down-regulation of Orai3 arrests cell-cycle progression and induces apoptosis in breast cancer cells but not in normal breast epithelial cells. J. Cell. Physiol. 2011, 226, 542–551. [Google Scholar] [CrossRef] [PubMed]
- Zhao, J.; Mi, Y.; Feng, S.-S. siRNA-based nanomedicine. Nanomedicine 2013, 8, 859–862. [Google Scholar] [CrossRef] [PubMed]
- Kesharwani, P.; Gajbhiye, V.; Jain, N.K. A review of nanocarriers for the delivery of small interfering RNA. Biomaterials 2012, 33, 7138–7150. [Google Scholar] [CrossRef] [PubMed]
- Chowdhury, E.H. pH-responsive magnesium-and carbonate-substituted apatite nano-crystals for efficient and cell-targeted delivery of transgenes. Open J. Genet. 2013, 3, 38. [Google Scholar] [CrossRef]
- Hossain, S.; Stanislaus, A.; Chua, M.J.; Tada, S.; Tagawa, Y.-I.; Chowdhury, E.H.; Akaike, T. Carbonate apatite-facilitated intracellularly delivered siRNA for efficient knockdown of functional genes. J. Control. Release 2010, 147, 101–108. [Google Scholar] [CrossRef] [PubMed]
- Stanislaus, A.; Hossain, S.; Chua, M.J.; Kunnath, A.P.; Wen, Q.C.; Syakira, S.N.; Siong, G.Y.; Loong, S.W.; Othman, I.; Akaike, T. Fabrication and intracellular delivery of siRNA/carbonate apatite nano-composites for effective knockdown of cyclin B1 gene. Drugs Ther. Stud. 2011, 1, 8. [Google Scholar] [CrossRef] [Green Version]
- Li, Y.T.; Chua, M.J.; Kunnath, A.P.; Chowdhury, E.H. Reversing multidrug resistance in breast cancer cells by silencing ABC transporter genes with nanoparticle-facilitated delivery of target siRNAs. Int. J. Nanomed. 2012, 7, 2473. [Google Scholar]
- Chuaa, M.; Tiasha, S.; Fatemiana, T.; Noordinb, M.; Kengc, C.; Chowdhurya, E. Carbonate apatite-facilitated intracellular delivery of c-ROS1 siRNA sensitizes MCF-7 breast cancer cells to cisplatin and paclitaxel. OA Cancer 2013, 1, 1–9. [Google Scholar]
- Tiash, S.; Kamaruzman, N.I.B.; Chowdhury, E.H. Carbonate apatite nanoparticles carry siRNA(s) targeting growth factor receptor genes egfr1 and erbb2 to regress mouse breast tumor. Drug Deliv. 2017, 24, 1721–1730. [Google Scholar] [CrossRef] [PubMed]
- Chodon, D.; Guilbert, A.; Dhennin-Duthille, I.; Gautier, M.; Telliez, M.S.; Sevestre, H.; Ouadid-Ahidouch, H. Estrogen regulation of TRPM8 expression in breast cancer cells. BMC Cancer 2010, 10, 212. [Google Scholar] [CrossRef] [PubMed]
- Dhennin-Duthille, I.; Gautier, M.; Faouzi, M.; Guilbert, A.; Brevet, M.; Vaudry, D.; Ahidouch, A.; Sevestre, H.; Ouadid-Ahidouch, H. High expression of transient receptor potential channels in human breast cancer epithelial cells and tissues: Correlation with pathological parameters. Cell. Physiol. Biochem. 2011, 28, 813–822. [Google Scholar] [CrossRef] [PubMed]
- Liu, J.; Chen, Y.; Shuai, S.; Ding, D.; Li, R.; Luo, R. TRPM8 promotes aggressiveness of breast cancer cells by regulating EMT via activating AKT/GSK-3β pathway. Tumor Biol. 2014, 35, 8969–8977. [Google Scholar] [CrossRef] [PubMed]
- Sahni, J.; Nelson, B.; Scharenberg, A.M. SLC41A2 encodes a plasma-membrane Mg2+ transporter. Biochem. J. 2007, 401, 505–513. [Google Scholar] [CrossRef] [PubMed]
- Guilbert, A.; Dhennin-Duthille, I.; Hiani, Y.E.; Haren, N.; Khorsi, H.; Sevestre, H.; Ahidouch, A.; Ouadid-Ahidouch, H. Expression of TRPC6 channels in human epithelial breast cancer cells. BMC Cancer 2008, 8, 125. [Google Scholar] [CrossRef] [PubMed]
- Song, C.; Bae, Y.; Jun, J.; Lee, H.; Kim, N.D.; Lee, K.B.; Hur, W.; Park, J.Y.; Sim, T. Identification of TG100-115 as a new and potent TRPM7 kinase inhibitor, which suppresses breast cancer cell migration and invasion. Biochim. Biophys. Acta 2017, 1861, 947–957. [Google Scholar] [CrossRef] [PubMed]
- Meng, X.; Cai, C.; Wu, J.; Cai, S.; Ye, C.; Chen, H.; Yang, Z.; Zeng, H.; Shen, Q.; Zou, F. TRPM7 mediates breast cancer cell migration and invasion through the MAPK pathway. Cancer Lett. 2013, 333, 96–102. [Google Scholar] [CrossRef] [PubMed]
- Liu, Z.; Wu, H.; Wei, Z.; Wang, X.; Shen, P.; Wang, S.; Wang, A.; Chen, W.; Lu, Y. TRPM8: A potential target for cancer treatment. J. Cancer Res. Clin. Oncol. 2016, 142, 1871–1881. [Google Scholar] [CrossRef] [PubMed]
- Sponder, G.; Abdulhanan, N.; Fröhlich, N.; Mastrototaro, L.; Aschenbach, J.R.; Röntgen, M.; Pilchova, I.; Cibulka, M.; Racay, P.; Kolisek, M. Overexpression of Na+/Mg2+ exchanger SLC41A1 attenuates pro-survival signaling. Oncotarget 2017, 9, 5084–5104. [Google Scholar] [PubMed]
- Roberts-Thomson, S.J.; Peters, A.A.; Grice, D.M.; Monteith, G.R. ORAI-mediated calcium entry: Mechanism and roles, diseases and pharmacology. Pharmacol. Ther. 2010, 127, 121–130. [Google Scholar] [CrossRef] [PubMed]
- Moccia, F.; Zuccolo, E.; Poletto, V.; Turin, I.; Guerra, G.; Pedrazzoli, P.; Rosti, V.; Porta, C.; Montagna, D. Targeting Stim and Orai Proteins as an Alternative Approach in Anticancer Therapy. Curr. Med. Chem. 2016, 23, 3450–3480. [Google Scholar] [CrossRef] [PubMed]
- Dang, D.; Rao, R. Calcium-ATPases: Gene disorders and dysregulation in cancer. Biochim. Biophys. Acta 2016, 1863, 1344–1350. [Google Scholar] [CrossRef] [PubMed]
- Chowdhury, E.; Akaike, T. High performance DNA nano-carriers of carbonate apatite: Multiple factors in regulation of particle synthesis and transfection efficiency. Int. J. Nanomed. 2007, 2, 101. [Google Scholar] [CrossRef]
- Clapham, D.E. Calcium signaling. Cell 2007, 131, 1047–1058. [Google Scholar] [CrossRef] [PubMed]
- Thebault, S.; Flourakis, M.; Vanoverberghe, K.; Vandermoere, F.; Roudbaraki, M.; Lehen’Kyi, V.Y.; Slomianny, C.; Beck, B.; Mariot, P.; Bonnal, J.-L. Differential role of transient receptor potential channels in Ca2+ entry and proliferation of prostate cancer epithelial cells. Cancer Res. 2006, 66, 2038–2047. [Google Scholar] [CrossRef] [PubMed]
- Hoth, M.; Button, D.C.; Lewis, R.S. Mitochondrial control of calcium-channel gating: A mechanism for sustained signaling and transcriptional activation in T lymphocytes. Proc. Natl. Acad. Sci. USA 2000, 97, 10607–10612. [Google Scholar] [CrossRef] [PubMed] [Green Version]
- Schwarz, E.C.; Wissenbach, U.; Niemeyer, B.A.; Strauß, B.; Philipp, S.E.; Flockerzi, V.; Hoth, M. TRPV6 potentiates calcium-dependent cell proliferation. Cell Calcium 2006, 39, 163–173. [Google Scholar] [CrossRef] [PubMed]
- Deason-Towne, F.; Perraud, A.-L.; Schmitz, C. The Mg2+ transporter MagT1 partially rescues cell growth and Mg2+ uptake in cells lacking the channel-kinase TRPM7. FEBS Lett. 2011, 585, 2275–2278. [Google Scholar] [CrossRef] [PubMed]


| Targeted Gene (Symbol) | Official Name |
|---|---|
| ORAI 1 | ORAI Calcium Release-Activated Calcium Modulator 1 |
| ORAI3 | ORAI Calcium Release-Activated Calcium Modulator 3 |
| ATP2C1 | ATPase, Ca2+ Transporting, Type 2C, Member 1 |
| SLC41A1 | Solute Carrier Family 41 (Magnesium Transporter), Member 1 |
| SLC41A2 | Solute Carrier Family 41 (Magnesium Transporter), Member 2 |
| MAGT1 | Magnesium Transporter 1 |
| TRPM8 | Transient Receptor Potential Cation Channel, Subfamily M, Member 8 |
| TRPM7 | Transient Receptor Potential Cation Channel, Subfamily M, Member 7 |
| TRPV6 | Transient Receptor Potential Cation Channel, Subfamily V, Member 6 |
| TRPC6 | Transient Receptor Potential Cation Channel, Subfamily C, Member 6 |
| siRNA Targeted Gene Symbol | Target Gene Sequences |
|---|---|
| Allstars Negative control siRNA | Proprietary |
| ORAI 1 | TCCGCTGTCCCGCTCCGGCTCCTGGGGCTC |
| ORAI3 | GCTGGCGTGAGCTGGGGACGTTGCGGGCAC |
| ATP2C1 | AGGAGTGCGGGGCGCGACTGGCGGCCGGC |
| SLC41A1 | AGTGCTTGATGGGGCTGCCTGTTGGTGGAT |
| SLC41A2 | ATCCAGTCCTTCTGTGGAACTTCTGAACAT |
| MAGT1 | GTGTAGCGCCAGCGCGCTGTGACGTAATGT |
| TRPM8 | CTCCCATGATGTCCTCACTGAACTCTTCTCC |
| TRPM7 | GCGCCGCTCACGTGGTCCGTCCCAGCCCC |
| TRPV6 | AGAGTCCTGGCTGGCTCTGCCAAGTGTAAC |
| TRPC 6 | GGGATCTTGACGGAGAGTGCGGGGATGAA |
| Instruments Used | NP Size Measured (nM) |
|---|---|
| Zetasizer | 191–284 |
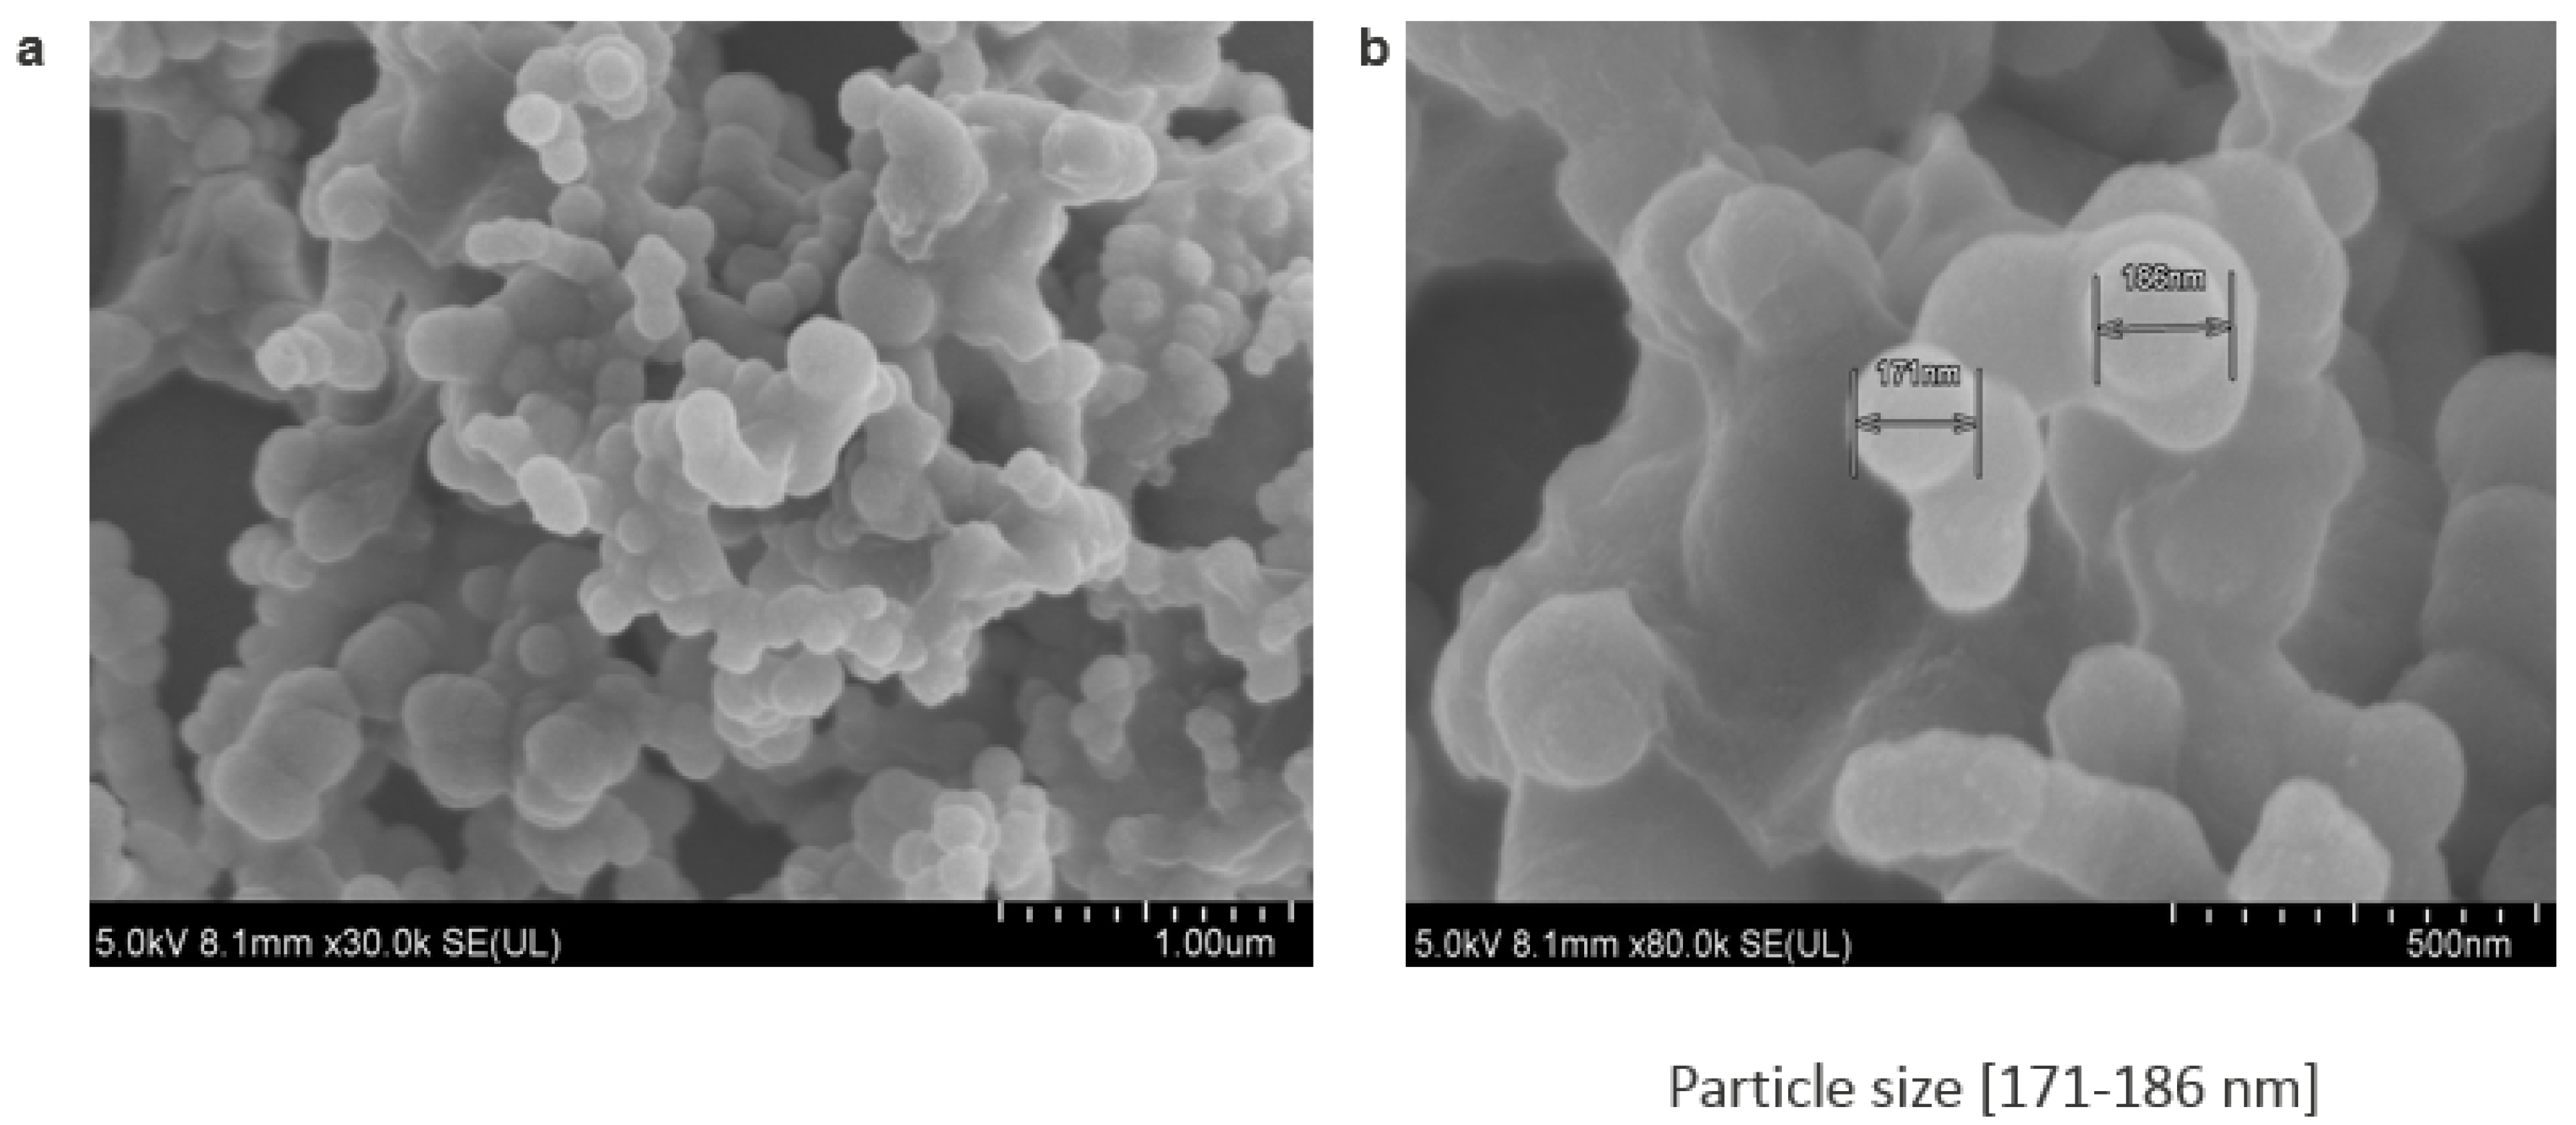
| FE-SEM | 171–186 |
© 2018 by the authors. Licensee MDPI, Basel, Switzerland. This article is an open access article distributed under the terms and conditions of the Creative Commons Attribution (CC BY) license (http://creativecommons.org/licenses/by/4.0/).
Share and Cite
Uddin, M.B.; Balaravi Pillai, B.; Tha, K.K.; Ashaie, M.; Karim, M.E.; Chowdhury, E.H. Carbonate Apatite Nanoparticles-Facilitated Intracellular Delivery of siRNA(s) Targeting Calcium Ion Channels Efficiently Kills Breast Cancer Cells. Toxics 2018, 6, 34. https://doi.org/10.3390/toxics6030034
Uddin MB, Balaravi Pillai B, Tha KK, Ashaie M, Karim ME, Chowdhury EH. Carbonate Apatite Nanoparticles-Facilitated Intracellular Delivery of siRNA(s) Targeting Calcium Ion Channels Efficiently Kills Breast Cancer Cells. Toxics. 2018; 6(3):34. https://doi.org/10.3390/toxics6030034
Chicago/Turabian StyleUddin, Mohammad Borhan, Balakavitha Balaravi Pillai, Kyi Kyi Tha, Maeirah Ashaie, Md. Emranul Karim, and Ezharul Hoque Chowdhury. 2018. "Carbonate Apatite Nanoparticles-Facilitated Intracellular Delivery of siRNA(s) Targeting Calcium Ion Channels Efficiently Kills Breast Cancer Cells" Toxics 6, no. 3: 34. https://doi.org/10.3390/toxics6030034