Glycerol Oxidation in the Liquid Phase over a Gold-Supported Catalyst: Kinetic Analysis and Modelling


Abstract
:1. Introduction
2. Results
2.1. Influence of the Reaction Conditions
2.1.1. Reaction Temperature
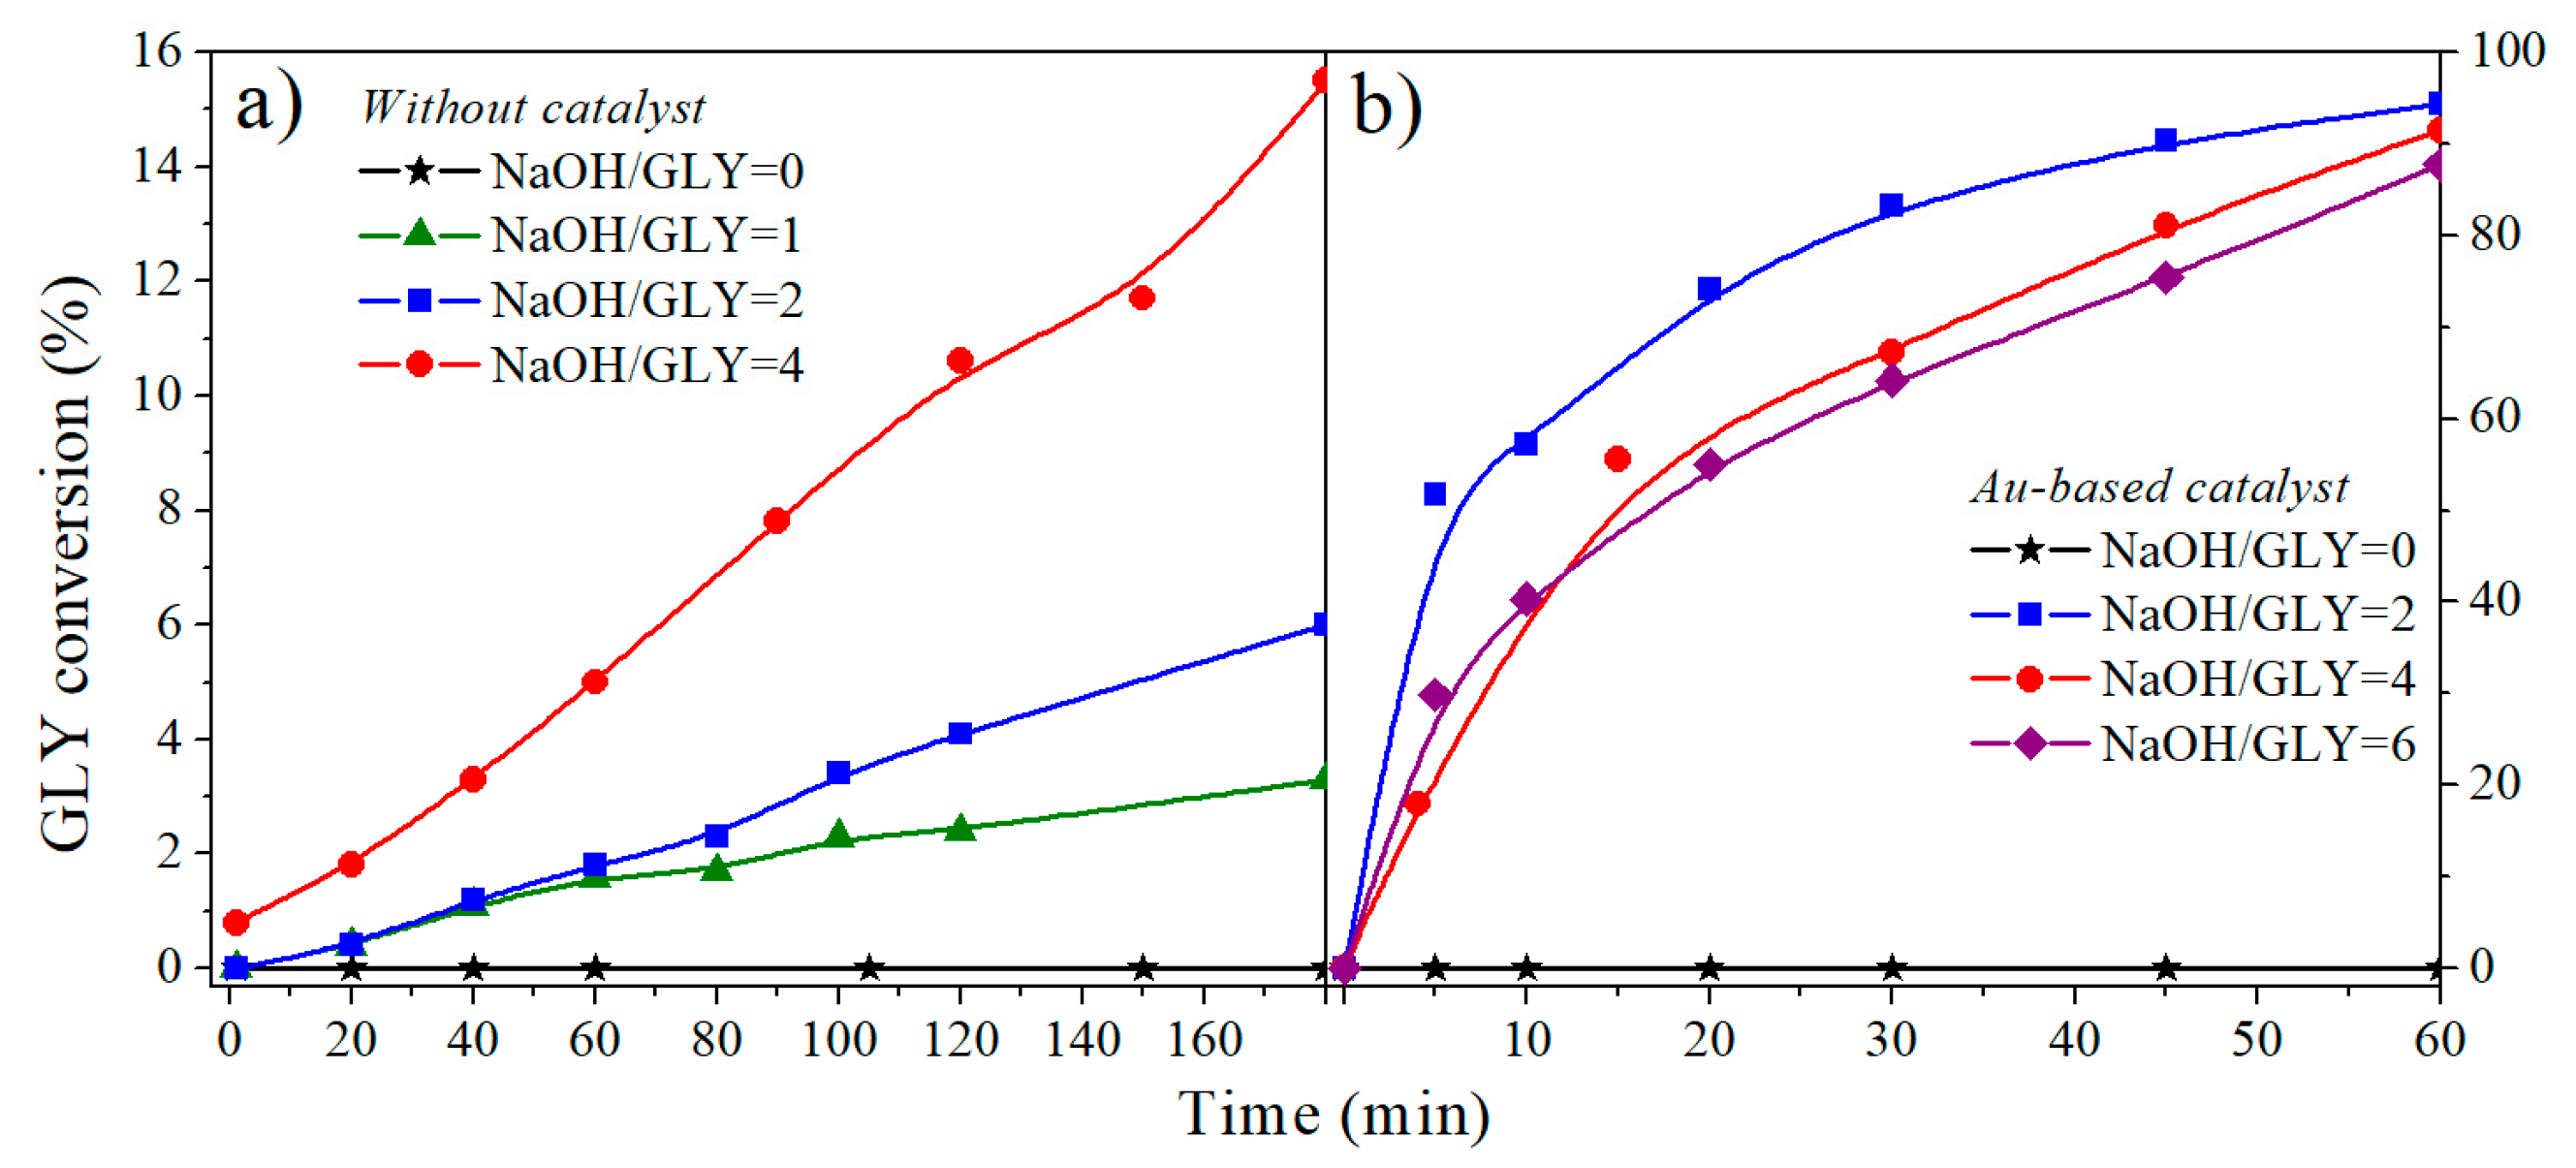
2.1.2. NaOH/Glycerol Ratio
2.1.3. Species Initial Concentration
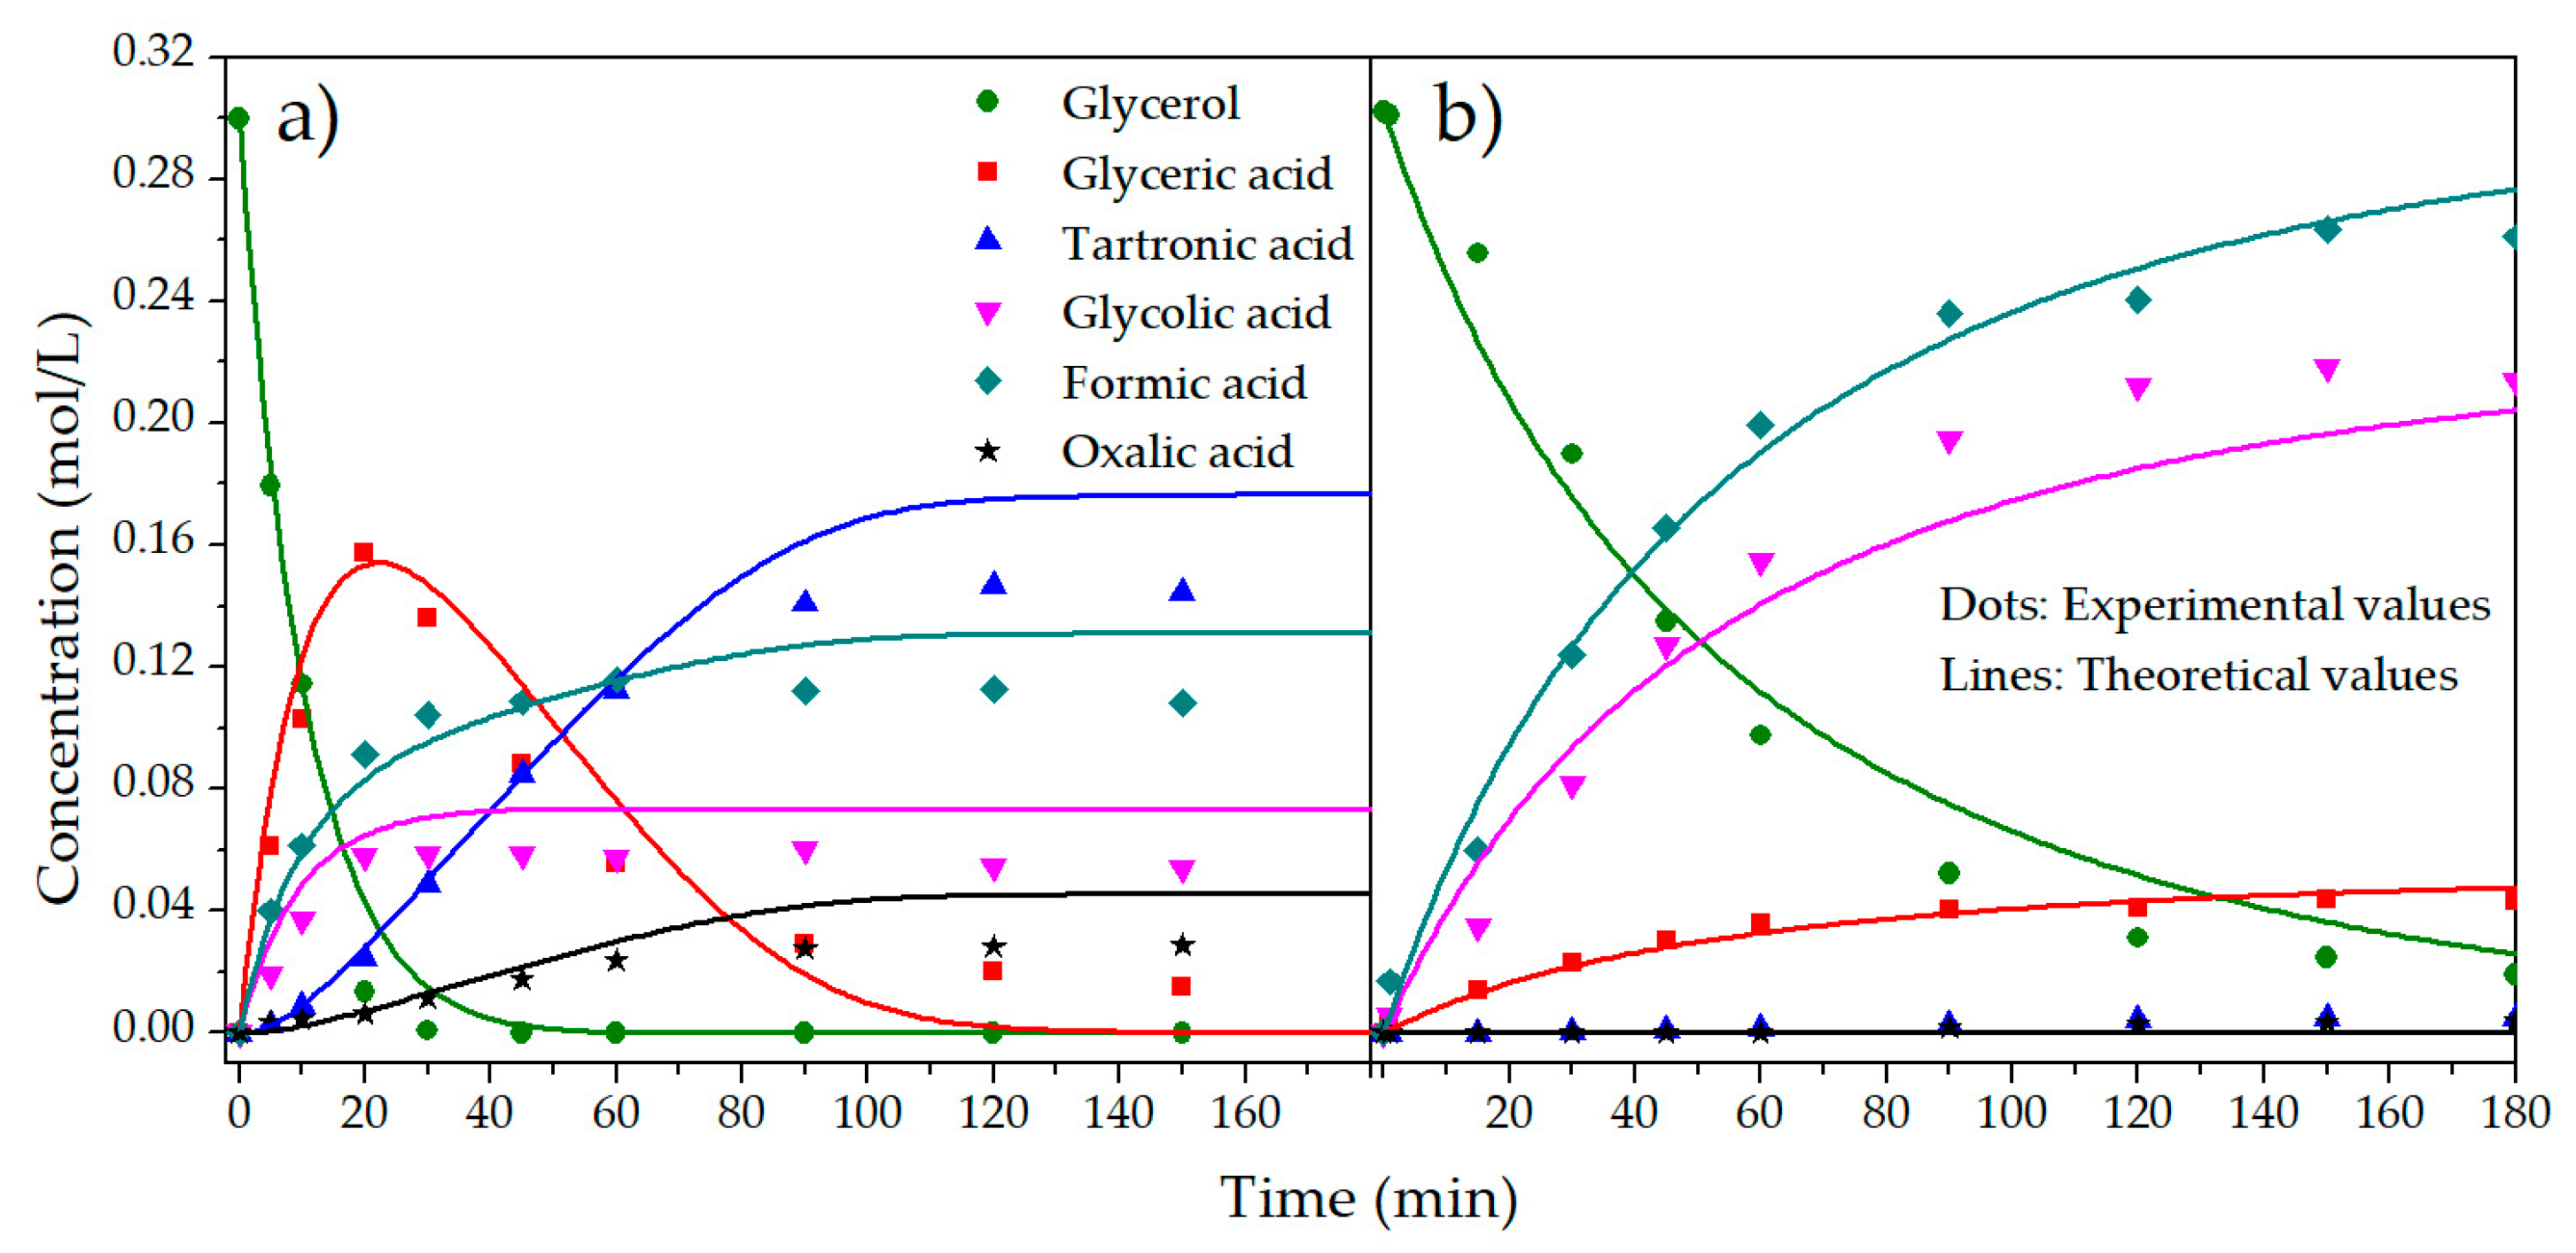
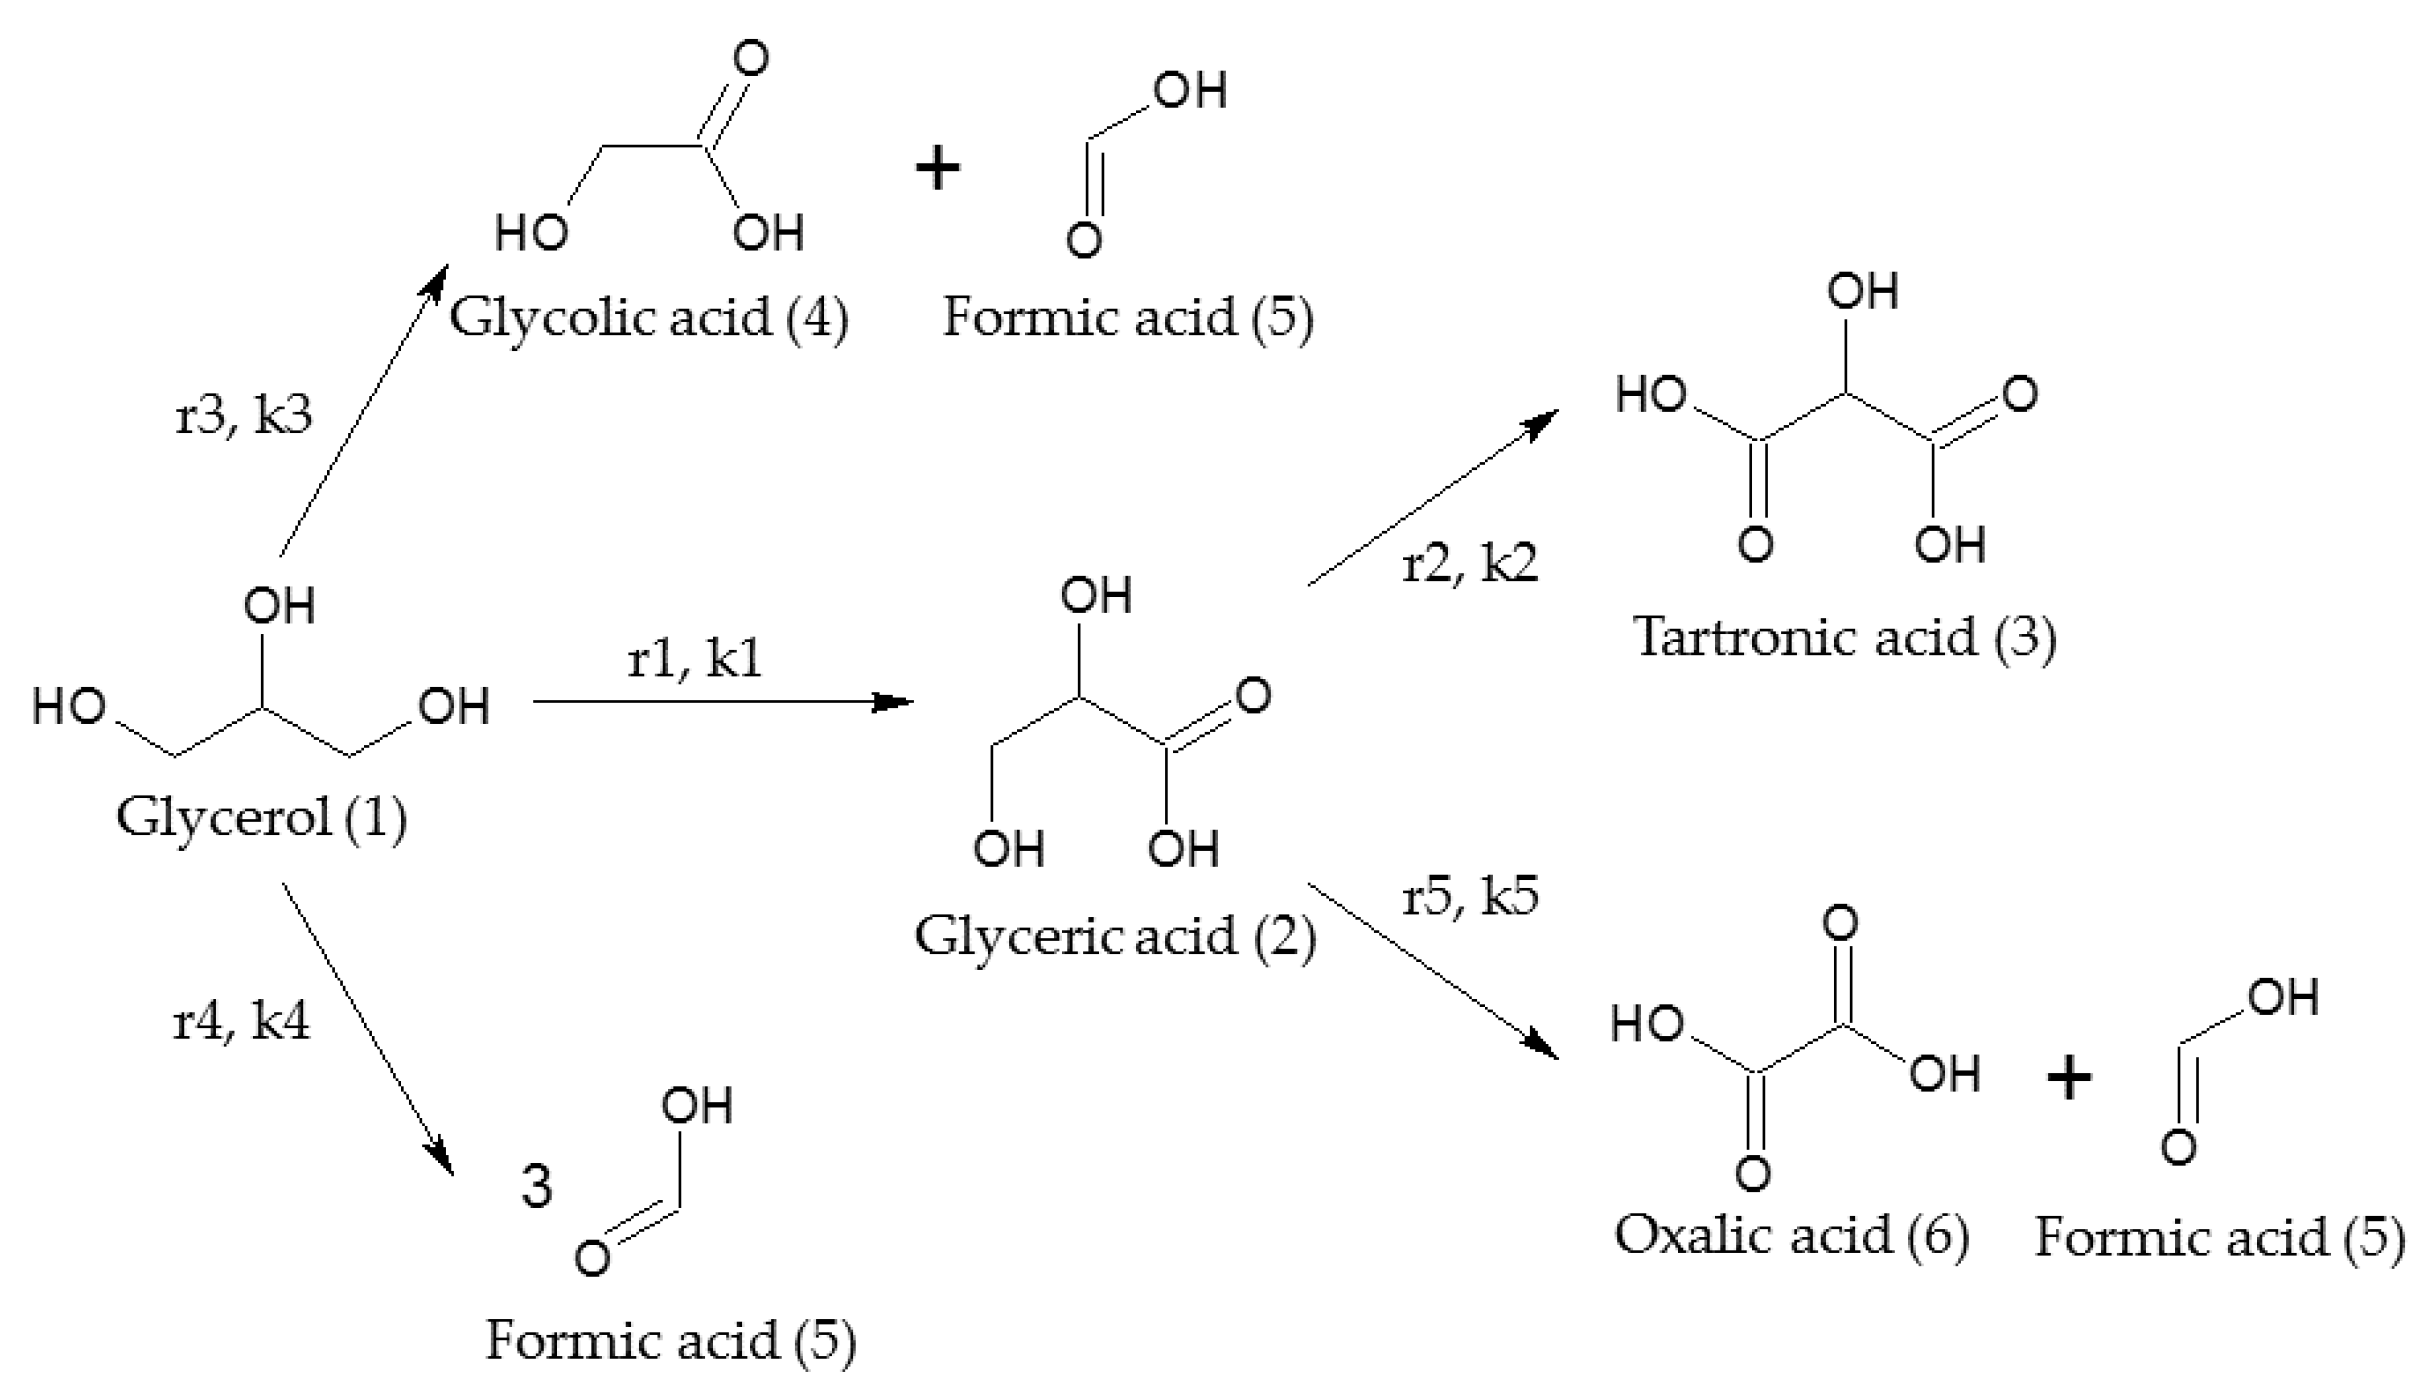
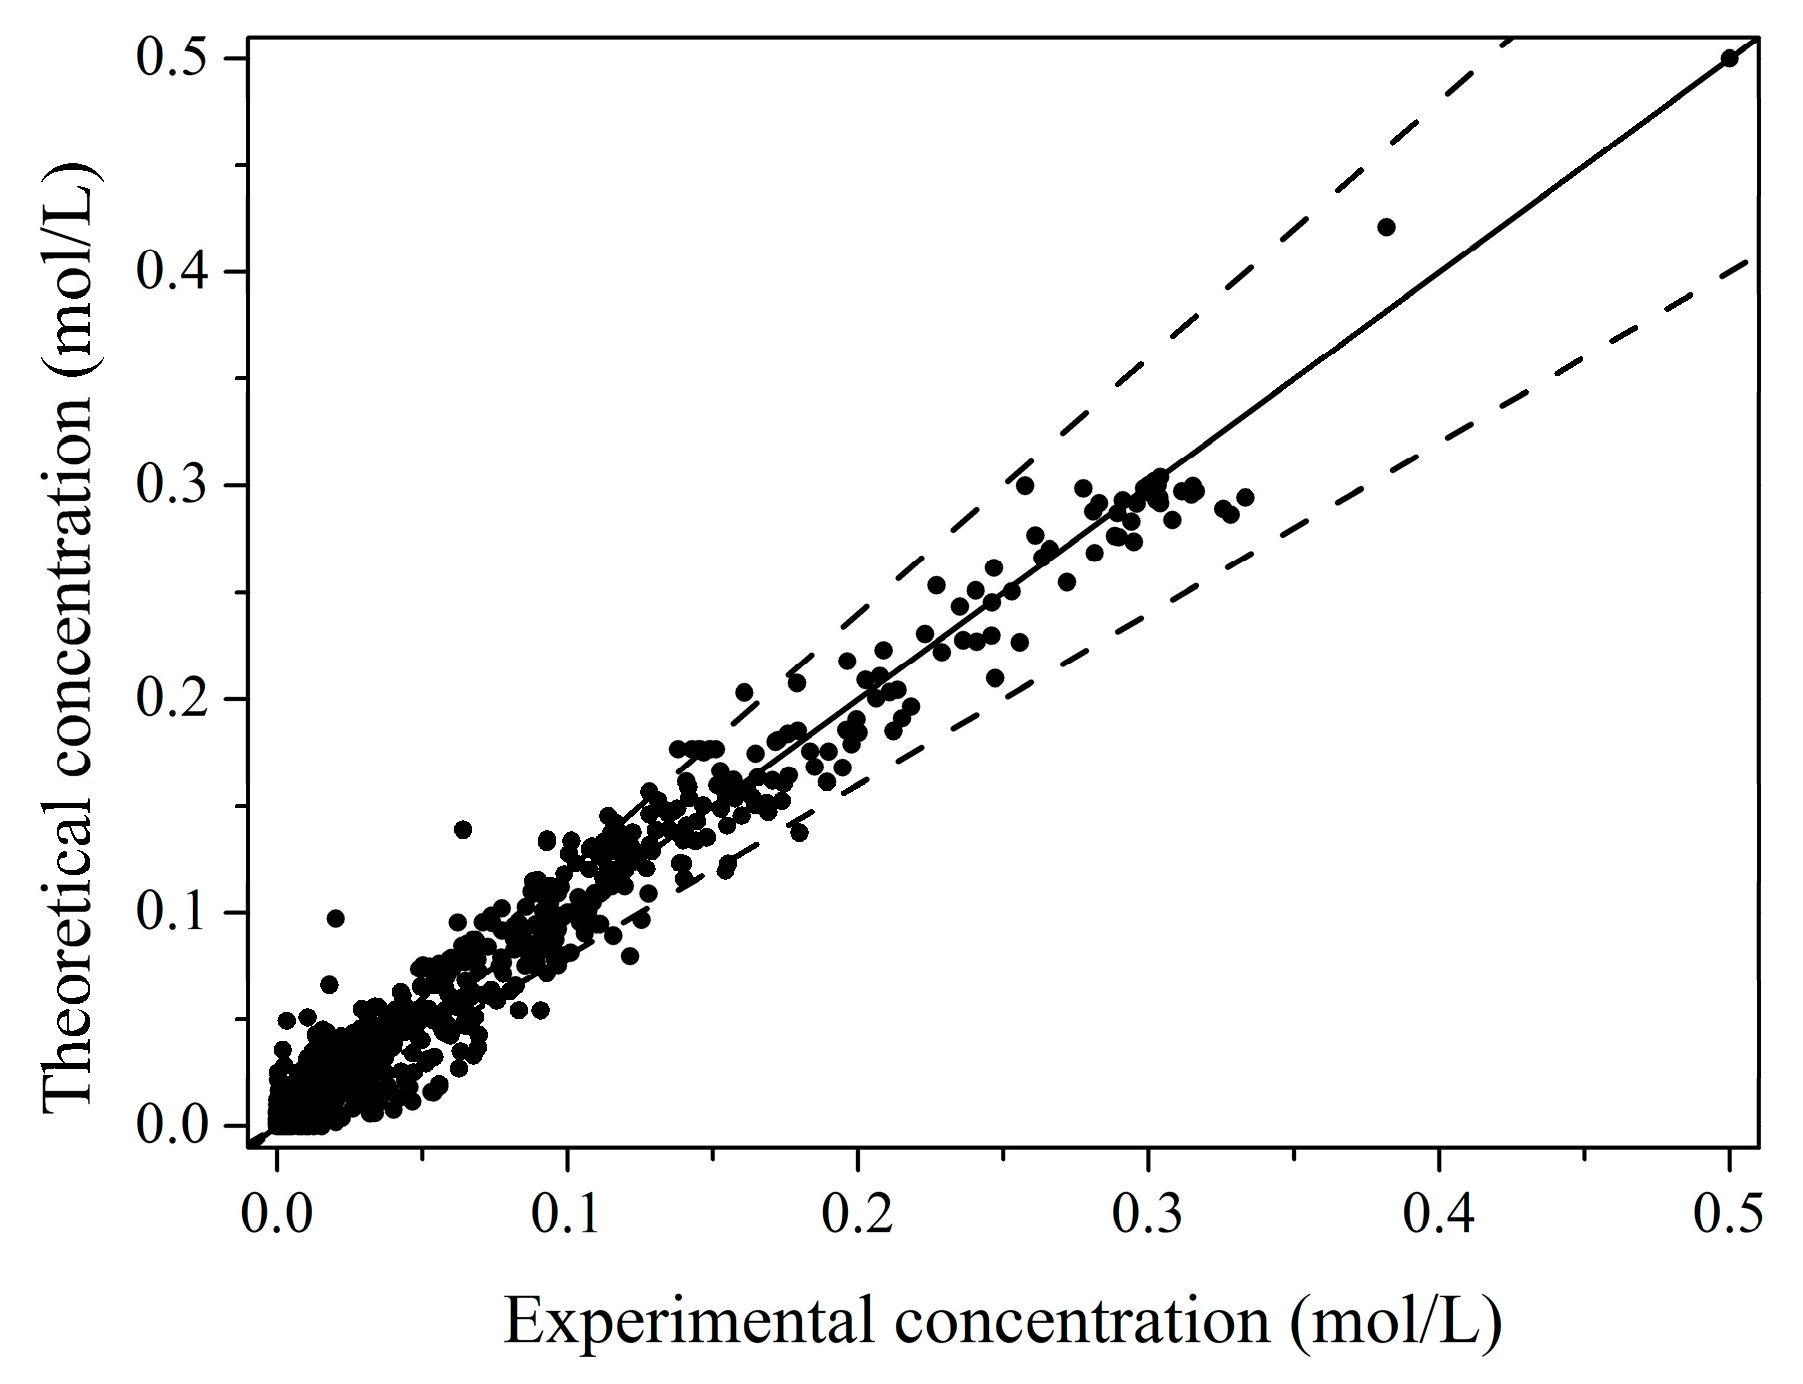
2.2. Kinetic Model
3. Discussion
4. Materials and Methods
5. Conclusions
Acknowledgments
Author Contributions
Conflicts of Interest
References
- BP Statistical Review of World Energy June 2017. Available online: www.bp.com/content/dam/bp/en/corporate/pdf/energy-economics/statistical-review-2017/bp-statistical-review-of-world-energy-2017-full-report.pdf (accessed on 10 August 2017).
- BP Energy Outlook 2035: February 2015. Available online: https://www.bp.com/content/dam/bp/pdf/energy-economics/energy-outlook-2015/bp-energy-outlook-2035-booklet.pdf (accessed on 10 August 2017).
- Hu, W.; Lowry, B.; Varma, A. Kinetic study of glycerol oxidation network over Pt-Bi/C catalyst. Appl. Catal. B Environ. 2011, 106, 123–132. [Google Scholar] [CrossRef]
- Gil, S.; Marchena, M.; Sanchez-Silva, L.; Romero, A.; Sanchez, P.; Valverde, J.L. Effect of the operation conditions on the selective oxidation of glycerol with catalysts based on Au supported on carbonaceous materials. Chem. Eng. J. 2011, 178, 423–435. [Google Scholar] [CrossRef]
- Villa, A.; Dimitratos, N.; Chan-Thaw, C.E.; Hammond, C.; Prati, L.; Hutchings, G.J. Glycerol oxidation using gold-containing catalysts. Acc. Chem. Res. 2015, 48, 1403–1412. [Google Scholar] [CrossRef] [PubMed]
- Skrzyńska, E.; Zaid, S.; Girardon, J.-S.; Capron, M.; Dumeignil, F. Catalytic behaviour of four different supported noble metals in the crude glycerol oxidation. Appl. Catal. A Gen. 2015, 499, 89–100. [Google Scholar] [CrossRef]
- Skrzyńska, E.; Wondolowska-Grabowska, A.; Capron, M.; Dumeignil, F. Crude glycerol as a raw material for the liquid phase oxidation reaction. Appl. Catal. A Gen. 2014, 482, 245–257. [Google Scholar] [CrossRef]
- Kong, P.S.; Aroua, M.K.; Daud, W.M.A.W. Conversion of crude and pure glycerol into derivatives: A feasibility evaluation. Renew. Sustain. Energy Rev. 2016, 63, 533–555. [Google Scholar] [CrossRef]
- Wang, F.-F.; Shao, S.; Liu, C.-L.; Xu, C.-L.; Yang, R.-Z.; Dong, W.-S. Selective oxidation of glycerol over Pt supported on mesoporous carbon nitride in base-free aqueous solution. Chem. Eng. J. 2015, 264, 336–343. [Google Scholar] [CrossRef]
- Katryniok, B.; Kimura, H.; Skrzyńska, E.; Girardon, J.-S.; Fongarland, P.; Capron, M.; Ducoulombier, R.; Mimura, N.; Paul, S.; Dumeignil, F. Selective catalytic oxidation of glycerol: Perspectives for high value chemicals. Green Chem. 2011, 13, 1960–1979. [Google Scholar] [CrossRef]
- Dimitratos, N.; Villa, A.; Prati, L.; Hammond, C.; Chan-Thaw, C.E.; Cookson, J.; Bishop, P.T. Effect of the preparation method of supported Au nanoparticles in the liquid phase oxidation of glycerol. Appl. Catal. A Gen. 2016, 514, 267–275. [Google Scholar] [CrossRef]
- Skrzyńska, E.; Ftouni, J.; Mamede, A.-S.; Addad, A.; Trentesaux, M.; Girardon, J.-S.; Capron, M.; Dumeignil, F. Glycerol oxidation over gold supported catalysts—“Two faces” of sulphur based anchoring agent. J. Mol. Catal. A Chem. 2014, 382, 71–78. [Google Scholar] [CrossRef]
- Sánchez, B.S.; Gross, M.S.; Querini, C.A. Pt catalysts supported on ion exchange resins for selective glycerol oxidation. Effect of au incorporation. Catal. Today 2017, in press. [Google Scholar] [CrossRef]
- Zaid, S.; Skrzyńska, E.; Addad, A.; Nandi, S.; Jalowiecki-Duhamel, L.; Girardon, J.-S.; Capron, M.; Dumeignil, F. Development of silver based catalysts promoted by noble metal M (M = Au, Pd or Pt) for glycerol oxidation in liquid phase. Top. Catal. 2017, 1–10. [Google Scholar] [CrossRef]
- Mimura, N.; Hiyoshi, N.; Date, M.; Fujitani, T.; Dumeignil, F. Microscope analysis of Au-Pd/TiO2 glycerol oxidation catalysts prepared by deposition-precipitation method. Catal. Lett. 2014, 144, 2167–2175. [Google Scholar] [CrossRef]
- Mimura, N.; Hiyoshi, N.; Fujitani, T.; Dumeignil, F. Liquid phase oxidation of glycerol in batch and flow-type reactors with oxygen over Au-Pd nanoparticles stabilized in anion-exchange resin. RSC Adv. 2014, 4, 33416–33423. [Google Scholar] [CrossRef]
- Porta, F.; Prati, L. Selective oxidation of glycerol to sodium glycerate with gold-on-carbon catalyst: An insight into reaction selectivity. J. Catal. 2004, 224, 397–403. [Google Scholar] [CrossRef]
- Davis, S.E.; Ide, M.S.; Davis, R.J. Selective oxidation of alcohols and aldehydes over supported metal nanoparticles. Green Chem. 2013, 15, 17–45. [Google Scholar] [CrossRef]
- Skrzyńska, E.; Ftouni, J.; Girardon, J.-S.; Capron, M.; Jalowiecki-Duhamel, L.; Paul, J.-F.; Dumeignil, F. Quasi-homogeneous oxidation of glycerol by unsupported gold nanoparticles in the liquid phase. Chemsuschem 2012, 5, 2065–2078. [Google Scholar] [CrossRef] [PubMed]
- Demirel, S.; Lucas, M.; Waerna, J.; Murzin, D.; Claus, P. Reaction kinetics and modelling of the gold catalysed glycerol oxidation. Top. Catal. 2007, 44, 299–305. [Google Scholar] [CrossRef]
- Díaz, J.A.; Skrzyńska, E.; Girardon, J.-S.; Ftouni, J.; Capron, M.; Dumeignil, F.; Fongarland, P. Kinetic modeling of the quasi-homogeneous oxidation of glycerol over unsupported gold particles in the liquid phase. Eur. J. Lipid Sci. Technol. 2016, 118, 72–79. [Google Scholar] [CrossRef]
- Vannice, M.A.; Joyce, W.H. Kinetics of Catalytic Reactions; Springer: New York, NY, USA, 2006. [Google Scholar]
- Davis, M.E.; Davis, R.J. Fundamentals of Chemical Reaction Engineering; McGraw-Hill: New York, NY, USA, 2003. [Google Scholar]
- Murzin, D.; Salmi, T. Catalytic Kinetics; Elsevier: Amsterdam, The Netherlands, 2005. [Google Scholar]
- García-Vargas, J.M.; Valverde, J.L.; Díez, J.; Dorado, F.; Sánchez, P. Catalytic and kinetic analysis of the methane tri-reforming over a Ni–Mg/β-Sic catalyst. Int. J. Hydrog. Energy 2015, 40, 8677–8687. [Google Scholar] [CrossRef]
- Isbell, H.S.; Frush, H.L.; Martin, E.T. Reactions of carbohydrates with hydroperoxides. Carbohydr. Res. 1973, 26, 287–295. [Google Scholar] [CrossRef]
- Ketchie, W.C.; Murayama, M.; Davis, R.J. Promotional effect of hydroxyl on the aqueous phase oxidation of carbon monoxide and glycerol over supported Au catalysts. Top. Catal. 2007, 44, 307–317. [Google Scholar] [CrossRef]
- Shang, C.; Liu, Z.-P. Origin and activity of gold nanoparticles as aerobic oxidation catalysts in aqueous solution. J. Am. Chem. Soc. 2011, 133, 9938–9947. [Google Scholar] [CrossRef] [PubMed]
- Zope, B.N.; Hibbitts, D.D.; Neurock, M.; Davis, R.J. Reactivity of the gold/water interface during selective oxidation catalysis. Science 2010, 330, 74–78. [Google Scholar] [CrossRef] [PubMed]
- Díaz, J.A.; Skrzyńska, E.; Zaid, S.; Girardon, J.S.; Capron, M.; Dumeignil, F.; Fongarland, P. Kinetic modelling of the glycerol oxidation in the liquid phase: Comparison of Pt, Au and Ag as active phases. J. Chem. Technol. Biotechnol. 2017, 92, 2267–2275. [Google Scholar] [CrossRef]


| T (°C) | NaOH/GLY (mol/mol) | C0GLY (mol/L) | C0PRODUCTS (mol/L) | XGLY (%) a | Initial Reaction Rate b | SGLYCERIC (%) a | SGLYCOLIC (%) a |
|---|---|---|---|---|---|---|---|
| Without catalyst | |||||||
| 40 | 4 | 0.3 | - | 0 | 0 | - | - |
| 60 | 4 | 0.3 | - | 3.6 | 4.9 × 10⁻⁴ | 33.3 | 29.5 |
| 80 | 4 | 0.3 | - | 18.5 | 4.3 × 10⁻³ | 24.9 | 40.1 |
| 100 | 4 | 0.3 | - | 68.0 | 1.7 × 10⁻² | 17.2 | 49.9 |
| 60 | 0 | 0.3 | - | 0 | 0 | - | - |
| 60 | 1 | 0.3 | - | 1.6 | 2.0 × 10⁻⁴ | 48.7 | 13.9 |
| 60 | 2 | 0.3 | - | 1.8 | 3.4 × 10⁻⁴ | 51.0 | 19.2 |
| Au-based catalyst (GLY/Au ratio 3500 mol/mol) | |||||||
| 40 | 4 | 0.3 | - | 69.8 | 0.019 | 52.3 | 31.3 |
| 60 | 4 | 0.3 | - | 89.8 | 0.057 | 55.6 | 24.7 |
| 80 | 4 | 0.3 | - | 99.6 | 0.058 | 56.4 | 15.0 |
| 100 | 4 | 0.3 | - | 100 | 0.210 | 21.4 | 14.7 |
| 60 | 0 | 0.3 | - | 0 | 0 | - | - |
| 60 | 2 | 0.3 | - | 94.0 | 0.104 | 59.1 | 25.3 |
| 60 | 6 | 0.3 | - | 87.1 | 0.030 | 69.9 | 18.3 |
| 40 | 4 | 0.1 | - | 55.0 | 0.017 | 56.0 | 29.5 |
| 40 | 4 | 0.5 | - | 95.8 | 0.033 | 53.4 | 28.5 |
| 60 | 4 | 0.1 | - | 99.9 | 0.132 | 54.1 | 22.2 |
| 60 | 4 | 0.1 | 0.1 Glyceric acid | 88.6 | 0.024 | 10.1 | 12.8 |
| 60 | 4 | 0.1 | 0.1 Tartronic acid | 94.6 | 0.082 | 62.3 | 11.3 |
| 60 | 4 | 0.3 | 0.1 Glycolic acid | 87.4 | 0.052 | 61.2 | 20.4 |
| 60 | 4 | 0.1 | 0.1 Formic acid | 100 | 0.140 | 42.1 | 23.7 |
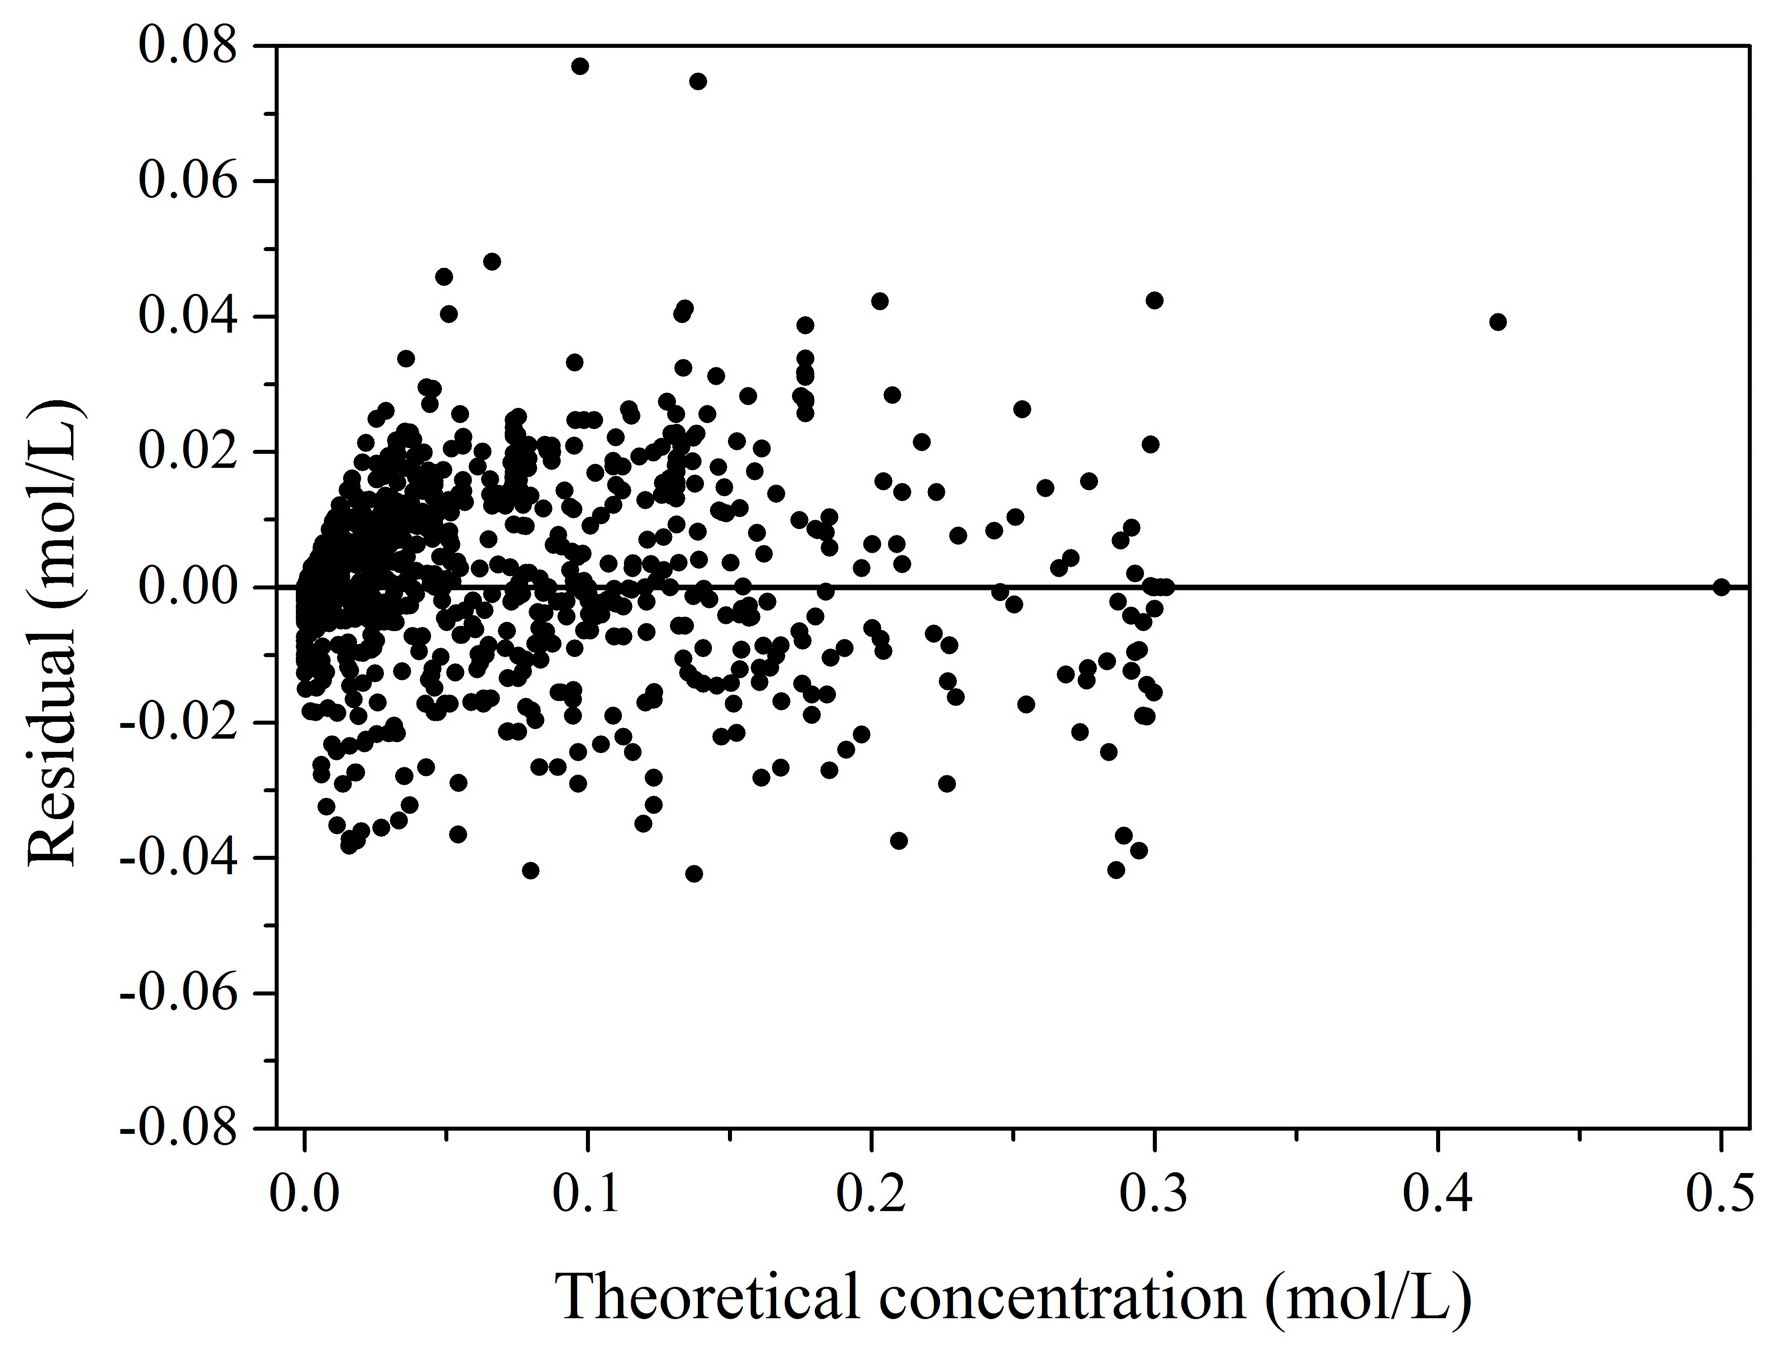
| r2 = 0.9729 | ||
|---|---|---|
| Parameter a | Estimate ± σ/1%σ| | t-Test b/Meaningful? |
| −9.65 ± 0.11/1.14% | 87.64 > 1.96/YES | |
| 35.58 ± 0.51/1.43% | 69.72 > 1.96/YES | |
| −7.31 ± 0.05/0.69% | 146.2 > 1.96/YES | |
| 27.35 ± 0.34/1.24% | 80.44 > 1.96/YES | |
| −9.74 ± 0.10/0.98% | 97.40 > 1.96/YES | |
| 30.13 ± 0.20/0.67% | 150.65 > 1.96/YES | |
| 5.87 ± 0.13/2.14% | 45.15 > 1.96/YES | |
| −1.99 ± 0.27/13.65% | 7.37 > 1.96/YES | |
| 3.60 ± 0.13/3.57% | 27.69 > 1.96/YES | |
| 3.26 ± 0.48/14.82% | 6.79 > 1.96/YES | |
| 5.09 ± 0.13/2.46% | 39.15 > 1.96/YES | |
| −10.38 ± 0.30/2.93% | 34.6 > 1.96/YES | |
| 2.69 ± 0.18/6.83% | 14.94 > 1.96/YES | |
| −0.91 ± 0.59/64.49% | 1.54 > 1.96/NO | |
| 2.95 ± 0.13/4.43% | 22.69 > 1.96/YES | |
| −19.56 ± 0.22/1.14% | 88.91 > 1.96/YES | |
| 4.99 ± 0.08/1.62% | 62.37 > 1.96/YES | |
| −12.34 ± 0.45/3.63% | 27.42 > 1.96/YES | |
| 3.86 ± 0.07/1.77% | 55.14 > 1.96/YES | |
| −3.14 ± 0.19/6.10% | 16.53 > 1.96/YES | |
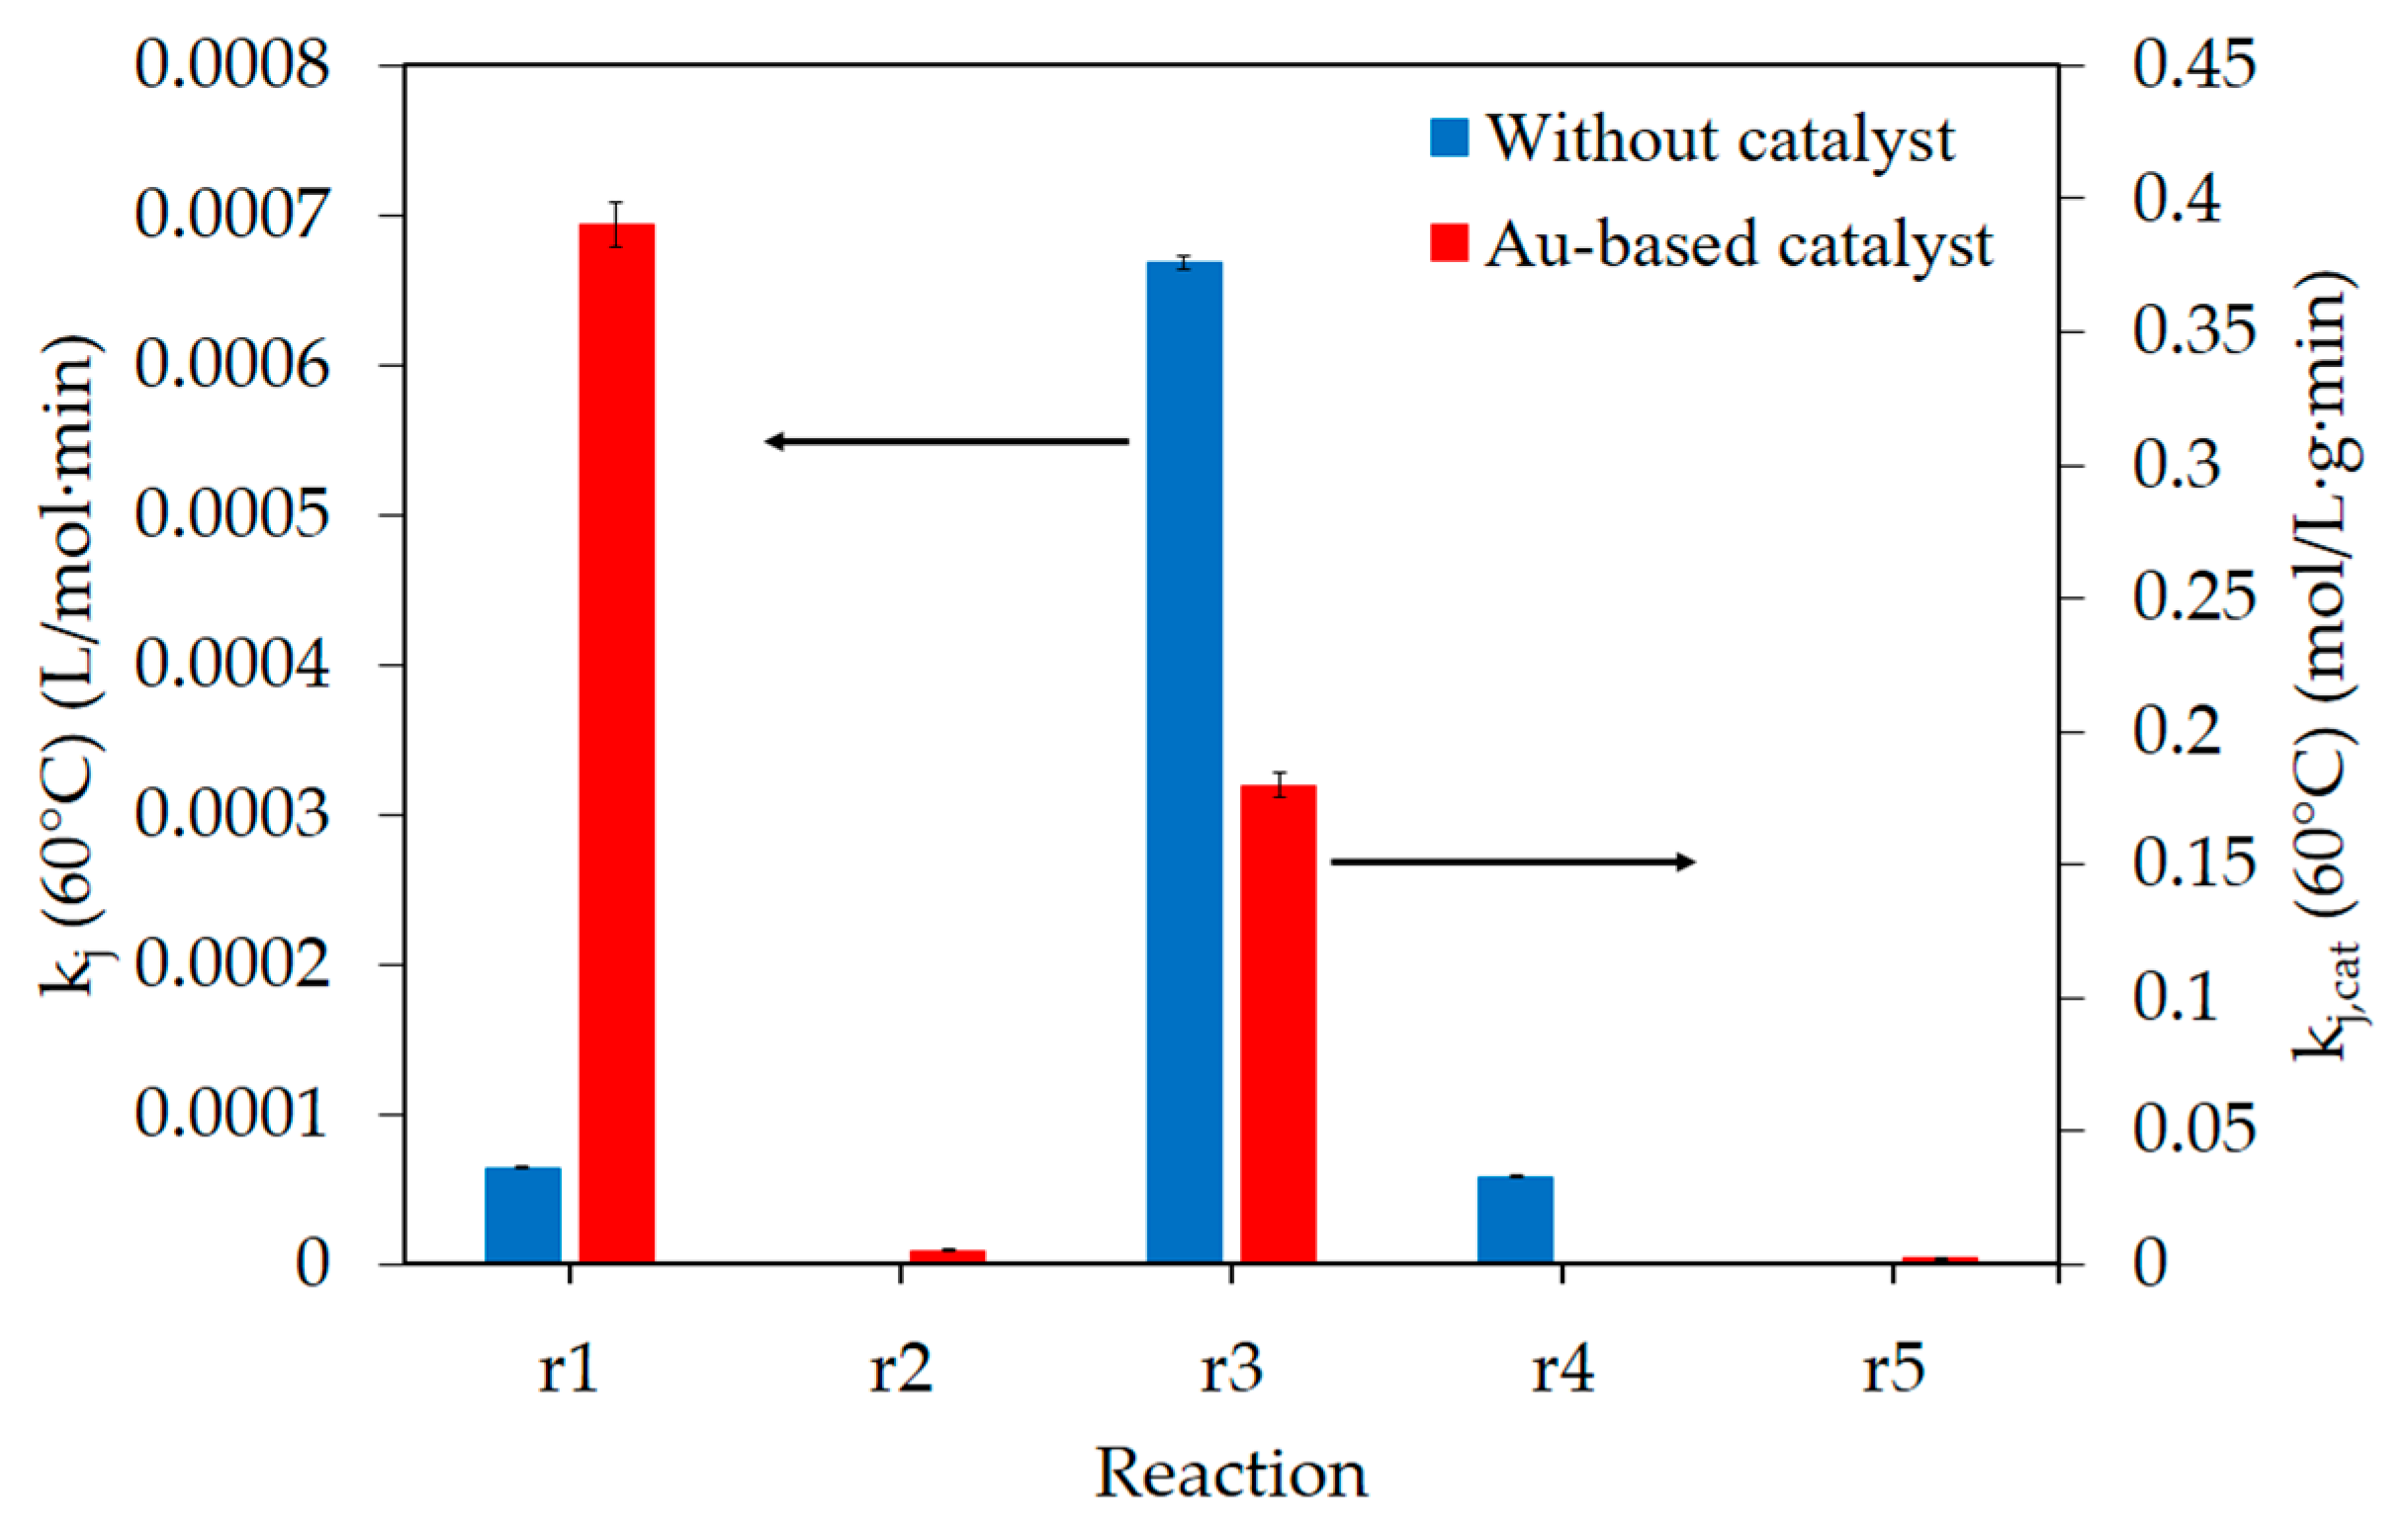
| Reaction | kj (60 °C) | Activation Energy | |||
| Without catalyst | r1 | 6.51 × 10⁻⁵ | L/(mol·min) | 99 | kJ/mol |
| r3 | 6.69 × 10⁻⁴ | 76 | |||
| r4 | 5.89 × 10⁻⁵ | 83 | |||
| Au-based catalyst | r1,cat | 0.39 | mol/(L·g·min) | 57 | kJ/mol |
| r2,cat | 5.25 × 10⁻³ | 52 | |||
| r3,cat | 0.18 | 34 | |||
| r5,cat | 2.11 × 10⁻³ | 40 | |||
| Adsorption Terms | Kj (60 °C) | Adsorption Enthalpy | |||
| Glycerol | 19.11 | L/mol | −54 | kJ/mol | |
| Glyceric acid | 146.94 | −34 | |||
| OH− | 47.46 | −9 | |||
| Catalyst | (kJ/mol) a | Reference |
|---|---|---|
| Au/Al2O3 | 57 | This work |
| Au/C | 50 b | [20] |
| Pt-Bi/C | 67 | [3] |
| Catalyst | Metal Loading (wt %) | Main Au Particle Diameter 1 (nm) | Theoretical Dispersion (%) |
|---|---|---|---|
| Au/Al2O3 | 0.98 | 4.7 ± 2.6 | 30 |
© 2017 by the authors. Licensee MDPI, Basel, Switzerland. This article is an open access article distributed under the terms and conditions of the Creative Commons Attribution (CC BY) license (http://creativecommons.org/licenses/by/4.0/).
Share and Cite
Díaz, J.A.; Skrzyńska, E.; Girardon, J.-S.; Capron, M.; Dumeignil, F.; Fongarland, P. Glycerol Oxidation in the Liquid Phase over a Gold-Supported Catalyst: Kinetic Analysis and Modelling. ChemEngineering 2017, 1, 7. https://doi.org/10.3390/chemengineering1010007
Díaz JA, Skrzyńska E, Girardon J-S, Capron M, Dumeignil F, Fongarland P. Glycerol Oxidation in the Liquid Phase over a Gold-Supported Catalyst: Kinetic Analysis and Modelling. ChemEngineering. 2017; 1(1):7. https://doi.org/10.3390/chemengineering1010007
Chicago/Turabian StyleDíaz, José Antonio, Elżbieta Skrzyńska, Jean-Sébastien Girardon, Mickaël Capron, Franck Dumeignil, and Pascal Fongarland. 2017. "Glycerol Oxidation in the Liquid Phase over a Gold-Supported Catalyst: Kinetic Analysis and Modelling" ChemEngineering 1, no. 1: 7. https://doi.org/10.3390/chemengineering1010007