Oxidation of Glycerol with Unactivated Electroless CuNiMoP Catalyst


1
Department of Civil & Environmental Engineering, Florida A&M University, Tallahassee, FL 32310, USA
2
Department of Chemistry, Florida A&M University, Tallahassee, FL 32307, USA
3
Department of Chemical & Biomedical Engineering, Florida A&M University, Tallahassee, FL 32310, USA
*
Author to whom correspondence should be addressed.
ChemEngineering 2017, 1(2), 11; https://doi.org/10.3390/chemengineering1020011
Submission received: 10 September 2017
/
Revised: 24 October 2017
/
Accepted: 25 October 2017
/
Published: 27 October 2017
Abstract
:Unannealed CuNiMoP electrocatalyst was found active in electrochemical oxidation of glycerol, providing over 60% conversion without optimization. Prompted by this result, the same catalyst was investigated for the thermochemical oxidation of glycerol. For the thermochemical oxidation of glycerol using the as-deposited electroless CuNiMoP catalyst, a 23 full factorial design of experiments (two level factorial experiment design with three factors) to assess the influence of temperature (A), reaction time (B) and pressure (C). The major reaction products detected by high performance liquid chromatography (HPLC) were glyceric, hydroxypyruvic, tartronic, oxalic and formic acids. The factors found to be most significant for the production of glyceric and tartronic acids were A, B, C, AB and BC. The highest percent conversion obtained for 30-min and 60-min catalysts was 10.6% and 9.4%, respectively. The presence of lactic acid was observed only for the 60-min as-deposited electroless CuNiMoP/Al2O3 catalyst. The results suggest the feasibility of an inexpensive catalyst based on non-noble metals for the thermochemical oxidation of glycerol through the electroless deposition technique. Some differences exist between the thermochemical and electrochemical product selectivity of the CuNiMoP catalyst, and reasons are suggested for the observed differences.
1. Introduction
The production and use of fossil fuels have long-standing negative impacts on the global climate, public health, local communities and ecosystem goods and services [1]. This motivates the development of renewable energy sources, which include the production of bio-ethanol, biogas and biodiesel [2]. With an increase in biodiesel production comes an increase in the production of crude glycerol, as it is a by-product of the transesterification of vegetable and animal fats/oils. Crude glycerol has little economic or industrial value due to the presence of methanol, inorganic salts, free fatty acids and unreacted esters. The purification process required to produce pure glycerol is very costly and involves many steps; thus, it would be beneficial to develop processes that make use of the unpurified compound directly [3,4,5,6].
Due to the presence of three hydroxyl groups in glycerol, its oxidation under certain specific conditions affords high-value chemicals such as glyceric acid, tartronic acid, mesoxalic acid and dihydroxyacetone. Tartronic acid is a very costly reagent (US$1564.00 per gram), as well as a high-value chemical in the pharmaceutical industry for obesity and osteoporosis treatment. It is also used as an anti-corrosive protective agent in boilers and high temperature applications and as an oxygen scavenger in the food industry [2]. Glyceric acid is also very costly to produce; thus, 10 mg of it can cost as much as US$56.00. It is thus conceivable that developing inexpensive oxidation catalysts that can be applied to both pure and crude glycerol will potentially make these chemicals more widely available.
There are several ways in which catalytic oxidation of glycerol occurs, with essential features of the mechanism being the simultaneous dehydrogenation of the hydroxyl group and oxidation of the formed intermediates. The dehydrogenation of the primary alcoholic functions on the metal surface is dependent on the presence of a base, and the reaction rate is directly proportional to the concentration of the base used [7]. The use of a basic medium enhances the selectivity of glyceric and tartronic acids as compared to the application of an acidic medium that yields dihydroxyacetone, hydroxypyruvic acid and mesoxalic acid [8]. The production of three-carbon compounds from glycerol has been extensively investigated [9,10,11,12,13]. Research has been conducted where noble-metal nanoparticles such as palladium (Pd), platinum (Pt) and gold (Au) in a basic medium have been used in the oxidation of glycerol [14]. With the use of Pd and Pt as the catalysts, glyceric acid is the major product formed [15] and tartronic acid and oxalate as the major over-oxidation by-products [16]. Furthermore, the addition of bismuth to Pt catalyst resulted in the oxidation of the secondary hydroxyl group, improved catalytic performance, selectivity and stability [8].
The use of Pt/CeO2 catalysts was reported to promote the oxidation of the primary hydroxyl groups to produce a 40% tartronic acid yield [16]. The main drawback of the application of both Pt and Pd is their decrease in catalytic performance at prolonged reaction times. One percent Au supported on activated carbon and graphite afforded 100% selectivity of glyceric acid under mild conditions of 333 K and 0.3–0.6 MPa of oxygen [17]. The presence of Pt on the Au metal surface affected the selectivity of oxidation products; the use of the mole fraction of Pt between 0.25 and 0.33 increased the selectivity of dihydroxyacetone and decreased that of glyceric acid [18]. Not only is the selectivity of glycerol oxidation products affected by the nature of metal catalyst used, the use of crude glycerol is found to affect both the selectivity and reaction rates of glycerol oxidation [3]. Although limited thermochemical and electrochemical oxidation of crude glycerol has been conducted, one of the reported works shows that crude glycerol significantly decreased the reaction rates of Ag/Al2O3, Au/Al2O3, Pd/Al2O3 and Pt/Al2O3 and also affected the selectivity of formic acid and glyceric acid [3]. The reason for this is not unconnected with the impurities found in crude glycerol including methanol, ash (sodium sulfate), organic sulfur derivatives (OSD) and non-methanol organic matter derivatives (MONG-NM). The noble metal-based catalysts are prone to poison by sulfur; thus, interest in the development of non-noble metal-based catalysts [7] that can tolerate sulfur becomes attractive. Hence, catalytic systems developed for glycerol oxidation must have enhanced sulfur and MONG-NM resistance [3,19].
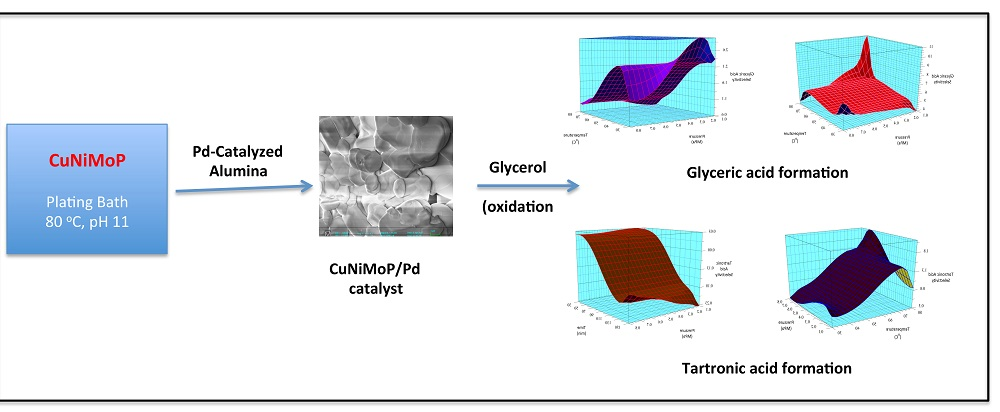
A drawback of the aforementioned approaches is the price of the noble metal used in the catalysts. A potential cost-effective approach would involve the use of non-noble metal-based catalyst for the thermochemical oxidation of glycerol. Elendu et al. [20] synthesized low-cost transition metal-based catalyst containing copper, nickel, molybdenum and phosphorus for the electrochemical oxidation of glycerol. The major electrochemical oxidation products of the electroless catalysts were not provided in [20], but were discussed extensively in [21]. Our interest in this work is to evaluate the as-deposited electroless CuNiMoP catalyst for its thermochemical oxidation capability for pure glycerol and compare its thermochemical oxidation products’ selectivity versus its electrochemical oxidation products’ selectivity for pure glycerol as reported in [21]. A qualitative comparison of the electrochemical and thermochemical oxidation products of the catalyst could provide insight into the mechanism that is operating at different electrochemical oxidation potentials. The effect of deposition time of CuNiMoP onto the catalyst support was also evaluated. A 23 full factorial design of experiments was performed to assess the influence of temperature, time and pressure on the oxidation products from pure glycerol.
2. Materials and Methods
All chemicals were used as received without any further purification. CuSO4·5H2O (≥98%), NiSO4·6H2O (≥98%), H2NaO2P·H2O (≥99%), Na2MoO4·2H2O (≥99%) and HCOOH (ACS, 37 wt% in H2O, contains 10–15% methanol as a stabilizer solution) were purchased from Sigma-Aldrich. Sodium citrate dihydrate (99%), gluconic acid potassium salt (99%) and potassium sodium L-tartrate tetrahydrate (ACS, 99%–102.0%) were purchased from Alfa Aesar. Degassed deionized water was used throughout the experiment.
2.1. Catalyst Preparation via Electroless Plating
Based on studies conducted by Elendu et al. [20], a CuNiMoP bath was prepared using the reagents shown in Table 1. The plating bath was allowed to reach a temperature of 80 °C, and a few drops of concentrated NaOH were added to bring the pH to 11. The catalyst support, Pd catalyzed alumina, was then introduced, and the mixture was continuously stirred. Plating was conducted for 30 and 60 min. At the end of each plating time, the plating mixture was placed in an ice bath for approximately 2 min. The reaction mixture was then centrifuged for 15 min, and the solution was pipetted out, leaving the solid catalyst, which was subsequently washed with distilled water and 2-propanol and dried for 24 h at 60 °C. Subsequently, the catalyst was subjected to physical characterization.
2.2. Characterization of CuNiMoP/Al2O3
The prepared catalyst was characterized by three methods: scanning electron microscopy (SEM), X-ray diffraction (XRD) and energy dispersive spectroscopy (EDS). Zeiss 1540 XB Cross Beam SEM was conducted to determine the change in morphology of the alumina surface after electroless deposition. XRD was performed to determine the crystallinity of the deposited catalyst on the alumina surface, while EDS was done to identify the elemental composition of the catalyst.
2.3. Oxidation Experiments
The glycerol oxidations were carried out in a 250-mL high-pressure chemical reactor equipped with pressure, temperature and speed controllers (Yudian 508/509). The 23 full factorial experiments were designed to investigate the influence of temperature, time and pressure on glycerol oxidation as shown in Table 2. Each reaction was conducted twice at the prescribed conditions. The reactions were performed with 100 mL of an aqueous glycerol/NaOH (0.3/1.2 M) solution, 0.1 g of the respective catalyst and a stirring rate of 205 rpm. Samples were taken after each experiment and subjected to analysis via high performance liquid chromatography (HPLC).
2.4. Product Analysis
The quantitative analysis of each reaction mixture was conducted by HPLC. The chromatograph (Schimadzu Technologies) was equipped with a Hi-plex column (7.7 mm × 300 mm, Agilent), a refractive index and a UV (190 nm) detector. Dilute H2SO4 (5 mM) was used as the eluent. Three hundred microliters of each sample were diluted with distilled water with a dilution factor of 5/3. An injection volume of 10 μL, a measuring time of 20 min and a flow rate of 0.7 mL min−1 were adjusted.
3. Results and Discussion
3.1. Catalyst Characterization
The electroless CuNiMoP deposited on alumina was characterized using SEM, XRD and EDS. The change in the surface morphology from the alumina to the deposited samples is evident in the SEM images. Figure 1a shows that the alumina surface is flat and free of any particles before any electroless deposition. In Figure 1b,c, changes can be observed on the surface of the catalyst after 30 min and with the increase in plating time to 60 min. The particle density on the substrates varies also with deposition time. For both the 30-min and 60-min samples, clusters of particles on the substrate edges result in thicker particle deposition on the edges. The size of the Al2O3 substrate on which the catalyst was deposited ranges from 1.5–2.0 μm, while the average catalyst particle size is 63 nm and 83.3 nm for the 30-min and 60-min deposition times, respectively.
Characteristic peaks of the Cu, Ni, Mo, P or their alloys are not uniquely identifiable in Figure 2 since the XRD patterns for the Al2O3 substrate dominate the 30- and 60-min as-deposited catalysts. Chen et al. experienced the same difficulty for CuNiMo/CeO2 catalyst used for the hydrogenation of CO since the CeO2 displayed four distinctive peaks dominantly present in all their samples, making it difficult to identify CuO in their catalyst [22]. However, EDS was successful in recognizing the elements present in the analyzed samples.
Figure 3 confirms the presence of the elements used in the CuNiMoP bath and the Al2O3 support. With the spectra of Cu and Ni shown in the figure and supported by their composition in Table 3, there is the obvious suggestion that more active catalyst materials are deposited in the 60-min electroless catalyst than in the 30-min sample. In addition, the weight percentages in Table 3 display the relationship between plating time and the amount of deposited material. Approximately, the composition of Cu and Ni deposited on the catalyst support increased by about 86% and 21%, respectively as the plating time increased from 30–60 min. The approximate compositions of the 30- and 60-min samples were Cu21N14Mo and Cu39Ni17Mo, respectively. Phosphorus was not detected in the catalyst.
3.2. Products Formed from Thermochemical Oxidation of Glycerol
Table 4 and Table 5 show that both the 30-min and 60-min as-deposited electroless CuNiMoP/Al2O3-catalyzed oxidations afforded similar oxidative products such as glyceric, hydroxypyruvic, tartronic, oxalic and formic acids. In addition to these products, lactic acid was only observed with the use of the 60-min as-deposited electroless CuNiMoP/Al2O3 catalyst. Both tables show that the percent conversion of glycerol for both catalysts was low and that the increase in catalyst deposition time did not confer any significant effect on the catalytic performance. In over 16 experimental runs, the highest percent conversions of glycerol obtained were 10.6% and 9.4% for the 30-min and 60-min as-deposited electroless CuNiMoP/Al2O3, respectively. The slightly higher percent conversion of the 30-min sample was probably a consequence of it having more active sites than the 60-min sample. We speculate that the poor catalytic behavior may be due to the catalyst being used “as-deposited” without any subsequent reductive treatment with hydrogen under thermal or annealing conditions. It can be inferred that the as-deposited electroless catalyst may contain surface oxides. Thus, it can be postulated that the presence of copper and nickel oxides and amorphous deposits on the catalyst surface hindered CuNiMoP/Al2O3’s activity to further oxidize glycerol into the respective three-carbon products. The low conversion observed here for the catalyst was not the case when the catalyst was used for the electrochemical oxidation of glycerol.
The observed low glycerol conversion can also be attributed to the low stirring rate applied in each experimental run. The slow stir speed of 205 rpm may not have dispersed the heavy catalyst particles uniformly throughout the glycerol solution mixture. Thus, not all the active sites for each catalyst molecule were exposed in an equivalent manner. In addition, due to inadequate stirring, some catalyst particles may have settled at the bottom of the reactor during each experimental run. It is suggested to anneal the catalyst under hydrogen after deposition and to perform each reaction at a stirring rate of approximately 500 rpm, in order to improve catalytic activity. As the 30-min as-deposited catalyst showed a slightly higher activity than the 60-min as-deposited catalyst, a shorter deposition time may also advance catalytic performance.
The low conversions obtained in the oxidation of pure glycerol with both our catalysts led us to postulate negligible conversion for crude glycerol using the same catalysts. This will be in agreement with the case of noble metals in the oxidation of crude glycerol, in which reaction rates were decreased by at least half in comparison to the rates for oxidation of pure glycerol [3]. In order to extend this study to crude glycerol, we must first optimize reaction conditions for pure glycerol oxidation to make the process more practical.
Unlike the thermochemical oxidation process, the electrochemical oxidation products reported in [21], in addition to organic acid byproducts, included partial oxidation products of glycerol such as aldehydes and ketones. Further, the products’ selectivity was found to be sensitive to the oxidation potential. The electrochemical oxidation was carried out in a batch reactor and the oxidation products sampled with time. The key by-products reported after 24-h batch oxidations were formic and tartronic acids at 0.5 V. As the oxidation potential increased to 0.7 V, the major products were glyceraldehyde, tartronic acid and formic acid. With the increase of potential to 0.9 V, the number of by-products found after 24 h included dihydroxyacetone, glyceraldehyde, tartronic acid, formic acid, mesoxalic acid and lactic acid. At a potential of 1.1 V for which 62% conversion was achieved, glyceraldehyde, mesoxalic and tartronic acids were the major oxidation products. A comparison of the batch thermochemical oxidation products with those formed from electrochemistry suggests that the electrochemical process is milder than the thermochemical oxidation. No intermediate oxidation products such as aldehydes and ketones were recovered from the thermochemical oxidation carried out within 2-h batch oxidation. This contrasts with the electrochemical process where even after 24 h under certain potentials, dihydroxyacetone and glyceraldehyde were produced in very large quantities. Although the electrochemical reaction mechanism for the catalyst may be similar to the thermochemical mechanism in some respects, the differences in the products’ distribution observed in the two systems suggest that some important differences exist. One such difference could be that while under electrochemical conditions, the unactivated catalyst (probably covered by surface oxide) allowed electron flow for glycerol oxidation; while under thermochemical conditions, such electron exchange for oxidation could be hindered. The existence of possible differences in the two mechanisms is currently being investigated in our labs.
3.3. Reaction Mechanism
Scheme 1 suggests that the oxidation of the primary hydroxyl functionality of glycerol can form glyceraldehyde, which is subsequently oxidized to glyceric acid. Given that glyceraldehyde was not detected by HPLC, it is hypothesized that it is very reactive under our thermochemical reaction conditions and is thus rapidly oxidized into glyceric acid by the electroless CuNiMoP/Al2O3 catalyst. Researchers using a similar starting solution of 0.3/1.2 M Gly/NaOH concluded that glyceraldehyde was unstable under the applied reaction conditions (60 °C, O2 at a pressure of 5 bar) [23]. They substantiated this claim by the addition of 0.1 M glyceraldehyde solution to NaOH, which produced a number of derivatives as judged by HPLC [23]. The production of multiple derivatives was also observed during our calibration of pure glyceraldehyde solutions. Dihydroxyacetone (Scheme 1) was also undetected by HPLC; however, it is hypothesized that a similar mechanism as speculated for glyceric acid could account for the presence of hydroxypyruvic acid, which is produced via the oxidation of the secondary hydroxyl group of glycerol [23], without the observed presence of dihydroxyacetone. Glyoxylic acid was also not detected by HPLC, but its absence can be explained through the Cannizzaro reaction, in which the intermediate glyoxylic acid is quickly converted into oxalic acid. This is in line with Skryńska et al. (2012), who attributed the absence of glyoxylic acid in their reaction mixture to the Cannizzaro reaction [23].
Glyceric acid is further oxidized via two separate routes into either tartronic acid or oxalic acid (Scheme 1). The first pathway shows the oxidation of the primary hydroxyl group of glyceric acid to form tartronic acid, while the other pathway shows the C-C cleavage of glyceric acid to produce formic and oxalic acids. In the course of this experiment, it was observed that glycerol oxidation on the 60-min CuNiMoP/Al2O3 yielded lactic acid as suggested in Scheme 1. According to [24], glyceraldehyde is dehydrated to produce 2-hydroxypropenal, which undergoes keto-enol tautomerization to give pyruvaldehyde, which, through benzylic acid arrangement, is converted into lactic acid [24].
3.4. Conditions that Affect Glycerol Oxidation to High Value Chemicals
Glyceric and tartronic acids are two high-value chemicals of interest resulting from the thermochemical oxidation of glycerol on CuNiMoP/Al2O3. As shown in Table 6, the CuNiMoP catalysts displayed a much higher selectivity for glyceric acid versus tartronic acid production. For the 30-min as-deposited catalysts, the highest selectivities for both glyceric (8.11) and tartronic acids (0.43) were obtained for Run 3. However, for the 60-min as-deposited catalysts, the highest selectivities for glyceric (14.84) and tartronic acids (5.45) were obtained for Runs 2 and 8, respectively. Simple statistical analysis of the experimental results was undertaken for further elucidation of the conditions that favored the production of these by-products.
3.4.1. Glyceric Acid
A half-normal plot for both the 30- and 60-min as-deposited electroless CuNiMoP/Al2O3 reactions as in Figure 4 shows that all the factors and several of their interactions are positioned to the right side of the normal line. This implies that these factors and their interactions, except the time-pressure interaction, are significant for glyceric acid formation. Time (B), pressure (C) and the interaction (BC) contribute the most to the conversion of glycerol into glyceric acid. As the plots in Figure 4 indicate, B, C and BC contribute at least 65% to glyceric acid formation.
Using ANOVA analysis, the main factors and their interactions were tested for significance for glyceric acid production at the 95% confidence level. Table 7 shows that for 30-min as-deposited electroless CuNiMoP/Al2O3 oxidation reactions, low p-values were obtained for temperature (A: 0.026), pressure (C: 0.038) and all the interactions (AC: 0.017, BC: 0.035 and AB: 0.017). With respect to the 60-min as-deposited electroless CuNiMoP/Al2O3 oxidation reactions, a p-value of 0.004 was obtained for the AC interactions. These respective p-values agree with the half-normal and interaction plot, and thus, the factors are significant for the formation of glyceric acid.
A simple regression analysis for glyceric acid production is represented by Equations (1) and (2) for the 30- and 60-min as-deposited electroless CuNiMoP/Al2O3 catalysts, respectively. The R-squared values for both models were 87.4%, indicating that the equations can be used to predict the amount of glyceric acid produced at any given temperature, time and pressure.
Equations (1) and (2) can also be represented by 3D surface plots as shown in Figure 5. The factors chosen for the x- and y-axes in Figure 5 were based on the p-values determined by the ANOVA analysis. Using Figure 5, very low glyceric acid production is estimated to occur at 0.1 MPa and 30 °C (low pressure and temperature) for both the 30-min (Figure 5a) and 60-min (Figure 5b) as-deposited catalyst’s reactions. This contrasts with the highest production rates estimated to occur at about 0.55 MPa and 80 °C for the 30-min as-deposited catalyst. This is also within the range for the 60-min sample as shown in Figure 5b.
3.4.2. Tartronic Acid
Similar statistical analysis done for glyceric acid was performed for tartronic acid, and the results are represented in Figure 6 and Figure 7. While time (B) and pressure (C) are given as the only significant factors for tartronic acid production for the 30-min sample in Figure 6a, the result in Figure 6b shows that for the 60-min sample, all the main factors and their interactions are significant for tartronic acid formation. This difference in behavior for the two catalyst samples is further demonstrated by the BC interaction results, where for the 30-min as-deposited electroless CuNiMoP/Al2O3 sample, a p-value of 0.055 was obtained while the 60-min as-deposited electroless CuNiMoP/Al2O3 sample gave a low p-value (<0.05) for all factors and factor interactions except for time (B) (see Table 8). This analysis revealed that the temperature-pressure interaction (0.009) is the most statistically significant factor for tartronic acid formation. Thus, the half-normal plots and the ANOVA analysis agree that the AC interaction is significant for the formation of tartronic acid for the 60-min as-deposited electroless CuNiMoP/Al2O3 reactions.
The regression for tartronic acid formation for the 30-min and 60-min as-deposited electroless catalysts, as given by Equations (3) and (4), gave R-squared values of 77.86% and 87.40%, respectively. Similar to glyceric acid, the equations can be used to predict the amount of tartronic acid produced at any prescribed temperature, time and pressure.
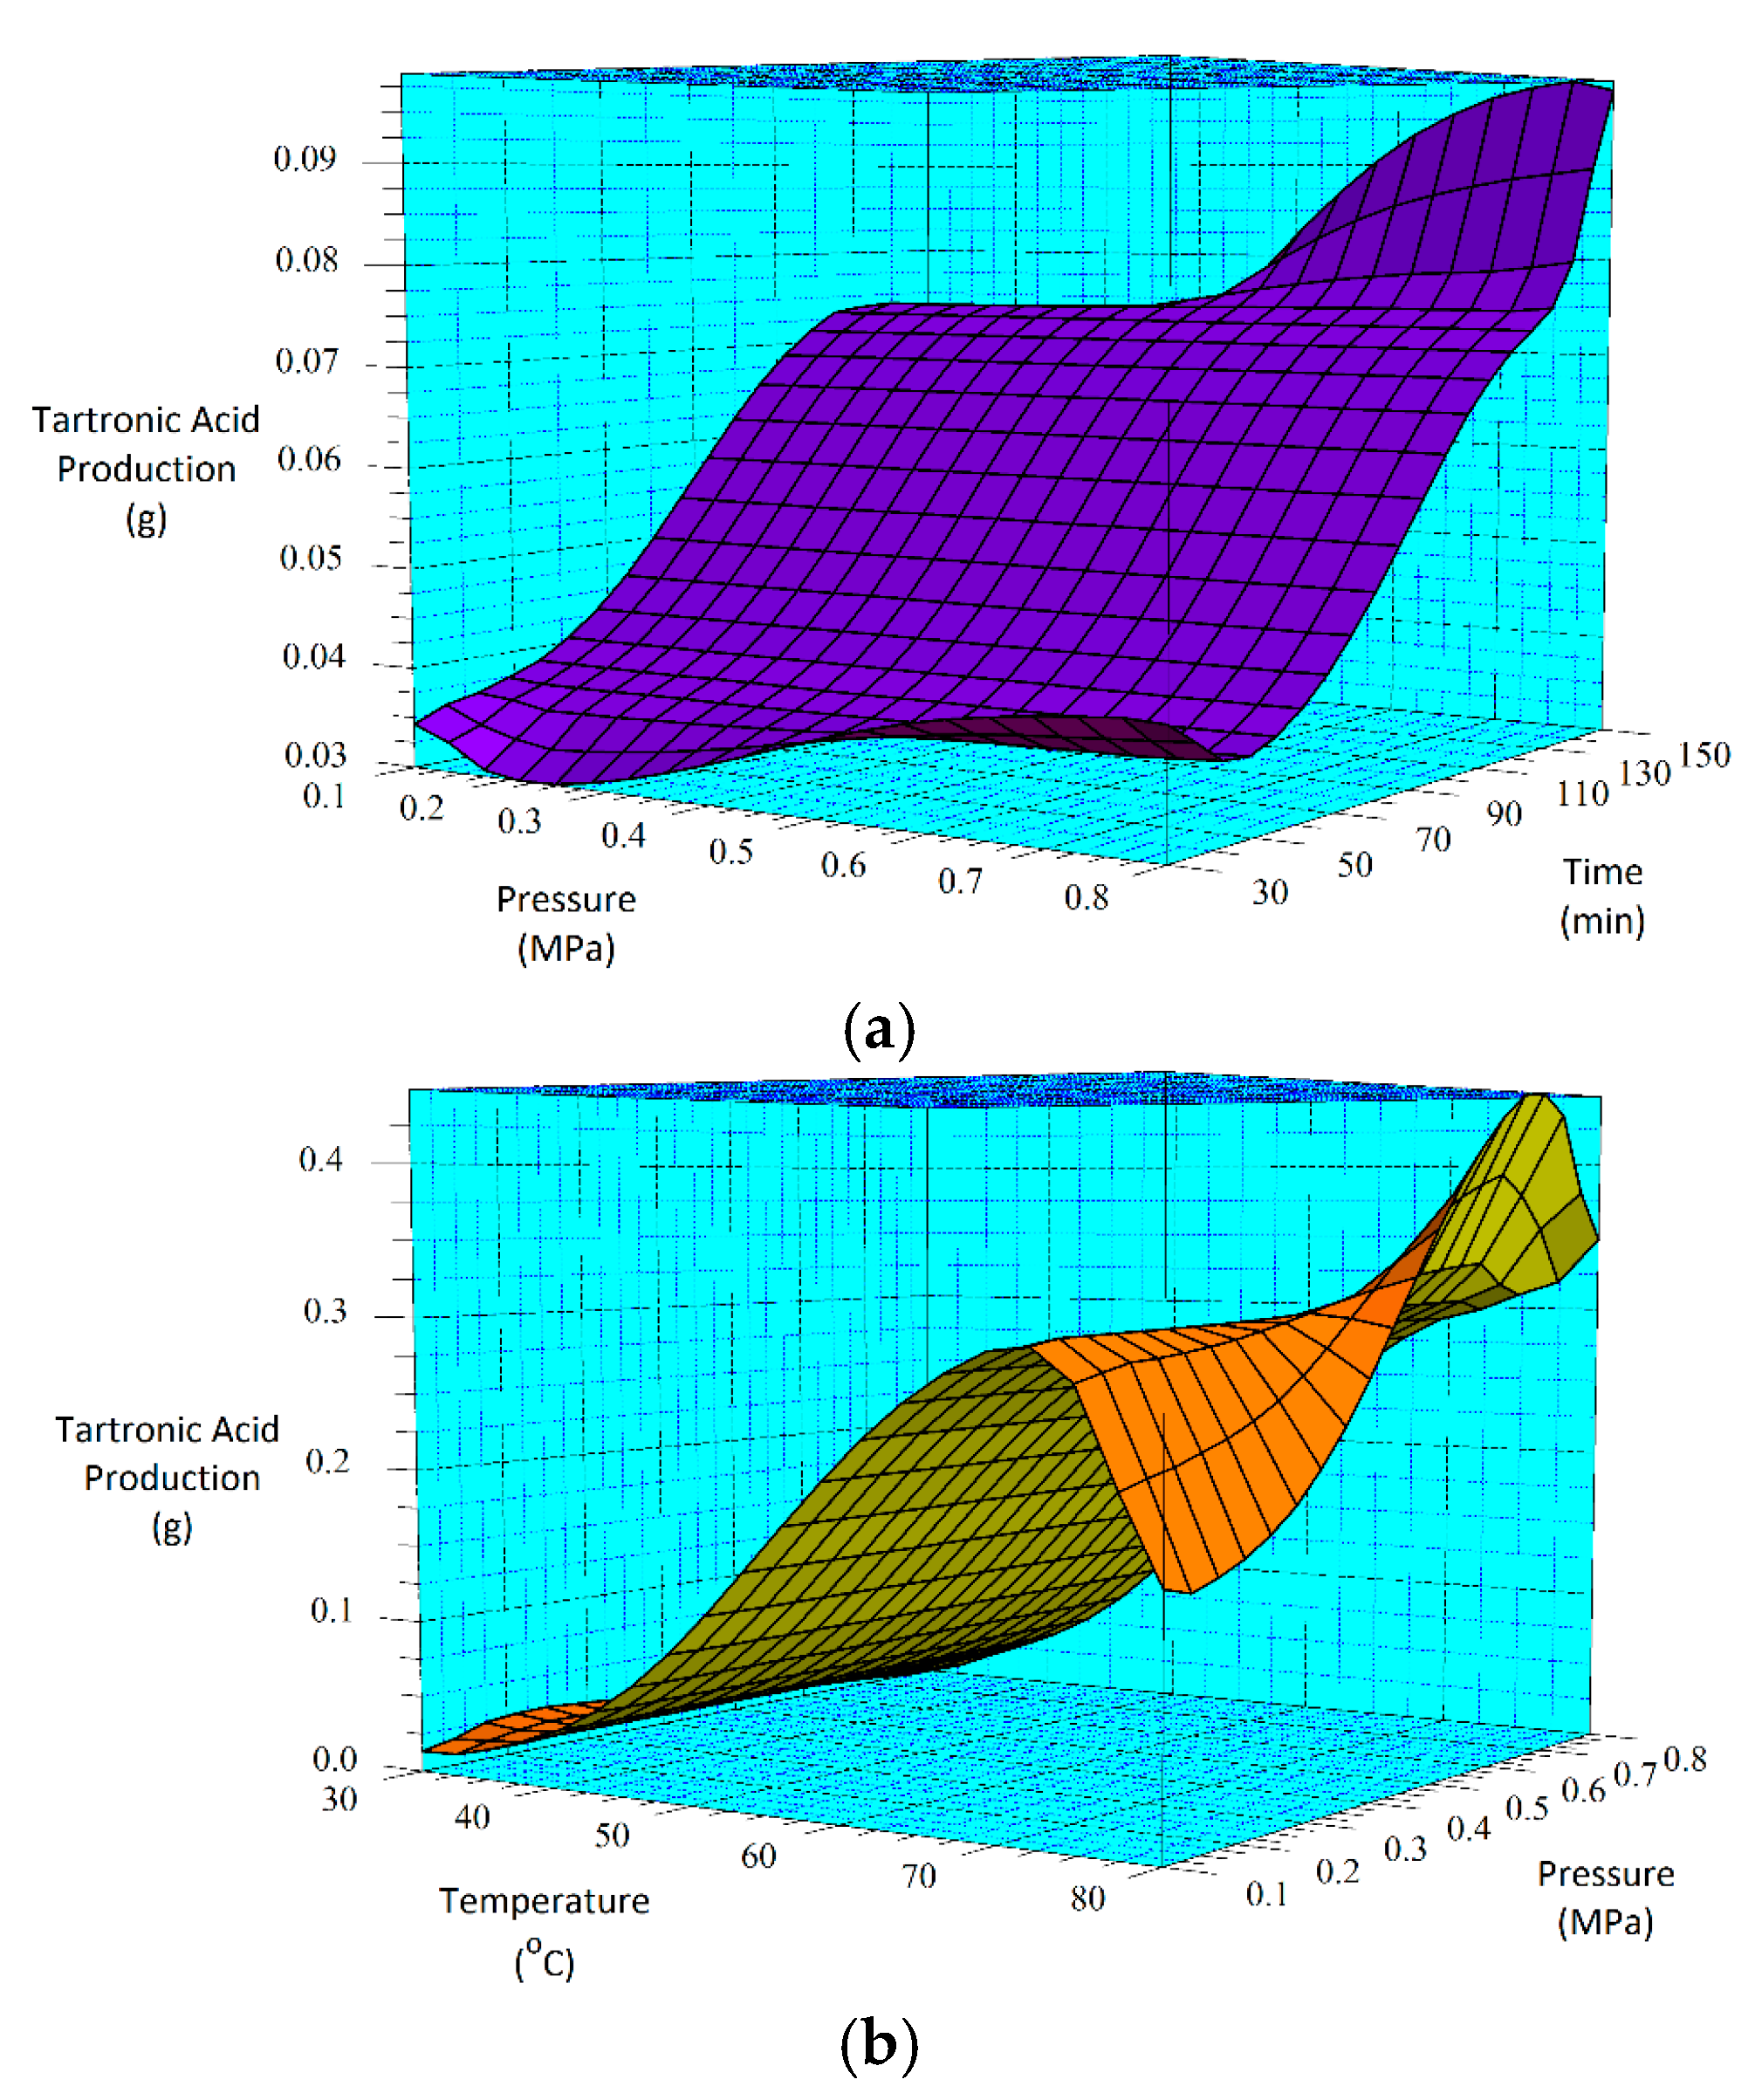
According to the regression model, while the lowest tartronic acid production occurs at 0.3 MPa and 30-min reaction time for the 30-min catalyst sample, the highest production is estimated to occur at 0.8 MPa and 150 min. On the other hand, Figure 7b suggests that for the 60-min catalyst sample, the minimum and maximum tartronic acid product will occur at conditions of 0.1 MPa, 30 °C and 0.5 MPa, 80 °C, respectively.
3.4.3. Significance of Time on Glyceric Acid and Tartronic Acid Production
The p-values obtained for time (B) for both glyceric and tartronic acids productions (above 0.05) suggest that time (B) is not significant. Intuitively, one would have expected that short reaction times would favor glyceric and tartronic acids formations, while long reaction times favor further oxidation of glyceric and tartronic acids into oxalic and formic acids, respectively. Examination of the time p-values for the formation of formic and oxalic acids with the 30-min catalyst sample yielded 0.095 and 0.084, respectively. These p-values are higher than 0.05, suggesting that time is not significant for their formation. Relatively, it may be argued that time is more important for their formation than for tartronic acid with a p-value of 0.446. On the other hand, for the 60-min catalyst sample, the time p-values for formic and oxalic acids were 0.062 and 0.058, respectively. Though not exactly less than 0.05, one may argue that these p-values suggest that time is more significant for the production of formic and oxalic acids with the 60-min catalyst sample. In addition to subtle differences observed between the 30-min and 60-min catalyst samples, the time p-values observed for the formation of formic and oxalic acids on these samples suggest some minor behavioral differences between the two catalyst samples.
4. Conclusions
As-deposited electroless CuNiMoP/Al2O3 catalyst was successful synthesized, and its thermochemical oxidation ability for glycerol was tested and the comparison made between its thermochemical oxidation products and those of its electrochemical oxidation of glycerol. The SEM and EDS characterization results showed that the increase in plating time favored more active material deposition of CuNiMoP. HPLC analysis showed that except some minor differences in product distributions, two catalysts deposited for different lengths of time produced the following oxidation by-products: glyceric acid, tartronic acid, hydroxypyruvic acid, oxalic acid and formic acid. Lactic acid was observed only for the 60-min as-deposited electroless sample. Our results indicate that this low-cost non-noble metal-based CuNiMoP/Al2O3 catalyst is able to oxidize glycerol. However, more research has to be conducted to optimize its catalytic capability. A comparison of the thermochemical oxidation products with those formed from electrochemistry shows that in addition to organic acid by-products, the electrochemical process resulted in the production of some intermediate glycerol oxidation products, such as aldehydes and ketones, thereby suggesting that the electrochemical process is milder than the thermochemical oxidation process. No intermediate oxidation products such as aldehydes and ketones were recovered from the thermochemical oxidation. The electrochemical reaction mechanism for the oxidation of glycerol using the synthesized electroless CuNiMoP catalyst is suggested to have some important difference between it and the thermochemical oxidation mechanism for glycerol. The thermochemical oxidation mechanism for glycerol oxidation on the CuNiMoP/Al2O3 catalyst is suggested. The reason for the observed low conversion of glycerol with the catalyst is explained as being due to the presence of oxides, the amorphous nature of the deposit and the lack of catalyst activation by annealing under a hydrogen reductive environment. While the presence of oxides on the surface of CuNiMo catalyst does not seem to hinder the electron flow during electrocatalytic oxidation of glycerol on CuNiMo, it appears not favorable for electron exchange for the thermochemical oxidation of glycerol on the CuNiMo catalyst.
From the three-carbon compounds produced, the full factorial design demonstrated that the increase in each factor (A, B and C) enhances the formation of glyceric and tartronic acids. Additionally, the statistical analysis of the model emphasized the significance of temperature (A) and pressure (C) and the interactions (AC, BC and AB) on their production.
Acknowledgments
The authors acknowledge the support of the Engineering Research Center (ERC) program of the National Science Foundation under Award Number EEC-08212121.
Author Contributions
Joel Sankar, Edith N. Onyeozili and Egwu Eric Kalu conceived of and designed the experiments. Joel Sankar performed the experiments and wrote the paper. Edith N. Onyeozili and Egwu Eric Kalu advised on the project. Joel Sankar, Edith N. Onyeozili and Egwu Eric Kalu analyzed the results.
Conflicts of Interest
The authors declare no conflict of interest. The founding sponsors had no role in the design of the study; in the collection, analyses or interpretation of data; in the writing of the manuscript; nor in the decision to publish the results.
References
- Höök, M.; Tang, X. Depletion of fossil fuels and anthropogenic climate change—A review. Energy Policy 2013, 52, 797–809. [Google Scholar] [CrossRef]
- Katryniok, B.; Kimura, H.; Skrzyńska, E.; Girardon, J.S.; Fongarland, P.; Capron, M.; Ducoulombier, R.; Mimura, N.; Paul, S.; Dumeignil, F. Selective Catalytic Oxidation of Glycerol: Perspectives for High Value Chemicals. Green Chem. 2011, 13, 1960–1979. [Google Scholar] [CrossRef]
- Skrzyńska, E.; Zaid, S.; Girardon, J.S.; Capron, M.; Dumeignil, F. Catalytic Behaviour of Four Different Supported Noble Metals in the Crude Glycerol Oxidation. Appl. Catal. A Gen. 2015, 499, 89–100. [Google Scholar] [CrossRef]
- Pagliaro, M. Glycerol the Platform Biochemical of the Chemical Industry; Simplicissimus Book Farm: Milan, Italy, 2013; ISBN 9788863699647. [Google Scholar]
- Pagliaro, M.; Rossi, M. The Future of Glycerol, 2nd ed.; RSC Green Chemistry Book Series: Cambridge, UK, 2010. [Google Scholar]
- Skrzynská, E.; Wondołowska-Grabowska, A.; Capron, M.; Dumeignil, F. Crude glycerol as a raw material for the liquid phase oxidation reaction. Appl. Catal. A. 2014, 482, 245–257. [Google Scholar] [CrossRef]
- Demirel-Gülen, S.; Lucas, M.; Claus, P. Liquid Phase Oxidation of Glycerol over Carbon Supported Gold Catalysts. Catal. Today 2005, 102–103, 166–172. [Google Scholar] [CrossRef]
- Gallezot, P. Selective oxidation with Air on Metal Catalysts. Catal. Today 1997, 37, 405–418. [Google Scholar] [CrossRef]
- Jin, X.; Zhao, M.; Zeng, C.; Yan, W.; Song, Z.; Thapa, P.S.; Subramaniam, B.; Chaudhari, R.V. Oxidation of Glycerol to Dicarboxylic Acids Using Cobalt Catalysts. ACS Catal. 2017, 6, 4576–4583. [Google Scholar] [CrossRef]
- Guerrero-Perez, M.O.; Rosas, J.M.; Bedia, J.; Rodriguez-Mirasol, J.; Cordero, T. Recent Inventions in Glycerol Transformations and Processing. Rec. Pat. Chem. Eng. 2009, 2, 11–21. [Google Scholar] [CrossRef]
- Zheng, Y.; Chen, X.; Shen, Y. Commodity Chemicals derived from Glycerol, an important biorefinery feedstock. Chem. Rev. 2008, 108, 5253–5277. [Google Scholar] [CrossRef] [PubMed]
- Mimura, N.; Hiyoshi, N.; Fujitani, T.; Dumeignil, F. Microscope Analysis of Au-Pd/TiO2 Glycerol Oxidation Catalysts Prepared by Deposition-Precipitation Method. RSC Adv. 2014, 144, 2167–2175. [Google Scholar] [CrossRef]
- Behr, A.; Eilting, J.; Irawadi, K.; Leschinki, J.; Lindner, F. Improved utilisation of renewable resources: New important derivatives of glycerol. Green Chem. 2008, 10, 13–30. [Google Scholar] [CrossRef]
- Chun-Hui, Z.; Beltramini, J.N.; Fan, Y.X.; Lu, G.Q. Chemoselective Catalytic Conversion of Glycerol as a Biorenewable Source to Valuable Commodity Chemicals. Chem. Soc. Rev. 2008, 37, 527–549. [Google Scholar]
- Dimitratos, N.; Porta, F.; Prati, L. Au, Pd (mono and bimetallic) Catalysts Supported on Graphite Using the Immobilization Method: Synthesis and Catalytic Testing for Liquid Phase Oxidation of Glycerol. Appl. Catal. A. 2005, 291, 210–214. [Google Scholar] [CrossRef]
- Kimura, H. Polyketomalonate by Catalytic Oxidation of Glycerol over a CeBiPt Catalystyt. II. Polym. Chem. 1996, 34, 3607–3614. [Google Scholar] [CrossRef]
- Carrettin, S.; McMorn, P.; Johnston, P.; Griffin, K.; Kiely, C.J.; Hutchings, G.J. Oxidation of Glycerol Using Supported Pt, Pd and Au catalysts. Phys. Chem. 2003, 6, 1329–1336. [Google Scholar] [CrossRef]
- Demirel, S.; Lehnert, K.; Lucas, M.; Claus, P. Use of Renewables for the Production of Chemicals: Glycerol Oxidation Over Carbon Supported Gold Catalysts. Appl. Catal. B Environ. 2007, 70, 637–643. [Google Scholar] [CrossRef]
- Skrzynská, E.; Ftouni, J.; Mamede, A.-S.; Addad, A.; Trentesaux, M.; Girardon, J.-S.; Capron, M.; Dumeignil, F. Glycerol oxidation over gold supported catalysts—“Two faces” of sulphur based anchoring agent. J. Mol. Catal. A 2014, 382, 71–78. [Google Scholar] [CrossRef]
- Elendu, O.; Modupe, O.; Yeboah, Y.; Kalu, E. Use of a Mixed Formaldehyde and Sodium Hypophosphite Reducing Agent Bath in the Electroless Synthesis of Cu-Ni-MoP Electro-catalyst Active for Glycerol Oxidation. Int. J. Electrochem. Sci. 2015, 10, 10792–10805. [Google Scholar]
- Elendu, O. Glycerol Electro-Oxidation with CuNiMoP Electrocatalyst for Cogeneration of Energy and High Value Chemicals under Alkalne Conditions. Ph.D. Thesis, Florida State University, Tallahassee, FL, USA, 2017. [Google Scholar]
- Chen, J.; Li, W.; Shen, R. CO Hydrogrnation to Higher Alcohols over Ni- and Mo-modified Cu/CeO2 catalyst. Korean J. Chem. Eng. 2016, 33, 500–506. [Google Scholar] [CrossRef]
- Skrzyńska, E.; Ftouni, J.; Girardon, J.S.; Capron, M.; Jalowiecki-Duhamel, L.; Paul, J.F.; Dumeignil, F. Quasi-Homogeneous Oxidation of Glycerol by Unsupported Gold Nanoparticles in the Liquid Phase. ChemSusChem 2012, 5, 2065–2078. [Google Scholar] [CrossRef] [PubMed]
- Roy, D.; Subramaniam, B.; Chaudhari, R. Cu-Based Catalysts Show Low Temperature Activity for Glycerol Conversion to Lactic Acid. ACS Catal. 2011, 5, 548–551. [Google Scholar] [CrossRef]
Figure 1.
SEM images at magnification of 8.11 K for (a) Al2O3 support, (b) 30-min and (c) 60-min as-deposited electroless CuNiMoP/Al2O3.
Figure 1.
SEM images at magnification of 8.11 K for (a) Al2O3 support, (b) 30-min and (c) 60-min as-deposited electroless CuNiMoP/Al2O3.
Figure 2.
XRD patterns from the alumina support, 30-min and 60-min deposition.
Figure 3.
EDS spectrums of the (a) 30-min and (b) 60-min as-deposited electroless CuNiMoP/Al2O3.
Scheme 1.
The glycerol oxidation mechanism on CuNiMoP. The compounds in red were not detected by HPLC. The compound in blue was only produced with the application of 60-min as-deposited catalyst.
Scheme 1.
The glycerol oxidation mechanism on CuNiMoP. The compounds in red were not detected by HPLC. The compound in blue was only produced with the application of 60-min as-deposited catalyst.
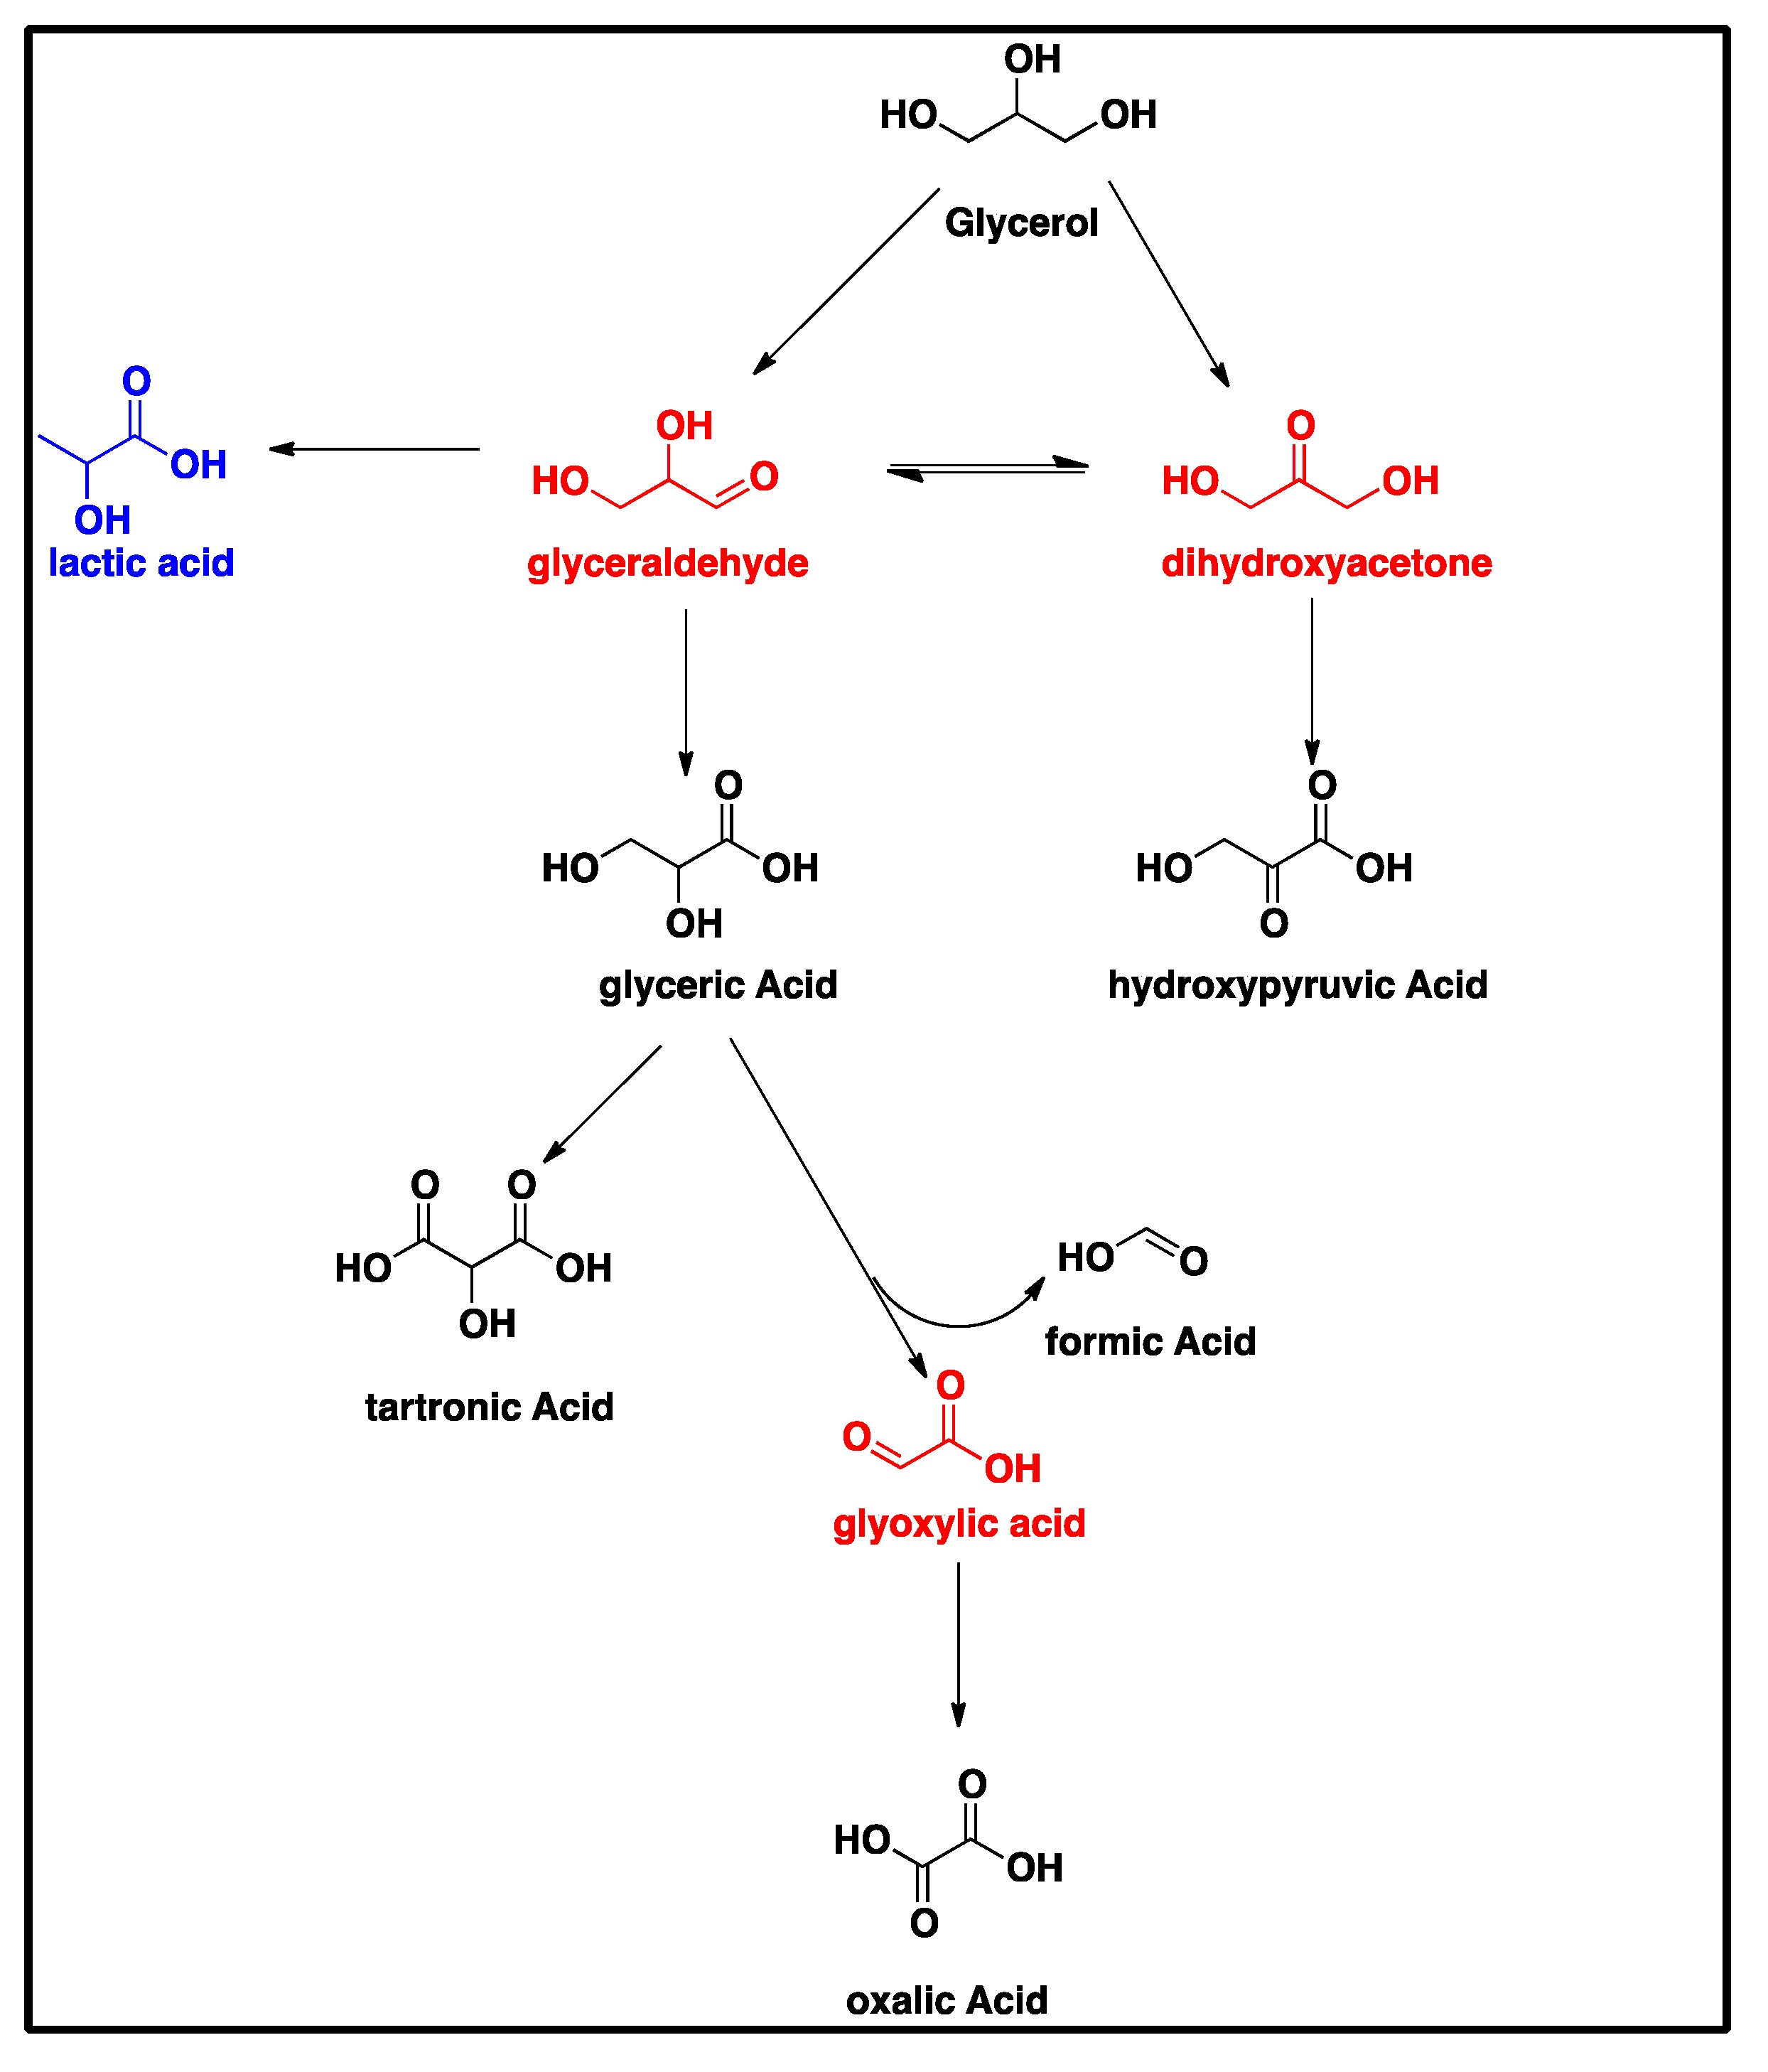
Figure 4.
Half-normal plot for glyceric acid production for (a) the 30-min and (b) the 60-min as-deposited electroless CuNiMoP/Al2O3 oxidation reactions.
Figure 4.
Half-normal plot for glyceric acid production for (a) the 30-min and (b) the 60-min as-deposited electroless CuNiMoP/Al2O3 oxidation reactions.
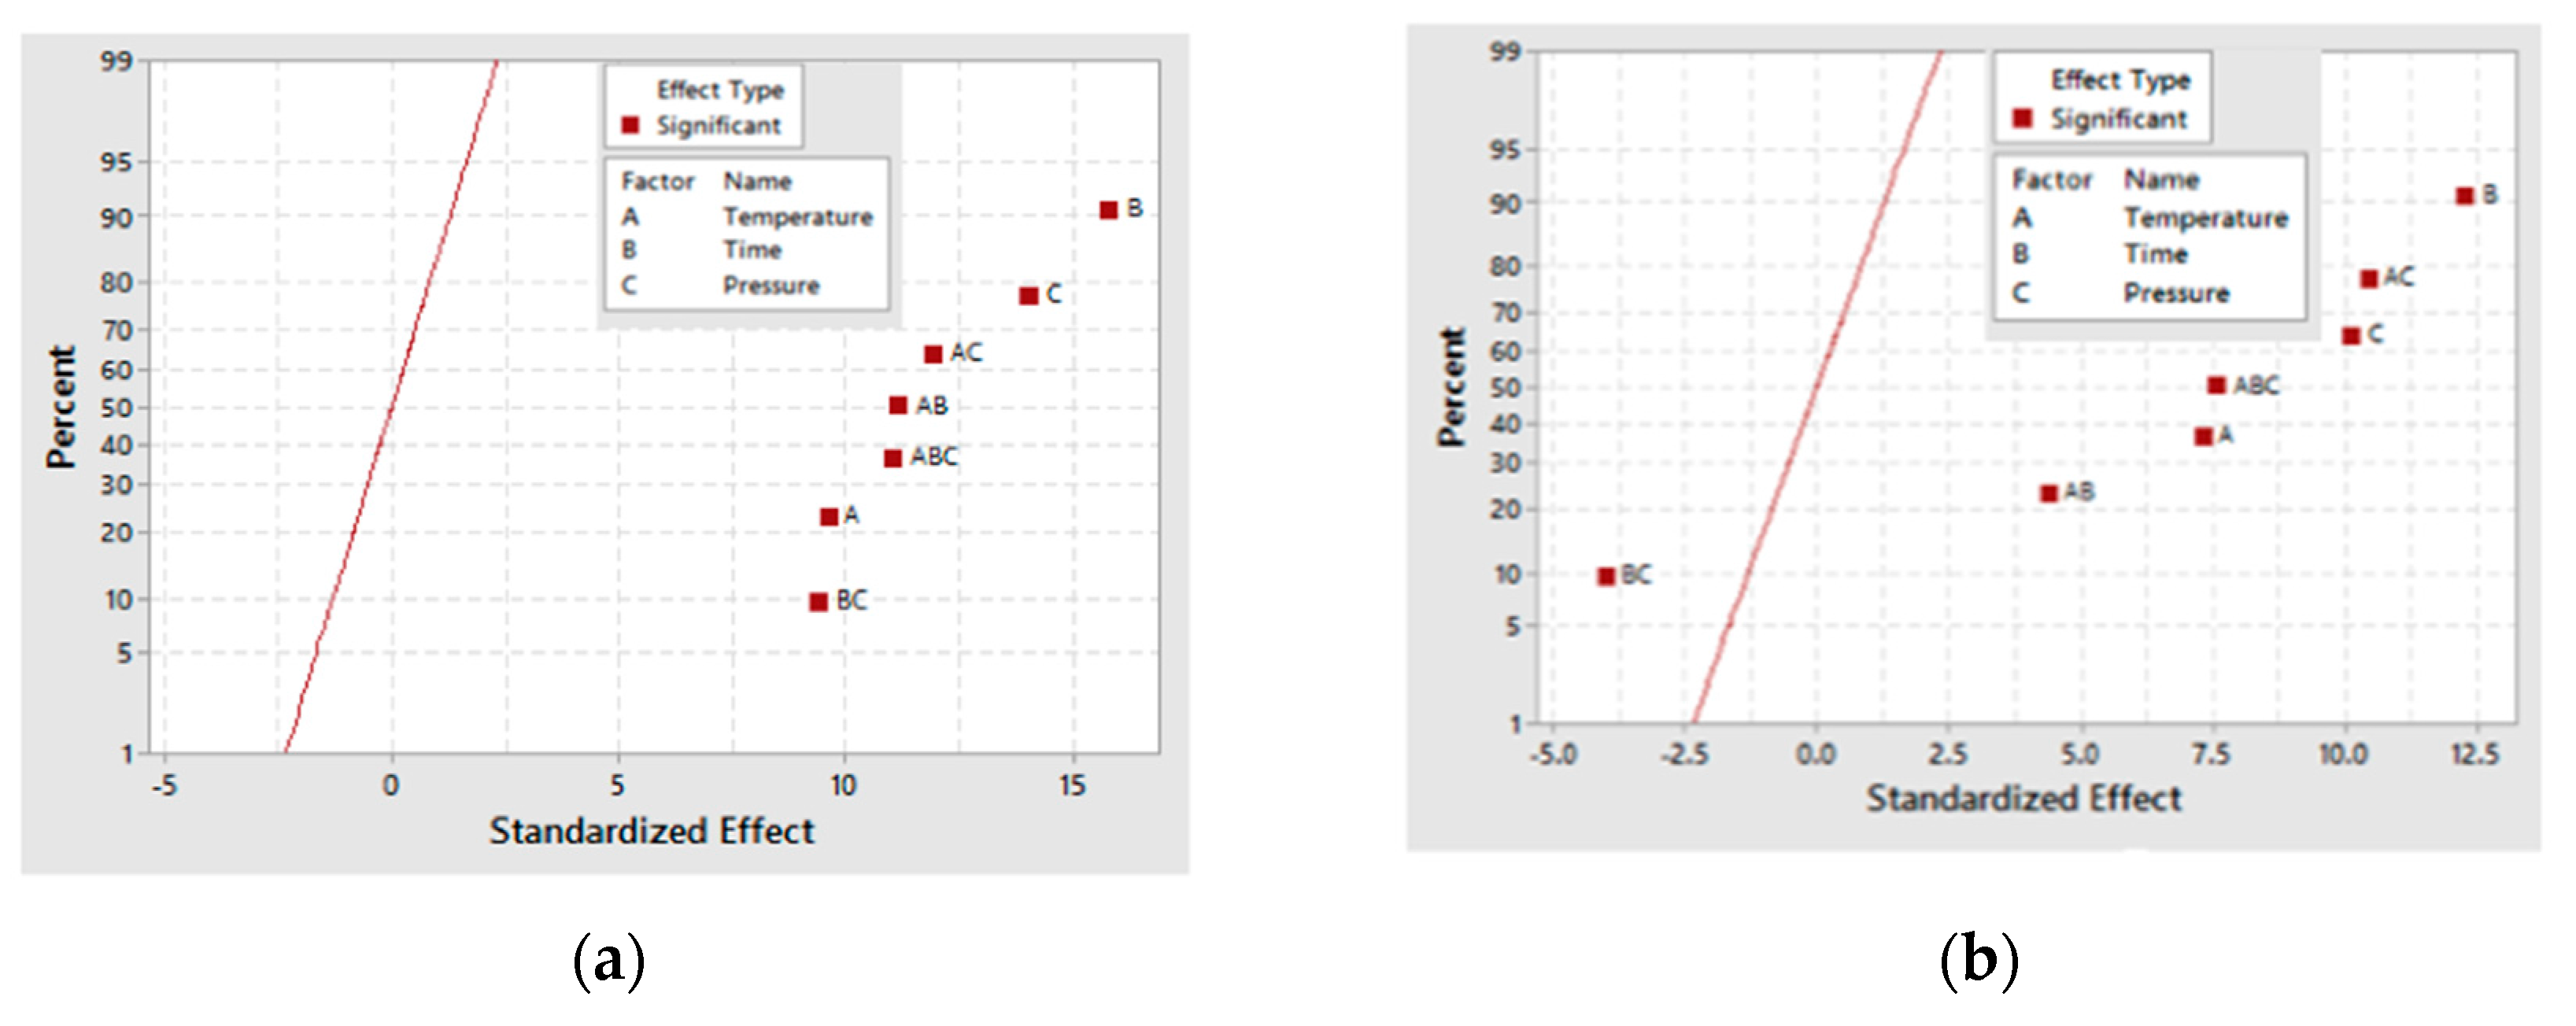
Figure 5.
3D surface plots for glyceric acid production for (a) the 30-min and (b) the 60-min as-deposited electroless CuNiMoP/Al2O3 oxidation reactions.
Figure 5.
3D surface plots for glyceric acid production for (a) the 30-min and (b) the 60-min as-deposited electroless CuNiMoP/Al2O3 oxidation reactions.
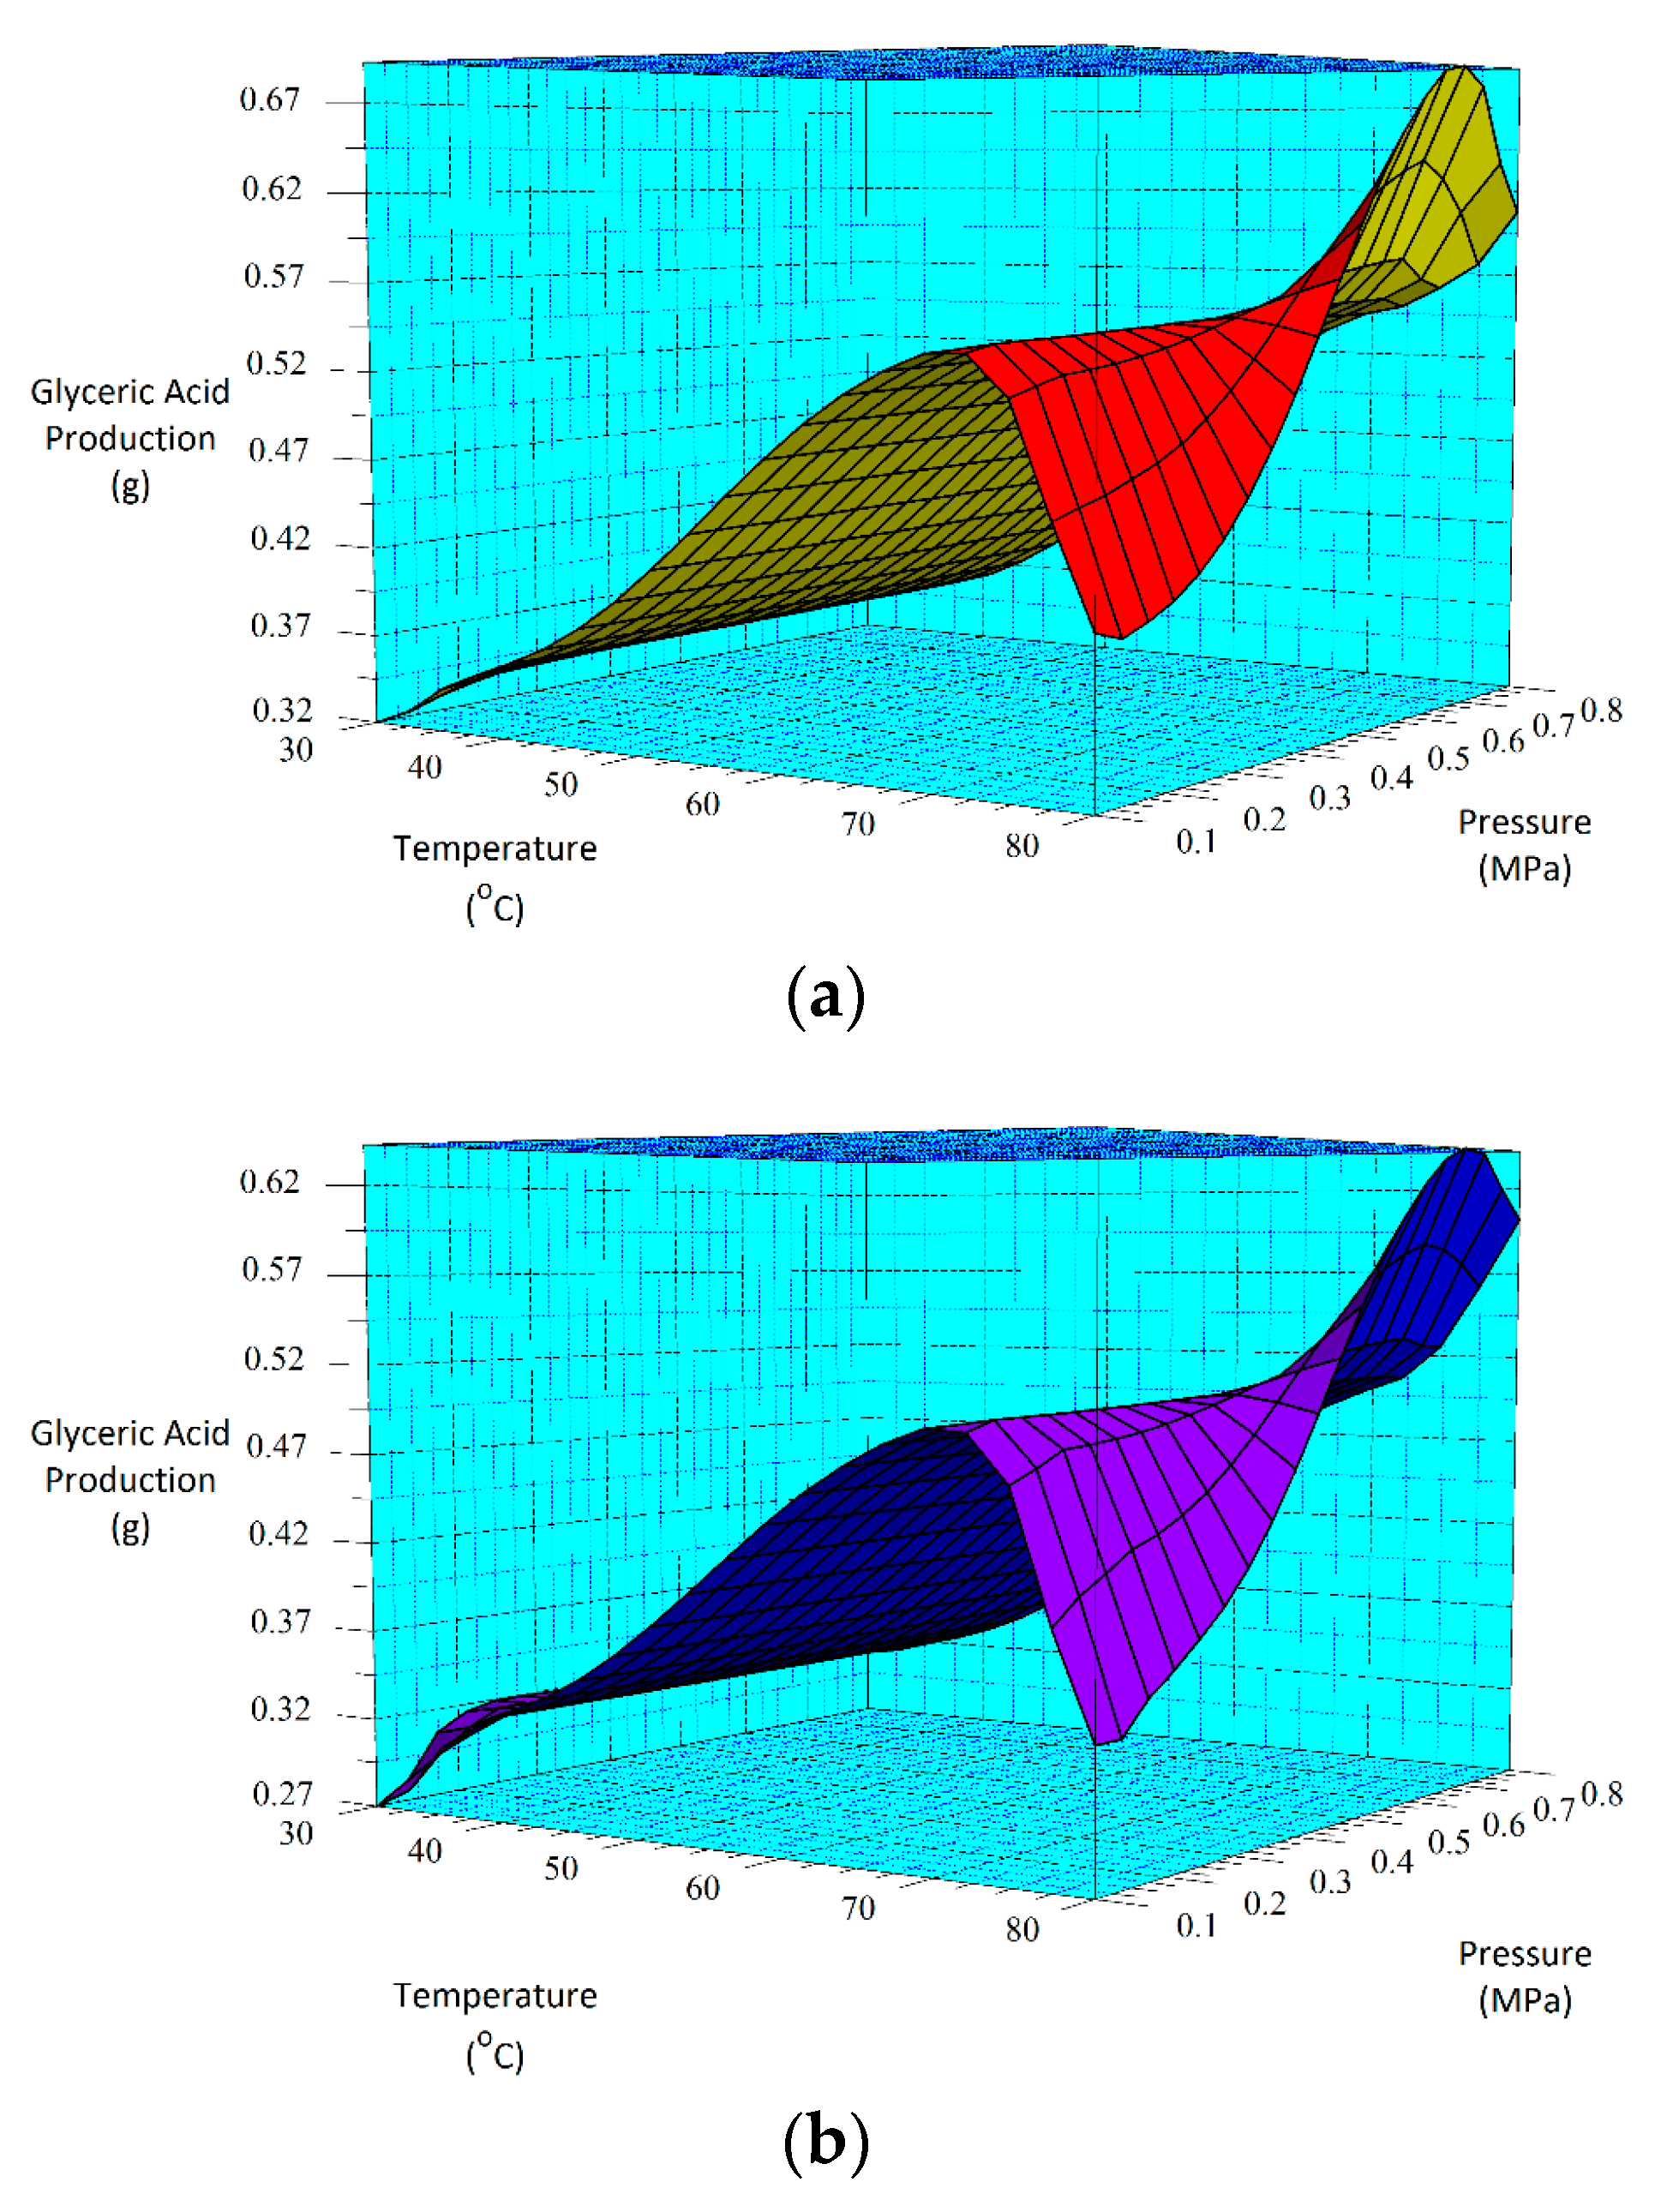
Figure 6.
Half normal plots for tartronic acid production for (a) the 30-min and (b) the 60-min as-deposited electroless CuNiMoP/Al2O3 oxidation reactions.
Figure 6.
Half normal plots for tartronic acid production for (a) the 30-min and (b) the 60-min as-deposited electroless CuNiMoP/Al2O3 oxidation reactions.
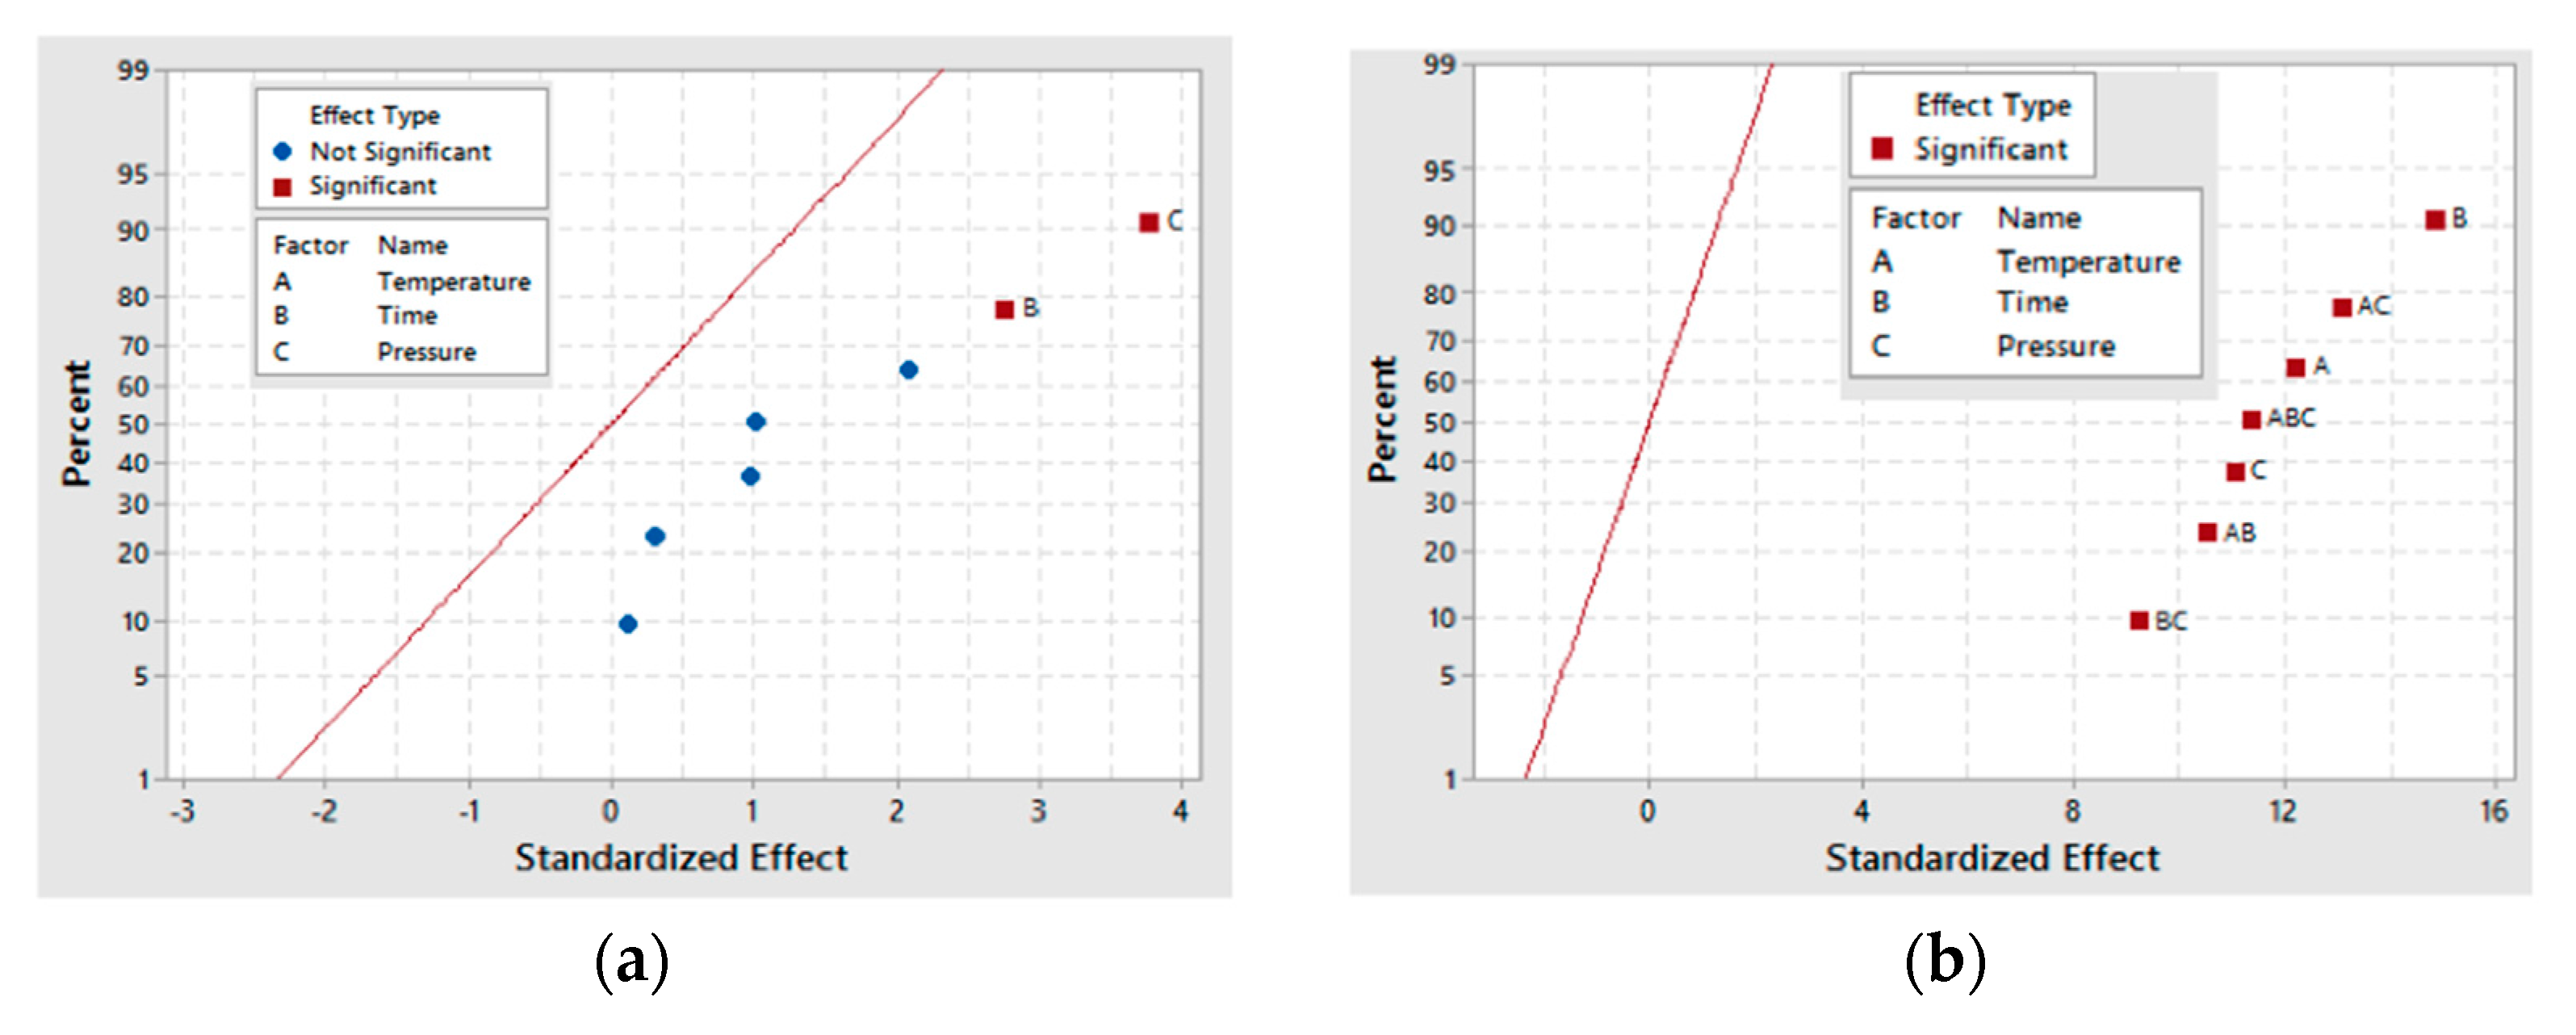
Figure 7.
3D surface plots for tartronic acid production for (a) the 30-min and (b) the 60-min as-deposited electroless CuNiMoP/Al2O3 oxidation reactions.
Figure 7.
3D surface plots for tartronic acid production for (a) the 30-min and (b) the 60-min as-deposited electroless CuNiMoP/Al2O3 oxidation reactions.

Table 1.
Chemical constituents used in the production of the CuNiMoP bath.
| Reagent | Molecular Weight (g/mol) | Mass (g) | Volume (mL) | Density (g/mL) |
|---|---|---|---|---|
| CuSO4·5H2O | 249.68 | 0.25 | - | - |
| NiSO4·6H2O | 262.86 | 3.36 | - | - |
| Na2MoO4·2H2O | 241.95 | 1 | - | - |
| KNaC4H4O6·4H2O | 282.22 | 2.5 | - | - |
| Gluconic acid potassium salt, C6H11KO7 | 234.25 | 4.75 | - | - |
| NaO2H2P·H2O | 105.99 | 2.5 | - | - |
| Sodium citrate | 294.10 | 2 | - | - |
| HCOOH | 30.03 | - | 10 | 1.09 |
| H2O | 18 | - | 250 | 1.00 |
Table 2.
The 23 full factorial experiment design for glycerol oxidation.
| Order | Variables | ||
|---|---|---|---|
| Temperature (°C) | Time (min) | Pressure (MPa) | |
| 1 | 30 | 30 | 0.1 |
| 2 | 80 | 30 | 0.1 |
| 3 | 30 | 150 | 0.1 |
| 4 | 80 | 150 | 0.1 |
| 5 | 30 | 30 | 0.8 |
| 6 | 80 | 30 | 0.8 |
| 7 | 30 | 150 | 0.8 |
| 8 | 80 | 150 | 0.8 |
Table 3.
Weight percentages and moles of Cu, Ni and Mo of the 30-min and 60-min electroless as-deposited CuNiMoP/Al2O3 catalysts.
Table 3.
Weight percentages and moles of Cu, Ni and Mo of the 30-min and 60-min electroless as-deposited CuNiMoP/Al2O3 catalysts.
| Element | 30-min Electroless as-Deposited Catalyst | 60-min Electroless as-Deposited Catalyst | ||
|---|---|---|---|---|
| wt (%) | moles (mol) | wt (%) | moles (mol) | |
| Mo L | 4.2 | 0.044 | 2.7 | 0.028 |
| Ni K | 36.7 | 0.625 | 27.4 | 0.467 |
| Cu K | 59.1 | 0.931 | 69.9 | 1.100 |
Table 4.
Glycerol conversion and amount of oxidative products formed for the 30-min as-deposited electroless CuNiMoP/Al2O3 catalyzed oxidations.
Table 4.
Glycerol conversion and amount of oxidative products formed for the 30-min as-deposited electroless CuNiMoP/Al2O3 catalyzed oxidations.
| Order | Glycerol Conversion (%) | Glyceric Acid (g) | Oxalic Acid (g) | Tartronic Acid (g) | Formic Acid (g) | Hydroxypyruvic Acid (g) | ||
|---|---|---|---|---|---|---|---|---|
| µGLC | SD | µGA | µOA | µTA | µFA | µHA | ||
| 1 | 3.75 | 0.52 | 0.250 | 0.067 | 0.023 | 0.00 | 0.577 | |
| 2 | 9.23 | 1.93 | 0.196 | 0.023 | 0.021 | 0.020 | 0.937 | |
| 3 | 3.49 | 3.08 | 0.390 | 0.016 | 0.020 | 0.035 | 0.000 | |
| 4 | 5.17 | 2.07 | 0.341 | 0.018 | 0.044 | 0.087 | 0.700 | |
| 5 | 6.15 | 1.08 | 0.334 | 0.018 | 0.045 | 0.033 | 1.120 | |
| 6 | 6.32 | 1.32 | 0.319 | 0.014 | 0.049 | 0.116 | 0.912 | |
| 7 | 8.87 | 2.35 | 0.401 | 0.020 | 0.100 | 0.048 | 1.090 | |
| 8 | 10.58 | 4.05 | 1.373 | 0.024 | 0.136 | 0.500 | 0.454 | |
Table 5.
Glycerol conversion and amount of oxidative products formed for the 60-min as-deposited electroless CuNiMoP/Al2O3 catalyzed oxidations.
Table 5.
Glycerol conversion and amount of oxidative products formed for the 60-min as-deposited electroless CuNiMoP/Al2O3 catalyzed oxidations.
| Order | Glycerol Conversion (%) | Glyceric Acid (g) | Oxalic Acid (g) | Tartronic Acid (g) | Formic Acid (g) | Lactic Acid (g) | Hydroxypyruvic Acid (g) | |
|---|---|---|---|---|---|---|---|---|
| µGLC | SD | µGA | µOA | µTA | µFA | µLA | µHA | |
| 1 | 4.93 | 3.24 | 0.066 | 0.025 | 0.000 | 0.000 | 0.000 | 0.860 |
| 2 | 3.96 | 3.03 | 0.067 | 0.000 | 0.000 | 0.017 | 0.005 | 0.000 |
| 3 | 9.45 | 1.06 | 0.586 | 0.036 | 0.157 | 0.021 | 0.020 | 0.000 |
| 4 | 2.74 | 1.42 | 0.417 | 0.016 | 0.116 | 0.066 | 0.033 | 0.450 |
| 5 | 7.32 | 4.52 | 0.367 | 0.000 | 0.003 | 0.045 | 0.012 | 0.000 |
| 6 | 4.27 | 0.14 | 0.522 | 0.033 | 0.086 | 0.257 | 0.033 | 0.531 |
| 7 | 6.27 | 0.82 | 0.268 | 0.026 | 0.056 | 0.076 | 0.005 | 1.590 |
| 8 | 7.98 | 0.18 | 1.060 | 0.024 | 1.210 | 0.055 | 0.100 | 0.054 |
Table 6.
Selectivities of glyceric and tartronic acids for both catalysts.
| Order | Variables | 30-min As-Deposited Electroless CuNiMoP/Al2O3 | 60-min As-Deposited Electroless CuNiMoP/Al2O3 | ||||
|---|---|---|---|---|---|---|---|
| Average Selectivity | |||||||
| Temp (°C) | Time (min) | Pressure (MPa) | Glyceric Acid | Tartronic Acid | Glyceric Acid | Tartronic Acid | |
| 1 | 30 | 30 | 0.1 | 1.25 | 0.04 | 0.42 | 0.00 |
| 2 | 80 | 30 | 0.1 | 0.20 | 0.04 | 14.84 | 0.00 |
| 3 | 30 | 150 | 0.1 | 8.11 | 0.43 | 7.71 | 2.09 |
| 4 | 80 | 150 | 0.1 | 0.44 | 0.06 | 1.71 | 1.71 |
| 5 | 30 | 30 | 0.8 | 0.29 | 0.04 | 9.87 | 0.11 |
| 6 | 80 | 30 | 0.8 | 0.31 | 0.05 | 1.00 | 0.17 |
| 7 | 30 | 150 | 0.8 | 0.35 | 0.08 | 0.16 | 0.04 |
| 8 | 80 | 150 | 0.8 | 2.07 | 0.22 | 4.91 | 5.45 |
Table 7.
ANOVA results for glyceric acid production.
| Oxidation | Source | SS | DF | Mean Square | F-Value | p-Value |
|---|---|---|---|---|---|---|
| 30-min as-deposited CuNiMoP/Al2O3 catalyzed reactions | Regression | 1.76898 | 6 | 0.294839 | 10.35 | 0.001 |
| A | 0.20305 | 1 | 0.203052 | 7.13 | 0.026 | |
| B | 0.11422 | 1 | 0.114221 | 4.01 | 0.076 | |
| C | 0.16831 | 1 | 0.168313 | 5.91 | 0.038 | |
| AB | 0.24602 | 1 | 0.246016 | 8.63 | 0.017 | |
| AC | 0.28037 | 1 | 0.280370 | 9.84 | 0.012 | |
| BC | 0.17472 | 1 | 0.174724 | 6.13 | 0.035 | |
| 60-min as-deposited CuNiMoP/Al2O3 catalyzed reactions | Regression | 1.28696 | 6 | 0.214494 | 10.38 | 0.001 |
| A | 0.09353 | 1 | 0.093527 | 4.52 | 0.062 | |
| B | 0.02334 | 1 | 0.023344 | 1.13 | 0.316 | |
| C | 0.01639 | 1 | 0.016387 | 0.79 | 0.396 | |
| AB | 0.05452 | 1 | 0.054522 | 2.64 | 0.139 | |
| AC | 0.31136 | 1 | 0.311364 | 15.06 | 0.004 | |
| BC | 0.04622 | 1 | 0.046225 | 2.24 | 0.169 | |
| A, B and C represent temperature, time and pressure, respectively. | ||||||
Table 8.
ANOVA results for tartronic acid production.
| Oxidation | Source | SS | DF | Mean Square | F-Value | p-Value |
|---|---|---|---|---|---|---|
| 30-min as-deposited CuNiMoP/Al2O3 catalyzed reactions | Regression | 0.024657 | 6 | 0.004110 | 5.27 | 0.014 |
| A | 0.000127 | 1 | 0.000127 | 0.16 | 0.695 | |
| B | 0.000495 | 1 | 0.000495 | 0.64 | 0.446 | |
| C | 0.00 | 1 | 0.00 | 0.00 | 0.991 | |
| AB | 0.000834 | 1 | 0.000834 | 1.07 | 0.328 | |
| AC | 0.000084 | 1 | 0.000084 | 0.11 | 0.750 | |
| BC | 0.003773 | 1 | 0.003773 | 4.84 | 0.055 | |
| 60-min as-deposited CuNiMoP/Al2O3 catalyzed reactions | Regression | 2.03807 | 6 | 0.339679 | 9.38 | 0.002 |
| A | 0.20081 | 1 | 0.200805 | 5.54 | 0.043 | |
| B | 0.12911 | 1 | 0.129108 | 3.57 | 0.092 | |
| C | 0.29216 | 1 | 0.292163 | 8.07 | 0.019 | |
| AB | 0.26266 | 1 | 0.262656 | 7.25 | 0.025 | |
| AC | 0.40577 | 1 | 0.405769 | 11.20 | 0.009 | |
| BC | 0.20250 | 1 | 0.202500 | 5.59 | 0.042 | |
| A, B and C represent temperature, time and pressure, respectively. | ||||||
© 2017 by the authors. Licensee MDPI, Basel, Switzerland. This article is an open access article distributed under the terms and conditions of the Creative Commons Attribution (CC BY) license (http://creativecommons.org/licenses/by/4.0/).
Share and Cite
MDPI and ACS Style
Sankar, J.; Onyeozili, E.N.; Kalu, E.E. Oxidation of Glycerol with Unactivated Electroless CuNiMoP Catalyst. ChemEngineering 2017, 1, 11. https://doi.org/10.3390/chemengineering1020011
AMA Style
Sankar J, Onyeozili EN, Kalu EE. Oxidation of Glycerol with Unactivated Electroless CuNiMoP Catalyst. ChemEngineering. 2017; 1(2):11. https://doi.org/10.3390/chemengineering1020011
Chicago/Turabian StyleSankar, Joel, Edith N. Onyeozili, and Egwu Eric Kalu. 2017. "Oxidation of Glycerol with Unactivated Electroless CuNiMoP Catalyst" ChemEngineering 1, no. 2: 11. https://doi.org/10.3390/chemengineering1020011